the application of eps geofoam in mitigating the …
TRANSCRIPT

THE APPLICATION OF EPS GEOFOAM IN
MITIGATING THE APPROACH PROBLEMS IN
INTEGRAL ABUTMENT BRIDGES
Ahmed Al-qarawi
MSc. Engineering
This thesis is submitted as a fulfilment for the degree of
Master of Engineering (Honours)
School of Computing Engineering and Mathematics
Western Sydney University
March 2016


This thesis is dedicated to,
My wife, Nesmah Abdullah, My kids, Leen and Ali
and
My beloved Mother


i
Declaration
Date: March 2016
Author: Ahmed Swadi Mohammed Al-qarawi
Title: THE APPLICATION OF EPS GEOFOAM IN
MITIGATING APPROACH PROBLEMS IN INTEGRAL
ABUTMENT BRIDGES
Degree: Master of Engineering (Honours)
I certify that the work presented in this thesis is, to the best of my
knowledge and belief, original, except as acknowledged in the text, and
the material has not been submitted, either in full or in part, for a degree
at this or any other institution.
I certify that I have complied with the rules, requirements,
procedures and policy relating to my higher degree research award of
Western Sydney University.
Author’s signature

ii

iii
Abstract
The traditional construction procedure of bridges involves the use of expansion joints
to allow for unrestricted superstructure movements against the temperature induced
deformations. However, expansion joints have been demonstrated to be vulnerable to
deterioration as a result of various environmental and operational factors. Therefore,
they pose an intractable challenge to the engineers represented by the costly and
frequent maintenance works they require. In that regard, the Integral Abutment
Bridge (IAB) system presents an attractive alternative to overcome such problems. In
addition to the advantages achieved by eliminating the expansion joints, the IABs
have desirable structural performance and offer simple and rapid construction
procedures.
The IABs as yet have their unique problems that ensue from the regular expansions
and contractions in the superstructure. The structural system of IABs relies on the
abutments movements to accommodate such changes in the dimensions of the
bridge. The repetitive abutment movements, against and away from the retained soil,
result in two principle detrimental effects in bridge approaches. These effects involve
long term build-up of the lateral earth pressure and settlement in the approach soil. In
consequence to these effects, the abutments will experience an escalated soil pressure
that may exceed the design values and possibly damage the abutment. Moreover, the
developed settlement at the bridge approaches will lead to safety and riding quality
issues for the bridge users.
The aforementioned problems in IABs have drastically reduced the advantages of
IABs and restrict their use to limited conditions. For instance, in Australia the use of
IABs is only permitted for bridges with a total length not exceeding 70m. Hence, a
practical remedy measure that alleviates the approach problems in IABs to allowable
states will maximize the potential benefits of this system and allows for utilizing it in
a wider range of design context. The existing remedy measures, represented by the
run-on concrete slabs and using heavily compacted backfill at bridge approaches are
as yet inefficient and do not provide an effective solution for the approach problems
in IABs. As a rational measure, using a low stiffness fill material between the
abutments and the retained soil can absorb the energy imposed by the abutment
movements and consequently minimize its effects on the approach soil. Thus, the
iv
expanded polystyrene geofoam (EPS) is deemed to present an excellent choice over
the other fill materials due to its unique characteristics. The EPS is a very light
material, highly compressible and energy absorbing. It also offers a cost effective
choice with easy and rapid installation.
The present thesis aims to extend an insight into the soil-structure interaction
behaviour in the IAB with particular emphasis to the soil settlement and the lateral
pressure issues at bridge approaches. It then investigates the effectiveness of the EPS
geofoam in mitigating these effects. Physical modelling together with numerical
analyses have been utilized to perform these investigations.
A finite element model, first, developed using ABAQUS/standard software and used
to simulate, in prototype dimensions, a wide-base embedded abutment experiencing
cyclic movements as would be anticipated to occur in IABs. The model was
validated using centrifuge test results from previous literature and employed to
perform a parametric study on the dominant factors affecting the soil-abutment
interaction behaviour. An experimental program then carried out to investigate the
influence of the mode of wall movement, rotation or translation, and the
effectiveness of the EPS geofoam inclusion using a physical model of a small wall
retaining loose sand on one side. The experimental test results of the small wall were
used to validate a finite element model that incorporated an EPS geofoam inclusion.
The EPS behaviour was simulated using a hyper-foam constitutive model and
calibrated using the laboratory test results.
Following which, finite element modelling was applied to investigate the impact of
using EPS geofoam inclusion in prototype dimensions on the soil settlement and
lateral earth pressures in IABs. Different geometrical arrangements for the EPS
inclusion have been investigated and conclusions about the optimum EPS
arrangements have been given.
Finally, the research conclusions and recommendations for future studies in regard to
the soil-structure interaction behaviour in IABs and the possible remedy measures
using the EPS geofoam are presented.

v
Acknowledgments
First, I would like to extend my sincere gratitude and appreciation to my principal
supervisor, Professor Chin Leo, for his invaluable and continuous support throughout
the research period. His constant attention and guidance have been of great help in
publishing the outcomes of this research in addition to the successful completion of
the thesis. I am deeply grateful to him for every effort and advice he provided toward
the completion of my degree.
I also extend my gratitude to my co-supervisor, Associate Professor Samanthika
Liyanapathirana, for her assistance and attention throughout every stage in my
research period.
I would like to acknowledge Western Sydney University, the School of Computing,
Engineering and Mathematics (SCEM) for providing the necessary laboratory
facilities and the wok environment. I would like to thank Dr Sanka Ekanayake and
Mr Thomas Ring for their assistance and help in my research work.
I would also like to gratefully thank my lovely wife for her great support, efforts and
interest she has provided throughout my study.
vi
Table of Contents
Declaration i
Abstract iii
Acknowledgment v
Table of Contents vii
List of Figures x
List of Tables xiii
List of Symbols xiv
1 Introduction 1
1.1 Background ……………………………………………..……………….1
1.2 Research Impetus and Objectives ……………….………………………4
1.3 Scope and Limitations……………………………………………………5
1.4 Structure of Thesis ……………………………….……………………...5
1.5 Publications ……………………………………………………………...7
2 Literature Review 8
2.1 Introduction ………………………………………….…………………..8
2.2 Integral Abutment Bridges (IABs)……………………..………………...9
2.3 Advantages of IAB system……………………………………………..10
2.4 Problems and limitations of IABs……………………………………....10
2.4.1 Long term built-up of lateral earth pressure……………………...11
2.4.2 Settlement of the bridge approaches………………………….…..11
2.5 An overview of the existing theories…………………………………...13
2.5.1 Lateral earth pressure…………………………………………....13
2.5.2 Settlement of the approach soil………………………………….23
2.6 Measures to solve approach problems in IABs…………………………28
2.7 Expanded polystyrene geofoam (EPS)………………………………....29
2.7.1 Physical properties……………………………………………....30
2.7.2 Mechanical properties…………………………………………...31
2.7.3 Application of EPS in mitigating approach problems in
IABs………………………………………………………….….34

vii
2.8 Gaps in the current knowledge…………………………………………36
3 Numerical Simulation of Abutment Wall Experiencing Cyclic
Movement 39
3.1 Introduction…………………………………………….……………….39
3.2 Building the finite element model……………………………………....40
3.2.1 Determination of scale factors and model
dimensions………………………………………………………40
3.2.2 Constitutive model and material properties………......................42
3.2.3 Interaction properties and boundary conditions……………........43
3.3 Discussion of model verification and results…………………...………44
3.3.1 Lateral earth pressure…………………………………………....44
3.3.2 Soil settlement………………………………….…………….….48
3.3.3 Influence of soil properties……………………………………...50
3.3.4 Influence of daily and annual temperature variation……………52
3.4 Summary………………………………………………………………..54
4 Small Wall Physical Model 56
4.1 Introduction…………………………………………………………….56
4.2 The test program………………………………………………………..57
4.2.1 The mode of wall movement……………………………………57
4.2.2 The use of EPS inclusion………………………………………..58
4.3 The experimental setup…………………………………………………59
4.4 Properties of materials…………………………………….....................60
4.5 Test results and discussions…………………………………………….61
4.5.1 Hinged wall tests………………………………………………..61
4.5.2 Tests of horizontally-displaced wall…………………………….68
4.5.3 Discussion of results………………………………………….…72
4.6 Summary…………………………………………………………...…...76
5 Finite Element Modelling of Integral Abutment Bridge With EPS
Inclusion 79
5.1 Introduction……………………………………………….....................79
5.2 Model description………………………………………………………79
5.2.1 Model dimensions…………………………………………….…79
5.2.2 Constitutive model and material properties of soil……………...80
5.2.3 Constitutive mode and material properties of EPS……………...81

viii
5.2.4 Interaction properties and boundary conditions…………………84
5.3 Model verification……………………………………….……………...84
5.4 Application of the ABAQUS model on prototype
dimensions……………………………………….…………………..…89
5.5 Summary…………………………………………….…………….……92
6 Summary and Conclusions 94
6.1 Summary………………………………………………………………..94
6.2 Conclusions………………………………………………………...…...95
6.3 Recommendation for future studies…………………………………….96
References 98

ix
List of Figures
1.1 Abutment thermally induced movements and the subsequent effects
on bridge approaches (Horvath, 2000)2.1 Integral abutment bridge
system..........................................................................................................…....2
2.1 Integral abutment bridge system ................................................................…....9
2.2 Typical approach settlement in integral bridge due to abutment cyclic
movements………………………………………………………………….…12
2.3 Lateral earth pressure distribution behind frame abutment (BA42/96, 2003)...15
2.4 Lateral pressure distribution behind full height embedded wall (BA42/96,
2003)…………………………………………………………………………..15
2.5 Comparison of the value of K* as predicted by Lehane (2011) with those
recommended in the UKBA42/96 (2003) (Lehane, 2011)……………………16
2.6 Earth Pressure distribution behind Abutment (Bayoglu, 2004)……………...17
2.7 Variation of the pressure coefficient K with the number of cycles
(England et al., 2000)…………………………………………………………18
2.8 Relationship between the lateral pressure coefficient, K and the
horizontal wall displacement, in active and active/passive conditions
(Tastsouka et al., 2009)…………………………………………………….....19
2.9 Measured earth pressures (Huntly and Valsangkar, 2013)……………………21
2.10 Maximum weekly soil pressures acting on back-wall (Hoppe and
Gomez,1996)………………………………………………………………….22
2.11 Variation in the value of K* computed based on equations 7 & 9
(Tan et al., 2015)……………………………………………………………...23
2.12 Typical soil settlement profiles in dense soil and loose soils…………………24
2.13 Relationship between maximum settlement and the number of cycles
(England et al., 2000)…………………………………………………………25
2.14 Settlement of loose sand due to combined daily and annual cycles (England et
al., 2000)………………………………………………………………………25
2.15 Dual ratchet mechanism due to wall rotational movement (Tatsuoka et al.,
2009)………………………………………………………………………......27
2.16 Active and passive movement vectors (Cosgrove and Lehane, 2003)………..28
2.17 Internal structure of EPS (Ossa and Romo, 2009)……………………………31
x
2.18 EPS Stress-Strain relationship in rapid unconfined compression test
(Arellano and Stark, 2009)………………………………………………...….33
2.19 Time dependant behaviour of EPS at different stress levels (Elraji, 2000)…...34
2.20 EPS inclusion in Jackson River Bridge, Virginia, US (Hoppe, 2005)………..35
3.1 The experimental setup of the centrifuge test (Ng. et al., 1998)……………...40
3.2 Finite element mesh of the prototype abutment wall and soil backfill………..42
3.3 FEM results (this study) test results of Ng. et al (1998) and other theoretical
models for the lateral pressure coefficient K at (a) ±6mm perturbation, (b)
±12mm perturbation and (c) ±30mm perturbation………………….………...47
3.4 Modelling results for the lateral pressure distribution after 10 cycles….…….48
3.5 The deformed FE model………………………………………………….…...49
3.6 Soil surface profile after 10 cycles of ±30mm perturbations…………….…...49
3.7 Maximum settlements vs. Number of cycles and Perturbations……………...50
3.8 Soils 1&2 Surface Profile and particle displacement vectors after 10 cycles of
±30mm wall
displacement…………………………………………………………………..52
3.9 Lateral earth pressure coefficient K, for dense and loose soils……………….52
3.10 Superimposed temperature fluctuation pattern………………………………..53
4.1 Modes of wall movement investigated in the test…………………………….58
4.2 The test program………………………………………………………………58
4.3 The experimental setup (for horizontally-displaced wall)…………………….59
4.4 Test setup with EPS inclusion (for hinged wall)……………………………...61
4.5 The soil surface (a) before and (b) after Test T1……………………………...63
4.6 Lateral earth pressures at different wall positions - Test T1………………….63
4.7 (a) The lateral pressure envelope during wall movements – Test T1, (b)
Relationship between K and number of movement cycles - Test T1…………64
4.8 Maximum settlements at different wall positions - Test T1…………………..65
4.9 Settlement results at different distances from the wall - Test T1……………..66
4.10 The settled soil profile at different cycles - Test T1…………………………..66
xi
4.11 The soil surface (a) before and (b) after Test T2……………………………...67
4.12 Lateral earth pressures at different wall positions - Test T2………………….67
4.13 Maximum settlement at initial position - Test T2…………………………….68
4.14 Settlement at different distances from the wall – Test T2……………………69
4.15 Measured lateral pressures at different wall positions -Test T3………………70
4.16 The soil surface (a) before and (b) after the Test T3………………………….70
4.17 Experimental setup of Test T4a (a) before the test and (b) after the test…….71
4.18 Lateral pressures results - Test T4a…………………………………………...71
4.19 Soil surface settlements at different distances from the wall – Test T4a……..71
4.20 Maximum settlement in tests T4a and T4b using different arrangements for the
EPS inclusion…………………………………………………………………72
4.21 Lateral pressures (passive position) of Tests T1 and T3……………………...74
4.22 Maximum settlements measured in tests T1 and T3………………………….74
4.23 Lateral pressure with and without EPS inclusion (translation movement)…...76
4.24 Settled soil profile of tests T3 and T4b……………………………………….76
5.1 Horizontal displacement vs Shear stress at different normal stress…………..80
5.2 Coulomb Failure envelope of the soil………………………………………...81
5.3 Compressive Stress–Strain curve for Hyper-foam……………………………82
5.4 Strain-Stress relationship of EPS samples in uniaxial compression test……...83
5.5 Hydrostatic test results………………………………………………………..83
5.6 Shear test on EPS sample……………………………………………………..84
5.7 The meshed ABAQUS model for small wall………………………….……...85
5.8 Finite element and experimental (test T2) results for the soil settlement……..86
5.9 Lateral pressures acting on the wall during (a) Cycle 10 & (b) Cycle 5 of test
T2……………………………………………………………………………...86
5.10 FE modelling and the experimental results for test T4………………………..88
5.11 The variance of the cohesion of soil during the analysis……………………...88
5.12 EPS arrangement behind the wall……………………………………………..90
5.13 The deformed FE Model-2a…………………………………………………..90

xii
5.14 Lateral pressure vs Number of cycles………………………………………...91
5.15 Maximum settlement vs Number of cycles…………………………………...92
List of Tables
2.1 Tests details as described by Cosgrove and Lehane (2003)……………..…26
2.2 10% strain - compressive strength of EPS with different densities
(Elraji, 2000)…………………………………………………………….…..31
3.1 Scaling Factors for the Centrifuge Model…………………………………..42
3.2 Properties of Soil Used in the Finite Element Analysis……………………..43
3.3 Comparison of lateral pressure coefficient (K)……………………………...45
3.4 Properties of Soil used in the Finite Element Analysis………………….…..51
3.5 Maximum settlement and lateral pressure coefficient for (A) Annual
temperature only and (B) combined annual and diurnal temperature
fluctuations…………………………………………………………………..54
4.1 Summary of the test results………………………………………………….77
xiii
List of Symbols
Latin
d Horizontal wall displacement
E Elasticity modulus
𝐸𝑐𝑐 Small strain stiffness of compacted soil
𝐸𝑜 Small-strain modulus
𝐸𝑝 Operational stiffness of soil
𝑔 Gravity
H Height of the retained soil
𝐾∗ The critical coefficient of lateral earth pressure according to the UK
BA42/96 specification
𝐾𝑎 Active coefficient of lateral earth pressure
𝐾𝑜 At-rest coefficient of lateral earth pressure
𝐾𝑝 Passive coefficient of lateral earth pressure
N Number of wall movement cycles
n Scale factor between centrifuge and prototype dimensions
𝑃𝑎 Active soil pressure
𝑃𝑝 Passive soil pressure
𝑢1 Displacement in x direction
𝑢2 Displacement in z direction
z Depth from soil surface
Greek
𝛾 Unit weight of the retained soil
∅ Friction angle of the soil
𝛿 Angle of friction between the soil and the wall

xiv
휀 Total strain
휀𝑜 Immediate strain
휀𝑡 Time dependant strain in EPS
𝜇 Poisson ration
Ψ Dilation angle of soil
𝜃 The inclination angle of the interface planar between the EPS and the
soil
𝜎ℎ Horizontal stress
𝜎𝑣 Vertical stress
휀𝑣 Volumetric strain
∆𝑥 Deformation in x direction
∆𝑧 Deformation in z direction
Abbreviations
AASHTO American Association of State Highway and Transportation Officials
CPE8R Eight-node quadratic element with reduced integration
EPS Expanded Polystyrene
FE Finite Element
FHWA American Federal Highway Association
IABs Integral Abutment Bridges
LVDT Linear variable differential transformer

xv

1
Chapter One
Introduction
1.1 Background
Bridges are conventionally designed and constructed with expansion joints in the
deck to accommodate the potential movements in the longitudinal direction of the
bridge. These movements are caused by various factors such as the expansion and
contraction due to the fluctuations in the ambient temperatures, post-construction
shrinkage, creep and the long term settlement of the bridge approaches. The
expansion joints are usually exposed to severe loading conditions due to the
aforementioned deck movements as well as the continuous traffic loading. As a
result, they require regular maintenance throughout the lifetime of the bridge, which
is costly and inconvenient for the bridge users. Expansion joints have therefore
always been a source of construction and maintenance inconvenience to bridge
engineers. Consequently, the concept of joint-less or integral abutment bridges
(IABs) has been proposed as a remedy. In a typical IAB, the bridge deck is
physically and structurally free of joints and is rigidly connected to the abutments as
a single structural unit.
The first use of the integral abutment bridges was recorded in 1938 in the United
States and since then they have been widely utilized around the world. Nowadays,
IABs represent the standard choice of bridge construction in many countries such as
US and the United Kingdom. The IAB system provides an excellent alternative to
overcome the expansion joint issues in addition to achieving substantial savings in
the construction and maintenance costs.
In spite of the various advantages of the IAB system, it is not without some inherent
problems of its own, which largely limit its use. The problems in the IABs are due to
the complicated soil-structure interaction behaviour unique to this type of bridges.
The expansion and contraction of the bridge deck in response to the variations in the
ambient temperatures will be reflected on the abutments in cycles of passive/active
movements due to the absence of expansion joints (Figure 1.1(a)). Although the
amplitude of such movements is very small and only ranges within few tens of
millimetres, it could result in significant structural and geotechnical problems in the

Chapter one Introduction
2
long term. This is because the cyclic movements of the abutment will result in
settlement in the approach soil and an increase in the lateral earth pressures acting on
the abutment wall. The settlement usually produces a trough at bridge approach
(Figure 1.1(b)), which poses rideability and safety issues to bridge users.
Furthermore, the stress ratcheting effects developed under the densification of the
approach soil will impose an escalated loading on the bridge structure which is not
encountered in jointed or conventional bridges.
(a)
(b)
Figure 1.1 Abutment thermally induced movements and the subsequent effects on
bridge approaches (Horvath, 2000)
The temperature induced effects and the subsequent approach settlement and lateral
pressures in the IABs represent primary impediments that largely restrict the use of
IABs to limited ranges of bridge length. Therefore, introducing a practical
engineering solution to rectify or at least alleviate the effects of the approach issues

Chapter one Introduction
3
in IABs has been a principle concern of the geotechnical and structural engineers
dealing with the integral abutment bridges. Such a solution will broaden the use of
the IABs and maximize their engineering and economic advantages.
The current practices which are utilized to overcome the approach problems in IABs
involve the use of concrete run-on slab at the bridge approaches to span the possible
settlement. However, the use of run-on slab is arguable and engineers in some
countries such as the UK do not recommend it as it complicates the approach
maintenance works (Lock, 2002). In such cases, the engineers rely on regular
approach patching and pavement overlying to rectify the settlement effects. Other
available measure is to use well compacted backfill at the bridge approaches, which
may minimise the soil settlement. However, it has been found that heavily
compacted backfill result in significant escalation in the lateral earth pressure acting
on the abutment wall due to the cyclic movements. Hence, current remedial measures
have only a limited success in alleviating the problems produced by the abutment
movements.
A logical approach to mitigate these problems entail inserting a compressible fill
material between the abutment wall and the retained soil. The inclusion will then
absorb the abutment movements with a minimal disturbance transferred to the
adjacent soil. It is hypothesized that such a remedial measure will greatly attenuate
the settlements and lateral earth pressure issues in IABs. Among many of the fill
materials, the expanded polystyrene geofoam (EPS) provides an excellent choice for
such a purpose (Horvath, 1997). The EPS is highly compressible and possesses high
compression strength to weight ratio. It has an excellent record of success in a wide
range of geotechnical applications such as a fill material for light weight
embankments, compressible inclusion behind retaining structures and stabilisation of
slopes, etc. Nevertheless, the potential use of EPS geofoam in rectifying the
intractable approach problems in IABs has not been thoroughly investigated.
In this research, the application of the EPS as a compressible inclusion in the IAB
approaches will be rigorously studied with a focus on producing a possible remedy
for the soil settlement and the lateral pressure ratcheting issues. However, utilizing
the EPS geofoam in such an application requires a proper understanding of the soil-
abutment interaction behaviour in the IABs and an insight into the important factors

Chapter one Introduction
4
affecting such behaviour. This research will thus include a study of the primary
factors influencing the abutment-soil behaviour and produce conclusions to improve
the existing design approaches.
1.2 Research Impetus and Objectives
A considerable amount of research effort has been expended in the past to investigate
the temperature effects on the IABs. The majority of these research studies were
focused on predicting the lateral pressures and, to a lesser extent, the settlement of
bridge approaches rather than developing a practical and effective remedial measure
for these problems. Therefore, the existing design practice does not include detailed
standard guidelines on the possible use of EPS geofoam in the approaches of the
IABs.
The primary aim of this thesis is to investigate the predominant factors that govern
the soil-wall interaction in IABs and develop the existing knowledge for the possible
application of the EPS geofoam to mitigate the approach problems. The specific
objectives of this study include:
Perform a comprehensive review of the current literature that concerns the
soil settlement and the lateral pressure ratcheting problems in IABs. This will
also include reviewing the primary characteristics of the EPS geofoam and its
applications. This literature review will summarize the existing relevant
knowledge, identify the research gaps and eventually determine the outlines
of this study.
Develop a two-dimensional finite element model to simulate the effects of
abutment movements on the retained soil and validate that model with
reliable experimental data from the literature.
Conduct a parametric study to investigate the influence of a number of
important factors governing the soil-abutment interaction in an IAB using
finite element modelling.
Perform laboratory experiments on a small physical model to study the
effects of the mode of wall movement on the soil settlement and the lateral
pressures encountered in the IAB approaches.
Investigate the potential influence of the EPS geofoam on the settlement and
lateral pressure by using the physical model.

Chapter one Introduction
5
Conduct experiments as required and calibrate a constitutive model to
simulate the soil-wall interaction behaviour when an ESP inclusion is
involved.
Validate the finite element model with EPS geofoam inclusions using results
from the physical model.
Develop a two-dimensional finite element model to investigate the potential
use of EPS inclusions in prototype dimensions for different geometric
configurations of EPS.
Produce a set of conclusions highlighting the primary factors that govern the
wall-soil interaction and the potential use of EPS geofoam in attenuating the
approach settlement and lateral pressure ratcheting in IABs.
1.3 Scope and Limitations
The scope of this study involves both theoretical and experimental investigations of
the soil-structure interactions associated with the IABs as a result of the fluctuations
in the ambient temperature. In particular, the study focuses on the approach
problems, namely, the settlement of the approach soil and the escalation in the lateral
earth pressures acting on the abutment under passive-active cyclic abutment
movements. The utilization of the expanded polystyrene geofoam compressible
inclusion to alleviate the approach problems in IABs is also included in the scope of
this study.
However, It is worthwhile noting that the influence of long term creep and
temperature effects on the EPS geofoam are considered beyond the scope of the
study. Also, the densification in the soil due to the cyclic active-passive wall
movements is not included in the constitutive model of soil. Due to the extensive
scope of work needed to incorporate creep, temperature and densification effects,
these will be left for a future study.
1.4 Structure of Thesis
Chapter Two
Chapter two involves a comprehensive review of the current literature dealing
with the approach problems in integral abutment bridges. Particular focus is
given to the effects of the temperature induced abutment movements and the
Chapter one Introduction
6
subsequent lateral pressure escalation and soil settlement. Then the existing
measures utilized to tackle the approach problems are discussed. The general
characteristics and applications of the EPS geofoam in the geotechnical
engineering are also reviewed. Finally, the gaps in the current knowledge of
the soil-structure interaction in IABs are identified.
Chapter Three
This chapter consists of numerical analyses for a concrete abutment with the
retained soil experiencing cyclic movements. A plane strain finite element
model is developed using the ABAQUS/Standard to simulate the wall.
Validation of the finite element model using centrifuge test results is
presented in this chapter. Also, a parametric study is conducted to investigate
the influence of soil properties and the pattern of the temperature changes on
the approach settlements and the lateral soil pressures.
Chapter Four
In this chapter, an experimental program is carried out on a physical model
represented by a small wall retaining loose sand and subjected to
passive/active movement cycles. During the tests, the settlement at the soil
surface and lateral soil pressures acting on the wall are measured. This test
program aims to investigate the effectiveness of EPS geofoam in mitigating
the soil settlement and the lateral earth pressure issues. Also the wall-soil
interaction behaviour under different modes of wall movements (rotation or
translation) has been investigated.
Chapter Five
The effectiveness of EPS geofoam in alleviating the approach problems in
IABs in prototype dimensions has been investigated in detail in this chapter
using finite element simulation. A two-dimensional plane strain ABAQUS
model has been developed and verified using the physical model test results
described in chapter four. Two different arrangements of EPS inclusions are
discussed based on the angle of the interface plane between the soil and the
EPS wedge.

Chapter one Introduction
7
Chapter Six
In this chapter, the final conclusions derived from the work conducted in this
study and the recommendations for future studies in regard to the use of EPS
geofoam to overcome the approach problems in the IABs are presented.
1.5 Publications
The outcomes of this study have been summarized and submitted for publication as
described below:
Alqarawi, A., Leo, C. J., Liyanapathirana, D. S. and Ekanayake, S. D. (2015).
Parametric study on the approach problem of an integral abutment bridge
subjected to cyclic loading due to temperature changes. Journal of Applied
Mechanics and Materials (Manuscript accepted)
Alqarawi, A., Leo, C. J., Liyanapathirana, D. S. and Ekanayake, S. D. (2015).
A study on the effects of abutment cyclic movements on the approach of
integral abutment bridges. Australian Geomechanics Journal. (Manuscript
accepted).
Alqarawi, A., Leo, C. J., Liyanapathirana, D. S. and Ekanayake, S. D. (2016).
The approach problem of an integral abutment bridge subjected to cyclic
loading due to temperature changes. 19th Southeast Asian Geotechnical
Conference and 2nd Association of Geotechnical Societies in Southeast Asia,
Malaysia 2016. (Manuscript accepted).
Alqarawi, A., Leo, C. J., Liyanapathirana, D. S. and Ekanayake, S. D. (2016).
The effects of mode of wall movement and the use of EPS geofoam on the
approach problems in integral abutment bridges. (Manuscript in preparation
for submission based on Chapters 4 and 5 of this thesis)

8
Chapter 2
Literature Review
2.1 Introduction
Bridges are commonly built with expansion joints to allow for the movements
occurring within the deck of the bridge. These movements involve the expansions
and contractions caused by the temperature changes, shrinkage and creep or the long
term settlements of the sides of the bridge. Bridge expansion joints are normally
exposed to severe loading conditions as a result of the continuous traffic loadings.
Consequently, they deteriorate or lose their intended function quite rapidly and
require regular maintenance throughout the lifetime of the bridge. A defective
expansion joint can be a source of various problems to the bridge structure and
bridge users. It may allow the salt-laden water to leak from the pavement surface into
the bridge girders, bearings and the concrete substructure causing corrosion and
deterioration of bridge substructure (Mistry, 2005). A survey on 200 bridges in the
United Kingdom revealed that the expansion joints are the dominant source of costly
and traffic-retarding maintenance works (Lock, 2002). Moreover, defective
expansion joints can produce a serious hazard to bridge users due to the broken or
loosen parts. Therefore, maintaining a bridge to a high level of performance and
safety standard requires costly and frequent maintenance works.
Because of the potential construction and maintenance problems associated with the
expansion joints, a new trend of bridge constructions has arisen. The new concept
aims to construct a bridge system that is physically and structurally free of joints or
bearings. This type of bridge systems are referred to as Integral Abutment or Joint-
less bridges (IAB). Terms like “continuous bridges” and “rigid bridges” have also
been used in literature to describe the IABs (Bayoglu, 2004). In a typical integral
abutment bridge, the deck is continuously running along the bridge without joints
and is rigidly connected to the bridge abutments as a single structural unit.
Abutments, on the other hand, are used to retain the soil backfill on both sides of the
bridge. Figure 2.1 shows a typical IAB system.

Chapter two Literature review
9
In this chapter, a comprehensive literature review has been conducted to outline the
dominant problems encountered in IABs and in particular the interaction behaviour
between the approach soil and bridge substructure. Since the current study
investigates the application of the Expanded Polystyrene (EPS) geofoam to mitigate
the potential approach problems in IABs, the behaviour of EPS will also be reviewed
in this chapter.
Fig. 2.1 Integral Abutment Bridge System
2.2 Integral Abutment Bridges (IABs)
Integral bridges have been used since 1938 in Ohio, United States (Burke, 2009).
During the following decades, the concept of integral bridges has been progressively
adopted in many countries around the world. In 1980, the American Federal
Highway Association (FHWA) recommended to construct bridges with overall
lengths of 90 m for steel bridges, 150 m for cast-in-place concrete bridges and 183 m
for post-tensioned bridges as IABs (Hassiotis, 2005). In 1996 the British Highways
Agency advised to use the integral bridge system for any bridge up to 60m length
(Lock, 2002). In Japan, the construction of the first integral bridge was completed in
1996 while South Korea constructed its first integral bridge in 2002 (Burke, 2009). In
Australia, IABs are receiving growing interest and considered as an option in recent
projects. In the Peninsula Link Highway project in Victoria, eleven out of thirty
bridges were constructed with IABs (Gibbens and McManus, 2011).
Currently, the IABs are the standard design option in most of the US states
(Hassiotis, 2005). Although the IABs are still outnumbered compared to the
conventional or jointed bridges, the overall trend of bridges construction seems to be
moving toward IABs (Mistry, 2005).
Backfill
Abutment
Bridge Deck
Foundation
Approach Slab
Abutment – Deck rigid
joint
Chapter two Literature review
10
2.3 Advantages of IAB system
Integral bridges are generally performing efficiently and last longer than traditional
bridges with less maintenance works (Burke, 2009). The attributes of IABs are
principally ensuing from eliminating of the expansion joints and bearings from the
bridge deck. The advantages of IABs can be summarized as below,
Minimise the construction cost and project time.
Significant savings in the potential maintenance costs throughout the lifetime
of the bridge.
Ease of design and construction
The structural continuity improves the bridge structural performance in terms
of resisting seismic loads
Eliminate the possible safety issues due to defective joints and alleviate riding
quality issues.
2.4 Problems and Limitations of IABS
Although, the IAB system is likely to overcome the construction and maintenance
difficulties caused by the expansion joints, other problems seem to be inherently
associated with IABs. Temperature fluctuations that occur on both diurnal and
seasonal basis will result in changes in the dimensions of the bridge. Bridge deck will
expand or contract in response to the changes in the ambient temperature. Such
changes in the bridge dimensions cannot be accommodated within the bridge deck
due to the absence of the expansion joints. Therefore, the thermal induced
deformations will be reflected on the bridge abutments in terms of rotational and
translational movements, against and away from the retained approach soil,
corresponding to the temperature changes. During the hot or summer seasons, the
deck will expand and will push the abutments toward the retained soil, while in the
winter seasons abutments will be displaced in the reverse direction towards the
bridge deck. As the abutment is normally connected to the deck at the top end, the
greatest magnitude of displacement typically occurs at the highest end of the
abutment and decreased down towards the base (Horvath, 2000).
Temperature variation has critical effects in integral abutment bridges and their
impacts can be as significant as the live loads (Thevaneyan et al., 2014). Therefore,

Chapter two Literature review
11
even when abutment displacement is relatively small and does not exceed a few tens
of millimetres, it may constitute a source of significant long term structural and
geotechnical problems.
An in-depth understanding of the effects imposed by the temperature induced cyclic
movement of bridge abutments is still lacking. This is a result of the complex
interaction mechanism between the retained soil and the bridge structure (Huntly and
Valsangkar, 2013). However, according to the literature, there are two primary
detrimental effects result from the abutment movements as discussed below.
2.4.1 Long term built–up of lateral earth pressures:
When a bridge deck expands under a temperature increase during the hot season, it
will push the abutments against the retained soil which increases the lateral pressure
imposed on the abutment by the backfill. In that case, earth pressures will certainly
exceed the at–rest pressure (Kₒ) or the initial pressure of the abutment. In the reverse
cycle, when the abutment is displaced towards the bridge deck as a result of bridge
contraction, a wedge-shaped part of soil will slide into the gap induced behind the
abutment. This part of soil will resist the abutment returning back to its initial
position when temperature rises again. As such, the abutment will experience an
extent of inward translational movement relative to its original position. The
repetition of that scenario will lead to increased lateral pressure on abutments in an
accelerated rate causing what is called stress ratcheting (Horvath, 2000; England et
al., 2000). The build-up of lateral pressure under this phenomenon may take many
years to occur, but it can produce a serious structural problem that may result in
abutment failure.
2.4.2 Settlement of the bridge approach
The cyclic movement of the abutment towards and away from the retained soil and
the associated increase in lateral pressure will result in soil densification and volume
contraction of the retained backfill (Ng et al., 1998). Furthermore, soil slumping will
also occur behind the abutment wall due to both the cyclic rotational and
translational movements of the abutment. Eventually, the aforementioned impacts
will collectively contribute to develop the classical soil trough at the bridge
approaches. Figure 2.2 shows a typical soil trough developed at an IAB approach.

Chapter two Literature review
12
The size, pattern and depth of the soil trough depend on different factors such as the
frequency and amplitude of the cyclic movement, depth and type of the abutment
wall and the properties of the backfill (Cosgrove and Lehane, 2003). Some
theoretical data proposes that the influence zone of settlement extends to a distance
equals to 2H, whereas H represents the height of the abutment. However a finite
element analysis performed by Arzoe et al. (1999) show that the influence zone may
extend to a distance more than 3H from the face of the abutment.
Fig. 2.2 Typical approach settlement in integral bridge due to abutment cyclic
movements
The information available on the effects of abutment movements in IABs on the
approach soil is still far from complete. Limited experimental tests have been
conducted to investigate the settlements and lateral pressures at the approach soil that
include centrifuge tests, (Springman et al., 1996; Ng. et al., 1998), small scale
experiments at a normal gravity (England et al., 2000; Cosgrove and Lehane, 2003;
Tatsuoka et al., 2009) in addition to field data collected from in-service IABs
(Wolde-Tinsae, 1988; Hoppe and Gomez, 1996; Arzoy et al., 1999; Hoppe, 2005;
Civjan et al., 2007; Barr et al., 2013; Huntley and Valsangkar, 2013).
Bridge Deck
Abutment wall Soil
Two way abutment movements Soil trough developed due
to abutment movements
Soil

Chapter two Literature review
13
2.5 An Overview of the Existing Theories
2.5.1 Lateral Earth Pressures
Lateral earth pressures behind bridge abutments were generally estimated using
classical theories such as Coulomb and Rankine. They introduce methodologies for
calculating the active and passive earth pressures taking into account a plane failure
surface (Khodair, 2009). Rankine theory assumes a linear variation of stress at the
interface with a frictionless wall and calculates the active and passive pressures using
the following formulas,
𝑃𝑎 = 𝛾 𝑧𝐾𝑎 (2.1)
𝑃𝑝 = 𝛾 𝑧𝐾𝑝 (2.2)
where 𝛾 is the unit weight of the soil, z is the depth from the soil surface, 𝐾𝑎 and
𝐾𝑝 are the active and passive coefficients of lateral earth pressures respectively and
are defined as,
𝐾𝑎 =1−𝑠𝑖𝑛∅
1+𝑠𝑖𝑛∅ (2.3)
𝐾𝑝 =1+𝑠𝑖𝑛∅
1−𝑠𝑖𝑛∅ (2.4)
In Coulomb theory, earth pressures behind a vertical wall retaining a backfill is
calculated as follow,
𝐾𝑎 = 𝑐𝑜𝑠2∅
𝑐𝑜𝑠𝛿[1+{𝑠𝑖𝑛(∅+𝛿)𝑠𝑖𝑛∅ 𝑐𝑜𝑠𝛿⁄ }1 2⁄ ]2 (2.5)
𝐾𝑝 = 𝑐𝑜𝑠2∅
𝑐𝑜𝑠𝛿[1−{𝑠𝑖𝑛(∅−𝛿)𝑠𝑖𝑛∅ 𝑐𝑜𝑠𝛿⁄ }1 2⁄ ]2 (2.6)
where ∅ refers to the friction angle of the soil, 𝛿 is the angle of friction between the
soil and the wall.
Despite that the IABs are widely utilized across the world, there is no standard or
unified design approach that describes the magnitude and distribution of lateral earth
pressure acting on the abutments (Arzoy et al., 1999; Huntly and Valsangkar, 2013).
The current design guidelines are based on empirical approaches or past experiences
from previously constructed structures. This may ensue from the lack of

Chapter two Literature review
14
understanding for the soil-structure interaction issues unique to this type of
structures.
The US practice involves significant variations in the design guidelines and
limitations of the integral bridges among different states. However, the
recommendations of the American Association of State Highway and Transportation
Officials (AASHTO) are generally adopted in many states in US (Bayoglu, 2004).
In Australia, the design of IABs is primarily based on the UK Design Manual for
Roads and Bridges, BA42/96(2003) which is issued by the British Highways and
Bridges Agency.
The UK Design Manual for Roads and Bridges, BA42/96 (2003) provides some
guidelines to estimate the value and distribution of the lateral earth pressure acting on
the abutment of integral bridges. Based on experimental data and field observations,
the UK BA42/96 (2003) developed the following equations to calculate the lateral
earth pressure coefficient (K).
For shallow abutment wall (𝐻 ≤ 3𝑚)
𝐾∗= 𝐾𝑜 + (𝑑
0.025𝐻)0.4 𝐾𝑝 (2.7)
For Full height abutment (𝐻 > 3𝑚) hinged at its bottom end
𝐾∗= 𝐾𝑜 + (𝑑
0.015𝐻)0.6 𝐾𝑝 (2.8)
where 𝐾∗ refers to the lateral earth pressure coefficient at the passive state, d is the
horizontal wall displacement, H is the retained height of the soil, 𝐾𝑜 represents the
theoretical at-rest lateral earth pressure coefficient (1 − 𝑠𝑖𝑛∅) and 𝐾𝑃 is the Coulomb
passive coefficient of lateral pressure calculated at soil-abutment friction angle 𝛿
equal to half of the soil internal friction angle ∅.
Figures 2.3 and 2.4 show the distribution of the lateral earth pressures behind
(a) frame abutment and (b) full height embedded wall as suggested by the
UK BA42/96 (2003). It is apparent that the coefficient of lateral pressure is assumed
to be constant at a value equal to 𝐾∗ at the upper part of the abutment and decreases
linearly toward 𝐾𝑜 at the bottom of the wall.

Chapter two Literature review
15
England and Tsang (2005) modified the recommended equation of the UK Highways
Agency (BA42/96, 2003) where the passive pressure coefficient 𝐾∗ is calculated
from Equation 9.
𝐾∗= 𝐾𝑜 + (𝑑
0.03𝐻)0.6 𝐾𝑝 (2.9)
Fig. 2.3 Lateral earth pressure distribution behind frame abutment (BA42/96,
2003)
Fig. 2.4 Lateral pressure distribution behind full height embedded wall (BA42/96,
2003)
It is apparent that the recommendations given by the UK BA42/96 (2003), Equations
7 and 8, do not account for the number of abutment rotations required for the
possible hardening and stiffness increase in the retained backfill. This approach does
not take into account the findings of a number of researchers who observed an
escalation in the lateral stresses with the number of movement cycles (Ng. et al.,
1998; England et al., 2000; Horvath, 2000; Lehane, 2011).

Chapter two Literature review
16
a
Lehane (2011) reported centrifuge test results conducted at the University of Western
Australia on a deep wall integral bridge. He reported that stresses behind abutment
wall increase linearly with the logarithm of the number of cycles, N, up to 100
cycles. However, values of lateral stress asymptote between 100 and 1000 cycles. He
also stated that the location of the maximum lateral pressure is observed at the upper
half of the wall height.
According to Lehane (2011), the escalation in the lateral stresses is associated with
an increase in the stiffness of the soil adjacent to the wall. He emphasised that the
estimation of lateral stresses has to account for the actual or, as described by him, the
“operational stiffness” of the soil 𝐸𝑝. Based on a backward analysis from test results,
he found that, at a relatively small wall displacements, the operational stiffness (𝐸𝑝)
of the soil relates primarily to the small-strain modulus 𝐸𝑜 and is independent to the
initial soil density. Lehane (2011) suggested that the 𝐸𝑝 can be assumed as 40% of
the small-strain stiffness of the compacted backfill 𝐸𝑜𝑐.
Lehane (2011) compared the lateral stresses computed using a simple elastic FE
model that utilises the operational stiffness of the soil 𝐸𝑝 with the recommendations
given in the UK publication BA42/96(2003), i.e. Equations 7 and 8.
Fig. 2.5 Comparison of the value of 𝐾∗ as predicted by Lehane (2011) with those
recommended in the UKBA42/96 (2003) at displacement amplitude equal to
(a) 0.2% and (b) 0.5%
(b) (a)

Chapter two Literature review
17
He found that the UK BA42/96(2002) recommendations underestimate the lateral
earth pressure at the upper third of the abutment, as shown in Figure 2.5.
Broms and Ingelson (1971) measured the lateral earth pressures acting on the
abutments in 150m and 110m integral bridges in Sweden. Based on the observed
data, they propose that the lateral earth pressure behind an abutment experiencing
cyclic movements varies linearly from zero at the top (at soil surface) to Rankine
passive pressure at 1 3⁄ H then decreases linearly to Rankine active pressure at the
bottom of the wall (H refers to the retained height of the abutment). This proposed
envelope for lateral pressure accounts for the stresses developed due to the
compaction of the backfill in addition to the rotational movements of the abutments.
Sandford and Elgaaly (1974) modified this pressure envelope, as given in Figure 2.6,
considering the pressure acting at the toe of the abutment equals to the at-rest
pressure instead of the Rankine active pressure.
Fig. 2.6 Earth Pressure distribution behind Abutment (After Bayoglu, 2004)
Ng. et al. (1998) conducted centrifuge tests on loose and dense sand backfills
subjected to range of cyclic perturbations. According to Ng. et al. (1998) the
temperature effects in IABs result in rotational and translational movements in bridge
abutments. It was found that the active movements of the wall lead to slippage of soil
particles into the gap between the wall and soil which results in an increase in lateral
earth pressure. They stated that the development of high lateral pressures is
dependent to the amount of perturbation, number of cycles and the density of the
soil. However, at a given magnitude of perturbation, the lateral earth pressure
coefficient 𝐾 increases with the number of cycles in a decreasing rate. The test
results showed that, 50% to 70% of the total increase in the value of K after 100
cycles is actually occurring within the first 20 cycles.
Broms & Ingelson design envelope
Abutm
ent
Wal
l
𝐻 3⁄ Rankine Passive
Pressure
Rankine Active Pressure 𝐻
At-rest Pressure

Chapter two Literature review
18
Throughout the test, the value of 𝐾 has always been exceeding the at-rest pressure
coefficient 𝐾𝑜. After applying the annual perturbations (±30𝑚𝑚) the maximum
measured value of 𝐾 exceeded the theoretical value of the passive earth pressure
coefficient 𝐾𝑝. The critical values of lateral pressures observed in the test were all
located closer to the surface of the soil than to the base of the wall.
England et al. (2000) conducted an experimental program on a small wall retaining a
sandy soil. Rotational amplitudes ( 𝑑 𝐻⁄ ) ranging from 0.13% to 0.9% were applied
(d refers to the horizontal displacement of bridge deck at one side at the abutment top
level and H represents the total height of the abutment). The test results reported by
England et al. (2000) showed a rapid escalation in the lateral stresses from the initial
𝐾𝑜 value during the first ten cycles. However, stresses thereafter were increasing at a
slower rate. The maximum value of the lateral pressure coefficients K measured at a
passive state, after 300 cycles of ±0.125% amplitude, was 2.6 and recorded at the
upper third of the wall height. On the other hand, the active pressure was found to be
insensitive to the increase in the number of cycles and varied in small range between
0.1 and 0.2.
Fig. 2.7 Variation of the pressure coefficient K with the number of cycles
(England et al., 2000).
Tatsuoka et al. (2009) conducted series of plane – strain tests on a 505mm high small
wall retaining loose sand. Tests involved using hinge – supported wall, at its bottom
end, which allows only rotational movement as well as embedded wall in which
translation and rotation movements are fairly free. Horizontal amplitudes (𝑑 𝐻⁄ )
Number of cycles
Lat
eral
ear
th p
ress
ure
co
effi
cien
t K

Chapter two Literature review
19
Wall normalized displacement
(𝑑 𝐻)⁄ %
ranging between 0.2% and 0.6% were applied at the top of the wall (d refers to the
horizontal displacement at the top of the wall and H represents the total height of the
wall). Two styles of horizontal displacement involving “active-only” and
“active/passive” were applied (active-only refers to the wall movement within a
range between initial and active positions while active/passive refers to the wall
movement within the range of passive - active positions).
After a number of loading cycles, escalations in the lateral stresses were apparent in
both active and active/passive tests. Lateral pressure coefficient K became five times
higher than the initial value 𝐾𝑜 after 200 cycles of 0.2% active-only displacement as
shown in Fig. 2.8.
Fig. 2.8 Relationship between the lateral pressure coefficient, K and the horizontal
wall displacement, in active and active/passive conditions (Tastsouka et al., 2009)
Huntley and Valsangkar (2013) reported field data collected, over three years, from
76m length two-span integral bridge in Brunswick, Canada. The bridge was
instrumented during the construction with six load cells (three at each abutment)
mounted at 0.25H, 0.5H and 0.75H (H refers to the abutment height). The abutments
were also provided with deformation and tilt meters to detect any translation or
rotation in the abutment. The results showed that the movements of the abutments,
translation and rotation, are generally conforming to the temperature fluctuations.
However, the abutments did not exhibit equal movements whereas the western
abutment rotates slightly more than the eastern one. According to Huntly and
Lat
eral
ear
th p
ress
ure
co
effi
cien
t
K
Chapter two Literature review
20
Valsangkar (2013) this variation may ensue from different exposure to the sun light
or from some differences in degree of compaction of the approach backfill.
The field data indicate that lateral stresses acting on the abutments were correlating
with the temperature changes and wall movements. Maximum lateral earth pressures
were recorded during summer in each of the three years. The stresses at the western
abutment recorded high values at the upper sensor compared to the mid and lower
sensors, while in the eastern abutment stresses were almost constant throughout the
height of the abutment. This highlights the influence of the movement mode on stress
distribution, where the motion in the eastern abutment was predominantly translation
with a very small amount of rotation.
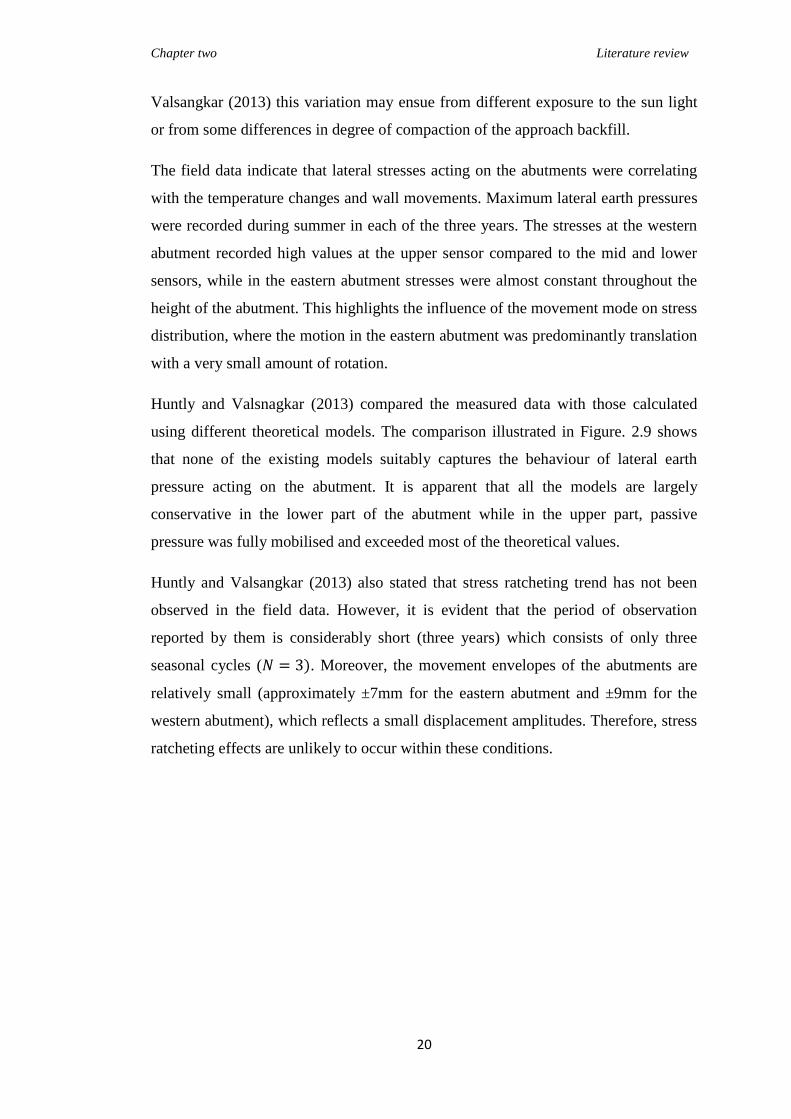
Huntly and Valsnagkar (2013) compared the measured data with those calculated
using different theoretical models. The comparison illustrated in Figure. 2.9 shows
that none of the existing models suitably captures the behaviour of lateral earth
pressure acting on the abutment. It is apparent that all the models are largely
conservative in the lower part of the abutment while in the upper part, passive
pressure was fully mobilised and exceeded most of the theoretical values.
Huntly and Valsangkar (2013) also stated that stress ratcheting trend has not been
observed in the field data. However, it is evident that the period of observation
reported by them is considerably short (three years) which consists of only three
seasonal cycles (𝑁 = 3). Moreover, the movement envelopes of the abutments are
relatively small (approximately ±7mm for the eastern abutment and ±9mm for the
western abutment), which reflects a small displacement amplitudes. Therefore, stress
ratcheting effects are unlikely to occur within these conditions.

Chapter two Literature review
21
Time
Lat
eral
ear
th p
ress
ure
co
effi
cien
t, K
Time
Lat
eral
ear
th p
ress
ure
coef
fici
ent,
K
Fig. 2.9 (a)
Figure 2.9 (b)
Figure 2.9 Measured earth pressures at (a) the upper and (b) middle sensors of the
western abutment (Huntly and Valsangkar, 2013)
Hoppe and Gomez (1996) reported field data collected from 98m two-span semi
integral bridge with 2.7m height concrete back wall in Virginia-USA. The bridge

Chapter two Literature review
22
Time
was instrumented during the construction stage and data were recorded for two and
half years. The collected data showed a daily variation in the lateral pressures acting
on the back wall in conformance with the temperature changes. Full passive earth
pressure was mobilised at the back of the wall and recorded at the upper pressure cell
(at 1.3m from the top). The maximum weekly pressures acting on the wall for the
period between January 1994 and January 1996 are presented in Figure 2.10. It is
apparent that a slight escalation in the average values of maximum stresses occurs
during this period. Abutments A and B showed similar behaviours in terms of lateral
pressure development but with differences in the magnitudes. Maximum lateral
stresses recorded in Abutments A and B were 175kPa and 200kPa respectively.
According to Hoppe and Gomez (1996) such variation might be a result of different
degree of compaction of soil in both approaches.
Based on a backward analysis from the field data, they observed that the computed
internal shear angle and unit weight of the soil (35°, 18kN/m3) are higher than initial
values used in the design. This indicates densification effects occurred in the
approach backfill.
(a) (b)
Fig. 2.10 Maximum weekly soil pressures acting on (a) back-wall A and
(b) back-wall B (Hoppe and Gomez, 1996)
It can be observed from the previous review, that predicting maximum lateral
pressures in the IABs using various models depends primarily on the theoretical
value of lateral earth pressure coefficient 𝐾𝑝.The existing design guidelines do not
provide a conclusive information on the method of calculating 𝐾𝑝. Therefore,
designers are usually free to choose the method to determine the value of 𝐾𝑝, which
consequently reflect a difference in the design outcomes. Tan et al. (2015) compared
the UK BA42/96 (2003) lateral earth pressure coefficient 𝐾∗ computed based on
Rankine and Coulomb theories, as shown in Figure. 2.11. It was found that at 𝑑 𝐻⁄

Chapter two Literature review
23
equals to 1%, the difference in the values of 𝐾∗was approximately 30% and 20% in
Equations 7 and 9 respectively.
(a) (b)
Fig. 2.11 Variation in the Value of 𝐾∗computed based on (a) Equation 7 &
(b) Equation 9 (After Tan et al., 2015)
2.5.2 Settlement of the Approach Soil
Settlement of the approach soil is a very common problem in the integral bridges.
Both, the experimental tests as well as the field observations show that the retained
backfill experiences an extent of settlement as a result of the movements of the
abutments (Ng. et al., 1998; England at al., 2000; Cosgrove and Lehane, 2003;
Tatsuka et al., 2009).
The centrifuge test results of Ng. et al. (1998) showed significant soil settlements in
the proximity of the wall after 100 cycles of (±60mm) perturbations. According to
Ng. et al. (1998), the combination of the rotational and translational movements of
the wall results in densification and volume contraction in the adjacent soil. Dense
and loose soils exhibited different settlement profiles, as illustrated in Figure. 2.12.
A sink-like trough was observed in the dense backfill with a maximum settlement of
660mm. On the other hand, the loose soil produced a steady settlement increasing
towards the abutment wall with maximum settlement reaching 700mm. The
influence zone of settlement in loose soil was approximately two times greater than
that in the dense soil.

Chapter two Literature review
24
(a) (b)
Fig. 2.12 Typical Soil Settlement Profiles in (a) dense soil and (b) loose soil
Ng. et al. (1998) stated that the settlement depends primarily on the amplitude and
the number of perturbation cycles. They also found that the magnitude of the shear
strain developed at the end of 100 cycles of given amplitude is 3 – 20 times higher
than the value under monotonic loading conditions with the same displacement
amplitude.
The settlement results observed by England et al. (2000) showed a progressive
increase in the maximum settlement of soil surface with the number of cycles but at a
slightly reducing rate. Their results indicated that the settlement is sensitive to the
amplitude of wall movement and, unlike the lateral stresses, did not approach a
limiting value after 300 cycles, as it appears in Figure 2.13.
According to England et al. (2000), the settlement is a result of the densification
effects in the backfill due to the wall movements against and away from the soil.
Such effects are identified by the heave in the free surface of the soil at 350mm
distance from the wall. The results reported by England et al. (2000) showed an
active slip wedge of soil developed adjacent to the wall. It is apparent, from Figure
2.14, that the slip wedge was progressing with the number of cycles to reach an
absolute settlement of approximately 40mm after 60 cycles of combined daily
(0.042%) and annual (0.25%) perturbations.
Loose soil
Steady settlement
Abutment wall
Dense soil
Sink-like trough
Abutment wall

Chapter two Literature review
25
No. of Cycles
Set
tlem
ent
(mm
)
Distance from wall (mm) Distance from wall (mm)
Fig. 2.13 Relationship between maximum settlement and the number of cycles
(England et al., 2000)
Fig. 2.14 Settlement of loose sand after 25, 35, 55 and 65 of combined daily and
annual cycles (England et al., 2000)
Tatsuoka et al. (2009) reported similar conclusions as a result of testing loose sand
retained by a 505mm high wall and subjected to cyclic displacements. The settlement
𝜃 ≈ 𝟔𝟓𝒐
Active or slip
wedge

Chapter two Literature review
26
of the soil, in response to the wall movement, was gradually increasing with the
number of cycles. Maximum settlement observed at 5cm from the wall after 50
cycles of displacement (d/H) equal to 0.2% was almost 0.7% of the wall height H.
Tatsuoka et al (2009) justifies that settlement in the soil surface by the dual – ratchet
mechanism. A small active sliding occurs in the loosened soil adjacent to the wall,
due to wall active movement, forming an active soil wedge. During the passive phase
of wall movement, the active wedge is going to be compressed as part of a larger
passive soil wedge. According to Tatsuoka et al. (2009) the deformation in the small
active wedge will not be substantially recovered during the passive movement and
will therefore be accumulated with further deformations in the subsequent active
movements. On the other hand, the passive wedge, which is not completely affected
by the active movement, experiences a repetitive compression which leads to
densification and volumetric contraction. Therefore, the settlement is eventually a
result of accumulated dual volumetric deformations in the active and passive wedges
of the soil. The mechanism proposed by Tatsuoka et al. (2009) is illustrated in
Figure. 2.15.
Cosgrove and Lehane (2003) conducted experiments on a 1m high loose backfill
subjected to cyclic loading. The tests were intended to represent an abutment wall
subjected to temperature induced cyclic loading. Two tests were conducted in which
different numbers of cycles and loading amplitudes were applied as given in Table
2.1. They used an optical measurement system, in which a number of visual targets
had been embedded in the soil, to capture the extent and direction of soil movements
in response to the cyclic displacement of the wall.
Table 2.1 Tests details as described by Cosgrove and Lehane (2003)
Test Displacement (d/H)% Number of cycles (N)
1 0.63 120
2 0.23 500
According to Cosgrove and Lehane (2003), both tests showed significant settlements
in the soil surface after 100 cycles of wall movement. They stated that settlement in
the soil surface varies nonlinearly with the number of cycles. The absolute measured

Chapter two Literature review
27
settlements, after 100 cycles, were equal to 20% and 10% of the total wall height in
test 1 and test 2 respectively.
Based on the movement vectors illustrated in Figures 2.16 (a) and 2.16 (b), a
triangular small wedge of soil moves at inclined downward direction during wall
active displacement while a reversal movement direction is observed during the
passive wall displacement. As observed in Figure 2.9 (b) (during the passive phase of
the cycle), the direction of movement is predominantly horizontal with a very small
vertical component. That means the precedent inclined active motion was not equally
reversed during the passive phase of the movement. This behaviour indicates the
occurrence of unrecoverable vertical deformation in the active wedge. The
subsequent cycles are also expected to behave similarly, perhaps with different
deformation behaviour in the active soil wedge. The accumulation of such
deformations is the likely primary reason contributing to settlements observed in the
approach of IABs.
(a) (b)
(c) (d)
Fig. 2.15 Dual ratchet mechanism due to wall rotational movement
(After Tatsuoka et al., 2009)
Active wedge formed during
first active movement
No major deformation
outside the active
wedge
Active
No displacement or
deformation of passive
wedge
Accumulated deformation in active
wedge in second active
displacement Active
Accumulated deformation in
passive wedge in second passive
displacement Passive
Passive wedge formed
during passive movement
Active wedge is part of the
passive wedge, not recovering the
previous active displacement Passive

Chapter two Literature review
28
It is apparent from Figures 2.6 (c) and 2.6 (d) that the movement effects during the
first cycle (𝑁 = 1) are very small or negligible at or beyond 500mm from the wall.
That defines the boundaries of the influence zone in response to wall rotation. In
contrast with the movement styles at 𝑁 = 50, less extents of active and passive
displacements are observed. That may justify the reduction in the settlement
incremental rate after many cycles of wall movements. However, the influence zone,
after 50 cycles, is extended to more than 600mm from the wall, which indicates more
volume of soil is being affected by the wall movements.
Fig. 2.16 Active and passive movement vectors (Cosgrove and Lehane, 2003)
2.6 Measures to Solve Approach Problems in IABs
The design guidelines of IABs vary widely from one country to another and therefore
standard measures utilised to alleviate the approach problems in IABs are not clearly
established. The use of run-on slab and well compacted soil in the vicinity of the
abutment are the common suggestions to minimise the approach settlements
(Horvath, 2000; Lock, 2002). Springman et al (1996) (cited in Lock, 2002) suggested
that loose backfills should not be used in IAB approaches, irrespective of the use of

Chapter two Literature review
29
approach slabs. However, in the United Kingdom and in some of the US states, the
use of the run-on slab is not advised as the settlement will occur whether or not
approach slab is provided (Lock, 2002). Also, the presence of the run-on slab will
complicate and increase the cost of the maintenance works for settled backfill as
compared to soil overlay and pavement patching (Hoppe and Gomez, 1996). On the
other hand the use of heavily compacted backfill was proven to increase the stiffness
of the retained soil and consequently results in high lateral pressures on the bridge
abutments (Hoppe, 2005).
Nam and Park (2014) reported some construction details and field observations data
from the first IAB constructed in South Korea. In an attempt to minimize the lateral
earth pressures on the abutment, 1.0m wide and 3.3m high pressure relief zones were
provided at bridge approaches adjacent to the abutments. The zone was filled with
coarse sub-base cohesion-less material type A-1-a (according to AASHTO
classification system). The concept of using this material was to minimize the
interlocking effects of backfill materials due to the horizontal movements of the
abutments and consequently alleviate the passive earth pressures. However, the
reported data represents only the first two years after the opening of the bridge (two
annual cycles) during which the maximum recorded displacement amplitude were
+8.8mm (passive) and -3.3mm (active). Both are relatively small amplitudes.
Nevertheless, passive pressure was mobilised behind the wall and maximum
recorded value of 𝐾𝑝 reached approximately 4.4 (50% of Rankine passive pressure)
during the summer of the second year. Such results show no evidence of avoiding
higher lateral pressures after many cycles of abutment movements.
2.7 Expanded Polystyrene Geofoam (EPS)
The expanded polystyrene (EPS) geofoam is a polymeric material belonging to the
family of the geosynthetic. The EPS possesses unique favourable characteristics
among which its extremely low density. The EPS used in civil engineering
applications has a density range from as low as 12kg/m3(less than a hundredth of
typical soil fill density)(Horvath, 1994). It also has favourable mechanical and
thermal properties such as its compressive strength and thermal insulation
characteristics (BASF, 2006). In addition to that, EPS is an environmentally friendly
material and provides a cost effective choice for construction. These features have

Chapter two Literature review
30
collectively put the EPS geofoam as one of the best light-weight materials available.
Therefore it has several geotechnical applications such as a light weight fill for
embankments, a compressible inclusion for retaining structures, and a stabilization
material for slopes, in addition to its potential use in integral abutment bridge
systems.
2.7.1 Physical Properties
The EPS is a cellular rigid material formed of polyhedron expanded polystyrene
particles. The expanded polystyrene particles are fused together during the
manufacturing process forming an integrated cellular structure with air voids in
between the particles. The polystyrene particles themselves are formed of vast
number of air filled closed cells. Figure 2.17 shows the internal micro structure of an
EPS specimen.
The density of EPS is an important factor that affects many of its physical and
mechanical properties. During the manufacturing process, it is possible, to a certain
extent, to control the density of EPS by controlling the quantity of moulded
polystyrene beads. Therefore, EPS can be produced in variety of densities between
10kg/m³ and 50kg/m³. However, in most of the geotechnical applications, the density
of EPS used is 20kg/m³ (Horvath, 1994).
In addition to its ultra-light weight, EPS is inherently non-biodegradable material and
chemically inactive with soil or water (Horvath, 1994). It also doesn’t offer a
nutritive medium for undersoil organisms. These features made the EPS a durable
geotechnical material.

Chapter two Literature review
31
Fig. 2.17 Internal structure of EPS (Ossa and Romo, 2009)
2.7.2 Mechanical Properties of EPS
2.7.2.1 Stress-Strain Relationship
The stress-strain relationship of EPS in compression, like its other mechanical and
physical properties, correlates to its density. Higher the density of EPS, the higher
will be its compressive strength. Table 2.2 shows selected values of EPS densities
with the corresponding compressive strength. Nevertheless, the stress-strain
relationship of EPS is qualitatively similar irrespective of its density (Horvath, 1994).
Table 2.2 10% strain - compressive strength of EPS with different densities
(Elraji 2000).
Density (kg/m3) 12 15 18 22 29
Compressive strength at 10% strain (kPa)
35 69 90 104 173
In rapid compression tests, EPS is known to exhibit a linear elastic behaviour
immediately after loading. That behaviour is represented by the initial straight part of
the stress-strain diagram. Slope of that linear part is defined as the Elastic Modulus
(a) EPS specimen (b) EPS particles
(c) EPS particles and cells (d) Air filled closed cells

Chapter two Literature review
32
or Young’s Modulus of EPS. The value of the elastic modulus of EPS, as mentioned
before, is affected by its density. Within this zone (the elastic zone) the micro cell
walls tend to bend and buckle in an attempt to absorb the energy induced by the
applied load. As a result, the elastic stiffness of the material will be decreased and its
behaviour will transform into a plastic stiffness (Ep) (Ossa and Romo, 2009). It was
found that the linear relationship between the applied stress and strain continues until
the value of strain reaches to approximately between 1% - 1.5%
(Horvath, 1994). For well conservative design considerations, researchers
recommended to identify the elastic limit as the point where the developed strain is
equal to 1% (Arellano and Stark, 2009). Therefore, the stress measured at 1% strain
is referred as the elastic limit of the EPS.
Beyond the point of elastic limit the material starts to yield. During this phase, large
amount of energy is dissipated by the continuous deformation of cell walls and
hinges and through expelling cells encapsulated air (Ossa and Romo, 2009). The
yield of EPS is found to occur over a range rather than a certain point at the stress-
strain diagram. That zone of the stress-strain relationship ends up at approximately
10% strains. The stress measured at this point (strain equal to 10%) is generally
referred as the compressive strength of EPS (Horvath, 1994).
Following the yield range, EPS exhibits a pure plastic strain-hardening behaviour.
During this phase, the internal structure and particle geometry are continuously
modified. The internal voids between particles are mostly vanished while the closed
cell walls are completely collapsed. The change in the material internal structure
continues until the polystyrene particles are totally damaged and reversed to their
original nature as polystyrene beads. However, no clear mode of failure appears in
the stress strain relationship of EPS.

Chapter two Literature review
33
Fig. 2.18 EPS Stress-Strain relationship in rapid unconfined compression test
(Arellano and Stark, 2009)
2.7.2.2 Time Dependant Behaviour
EPS is found to exhibit time dependent behaviour represented by the creep and stress
relaxation when it is subjected to sustained loading conditions. Creep refers to the
plastic deformation developed over a period of time under sustained load, while the
stress relaxation is expressed as the reduction in stress with time under constant
strain. Creep and relaxation are in fact reciprocal phenomena appearing in EPS
behaviour due its visco-plastic characteristics.
In a typical axial compression test, an EPS specimen will deform elastically upon
application of load. Shortly after and when specimen exceeds its elastic limit, it will
enter into the plastic zone and some part of the developed strain will be irreversible.
The total strain at this stage is the combination of elastic strain plus the creep or time
dependent strains. The total strain can also be decomposed into immediate and time-
dependent components as follows:
휀 = 휀𝑜 + 휀𝑡 (2.10)
0 10 20 30 40 50 60 70 80 90 100
1000
900
800
700
600
500
400
300
200
100
0
Compressive
strength
Zone
Zone 2 Zone 3 Zone 4
Co
mp
ress
ive
stre
ss (
kP
a)
Compressive strain
(%)

Chapter two Literature review
34
where 휀 is the total strain developed after a certain time (t), 휀𝑜 is the immediate strain
due the load application, which also represents the elastic component of the strain
and 휀𝑡 is the creep or the time-dependant strain developed during the time (t)
The amount of creep in EPS is susceptible to the initial applied load and EPS density
(Chun et al., 2004). Horvath (1994) stipulated that small or negligible amount of
creep is observed in specimens subjected to an initial strain below 1%, but significant
increase in the developed creep occurred when the specimen was initially strained by
more than 1%. Accordingly a design criterion was suggested to limit the applied load
on EPS blocks below the elastic limit to avoid excessive time dependent deformation
(Arellano and Stark, 2009).
Elraji (2000) described the results of creep test for different EPS specimens with
different initial loading levels. The result showed dramatic increase in creep when
the initial loading was 70% of compressive strength, while the creep effects were
limited when the initial stress levels were 30% and 50 % of its compressive strength
Figure 2.19 Time dependant behaviour of EPS at different stress levels (Elraji, 2000)
2.7.3 Applications of EPS in Mitigating Approach Problems in IABs
There is no evidence in literature indicating the use of EPS geofoam, as a design
requirement, for the specific purpose of mitigating the approach problems in IABs.
According to Barr et al. (2013), none of the European countries require the use of
any type of inclusion behind the abutments in the IABs. However, a few US states

Chapter two Literature review
35
are using some sort of elastic materials as inclusions behind the abutments in IABs
(Barr et al., 2013).
The inherent properties of the EPS make it a perfect alternative to the persistent
lateral pressures and soil settlements in integral bridges. Hoppe (2005) reported field
data collected, over five years, from an integral bridge on Jackson River in state of
Virginia in the United States. The bridge was the first IAB in the US to include a
compressible inclusion with a principle role aiming to mitigate the settlements and
lateral pressure problems. The inclusion represented by 250mm thick board of
elasticised polystyrene (EPS) placed between the retained backfill and the concrete
back wall along the width of the bridge. The height of the EPS board was terminated
at 0.76m from the top of the wall to allow for placing a pressure cell that measures
the lateral pressures directly on the wall (without inclusion).
The 100m long and 16.6m wide three span integral bridge was instrumented during
the construction stage and was opened for traffic in 1999. Three pressure cells were
provided at each abutment mounted at 0.63m, 1.12m and 1.6m from top of the wall.
The reported data include lateral soil pressure, acting on the abutment walls, and the
settlement in the approach soil recorded during the period from 1999 until 2005.
Fig. 2.20 EPS inclusion in Jackson River Bridge, Virginia, US (Hoppe, 2005)
EPS inclusion

Chapter two Literature review
36
According to Hoppe (2005) lateral earth pressures were reduced significantly behind
the EPS inclusion compared to the upper part of abutment (where there is no EPS
inclusion). Maximum stress in the middle sensor was approximately 7% to 10% of
the upper sensor. However, lateral pressure in the upper part of the abutment is
certainly higher than that in the middle or the lower parts. Therefore for a fair
comparison, pressures need to be measured at similar locations.
The settlement at the approach soil for the period between November 1999 and
December 2004 was monitored. Limited surface settlement, approximately 20mm,
observed at the end of that period. The bridge approaches were maintained only once
with pavement patching since the opening of the bridge. Hoppe (2005) compared that
maintenance works with those carried out in another integral bridge in the City of
Rockingham County, which has approximately the same length. The latter suffered
excessive settlement at the vicinity of abutment and approach pavement was
repeatedly patched.
2.8 Gaps in the Current Knowledge
The integral abutment bridges are widely utilized around the world because of their
structural merits and the substantial cost savings associated with the elimination of
the expansion joints. However, the absence of the expansion joints also has negative
impacts. The problems unique to this kind of bridges are primarily caused by its
inability to accommodate the temperature induced deformations in the deck of the
bridge. The cyclic movements of the bridge abutments and the associated lateral
pressure escalation and soil settlements place a great limitation on the use of the
IABs, especially in terms of the length of their span. Solving such problems will
enable the use of IABs of greater span and maximize their potential benefits.
The information reported in literature regarding soil-structure interactions in IABs do
not uniformly agree and seem to be dependent on the conditions under which they
were obtained. As a result, the existing guidelines dealing with the approach
problems in IABs vary widely and are largely conservative in most of the cases.
Moreover, the main focus of a majority of the existing researches is the soil-structure
interaction behaviour in IABs under the temperature induced movement of bridge
abutments. These were mostly carried out using different experimental and numerical

Chapter two Literature review
37
methods to investigate the lateral earth pressures and the approach settlements caused
by abutment movements. In contrast, very limited efforts were devoted to study the
possible remedies for such intractable problems. Therefore, effective and practical
measures to adequately rectify the lateral pressures and approach settlements in the
IABs are currently unavailable. The recommendations given in most of the existing
design manuals are limited to using well compacted soil in the vicinity of the
abutment to minimise the soil settlement. However, stiff soil is likely to cause the
development of high lateral pressure on the abutments due to the latter’s movement
(Hoppe, 2005) and will also experience an amount of undesirable settlement. Using
the run-on or approach concrete slab is still debatable as it does not prevent the
development of the settlement. Moreover, run-on slab can only be effective when the
settlement is relatively small (few millimetres) which is, however, not the case with a
large percentage of IABs where a significant amount of settlement is developed.
Therefore, the aforementioned measures tend to alleviate the symptoms to a degree
but not solve the problem. Generally, the current practice in many countries in
Europe as well as in the US recommends using a regular pavement overlaying and
surface patching programme to overcome the approach settlement. Again, this
measure does not provide an effective solution in addition to being costly and traffic
retarding over the long term.
The data reported by Hoppe (2005) indicated that the EPS performs well in
attenuating the lateral pressures and the settlements at the bridge approaches.
According to him, the EPS inclusion was able to accommodate the movement of the
abutment with minimum disturbance to the adjoining soil. However, the potential
capability of the EPS to mitigate the approach problems in IABs has not been
sufficiently investigated. In fact, the knowledge about the potential use of EPS in the
IABs is very limited and insufficient to produce guidelines to help engineers
overcome the lateral pressures and settlement problems.
The expanded polystyrene (EPS) geofoam has unique characteristics, including its
extremely light weight. As a highly compressible material, the EPS can provide an
effective inclusion to absorb the abutment movement with minimal effects on the
adjoining soil. At the same time, its compressive strength is sufficient to bear the
vertical load. Nevertheless, it has not been utilized in mitigating the approach
problems in IABs extensively. This is because of the lack of available knowledge of

Chapter two Literature review
38
this application. This research intends to address the gaps in the knowledge and
provide a more rigorous insight into the possible use of EPS as a compressible
inclusion in IABs by studying the optimum arrangements of the EPS blocks, the
interaction between soil and EPS and the actual behaviour of the EPS when used in
IABs.

39
Chapter Three
Numerical Simulation of Abutment Wall Experiencing Cyclic
Movement
3.1 Introduction
The field data collected from in-service IABs provide important information on the
soil-structure interaction behaviour. However, collecting the field data requires a
significantly long time and is limited to certain instrumented IABs. Moreover, the
reported field data such as from Hoppe and Gomez (1996) and Huntly and
Valsangkar (2013) showed an extent of variation in the behaviour of the IABs
depending on the mode of abutment movements. It would appear that the mode of
movement plays an important role in the subsequent settlement and lateral pressure
escalation effects. Inherent differences were observed in IABs depending on various
factors including the abutment type, properties of the backfill and the range of
temperature change. Therefore, the field data are quite specific to the conditions of
the structures where the data were collected, and cannot be easily extrapolated to
other field cases with a different set of conditions.
On the other hand, the numerical analysis approach has been adopted by many
researchers to investigate the behaviour of IABs (Ng. et al., 1998; Arzoy et al., 1999;
Dicleli, 2000; Horvath, 2000; Kim and Laman, 2010; Bloodworth et al., 2012). It
provides a flexible tool to study a wide range of cases in a shorter time. In this
chapter, the approach problems in IABs represented by the settlement and lateral
pressures escalation will be investigated using a finite element simulation. A finite
element model was developed using the ABAQUS/Standard software and verified by
the experimental centrifuge data reported by Ng. et al. (1998). The settlement and
lateral earth pressure issues were addressed in the model and the influence of
different parameters are discussed.

Chapter three Numerical simulation of abutment wall experiencing cyclic movement
40
3.2 Building the Finite Element Model
The finite element (FE) model was developed, using the ABAQUS/Standard
(ABAQUS, 2013), to simulate a concrete abutment wall retaining a soil backfill and
subjected to cyclic movements as would be expected to occur in an IAB. The FE
model has been verified using centrifuge test data (Ng. et al., 1998) in which the
presence of a settlement trough and stress ratcheting were observed.
3.2.1 Determination of Scale Factors and Model Dimensions
The geotechnical centrifuge modelling is utilised to perform geotechnical tests on
laboratory scale physical models. In the centrifuge test, the gravitational force is
elevated, by spinning the model, to achieve stress levels equivalent to those in the
actual prototype model in field. The dimensions in the centrifuge tests are largely
downscaled compared to the corresponding dimensions of the prototype. Due
consideration must be given to the centrifuge model dimensions and materials to
enhance the similarity to the corresponding prototype.
The data reported by Ng. et al. (1998), involves a series of centrifuge tests conducted
on a sandy soil. The retaining wall was subjected to a range of cyclic displacements
under a gravitational acceleration of 60𝑔. Fig. 3.1 shows the experimental setup of
the centrifuge model as given by Ng. et al. (1998).
Figure 3.1 The experimental setup of the centrifuge test (Ng. et al., 1998)
All dimensions in
mm unless stated
otherwise
220
Compu-
motor
Cam
LVDT
Gantry
Wooden blocks
235
95 X
Z
Dry silica sand
(Fraction E: 100/170)
9.9
Direction of
centrifuge
acceleration
60g
0.5mm latex
strip
100 12.1mm thick lead
shots (2.1mm dia.)
9.9
106
Top plates
80

Chapter three Numerical simulation of abutment wall experiencing cyclic movement
41
For the purpose of validation, the geometry, material properties and the applied loads
used in the finite element model are imposed identical to those prescribed in the
centrifuge tests. The scaling factors have been determined on account of the
centrifuge acceleration in order to produce identical self-weight stresses between the
centrifuge model and the prototype. It is worthwhile noting that the scaling factors
utilised in centrifuge modelling have been determined by considering the physical
system of the bridge abutment under cyclic loading as a function of six variables,
𝑓 = (𝜎, 𝜌, 𝑔, 𝑢, 𝑥, 𝑡 ) (3.1)
where, 𝜎, 𝜌, 𝑔, 𝑢, 𝑥, 𝑡 are stress, density, gravity, displacement, length and time
respectively. Since equation (3.1) involves three physical dimensions (length, mass
and time), then based on the Buckingham theorem of dimensional analysis, the
number of equivalent dimensionless variables in (3.1) is given by 𝑝 = 𝑚 − 𝑘 = 6 −
3 = 3 (m = number of physical variables and k = number of physical dimensions)
(Butterfield, 1999). In the geotechnical centrifuge model, the following three
dimensionless parameters have been invoked:
𝜋1 =𝜎
𝜌𝑔𝑢, 𝜋2 =
𝑢
𝑔𝑡2, 𝜋3 =
𝑢
𝑥 (3.2)
so that the system represented by equation (3.1) can now be written in terms of the
dimensionless parameters as,
𝑓 = (𝜋1, 𝜋2, 𝜋3) (3.3)
In order to achieve similarity between the centrifuge and prototype models, the
dimensionless parameters for both models have to be made equal, i.e.
𝜋1𝑚
𝜋1𝑝 = 1 ,
𝜋2𝑚
𝜋2𝑝 = 1 ,
𝜋3𝑚
𝜋3𝑝 = 1 (3.4)
where, 𝜋𝑚and 𝜋𝑝 refer to the dimensionless parameters in the centrifuge and the
prototype models respectively. In geotechnical testing, it is customary for the
centrifuge model to produce identical self-weight stresses as the prototype model, i.e.
𝜎𝑚 = 𝜎𝑝 to achieve the similarity. Moreover, as the properties of the soil used in the
centrifuge model are typically similar to those in the prototype, then 𝜌𝑚 = 𝜌𝑝.
Finally, the gravitational acceleration in the centrifuge is n times that of the
prototype, namely, 𝑔𝑚 = 𝑛 × 𝑔𝑝(where 𝑛 = 60 in this case). Using equation (3.4),

Chapter three Numerical simulation of abutment wall experiencing cyclic movement
42
the scaling factors between the centrifuge and the prototype models are then
established and summarised as shown in Table 3.1.
Table 3.1 Scaling Factors for the Centrifuge Model
Parameter Stress
(𝜎)
Density
(𝜌)
Gravity
(𝑔)
Time
(𝑡)
Dimension,
(𝑥)
Strain
(휀)
Cycles
(frequency),
(𝑓)
Scaling
factor 1 1 𝑛 1
𝑛⁄ 1𝑛⁄ 1 𝑛
As shown in Table 3.1, the dimensions of the centrifuge model are scaled downwards
from the dimensions of the prototype model by the gravity scaling factor while
importantly maintaining identical self-weight stresses as well as strains of the
prototype in the centrifuge model. Figure 3.2 shows the finite element mesh of the
prototype abutment and the soil backfill which have been modelled in this chapter
using FEM.
Fig. 3.2 Finite element mesh of the prototype abutment wall and soil backfill
3.2.2 Constitutive Models and Material Properties
Normally, temperature fluctuates at a relatively slow pace, especially the annual
fluctuations due to primary seasonal temperature changes. Accordingly, the
corresponding changes in the dimensions of the bridge will take place in a slow
pattern (i.e. at a very low frequency). Under these circumstances, the analysis can
reasonably be modelled using a constitutive model developed for quasi-static
34.9m
13.2m
10m
17m

Chapter three Numerical simulation of abutment wall experiencing cyclic movement
43
loading/unloading conditions rather than more specifically for cyclic loading.
Hence, the Mohr-Coulomb model was adopted to describe the inelastic behaviour of
the non-cohesive soil. The Mohr-Coulomb elasto-plastic model in ABAQUS (2013)
allows the material to harden and/or soften isotropically and uses a smooth flow
potential that has a hyperbolic shape in the meridional stress plane and a smooth
elliptic shape in the deviatroic stress plane.
The properties of the soil backfill modelled using the Mohr Coulomb model in the
finite element analysis were defined based on the corresponding values described in
the centrifuge test. The soil used in the centrifuge test is Leighton Buzzard silica
sand. Particle size was between 90 and 150 μm, which offers high model to particle
size ratio. Therefore, using the same soil material properties as the prototype model
will not have any significant effects on the numerical results (Ng. et al., 1998). Table
3.2 summarizes the soil properties as described by Ng et al. (1998).
Table 3.2 Properties of soil used in the finite element analysis
Material Density
t/m3
Elasticity
modulus
(E) kPa
Poisson’s
ratio
(μ)
Friction
angle
() °
Dilation
angle
(Ψ) °
Non-cohesive
soil
1.546 20 x 103 0.25 32 2
The concrete wall is modelled as an elastic material with a modulus of elasticity (E)
equal to 40 × 106 kPa and a Poisson’s ratio of 0.2. A high value for the elasticity
modulus of concrete is used to simulate a semi-rigid abutment wall that exhibits
extremely small amount of deformation during the cyclic movement.
3.2.3 Interaction Properties and Boundary Conditions
The interface behaviour of the soil-concrete abutment was modelled using a standard
surface-to-surface contact with finite sliding. The interaction was activated during
the initial step of the analysis. The mechanical frictional behaviour at the interface
surfaces was expressed as a tangential friction while the normal behaviour at the
interface between the soil and concrete was simulated as a “hard contact” where no
separation or penetration is permitted between the two surfaces. In order to avoid any
possible separation at the interface between the base of the concrete wall and the soil,
tie constraints were provided along the baseline of the abutment wall.

Chapter three Numerical simulation of abutment wall experiencing cyclic movement
44
The boundary restraints of the model were defined in the initial step to establish a
global equilibrium in the model. The horizontal and vertical movements were
restrained along the bottom edge of the model (𝑢1 = 𝑢2 = 0), while the vertical
edges on both sides were restrained against the horizontal movement only (𝑢1 = 0).
The initial stresses are taken into account in the analysis and introduced as gravity
loads throughout the model, in the initial step of the analysis. A plane strain
eight-node quadratic element with reduced integration (CPE8R) was used for
concrete and soil in the FE model simulating a central section of a wide abutment
wall.
3.3 Discussion of Model Verification and Results
The present chapter involves a series of modelling cases to satisfy the verification of
the FE modelling and to investigate the influence of different parameters on the
behaviour of the approach soil in response to the abutment movements.
3.3.1 Lateral Earth Pressures
In order to perform a validation of the FE model, identical loading conditions to
those prescribed in the centrifuge test, in terms of the applied displacements and the
number of cycles, have been simulated. Ng. et al. (1998) presented selected
measured and calculated results for the lateral earth pressure coefficient K at depths
of 2m and 4m (measured from top of the wall) as a result of 10 cycles of ±6mm and
±12mm perturbations. K is defined as the ratio of horizontal pressure acting at a
certain point on the wall to the vertical effective stress at the same point. Table 3
shows typical results presented by Ng et al. (1998) and the finite element modelling
results from Ng et al. (1998) own FE model and the present ABAQUS FE model.
The results in Table 3.3 show a good agreement between the finite element
modelling from this study and the centrifuge test results.
The dependency of the measured lateral earth pressure with the number of
perturbation cycles at different perturbation amplitudes, from the same centrifuge
model were also reported by Ng. et al. (1998). The centrifuge results showed an
increase in the value of lateral earth pressure coefficient (K) during the first 15 to 20
cycles then asymptotes or increases at a decreasing rate during the successive cycles.

Chapter three Numerical simulation of abutment wall experiencing cyclic movement
45
Table 3.3 Comparison of lateral pressure coefficient (K)
10 cycles, ±6mm perturbation
Depth from soil
surface
K measured
(Ng et al., 1998)
K, FE model
(Ng et al., 1998)
K, FE model
(this study)
2m 0.9 1.3 0.8
4m 0.7 1 0.51
10 cycles, ±12mm perturbation
2m 1.1 1.8 1.2
4m 0.8 1.3 0.736
Using the ABAQUS (2013) finite element model, the lateral earth pressure responses
were computed under the same loading conditions. The modelling results show a
reasonably similar behaviour at different perturbation magnitudes. A rapid increase
in the values of lateral pressure coefficient K is observed within the first few cycles
followed by a plateau region within which K increases slightly. However such
behaviour is dependent on the displacement amplitude, where the increase in K value
is more apparent in large amplitudes (±30mm) compared to smaller ones (±6mm).
The behaviour of lateral pressures has also been compared to selected theoretical
models to assess the efficiency of the present FE model. Figure 3.3 illustrates the
relationship between the number of cycles and the coefficient of lateral pressure K as
given by the experimental results, the ABAQUS modelling and other theoretical
models (Broms and Ingelson, 1971; England and Tsang, 2001; UK BA42/96, 2003)
at different perturbations and number of cycles.
It can be noticed, from Figure 3.3, that the modelling results are generally close to
the centrifuge test results at different perturbation (displacement) amplitudes. In
contrast with the classical earth pressure models, the ABAQUS FE model accounts
for the number of movement cycles of the wall and the subsequent increase in lateral
pressures. On the other hand the earth pressure models varied widely in describing
the lateral pressures. Rankine and Broms and Ingelson (1971) are apparently so
conservative specially at small displacement amplitudes (6 to 12 mm). The UK
BA42/96 (2003) and England and Tsang (2001) are found to better predict the lateral
pressures at small movements, however, they underestimate the pressures at large
wall movements (30mm).

Chapter three Numerical simulation of abutment wall experiencing cyclic movement
46
Figure 3.3(a)
Figure 3.3 (b)
0
0.5
1
1.5
2
2.5
3
3.5
4
4.5
5
0 10 20 30 40 50
(K)
at 2
m d
epth
Number of cycles
K (measured at 6mm) K (model at 6mm)
UK BA42/96 Rankine, Broms and Ingelson
England and Tsang
0
0.5
1
1.5
2
2.5
3
3.5
4
4.5
5
0 5 10 15 20 25 30 35 40 45 50
(K)
at 2
m d
epth
Number of cycles
K (measured at 12mm) K (model at 12mm)
UK BA42/96 Rankine, Broms and Ingelson
England and Tsang

Chapter three Numerical simulation of abutment wall experiencing cyclic movement
47
Figure 3.3 (c)
Figure 3.3 FEM results (this study) test results of Ng. et al (1998) and other
theoretical models for the lateral pressure coefficient K at (a) ±6mm perturbation, (b)
±12mm perturbation and (c) ±30mm perturbation
The distribution of lateral pressures acting along the height of the wall has been
computed by the ABAQUS FE model. Figure 3.4 illustrates the lateral pressure
distributions at different displacement amplitudes. It is evident that lateral pressures
at 2m depth from the soil surface increases significantly with the displacement
amplitude to record maximum pressure at ±30mm. This behaviour agrees with the
findings of other researchers, where maximum lateral pressures are usually recorded
at the upper half or in particular at H/3 from top of the wall (Ng. et al.,1998; Lehane,
2003), whereas H refers to the wall height.
0
0.5
1
1.5
2
2.5
3
3.5
4
4.5
5
0 5 10 15 20 25 30 35 40 45 50
(K)
at 2
m d
epth
Number of cycles
K (measured at 30mm) K (model at 30mm)
UK BA42/96 Rankine, Broms and Ingelson
England and Tsang

Chapter three Numerical simulation of abutment wall experiencing cyclic movement
48
Figure 3.4 Modelling results for the lateral pressure distribution after 10 cycles
3.3.2 Soil Settlement
Modelling results for the settlement of the approach soil due to the cyclic movements
of the abutment were also produced by the FE model. As the quantitative settlement
results reported by Ng. et al (1998) were limited, the FE results have been
qualitatively verified against the corresponding centrifuge data. According to
Ng. et al. (1998), the soil deformation in loose fill is a gradual settlement starting
with maximum value at the interface between the soil and the abutment, and
decreasing gradually away from the wall. Similar settlement profile was observed in
the FE modelling results after applying 10 cycles of ±30 mm perturbation (the ±30
mm was described by Ng et al. (1998) as the annual perturbation). Figure 3.5 below
illustrates the deformed model with the soil settlement contours.
The profile of the settlement trough after 10 cycles of ±30mm is shown in Figure 3.6.
It indicates that the soil surface settlement starts from a distance of 2m to 3m from
0
1
2
3
4
5
6
0 20 40 60 80
Dep
th f
rom
to
p o
f w
all
(m)
Lateral Pressure (kPa)
+/-30mm
+/-12mm
+/-6mm

Chapter three Numerical simulation of abutment wall experiencing cyclic movement
49
-0.01
0
0.01
0.02
0.03
0.04
0.05
00.511.522.533.54
Set
tlem
ent
(m)
Distance from wall (m)
the wall and increases until it reaches its maximum value of almost 0.05m at the
wall-soil interface.
Figure 3.6 Soil surface profile after 10 cycles of ±30mm perturbations
Ng et al. (1998) described the magnitude of settlement in the backfill due to
temperature variation as a function of the wall displacement (perturbation amplitude)
and the number of cycles. Settlement increases as the number of cycles and
amplitude of the perturbation increase. Similar settlement behaviour was also
observed in the finite element results for different wall perturbations and number of
cycles
The relationship between the magnitude of maximum vertical settlement (𝑢2) and the
number of cycles at different perturbations is summarized in Figure 3.7. The results
Settlement zone
Settlement trough
Figure 3.5 The deformed FE model
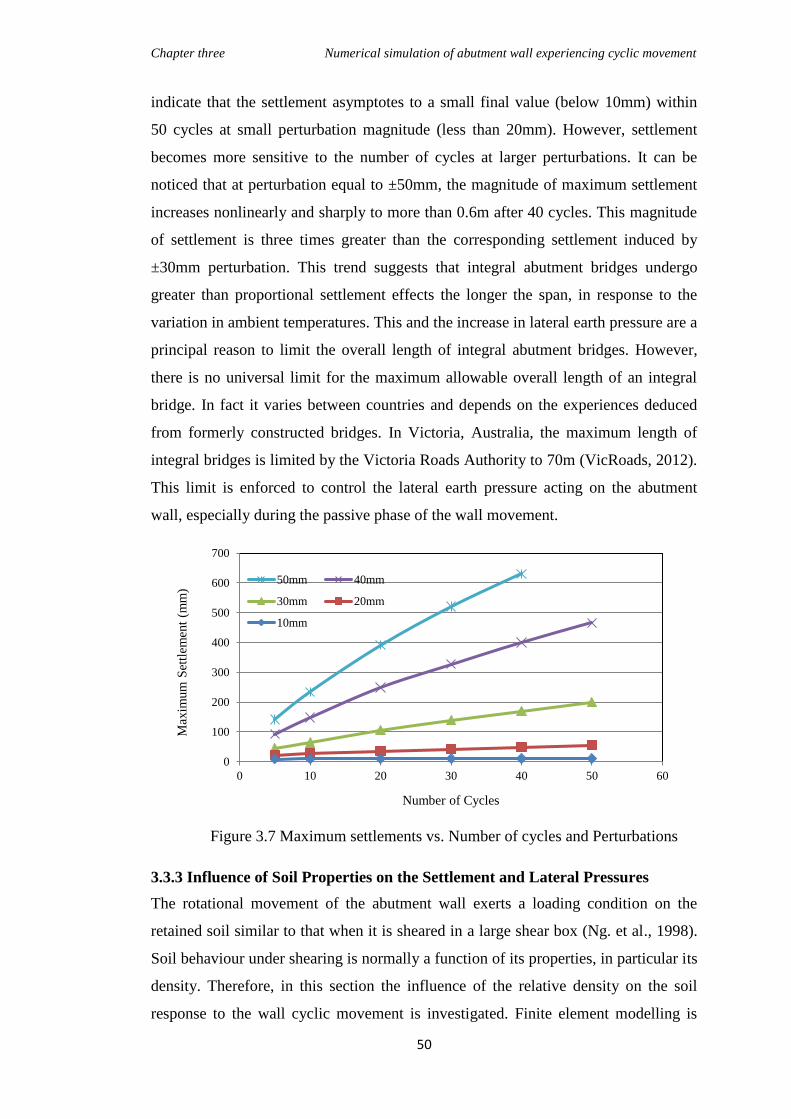
Chapter three Numerical simulation of abutment wall experiencing cyclic movement
50
indicate that the settlement asymptotes to a small final value (below 10mm) within
50 cycles at small perturbation magnitude (less than 20mm). However, settlement
becomes more sensitive to the number of cycles at larger perturbations. It can be
noticed that at perturbation equal to ±50mm, the magnitude of maximum settlement
increases nonlinearly and sharply to more than 0.6m after 40 cycles. This magnitude
of settlement is three times greater than the corresponding settlement induced by
±30mm perturbation. This trend suggests that integral abutment bridges undergo
greater than proportional settlement effects the longer the span, in response to the
variation in ambient temperatures. This and the increase in lateral earth pressure are a
principal reason to limit the overall length of integral abutment bridges. However,
there is no universal limit for the maximum allowable overall length of an integral
bridge. In fact it varies between countries and depends on the experiences deduced
from formerly constructed bridges. In Victoria, Australia, the maximum length of
integral bridges is limited by the Victoria Roads Authority to 70m (VicRoads, 2012).
This limit is enforced to control the lateral earth pressure acting on the abutment
wall, especially during the passive phase of the wall movement.
Figure 3.7 Maximum settlements vs. Number of cycles and Perturbations
3.3.3 Influence of Soil Properties on the Settlement and Lateral Pressures
The rotational movement of the abutment wall exerts a loading condition on the
retained soil similar to that when it is sheared in a large shear box (Ng. et al., 1998).
Soil behaviour under shearing is normally a function of its properties, in particular its
density. Therefore, in this section the influence of the relative density on the soil
response to the wall cyclic movement is investigated. Finite element modelling is
0
100
200
300
400
500
600
700
0 10 20 30 40 50 60
Max
imum
Set
tlem
ent
(mm
)
Number of Cycles
50mm 40mm
30mm 20mm
10mm
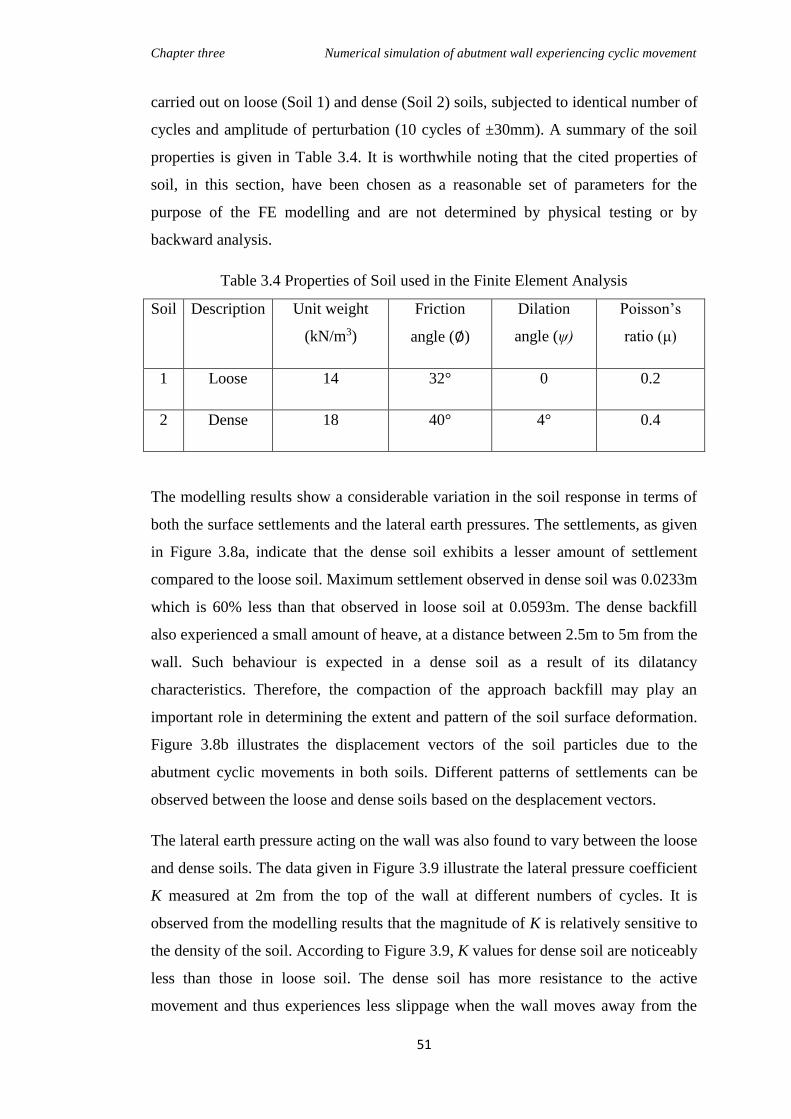
Chapter three Numerical simulation of abutment wall experiencing cyclic movement
51
carried out on loose (Soil 1) and dense (Soil 2) soils, subjected to identical number of
cycles and amplitude of perturbation (10 cycles of ±30mm). A summary of the soil
properties is given in Table 3.4. It is worthwhile noting that the cited properties of
soil, in this section, have been chosen as a reasonable set of parameters for the
purpose of the FE modelling and are not determined by physical testing or by
backward analysis.
Table 3.4 Properties of Soil used in the Finite Element Analysis
Soil Description Unit weight
(kN/m3)
Friction
angle (∅)
Dilation
angle (ψ)
Poisson’s
ratio (μ)
1 Loose 14 32° 0 0.2
2 Dense 18 40° 4° 0.4
The modelling results show a considerable variation in the soil response in terms of
both the surface settlements and the lateral earth pressures. The settlements, as given
in Figure 3.8a, indicate that the dense soil exhibits a lesser amount of settlement
compared to the loose soil. Maximum settlement observed in dense soil was 0.0233m
which is 60% less than that observed in loose soil at 0.0593m. The dense backfill
also experienced a small amount of heave, at a distance between 2.5m to 5m from the
wall. Such behaviour is expected in a dense soil as a result of its dilatancy
characteristics. Therefore, the compaction of the approach backfill may play an
important role in determining the extent and pattern of the soil surface deformation.
Figure 3.8b illustrates the displacement vectors of the soil particles due to the
abutment cyclic movements in both soils. Different patterns of settlements can be
observed between the loose and dense soils based on the desplacement vectors.
The lateral earth pressure acting on the wall was also found to vary between the loose
and dense soils. The data given in Figure 3.9 illustrate the lateral pressure coefficient
K measured at 2m from the top of the wall at different numbers of cycles. It is
observed from the modelling results that the magnitude of K is relatively sensitive to
the density of the soil. According to Figure 3.9, K values for dense soil are noticeably
less than those in loose soil. The dense soil has more resistance to the active
movement and thus experiences less slippage when the wall moves away from the

Chapter three Numerical simulation of abutment wall experiencing cyclic movement
52
backfill during the active phase of the cycle. On the other hand, loose soil, which
possesses less shear resistance, slumps more easily during wall active movement.
This creates a soil wedge and, after successive cycles of movement, leads to a
progressive increase in lateral earth pressure.
Figure 3.8a Soils 1&2 Surface Profile after 10 cycles of ±30mm wall displacement
Loose soil Dense soil
Figure 3.8b Displacement vectors of soils particles
Figure 3.9 Lateral Earth Pressure Coefficient K, for Dense and Loose Soils
-0.01
0
0.01
0.02
0.03
0.04
0.05
0.06
0.07
0 1 2 3 4 5 6 7 8
sett
lem
ent
(m)
Distance from wall (m)
Loose
Dense
0
0.5
1
1.5
2
2.5
3
0 10 20 30 40 50 60
Lat
eral
ear
th p
ress
ure
co
effi
cien
t, K
Number of cycles
Loose soil
Dense

Chapter three Numerical simulation of abutment wall experiencing cyclic movement
53
3.3.4 Influence of Daily and Annual Temperature Variation
The expansion and contraction cycles of bridge deck due to diurnal and seasonal
temperature fluctuations normally occur concurrently. In order to capture the effects
of both temperature variations on the IABs, a cyclic perturbation pattern was
developed to represent the combined daily and annual temperature fluctuations as
shown in Figure 3.10. This pattern is used in the finite element model to define the
wall movement amplitude. Two separate scenarios were examined using the same
model of the loose soil in Table 3.4 above to evaluate the combined effects of
daily/annual temperature fluctuations. In the first scenario, only a single cycle of
±40mm perturbations (reflecting annual temperature fluctuations) was applied, while
in the second scenario, 365 cycles of ±6mm (daily temperature fluctuations) were
applied within one complete cycle of ±40mm (annual temperature fluctuations).
One annual cycle
Figure 3.10 Superimposed temperature fluctuation pattern
The modelling results obtained from the two scenarios showed only a slight
difference in the soil settlement, but a more significant impact on the lateral earth
pressure coefficient (K) was observed as illustrated in Table 3.5.
-0.06
-0.04
-0.02
0
0.02
0.04
0.06
0 50 100 150 200 250 300 350 400
Purt
urb
atio
n (
mm
)
Cycle time (day)
One daily cycle

Chapter three Numerical simulation of abutment wall experiencing cyclic movement
54
Table 3.5 Maximum settlement and lateral pressure coefficient for (A) Annual
temperature only and (B) combined annual and diurnal temperature fluctuations
Amplitude Maximum
settlement [m]
Lateral pressure
coefficient (K) at 0.3H*
Single cycle of ±40mm 0.085 2.85
365 cycles of ±6mm superimposed
with a single cycle of ±40mm
0.093 3.53
*H refers to the total height of the concrete abutment
The data given in Table 3.5 indicate that the value of lateral pressure coefficient (K)
increased by approximately 24% when daily/annual temperature variations are
combined, relative to the single cycle with only annual temperature variations. These
effects increase with respect to the range of daily temperature variations. For
instance, during summer seasons the temperature varies widely in Australia between
day and night, which results in greater daily perturbation and consequently larger
impact on lateral earth pressure. Hence, considering only the cyclic movements of
IAB abutments under a single effect of either daily or annual temperature
fluctuations may underestimate the value of lateral earth pressure and consequently
may result in improper designs. It is suggested that the combined “daily–annual”
temperature variation effects should be taken into account during the investigation of
abutment movements.
3.4 Summary
A finite element model has been developed using the ABAQUS/Standard to simulate
a centrifuge test in which an abutment wall is experiencing cyclic movements. The
modelling results including the lateral earth pressures acting on the wall and the
settlements in the soil adjacent to the wall have been compared with centrifuge test
results and found to agree well with the measured data. The modelling results
indicate the presence of stress ratcheting effects after applying number of movement
cycles of relatively large displacement. Excessive settlement has also been observed
by the modelling results in response to the wall movement.
The FE model was used to perform a parametric study in which the effects of soil
properties and the type of cyclic movements have been investigated. It has been

Chapter three Numerical simulation of abutment wall experiencing cyclic movement
55
found that dense soils tend to exhibit less settlements and racheting effects compared
to loose soil. On the other hand, estimating the effects of wall movements based on
only the annual temperature changes largely underestimates the values of lateral
earth pressures. Therefore, the superimposed daily-annual temperature changes
should be taken into account when the cyclic movement in IABs is studied.

56
Chapter Four
Small Wall Physical Model
4.1 Introduction
Physical models of abutment walls under the influence of normal gravity have been
used in the past to investigate the soil–structure interaction mechanism in integral
abutment bridges (England, 2000; Cosgrove and Lehane, 2003; Tatsuoka et al.,
2009). Important data have been obtained with regard to various issues in IABs using
physical modelling. In this chapter, the results and findings of an experimental
program undertaken in this thesis for a small retaining wall will be discussed in
detail. These experiments are intended to fulfil two primary objectives as outlined
below:
Provide an insight into the soil-wall interaction behaviour under different
modes of wall movements. This will particularly involve the development of
lateral earth pressures exerted on the wall and the settlement in the soil
surface.
Investigate the effectiveness of using the expanded polystyrene geofoam
(EPS), as a compressible inclusion, in attenuating the wall movement effects
on the adjacent retained soil.
The physical test setup involves a small wall retaining loose sand at one side and
subjected to cyclic movements as would be expected to occur in an abutment of an
integral bridge. However, it is worthwhile noting that the physical model discussed
in this chapter is not intended to represent a down-scaled model of a large prototype.
Also the stress levels in this model are not expected to replicate those developed in a
wall with prototype dimensions. However, the current physical model is intended to
investigate the overall trend of the wall-soil interaction behaviour under certain
conditions, which is likely independent of the dimensions of the physical model.

Chapter four Small wall physical model
57
4.2 The Test Program
The experimental program involves five tests varying two principal parameters as
follows:
4.2.1 The Mode of Wall Movement
According to Ng. et al. (1998), the movement occurring in the abutment in an
integral bridge, as a result of the temperature changes, is a combination of two
different modes of movements, rotation and translation. This means the abutment
will translate and rotate at the same time as a result of deck expansion and/or
contraction. The reported field data showed that the rotation and translation
movements are usually unequal and the domination of either mode is dependent on
various factors including the type and height of the abutment and the properties of
backfill (Huntly and Valsangkar, 2009). Generally, short abutments tend to translate
more compared to deep embedded abutment walls where the dominant movement
mode is rotation.
The mode of movement, translation or rotation, has a considerable impact on the
magnitude and distribution of the lateral earth pressures acting on the abutment.
(Huntly and Valsangkar, 2013). It also affects the extent and depth of the potential
soil settlement in the approach soil which consequently influence the relevant design
criterion of the run-on slab. Therefore, investigating the variations imposed by the
mode of abutment movement will broaden the existing knowledge about the
approach issues in IABs and their possible remedies.
However a rigorous analysis that quantifies such effects in IABs is unavailable;
therefore, in the present experimental program two modes of wall movements will be
examined as follows,
Translation: in this test, the small wall experiences an absolute translational
movement toward and away from the soil as shown in Figure 4.1.a. The
moving force is applied at the centre of the wall.
Rotation: in this test, the wall is hinged at its bottom end so that it can only
rotate without any translation. The moving force in this case is applied at the
top end of the wall as shown in Figure 4.1.b.
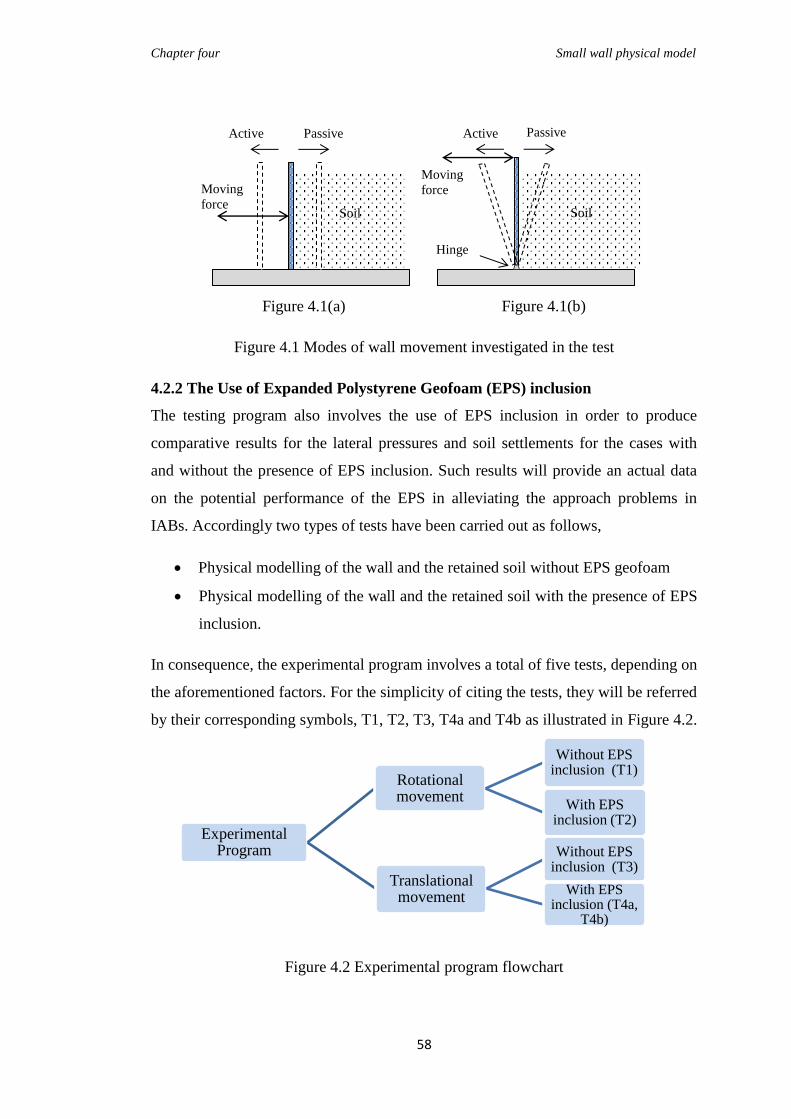
Chapter four Small wall physical model
58
Figure 4.1(a) Figure 4.1(b)
Figure 4.1 Modes of wall movement investigated in the test
4.2.2 The Use of Expanded Polystyrene Geofoam (EPS) inclusion
The testing program also involves the use of EPS inclusion in order to produce
comparative results for the lateral pressures and soil settlements for the cases with
and without the presence of EPS inclusion. Such results will provide an actual data
on the potential performance of the EPS in alleviating the approach problems in
IABs. Accordingly two types of tests have been carried out as follows,
Physical modelling of the wall and the retained soil without EPS geofoam
Physical modelling of the wall and the retained soil with the presence of EPS
inclusion.
In consequence, the experimental program involves a total of five tests, depending on
the aforementioned factors. For the simplicity of citing the tests, they will be referred
by their corresponding symbols, T1, T2, T3, T4a and T4b as illustrated in Figure 4.2.
Figure 4.2 Experimental program flowchart
Experimental Program
Rotational movement
Without EPS inclusion (T1)
With EPS inclusion (T2)
Translational movement
Without EPS inclusion (T3)
With EPS inclusion (T4a,
T4b)
Active Passive
Moving
force Soil
Hinge
Active Passive
Moving
force
Soil

Chapter four Small wall physical model
59
4.3 The Experimental Setup
The tests have been conducted in the Geotechnical Laboratory in Western Sydney
University. The testing chamber and the frame, shown in Figure 4.3, were formerly
constructed by the university to be used in geotechnical tests of retaining structures.
The chamber is 0.7m long, 0.3 height and 0.25m wide with 50mm thick clear acrylic
panel forming its face. The wall is represented by 300mm height, 248mm wide and
13mm thick steel plate placed inside the chamber. Two ways of fixation for the wall
were used depending on the mode of movement.
During the horizontal translation tests, two movable supporting bars were
horizontally attached to the rear side of the wall at 50mm and 250mm from the
bottom. The bars were intended to hold the wall and prevent any rotational
movement during wall translation. The wall was freely sitting on the bottom panel of
the chamber.
In the other tests, where the wall movement is rotational, the wall was fixed with a
hinge at its bottom so that it rotates freely without any possible translation. No
supporting bars are used in this mode of movement.
In each test, the wall sides were properly lubricated to minimize the friction between
the wall and the chamber. “L shaped” clear plastic sheets were placed at the corners
around the wall to prevent any soil leakage during wall movement which may affect
the settlements.
Figure 4.3 The experimental setup (for horizontally-displaced wall)
Data Logging
System
Soil
Steel wall
Supporting
bars
Movement bar
Pressure cell
Computer
LVDT

Chapter four Small wall physical model
60
A, BestTech, pressure cell of 50mm diameter and 11.3mm thickness was used to
measure the lateral pressures during the tests. The cell was initially calibrated at low
pressures using a 1m high column of water. The cell has a precision of 0.367kPa. It
was mounted at the front face of the wall at a height equal to 2H/3 from the top of the
soil surface (H refers to the retained height of the soil). Taking into account the
dimensions of the model, this location was selected to achieve some lateral pressure
as the latter can be very small at the upper part of the wall.
A linear variable differential transformer, LVDT, fixed to the chamber frame is used
to measure the horizontal movement of the wall. The readings of the pressure cell
and the LVDT were recorded throughout the tests using a data logger. An in-house
customized software was developed to store and analyse the data on a desktop
computer connected to the data logger.
The moving force was applied during the test through a rotating shaft at the rear side
of the wall. The shaft has fine (1mm) threads to allow for a smooth and slow
horizontal movement. Equal horizontal displacement of 2mm (at the soil surface
level) has been utilized in all tests. This magnitude represents a comparative value to
a typical annual displacement amplitude in the actual bridge dimensions (±30mm).
The cycle of movement utilized in all tests begins with passive displacement of 2mm
against the soil followed by 4mm reversed displacement so that the wall experience
2mm active movement. Eventually the wall is moved passively 2mm to return to its
initial position. The combination of wall movements, toward passive, active and back
to its original position is interpreted as one single cycle.
4.4 Properties of Materials
4.4.1 Soil
The soil used in the tests is dry siliceous sand supplied from a local dealer in Sydney-
Australia. A standard sieve analysis was conducted to identify the particle size
distrbution of the sand. The sieving results showed that the sand is quite unifrom
with a particle size ranging between 150-300𝜇𝑚. The test was aimed to utilize a
loose soil in order to provide an upper-bound figures of the settlements for given
loading cycles. Therefore the sand has been placed loosely in the testing chamber
without compaction. The height of the soil, in all tests, was 240mm.

Chapter four Small wall physical model
61
After placing the soil, the top surface was gently levelled to achieve the required
height of soil. The unit weight of soil has been calculated at each test based on the
total weight of soil used and the occupied volume. Soil unit weight was ranging
between 14.33kN/m3 and 14.9kN/m3.
4.4.2 EPS Geofoam
The EPS geofoam utilized in the test has been cut using a hot wire from a large block
of EPS supplied by a local manufacturer with a density of EPS 20kg/m3. A wedge-
shaped EPS inclusion was used in test T2 in which the angle 𝜃 between the
horizontal surface and the interface planar between the EPS and the soil was
approximately 50°. The inclusion, as shown in Figure 4.4, is formed of three pieces
of EPS with dimensions of 50mmx80mmx248mm, 100mmx80mm, 248mm and
150mmx80mmx248mm
Figure 4.4 Test setup with the EPS inclusion (for hinged wall)
In test T4, two arrangements of EPS were used including single-block and wedge-
shaped inclusions.
4.5 Tests Results and Discussion
4.5.1 Hinged Wall Tests
The hinged wall tests are meant to investigate the effects of wall movement on the
adjacent soil when the mode of movement is an absolute rotation. This test involves
two variations, as discussed below,
Soil
EPS 80mm
80mm
80mm
50mm
100mm
150mm
Steel wall Hinge support
θ
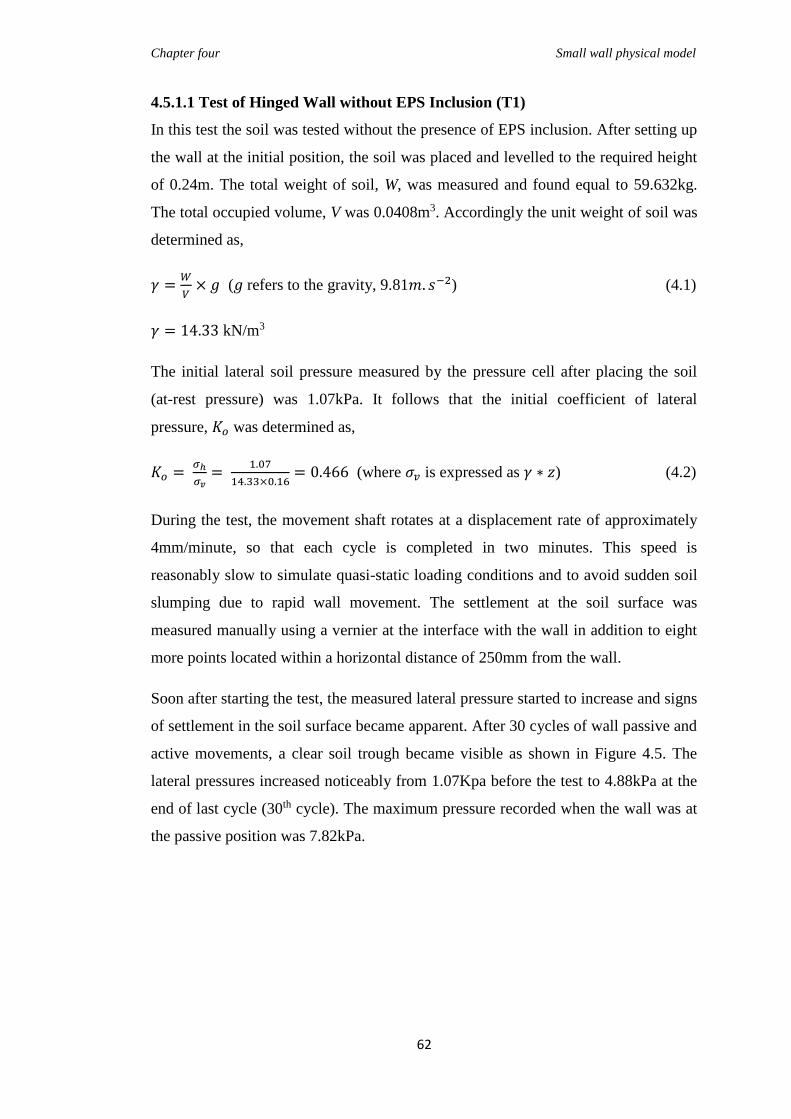
Chapter four Small wall physical model
62
4.5.1.1 Test of Hinged Wall without EPS Inclusion (T1)
In this test the soil was tested without the presence of EPS inclusion. After setting up
the wall at the initial position, the soil was placed and levelled to the required height
of 0.24m. The total weight of soil, W, was measured and found equal to 59.632kg.
The total occupied volume, V was 0.0408m3. Accordingly the unit weight of soil was
determined as,
𝛾 =𝑊
𝑉× 𝑔 (𝑔 refers to the gravity, 9.81𝑚. 𝑠−2) (4.1)
𝛾 = 14.33 kN/m3
The initial lateral soil pressure measured by the pressure cell after placing the soil
(at-rest pressure) was 1.07kPa. It follows that the initial coefficient of lateral
pressure, 𝐾𝑜 was determined as,
𝐾𝑜 = 𝜎ℎ
𝜎𝑣=
1.07
14.33×0.16= 0.466 (where 𝜎𝑣 is expressed as 𝛾 ∗ 𝑧) (4.2)
During the test, the movement shaft rotates at a displacement rate of approximately
4mm/minute, so that each cycle is completed in two minutes. This speed is
reasonably slow to simulate quasi-static loading conditions and to avoid sudden soil
slumping due to rapid wall movement. The settlement at the soil surface was
measured manually using a vernier at the interface with the wall in addition to eight
more points located within a horizontal distance of 250mm from the wall.
Soon after starting the test, the measured lateral pressure started to increase and signs
of settlement in the soil surface became apparent. After 30 cycles of wall passive and
active movements, a clear soil trough became visible as shown in Figure 4.5. The
lateral pressures increased noticeably from 1.07Kpa before the test to 4.88kPa at the
end of last cycle (30th cycle). The maximum pressure recorded when the wall was at
the passive position was 7.82kPa.
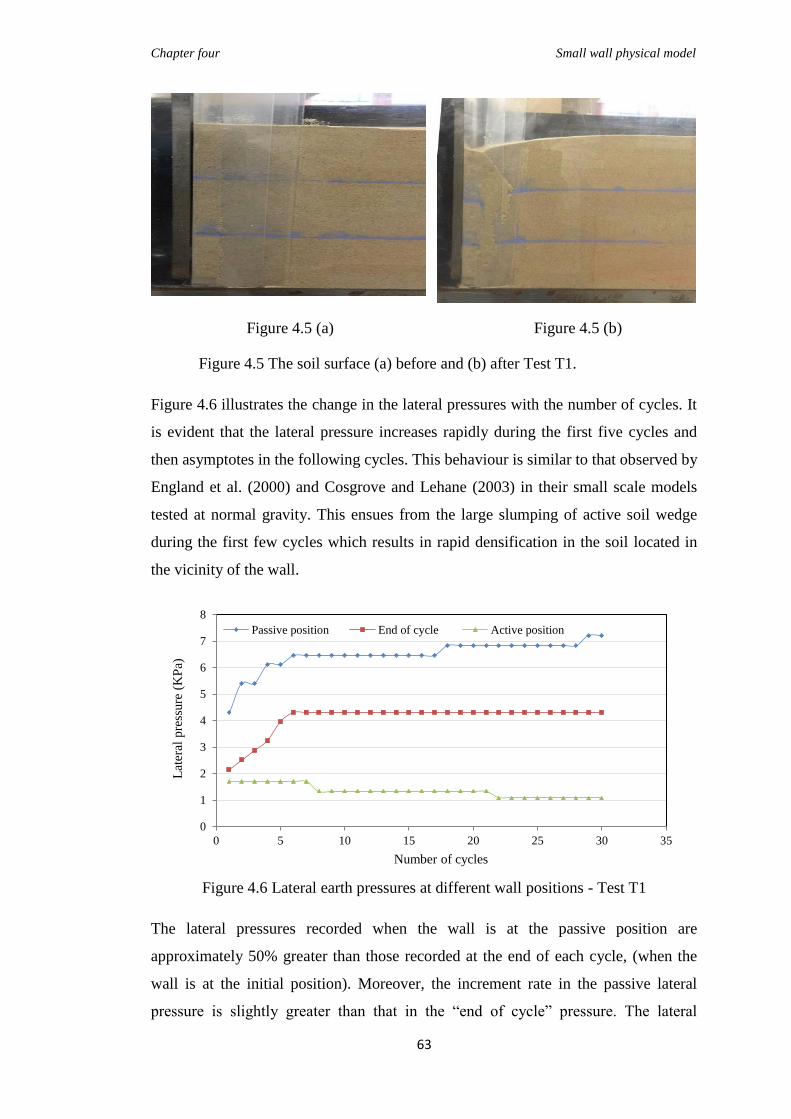
Chapter four Small wall physical model
63
Figure 4.5 (a) Figure 4.5 (b)
Figure 4.5 The soil surface (a) before and (b) after Test T1.
Figure 4.6 illustrates the change in the lateral pressures with the number of cycles. It
is evident that the lateral pressure increases rapidly during the first five cycles and
then asymptotes in the following cycles. This behaviour is similar to that observed by
England et al. (2000) and Cosgrove and Lehane (2003) in their small scale models
tested at normal gravity. This ensues from the large slumping of active soil wedge
during the first few cycles which results in rapid densification in the soil located in
the vicinity of the wall.
Figure 4.6 Lateral earth pressures at different wall positions - Test T1
The lateral pressures recorded when the wall is at the passive position are
approximately 50% greater than those recorded at the end of each cycle, (when the
wall is at the initial position). Moreover, the increment rate in the passive lateral
pressure is slightly greater than that in the “end of cycle” pressure. The lateral
0
1
2
3
4
5
6
7
8
0 5 10 15 20 25 30 35
Lat
eral
pre
ssure
(K
Pa)
Number of cycles
Passive position End of cycle Active position

Chapter four Small wall physical model
64
pressures during wall active movement are seemed to be constant and insensitive to
the number of cycles.
The lateral pressure envelope is presented in Figure 4.7 (a), where the pressures are
plotted against the lateral displacement. It can be noticed that the pressure varies
rapidly when the wall travels between the active and passive positions, which
indicates the loading and unloading cycles in the adjacent soil.
Figure 4.7 (a)
Similar behaviour is also observed for the change in lateral pressure coefficient K
during the test. Figure 4.7 (b) illustrates the relationship between the measured
values of K at different wall positions with the number of cycles.
.
Figure 4.7 (b)
Figure 4.7 (a) Lateral pressure envelope during wall movements - Test T1
& Figure 4.7 (b) relationship between K and number of movement cycles - Test T1
0
1.5
3
4.5
6
7.5
9
-3 -2 -1 0 1 2 3
Lat
eral
Pre
ssure
(kP
a)
Horizontal displacement (mm)
0
0.5
1
1.5
2
2.5
3
3.5
0 5 10 15 20 25 30 35
Co
effi
cien
t o
f la
tera
l p
ress
ure
, K
Number of Cycles
K - end of cycle K - active
K- passive
Loading
Unloading

Chapter four Small wall physical model
65
The settlement results show that the maximum soil settlement occurs at the interface
between the wall and the soil. The value of maximum settlement increased non-
linearly with number of cycles. Figure 4.8 summarizes the relationship between the
maximum settlement and the number of cycles at different wall positions. Unlike the
lateral pressures, maximum settlement results were not showing a limiting value after
30 cycles. Also the settlements exhibit limited dependency to the wall position
(active or passive). However, the highest settlement values were always recorded
when the wall was at its active position.
Figure 4.8 Maximum settlements at different wall positions - Test T1
At the end of the test, the maximum measured settlement was equal to approximately
0.1H. The extent of the soil trough was equal to approximately 250mm from the wall
which slightly exceeds the retained height of the soil, H. These results are
qualitatively close to those obtained by Cosgrove and Lehane (2003) after testing
loose sand undergoing a cyclic displacement by the retaining wall.
In order to represent the extent of settlement effects at the soil surface, the
settlements at different distances from the wall were plotted against the number of
cycles as shown in Figure 4.9. As would be expected, maximum settlement is
observed at the wall-soil interface, and then decreased to an asymptote at
approximately 250mm from the wall.
-5
0
5
10
15
20
25
30
0 5 10 15 20 25 30
Max
imum
set
tlem
ent
(mm
)
Number of Cycles
Active position
End of cycle
Passive position

Chapter four Small wall physical model
66
Figure 4.9 Settlement results at different distances from the wall - Test T1
The profile of the soil has been represented to show the stages of settlement during
the test, as shown in Figure 4.10. The deformed soil shows a steady settlement
increase gradually towards the wall. This pattern represents typical settlement
behaviour in a loose soil (Ng. et al., 1998).
Figure 4.10 The settled soil profile at different cycles - Test T1
4.5.1.2 Test of Hinged Wall with EPS Inclusion (T2)
In this test an EPS inclusion has been placed at the interface between the soil and the
wall. The soil was placed and levelled to a nominal height of 240mm. The unit
weight of soil was determined based on the total weight and the occupied volume as
in T1. The unit weight of soil in this test was 14.27kN/m3
This test involved the application of 30 (passive / active) cycles of 2mm horizontal
displacement at the level of soil surface. Lateral pressure and the settlement results
0
5
10
15
20
25
30
0 5 10 15 20 25 30 35
Set
tlem
ent
(mm
)
Number of cycles
At zero distance from wall
At 50mm from wall
At 100mm from wall
At 180mm from wall
At 250mm from wall
0
5
10
15
20
25
30
0 5 10 15 20 25
Set
tlem
ent
(mm
)
Distance from wall (cm)
after 5 cycles after 10 cycles
after 20 cycles after 30 cycles
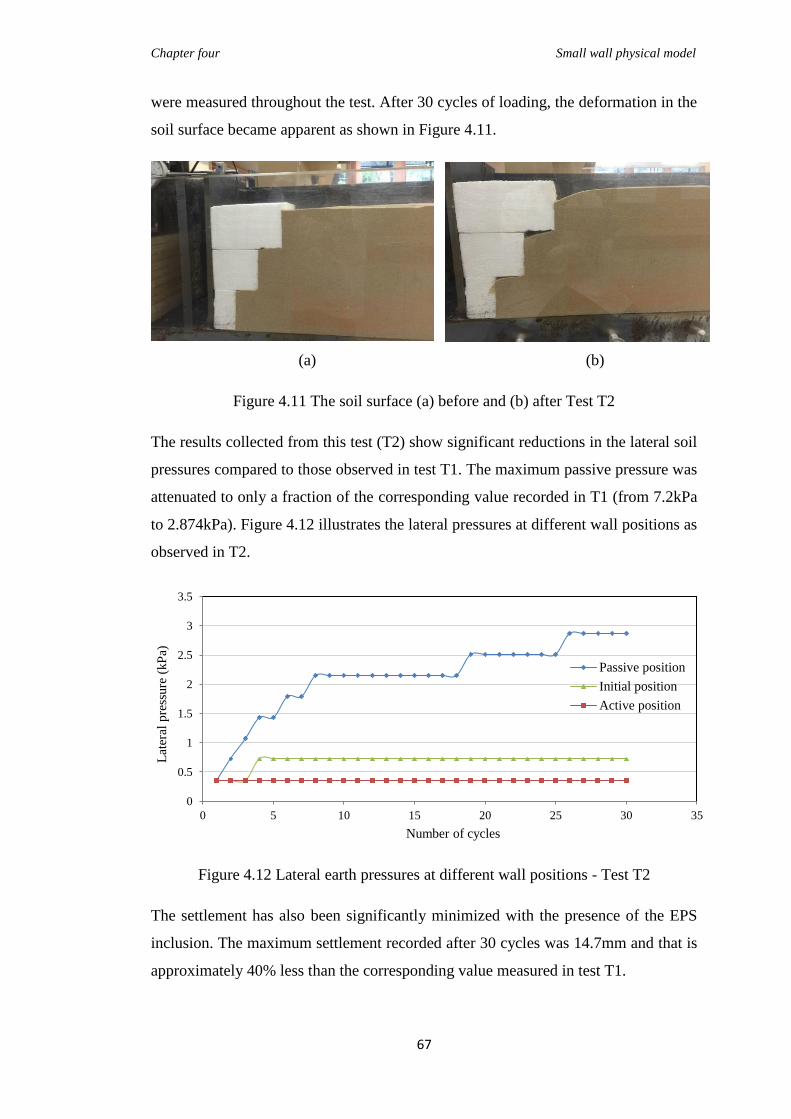
Chapter four Small wall physical model
67
were measured throughout the test. After 30 cycles of loading, the deformation in the
soil surface became apparent as shown in Figure 4.11.
(a) (b)
Figure 4.11 The soil surface (a) before and (b) after Test T2
The results collected from this test (T2) show significant reductions in the lateral soil
pressures compared to those observed in test T1. The maximum passive pressure was
attenuated to only a fraction of the corresponding value recorded in T1 (from 7.2kPa
to 2.874kPa). Figure 4.12 illustrates the lateral pressures at different wall positions as
observed in T2.
Figure 4.12 Lateral earth pressures at different wall positions - Test T2
The settlement has also been significantly minimized with the presence of the EPS
inclusion. The maximum settlement recorded after 30 cycles was 14.7mm and that is
approximately 40% less than the corresponding value measured in test T1.
0
0.5
1
1.5
2
2.5
3
3.5
0 5 10 15 20 25 30 35
Lat
eral
pre
ssure
(kP
a)
Number of cycles
Passive position
Initial position
Active position

Chapter four Small wall physical model
68
Figure 4.13 Maximum settlement at initial position - Test T2
The pattern of settlement is slightly different for the two tests. The settlement profile
for T2 has less extent and depth than for T1. It is evident that the influence zone of
wall movement has been minimized due to the existence of the EPS inclusion. This
behaviour is manifested in large decrease of settlement rate with the distance from
the wall as illustrated in Figure 4.14.
Figure 4.14 Settlement at different distances from the wall – Test T2
4.5.2 Tests of Horizontally-displaced Wall (Translational Movement)
These tests are intended to investigate the soil settlement and the lateral pressures
acting on the wall when the movement is an absolute translation without any
rotation. In these tests, the wall stands vertically on its base and is supported with
two horizontal bars as illustrated earlier in Figure 4.3. This type of test also involves
two variations, with (T4) and without the presence of EPS inclusion (T3).
0
2
4
6
8
10
12
14
16
0 5 10 15 20 25 30 35
Set
tlem
ent
(mm
)
Number of cycles
0
2
4
6
8
10
12
14
16
0 5 10 15 20 25 30 35
Set
tlem
ent
(mm
)
Number of cycles
at EPS-soil interface
at 200mm from wall
at 250mm from wall
at 330mm from wall
at 400mm from wall

Chapter four Small wall physical model
69
4.5.2.1 Translation Wall Movement without EPS Inclusion (T3)
Similar to the test setup in T1, the soil was loosely placed inside the test chamber
without using an EPS inclusion. Thirty cycles of two way, 2mm, translational
displacement were applied at the centre of the wall at the same rate adopted in earlier
tests T1 and T2. The lateral pressures and the settlements were measured throughout
the test.
The results collected from test T3 showed considerable quantitative and qualitative
variations to those observed in T1. The lateral earth pressures in test T3 are generally
higher than the corresponding values in test T1. The passive pressure increases
nonlinearly with the number of cycles to reach a maximum value of 30.19 kPa after
30 cycles. This value is approximately four times higher than the corresponding
value in T1. Moreover, passive pressure in T3 was constantly increasing throughout
the test without a sign or tendency to asymptote after 30 cycles.
The end-of-cycles pressure experiences a rapid increase during the first ten cycles of
the test then stabilized or increased at smaller rate after 15 cycles of wall movements.
The maximum value of at-rest pressure recorded in T3 was 17.25. Figure 4.15 shows
the lateral pressures measured during test T3 at different wall positions.
Figure 4.15 Measured lateral pressures at different wall positions -Test T3
The settlement results also showed some differences compared to the test results of
T1. The maximum settlement, measured at the interface between the soil and the wall
increased significantly with the number of cycles to reach 74.3mm at the end of the
test. This value exceeds 30% of the total retained height of the soil and is three times
greater than that in Test T1. The results also show an amount of heave at the soil
0
5
10
15
20
25
30
35
0 5 10 15 20 25 30 35
Lat
eral
pre
ssure
Number of cycles
passive position Initial position
active position

Chapter four Small wall physical model
70
surface between 15cm and 20cm from the wall. This behaviour was not observed in
test T1 whereas the soil did not exhibit any heave during the test. The model before
and after the test are shown in Figure 4.16.
(a) (b)
Figure 4.16 The soil surface (a) before and (b) after the Test T3
4.5.2.2 Translation Wall Movement with EPS Inclusion (T4a, T4b)
This experiment involves testing the soil under two-way translational wall
movements with an EPS inclusion provided between the soil and the steel wall. The
inclusion is represented by 80mm thick EPS board with a density of 20kg/m3 (Test
T4a). According to the selected thickness of the EPS board, the total strain incurred
by the wall movement may exceed the elastic strain of the EPS inclusion (0.1%) and
some plastic deformations could be accumulated during the test. This will allow for
investigating the effects of any possible plastic deformations in the EPS on the soil
settlements and the lateral pressures.
The soil was loosely placed in the test chamber and the test was carried out under the
same displacement amplitude and loading rate used in previous tests. At the end of
the test, a small trough was apparent in the soil adjacent to the EPS geofoam as
shown in Figure 4.17.
The lateral pressures measured during the test were considerably less than those in
test T3. Maximum lateral pressure recorded in this test was 9.705kPa and that is
approximately 65% less than the corresponding value in the test T3. Although the
magnitude of pressure increased rapidly during the first few cycles, it showed a clear
sign of reduction in its increment rate and asymptote between 22 and 30 cycles.
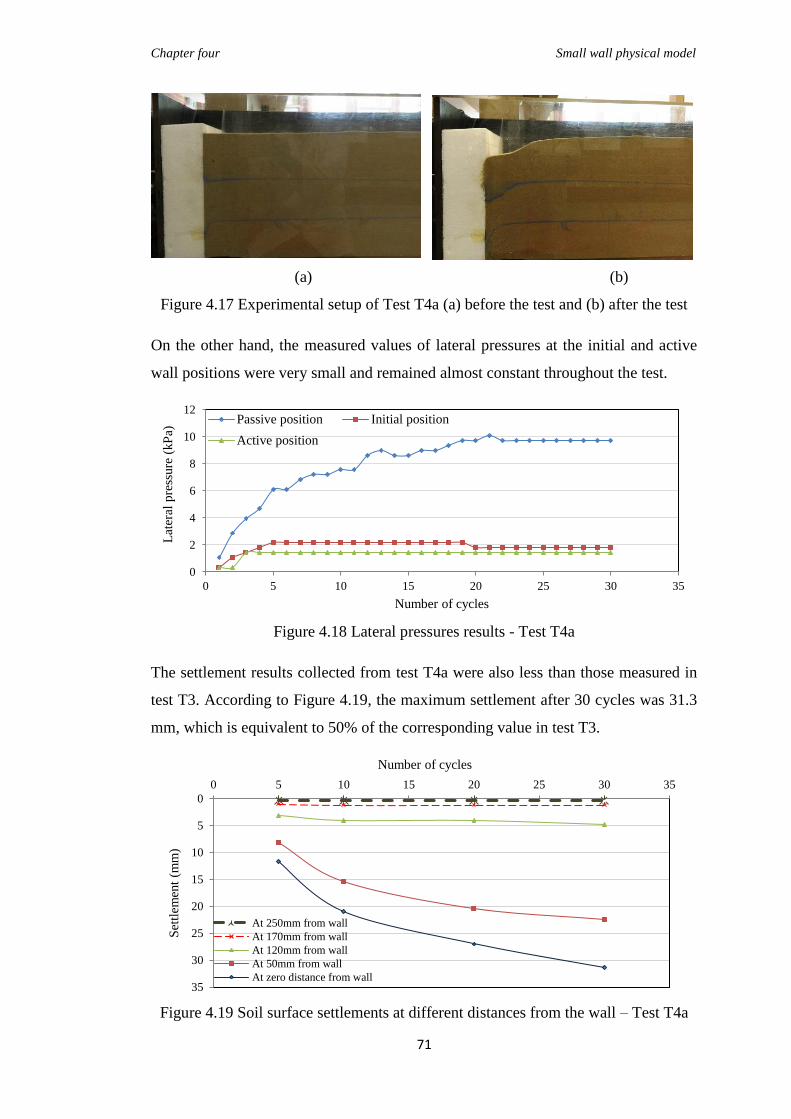
Chapter four Small wall physical model
71
(a) (b)
Figure 4.17 Experimental setup of Test T4a (a) before the test and (b) after the test
On the other hand, the measured values of lateral pressures at the initial and active
wall positions were very small and remained almost constant throughout the test.
Figure 4.18 Lateral pressures results - Test T4a
The settlement results collected from test T4a were also less than those measured in
test T3. According to Figure 4.19, the maximum settlement after 30 cycles was 31.3
mm, which is equivalent to 50% of the corresponding value in test T3.
Figure 4.19 Soil surface settlements at different distances from the wall – Test T4a
0
2
4
6
8
10
12
0 5 10 15 20 25 30 35
Lat
eral
pre
ssure
(kP
a)
Number of cycles
Passive position Initial position
Active position
0
5
10
15
20
25
30
35
0 5 10 15 20 25 30 35
Set
tlem
ent
(mm
)
Number of cycles
At 250mm from wall
At 170mm from wall
At 120mm from wall
At 50mm from wall
At zero distance from wall

Chapter four Small wall physical model
72
In order to verify the potential effectiveness of EPS inclusion in different
arrangements, test T4b was carried out using EPS arrangement similar to that used in
Test T2 (wedge-shaped inclusion). The results of the second version of test T4, T4b,
revealed a considerable variation in the soil settlement. This fact indicates that the
wedge shaped inclusion is more effective in attenuating the soil settlement than the
single-block inclusion irrespective of the mode of wall movement. Figure 4.20
summarized a comparison between the settlement results using single-block and
wedge-shaped EPS inclusions as observed in tests T4a and T4b respectively.
Figure 4.20 Maximum settlement in tests T4a and T4b using different arrangements
for the EPS inclusion
4.5.3 Discussion of Results
The experimental results reported in this chapter showed various behaviours for the
retained soil in response to the different modes of wall movements and the presence
of an EPS inclusion. In this section, results collected from tests T1 through T4 will
be reviewed and analysed.
4.5.3.1 Influence of Mode of Wall Movement
In order to analyse the influence of different wall movements on the retained soil, it
is worthwhile first to discuss the soil-wall interaction mechanism under cyclic
displacement. Generally, the movement of the wall in both modes (rotation and
translation) involves cycles of passive and active displacements. During the passive
phase, the wall compresses the adjacent soil, which results in a densified passive
wedge of soil. When the wall moves back towards the active position, an active soil
0
5
10
15
20
25
30
35
0 5 10 15 20 25 30 35
Set
tlem
ent
(mm
)
Number of cycles
Single-block EPS
Wedge-shaped EPS

Chapter four Small wall physical model
73
wedge will slide down and slightly translate towards the gap behind the wall. In the
following passive movement, the wall will encounter additional pressure to
overcome the resistance, from the “formerly moved” active wedge, until it reached
the passive position. This additional pressure, imposed by the active wedge
resistance, will result in additional densification in the passive wedge. The repetition
of such scenario over successive cycles will lead to,
Highly densified soil in the passive soil wedge which eventually dilates and
heaves under shearing,
Escalation in the lateral pressure acting on the wall and
More settlements in the loosened soil in the active wedge.
Although the aforementioned mechanism and the subsequent effects on the soil are
the same irrespective of the mode of movement, the latter yet, imposes significant
variations in the measured lateral pressures and soil settlements. Evidently the
translation movement has greater effects on the retained soil than the wall rotation as
illustrated in Figures 4.21 & 4.22. This is basically because the volume of soil
affected or displaced during the translational movement is larger (theoretically two
times) than that for the case of rotation. Consequently, the volumetric strain in test
T3 is greater than that in T1.
휀𝑣3 > 휀𝑣1 (4.3)
∆𝑥3 . ∆𝑦3 . ∆𝑧3 > ∆𝑥1. ∆𝑦1. ∆𝑧1 (4.4)
As a plane strain case, the deformation in y direction ∆𝑦 is constant.
Accordingly,
∆𝑥3 . ∆𝑧 > ∆𝑥1. ∆𝑧1 (4.5)
Therefore, the larger volumetric strain in test T3 was reflected as greater amounts of
settlement (∆𝑧) and soil densification (∆𝑥). The heave in the soil surface observed in
test T3 indicates the increase in the density of the passive wedge of the soil, which
normally dilates during shearing. This behaviour was not observed in test T1 because

Chapter four Small wall physical model
74
the applied amplitude together with the mode of movement were not sufficient to
densify the passive soil wedge.
Figure 4. 21 Lateral pressures (passive position) of Tests T1 and T3
Figure 4.22 Maximum settlements measured in tests T1 and T3
4.5.3.2 Influence of the EPS Inclusion
In both modes of wall movements, rotation and translation, the EPS inclusion has
functioned effectively in alleviating the lateral pressures and the soil settlements as
shown in Figure 4.23 and Figure 4.24. For instance, the maximum measured lateral
pressure and settlement in test T3 were reduced by 68% and 58% respectively
compared to those in T4a. These reductions in the stresses and the settlement have a
significant influence on the initial design requirements and the in-service
maintenance works necessary for the bridge approaches. Therefore, in addition to its
0
5
10
15
20
25
30
35
0 5 10 15 20 25 30 35
Lat
eral
pre
ssure
(K
pa)
Number of cycles
Hinged wall
Horizontally-displaced wall
0
10
20
30
40
50
60
70
80
0 5 10 15 20 25 30 35
Set
tlem
ent
(mm
)
Number of cycles
Hinged wall
Horizontally-displaced wall

Chapter four Small wall physical model
75
potential structural and geotechnical advantages, the use of EPS will incur
considerable cost savings in the long term.
The function of the highly compressible EPS inclusion is to absorb the wall
displacement, without disturbing the adjacent soil, and subsequently dissipating the
lateral pressures associated with the movement. However, in the results collected
from test T2, T4a and T4b, this function seemed to be only partially achieved. A
degree of lateral pressure, due to wall displacement, is evidently being transferred to
the soil and consequently the settlement and lateral earth pressure were attenuated
but not substantially vanished.
Based on the general equilibrium expression,
𝜎𝐸𝑃𝑆 = 𝜎𝑠𝑜𝑖𝑙 (4.4)
𝜎𝐸𝑃𝑆 = 휀𝑠𝑜𝑖𝑙 . 𝐸𝑠𝑜𝑖𝑙 (4.5)
휀𝑠𝑜𝑖𝑙 = (𝜎𝐸𝑃𝑆
𝐸𝑠𝑜𝑖𝑙 ) (4.6)
According to Equation 4.6, the “most important” strain in the retained soil is a
function of the compressive strength of the EPS and the stiffness of soil. In other
words, to maximise the advantage of the EPS inclusion in rectifying the wall
movement effects, an EPS with lower compressive strength and denser backfill need
to be used. However, this criterion need to be employed with due attention to the
other intended functions of the EPS inclusion such as bearing the vertical loads and
the lateral soil pressure.
The arrangement of the EPS as a single-block or a wedge-shaped inclusion, also has
a clear influence on the performance of the EPS inclusion. The wedge-shaped
inclusion seems to be more effective than a single-block of EPS. However, the
wedge-shaped inclusion requires a larger volume of EPS and consequently increase
the overall project cost. Therefore, the selection of the proper design for the EPS
inclusion would need to compromise between the properties of EPS, the incurred
cost and the extent to which the settlement and the lateral pressures need to be
minimized.

Chapter four Small wall physical model
76
Figure 4.23 Lateral pressure with and without EPS inclusion (translation movement)
Figure 4.24 Settled soil profile of tests T3 and T4b
4.6 Summary
Five physical model tests were carried out on a small wall retaining loose sand to
investigate the influence of the mode of wall movement and the use of an expanded
polystyrene geofoam inclusion on the settlement problems at the approach of IABs.
The data collected from the tests are summarized in Table 4.1. Based on the
experimental test results, the following conclusions have been drawn:
0
5
10
15
20
25
30
35
0 5 10 15 20 25 30 35
Lat
eral
pre
ssure
(kP
a)
Number of cycles
With EPS inclusion
Without EPS inclusion
-10
0
10
20
30
40
50
60
70
80
0 5 10 15 20 25
Set
tlem
ent
(mm
)
Distance from wall (cm)
Without EPS inclusion
With EPS inclusion

Chapter four Small wall physical model
77
Table 4.1 Summary of the test results
Test Description Max. Measured
Pressure
(kPa)
Maximum
Settlement
(mm)
T1 Rotational movement
no EPS inclusion 7.817 24.6
T2 Rotational movement with
wedge-shaped EPS inclusion 2.874 14.7
T3 Translational Movement
no EPS inclusion 30.19 74
T4-a Translational movement
with single-block of EPS
inclusion
9.705 31.3
T4-b Translational movement
with wedge-shaped EPS
inclusion
- 26.3
An abutment in an integral bridge will move cyclically in response to the
ambient temperature changes. Such movement is a combination of two
different modes, rotation and translation. These movements are usually
unequal and the dominant mode is dependent on the type and height of the
abutment in addition to the backfill properties.
The dominant mode of abutment movement has a significant effect on the
soil-structure interaction behaviour in IABs. Abutments with mainly
translational movement experience higher approach settlements and lateral
earth pressures than those with principally rotational movement.
The use of EPS inclusion is effective in minimizing the soil settlement and
lateral pressures irrespective of the type of wall movement.
The design of the EPS inclusion, in particular its arrangements,
compressive strength and thickness, plays an important role in its potential
performance. However, the initial cost incurred will have to be
compromised with the objectives or the intended functions of the EPS
inclusion.

Chapter four Small wall physical model
78
In addition to its potential in rectifying the approach problems in IABs, the
EPS possesses compressive strength that is sufficient to support the
overburden loads specially in locations where weak or compressible
underlying soil exists. Therefore, the EPS provides a unique design
alternative that can be utilized as a light weight embankment and
compressible inclusion at the same time.

79
Chapter Five
Finite Element Modelling of Integral Abutment Bridges with EPS
Inclusion
5.1 Introduction
Computer simulations utilising reliable numerical models have been applied
extensively in many engineering applications of practical interest. It provides an
effective tool to produce results at minimal time, cost and effort. In its application to
IABs, computer modelling has been used to investigate the soil-structure interaction
behaviour under the temperature induced loads (Dicleli, 2000; Horvath, 2000; Kim
and Laman, 2010; Bloodworth et al., 2012). However, to develop an efficient and
reliable computer model, sufficient calibration and validation with physical data need
to be undertaken.
In this chapter, a finite element model is developed using the ABAQUS/Standard
finite element modelling software and validated against the experimental test data
reported earlier in Chapter 4. As part of the work presented in this chapter, the
ability of the model to simulate the constitutive behaviour of the expanded
polystyrene geofoam (EPS) is verified. This verification is important to model the
soil-wall interaction when an EPS inclusion is used. The finite element model is also
to be validated against the adequacy in replicating the physical test results of the
different modes of wall movements.
Upon validating the numerical model using the small wall test results, it is utilized to
investigate the potential application of the EPS in rectifying the approach problems
in IABs considering prototype dimensions. The model will provide an effective and
flexible tool to study the effects of the EPS inclusion in different settings and
arrangements on the lateral earth pressures and soil settlements in IABs approaches.
5.2 Model Description
5.2.1 Model Dimensions
The ABAQUS/standard (ABAQUS, 2013) finite element modelling software is used
to develop the two-dimensional plane strain finite element (FE) model. The model is
applied to study the IAB wall at prototype scale, with and without EPS inclusion.
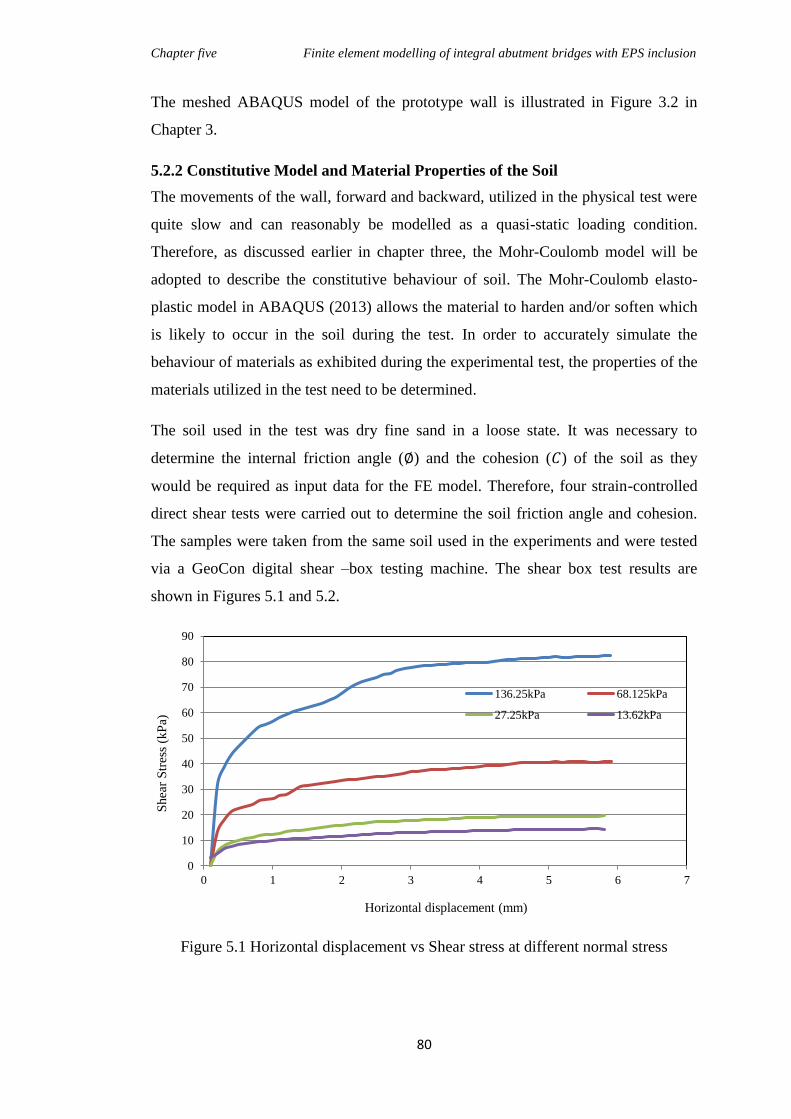
Chapter five Finite element modelling of integral abutment bridges with EPS inclusion
80
The meshed ABAQUS model of the prototype wall is illustrated in Figure 3.2 in
Chapter 3.
5.2.2 Constitutive Model and Material Properties of the Soil
The movements of the wall, forward and backward, utilized in the physical test were
quite slow and can reasonably be modelled as a quasi-static loading condition.
Therefore, as discussed earlier in chapter three, the Mohr-Coulomb model will be
adopted to describe the constitutive behaviour of soil. The Mohr-Coulomb elasto-
plastic model in ABAQUS (2013) allows the material to harden and/or soften which
is likely to occur in the soil during the test. In order to accurately simulate the
behaviour of materials as exhibited during the experimental test, the properties of the
materials utilized in the test need to be determined.
The soil used in the test was dry fine sand in a loose state. It was necessary to
determine the internal friction angle (∅) and the cohesion (𝐶) of the soil as they
would be required as input data for the FE model. Therefore, four strain-controlled
direct shear tests were carried out to determine the soil friction angle and cohesion.
The samples were taken from the same soil used in the experiments and were tested
via a GeoCon digital shear –box testing machine. The shear box test results are
shown in Figures 5.1 and 5.2.
Figure 5.1 Horizontal displacement vs Shear stress at different normal stress
0
10
20
30
40
50
60
70
80
90
0 1 2 3 4 5 6 7
Shea
r S
tres
s (k
Pa)
Horizontal displacement (mm)
136.25kPa 68.125kPa
27.25kPa 13.62kPa
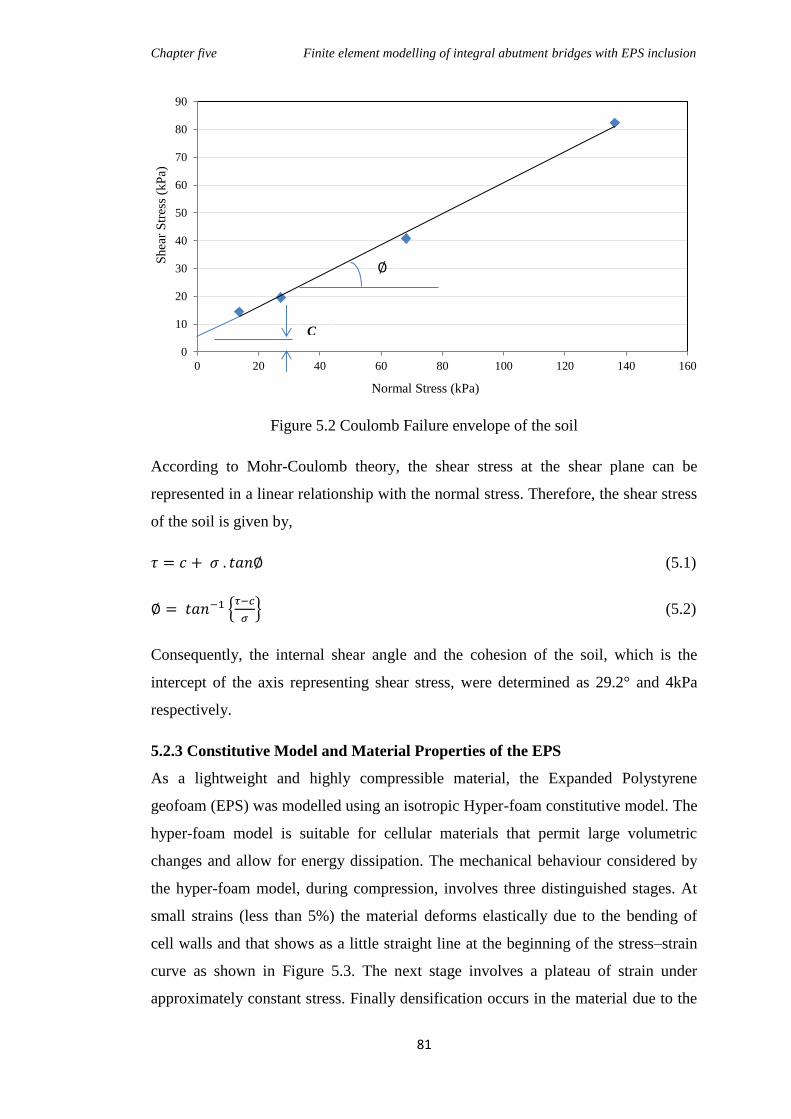
Chapter five Finite element modelling of integral abutment bridges with EPS inclusion
81
Figure 5.2 Coulomb Failure envelope of the soil
According to Mohr-Coulomb theory, the shear stress at the shear plane can be
represented in a linear relationship with the normal stress. Therefore, the shear stress
of the soil is given by,
𝜏 = 𝑐 + 𝜎 . 𝑡𝑎𝑛∅ (5.1)
∅ = 𝑡𝑎𝑛−1 {𝜏−𝑐
𝜎} (5.2)
Consequently, the internal shear angle and the cohesion of the soil, which is the
intercept of the axis representing shear stress, were determined as 29.2° and 4kPa
respectively.
5.2.3 Constitutive Model and Material Properties of the EPS
As a lightweight and highly compressible material, the Expanded Polystyrene
geofoam (EPS) was modelled using an isotropic Hyper-foam constitutive model. The
hyper-foam model is suitable for cellular materials that permit large volumetric
changes and allow for energy dissipation. The mechanical behaviour considered by
the hyper-foam model, during compression, involves three distinguished stages. At
small strains (less than 5%) the material deforms elastically due to the bending of
cell walls and that shows as a little straight line at the beginning of the stress–strain
curve as shown in Figure 5.3. The next stage involves a plateau of strain under
approximately constant stress. Finally densification occurs in the material due to the
0
10
20
30
40
50
60
70
80
90
0 20 40 60 80 100 120 140 160
Shea
r S
tres
s (k
Pa)
Normal Stress (kPa)
∅
C

Chapter five Finite element modelling of integral abutment bridges with EPS inclusion
82
collapse of cell walls resulting in a rapid increase in the compressive stress
(ABAQUS, 2013). The behaviour prescribed by the hyper-foam model is, therefore,
closely identical to the constitutive behaviour of EPS geofoam.
Figure 5.3 Compressive Stress–Strain curve for Hyper-foam
The Hyper-foam model in ABAQUS (2013) needs to be calibrated with experimental
data to define the properties of material as input data for the model. Accordingly
three different laboratory tests have been carried out on EPS samples including,
- Confined uniaxial compression test: In this test, three (50mm diameter and
50mm height) EPS samples were tested using a 50kn Wykeham Farrance
electro-mechanical loading frame. The load was applied through a load cell
mounted at the top of the specimen. An LVDT was used to measure the
vertical deformation in the specimen. Specimen’s height to diameter ratio
(H/D) is chosen to be 1:1 to avoid any possible buckling effects. On the other
hand, the contact ends of specimens have been properly smoothed with a sand
paper to eliminate the end restraining effects. Each specimen was loaded to a
total strain of 30% at a loading rate equal to 2%/minute. Test results for the
three samples are presented in Figure 5.4.

Chapter five Finite element modelling of integral abutment bridges with EPS inclusion
83
Figure 5.4 Strain-Stress relationship of EPS samples in uniaxial compression test
- Three-dimensional drained hydrostatic test: This test was conducted using a
Wykeham Farrance pressure cell where the specimens were subjected to a
uniform hydrostatic confining pressure. A GDS controller was used to control
the pressure inside the cell and to measure the volumetric strain in the
specimen. Samples tested have the same dimensions as in the uniaxial test.
The hydrostatic test results are presented in Figure 5.5.
Figure 5.5 Hydrostatic test results
- Simple shear test: A 60mm x 60mm EPS specimen with a height of 55mm
was tested under a simple shear load to determine the shear resistance of the
EPS. In the test, the bottom surface of the sample was pasted to the base with
a strong adhesive while the top surface was tightly inserted into a movable
rigid steel frame. A monotonic shearing load was applied at a strain rate of
0
20
40
60
80
100
120
140
160
0 5 10 15 20 25 30 35
Str
ess
(kP
a)
Strain (%)
Specimen A
Specimen B
Specimen C
0
20
40
60
80
100
120
0 5 10 15 20 25 30 35
Pre
ssure
(kP
a)
Volumetric strain (%)

Chapter five Finite element modelling of integral abutment bridges with EPS inclusion
84
0
5
10
15
20
25
30
0 5 10 15 20
Sh
ear
stre
ss (
kP
a)
Shear strain (%)
2%/minute. The applied load and the horizontal displacement of the specimen
were measured throughout the test. The shear strain 𝛾 is calculated as the
ratio between the horizontal displacement ∆𝑥 to the effective height of the
sample H. The shear test results are shown in Figure 5.6 (b). The EPS
samples used in all tests were taken from the same EPS block supplied by a
local firm in Sydney-Australia. The EPS density was 20kg/m3.
(a) (b)
Figure 5.6 Shear test on EPS sample
5.2.4 Interaction Properties and Boundary Conditions
Similar to the case described earlier in Chapter 3, the interaction behaviour at the
soil-wall and soil-EPS interfaces was modelled as a standard surface-to-surface
contact with finite sliding. The interaction was activated during the initial step of the
analysis. The mechanical frictional behaviour at the surfaces of interface was
expressed as a tangential friction, while the normal behaviour at the interface
between the soil, concrete and the EPS was simulated as a “hard contact” where no
separation or penetration is permitted between any two surfaces.
Direct shear tests were also carried out to determine the coefficient of friction
between the soil and the EPS geofoam. The soil, in loose state, was sheared against a
block of EPS geofoam at normal stresses of 13.6 kPa, 27.3 kPa and 68.1 kPa. Based
on the test results the soil-EPS friction coefficient was determined as 0.42.
5.3 Model Verification
In order to verify the efficiency of the model in simulating the wall – soil interaction
behaviour when an EPS geofoam inclusion is involved, the same setup used in the
H EPS
∆𝑥
Shear force

Chapter five Finite element modelling of integral abutment bridges with EPS inclusion
85
physical small wall tests has been simulated using the FE model. Taking into
account that the physical model was carried out under normal gravity, 𝑔 = 1, the
geometry of the FE model applied in the verification including the dimensions of the
wall and the soil are made equal to those in the physical model. The Mohr-Coulomb
parameters (C &∅) of the soil used in the model are identical to those determined by
the laboratory tests. The density of soil prescribed in the model has also been
determined based on the actual unit weight of sand used in the physical model. The
elasticity modulus of the soil was assumed as 30,000 kPa in reference to the typical
value of the elasticity modulus of uniform loose sand. Also the Hyper-foam model
was calibrated using the tests results of the EPS geofoam.
The meshed ABAQUS model for the small wall is shown in Fig 5.7. The materials
properties, displacement amplitude and mode of wall movements were all identical
to those utilized in Tests T2 and T4.
Figure 5.7 The meshed ABAQUS model for small wall
The FE modelling results for the maximum settlement of soil surface as well as the
lateral earth pressures have been plotted together with the corresponding
experimental results for comparison as appear in Figures 5.8 and 5.9. Taking into
account the complexity of soil-structure interactions and the soil densification
effects, the modelling and experimental results agree well with each other and the
discrepancies between them are generally insignificant.
0.7m
0.24m
0.3m
0.55m
m

Chapter five Finite element modelling of integral abutment bridges with EPS inclusion
86
Figure 5.8 Finite element and experimental (test T2) results for the soil settlement
Figure 5.9 (a)
Figure 5.9 (b)
Figure 5.9 Lateral pressures acting on the wall during (a) Cycle 10 & (b) Cycle 5 of
test T2
0
1
2
3
4
5
6
7
8
0 2 4 6 8 10 12
Max
imum
Set
tlem
ent
(mm
)
Number of Cycles
Modelling
Experiment
0
1
2
3
4
-3 -2 -1 0 1 2 3
Lat
eral
pre
ssure
at
a d
epth
of
0.3
H
(kP
a)
Displacement (mm)
Modelling
Experiment
0
1
2
3
4
-3 -2 -1 0 1 2 3
Lat
eral
pre
ssure
at
a d
epth
of
0.3
H
(kP
a)
Displacement (mm)
Modelling
Experiment

Chapter five Finite element modelling of integral abutment bridges with EPS inclusion
87
In order to maximize the validation range for the FE model, the test T4 has also been
simulated in which the wall translated horizontally which induced greater settlements
and lateral soil pressures compared to test T2. A comparison between the modelling
and the experimental results of test T4 is given in Figures 5.10.
According to Figure 5.10, the modelling results of the maximum soil settlement are
exhibited as an almost straight line which slightly deviate from the actual non-linear
experimental results. This behaviour could be justified by the influence of two
factors. First, any plastic deformation or the hardening effects taking place in the
EPS geofoam may not have been substantially captured by the Hyper-foam model. In
such a circumstance, the elasto-plastic model developed by Wong and Leo (2006)
can be utilized to better replicate the actual behaviour of the EPS geofoam and
consequently improve the modelling results of soil settlements.
The second influencing factor is the constitutive model of the soil which has not been
able to replicate the densification and the associated changes in the soil properties
due to the successive passive-active cycles of movements. The soil normally
densifies under the continuous loading and un-loading cycles which results in an
increase in the density, stiffness and also the shear strength of the soil.
An examination of the stresses in the EPS geofoam reveal that they are generally
rather small in magnitude in the small wall model, thus the plastic zones in the
geofoam are quite insignificant. In consequence, the plasticity or lack of it in the
geofoam is not a primary reason why the small physical model and the FE settlement
results in Figure 5.10 do not match sufficiently well (compare experimental results
versus modelling results with constant cohesion, C). It was later confirmed in the FE
modelling of the typical prototype wall (see later section) that the regions where the
yield stress have been exceeded in the geofoam inclusions are quite small.
Unlike the geofoam, however, the loose sand was yielding and densifying with every
cycle of wall movements hence the specification of the shear strength in the Mohr-
Coulomb model and the effects of densification are likely to be consequential. In an
attempt to investigate the potential effects of yielding and soil densification on the
FE modelling results, the FE ABAQUS model has been utilized to back analyse the
soil density, stiffness, shear angle and cohesion. Based on the backward analyses it
was found that the settlement results are sensitive to the magnitude of soil cohesion.

Chapter five Finite element modelling of integral abutment bridges with EPS inclusion
88
Other parameters had very small or negligible effects. A modified analysis was
undertaken, by slightly adjusting for soil cohesion in every five cycles of the wall
movement in the ABAQUS model. The results showed that the settlement results of
the physical model could be matched accurately by the FE model if the cohesion was
adjusted (see Figure 5.10, variable cohesion c case). The adjusted cohesion values
are shown in Figure 5.11.
The observations that can be drawn from the validation effort using the small wall
are: (1) the calibration of the Mohr-Coulomb constitutive model for stress ranges
suitable for the prototype wall was not appropriate for the stress ranges of the small
wall. In this instance, the calibrated cohesion initially used in the small wall
modelling (4 kPa) was higher than it should be as shown by the back analysis; (2) the
cohesion part of the shear strength dominates over the internal friction angle part in
the small wall case because of the small stresses. Hence the modelling was very
sensitive to the specified cohesion value of the soil. This would not be the case in the
prototype wall where internal friction will be more dominant and stresses are higher.
As shown in the verification effort in Chapter 3 using data from the centrifuge tests
which share stress similarity with the prototype, the Mohr-Coulomb constitutive
model had performed very adequately.
In light of the above observations, the Mohr-Coulomb model for the loose sand and
the Hyper-foam model were deemed adequate to be used for the modelling study of
IABs of prototype dimensions, with and without EPS inclusions.
Figure 5.10 FE modelling and the experimental results for test T4
0
5
10
15
20
25
30
35
0 5 10 15 20 25 30 35
Max
imum
set
tlem
ent
(mm
)
Number of cycles
Experimental results
Modelling results, constant c value
Modelling results, variable c value

Chapter five Finite element modelling of integral abutment bridges with EPS inclusion
89
Figure 5.11 The variance of the cohesion of soil during the analysis
5.4 Application of the ABAQUS Model on Prototype Dimensions
Based on the outcomes of the numerical validation discussed in section 2.3 above, it
can be concluded that the current FE model is sufficiently reliable to replicate the
wall-soil interaction when an EPS inclusion is utilized. Consequently, it is possible to
apply the model now for cases with prototype dimensions that involve the use of EPS
geofoam.
In order to produce results to quantitatively assess the efficiency of the EPS inclusion
in prototype dimensions, the same model discussed earlier in Chapter 3 will be
simulated but with the use of EPS geofoam as a remedial measure for the soil
settlement and lateral pressure problems. The FE ABAQUS model described in
Chapter 3 has been modified so that a wedge-shaped EPS inclusion is provided at the
interface between the soil and the wall. The density and other properties of the EPS
geofoam have been set equal to those utilized in calibrating the Hyper-foam model.
Hence, the effectiveness of incorporating the EPS geofoam can be investigated by
comparing the results with the corresponding ones in Chapter 3 (the model without
EPS inclusion). For an easy reference, the model described earlier in Chapter 3 will
be cited as Model-1 and the modified model discussed in this section (with EPS
inclusion) will be cited as Model-2
The EPS blocks in Model-2 were arranged in a wedge shape behind the abutment
wall as illustrated in Figure 5.12. The slope angle 𝜃 of the assumed planar interface
between the EPS wedge and the soil is a primary design variable that may affect the
settlement and lateral pressure results (Horvath, 2000). Therefore, two variations of
0
0.5
1
1.5
2
2.5
3
0 5 10 15 20 25 30 35
C,
(kP
a)
Number of cycles

Chapter five Finite element modelling of integral abutment bridges with EPS inclusion
90
Model-2 were simulated based on two different values for the angle . In Model-2a,
the magnitude of angle 𝜃 was assumed as 45 + ∅ 2⁄ , where ∅ is the internal friction
angle of the soil. The case of Model-2a represents the soil on the verge of active
failure state. The angle was assumed equal to the internal friction angle of soil
(∅ = 𝜃) in Model-2b.
Figure 5.12 EPS arrangement behind the wall
The modelling results show that the EPS inclusion generally performs well in
reducing both the lateral earth pressure and settlement effects compared to Model-1
(where no EPS inclusion is used). Also, unlike the settlement results in Model-1, the
critical settlement spot in Model-2a was observed at the interface between the EPS
geofoam and the soil as illustrated in Figure 5.13. Surface settlements at the interface
between the EPS and the wall were very small and insensitive to the increase in
number of cycles. Instead, the settlement of interest is now at the soil–EPS interface.
Figure 5.13 The deformed FE Model-2a
Significant differences were observed in lateral earth pressure and the maximum soil
settlement results in Model-2a and Model-2b due to the difference in the value of the
Maximum settlement
Concrete wall

Chapter five Finite element modelling of integral abutment bridges with EPS inclusion
91
angle 𝜃. The results obtained from Model-2b show that the lateral stress acting at 2m
from the top of the wall was decreased by 75% compared to the corresponding value
of Model-2a and by 97% compared to Model-1, as shown in Figure 5.14.
A similar result was also observed in the magnitude of maximum soil settlement,
where the values of soil settlements in Case 2b are far less than those observed in
Case 2a and in Case 1 (without EPS) as shown in Figure 5.15.
Figure 5.14 Lateral pressure vs Number of cycles
The reason for the significant reduction in the lateral earth pressures and the
settlement when the slope of the EPS wedge, 𝜃, was set to the soil internal friction
angle ∅ (Case 2b) is due to increased stability of the soil behind the EPS blocks. As a
result, the soil behind the EPS blocks applies extremely small lateral stresses, if any,
on the EPS inclusion. Therefore, the amount of lateral stress transferred from the soil
to the wall through the EPS wedge will be very small. The greater extent of the EPS
wedge further dissipates the effects of wall movements on the adjoining soil. This
effect consequently minimizes the volumetric strain and the associated settlement in
the soil surface.
However, although the Case 2b is likely to diminish the lateral stress and settlement
problems in the IAB approaches, such an option will require the replacement of a
larger volume of soil and substituting it with EPS geofoam. This option is more
costly and may not be a cost-effective solution. An optimum value for the angle 𝜃
may need to be selected by giving due consideration to both the overall construction
cost and technical efficiency.
0
10
20
30
40
50
60
70
80
0 10 20 30 40 50 60
Lat
eral
pre
ssure
(kP
a)
Number of cycles
Case 1 (no EPS inclusion)
Case 2a
Case 2b

Chapter five Finite element modelling of integral abutment bridges with EPS inclusion
92
Figure 5.15 Maximum settlement vs Number of cycles
5.5 Summary
A plane strain finite element model has been developed using the
ABAQUS/Standard and validated using experimental results obtained from a small
wall retaining loose sand and subjected to active and passive displacements, as
described earlier in Chapter 4. The purpose is to validate the FE model in simulating
the abutment-soil interaction behaviour at the approach when an EPS geofoam
inclusion is provided. Then this model was applied in simulating prototype-scale
cases. The FE modelling is used to assess the effectiveness of the EPS geofoam in
rectifying the approach problems in the IABs. Based on the modelling results, the
following conclusions have been obtained,
The Hyper-foam constitutive model available in the ABAQUS/Standard has
reasonably replicated the behaviour of EPS geofoam used in typical IABs.
An elasto-plastic constitutive model such as one developed by Wong and
Leo (2006) can be utilized in the FE element model to better describe the
behaviour of the EPS geofoam inclusion especially in applications where the
presence of plasticity is substantial (such as for IABs with much longer
spans than the typical case).
The Mohr-Coulomb constitutive model can be used to model the impact of
movement cycles on the backfill of IABs effectively provided the shear
strength and, in some cases the densification effects, are properly included.
The EPS geofoam inclusion provides an effective remedial measure to
alleviate the soil settlements and lateral pressure at the IABs approaches.
0
20
40
60
80
100
120
0 10 20 30 40 50 60
Max
imum
set
tlem
ent
(mm
)
Number of cycles
Case 1 (no EPS inclusion)
Case 2a
Case 2b

Chapter five Finite element modelling of integral abutment bridges with EPS inclusion
93
Also, it is worthwhile noting that differential settlement directly due to the
different compressibility between the approach embankment soil and the
EPS geofoam is insignificant compared to that due to the abutment cyclic
movement. Nevertheless, engineers will need to design for different self-
weight of the different parts of the embankment if it is built on soft
foundation soil. This type of design is routinely done by geotechnical
engineers and should not detract from the advantanges and effectiveness of
using EPS geofoam.
The angle 𝜃 of the interface planar between the soil and the EPS wedge
plays an important role in the overall performance of the inclusion.
However, the incurred cost of using EPS geofoam is related to the interface
angle 𝜃 and the volume of the geofoam material used. Hence an optimised
design for using EPS geofoam need to be found between satisfying required
lateral and settlement criteria and the incurred costs.

94
Chapter Six
Summary and Conclusions
6.1 Summary
Integral abutment bridges (IABs) are receiving growing interest as a favourable
construction practice in many countries due to the significant savings in their
construction and maintenance costs. In addition, IABs have been shown to
demonstrate improved structural performance in various aspects of design, such as
the resistance to seismic loading. However, the absence of the expansion joints in the
IABs results in temperature induced movements in the bridge abutments, which
consequently lead to a settlement in the approach soil and a rapid increase in the
lateral earth pressure acting on the abutment. Using a compressible material as an
inclusion between the soil and abutment wall may reduce the aforementioned effects
to allowable values. Expanded polystyrene geofoam (EPS) is an excellent choice for
such applications due to its numerous merits. Besides being a highly compressible
material, EPS geofoam is extremely light weight and has a high compressive
strength. Therefore, it largely reduces the loads on the subsoil and at the same time
carries the vertical loads adequately.
This thesis consists of numerical and experimental studies of the soil-structure
interaction behaviour in IABs and the effectiveness of the EPS geofoam to mitigate
the approach problems in the IABs. First, a finite element model has been developed
using the ABAQUS/Standard software for a normal IAB system. The model was
validated using centrifuge experimental data and then applied to perform a simple
parametric study by varying the parameters contributing to the soil settlement and
lateral pressure development at the approach of IABs. A physical model, involving a
small wall retaining loose sand was then used to investigate the influence of an EPS
inclusion on the settlements and soil lateral pressures in response to different modes
of wall movements. Laboratory tests and numerical analyses have also been
conducted as necessary to calibrate and verify the Hyper-foam constitutive model in
simulating the EPS geofoam behaviour. Finally, a two-dimensional finite element
model was developed to investigate, in prototype dimensions, the effectiveness of
EPS in attenuating the approach issues in IABs. Different arrangements of EPS
inclusions, including single-block and wedge shaped inclusions, have been studied.
Chapter six Summary and conclusions
95
6.2 Conclusions
The outcomes of the numerical and experimental studies conducted in this research
are summarized as follow,
The classical theories for lateral earth pressures such as Coulomb and
Rankine do not capture well the lateral soil pressures in the IABs due to the
ratcheting effects developed under cyclic abutment movements.
The lateral pressures acting on the abutment in IABs is a function of the
amplitude and the mode of wall displacement as well as the number of the
movement cycles. Lateral pressures are higher at the upper part of the
abutment and less at the bottom part. Maximum pressure is usually recorded
at a height equal to H/3 from the soil surface, where H is the total height of
the retained soil.
The existing Australian standards (AS 5100) do not include guidelines for the
integral bridges. The British standards BA42/96 (2003) and the
recommendations of the PCI committee in the United States are generally
adopted in the design and construction of the IABs in Australia. However, the
existing guidelines dealing with the approach issues in the IABs are highly
empirical and do not account for the number of abutment movement cycles.
Therefore, in some cases, the value of lateral soil pressures acting on the
abutment such as in the UK standard BA42/96 (2003) is underestimated.
The two-dimensional finite element model, that utilizes Mohr-Coulomb
constitutive model for the soil, replicates the soil-wall interaction behaviour
reasonably well under cyclic movements. However, further improvements
can be made to the model by taking into consideration the soil densification
due to the cyclic movements of the abutment wall.
The temperature induced abutment movement is a combination of translation
and rotation. The dominant mode of movement, translation or rotation, has a
significant impact on the developed lateral pressures and soil settlements.
Abutments with mainly translational movement experience more severe
effects compared to that with principally rotational movement. In practice it
will be necessary and important to distinguish between dominantly

Chapter six Summary and conclusions
96
translational (short walls) or dominantly rotational wall (tall walls).
Guidelines for what constitutes a short or a long wall, however, are lacking.
Studying the effects of cyclic displacements in IABs considering only the
major temperature changes (the annual variation) rather than the
superimposed daily-annual variation will largely underestimate the lateral
earth pressures acting on the abutment.
The Hyper-foam constitutive model replicates the EPS geofoam behaviour
well at relatively small strains (below elastic limits). However, at larger
strains, the EPS may exhibit an amount of plastic deformation, which could
not be captured by the Hyper-foam model accurately.
The use of the EPS geofoam, as a fill material between the abutment and the
soil, significantly reduces the lateral pressure and the soil settlement in the
IAB approaches. The stiffness of the EPS and the retained soil influence the
effectiveness of the EPS inclusion. EPS of a relatively low stiffness is advised
to be used with a heavily retained soil to obtain the best results from a purely
inclusion perspective. However, this must be weighed against the need for the
EPS to support the vertical overburden.
The wedge-shaped EPS inclusion generally performs better than the single-
block inclusion in terms of alleviating the lateral soil pressure and
settlements. The angle of the inclined interface between the soil and the EPS
wedge also has a considerable impact on the inclusion performance. Selecting
an interface angle equal to the internal shear angle of the soil improves the
efficiency of the EPS inclusion. However, the additional incurred cost due to
the additional volume of EPS required in such an alternative need to be
considered.
6.3 Recommendation for Future Studies
This research has shown that EPS geofoam perform effectively in reducing
the approach problems in IABs, namely in terms of a significant reduction in
the lateral pressures and alleviation of the approach settlement. The EPS
utilized in the experimental and numerical analyses is of medium grade with
a density of 20kg/m3. Further studies are advised to consider EPS geofoam
of different densities and also different arrangements, such as providing a
resilient EPS thin board between the wall and the full EPS wedge, to further
Chapter six Summary and conclusions
97
reduce the temperature effects on IAB approaches especially the soil
settlement.
The hyper-foam model provided by the ABAQUS (2013) is able to replicate
the EPS behaviour reasonably well. However, in order to simulate the EPS
behaviour when plastic deformations and hardening effects are expected, an
elasto-plastic constitutive model such as the one developed by Wong and
Leo (2006) need to be employed in the FE modelling.
It is recommended that a constitutive model that incorporates soil
densification should be considered for future modelling to more accurately
take into account the effects of densification due to the cyclic movements.
The temperature induced movements of the abutment takes place in a slow
pattern corresponding to the annual temperature fluctuation. Therefore, time
dependent creep deformation is likely to occur in the EPS geofoam due to its
rheological behaviour. Further studies are recommended to involve the creep
strain component in the analysis of EPS when used in IAB approaches.
Guidelines for what constitute a translational-dominant, a rotational-
dominant wall or a mixed wall need to be investigated and established.
The physical model adopted in this research produced important data on the
influences of the mode of wall movements and the use of EPS inclusion on
the soil settlement and lateral pressures developed under the wall
displacement. However, a future study using a prototype-scale physical
model or centrifuge tests is recommended in the interest of producing similar
stress conditions as in the field for quantifying the actual effects of the EPS
inclusion on the approach problems in IABs.
Future studies are recommended to use three-dimensional computer model in
modelling the soil-structure interaction in IABs to simulate the realistic
situation of the approach including the slopes on both approach sides.
The computer model developed in this study deals with the EPS geofoam
inclusion as a continuum material. However, in future studies it is
recommended to simulate the EPS inclusion as stacked blocks of EPS
geofoam, as would be expected in the actual practice, to capture the effects
of friction and any possible movements between the blocks.

98
References
ABAQUS Inc. (2013). ABAQUS Version 6.13 user’s manual, Providence, Rohde
Island, USA.
Arellano, D. and T. D. Stark (2009). Load bearing analysis of EPS-block geofoam
embankments. 8th International Conference on the Bearing Capacity of Roads,
Railways and Airfields.
Arsoy, S., Barker, R. M., & Duncan, J. M. (1999). The behaviour of integral
abutment bridges (Vol. 3, p. 13). Charlottesville, VA: Virginia Transportation
Research Council.
Bayoglu F., (2004). Soil – structure interaction for integral bridges and culverts.
Licentiate Thesis, KTH.
BA42/96 (2003). Design manual for roads and bridges, Vol. 1, Section 3, Part 12:
The design of integral bridges: Amendment 1. UK Highways Agency.
Barr, P. J., Halling, M. W., Huffaker, C., & Boyle, H. (2013). Behaviour and analysis
of an integral abutment bridge. Bridges Transportation Research Board.
BASF Aktlengesellschaft (2006). Rigid styropor foam as a lightweight construction
material for highway foundations: GEOFOAM. Technical Information.
Ludwigshafen- Germany 510/1 - 510/10
Bloodworth, A. G., Xu, M., Banks, J. R., & Clayton, C. R. (2011). Predicting the
earth pressure on integral bridge abutments. Journal of Bridge Engineering, 17(2),
371-381.
Broms, B. B., & Ingelson, I. (1971). Earth pressure against the abutments of a rigid
frame bridge. Geotechnique, 21(1), 15-28.
Burke Jr, M. P. (2009). Integral and semi-integral bridges. John Wiley & Sons.
Butterfield, R. (1999). Dimensional analysis for geotechnical engineers.
Geotechnique, 49(3), 357-366.
Civjan, S. A., Bonczar, C., Brena, S. F., DeJong, J., & Crovo, D. (2007). Integral
abutment bridge behaviour: Parametric analysis of a Massachusetts bridge. Journal
of Bridge Engineering, 12(1), 64-71.
Cosgrove, E., & Lehane, B. M. (2003). Cyclic loading of loose backfill placed
adjacent to integral bridge abutments. International Journal of Physical Modelling in
Geotechnics, 3(3), 9-16.
Chun, B. S., H.-S. Lim, M. Sagong and K. Kim (2004). "Development of a
hyperbolic constitutive model for expanded polystyrene (EPS) geofoam under
triaxial compression tests. Geotextiles and Geomembranes 22(4): 223-237.

References
99
Dicleli, M. (2000). Simplified model for computer-aided analysis of integral bridges.
Journal of Bridge engineering, 5(3), 240-248.
Elragi, A. F. (2000). Selected engineering properties and applications of EPS
geofoam.
England, G. L., Bush, D. I., & Tsang, N. C. (2000). Integral bridges: a fundamental
approach to the time-temperature loading problem. Thomas Telford.
England, G. L., & Tsang, N. C. M. (2001). Towards the design of soil loading for
integral bridges—Experimental evaluation. Department of Civil and Environmental
Engineering, Imperial College, London.
Gibbens, B., & McManus, A. (2011, October). Design of Peninsula Link Integral
Bridges. Austroads Bridge Conference, 8th, 2011, Sydney, New South Wales,
Australia (No. AP-G90/11).
Hassiotis, S., & Roman, E. K. (2005). A survey of current issues on the use of
integral abutment bridges. Bridge Structures, 1(2), 81-101.
Hoppe, E. J. (2005). Field study of integral back wall with elastic inclusion (No.
FHWA/VTRC 05-R28).
Hoppe, E. J., & Gomez, J. P. (1996). Field study of an integral back wall bridge (No.
FHWA/VA-97-R7).
Horvath, J. S. (1994). "Expanded Polystyrene (EPS) geofoam: An introduction to
material behaviour. Geotextiles and Geomembranes, 13(4): 263-280.
Horvath, J. S. (2000). Integral-abutment bridges: problems and innovative solutions
using EPS geofoam and other geosynthetics. Res. Rpt. No. CE/GE-00, 2.
Horvath, J. S. (1997). The compressible inclusion function of EPS geofoam.
Geotextiles and Geomembranes, 15(1), 77-120.
Huntley, S. A., & Valsangkar, A. J. (2013). Field monitoring of earth pressures on
integral bridge abutments. Canadian Geotechnical Journal, 50(8), 841-857.
Khodair, Y. A. (2009). Lateral earth pressure behind an integral abutment. Structure
and Infrastructure Engineering, 5(2), 123-136.
Lehane, B. M. (2011). Lateral soil stiffness adjacent to deep integral bridge
abutments. Géotechnique, 61(7), 593-603.
Lock, R. J. (2002). Integral bridge abutments. MEng Project Report.
CUED/DSOILS/STR320, 2002 (Cambridge, UK: Schofield Centre).
Mistry, V. C. (2005). Integral abutment and joint-less bridges. The FHWA
Conference (IAJB 2005).

References
100
Nam, M. S., & Park, Y. H. (2013). Relationship between Earth Pressure and
Thermally Induced Movement of Integral Abutments. Journal of Performance of
Constructed Facilities, 29(4), 04014093.
Ng, C. W., Springman, S. M., & Norrish, A. R. (1998). Centrifuge modelling of
spread-base integral bridge abutments. Journal of geotechnical and
geoenvironmental engineering, 124(5), 376-388.
Ossa, A. and M. P. Romo (2009). "Micro- and macro-mechanical study of
compressive behaviour of expanded polystyrene geofoam. Geosynthetics
International, 16(5): 327-338.
Tan, D., Reid, C., Rajeev, P., Piratheepan, J., & Sivakugan, N. (2014). Earth pressure
development in integral abutment bridge subjected to thermal loadings. 8th
Australasian Congress on Applied Mechanics (ACAM), PP 408-415.
Tatsuoka, F., Hirakawa, D., Nojiri, M., Aizawa, H., Nishikiori, H., Soma, R.,
Tateyama, M. & Watanabe, K. (2009). A new type of integral bridge comprising
geosynthetic-reinforced soil walls. Geosynthetics International, 16(4), 301-326.
Thevaneyan, K.D., John, P.F., & Jianqiao Y. (2014). Superstructure behaviour of a
stub-type integral abutment bridge. Journal of Bridge Engineering, 19 (6) (2014), pp.
04014012-1–04014012-12
Sandford, T. C., & Elgaaly, M. (1993). Skew effects on backfill pressures at frame
bridge abutments. Transportation research record, (1415).
Vicroads, 2012. Design of Integral and Semi-Integral Bridges. Bridge Technical
Note BTN 2012/003 Version 1.0. Victoria. Australia
White, D. J., Mekkawy, M. M., Sritharan, S., & Suleiman, M. T. (2007).
“Underlying” Causes for Settlement of Bridge Approach Pavement Systems. Journal
of performance of constructed facilities, 21(4), 273-282.
Wolde-Tinsae, A. M., Klinger, J. E., & White, E. J. (1988). Performance of jointless
bridges. Journal of performance of constructed facilities, 2(2), 111-125.
Wong, H., & Leo, C. J. (2006). A simple elastoplastic hardening constitutive model
for EPS geofoam. Geotextiles and Geomembranes, 24(5), 299-310.