the appearance of human skin - cs.columbia.edu · the appearance of human skin ... 4 physiology and...
TRANSCRIPT
The Appearance of Human Skin
Takanori Igarashi∗, Ko Nishino†, and Shree K. Nayar †
Technical Report: CUCS-024-05
Department of Computer Science
Columbia University
New York, NY 10027, USA
June 2005
∗Takanori Igarashi is with the Skin Care Research Laboratory of Kao Corporation, Japan. From April 2003 to July 2004
he was a Visiting Research Scientist at Columbia University and supported by Kao Corporation.†Ko Nishino and Shree K. Nayar are with the Department of Computer Science, Columbia University, New York, N.Y.
10027.
This research was supported by Kao Corporation, Japan, and by an ITR Award (IIS-00-85864) from the National Science
Foundation, USA. It was conducted at the Computer Vision Laboratory in the Department of Computer Science at Columbia
University.

Contents
1 Why is Skin Appearance Important? 1
2 What is Skin? 3
3 Taxonomy of Human Skin Appearance 5
3.1 Micro Scale . . . . . . . . . . . . . . . . . . . . . . . . . . . . . . . . . . . . . . . . . 5
3.2 Meso Scale . . . . . . . . . . . . . . . . . . . . . . . . . . . . . . . . . . . . . . . . . 7
3.3 Macro Scale . . . . . . . . . . . . . . . . . . . . . . . . . . . . . . . . . . . . . . . . . 8
4 Physiology and Anatomy of Human Skin 8
4.1 Level 1: Cellular Level Elements . . . . . . . . . . . . . . . . . . . . . . . . . . . . . . 9
4.1.1 Cells . . . . . . . . . . . . . . . . . . . . . . . . . . . . . . . . . . . . . . . . 9
4.1.2 Fibers . . . . . . . . . . . . . . . . . . . . . . . . . . . . . . . . . . . . . . . . 11
4.1.3 Chromophores . . . . . . . . . . . . . . . . . . . . . . . . . . . . . . . . . . . 13
4.2 Level 2: Skin Layers . . . . . . . . . . . . . . . . . . . . . . . . . . . . . . . . . . . . 13
4.2.1 Epidermis . . . . . . . . . . . . . . . . . . . . . . . . . . . . . . . . . . . . . . 14
4.2.2 Dermis . . . . . . . . . . . . . . . . . . . . . . . . . . . . . . . . . . . . . . . 15
4.2.3 Subcutis . . . . . . . . . . . . . . . . . . . . . . . . . . . . . . . . . . . . . . . 16
4.3 Level 3: Skin . . . . . . . . . . . . . . . . . . . . . . . . . . . . . . . . . . . . . . . . 16
4.3.1 Skin Layers . . . . . . . . . . . . . . . . . . . . . . . . . . . . . . . . . . . . . 16
4.3.2 Hairs . . . . . . . . . . . . . . . . . . . . . . . . . . . . . . . . . . . . . . . . 17
4.3.3 Skin Surface Lipid . . . . . . . . . . . . . . . . . . . . . . . . . . . . . . . . . 18
4.3.4 Fine Wrinkle . . . . . . . . . . . . . . . . . . . . . . . . . . . . . . . . . . . . 18
4.4 Level 4: Skin Features . . . . . . . . . . . . . . . . . . . . . . . . . . . . . . . . . . . 19
4.4.1 Wrinkle . . . . . . . . . . . . . . . . . . . . . . . . . . . . . . . . . . . . . . . 20
4.4.2 Pore . . . . . . . . . . . . . . . . . . . . . . . . . . . . . . . . . . . . . . . . . 21
4.4.3 Freckle, Spot, and Mole . . . . . . . . . . . . . . . . . . . . . . . . . . . . . . 22
4.5 Level 5: Body Regions . . . . . . . . . . . . . . . . . . . . . . . . . . . . . . . . . . . 23
i

5 Models for Human Skin Appearance 25
5.1 Cellular Optics . . . . . . . . . . . . . . . . . . . . . . . . . . . . . . . . . . . . . . . 26
5.1.1 Absorption of Cellular Level Elements . . . . . . . . . . . . . . . . . . . . . . 27
5.1.2 Scattering from Cellular Level Elements . . . . . . . . . . . . . . . . . . . . . . 28
5.2 Cutaneous Optics . . . . . . . . . . . . . . . . . . . . . . . . . . . . . . . . . . . . . . 30
5.2.1 Optical Pathways in Skin . . . . . . . . . . . . . . . . . . . . . . . . . . . . . . 30
5.2.2 Optical Parameters for Scattering and Absorption . . . . . . . . . . . . . . . . . 32
5.2.3 Models for Light Transport in Skin . . . . . . . . . . . . . . . . . . . . . . . . 38
5.3 BRDF and BSSRDF . . . . . . . . . . . . . . . . . . . . . . . . . . . . . . . . . . . . 44
5.3.1 BRDF . . . . . . . . . . . . . . . . . . . . . . . . . . . . . . . . . . . . . . . . 44
5.3.2 BSSRDF . . . . . . . . . . . . . . . . . . . . . . . . . . . . . . . . . . . . . . 52
5.4 BTF . . . . . . . . . . . . . . . . . . . . . . . . . . . . . . . . . . . . . . . . . . . . . 59
5.5 Appearance of Body Regions and Body Parts . . . . . . . . . . . . . . . . . . . . . . . 62
6 Summary 66
ii
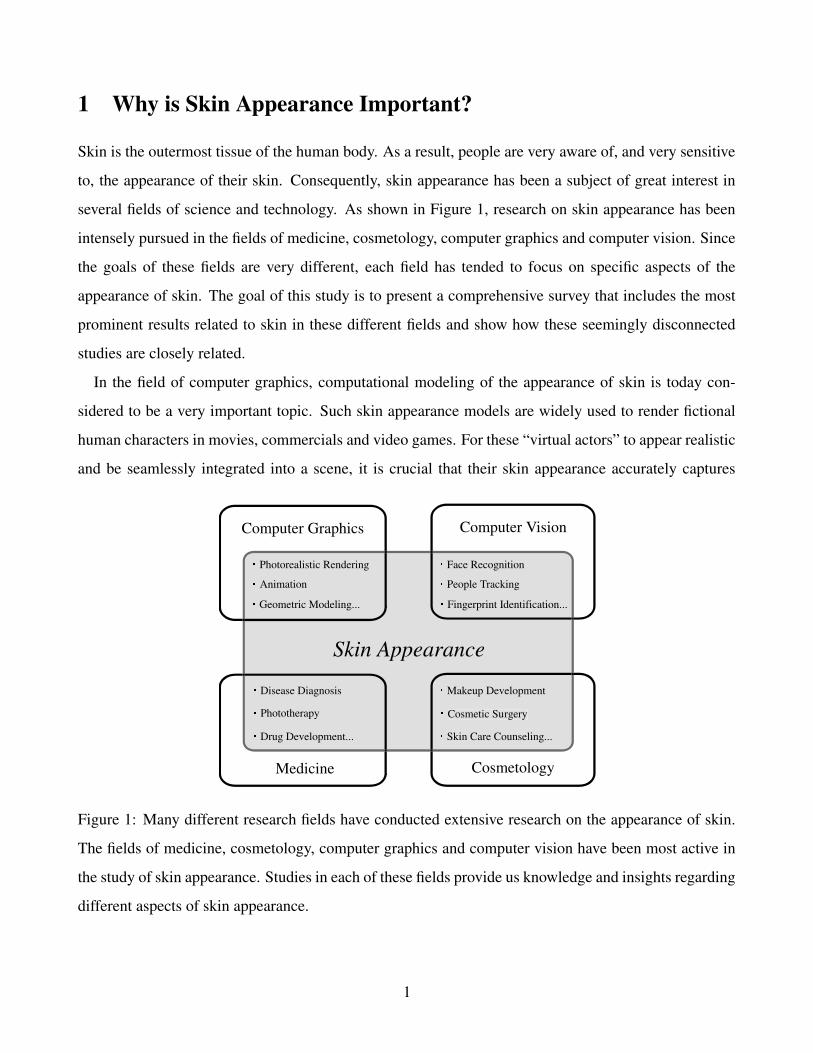
1 Why is Skin Appearance Important?
Skin is the outermost tissue of the human body. As a result, people are very aware of, and very sensitive
to, the appearance of their skin. Consequently, skin appearance has been a subject of great interest in
several fields of science and technology. As shown in Figure 1, research on skin appearance has been
intensely pursued in the fields of medicine, cosmetology, computer graphics and computer vision. Since
the goals of these fields are very different, each field has tended to focus on specific aspects of the
appearance of skin. The goal of this study is to present a comprehensive survey that includes the most
prominent results related to skin in these different fields and show how these seemingly disconnected
studies are closely related.
In the field of computer graphics, computational modeling of the appearance of skin is today con-
sidered to be a very important topic. Such skin appearance models are widely used to render fictional
human characters in movies, commercials and video games. For these “virtual actors” to appear realistic
and be seamlessly integrated into a scene, it is crucial that their skin appearance accurately captures
� Cosmetic Surgery
Skin Appearance
Computer Graphics Computer Vision
Medicine
� Cosmetic Surgery
Cosmetology
� Makeup Development
� Skin Care Counseling...
� Disease Diagnosis
� Photorealistic Rendering� Animation
� Face Recognition� People Tracking
� Phototherapy
� Drug Development...
� Geometric Modeling... � Fingerprint Identification...
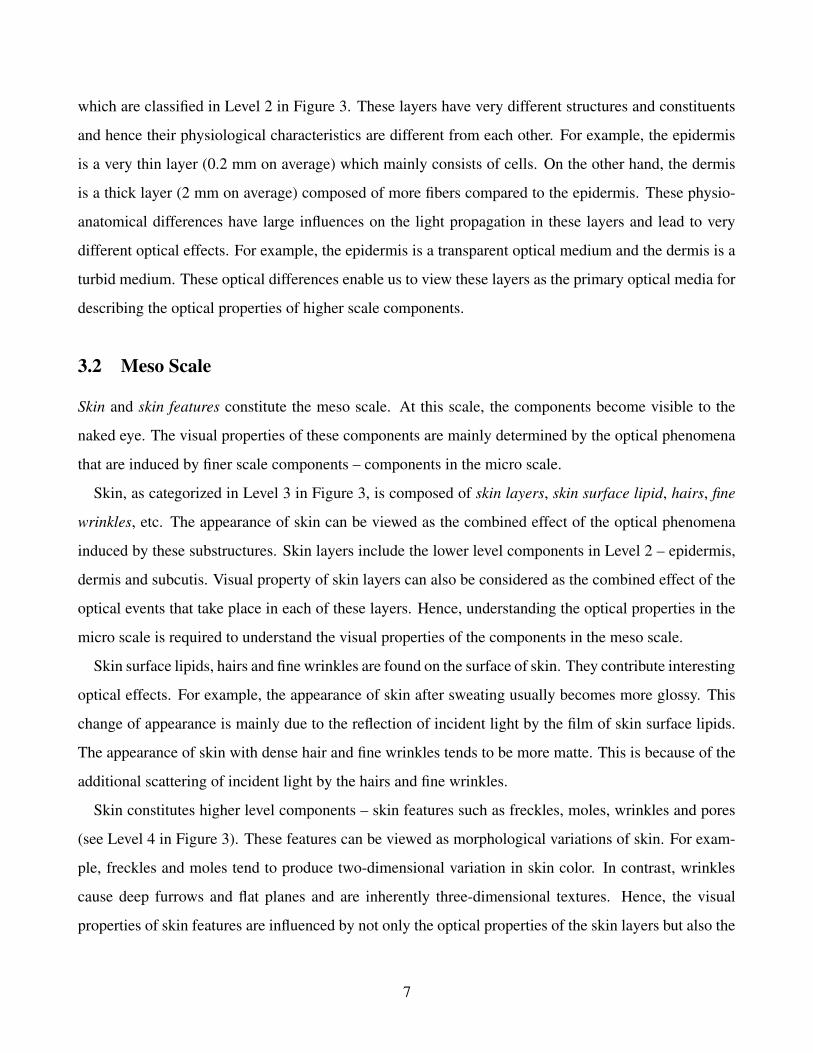
Figure 1: Many different research fields have conducted extensive research on the appearance of skin.
The fields of medicine, cosmetology, computer graphics and computer vision have been most active in
the study of skin appearance. Studies in each of these fields provide us knowledge and insights regarding
different aspects of skin appearance.
1

all the subtleties of actual human skin under various viewing and lighting conditions. Although great
progress has been made in making rendered skin appear realistic, it is still far from perfect and is easily
recognized as being rendered rather than real. In short, a computationally efficient and yet realistic skin
model remains an open problem in computer graphics.
In computer vision, a detailed and accurate model of skin appearance is of great value in identifying
individuals. For instance, human identification based on fingerprints has made substantial progress and
is now a widely used biometric technology. It is now widely acknowledged that accurate models of
the appearance of skin in other parts of the body could be useful for human identification as well. For
instance, technologies that recognize the pattern of blood vessels in the palm and the finger have been re-
cently developed and have shown good performance in identification. In order to reliably exploit similar
signatures of skin appearance from other body regions, we need a more comprehensive understanding
of the visual characteristics of skin.
Skin also has aesthetic relevance. The desire to have beautiful and healthy looking skin has been
a centuries-old quest for humans. Skin with brighter complexion and smoother surface tends to be
perceived as being healthier and more attractive. Making skin appear beautiful is the primary goal of
cosmetology. For instance, foundations are widely used to hide skin imperfections and make skin look
younger. Despite the enormous investments made in skin research, today’s foundations are far from
perfect. While they may hide imperfections and make skin appear more uniform, the final appearance of
skin coated with a foundation always has an artificial look to it. Recently, skin counseling systems have
been developed to help a person identify cosmetic products that would be most suited to them. Such
systems can also benefit from more accurate and detailed models of skin appearance.
Needless to say, the appearance of skin is of vital importance to the field of medicine. During the
diagnosis of skin diseases, careful observation and assessment of the appearance of the diseased area
is always the first and most important step. Recently, photo-diagnosis and photo-therapy have become
popular methods for treating skin diseases. In these techniques, light is used to detect and treat lesions in
the skin. Such techniques are non-invasive and hence patients are not subjected to pain and scars during
the treatment. In order to increase the precision of such systems, we need more precise models of the
interaction of light with dermal tissues.
In this survey, we will summarize and relate studies on skin appearance conducted in the above fields.
Our goal is to present the disconnected works in these different areas within a single unified framework.
2
In each of the above fields, the optical behaviors of specific skin components have been studied from the
viewpoint of the specific objectives of the field. However, the different components of skin produce dif-
ferent types of optical phenomena that are determined by their physio-anatomical characteristics (sizes,
shapes and functions of the components). The final appearance of skin has contributions from complex
optical interactions of many different skin components with light. In order to view these interactions in
a unified manner, it is meaningful to describe and categorize past works based on the physiological and
anatomical characteristics of the various skin components. To this end, we will first outline the physio-
anatomical characteristics of skin that are important to its appearance. Then, we will review previous
studies that have been conducted on each of the structural components of skin.
We will start our survey by describing the basic functions of human skin in Section 2. This knowledge
is necessary to understand the physio-anatomical properties of the components of skin. In Section 3, we
will propose a taxonomy of skin appearance that serves as the basic structure of our survey. In this tax-
onomy, we summarize the important physio-anatomical components of skin and the optical phenomena
they produce. In Section 4, we will describe in detail the physio-anatomical structure and character of
each skin component. In Section 5, we will review studies on skin appearance that have been conducted
in the four fields shown in Figure 1. We hope our survey will have two effects. The first is to broaden
and deepen the reader’s understanding of skin appearance. The second is to spur new interdisciplinary
research on skin appearance.
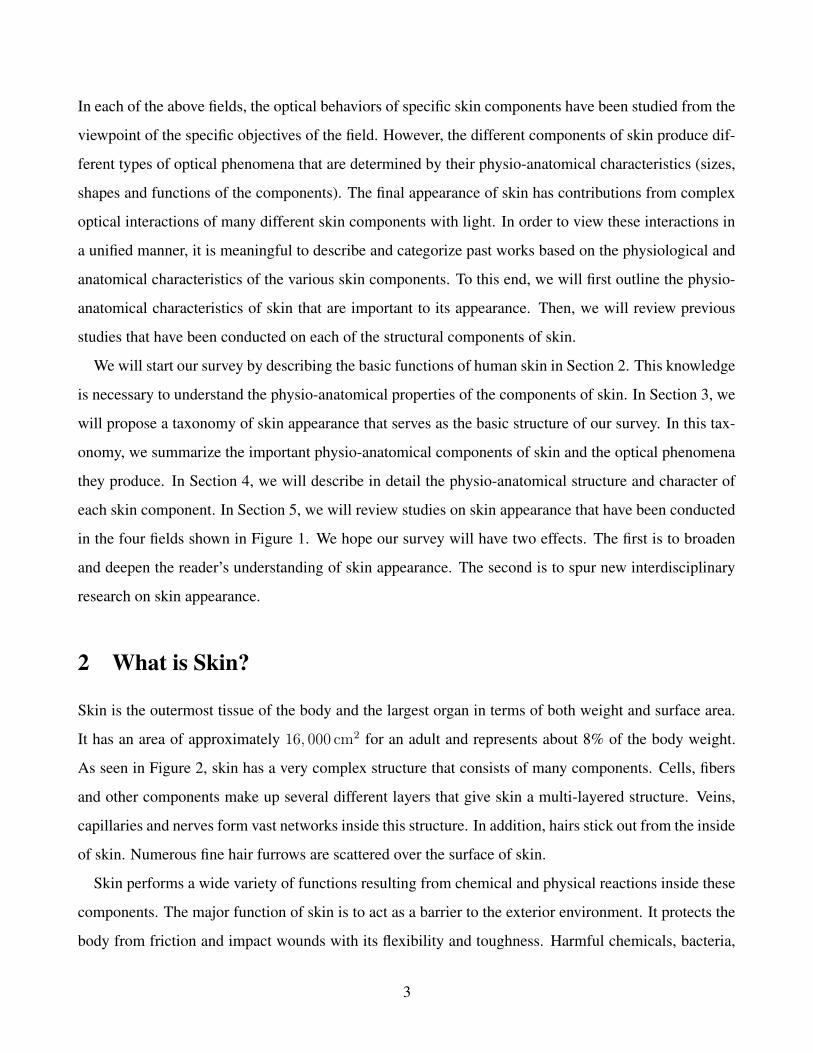
2 What is Skin?
Skin is the outermost tissue of the body and the largest organ in terms of both weight and surface area.
It has an area of approximately 16, 000 cm2 for an adult and represents about 8% of the body weight.
As seen in Figure 2, skin has a very complex structure that consists of many components. Cells, fibers
and other components make up several different layers that give skin a multi-layered structure. Veins,
capillaries and nerves form vast networks inside this structure. In addition, hairs stick out from the inside
of skin. Numerous fine hair furrows are scattered over the surface of skin.
Skin performs a wide variety of functions resulting from chemical and physical reactions inside these
components. The major function of skin is to act as a barrier to the exterior environment. It protects the
body from friction and impact wounds with its flexibility and toughness. Harmful chemicals, bacteria,
3

Figure 2: A cross-sectional schematic diagram of skin. Skin is a complex multi-layered tissue consisting
of various types of components, including veins, capillaries, hairs, cells, fibers, etc. (Image courtesy of
A.D.A.M.)
viruses and ultraviolet light are also prevented from entering the body by the skin. It also prevents water
loss and regulates body temperature by blood flow and evaporation of sweat. These functionalities are
critical to our well being. The secretion of sweat and skin lipid cause the elimination of a number of
harmful substances resulting from metabolic activities in the intestines and the liver. Furthermore, skin
has a large amount of nerve fibers and nerve endings that enable it to act as a sensory organ. When skin
is exposed to sunlight, it can produce vitamin D, an imperative chemical substance for the body [139].
These functions of skin tend to vary in degrees according to age, race, gender and individual. For
instance, older skin tends to lose its flexibility and toughness because the structure of skin slowly de-
natures with age. Negroid or Mongoloid skin have higher light-protection ability than Caucasian skin
because of the differences in the volume of melanin, which absorbs ultraviolet light. These functional
differences are in most cases a result of physio-anatomical variations within the structure of skin. It is
these physio-anatomical variations that lead to the diverse appearances of skin. Hence, in order to under-
stand the appearance of skin, it is crucial to understand the physiology and anatomy of skin. In the next
section, we will present a taxonomy of skin appearance that is based on physiology and anatomy. Then,
4
in Section 4, we will use this taxonomy to describe the physio-anatomical properties of the various skin
components.
3 Taxonomy of Human Skin Appearance
In order to understand the appearance of skin, it is important to understand the optical/visual properties
of the constituent components of skin. In this section, we present a hierarchical representation of skin
components that is based on the scale of the optical processes induced by the components.
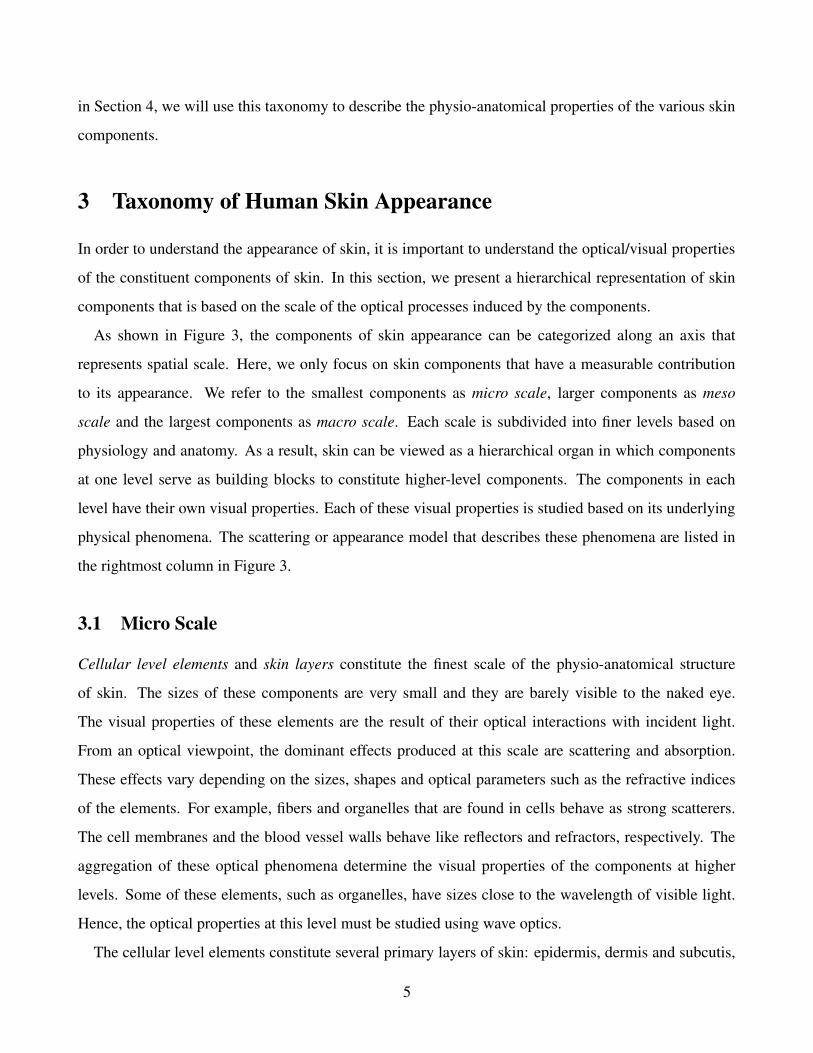
As shown in Figure 3, the components of skin appearance can be categorized along an axis that
represents spatial scale. Here, we only focus on skin components that have a measurable contribution
to its appearance. We refer to the smallest components as micro scale, larger components as meso
scale and the largest components as macro scale. Each scale is subdivided into finer levels based on
physiology and anatomy. As a result, skin can be viewed as a hierarchical organ in which components
at one level serve as building blocks to constitute higher-level components. The components in each
level have their own visual properties. Each of these visual properties is studied based on its underlying
physical phenomena. The scattering or appearance model that describes these phenomena are listed in
the rightmost column in Figure 3.
3.1 Micro Scale
Cellular level elements and skin layers constitute the finest scale of the physio-anatomical structure
of skin. The sizes of these components are very small and they are barely visible to the naked eye.
The visual properties of these elements are the result of their optical interactions with incident light.
From an optical viewpoint, the dominant effects produced at this scale are scattering and absorption.
These effects vary depending on the sizes, shapes and optical parameters such as the refractive indices
of the elements. For example, fibers and organelles that are found in cells behave as strong scatterers.
The cell membranes and the blood vessel walls behave like reflectors and refractors, respectively. The
aggregation of these optical phenomena determine the visual properties of the components at higher
levels. Some of these elements, such as organelles, have sizes close to the wavelength of visible light.
Hence, the optical properties at this level must be studied using wave optics.
The cellular level elements constitute several primary layers of skin: epidermis, dermis and subcutis,
5

Figure 3: Taxonomy of the appearance of skin. The components of skin appearance can be hierarchically
categorized along an axis that represents physical scale. We review the studies on skin appearance done
in different fields based on this taxonomy.
6
which are classified in Level 2 in Figure 3. These layers have very different structures and constituents
and hence their physiological characteristics are different from each other. For example, the epidermis
is a very thin layer (0.2 mm on average) which mainly consists of cells. On the other hand, the dermis
is a thick layer (2 mm on average) composed of more fibers compared to the epidermis. These physio-
anatomical differences have large influences on the light propagation in these layers and lead to very
different optical effects. For example, the epidermis is a transparent optical medium and the dermis is a
turbid medium. These optical differences enable us to view these layers as the primary optical media for
describing the optical properties of higher scale components.
3.2 Meso Scale
Skin and skin features constitute the meso scale. At this scale, the components become visible to the
naked eye. The visual properties of these components are mainly determined by the optical phenomena
that are induced by finer scale components – components in the micro scale.
Skin, as categorized in Level 3 in Figure 3, is composed of skin layers, skin surface lipid, hairs, fine
wrinkles, etc. The appearance of skin can be viewed as the combined effect of the optical phenomena
induced by these substructures. Skin layers include the lower level components in Level 2 – epidermis,
dermis and subcutis. Visual property of skin layers can also be considered as the combined effect of the
optical events that take place in each of these layers. Hence, understanding the optical properties in the
micro scale is required to understand the visual properties of the components in the meso scale.
Skin surface lipids, hairs and fine wrinkles are found on the surface of skin. They contribute interesting
optical effects. For example, the appearance of skin after sweating usually becomes more glossy. This
change of appearance is mainly due to the reflection of incident light by the film of skin surface lipids.
The appearance of skin with dense hair and fine wrinkles tends to be more matte. This is because of the
additional scattering of incident light by the hairs and fine wrinkles.
Skin constitutes higher level components – skin features such as freckles, moles, wrinkles and pores
(see Level 4 in Figure 3). These features can be viewed as morphological variations of skin. For exam-
ple, freckles and moles tend to produce two-dimensional variation in skin color. In contrast, wrinkles
cause deep furrows and flat planes and are inherently three-dimensional textures. Hence, the visual
properties of skin features are influenced by not only the optical properties of the skin layers but also the
7
morphology of skin.
3.3 Macro Scale
Body regions and body parts are classified as macro scale and physiologically assigned to Level 5 and
Level 6, respectively (see Figure 3). The appearance of skin varies across different regions of the body.
This is because the physio-anatomical characteristics of the lower-level components can differ signif-
icantly from one region of the body to another. For example, the nose and the forehead have greater
amounts of skin surface lipid compared to the cheek. As a result, the nose and the forehead tend to
appear more glossy than the cheek. To our knowledge, there are no physical models that describe these
appearance variations over the body in a unified framework. Body parts such as the face, arm, leg
and torso are clusters of body regions. The appearance of each body part includes the appearances of
the body regions that constitute it. Again, we are not aware of any physical or empirical models for
describing part appearances.
It is interesting to note that the four fields that have been involved in skin research have tended to focus
on different scales or levels of skin appearance. In computer graphics and computer vision, components
in the visible scale have been studied. This is because the main objectives in these fields are to render
and recognize skin appearance. Thus, previous work in graphics and vision provide us with knowledge
about the visual properties of skin mainly at the meso and macro scales. On the other hand, research
in medicine has focused on smaller scale elements. This is because skin diseases are usually caused by
disorders in the micro scale components. Thus, past work in medicine provides us with knowledge about
the optical properties of skin at the micro scale. By reviewing work in these different fields, we can span
all the scales of skin appearance and, at the same time, describe all of the previous works in a consistent
manner.
4 Physiology and Anatomy of Human Skin
The optical and visual properties of skin components at each level of our taxonomy (Figure 3) differ
significantly depending on their physio-anatomical characteristics. For example, light scattering behav-
iors of cells and fibers (Level 1) depend on their sizes and shapes. Light propagation in the skin layers,
i.e. the epidermis and the dermis (Level 2), are very different since their structures, densities and thick-
8
nesses vary greatly. Reflection at the surface of skin is influenced by the morphological characteristics
of fine wrinkles (Level 3). The appearance of wrinkles themselves also depend on their morphological
characteristics such as depth, width and density variations. Most of these optical and visual properties
are different for different body regions (Level 5) and body parts (Level 6) since the physio-anatomical
characteristics of the lower-level components (Levels 1 to 4) vary across the body. The above examples
are used to convey the importance of understanding the physio-anatomical properties of each of the skin
components.
4.1 Level 1: Cellular Level Elements
Although skin is composed of various types of cellular level elements, cells, fibers and chromophores are
of special relevance to us. This is because light scattering and absorption in these fundamental elements
are the building blocks of the gross optical phenomena observed at the cellular level.
4.1.1 Cells
Skin includes various types of cells. The main cells are keratinocyte, fibroblast, fat cell, melanocyte and
erythrocyte. These cells are present in different locations and have different structures and functions.
Keratinocytes are quantitatively the dominant constituent cells in the epidermis. These cells produce
fibriform proteins called keratin which contribute to the rigidity of the outermost layer of skin. Kera-
tionocytes protect the body from the external environment, for instance from stimulation, friction and
viruses, while retaining moisture. Keratinocytes can be further categorized into four types of cells based
on their functions and structures: basal cells, prickle cells, granular cells and horny cells. Although
these cells have the same origin, they have different shapes, functions and subcellular level elements
called organelles. For example, the basal cell, which reproduces keratinocytes, is a cylindrical and soft
living cell. On the other hand, the horny cell, which mainly acts as a protector from the external envi-
ronment, is a very flat and hard dead cell in which most organelles are degenerate.
Fibroblasts are long and narrow cells present in the dermis, the second skin layer beneath the epidermis.
They produce collagen and elastin fibers which are the primary constituents of the dermis.
Fat cells are quantitatively the most abundant cells of the dermis. These cells accumulate fat and their
sizes vary according to the volume of fat contained in them. These cells do not absorb much light. On
9
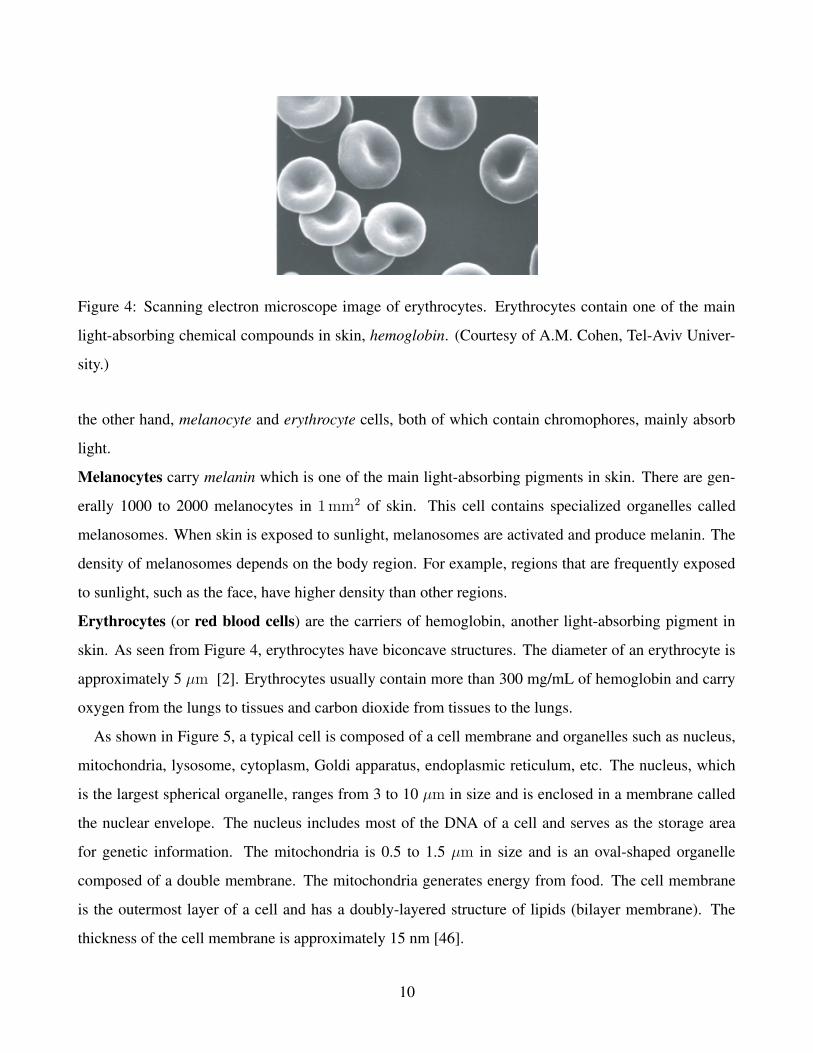
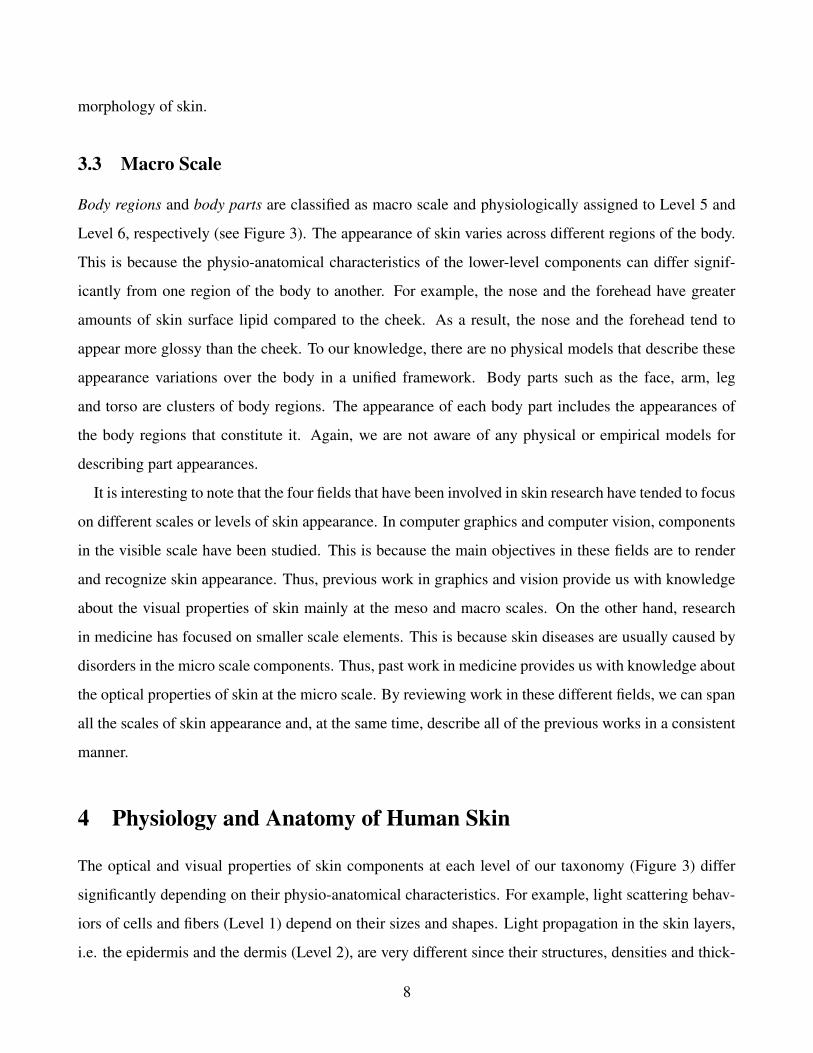
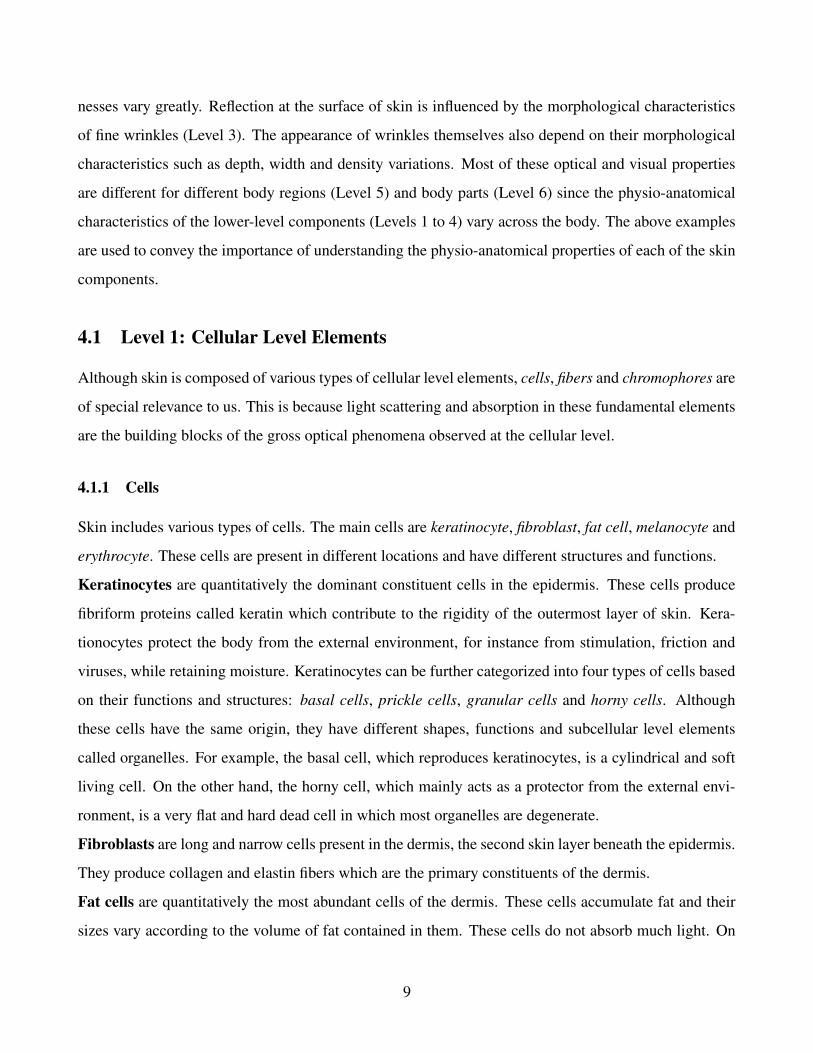
Figure 4: Scanning electron microscope image of erythrocytes. Erythrocytes contain one of the main
light-absorbing chemical compounds in skin, hemoglobin. (Courtesy of A.M. Cohen, Tel-Aviv Univer-
sity.)
the other hand, melanocyte and erythrocyte cells, both of which contain chromophores, mainly absorb
light.
Melanocytes carry melanin which is one of the main light-absorbing pigments in skin. There are gen-
erally 1000 to 2000 melanocytes in 1 mm2 of skin. This cell contains specialized organelles called
melanosomes. When skin is exposed to sunlight, melanosomes are activated and produce melanin. The
density of melanosomes depends on the body region. For example, regions that are frequently exposed
to sunlight, such as the face, have higher density than other regions.
Erythrocytes (or red blood cells) are the carriers of hemoglobin, another light-absorbing pigment in
skin. As seen from Figure 4, erythrocytes have biconcave structures. The diameter of an erythrocyte is
approximately 5 µm [2]. Erythrocytes usually contain more than 300 mg/mL of hemoglobin and carry
oxygen from the lungs to tissues and carbon dioxide from tissues to the lungs.
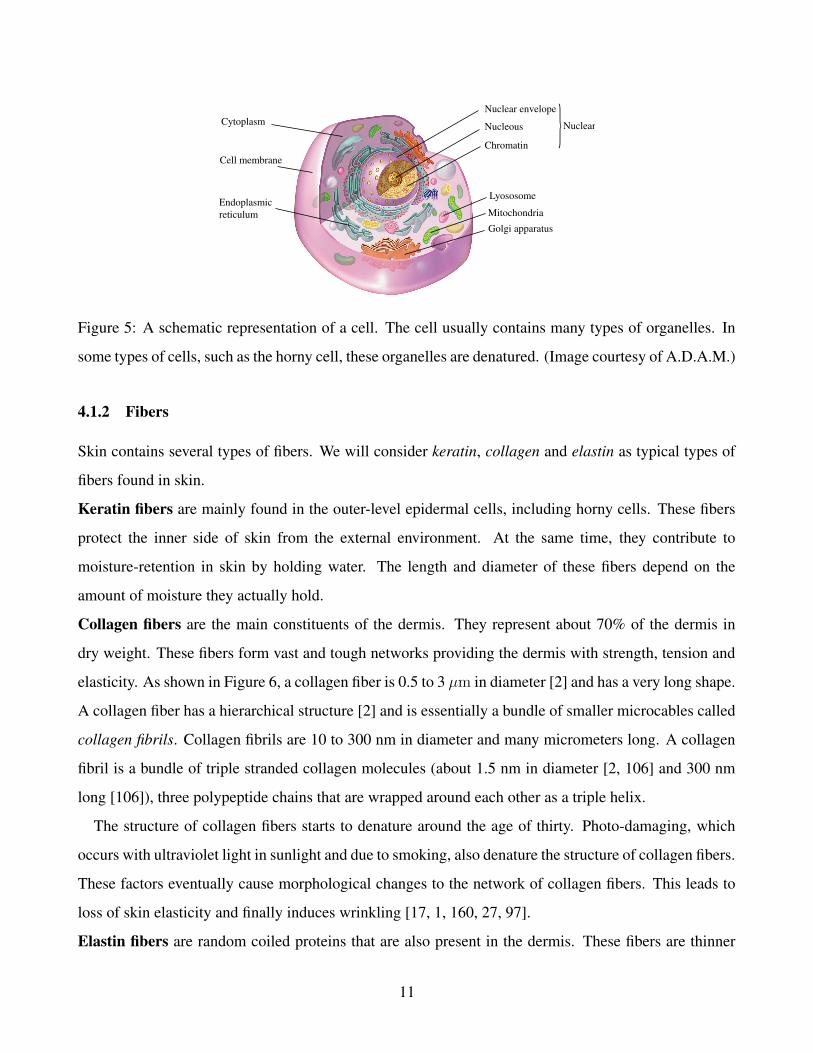
As shown in Figure 5, a typical cell is composed of a cell membrane and organelles such as nucleus,
mitochondria, lysosome, cytoplasm, Goldi apparatus, endoplasmic reticulum, etc. The nucleus, which
is the largest spherical organelle, ranges from 3 to 10 µm in size and is enclosed in a membrane called
the nuclear envelope. The nucleus includes most of the DNA of a cell and serves as the storage area
for genetic information. The mitochondria is 0.5 to 1.5 µm in size and is an oval-shaped organelle
composed of a double membrane. The mitochondria generates energy from food. The cell membrane
is the outermost layer of a cell and has a doubly-layered structure of lipids (bilayer membrane). The
thickness of the cell membrane is approximately 15 nm [46].
10
Nuclear envelope
Nucleous
Chromatin
Mitochondria
Golgi apparatus
LyososomeEndoplasmicreticulum
Cytoplasm
Cell membrane
}Nuclear
Figure 5: A schematic representation of a cell. The cell usually contains many types of organelles. In
some types of cells, such as the horny cell, these organelles are denatured. (Image courtesy of A.D.A.M.)
4.1.2 Fibers
Skin contains several types of fibers. We will consider keratin, collagen and elastin as typical types of
fibers found in skin.
Keratin fibers are mainly found in the outer-level epidermal cells, including horny cells. These fibers
protect the inner side of skin from the external environment. At the same time, they contribute to
moisture-retention in skin by holding water. The length and diameter of these fibers depend on the
amount of moisture they actually hold.
Collagen fibers are the main constituents of the dermis. They represent about 70% of the dermis in
dry weight. These fibers form vast and tough networks providing the dermis with strength, tension and
elasticity. As shown in Figure 6, a collagen fiber is 0.5 to 3 µm in diameter [2] and has a very long shape.
A collagen fiber has a hierarchical structure [2] and is essentially a bundle of smaller microcables called
collagen fibrils. Collagen fibrils are 10 to 300 nm in diameter and many micrometers long. A collagen
fibril is a bundle of triple stranded collagen molecules (about 1.5 nm in diameter [2, 106] and 300 nm
long [106]), three polypeptide chains that are wrapped around each other as a triple helix.
The structure of collagen fibers starts to denature around the age of thirty. Photo-damaging, which
occurs with ultraviolet light in sunlight and due to smoking, also denature the structure of collagen fibers.
These factors eventually cause morphological changes to the network of collagen fibers. This leads to
loss of skin elasticity and finally induces wrinkling [17, 1, 160, 27, 97].
Elastin fibers are random coiled proteins that are also present in the dermis. These fibers are thinner
11

collagen fibers
0.5 - 3µm
1µm
10 - 300µm
1.5nmtriple-strandedcollagen molecule
collagenfibril
single collagenpolypeptide chain
Figure 6: The structure of collagen fibers. Collagen fibers are composed of collagen fibrils that are
bundles of collagen molecules made of polypeptide chains. (From B. Alberts, D. Bray, A. Johnson,
J. Lewis, M. Raff, K. Roberts and P. Walter, Essential Cell Biology, 1998, c©1998 Garland Science
Publishing, Reprinted with permission [2].)
than collagen bundles (1 to 3 µm in diameter [106]). They occupy 2 to 4% of the total weight of the
dermis. An elastin fiber consists of two components – micro-fibrils and matrix elastin. The micro-fibrils
are aggregated at the periphery of elastic fiber (10 to 12 nm thick) and are also present within elastin
fibers as strands aligned along the longitudinal direction (15 to 80 nm thick) [106].
Elastin fibers provide skin with elasticity and resilience. Even though the volume of elastin fibers is
much smaller than that of collagen fibers, elastin fibers also play an important role in providing structural
support to the dermis. Similar to collagen fibers, aging and ultraviolet light degrade elastin fibers, which
finally leads to wrinkling. Elastin fibers are extensible and return to their original shapes after stretching.
This property is not found in collagen fibers [106].
12
4.1.3 Chromophores
Skin includes various types of light-absorbing chemical compounds called chromophores. Among these
chromophores, melanin and hemoglobin are especially important for understanding the appearance of
normal skin since they absorb light particularly in the visible wavelength range [6, 187].
Melanin is the dominant chromophore of the epidermis. It can also be found in hair. Melanin is first
produced in melanosomes, then is diffused into the epidermal layer, and moves up towards the surface
of skin while denaturing. Through this upward process, melanin changes its color from tan to white.
Melanin is divided into two types, eumelanin and pheomelanin, depending on its chemical structure.
Eumelanin is a black or dark brown chromophore usually found in dark hair and eyes. Pheomelanin is
yellow or reddish brown chromophore that is observed in red hair and feathers. Usually, normal skin
contains some amount of eumelanin. Therefore, in most studies on skin, “melanin” is referred to as
“eumelanin” [78].
The physiological function of melanin is to protect the inside of skin by absorbing and scattering
ultraviolet light. When exposed to sunlight, melanocytes start to produce melanin. This is the biological
reaction that eventually makes our skin appear tanned.
The color of skin depends on the fraction of the volume of the melanosomes. In the light colored
skin of Caucasians, the fraction is only between 1 and 3%. In the skins of well-tanned Caucasians and
Mediterraneans, the percentage increases to 11 to 16%. In dark colored African skin, it goes up to
43% [78].
Hemoglobin is a red colored chromophore found in erythrocytes. Hemoglobin represents 95% of the
dry mass of an erythrocyte. Hemoglobin binds oxygen effectively and carries oxygen to every body
site through vessels and capillaries. When hemoglobin contains oxygen, it is called oxy-hemoglobin.
Otherwise, it is called deoxy-hemoglobin. Usually, in the vein, more than 47% of the hemoglobin is
oxy-hemoglobin [7]. Oxy-hemoglobin is a brighter shade of red than deoxy-hemoglobin.
4.2 Level 2: Skin Layers
Cellular level elements (Level 1) form the three different skin layers: epidermis, dermis and subcutis.
These layers are composed of different types of cellular level elements. Hence, they are very different
in terms of structure and function. As a result, they exhibit different types of light propagation.
13
]]
Stratum corneum
Stratum basaleStratum spinosumStratum granulosum
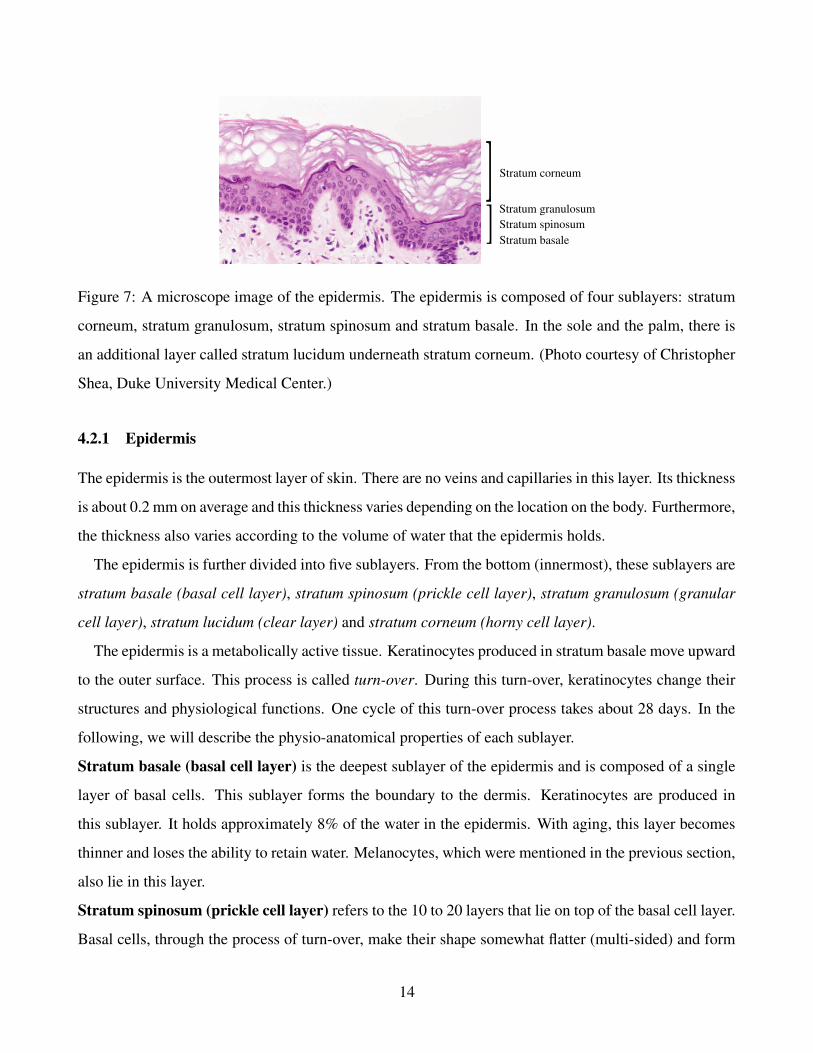
Figure 7: A microscope image of the epidermis. The epidermis is composed of four sublayers: stratum
corneum, stratum granulosum, stratum spinosum and stratum basale. In the sole and the palm, there is
an additional layer called stratum lucidum underneath stratum corneum. (Photo courtesy of Christopher
Shea, Duke University Medical Center.)
4.2.1 Epidermis
The epidermis is the outermost layer of skin. There are no veins and capillaries in this layer. Its thickness
is about 0.2 mm on average and this thickness varies depending on the location on the body. Furthermore,
the thickness also varies according to the volume of water that the epidermis holds.
The epidermis is further divided into five sublayers. From the bottom (innermost), these sublayers are
stratum basale (basal cell layer), stratum spinosum (prickle cell layer), stratum granulosum (granular
cell layer), stratum lucidum (clear layer) and stratum corneum (horny cell layer).
The epidermis is a metabolically active tissue. Keratinocytes produced in stratum basale move upward
to the outer surface. This process is called turn-over. During this turn-over, keratinocytes change their
structures and physiological functions. One cycle of this turn-over process takes about 28 days. In the
following, we will describe the physio-anatomical properties of each sublayer.
Stratum basale (basal cell layer) is the deepest sublayer of the epidermis and is composed of a single
layer of basal cells. This sublayer forms the boundary to the dermis. Keratinocytes are produced in
this sublayer. It holds approximately 8% of the water in the epidermis. With aging, this layer becomes
thinner and loses the ability to retain water. Melanocytes, which were mentioned in the previous section,
also lie in this layer.
Stratum spinosum (prickle cell layer) refers to the 10 to 20 layers that lie on top of the basal cell layer.
Basal cells, through the process of turn-over, make their shape somewhat flatter (multi-sided) and form
14
these layers. These cells are called prickle cells and have little spines on the outside of their membrane.
The thickness of this sublayer is typically from 50 to 150 µm [6].
Stratum granulosum (granular cell layer) is composed of 2 to 4 granular cell layers. The typical
thickness is 3 µm [6]. In this sublayer, cornification called keratinization of keratinocytes begins. In
this process, organelles such as nuclei and mitochondria start to resolve. Cells are increasingly filled
with keratin fibers and contain less moisture than basal and prickle cell layers. The shape of these cells
becomes much flatter during this process.
Stratum lucidum (clear layer) can only be found in soles and palms. It is a highly refractive sublayer.
Its cells become flatter and more densely packed during turn-over.
Stratum corneum (horny cell layer) is the exterior sublayer of the epidermis. Its thickness ranges
from 8 to 15 µm [6]. This sublayer is composed of several layers of hexagonal-shaped flat and hard
cells named horny cells or corneocytes. These are dry dead cells without organelles and filled with
keratin fibers. This sublayer prevents excessive dehydration of the skin tissue and usually contains
10 to 15% of the mass of water in the epidermis, depending on the skin condition. Horny cells are
surrounded by intercellular lipids. A principal constituent is ceramide, which plays a crucial role in
water retention [103]. Horny cells also contain special chemical compounds called natural moisturizing
factor (NMF) that also plays an important role in retaining skin moisture. NMF is composed of sodium
PCA, sphinolipids and ceramides, phospholipids, fatty acids, glycerol, squalane and cholesterol [103].
Skin that lacks NMF and ceramide tends to be very dry.
4.2.2 Dermis
The dermis is the second layer of skin, beneath the epidermal layer. This layer is much thicker than the
epidermis (usually 1 to 4 mm [6]). The main components of the dermis are collagen and elastin fibers.
Compared to the epidermis, there are much fewer cells and much more fibers in the dermis. Dermis has
the following two sublayers.
Papillary layer is the upper sublayer of the dermis that is clearly demarcated from the epidermis. This
sublayer is a loosely connected tissue and includes a large amount of nerve fibers, capillaries, water and
cells (e.g fibroblasts). In this sublayer, collagen fibers form a finer network than those of the reticular
layer [32].
Reticular layer constitutes the lower part of the dermis and represents a continuous transition to the
15
subcutis. This sublayer has a denser and thicker network than the papillary layer and includes fewer
nerve fibers and capillaries. In this sublayer, collagen fibers are aggregated into thick bundles which are
mostly aligned parallel to the surface of skin [32].
The micro-anatomical complexity of skin, particularly in Level 1, makes quantitative analysis of the
optical properties of skin difficult. However, it can be significantly simplified by considering the physio-
anatomical characteristics of each skin layers. As mentioned above, the epidermis and the dermis are
very different in composition, thickness and functions. Hence, these two layers can be considered to be
independent of each other in terms of optical behaviors. Indeed, the epidermis and the dermis are viewed
as independent optical media in many early studies on skin optics. For example, melanin is present only
in the epidermis. On the other hand, hemoglobin is found only in the dermis since there are no veins and
capillaries in the epidermis. Hence, the epidermis can be essentially viewed as a melanin layer and the
dermis can be viewed as a hemoglobin layer when analyzing the absorption properties of skin.
4.2.3 Subcutis
Subcutis, or hypodermis in histology, is the third layer beneath the dermis. It is important to note that it
is not categorized as another skin layer. Subcutis is an elastic layer and includes a large amount of fat
cells that work as a shock absorber for blood vessels and nerve endings. The thickness of this layer is
reported to be 4 to 9 mm on average. However, the actual thickness differs from person to person and
also depends on the body region.
4.3 Level 3: Skin
Skin is mainly composed of skin layers, fine wrinkles, hairs and skin surface lipids. Skin layers are the
main component of skin. Fine wrinkles, hairs and skin surface lipids are observed on the outermost
surface of skin. These components exhibit very different optical behaviors according to their structures.
We now give details of the physio-anatomical characteristics of these components.
4.3.1 Skin Layers
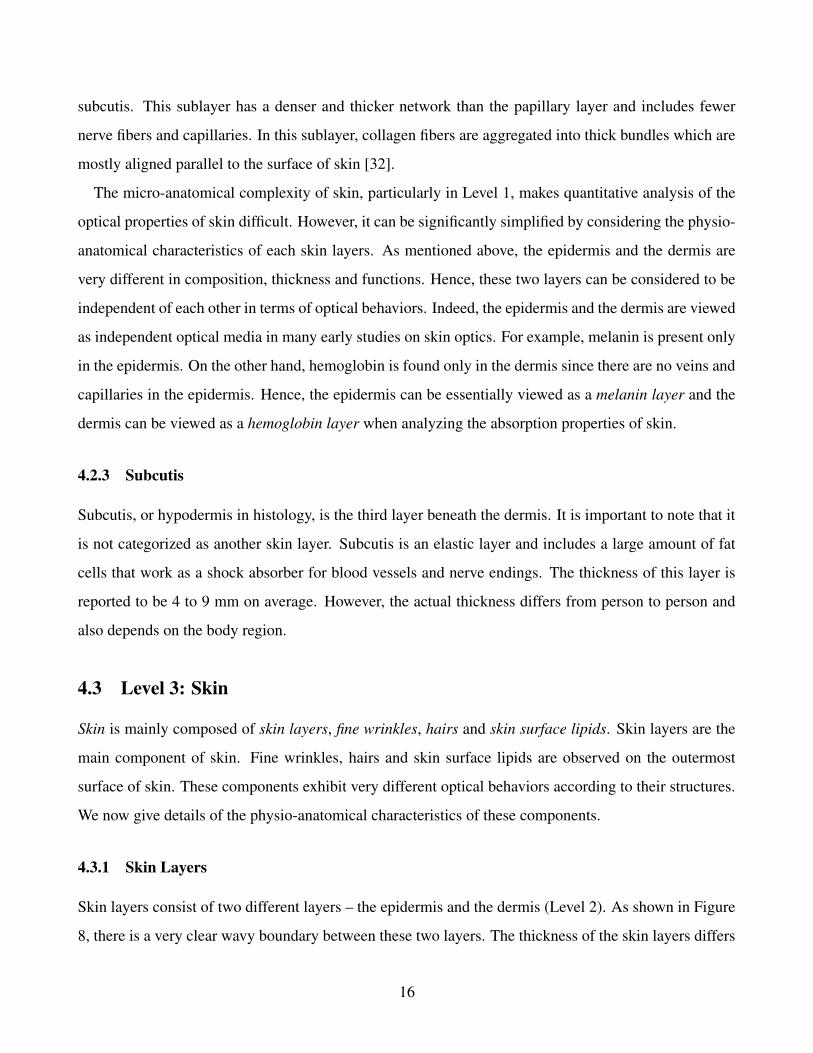
Skin layers consist of two different layers – the epidermis and the dermis (Level 2). As shown in Figure
8, there is a very clear wavy boundary between these two layers. The thickness of the skin layers differs
16
Epidermis
Dermis
Figure 8: Skin layers consist of the epidermis and the dermis. (Photo courtesy of Christopher Shea,
Duke University Medical Center.)
quite a bit depending on gender, age, individual, body regions, etc. It has been found that males tend
to have thicker skin layers than females [132]. On the other hand, while several studies on the relation
between age and the thickness of the skin layers have been reported [60, 102, 42], a clear relationship
has not yet been found. Conditions of skin such as water-retention also differ depending on region, age
and individual. For instance, skin layers of older people have less ability for water-retention, since the
NMF tends to decrease with age. It has also been reported that the transparency of the stratum corneum
(the outermost sublayer of the epidermis) decreases with the amount of water contained in it [133].
4.3.2 Hairs
Hairs behave as strong scatterers of light and affect the surface reflection of skin. Hairs are distributed
all over the surface of the body except for the palms of the hands, the soles of the feet, the tops of the
feet and mucocutaneous junctions [139, 74]. Hair grows from a hair follicle which resides in the dermal
layer and opens onto the surface of skin. The bottom end of a hair follicle sits close to the boundary
between the dermis and the subcutis. The color of hair is determined by the amount of eumelanin (dark
brown) or pheomelanin (yellow reddish brown) it contains. Hair that does not contain melanin is white.
Hair can be categorized into two types – terminal thick hair and vellus fine hair. Terminal hair is
usually hard and long (up to 3 feet long [151]). Examples include, the hair on the head, eyelashes,
17
and eyebrows. Vellus hairs, sometimes called “peachy fuzz”, are soft and short (approximately 1 mm
long [151]). They can be found on the cheek, forehead, arms, etc. In body regions that are covered with
vellus hair, the hair plays an important role in the visual appearance of the region.
4.3.3 Skin Surface Lipid
Skin surface lipid plays an important role in surface reflection from skin. It reflects incident light spec-
ularly and makes skin appearance shinier. Skin surface lipid can be observed in most body regions, but
its volume varies from one region to another. Furthermore, it also varies with respect to gender, age, etc.
Skin surface lipid forms a thin film called the skin surface lipid film (SSLF) on skin layers. The SSLF
protects excess evaporation of water from skin and keeps skin moisturized and smooth. The basis of the
SSLF is sebum, which is a yellowish oily liquid secreted by sebaceous glands. Sebaceous glands are
present in the dermal layer and are connected to hair follicles. They cover a large region of the face, the
middle of the back and the chest [139]. Although the contents of sebum vary depending on the body
region, the composition of sebum is roughly estimated to be 30% of free fatty acid, 33% of triglycerides,
15% of wax, 5% of sterol esters, 5% of squalene and 7% of paraffin [146]. After sebum is secreted,
it gets mixed with sweat and lipid. This results in an emulsified film over the surface of skin [146].
The SSLF spreads over the skin surface as an unevenly distributed amorphous sheet. The thickness of
the SSLF varies from one body region to another and is roughly estimated to range from 0.01 to 2.1
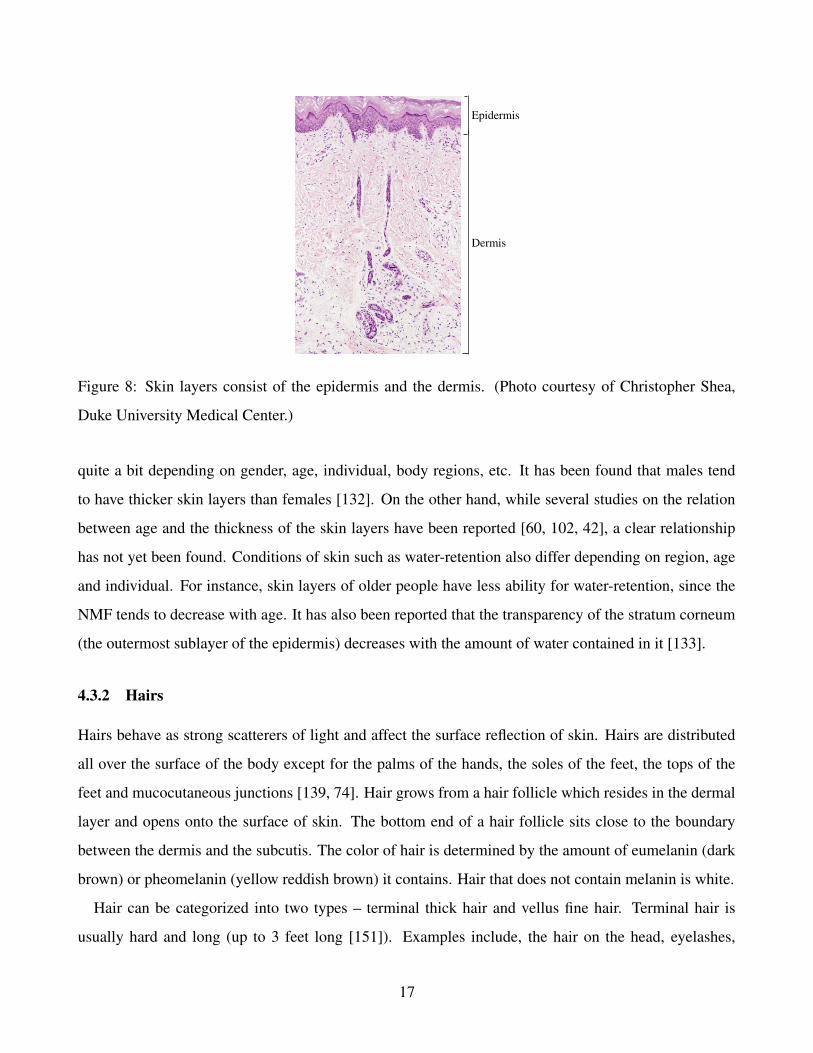
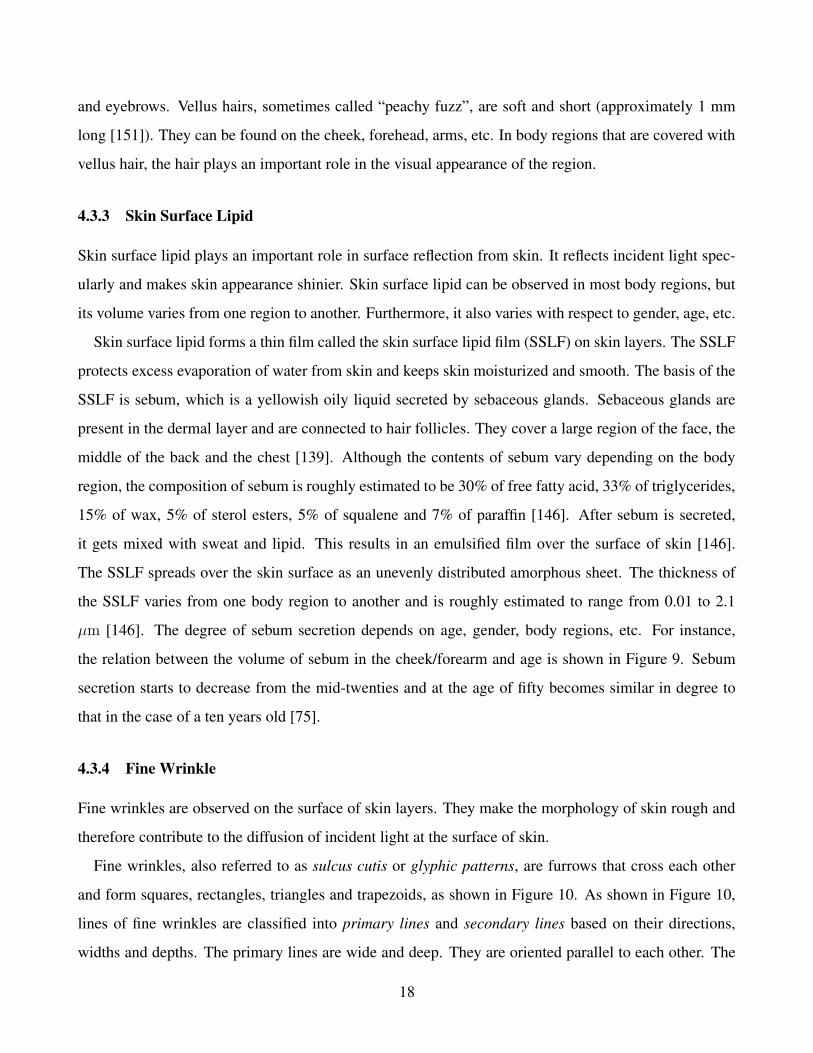
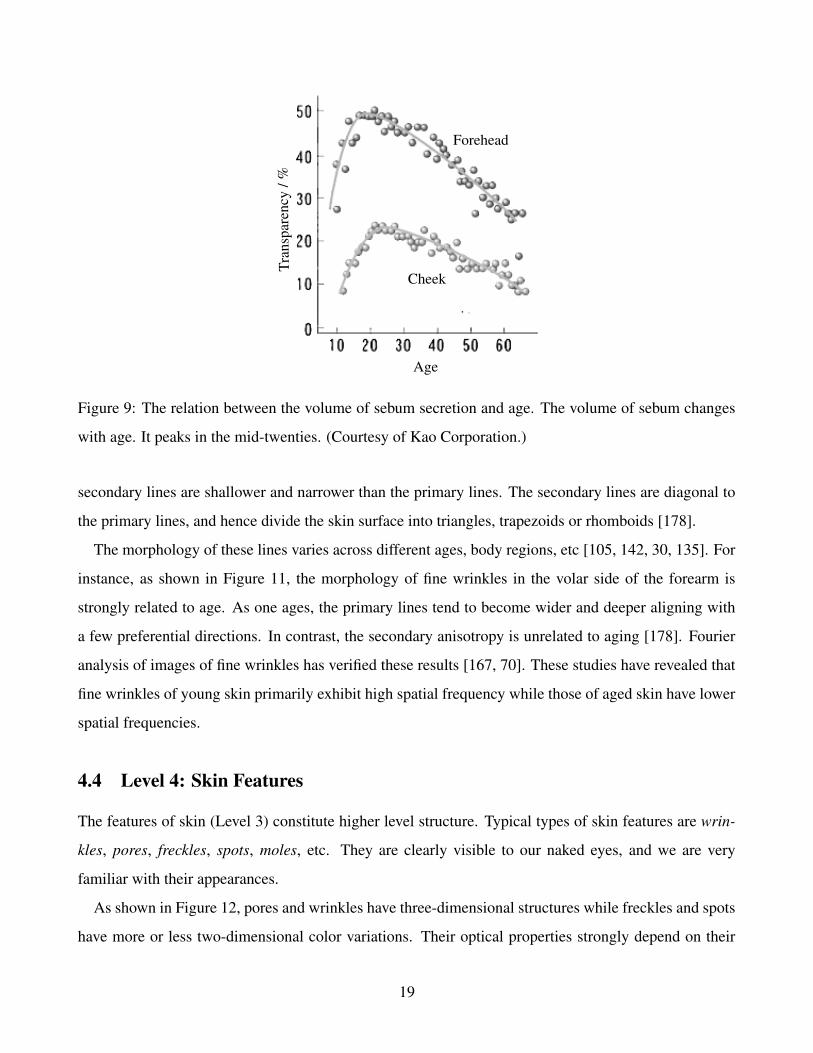
µm [146]. The degree of sebum secretion depends on age, gender, body regions, etc. For instance,
the relation between the volume of sebum in the cheek/forearm and age is shown in Figure 9. Sebum
secretion starts to decrease from the mid-twenties and at the age of fifty becomes similar in degree to
that in the case of a ten years old [75].
4.3.4 Fine Wrinkle
Fine wrinkles are observed on the surface of skin layers. They make the morphology of skin rough and
therefore contribute to the diffusion of incident light at the surface of skin.
Fine wrinkles, also referred to as sulcus cutis or glyphic patterns, are furrows that cross each other
and form squares, rectangles, triangles and trapezoids, as shown in Figure 10. As shown in Figure 10,
lines of fine wrinkles are classified into primary lines and secondary lines based on their directions,
widths and depths. The primary lines are wide and deep. They are oriented parallel to each other. The
18
Forehead
Cheek
Age
Tran
spar
ency
/%
Figure 9: The relation between the volume of sebum secretion and age. The volume of sebum changes
with age. It peaks in the mid-twenties. (Courtesy of Kao Corporation.)
secondary lines are shallower and narrower than the primary lines. The secondary lines are diagonal to
the primary lines, and hence divide the skin surface into triangles, trapezoids or rhomboids [178].
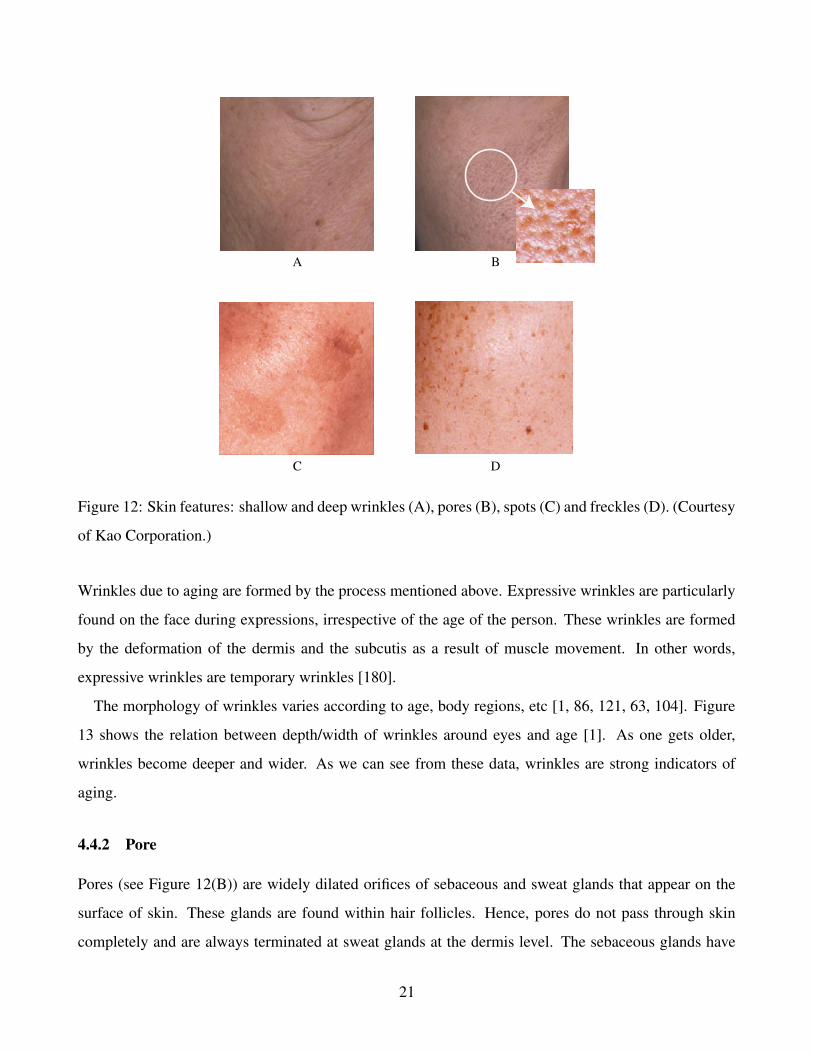
The morphology of these lines varies across different ages, body regions, etc [105, 142, 30, 135]. For
instance, as shown in Figure 11, the morphology of fine wrinkles in the volar side of the forearm is
strongly related to age. As one ages, the primary lines tend to become wider and deeper aligning with
a few preferential directions. In contrast, the secondary anisotropy is unrelated to aging [178]. Fourier
analysis of images of fine wrinkles has verified these results [167, 70]. These studies have revealed that
fine wrinkles of young skin primarily exhibit high spatial frequency while those of aged skin have lower
spatial frequencies.
4.4 Level 4: Skin Features
The features of skin (Level 3) constitute higher level structure. Typical types of skin features are wrin-
kles, pores, freckles, spots, moles, etc. They are clearly visible to our naked eyes, and we are very
familiar with their appearances.
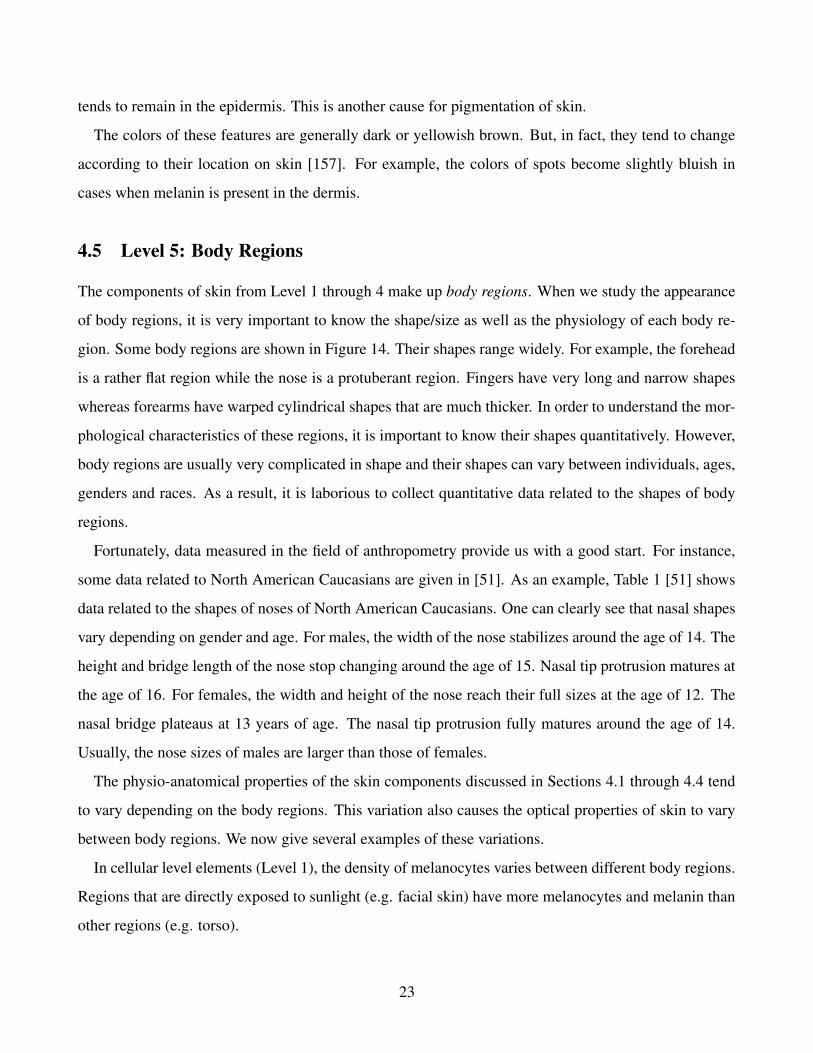
As shown in Figure 12, pores and wrinkles have three-dimensional structures while freckles and spots
have more or less two-dimensional color variations. Their optical properties strongly depend on their
19
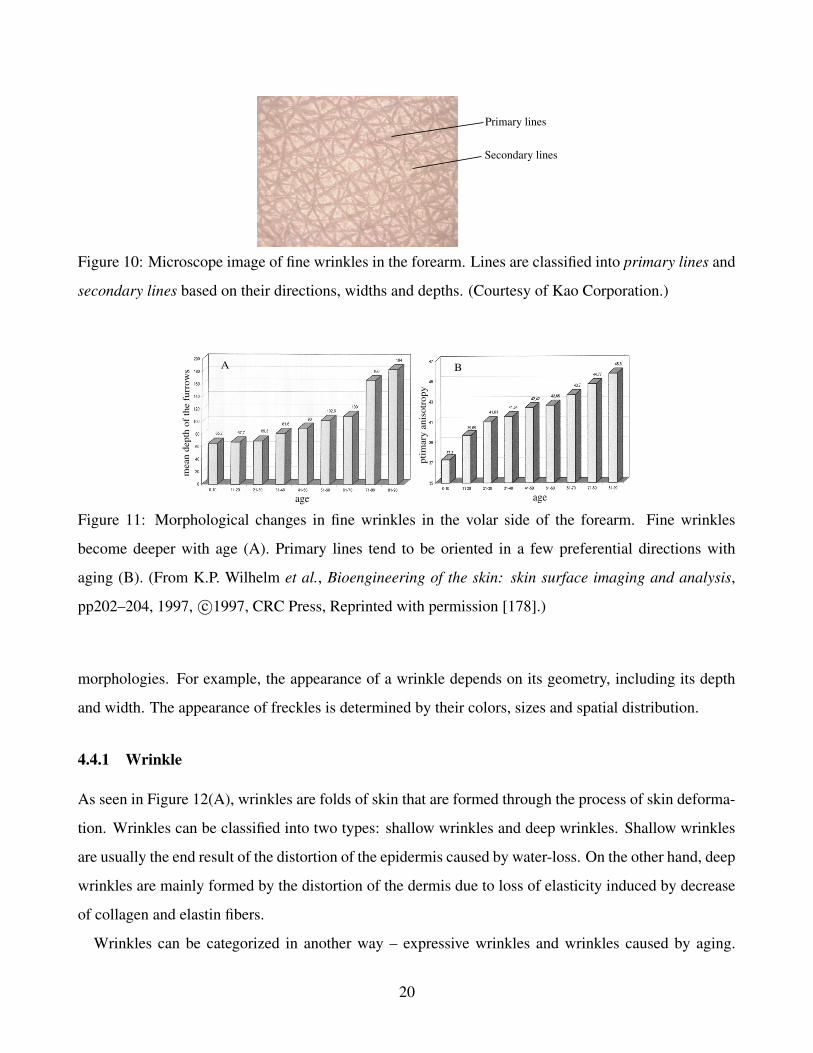
Primary lines
Secondary lines
Figure 10: Microscope image of fine wrinkles in the forearm. Lines are classified into primary lines and
secondary lines based on their directions, widths and depths. (Courtesy of Kao Corporation.)
age age
mea
nde
pth
ofth
efu
rrow
s
ptim
ary
anis
otro
py
A B
Figure 11: Morphological changes in fine wrinkles in the volar side of the forearm. Fine wrinkles
become deeper with age (A). Primary lines tend to be oriented in a few preferential directions with
aging (B). (From K.P. Wilhelm et al., Bioengineering of the skin: skin surface imaging and analysis,
pp202–204, 1997, c©1997, CRC Press, Reprinted with permission [178].)
morphologies. For example, the appearance of a wrinkle depends on its geometry, including its depth
and width. The appearance of freckles is determined by their colors, sizes and spatial distribution.
4.4.1 Wrinkle
As seen in Figure 12(A), wrinkles are folds of skin that are formed through the process of skin deforma-
tion. Wrinkles can be classified into two types: shallow wrinkles and deep wrinkles. Shallow wrinkles
are usually the end result of the distortion of the epidermis caused by water-loss. On the other hand, deep
wrinkles are mainly formed by the distortion of the dermis due to loss of elasticity induced by decrease
of collagen and elastin fibers.
Wrinkles can be categorized in another way – expressive wrinkles and wrinkles caused by aging.
20
A B
C D
Figure 12: Skin features: shallow and deep wrinkles (A), pores (B), spots (C) and freckles (D). (Courtesy
of Kao Corporation.)
Wrinkles due to aging are formed by the process mentioned above. Expressive wrinkles are particularly
found on the face during expressions, irrespective of the age of the person. These wrinkles are formed
by the deformation of the dermis and the subcutis as a result of muscle movement. In other words,
expressive wrinkles are temporary wrinkles [180].
The morphology of wrinkles varies according to age, body regions, etc [1, 86, 121, 63, 104]. Figure
13 shows the relation between depth/width of wrinkles around eyes and age [1]. As one gets older,
wrinkles become deeper and wider. As we can see from these data, wrinkles are strong indicators of
aging.
4.4.2 Pore
Pores (see Figure 12(B)) are widely dilated orifices of sebaceous and sweat glands that appear on the
surface of skin. These glands are found within hair follicles. Hence, pores do not pass through skin
completely and are always terminated at sweat glands at the dermis level. The sebaceous glands have
21

20s 30s 40s 50s 60s 70s 20s 30s 40s 50s 60s 70s0
200
400
600
800
1000
200
400
600
800A B
Age group Age group
Dep
th/µ
m
Wid
th/µ
m
Figure 13: Age-related changes in the depth (A) and width (B) of wrinkles at the eye corners. Age
groups: 20s, 20-29 years; 30s, 30-39 years; 40s; 40-49 years; 50s, 50-59 years; 60s, 60-69 years; 70s,
70-80 years (total number of samples = 101). (Courtesy of G. Imokawa, Figure 6 in S. Akazaki, H.
Nakazawa, H. Kazama, O. Osanai, M. Kawai, Y. Takema, and G. Imokawa, Age-related changes in skin
wrinkles assessed by a novel three-dimensional morphometric analysis, British Journal of Dermatology,
147, pp689-695, 2002, c©2002, Blackwell Publishing, Reprinted with permission [1].)
lobular structures and range in size from one region to another. Many pores can be formed in sebum-rich
regions such as the face, since pores are connected to sebaceous glands.
Pores act not only as the openings from which oil and sweat are secreted, but also serve as channels
that carry certain substances to the deeper dermal layer. This is the reason why materials applied to the
surface of skin with hair can penetrate more deeply into the skin than in the case of hairless skin [139].
4.4.3 Freckle, Spot, and Mole
As shown in Figure 12(C) and 12(D), freckles, spots and moles are dark brown marks that can be found
on the surface of skin. They have no specific shapes but usually have very clear contours. All of these
features are pigmentary deposits of melanin. As explained in Section 4.1.3, melanin is usually metab-
olized through the process of turn-over and is finally evacuated from the surface of skin. However,
this metabolism sometimes does not work well because of metabolic malfunctions caused by ultraviolet
light, stimulation, aging, etc. In such cases, melanin remains in the epidermis or penetrates into the
dermis and forms pigmentary deposits. Ultraviolet light, stimulation and aging sometimes cause exces-
sive production of melanin by melanocytes. In such cases, melanin cannot be evacuated completely and
22
tends to remain in the epidermis. This is another cause for pigmentation of skin.
The colors of these features are generally dark or yellowish brown. But, in fact, they tend to change
according to their location on skin [157]. For example, the colors of spots become slightly bluish in
cases when melanin is present in the dermis.
4.5 Level 5: Body Regions
The components of skin from Level 1 through 4 make up body regions. When we study the appearance
of body regions, it is very important to know the shape/size as well as the physiology of each body re-
gion. Some body regions are shown in Figure 14. Their shapes range widely. For example, the forehead
is a rather flat region while the nose is a protuberant region. Fingers have very long and narrow shapes
whereas forearms have warped cylindrical shapes that are much thicker. In order to understand the mor-
phological characteristics of these regions, it is important to know their shapes quantitatively. However,
body regions are usually very complicated in shape and their shapes can vary between individuals, ages,
genders and races. As a result, it is laborious to collect quantitative data related to the shapes of body
regions.
Fortunately, data measured in the field of anthropometry provide us with a good start. For instance,
some data related to North American Caucasians are given in [51]. As an example, Table 1 [51] shows
data related to the shapes of noses of North American Caucasians. One can clearly see that nasal shapes
vary depending on gender and age. For males, the width of the nose stabilizes around the age of 14. The
height and bridge length of the nose stop changing around the age of 15. Nasal tip protrusion matures at
the age of 16. For females, the width and height of the nose reach their full sizes at the age of 12. The
nasal bridge plateaus at 13 years of age. The nasal tip protrusion fully matures around the age of 14.
Usually, the nose sizes of males are larger than those of females.
The physio-anatomical properties of the skin components discussed in Sections 4.1 through 4.4 tend
to vary depending on the body regions. This variation also causes the optical properties of skin to vary
between body regions. We now give several examples of these variations.
In cellular level elements (Level 1), the density of melanocytes varies between different body regions.
Regions that are directly exposed to sunlight (e.g. facial skin) have more melanocytes and melanin than
other regions (e.g. torso).
23
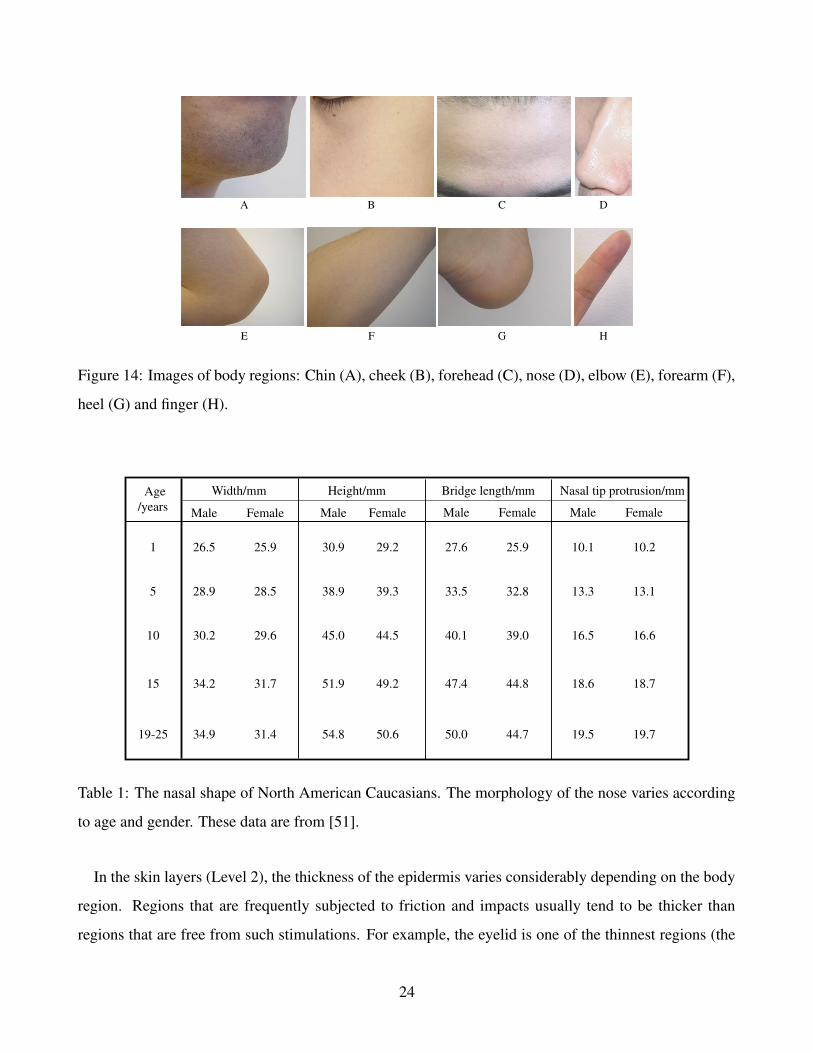
A B C D
E F G H
Figure 14: Images of body regions: Chin (A), cheek (B), forehead (C), nose (D), elbow (E), forearm (F),
heel (G) and finger (H).
Width/mm Height/mm Bridge length/mm Nasal tip protrusion/mm
Male Female
1
5
Male Female Male Female Male Female
Age/years
10
15
19-25
26.5
28.9
30.2
34.2
34.9
25.9
28.5
29.6
31.7
31.4
30.9
38.9
45.0
51.9
54.8
29.2
39.3
44.5
49.2
50.6
27.6
33.5
40.1
47.4
50.0
25.9
32.8
39.0
44.8
44.7
10.1
13.3
16.5
18.6
19.5
10.2
13.1
16.6
18.7
19.7
Table 1: The nasal shape of North American Caucasians. The morphology of the nose varies according
to age and gender. These data are from [51].
In the skin layers (Level 2), the thickness of the epidermis varies considerably depending on the body
region. Regions that are frequently subjected to friction and impacts usually tend to be thicker than
regions that are free from such stimulations. For example, the eyelid is one of the thinnest regions (the
24
A B
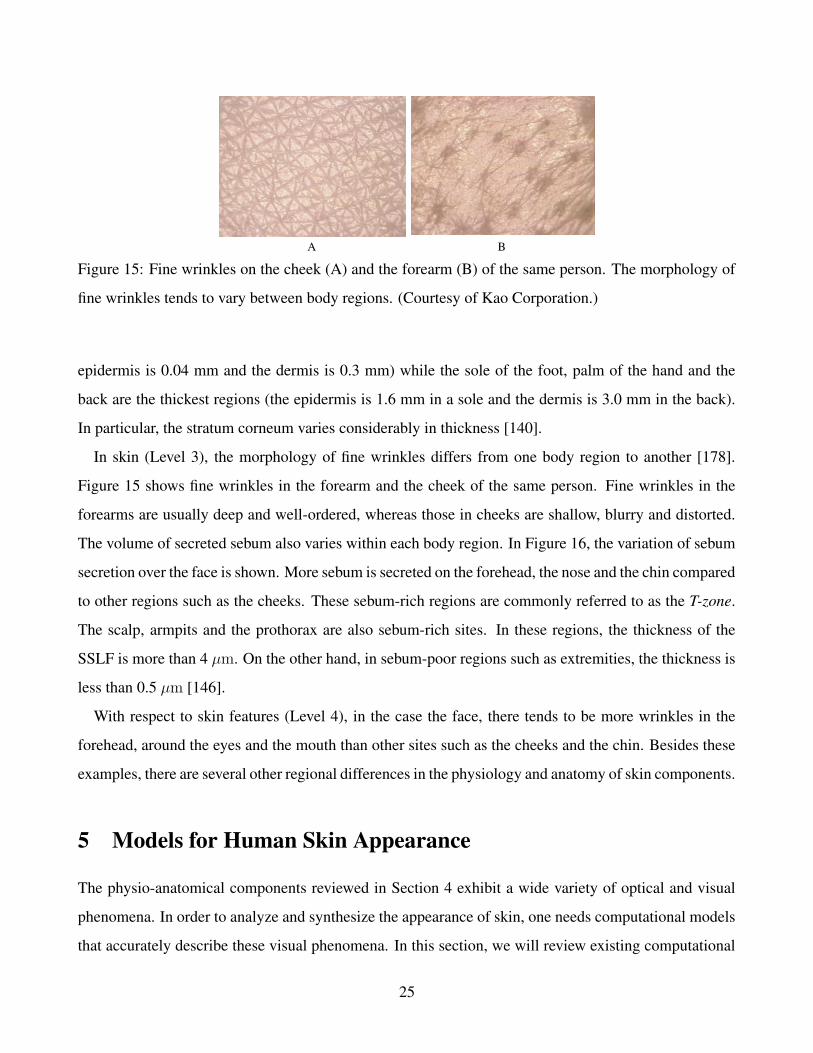
Figure 15: Fine wrinkles on the cheek (A) and the forearm (B) of the same person. The morphology of
fine wrinkles tends to vary between body regions. (Courtesy of Kao Corporation.)
epidermis is 0.04 mm and the dermis is 0.3 mm) while the sole of the foot, palm of the hand and the
back are the thickest regions (the epidermis is 1.6 mm in a sole and the dermis is 3.0 mm in the back).
In particular, the stratum corneum varies considerably in thickness [140].
In skin (Level 3), the morphology of fine wrinkles differs from one body region to another [178].
Figure 15 shows fine wrinkles in the forearm and the cheek of the same person. Fine wrinkles in the
forearms are usually deep and well-ordered, whereas those in cheeks are shallow, blurry and distorted.
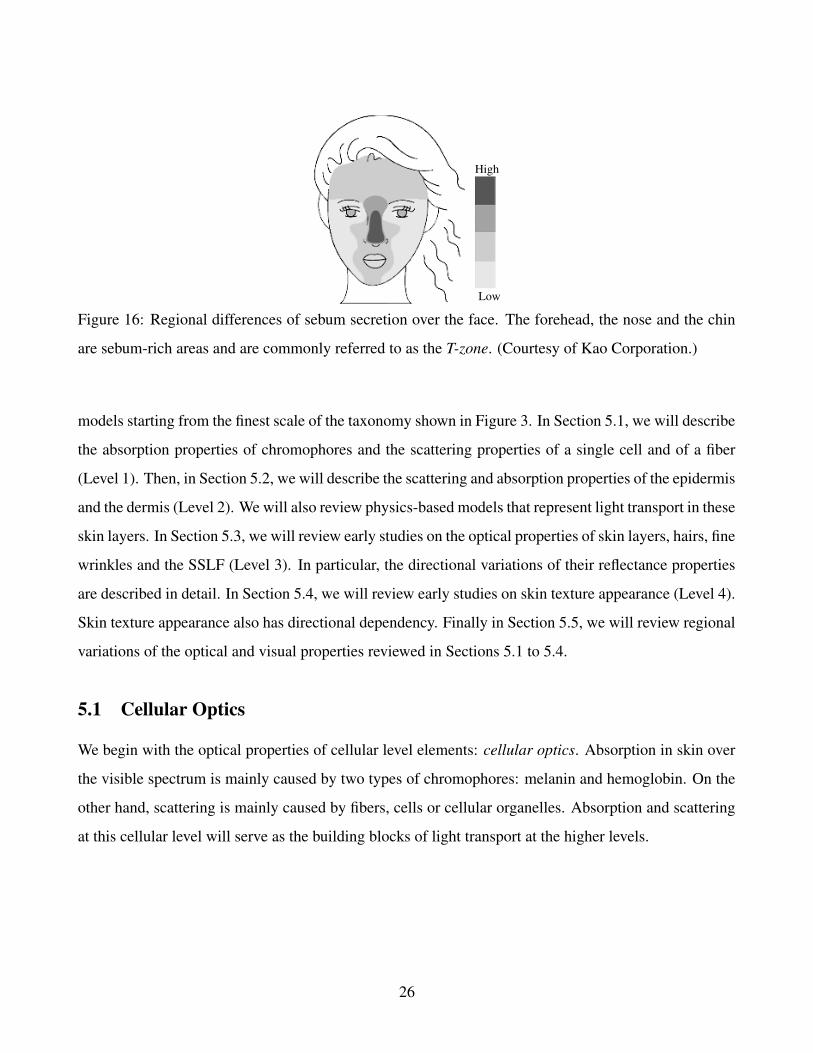
The volume of secreted sebum also varies within each body region. In Figure 16, the variation of sebum
secretion over the face is shown. More sebum is secreted on the forehead, the nose and the chin compared
to other regions such as the cheeks. These sebum-rich regions are commonly referred to as the T-zone.
The scalp, armpits and the prothorax are also sebum-rich sites. In these regions, the thickness of the
SSLF is more than 4 µm. On the other hand, in sebum-poor regions such as extremities, the thickness is
less than 0.5 µm [146].
With respect to skin features (Level 4), in the case the face, there tends to be more wrinkles in the
forehead, around the eyes and the mouth than other sites such as the cheeks and the chin. Besides these
examples, there are several other regional differences in the physiology and anatomy of skin components.
5 Models for Human Skin Appearance
The physio-anatomical components reviewed in Section 4 exhibit a wide variety of optical and visual
phenomena. In order to analyze and synthesize the appearance of skin, one needs computational models
that accurately describe these visual phenomena. In this section, we will review existing computational
25
High
Low
Figure 16: Regional differences of sebum secretion over the face. The forehead, the nose and the chin
are sebum-rich areas and are commonly referred to as the T-zone. (Courtesy of Kao Corporation.)
models starting from the finest scale of the taxonomy shown in Figure 3. In Section 5.1, we will describe
the absorption properties of chromophores and the scattering properties of a single cell and of a fiber
(Level 1). Then, in Section 5.2, we will describe the scattering and absorption properties of the epidermis
and the dermis (Level 2). We will also review physics-based models that represent light transport in these
skin layers. In Section 5.3, we will review early studies on the optical properties of skin layers, hairs, fine
wrinkles and the SSLF (Level 3). In particular, the directional variations of their reflectance properties
are described in detail. In Section 5.4, we will review early studies on skin texture appearance (Level 4).
Skin texture appearance also has directional dependency. Finally in Section 5.5, we will review regional
variations of the optical and visual properties reviewed in Sections 5.1 to 5.4.
5.1 Cellular Optics
We begin with the optical properties of cellular level elements: cellular optics. Absorption in skin over
the visible spectrum is mainly caused by two types of chromophores: melanin and hemoglobin. On the
other hand, scattering is mainly caused by fibers, cells or cellular organelles. Absorption and scattering
at this cellular level will serve as the building blocks of light transport at the higher levels.
26
400 450 500 550 600 650 7000.0
0.2
0.4
0.6
0.8
1.0
1.2
1.4
1.6
Wavelength / nm
Abs
orpt
ion
cros
sse
ctio
n/x
10M
cm5
-1-1
Deoxy-hemoglobin
Oxy-hemoglobin
Melanin
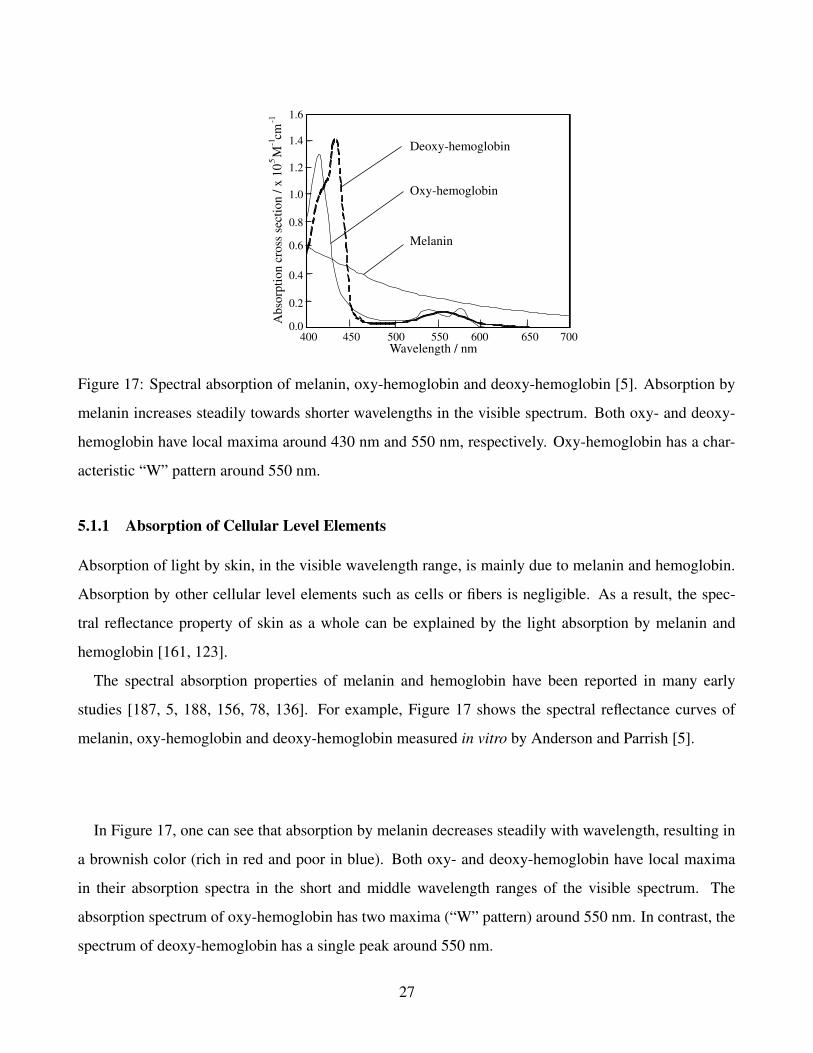
Figure 17: Spectral absorption of melanin, oxy-hemoglobin and deoxy-hemoglobin [5]. Absorption by
melanin increases steadily towards shorter wavelengths in the visible spectrum. Both oxy- and deoxy-
hemoglobin have local maxima around 430 nm and 550 nm, respectively. Oxy-hemoglobin has a char-
acteristic “W” pattern around 550 nm.
5.1.1 Absorption of Cellular Level Elements
Absorption of light by skin, in the visible wavelength range, is mainly due to melanin and hemoglobin.
Absorption by other cellular level elements such as cells or fibers is negligible. As a result, the spec-
tral reflectance property of skin as a whole can be explained by the light absorption by melanin and
hemoglobin [161, 123].
The spectral absorption properties of melanin and hemoglobin have been reported in many early
studies [187, 5, 188, 156, 78, 136]. For example, Figure 17 shows the spectral reflectance curves of
melanin, oxy-hemoglobin and deoxy-hemoglobin measured in vitro by Anderson and Parrish [5].
In Figure 17, one can see that absorption by melanin decreases steadily with wavelength, resulting in
a brownish color (rich in red and poor in blue). Both oxy- and deoxy-hemoglobin have local maxima
in their absorption spectra in the short and middle wavelength ranges of the visible spectrum. The
absorption spectrum of oxy-hemoglobin has two maxima (“W” pattern) around 550 nm. In contrast, the
spectrum of deoxy-hemoglobin has a single peak around 550 nm.
27
cytoplasm
mitochondria
protein
melanin
cortical cytoplasm
deried protein
cell membrane
nucleus
Refractive index Remarks
1.38 rat liver cell
cytoplasm 1.37 hamster overy cell
1.35 ~ 1.37
1.39
1.46
1.40
1.7
1.5
1.58
Cellular level elements
1.32 to 1.45 (axis)1.40 to 1.61 (radial)collagen fiber dry, deminerised tendon
rat liver cell
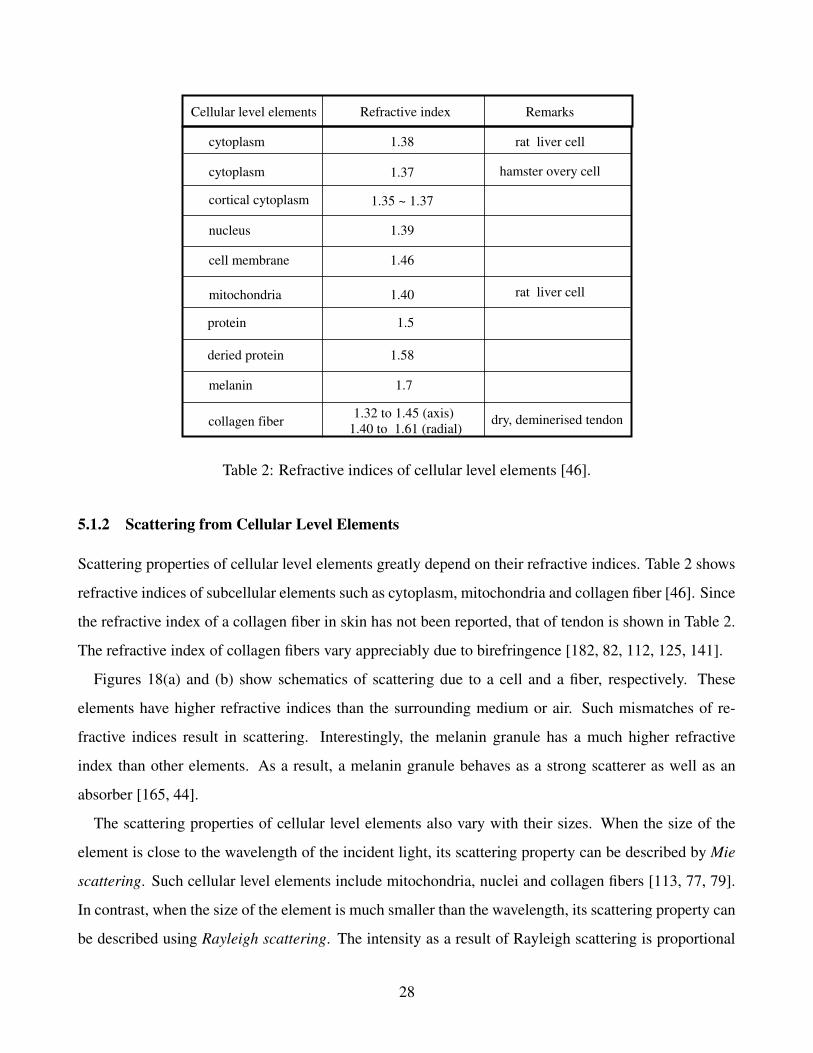
Table 2: Refractive indices of cellular level elements [46].
5.1.2 Scattering from Cellular Level Elements
Scattering properties of cellular level elements greatly depend on their refractive indices. Table 2 shows
refractive indices of subcellular elements such as cytoplasm, mitochondria and collagen fiber [46]. Since
the refractive index of a collagen fiber in skin has not been reported, that of tendon is shown in Table 2.
The refractive index of collagen fibers vary appreciably due to birefringence [182, 82, 112, 125, 141].
Figures 18(a) and (b) show schematics of scattering due to a cell and a fiber, respectively. These
elements have higher refractive indices than the surrounding medium or air. Such mismatches of re-
fractive indices result in scattering. Interestingly, the melanin granule has a much higher refractive
index than other elements. As a result, a melanin granule behaves as a strong scatterer as well as an
absorber [165, 44].
The scattering properties of cellular level elements also vary with their sizes. When the size of the
element is close to the wavelength of the incident light, its scattering property can be described by Mie
scattering. Such cellular level elements include mitochondria, nuclei and collagen fibers [113, 77, 79].
In contrast, when the size of the element is much smaller than the wavelength, its scattering property can
be described using Rayleigh scattering. The intensity as a result of Rayleigh scattering is proportional
28
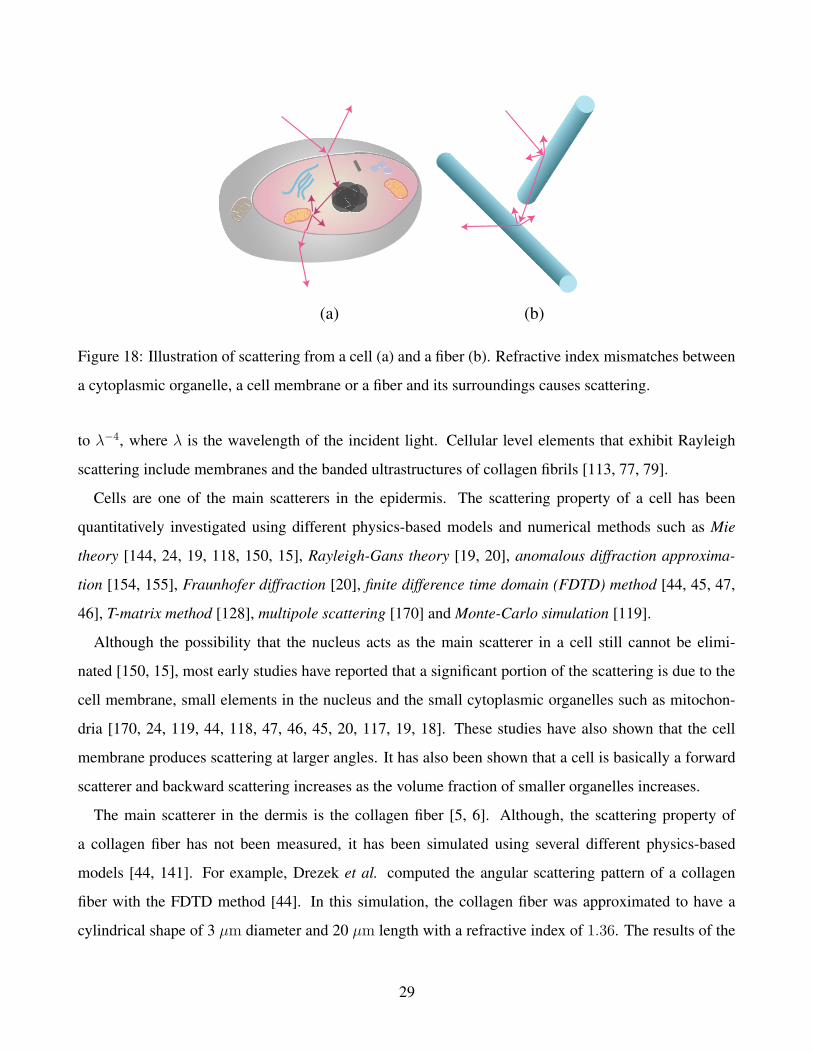
(a) (b)
Figure 18: Illustration of scattering from a cell (a) and a fiber (b). Refractive index mismatches between
a cytoplasmic organelle, a cell membrane or a fiber and its surroundings causes scattering.
to λ−4, where λ is the wavelength of the incident light. Cellular level elements that exhibit Rayleigh
scattering include membranes and the banded ultrastructures of collagen fibrils [113, 77, 79].
Cells are one of the main scatterers in the epidermis. The scattering property of a cell has been
quantitatively investigated using different physics-based models and numerical methods such as Mie
theory [144, 24, 19, 118, 150, 15], Rayleigh-Gans theory [19, 20], anomalous diffraction approxima-
tion [154, 155], Fraunhofer diffraction [20], finite difference time domain (FDTD) method [44, 45, 47,
46], T-matrix method [128], multipole scattering [170] and Monte-Carlo simulation [119].
Although the possibility that the nucleus acts as the main scatterer in a cell still cannot be elimi-
nated [150, 15], most early studies have reported that a significant portion of the scattering is due to the
cell membrane, small elements in the nucleus and the small cytoplasmic organelles such as mitochon-
dria [170, 24, 119, 44, 118, 47, 46, 45, 20, 117, 19, 18]. These studies have also shown that the cell
membrane produces scattering at larger angles. It has also been shown that a cell is basically a forward
scatterer and backward scattering increases as the volume fraction of smaller organelles increases.
The main scatterer in the dermis is the collagen fiber [5, 6]. Although, the scattering property of
a collagen fiber has not been measured, it has been simulated using several different physics-based
models [44, 141]. For example, Drezek et al. computed the angular scattering pattern of a collagen
fiber with the FDTD method [44]. In this simulation, the collagen fiber was approximated to have a
cylindrical shape of 3 µm diameter and 20 µm length with a refractive index of 1.36. The results of the
29
simulation show that a collagen fiber is a strong forward scatterer. Saidi et al. also simulated the angular
scattering distribution of a collagen fiber with cylindrical Mie theory and concluded that the scattering
of a collagen fiber is very strong in the forward direction [141]. These studies clearly suggest that skin
is a strong forward scattering medium at the micro scale.
5.2 Cutaneous Optics
Scattering properties of skin layers are not necessarily the same as those of cellular level elements. For
example, the dermis is composed of many collagen fibers that are densely packed. As a result, scattering
by the dermis can be described as multiple scattering by these collagen fibers. If we could render every
single optical event due to each cellular level element in the skin layers, we could estimate the optical
properties of the skin layers accurately. However, it is prohibitively expensive to render all these optical
events because of the large number of cellular level elements and their inhomogeneous distributions
within the skin layers. Instead, we can estimate the optical properties of skin layers by assuming them to
be optically homogeneous media. Previous works on the optical properties of skin layers or cutaneous
optics [6] have employed this approximation.
In this section, we will review these previous results. We will first describe in Section 5.2.1 how light
propagates in the skin layers to understand the optical characteristics of each skin layer in isolation.
Then, the optical parameters that represent scattering and absorption properties of skin layers will be
introduced in Section 5.2.2. Finally, in Section 5.2.3, we will review several physics-based models that
describe light transport in skin.
5.2.1 Optical Pathways in Skin
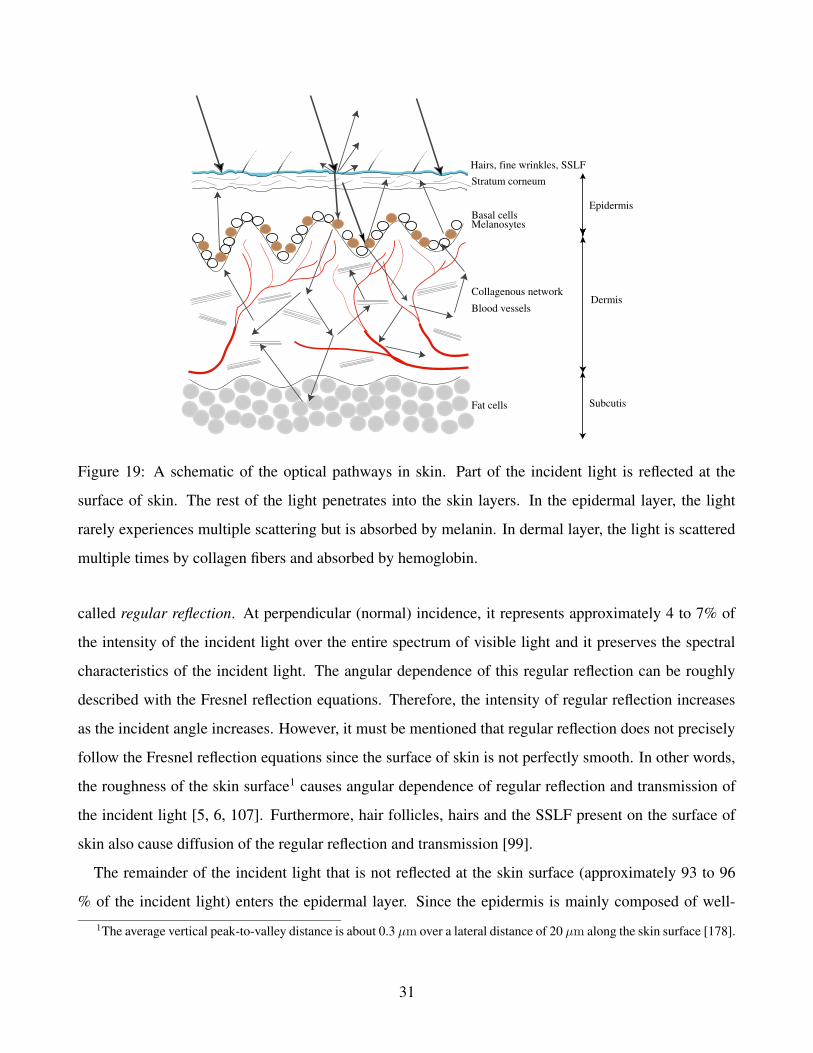
Light incident on skin undergoes very different pathways in each of the skin layers. Figure 19 shows
a schematic of the optical pathways in the skin layers. We will use this schematic to describe the light
transport. In the following discussion, we will assume that (a) absorption and scattering centers are
uniformly distributed across the skin layers [5, 6, 168, 99, 3], and (b) anisotropy of the light propagation
caused by preferential alignments of collagen fibers [126] is negligible.
A part of the incident light is first reflected at the surface of skin due to the difference in the refractive
indices of stratum corneum (approximately 1.55 [143]) and air (approximately 1.0). This reflection is
30
Hairs, fine wrinkles, SSLF
Stratum corneum
Basal cellsMelanosytes
Epidermis
Blood vessels
SubcutisFat cells
Collagenous networkDermis
Figure 19: A schematic of the optical pathways in skin. Part of the incident light is reflected at the
surface of skin. The rest of the light penetrates into the skin layers. In the epidermal layer, the light
rarely experiences multiple scattering but is absorbed by melanin. In dermal layer, the light is scattered
multiple times by collagen fibers and absorbed by hemoglobin.
called regular reflection. At perpendicular (normal) incidence, it represents approximately 4 to 7% of
the intensity of the incident light over the entire spectrum of visible light and it preserves the spectral
characteristics of the incident light. The angular dependence of this regular reflection can be roughly
described with the Fresnel reflection equations. Therefore, the intensity of regular reflection increases
as the incident angle increases. However, it must be mentioned that regular reflection does not precisely
follow the Fresnel reflection equations since the surface of skin is not perfectly smooth. In other words,
the roughness of the skin surface1 causes angular dependence of regular reflection and transmission of
the incident light [5, 6, 107]. Furthermore, hair follicles, hairs and the SSLF present on the surface of
skin also cause diffusion of the regular reflection and transmission [99].
The remainder of the incident light that is not reflected at the skin surface (approximately 93 to 96
% of the incident light) enters the epidermal layer. Since the epidermis is mainly composed of well-
1The average vertical peak-to-valley distance is about 0.3 µm over a lateral distance of 20 µm along the skin surface [178].
31
separated scatterers (e.g. cells) [100], multiple scattering is negligible in this layer. Hence, scattering
in the epidermal layer is mainly in the forward direction, reflecting the scattering property of a single
cell. The epidermis also contains densely-packed keratin fibers that could behave as strong scatterers.
However, their contribution is again negligible since the epidermis is very thin [79]. Consequently, the
epidermis is a more or less transparent layer that does not produce strong enough scattering to affect the
appearance of skin. On the other hand, significant absorption occurs in the epidermal layer. The degree
of absorption strongly depends on the volume of melanin which gives rise to the wide range of skin
colors. Since the epidermal layer acts as a strong absorber and not as a scatterer, this layer is sometimes
referred to as the melanin layer.
Figure 8 shows the wave-like interface between the epidermis and the dermis, which is referred to
as the dermo-epidermal junction. Several studies have shown that this rough interface causes diffusion
of light [107, 55, 64]. It has been suggested that light diffusion due to this interface increases with the
change in refractive index at the interface [107].
Dermis is an optically thick and turbid medium, where a significant amount of scattering of incident
light takes place [141, 77, 168, 79, 44, 5, 6]. Multiple scattering takes place in the vast network of
collagen fibers (especially in the deep areas of the dermis). Therefore, scattering by the dermal layer
appears to be isotropic although scattering due to a single collagen fiber is strong in the forward direction.
The scattering properties of the dermis depend on the wavelength of light. Table 3 shows the rela-
tionship between the wavelength and the optical path length in Caucasian skin [6]. Light scattering in
the dermis varies inversely with wavelength [56, 66]. Hence, light with longer wavelength can penetrate
deeper into the skin.
The light traveling in the dermal layer is absorbed by hemoglobin in the capillaries and the upper
superficial arteriolar and venule. Because of these scattering and absorption effects, the dermal layer can
be described as a combination of two layers: a multiple scattering layer and a hemoglobin layer.
5.2.2 Optical Parameters for Scattering and Absorption
The scattering and absorption properties of the skin layers must be represented quantitatively in order
to model light transport in skin. Absorption and scattering are usually characterized by the absorption
coefficient µa, the scattering coefficient µs and the scattering phase function p(s,s′). The phase function
is a probability density function that gives the probability of single scattering of light from direction
32
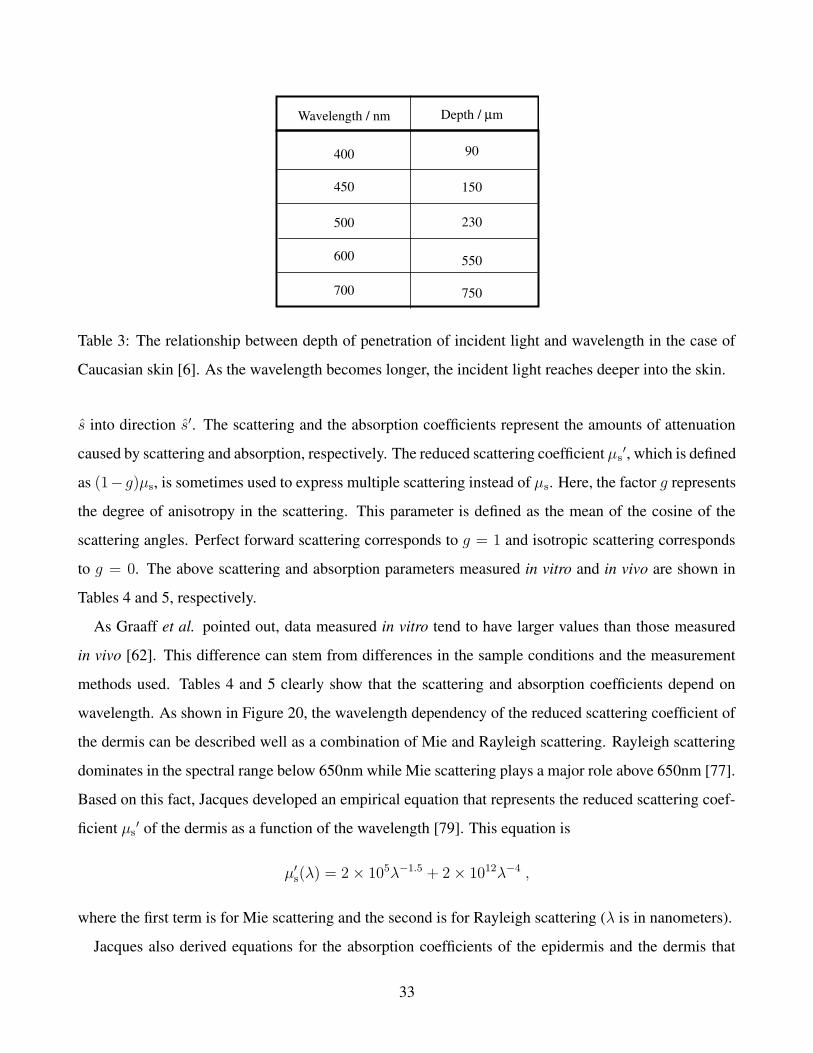
90
150
230
550
750
Wavelength / nm Depth / µm
400
450
500
600
700
Table 3: The relationship between depth of penetration of incident light and wavelength in the case of
Caucasian skin [6]. As the wavelength becomes longer, the incident light reaches deeper into the skin.
s into direction s′. The scattering and the absorption coefficients represent the amounts of attenuation
caused by scattering and absorption, respectively. The reduced scattering coefficient µs′, which is defined
as (1−g)µs, is sometimes used to express multiple scattering instead of µs. Here, the factor g represents
the degree of anisotropy in the scattering. This parameter is defined as the mean of the cosine of the
scattering angles. Perfect forward scattering corresponds to g = 1 and isotropic scattering corresponds
to g = 0. The above scattering and absorption parameters measured in vitro and in vivo are shown in
Tables 4 and 5, respectively.
As Graaff et al. pointed out, data measured in vitro tend to have larger values than those measured
in vivo [62]. This difference can stem from differences in the sample conditions and the measurement
methods used. Tables 4 and 5 clearly show that the scattering and absorption coefficients depend on
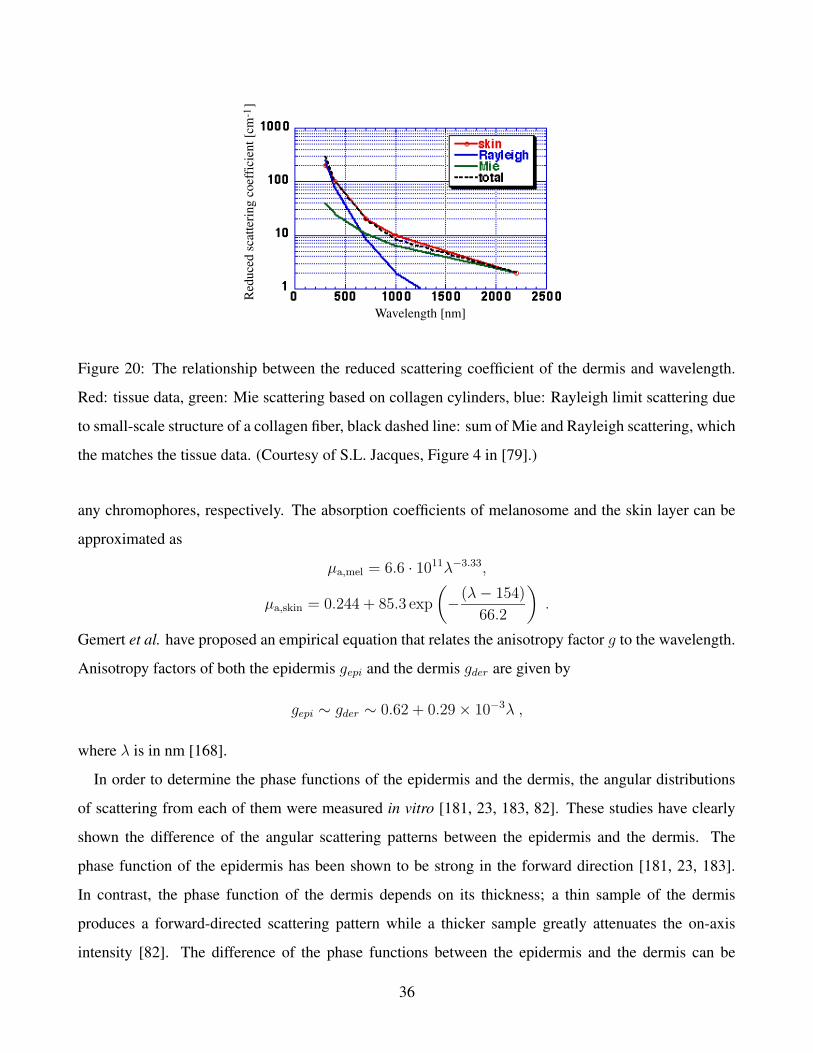
wavelength. As shown in Figure 20, the wavelength dependency of the reduced scattering coefficient of
the dermis can be described well as a combination of Mie and Rayleigh scattering. Rayleigh scattering
dominates in the spectral range below 650nm while Mie scattering plays a major role above 650nm [77].
Based on this fact, Jacques developed an empirical equation that represents the reduced scattering coef-
ficient µs′ of the dermis as a function of the wavelength [79]. This equation is
µ′
s(λ) = 2 × 10⁵λ−1.5 + 2 × 10¹²λ−4 ,
where the first term is for Mie scattering and the second is for Rayleigh scattering (λ is in nanometers).
Jacques also derived equations for the absorption coefficients of the epidermis and the dermis that
33
Description µs / cm -1 µa / cm -1 g
Stratum corneum
Wavelength / nm
400 2000
µs' / cm -1
230
Epidermis
415
488
514
585
633
800
600
0.9
66 0.74
50 0.76
600 44 0.77
470 36 0.79
450 35 0.8
415
488
514
585
633
320
250
250
196
187.5
4.7
3.5
3
3
2.7
0.74
0.76
0.77
0.79
0.8
633
700
633
635
11.64
Dermis
23.8
21.3
78
< 10
2.7
1.9
1.8
0.97
0.68244Dermis (leg)
Skin and underlyingtissues (leg)
Caucasian male skin
Caucasian female skin
Hipanic male skin
Forearm: fat
633
500
500
500
500
70.7 11.4 3.1 0.8
50 5.1
23.9 5.2
24.2 3.8
12 0.076
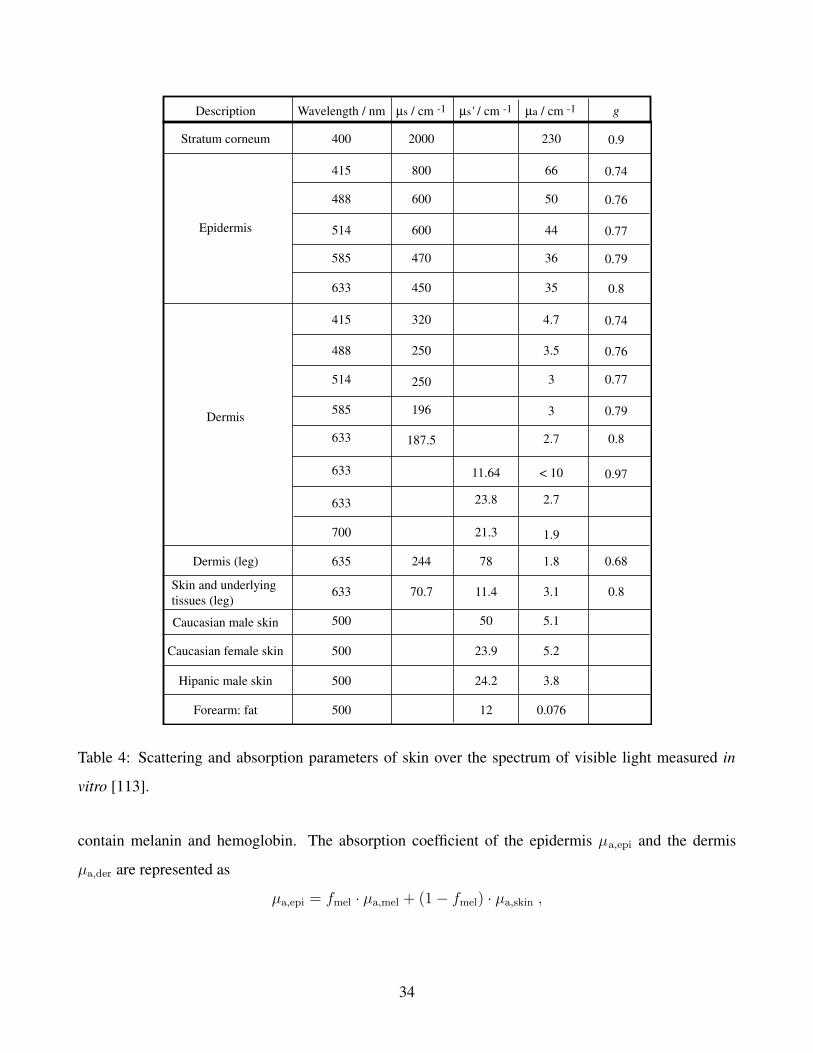
Table 4: Scattering and absorption parameters of skin over the spectrum of visible light measured in
vitro [113].
contain melanin and hemoglobin. The absorption coefficient of the epidermis µa,epi and the dermis
µa,der are represented as
µa,epi = fmel · µa,mel + (1 − fmel) · µa,skin ,
34
Description µa / cm -1 g
Epidermis (forearm)
Wavelength / nm µs' / cm -1
Dermis ( forearm)
Skin
Skin (0~1 mm)
Skin (1~2 mm)
Skin ( > 2 mm)
Arm
Foot sole
Forehead
Dermis
633
633
660
633
700
633
633
633
633
660
700
633
660
700
633
660
700
17.5
17.5
9 ~ 14.5
32
28.7
16.2
12
5.3
9.08
8.68
8.14
11.17
10.45
9.52
16.72
16.16
15.38
8
0.15
0.07 ~ 0.2
0.62
0.38
0.67
0.026
0.96
0.17
0.128
0.09
0.072
0.053
0.037
0.09
0.052
0.024
0.05
0.05
0.05
0.09
0.09
0.08
0.09
0.08
0.06
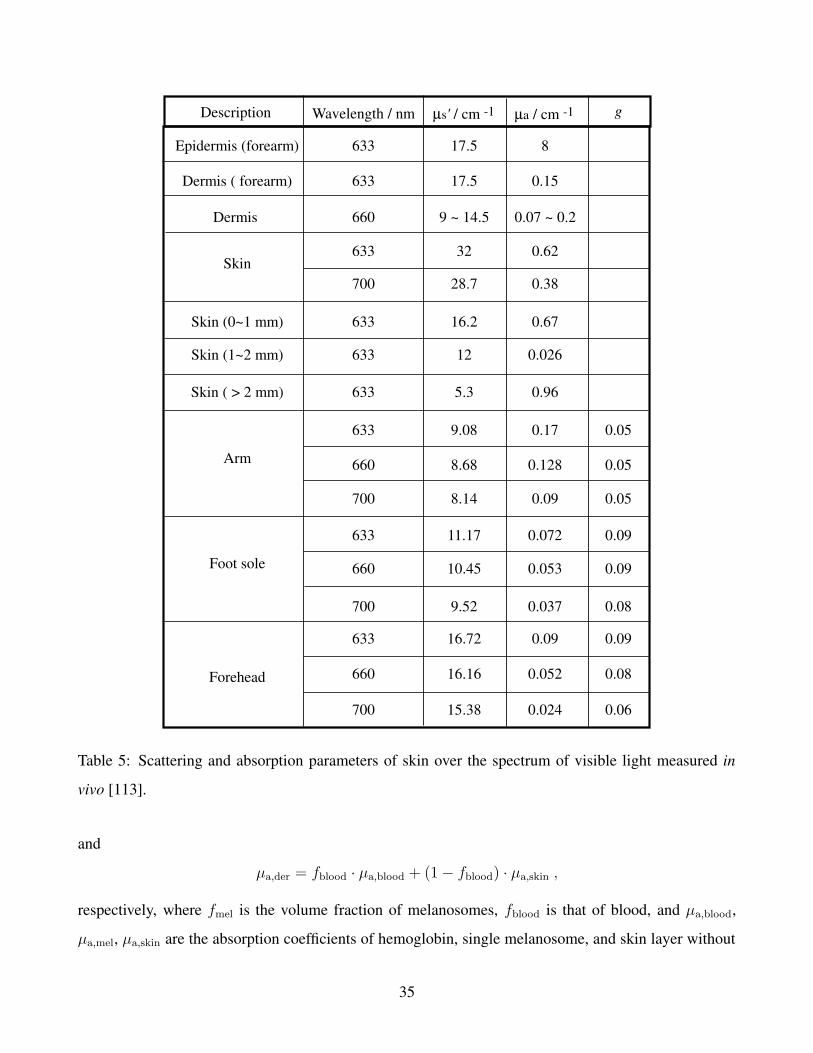
Table 5: Scattering and absorption parameters of skin over the spectrum of visible light measured in
vivo [113].
and
µa,der = fblood · µa,blood + (1 − fblood) · µa,skin ,
respectively, where fmel is the volume fraction of melanosomes, fblood is that of blood, and µa,blood,
µa,mel, µa,skin are the absorption coefficients of hemoglobin, single melanosome, and skin layer without
35
Wavelength [nm]
Red
uced
scat
teri
ngco
effi
cien
t[cm
]-1
Figure 20: The relationship between the reduced scattering coefficient of the dermis and wavelength.
Red: tissue data, green: Mie scattering based on collagen cylinders, blue: Rayleigh limit scattering due
to small-scale structure of a collagen fiber, black dashed line: sum of Mie and Rayleigh scattering, which
the matches the tissue data. (Courtesy of S.L. Jacques, Figure 4 in [79].)
any chromophores, respectively. The absorption coefficients of melanosome and the skin layer can be
approximated as
µa,mel = 6.6 · 1011λ−3.33,
µa,skin = 0.244 + 85.3 exp
(−(λ − 154)
66.2
).
Gemert et al. have proposed an empirical equation that relates the anisotropy factor g to the wavelength.
Anisotropy factors of both the epidermis gepi and the dermis gder are given by
gepi ∼ gder ∼ 0.62 + 0.29 × 10⁻³λ ,
where λ is in nm [168].
In order to determine the phase functions of the epidermis and the dermis, the angular distributions
of scattering from each of them were measured in vitro [181, 23, 183, 82]. These studies have clearly
shown the difference of the angular scattering patterns between the epidermis and the dermis. The
phase function of the epidermis has been shown to be strong in the forward direction [181, 23, 183].
In contrast, the phase function of the dermis depends on its thickness; a thin sample of the dermis
produces a forward-directed scattering pattern while a thicker sample greatly attenuates the on-axis
intensity [82]. The difference of the phase functions between the epidermis and the dermis can be
36

explained by considering the thickness of each of the skin layers and the scattering properties of a cell
and a collagen fiber. The epidermis is very thin and is mainly composed of cells that exhibit strong
forward scattering. Furthermore, cells are packed sparsely in the epidermis. Therefore, the incident light
experiences forwarded scattering only a few times. Consequently, scattering in the epidermis is strong
in the forward direction. On the other hand, the dermis is very thick and is composed of collagen fibers
that are densely packed. Although a collagen fiber exhibits strong forward scattering, incident light gets
scattered multiple times and hence the angular distribution of the scattering by the dermis becomes more
isotropic than in the case of the epidermis.
The Henyey-Greenstein function well-approximates the phase functions of the dermis [82] and the
epidermis [183]. The Henyey-Greenstein function is an approximation for spherical Mie scattering:
I(θ) ∼ 1 − g2HG
(1 + g2HG − 2gHG cos(θ))3/2
.
The phase function of the epidermis is given by this equation with gHG = 0.85 to 0.91 [183]. In the case
of the dermis, a modified Henyey-Greenstein function fits better [82, 108]. This modified function is
the combination of the two terms, one for isotropic scattering and the other for the Henyey-Greenstein
function:
I(θ) ∼ b + (1 − b)1 − g2
HG
(1 + g2HG − 2gHG cos(θ))3/2
,
where b is the fraction of the isotropic scattering. The values of gHG and b depend on the sample
thickness. For instance, b = 0.16 and gHG = 0.92 for a thin sample (20 µm in thickness), and b = 0.58
and gHG = 0.82 for a thicker sample (280 µm in thickness). The first term of the modified Henyey-
Greenstein function is derived from Rayleigh scattering since this scattering exhibits almost isotropic
angular distribution. Hence, the modified Henyey-Greenstein suggests that scattering by the dermis
includes not only Mie scattering but also Rayleigh scattering. This is supported by the fact that the
reduced scattering coefficient of the dermis can be represented as a combination of two components
each of which is related to Mie and Rayleigh scattering as described in Section 5.2.2. The contribution
of Rayleigh scattering indicates that there must be some scatterers that are smaller than the visible
wavelength of light in the dermis. Such small structures have not been clearly identified as yet. However,
collagen fiber bundles are composed of fibrils that produce a striated appearance under an electron
microscope. Jacques has suggested that this small-scale structure gives rise to the Rayleigh scattering of
the dermis [77].
37
5.2.3 Models for Light Transport in Skin
Some physics-based models that can quantitatively describe light transport in tissues have been proposed
in the past. These models usually require the values of optical parameters such as the scattering and
absorption coefficients. Using the parameters shown in Tables 4 and 5 in Section 5.2.2, we can predict
light transport in skin.
When we model light transport in an optical medium where no scattering, or very little scattering,
happens (i.e. absorption is much greater than scattering), the incident light goes straight into the medium
and gets attenuated exponentially due to absorption. In this case, the light transport is computed by the
Lambert-Beer law [5, 6, 168, 176]. This law can be written as
L = (1 − RF )E exp(−µtd) ,
where L is the radiance, E is incident irradiance, RF is the coefficient of Fresnel reflectance for normal
light incidence and d is the thickness of the optical medium. Gemert et al. reported that the Lambert-
Beer law works well only when µa > 10µs [168]. Skin illuminated with visible light does not satisfy
this condition since cellular level elements act as strong scatterers for visible and near-infrared light. In
other words, this condition holds only for ultraviolet and infrared light. Hence, the Lambert-Beer law is
invalid for modeling light transport in skin.
However, a modified Lambert-Beer model can predict light transport in a highly scattering medium.
The optical path length of light in a highly scattering medium is not exactly the same as the thickness
of the medium since the light changes its direction as it gets scattered. Furthermore, the optical path
length varies, as shown in Table 3, according to the wavelength of the incident light. In order to employ
the Lambert-Beer law for a highly scattering medium, it should be modified to take into account this
change in the optical path length. The modified law is derived by replacing the sample thickness d in the
conventional Lambert-Beer law with the mean path length of the scattered light d(λ):
L(λ) = (1 − RF )E(λ) exp[−µad(λ)] .
This law was first applied to infrared light transport in the brain [40, 73, 130, 131]. Recently, some
researchers have applied it to visible light transport in skin [69, 147, 163, 95]. In these studies, it was
used to predict skin color. However, it does not take into account the phase function of scattering.
Therefore, it is hard to use it to describe the spatial properties of light transport in skin due to scattering.
38
Monte Carlo simulation is a powerful method for computing light transport in tissues [177, 179,
126, 101, 21, 173, 54, 109, 89, 88, 91, 172, 148, 166, 62, 61, 129, 91, 174, 159]. This approach has
been employed for simulating light transport in skin which has a complicated multi-layered structure.
This method statistically computes the optical pathway of each photon, repeatedly. In order to obtain
an accurate result, one needs to iterate the computation of photon migration many times. Hence, it is
computationally very expensive. Consequently, analytical methods are preferred in many applications,
albeit with the cost of additional restricting assumptions.
The exact analytical form for light transport in a scattering medium is given by the radiative transfer
equation (RTE) [177]:
s · ∇L(�r, s) = −µtL(�r, s) +µt
4π
∫4π
p(s, s′)L(�r, s′)dω′ + q(�r, s) ,
where dω [sr−1] denotes a solid angle around direction s, L [Wm−2sr−1] is the radiance, µt [m−1] is
the total attenuation coefficient which is the summation of µa and µs, p(s, s′) [sr−1] is the phase function
of the medium and q(�r, s) [Wm−3sr−1] is the power of a source at �r in the direction s. The left-hand
side represents the gradient of the radiance at location �r in the direction s. The first term on the right-
hand side represents the decrease in radiance caused by absorption and scattering. The second term
accounts for the increase in radiance due to the flux scattered into the direction of interest from other
directions. This monochromatic equation is built upon a few assumptions: (a) skin is a homogeneous
medium containing discrete scattering centers (i.e. no light interference takes place), and (b) polarization
effects [4, 84, 85, 80, 81, 41, 153, 115, 114] can be neglected.
Unfortunately, a solution to this equation is not easily obtained because of its integro-differential form.
However, it is possible to expand the RTE as powers of spherical harmonics (or Legendre polynomials,
in which case azimuthal angles are dropped). This expansion leads to an almost exact solution to the
RTE when the number of the polynomials is very large. It has been reported that a precise model for
light transport in a tissue needs up to 150 spherical harmonics, which was estimated using the finite
difference method [14]. Needless to say, this is still a computationally expensive model.
There are some practical models that approximate light transport in a tissue. Examples of these mod-
els are the Kubelka-Munk two- [171, 5, 6, 168, 176, 166, 31, 32] and four-flux theories [166], seven-flux
theory [186, 176], the adding-doubling method [177, 25, 137, 138], discrete ordinates [116, 185], path
integrals [134] and the diffusion approximation equation [53, 92, 52, 145, 93, 90, 189, 83, 43, 186,
39
185, 176, 175, 54, 26]. Among these models, the adding-doubling method and discrete ordinates are
more accurate than others since they can provide solutions to the RTE with anisotropic scattering and
mismatched boundaries. The adding-doubling method works well with layered media and captures the
reflection from and transmission through the media, while discrete ordinates generate internal fluence.
The adding-doubling method would be more useful than discrete ordinates for modeling the reflection
from skin surface. Other models such as the Kubelka-Munk theory and the diffusion approximation
equation are computationally faster than the adding-doubling method and discrete ordinates and there-
fore are widely used. These models can be derived from the RTE by assuming that the tissue is an
isotropic scattering medium.
The Kubelka-Munk theory is one of the most popular and simplest approaches for computing light
transport in a highly scattering medium. In such a medium, most photons experience multiple scattering
before being absorbed or leaving the medium. In this case, the spatial distribution of scattered light
becomes isotropic very rapidly. As shown in Figure 21, the Kubelka-Munk theory assumes that the
radiation passing through a scattering medium can be divided into two “diffuse fluxes” traveling in the
forward and backward directions denoted as I and J , respectively [6].
The backscattering and absorption coefficients for these diffuse fluxes (denoted as s and k, respec-
tively) are defined by two differential equations:
dI = (−kI − sI + sJ)dx,
−dJ = (−kJ − sJ + sI)dx .
The reflectance (R) and transmittance (T ) of the medium are related to k and s as:
R =(1 − β2) (exp(Kd) − exp(−Kd))
(1 + β)2 exp(Kd) − (1 − β)2 exp(−Kd),
T =4β
(1 + β)2 exp(Kd) − (1 − β)2 exp(−Kd),
where K =√
k(k + 2s), β =√
kk+2s
and d is the thickness of the medium. The assumptions made by
the Kubelka-Munk theory cause some errors in certain cases. For instance, the model overestimates the
radiance of scattered light in a medium of high albedo (i.e. strongly anisotropic scattering), such as the
superficial area of skin, because it assumes diffuse fluxes [176]. The Kubelka-Munk theory also cannot
predict the spatial distribution of light due to scattering, since the directions of scattered light are limited
to only two directions.
40
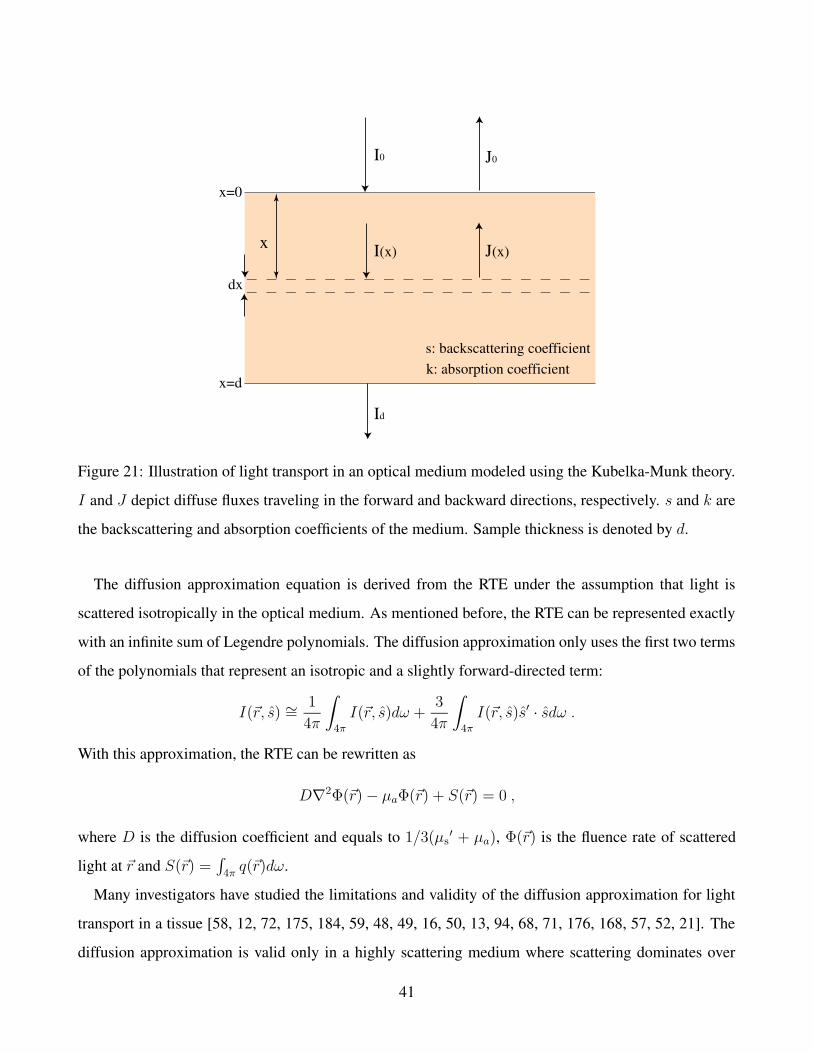
x
R=J0/I0
x=0
x=d
dx
I0 J0
I(x) J(x)
IdT=ID/I0
s: backscattering coefficientk: absorption coefficient
Figure 21: Illustration of light transport in an optical medium modeled using the Kubelka-Munk theory.
I and J depict diffuse fluxes traveling in the forward and backward directions, respectively. s and k are
the backscattering and absorption coefficients of the medium. Sample thickness is denoted by d.
The diffusion approximation equation is derived from the RTE under the assumption that light is
scattered isotropically in the optical medium. As mentioned before, the RTE can be represented exactly
with an infinite sum of Legendre polynomials. The diffusion approximation only uses the first two terms
of the polynomials that represent an isotropic and a slightly forward-directed term:
I(�r, s) ∼= 1
4π
∫4π
I(�r, s)dω +3
4π
∫4π
I(�r, s)s′ · sdω .
With this approximation, the RTE can be rewritten as
D∇2Φ(�r) − µaΦ(�r) + S(�r) = 0 ,
where D is the diffusion coefficient and equals to 1/3(µs′ + µa), Φ(�r) is the fluence rate of scattered
light at �r and S(�r) =∫
4πq(�r)dω.
Many investigators have studied the limitations and validity of the diffusion approximation for light
transport in a tissue [58, 12, 72, 175, 184, 59, 48, 49, 16, 50, 13, 94, 68, 71, 176, 168, 57, 52, 21]. The
diffusion approximation is valid only in a highly scattering medium where scattering dominates over
41
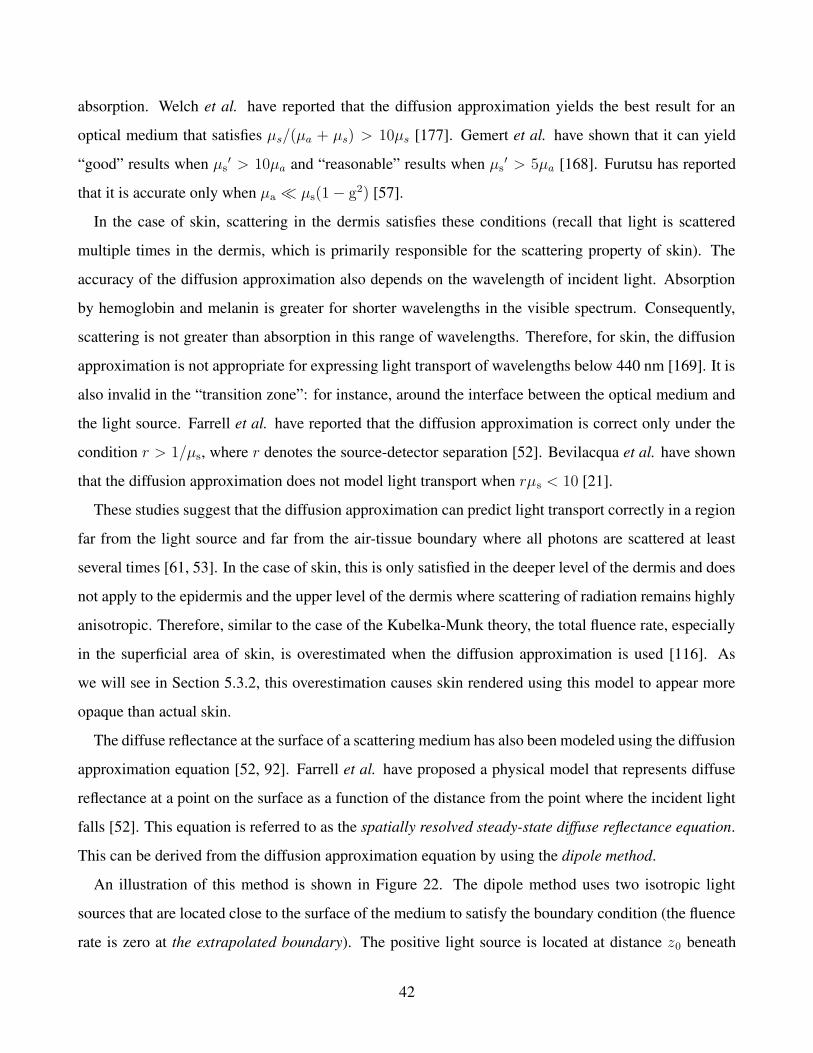
absorption. Welch et al. have reported that the diffusion approximation yields the best result for an
optical medium that satisfies µs/(µa + µs) > 10µs [177]. Gemert et al. have shown that it can yield
“good” results when µs′ > 10µa and “reasonable” results when µs
′ > 5µa [168]. Furutsu has reported
that it is accurate only when µa � µs(1 − g2) [57].
In the case of skin, scattering in the dermis satisfies these conditions (recall that light is scattered
multiple times in the dermis, which is primarily responsible for the scattering property of skin). The
accuracy of the diffusion approximation also depends on the wavelength of incident light. Absorption
by hemoglobin and melanin is greater for shorter wavelengths in the visible spectrum. Consequently,
scattering is not greater than absorption in this range of wavelengths. Therefore, for skin, the diffusion
approximation is not appropriate for expressing light transport of wavelengths below 440 nm [169]. It is
also invalid in the “transition zone”: for instance, around the interface between the optical medium and
the light source. Farrell et al. have reported that the diffusion approximation is correct only under the
condition r > 1/µs, where r denotes the source-detector separation [52]. Bevilacqua et al. have shown
that the diffusion approximation does not model light transport when rµs < 10 [21].
These studies suggest that the diffusion approximation can predict light transport correctly in a region
far from the light source and far from the air-tissue boundary where all photons are scattered at least
several times [61, 53]. In the case of skin, this is only satisfied in the deeper level of the dermis and does
not apply to the epidermis and the upper level of the dermis where scattering of radiation remains highly
anisotropic. Therefore, similar to the case of the Kubelka-Munk theory, the total fluence rate, especially
in the superficial area of skin, is overestimated when the diffusion approximation is used [116]. As
we will see in Section 5.3.2, this overestimation causes skin rendered using this model to appear more
opaque than actual skin.
The diffuse reflectance at the surface of a scattering medium has also been modeled using the diffusion
approximation equation [52, 92]. Farrell et al. have proposed a physical model that represents diffuse
reflectance at a point on the surface as a function of the distance from the point where the incident light
falls [52]. This equation is referred to as the spatially resolved steady-state diffuse reflectance equation.
This can be derived from the diffusion approximation equation by using the dipole method.
An illustration of this method is shown in Figure 22. The dipole method uses two isotropic light
sources that are located close to the surface of the medium to satisfy the boundary condition (the fluence
rate is zero at the extrapolated boundary). The positive light source is located at distance z0 beneath
42
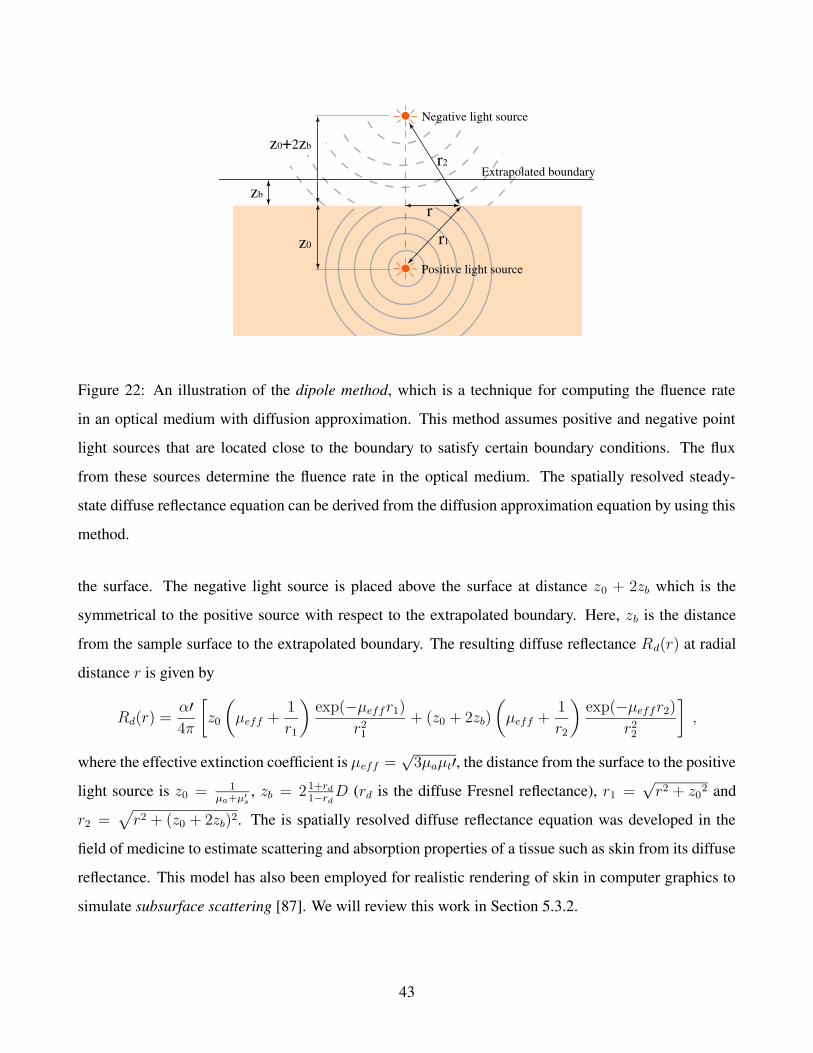
z0
zb
z0+2zb
r1
r2
r
Extrapolated boundary
Negative light source
Positive light source
Figure 22: An illustration of the dipole method, which is a technique for computing the fluence rate
in an optical medium with diffusion approximation. This method assumes positive and negative point
light sources that are located close to the boundary to satisfy certain boundary conditions. The flux
from these sources determine the fluence rate in the optical medium. The spatially resolved steady-
state diffuse reflectance equation can be derived from the diffusion approximation equation by using this
method.
the surface. The negative light source is placed above the surface at distance z0 + 2zb which is the
symmetrical to the positive source with respect to the extrapolated boundary. Here, zb is the distance
from the sample surface to the extrapolated boundary. The resulting diffuse reflectance Rd(r) at radial
distance r is given by
Rd(r) =α′4π
[z0
(µeff +
1
r1
)exp(−µeffr1)
r21
+ (z0 + 2zb)
(µeff +
1
r2
)exp(−µeffr2)
r22
],
where the effective extinction coefficient is µeff =√
3µaµt′, the distance from the surface to the positive
light source is z0 = 1µa+µ′
s
, zb = 21+rd
1−rd
D (rd is the diffuse Fresnel reflectance), r1 =√
r2 + z02 and
r2 =√
r2 + (z0 + 2zb)2. The is spatially resolved diffuse reflectance equation was developed in the
field of medicine to estimate scattering and absorption properties of a tissue such as skin from its diffuse
reflectance. This model has also been employed for realistic rendering of skin in computer graphics to
simulate subsurface scattering [87]. We will review this work in Section 5.3.2.
43
Figure 23: The BRDF relates the reflected radiance to the irradiance as a function of the light source
and the viewing directions. This function assumes that the point of incidence is the same as the point of
reflection.
5.3 BRDF and BSSRDF
The appearance of skin varies greatly depending on the illumination and viewing conditions. This results
from the directional variation of reflection by skin. In order to model skin appearance accurately, it is
crucial to model the directional properties of skin reflectance. The Bidirectional Reflectance Distribution
Function (BRDF) and the Bidirectional Surface Scattering Reflectance Distribution Function (BSSRDF)
are appropriate functions for this purpose. In this section, we will review previous studies on the BRDF
and BSSRDF of skin.
5.3.1 BRDF
The BRDF [127], fr, is a function that relates the reflected radiance dLr at a surface point x in the
direction �ω to the irradiance dEi due to a light source in the direction �ω′:
Fr(x, �ω, �ω′) =dLr(x, �ω)
dEi(x, �ω′).
As shown in Figure 23, this function assumes that the incident light hitting a surface point is reflected
from the same point. The light reflected by the surface of skin tends to adhere to this assumption.
Hence, the BRDF can represent the surface reflection from skin more or less accurately. On the other
hand, light penetrating into the skin does not follow this assumption since it travels inside the skin layers
and gets scattered, and then reemerges from surface points that are not necessarily the same as the point
of incidence. Therefore, the BRDF cannot describe the body reflection (or the process of subsurface
scattering) of skin. Despite this limitation, the BRDF has been widely used for rendering skin because
of its low computational cost.
44
The BRDF of skin has been measured by several research groups. For example, the BRDF of
skin measured in vitro is available in the Columbia-Utrecht Reflectance and Texture (CuReT) database
(http://www.cs.columbia.edu/CAVE/curet/) by Dana et al. [37]. The sample skin was removed from a
corpse and prepared as a flat sample. Then it was measured with 200 different combinations of incident
light and viewing directions. Since the data was captured in vitro, the conditions of the sample such
as the degree of hydration and the contents of chromophores are different from those of living skin.
Such changes of physiological conditions lead to changes in refractive index, absorption and scattering
properties of skin. Therefore, the measured data does not accurately represent the BRDF of living skin.
Marschner et al. have measured the reflectance of skin on the forehead over a wide range of direc-
tions in vivo [110, 111]. The shape of a forehead is curved. They used a CCD camera for measuring the
radiometric data, a 3D range scanner for measuring the geometry of the forehead, and machine-readable
targets to later register both. From the radiometric and geometric information captured by these devices,
the BRDF was computed. In [110] and [111], BRDFs of four different types of skin (in terms of com-
plexion, age, race and gender) were measured. Figure 24 shows rendered images using these measured
BRDFs. These images clearly exhibit natural variations in skin appearance such as shininess and tint.
For example, the fourth rendered image of a South Asian (Indian) face has not only dark skin color but
also a shinier appearance. Sheen usually observed around grazing angles is also seen in these images.
As can be seen in Figure 25 [110, 111], skin exhibits a very unusual BRDF. At small incident angles,
the BRDF almost follows the Lambertian model. On the other hand, at larger incident angles, the
reflectance increases significantly with the viewing angle. It is hard to describe such a BRDF using
conventional physics-based models. For example, Murakami et al. have reported that neither the surface
nor the body reflection of skin are correctly simulated with the Torrance-Sparrow [158] or the Oren-
Nayar [124] reflection models [120]. They have also shown that Monte Carlo simulation taking into
account subsurface scattering in skin layers more accurately represents the directional variation of the
body reflection component of skin. These results indicate three important points; (1) surface reflection
cannot be described with conventional rough surface models such as the Torrance-Sparrow model since
the assumptions such models are based on are too simple to represent the complicated geometry of real
skin surface, (2) Lambert’s law is inadequate for representing body reflection of skin, and (3) subsurface
scattering in skin should be taken into account to describe the body reflection.
There are several approximate BRDF models for skin that take into account the effects of subsurface
45
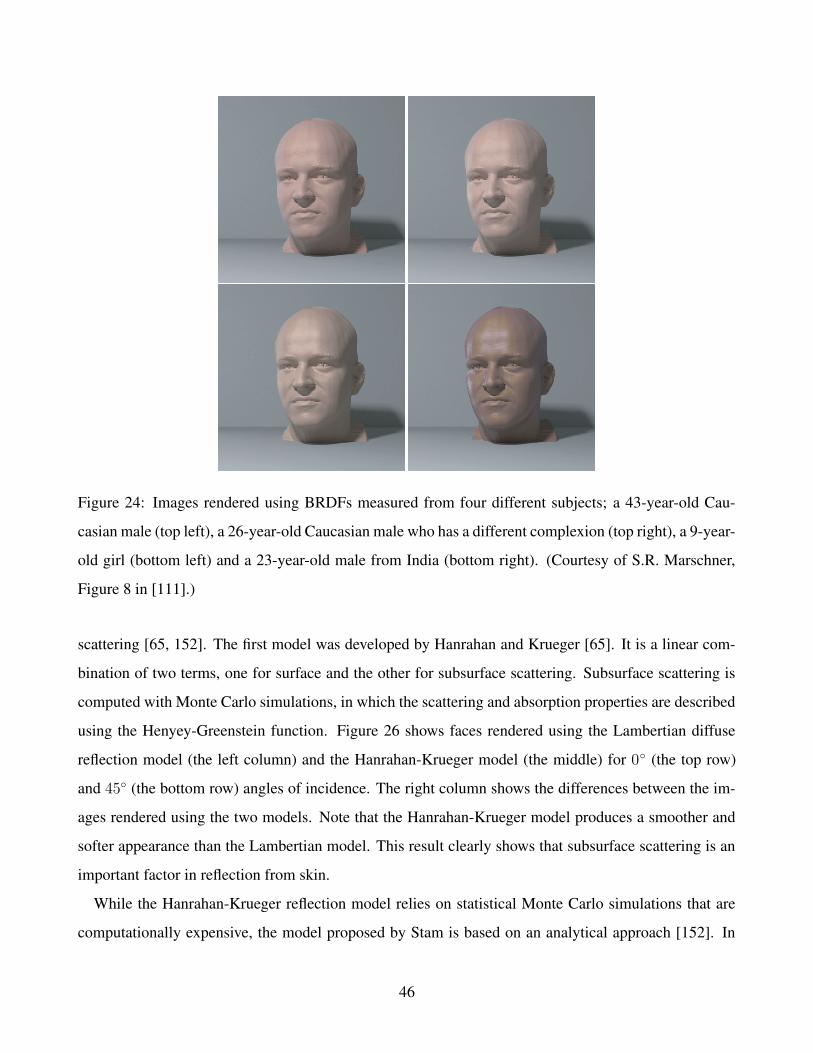
Figure 24: Images rendered using BRDFs measured from four different subjects; a 43-year-old Cau-
casian male (top left), a 26-year-old Caucasian male who has a different complexion (top right), a 9-year-
old girl (bottom left) and a 23-year-old male from India (bottom right). (Courtesy of S.R. Marschner,
Figure 8 in [111].)
scattering [65, 152]. The first model was developed by Hanrahan and Krueger [65]. It is a linear com-
bination of two terms, one for surface and the other for subsurface scattering. Subsurface scattering is
computed with Monte Carlo simulations, in which the scattering and absorption properties are described
using the Henyey-Greenstein function. Figure 26 shows faces rendered using the Lambertian diffuse
reflection model (the left column) and the Hanrahan-Krueger model (the middle) for 0◦ (the top row)
and 45◦ (the bottom row) angles of incidence. The right column shows the differences between the im-
ages rendered using the two models. Note that the Hanrahan-Krueger model produces a smoother and
softer appearance than the Lambertian model. This result clearly shows that subsurface scattering is an
important factor in reflection from skin.
While the Hanrahan-Krueger reflection model relies on statistical Monte Carlo simulations that are
computationally expensive, the model proposed by Stam is based on an analytical approach [152]. In
46
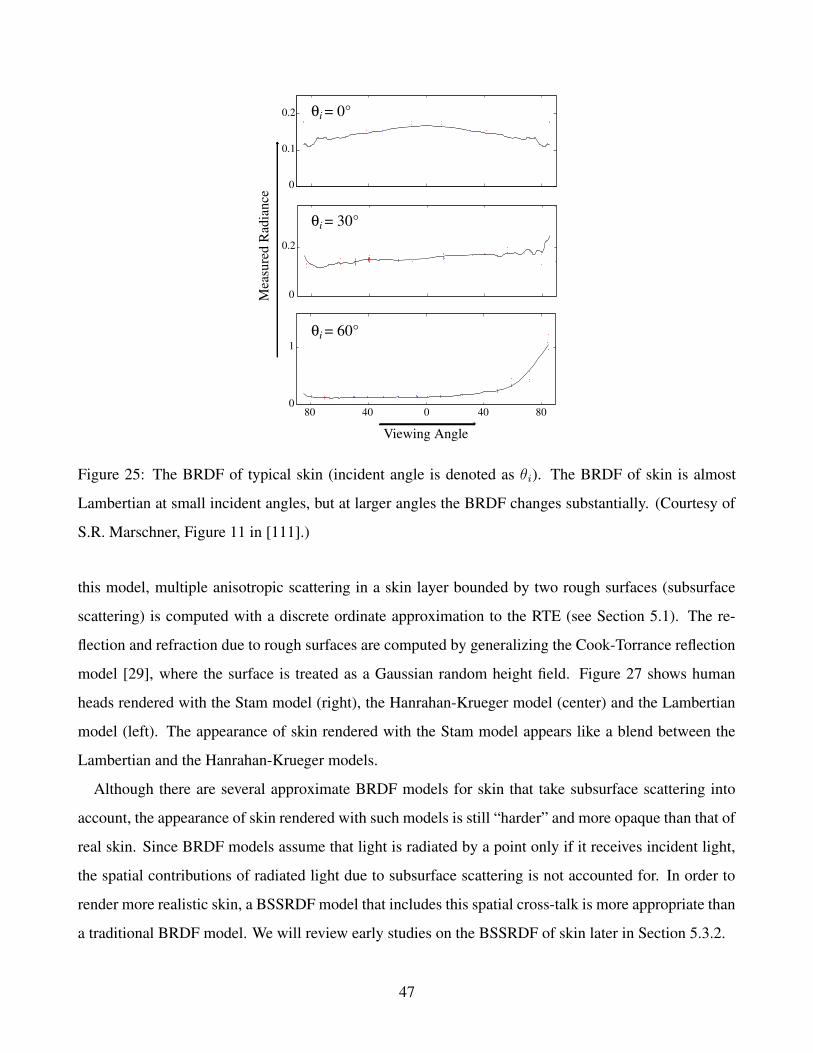
0
0.1
0.2
0
0.2
0
1
80 40 0 40 80
θi = 0°
θi = 30°
θi = 60°
Viewing Angle
Mea
sure
dR
adia
nce
Figure 25: The BRDF of typical skin (incident angle is denoted as θi). The BRDF of skin is almost
Lambertian at small incident angles, but at larger angles the BRDF changes substantially. (Courtesy of
S.R. Marschner, Figure 11 in [111].)
this model, multiple anisotropic scattering in a skin layer bounded by two rough surfaces (subsurface
scattering) is computed with a discrete ordinate approximation to the RTE (see Section 5.1). The re-
flection and refraction due to rough surfaces are computed by generalizing the Cook-Torrance reflection
model [29], where the surface is treated as a Gaussian random height field. Figure 27 shows human
heads rendered with the Stam model (right), the Hanrahan-Krueger model (center) and the Lambertian
model (left). The appearance of skin rendered with the Stam model appears like a blend between the
Lambertian and the Hanrahan-Krueger models.
Although there are several approximate BRDF models for skin that take subsurface scattering into
account, the appearance of skin rendered with such models is still “harder” and more opaque than that of
real skin. Since BRDF models assume that light is radiated by a point only if it receives incident light,
the spatial contributions of radiated light due to subsurface scattering is not accounted for. In order to
render more realistic skin, a BSSRDF model that includes this spatial cross-talk is more appropriate than
a traditional BRDF model. We will review early studies on the BSSRDF of skin later in Section 5.3.2.
47
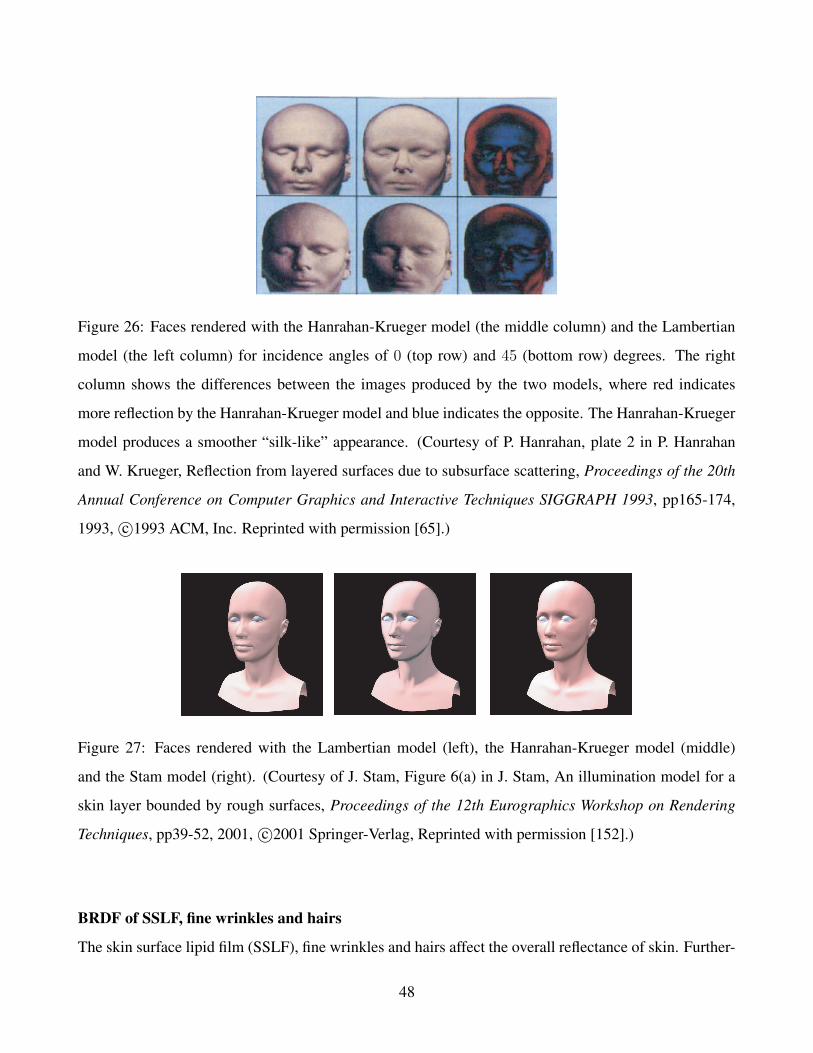
Figure 26: Faces rendered with the Hanrahan-Krueger model (the middle column) and the Lambertian
model (the left column) for incidence angles of 0 (top row) and 45 (bottom row) degrees. The right
column shows the differences between the images produced by the two models, where red indicates
more reflection by the Hanrahan-Krueger model and blue indicates the opposite. The Hanrahan-Krueger
model produces a smoother “silk-like” appearance. (Courtesy of P. Hanrahan, plate 2 in P. Hanrahan
and W. Krueger, Reflection from layered surfaces due to subsurface scattering, Proceedings of the 20th
Annual Conference on Computer Graphics and Interactive Techniques SIGGRAPH 1993, pp165-174,
1993, c©1993 ACM, Inc. Reprinted with permission [65].)
Figure 27: Faces rendered with the Lambertian model (left), the Hanrahan-Krueger model (middle)
and the Stam model (right). (Courtesy of J. Stam, Figure 6(a) in J. Stam, An illumination model for a
skin layer bounded by rough surfaces, Proceedings of the 12th Eurographics Workshop on Rendering
Techniques, pp39-52, 2001, c©2001 Springer-Verlag, Reprinted with permission [152].)
BRDF of SSLF, fine wrinkles and hairs
The skin surface lipid film (SSLF), fine wrinkles and hairs affect the overall reflectance of skin. Further-
48
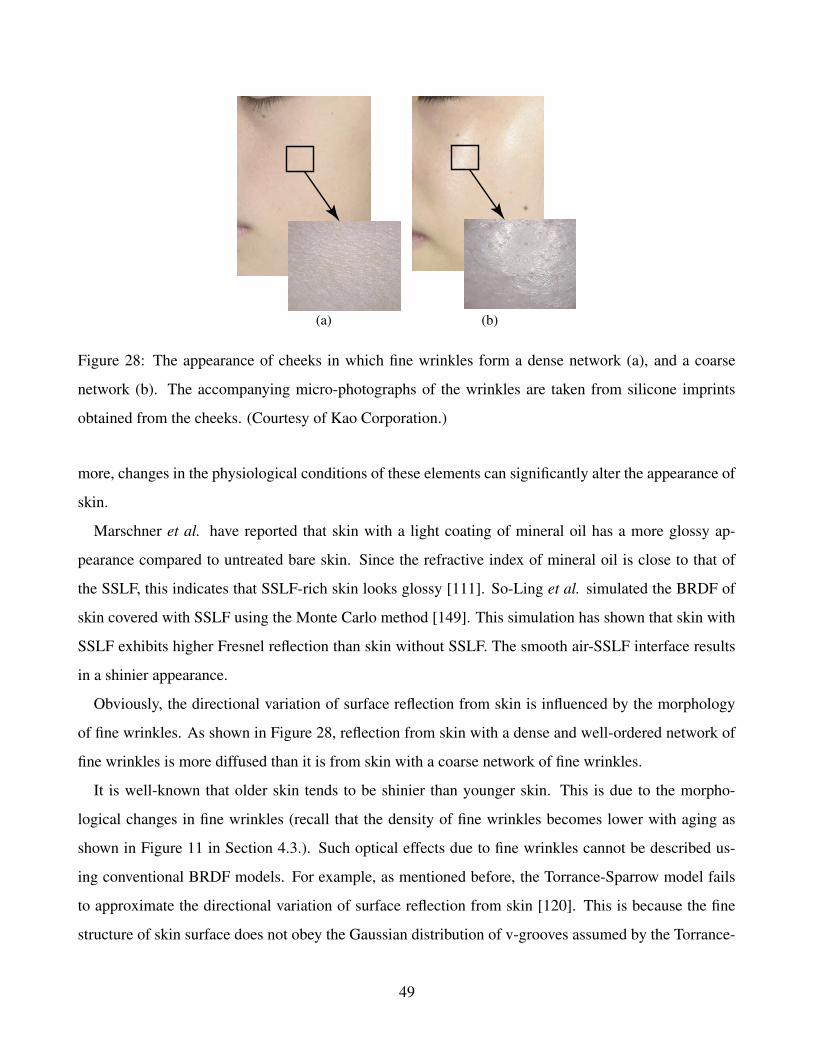
(a) (b)
Figure 28: The appearance of cheeks in which fine wrinkles form a dense network (a), and a coarse
network (b). The accompanying micro-photographs of the wrinkles are taken from silicone imprints
obtained from the cheeks. (Courtesy of Kao Corporation.)
more, changes in the physiological conditions of these elements can significantly alter the appearance of
skin.
Marschner et al. have reported that skin with a light coating of mineral oil has a more glossy ap-
pearance compared to untreated bare skin. Since the refractive index of mineral oil is close to that of
the SSLF, this indicates that SSLF-rich skin looks glossy [111]. So-Ling et al. simulated the BRDF of
skin covered with SSLF using the Monte Carlo method [149]. This simulation has shown that skin with
SSLF exhibits higher Fresnel reflection than skin without SSLF. The smooth air-SSLF interface results
in a shinier appearance.
Obviously, the directional variation of surface reflection from skin is influenced by the morphology
of fine wrinkles. As shown in Figure 28, reflection from skin with a dense and well-ordered network of
fine wrinkles is more diffused than it is from skin with a coarse network of fine wrinkles.
It is well-known that older skin tends to be shinier than younger skin. This is due to the morpho-
logical changes in fine wrinkles (recall that the density of fine wrinkles becomes lower with aging as
shown in Figure 11 in Section 4.3.). Such optical effects due to fine wrinkles cannot be described us-
ing conventional BRDF models. For example, as mentioned before, the Torrance-Sparrow model fails
to approximate the directional variation of surface reflection from skin [120]. This is because the fine
structure of skin surface does not obey the Gaussian distribution of v-grooves assumed by the Torrance-
49
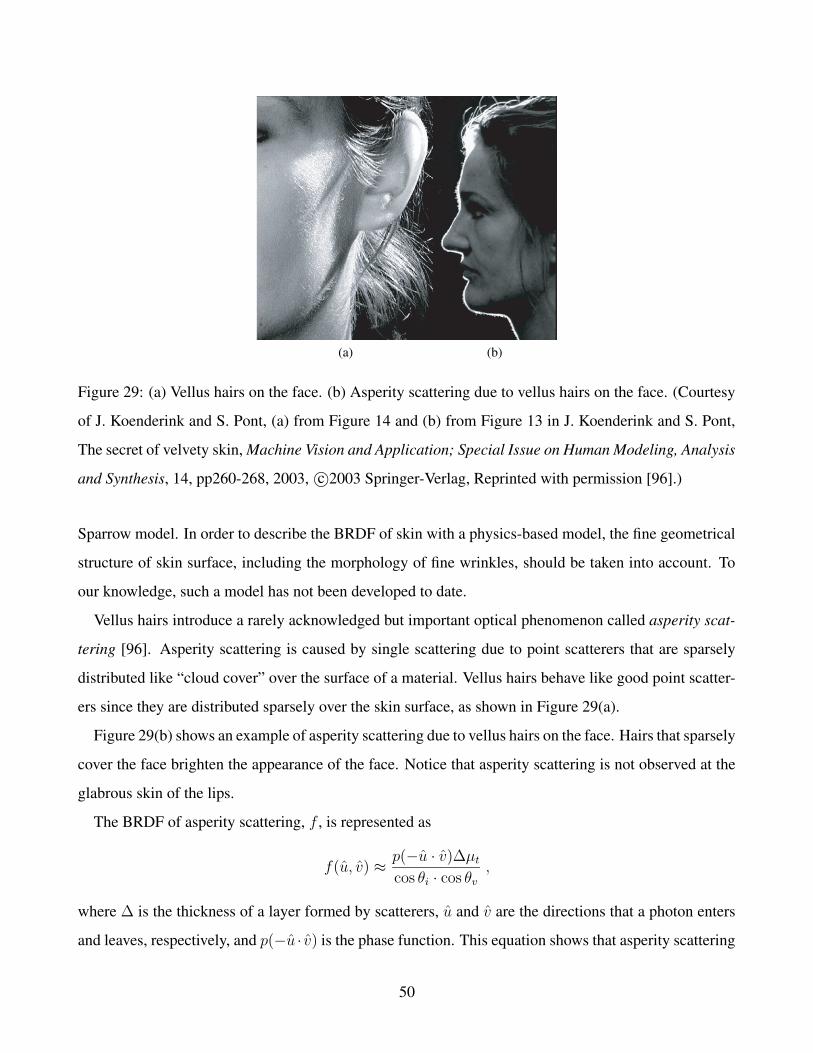
(a) (b)
Figure 29: (a) Vellus hairs on the face. (b) Asperity scattering due to vellus hairs on the face. (Courtesy
of J. Koenderink and S. Pont, (a) from Figure 14 and (b) from Figure 13 in J. Koenderink and S. Pont,
The secret of velvety skin, Machine Vision and Application; Special Issue on Human Modeling, Analysis
and Synthesis, 14, pp260-268, 2003, c©2003 Springer-Verlag, Reprinted with permission [96].)
Sparrow model. In order to describe the BRDF of skin with a physics-based model, the fine geometrical
structure of skin surface, including the morphology of fine wrinkles, should be taken into account. To
our knowledge, such a model has not been developed to date.
Vellus hairs introduce a rarely acknowledged but important optical phenomenon called asperity scat-
tering [96]. Asperity scattering is caused by single scattering due to point scatterers that are sparsely
distributed like “cloud cover” over the surface of a material. Vellus hairs behave like good point scatter-
ers since they are distributed sparsely over the skin surface, as shown in Figure 29(a).
Figure 29(b) shows an example of asperity scattering due to vellus hairs on the face. Hairs that sparsely
cover the face brighten the appearance of the face. Notice that asperity scattering is not observed at the
glabrous skin of the lips.
The BRDF of asperity scattering, f , is represented as
f(u, v) ≈ p(−u · v)∆µt
cos θi · cos θv
,
where ∆ is the thickness of a layer formed by scatterers, u and v are the directions that a photon enters
and leaves, respectively, and p(−u · v) is the phase function. This equation shows that asperity scattering
50
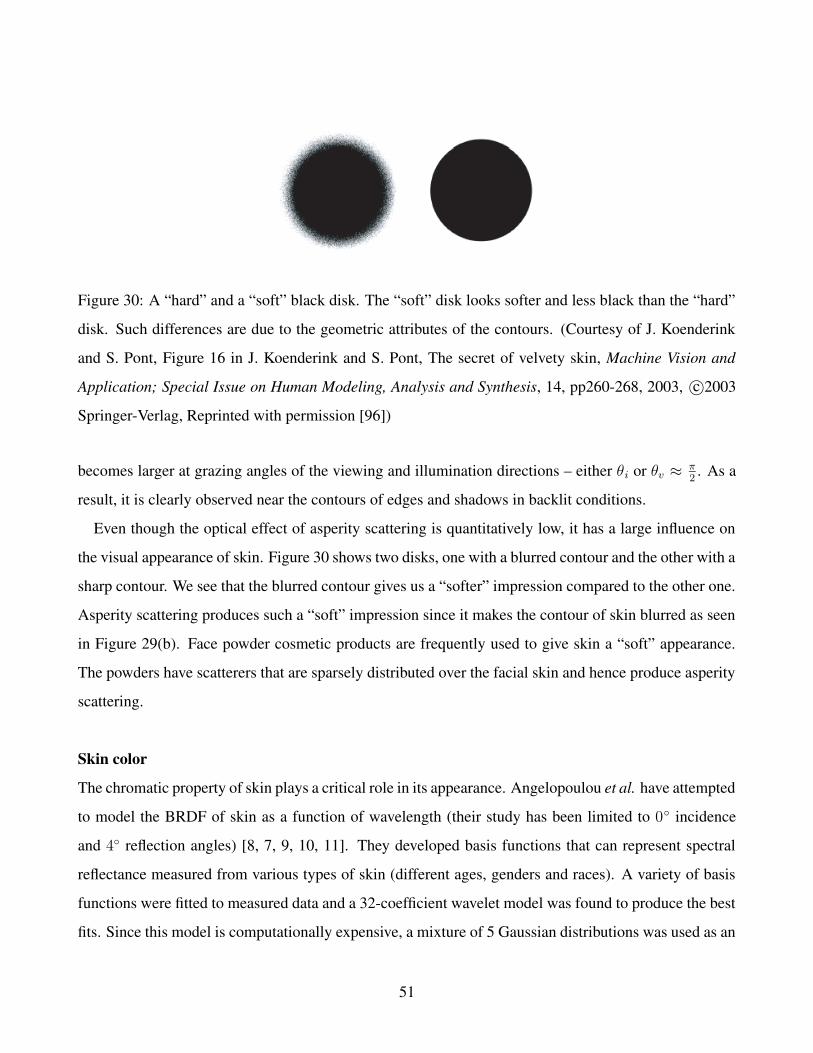
Figure 30: A “hard” and a “soft” black disk. The “soft” disk looks softer and less black than the “hard”
disk. Such differences are due to the geometric attributes of the contours. (Courtesy of J. Koenderink
and S. Pont, Figure 16 in J. Koenderink and S. Pont, The secret of velvety skin, Machine Vision and
Application; Special Issue on Human Modeling, Analysis and Synthesis, 14, pp260-268, 2003, c©2003
Springer-Verlag, Reprinted with permission [96])
becomes larger at grazing angles of the viewing and illumination directions – either θi or θv ≈ π2. As a
result, it is clearly observed near the contours of edges and shadows in backlit conditions.
Even though the optical effect of asperity scattering is quantitatively low, it has a large influence on
the visual appearance of skin. Figure 30 shows two disks, one with a blurred contour and the other with a
sharp contour. We see that the blurred contour gives us a “softer” impression compared to the other one.
Asperity scattering produces such a “soft” impression since it makes the contour of skin blurred as seen
in Figure 29(b). Face powder cosmetic products are frequently used to give skin a “soft” appearance.
The powders have scatterers that are sparsely distributed over the facial skin and hence produce asperity
scattering.
Skin color
The chromatic property of skin plays a critical role in its appearance. Angelopoulou et al. have attempted
to model the BRDF of skin as a function of wavelength (their study has been limited to 0◦ incidence
and 4◦ reflection angles) [8, 7, 9, 10, 11]. They developed basis functions that can represent spectral
reflectance measured from various types of skin (different ages, genders and races). A variety of basis
functions were fitted to measured data and a 32-coefficient wavelet model was found to produce the best
fits. Since this model is computationally expensive, a mixture of 5 Gaussian distributions was used as an
51
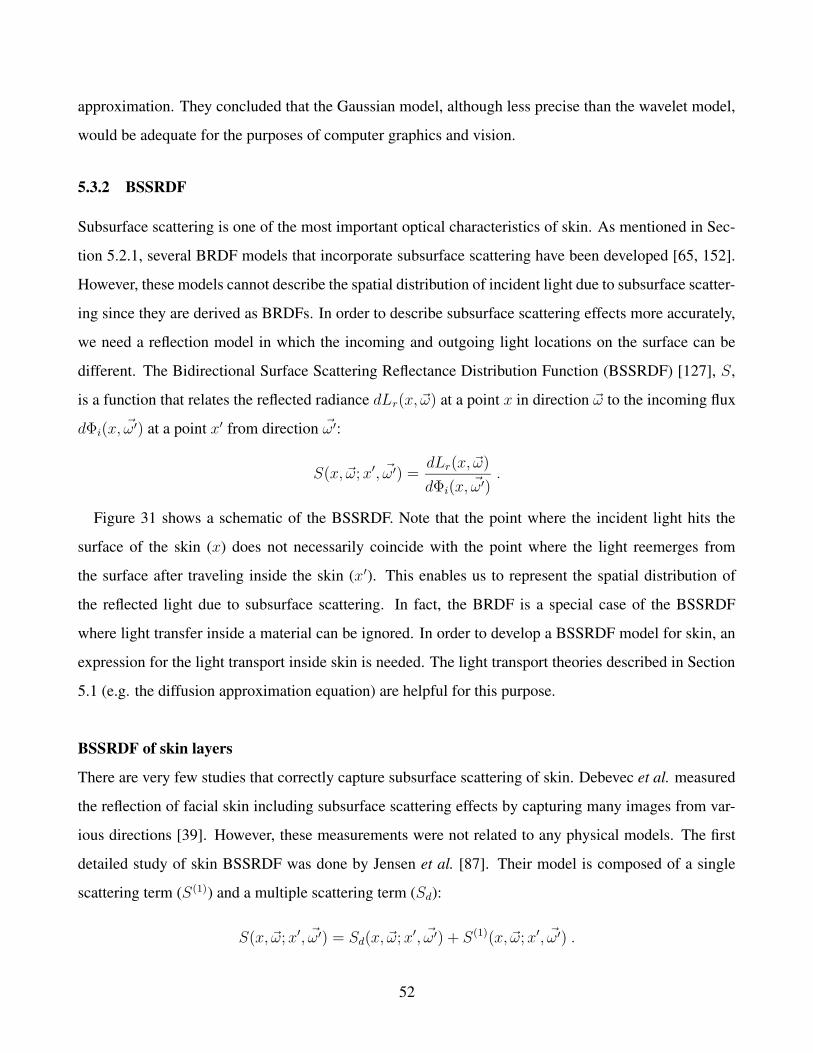
approximation. They concluded that the Gaussian model, although less precise than the wavelet model,
would be adequate for the purposes of computer graphics and vision.
5.3.2 BSSRDF
Subsurface scattering is one of the most important optical characteristics of skin. As mentioned in Sec-
tion 5.2.1, several BRDF models that incorporate subsurface scattering have been developed [65, 152].
However, these models cannot describe the spatial distribution of incident light due to subsurface scatter-
ing since they are derived as BRDFs. In order to describe subsurface scattering effects more accurately,
we need a reflection model in which the incoming and outgoing light locations on the surface can be
different. The Bidirectional Surface Scattering Reflectance Distribution Function (BSSRDF) [127], S,
is a function that relates the reflected radiance dLr(x, �ω) at a point x in direction �ω to the incoming flux
dΦi(x, �ω′) at a point x′ from direction �ω′:
S(x, �ω; x′, �ω′) =dLr(x, �ω)
dΦi(x, �ω′).
Figure 31 shows a schematic of the BSSRDF. Note that the point where the incident light hits the
surface of the skin (x) does not necessarily coincide with the point where the light reemerges from
the surface after traveling inside the skin (x′). This enables us to represent the spatial distribution of
the reflected light due to subsurface scattering. In fact, the BRDF is a special case of the BSSRDF
where light transfer inside a material can be ignored. In order to develop a BSSRDF model for skin, an
expression for the light transport inside skin is needed. The light transport theories described in Section
5.1 (e.g. the diffusion approximation equation) are helpful for this purpose.
BSSRDF of skin layers
There are very few studies that correctly capture subsurface scattering of skin. Debevec et al. measured
the reflection of facial skin including subsurface scattering effects by capturing many images from var-
ious directions [39]. However, these measurements were not related to any physical models. The first
detailed study of skin BSSRDF was done by Jensen et al. [87]. Their model is composed of a single
scattering term (S(1)) and a multiple scattering term (Sd):
S(x, �ω; x′, �ω′) = Sd(x, �ω; x′, �ω′) + S(1)(x, �ω; x′, �ω′) .
52
Figure 31: A schematic representation of the BSSRDF. The BSSRDF relates the reflected radiance to
the incoming flux as a function of illumination and viewing directions. Unlike the BRDF, the point of
incidence is not necessarily coincident with the point of reflection. This enables the BSSRDF to capture
subsurface scattering effects more accurately.
In the case of skin, a significant portion of the incident light undergoes multiple scattering in the dermis.
Hence, the multiple scattering term is generally larger than the single scattering term.
In order to build a physical model for the multiple scattering term, Jensen et al. employed the spa-
tially resolved steady-state diffuse reflectance equation (see Section 5.2.3 [52]). Note that the spatially
resolved diffuse reflectance equation is derived from the diffusion approximation equation. Hence, this
equation represents the spatial distribution of the light due to subsurface scattering assuming isotropic
scattering. By taking into account the Fresnel reflection at the boundary for the incoming and outgoing
light, the spatially resolved diffuse reflectance Rd(‖x′ − x‖) can be included in the BSSRDF model of
skin as
Sd(x, �ω; x′, �ω′) =1
πFt(η, �ω)Rd(‖x′ − x‖)Ft(η, �ω′) ,
where Ft(η, �ω) and Ft(η, �ω′) are the Fresnel transmittances in the directions �ω and �ω′, respectively, for
refractive index η.
As expected, the BSSRDF model yields more realistic rendered skin compared to BRDF models.
Faces rendered with a BRDF and the above BSSRDF model are shown in Figure 32 (a) and (b), respec-
tively. The image rendered using the BSSRDF model is much softer and gives a more translucent look
compared to the image rendered using a BRDF model. In the BSSRDF case, internal color bleeding
caused by the absorption of light by blood in the deeper levels of skin is also observed in the shadow re-
gion under the nose. Such subtle and yet clearly visible differences between the two images demonstrate
the importance of the spatial distribution of the reflected light due to subsurface scattering.
53

(a) (b)
Figure 32: A face rendered with a BRDF model (a) and the BSSRDF model (b). The BSSRDF model
produces a softer appearance. It also produces “internal color bleeding” effects which are critical to the
appearance of translucent materials (see the shadow region under the nose). (Courtesy of H.W. Jensen,
Figure 11 in H.W. Jensen, S.R. Marschner, M. Levoy, and P. Hanrahan, A Practical model for subsur-
face light transport, Proceedings of the 28th Annual Conference on Computer Graphics and Interactive
Techniques SIGGRAPH 2001, pp511-518, 2001, c©2001 ACM, Inc. Reprinted with permission [87].)
Although the appearance of Figure 32(b) is much more realistic compared to Figure 32(a), the skin
surface still looks harder than real skin. This difference is mainly due to the following factors. Firstly, the
BSSRDF model developed by Jensen et al. only considers single and multiple scattering. However, light
experiences scattering more than once but just a few times in the transition zone (i.e. the upper regions
of skin around the epidermal and papillary layers). Scattering in this zone is not correctly taken into
account in the above model as it uses the diffusion approximation for multiple scattering. The diffusion
approximation overestimates the total fluence rate in the transition zone as mentioned in Section 5.2.3.
Consequently, the model does not adequately capture the transparency of the transition zone. In order
to accurately describe the anisotropic light transfer in this zone, a full-blown computational simulation
using Monte Carlo methods and adding-doubling methods must be done. Secondly, skin was modeled
as a semi-infinite single layer in the development of the BSSRDF model. However, skin is composed of
several layers that have different scattering and absorption properties. It is hard to accurately describe
light transport in a multi-layered structure with semi-infinite single-layered models. Thirdly, the model
uses scattering and absorption coefficients of the arm region for rendering facial skin. As we will de-
54
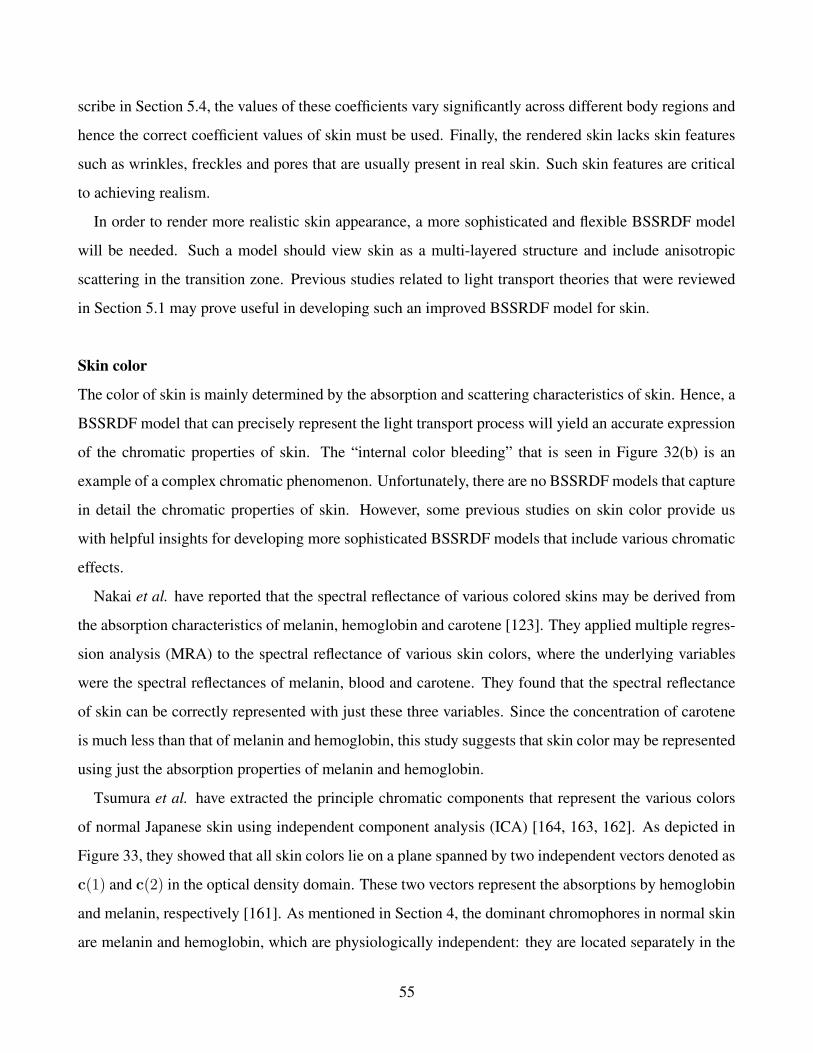
scribe in Section 5.4, the values of these coefficients vary significantly across different body regions and
hence the correct coefficient values of skin must be used. Finally, the rendered skin lacks skin features
such as wrinkles, freckles and pores that are usually present in real skin. Such skin features are critical
to achieving realism.
In order to render more realistic skin appearance, a more sophisticated and flexible BSSRDF model
will be needed. Such a model should view skin as a multi-layered structure and include anisotropic
scattering in the transition zone. Previous studies related to light transport theories that were reviewed
in Section 5.1 may prove useful in developing such an improved BSSRDF model for skin.
Skin color
The color of skin is mainly determined by the absorption and scattering characteristics of skin. Hence, a
BSSRDF model that can precisely represent the light transport process will yield an accurate expression
of the chromatic properties of skin. The “internal color bleeding” that is seen in Figure 32(b) is an
example of a complex chromatic phenomenon. Unfortunately, there are no BSSRDF models that capture
in detail the chromatic properties of skin. However, some previous studies on skin color provide us
with helpful insights for developing more sophisticated BSSRDF models that include various chromatic
effects.
Nakai et al. have reported that the spectral reflectance of various colored skins may be derived from
the absorption characteristics of melanin, hemoglobin and carotene [123]. They applied multiple regres-
sion analysis (MRA) to the spectral reflectance of various skin colors, where the underlying variables
were the spectral reflectances of melanin, blood and carotene. They found that the spectral reflectance
of skin can be correctly represented with just these three variables. Since the concentration of carotene
is much less than that of melanin and hemoglobin, this study suggests that skin color may be represented
using just the absorption properties of melanin and hemoglobin.
Tsumura et al. have extracted the principle chromatic components that represent the various colors
of normal Japanese skin using independent component analysis (ICA) [164, 163, 162]. As depicted in
Figure 33, they showed that all skin colors lie on a plane spanned by two independent vectors denoted as
c(1) and c(2) in the optical density domain. These two vectors represent the absorptions by hemoglobin
and melanin, respectively [161]. As mentioned in Section 4, the dominant chromophores in normal skin
are melanin and hemoglobin, which are physiologically independent: they are located separately in the
55
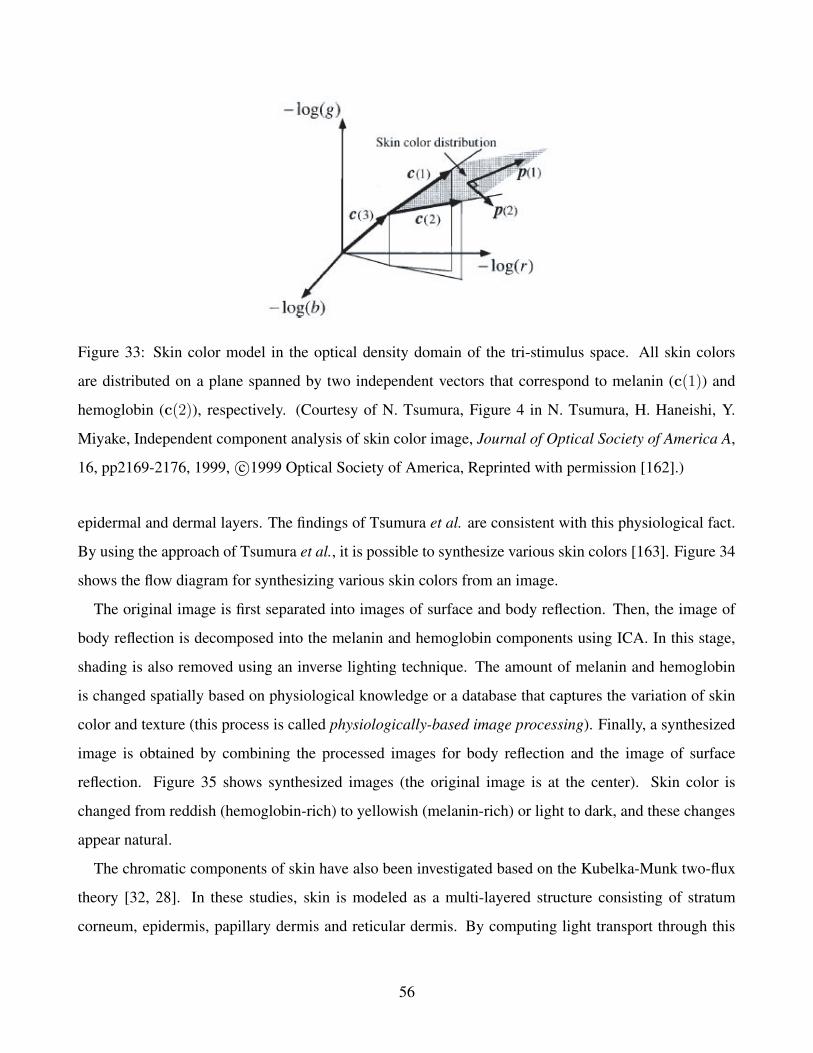
Figure 33: Skin color model in the optical density domain of the tri-stimulus space. All skin colors
are distributed on a plane spanned by two independent vectors that correspond to melanin (c(1)) and
hemoglobin (c(2)), respectively. (Courtesy of N. Tsumura, Figure 4 in N. Tsumura, H. Haneishi, Y.
Miyake, Independent component analysis of skin color image, Journal of Optical Society of America A,
16, pp2169-2176, 1999, c©1999 Optical Society of America, Reprinted with permission [162].)
epidermal and dermal layers. The findings of Tsumura et al. are consistent with this physiological fact.
By using the approach of Tsumura et al., it is possible to synthesize various skin colors [163]. Figure 34
shows the flow diagram for synthesizing various skin colors from an image.
The original image is first separated into images of surface and body reflection. Then, the image of
body reflection is decomposed into the melanin and hemoglobin components using ICA. In this stage,
shading is also removed using an inverse lighting technique. The amount of melanin and hemoglobin
is changed spatially based on physiological knowledge or a database that captures the variation of skin
color and texture (this process is called physiologically-based image processing). Finally, a synthesized
image is obtained by combining the processed images for body reflection and the image of surface
reflection. Figure 35 shows synthesized images (the original image is at the center). Skin color is
changed from reddish (hemoglobin-rich) to yellowish (melanin-rich) or light to dark, and these changes
appear natural.
The chromatic components of skin have also been investigated based on the Kubelka-Munk two-flux
theory [32, 28]. In these studies, skin is modeled as a multi-layered structure consisting of stratum
corneum, epidermis, papillary dermis and reticular dermis. By computing light transport through this
56
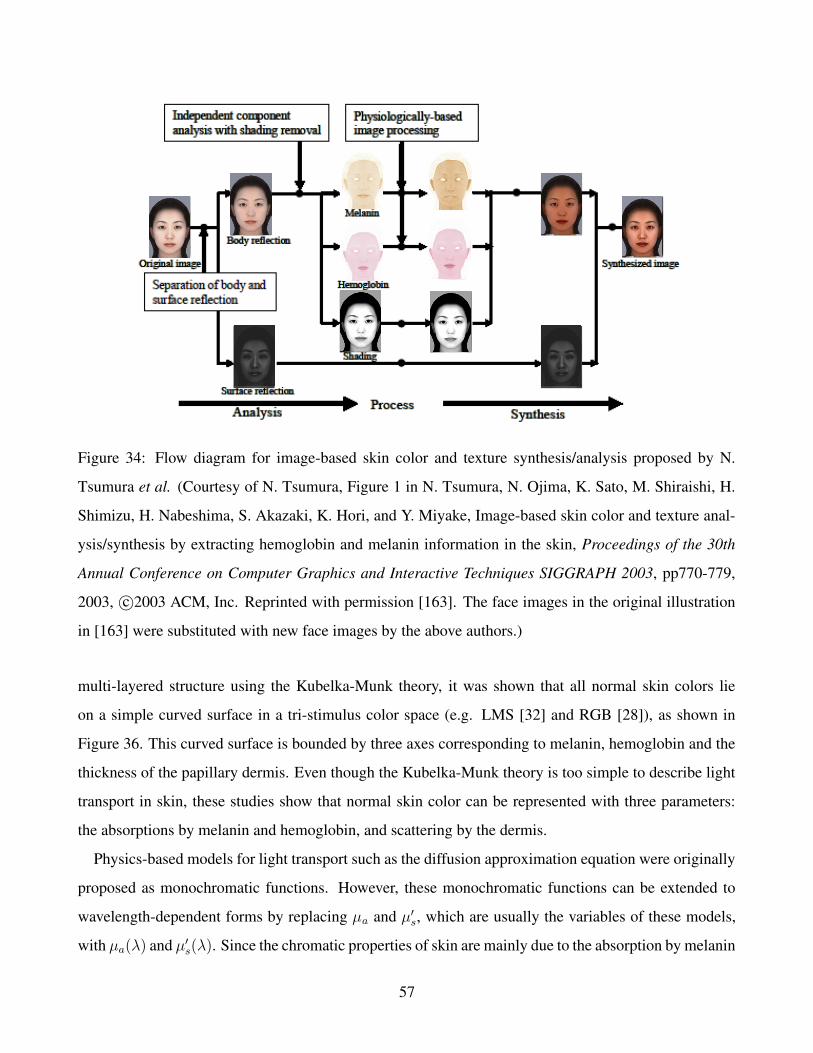
Figure 34: Flow diagram for image-based skin color and texture synthesis/analysis proposed by N.
Tsumura et al. (Courtesy of N. Tsumura, Figure 1 in N. Tsumura, N. Ojima, K. Sato, M. Shiraishi, H.
Shimizu, H. Nabeshima, S. Akazaki, K. Hori, and Y. Miyake, Image-based skin color and texture anal-
ysis/synthesis by extracting hemoglobin and melanin information in the skin, Proceedings of the 30th
Annual Conference on Computer Graphics and Interactive Techniques SIGGRAPH 2003, pp770-779,
2003, c©2003 ACM, Inc. Reprinted with permission [163]. The face images in the original illustration
in [163] were substituted with new face images by the above authors.)
multi-layered structure using the Kubelka-Munk theory, it was shown that all normal skin colors lie
on a simple curved surface in a tri-stimulus color space (e.g. LMS [32] and RGB [28]), as shown in
Figure 36. This curved surface is bounded by three axes corresponding to melanin, hemoglobin and the
thickness of the papillary dermis. Even though the Kubelka-Munk theory is too simple to describe light
transport in skin, these studies show that normal skin color can be represented with three parameters:
the absorptions by melanin and hemoglobin, and scattering by the dermis.
Physics-based models for light transport such as the diffusion approximation equation were originally
proposed as monochromatic functions. However, these monochromatic functions can be extended to
wavelength-dependent forms by replacing µa and µ′
s, which are usually the variables of these models,
with µa(λ) and µ′
s(λ). Since the chromatic properties of skin are mainly due to the absorption by melanin
57
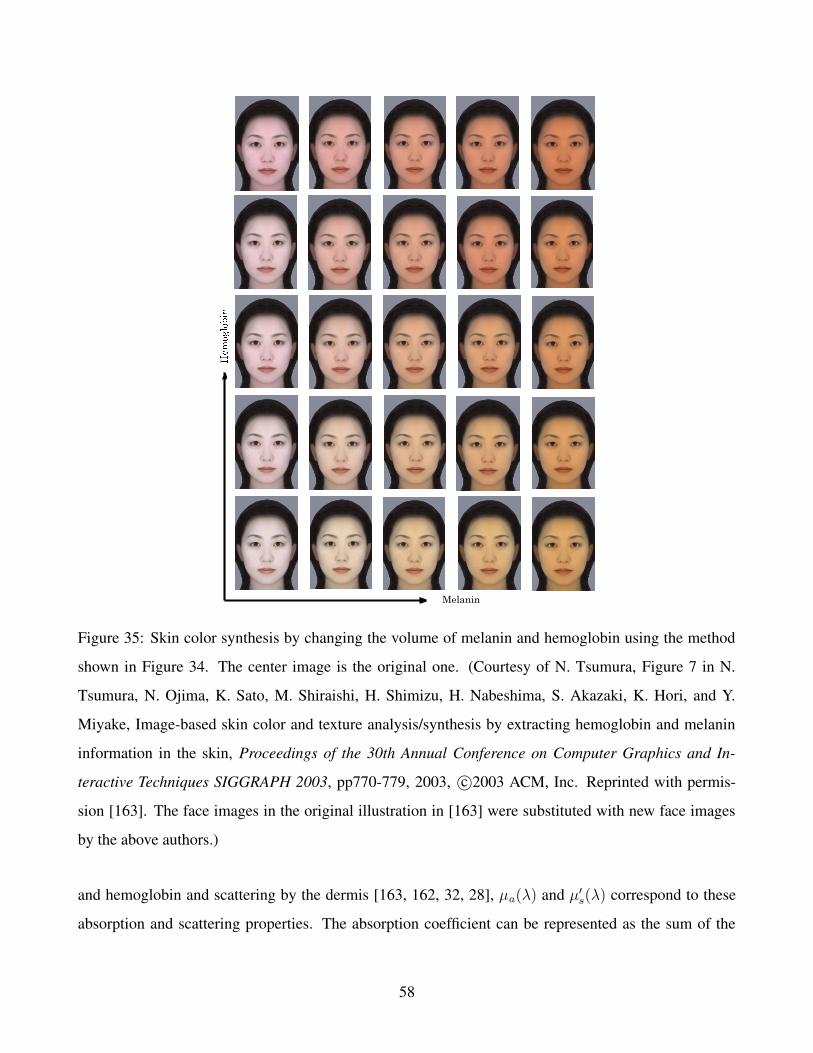
Melanin
� ����
� ��� �
Figure 35: Skin color synthesis by changing the volume of melanin and hemoglobin using the method
shown in Figure 34. The center image is the original one. (Courtesy of N. Tsumura, Figure 7 in N.
Tsumura, N. Ojima, K. Sato, M. Shiraishi, H. Shimizu, H. Nabeshima, S. Akazaki, K. Hori, and Y.
Miyake, Image-based skin color and texture analysis/synthesis by extracting hemoglobin and melanin
information in the skin, Proceedings of the 30th Annual Conference on Computer Graphics and In-
teractive Techniques SIGGRAPH 2003, pp770-779, 2003, c©2003 ACM, Inc. Reprinted with permis-
sion [163]. The face images in the original illustration in [163] were substituted with new face images
by the above authors.)
and hemoglobin and scattering by the dermis [163, 162, 32, 28], µa(λ) and µ′
s(λ) correspond to these
absorption and scattering properties. The absorption coefficient can be represented as the sum of the
58
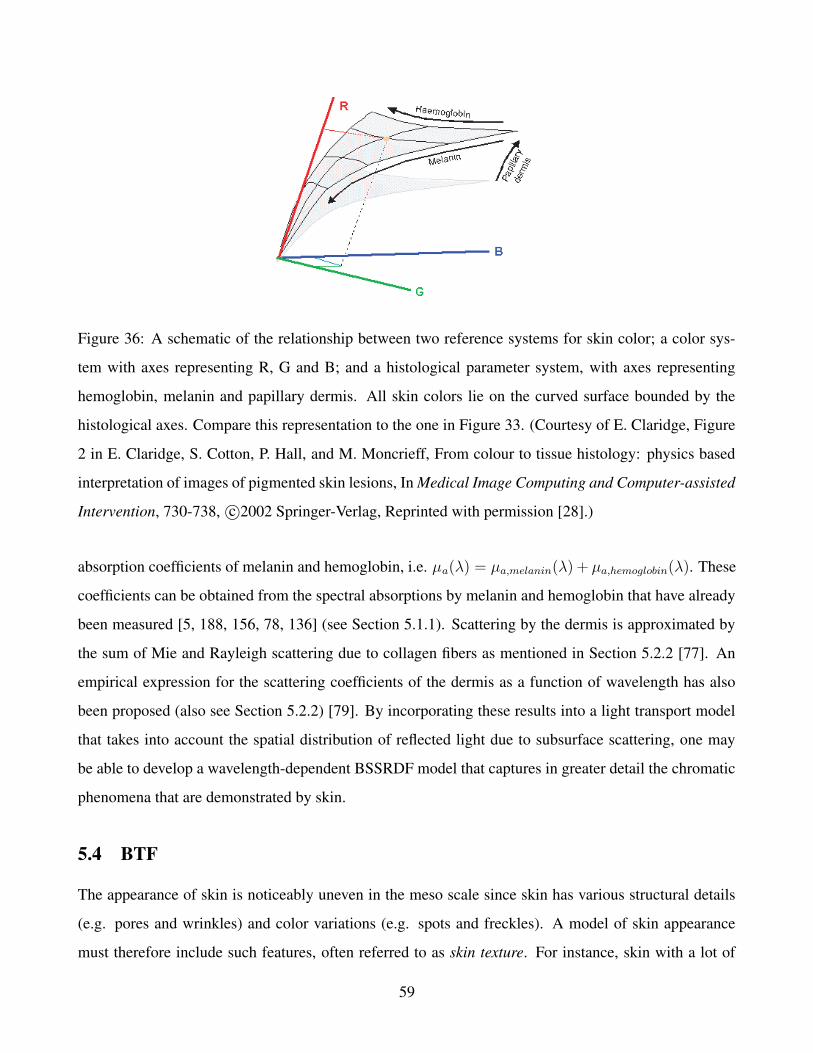
Figure 36: A schematic of the relationship between two reference systems for skin color; a color sys-
tem with axes representing R, G and B; and a histological parameter system, with axes representing
hemoglobin, melanin and papillary dermis. All skin colors lie on the curved surface bounded by the
histological axes. Compare this representation to the one in Figure 33. (Courtesy of E. Claridge, Figure
2 in E. Claridge, S. Cotton, P. Hall, and M. Moncrieff, From colour to tissue histology: physics based
interpretation of images of pigmented skin lesions, In Medical Image Computing and Computer-assisted
Intervention, 730-738, c©2002 Springer-Verlag, Reprinted with permission [28].)
absorption coefficients of melanin and hemoglobin, i.e. µa(λ) = µa,melanin(λ) + µa,hemoglobin(λ). These
coefficients can be obtained from the spectral absorptions by melanin and hemoglobin that have already
been measured [5, 188, 156, 78, 136] (see Section 5.1.1). Scattering by the dermis is approximated by
the sum of Mie and Rayleigh scattering due to collagen fibers as mentioned in Section 5.2.2 [77]. An
empirical expression for the scattering coefficients of the dermis as a function of wavelength has also
been proposed (also see Section 5.2.2) [79]. By incorporating these results into a light transport model
that takes into account the spatial distribution of reflected light due to subsurface scattering, one may
be able to develop a wavelength-dependent BSSRDF model that captures in greater detail the chromatic
phenomena that are demonstrated by skin.
5.4 BTF
The appearance of skin is noticeably uneven in the meso scale since skin has various structural details
(e.g. pores and wrinkles) and color variations (e.g. spots and freckles). A model of skin appearance
must therefore include such features, often referred to as skin texture. For instance, skin with a lot of
59
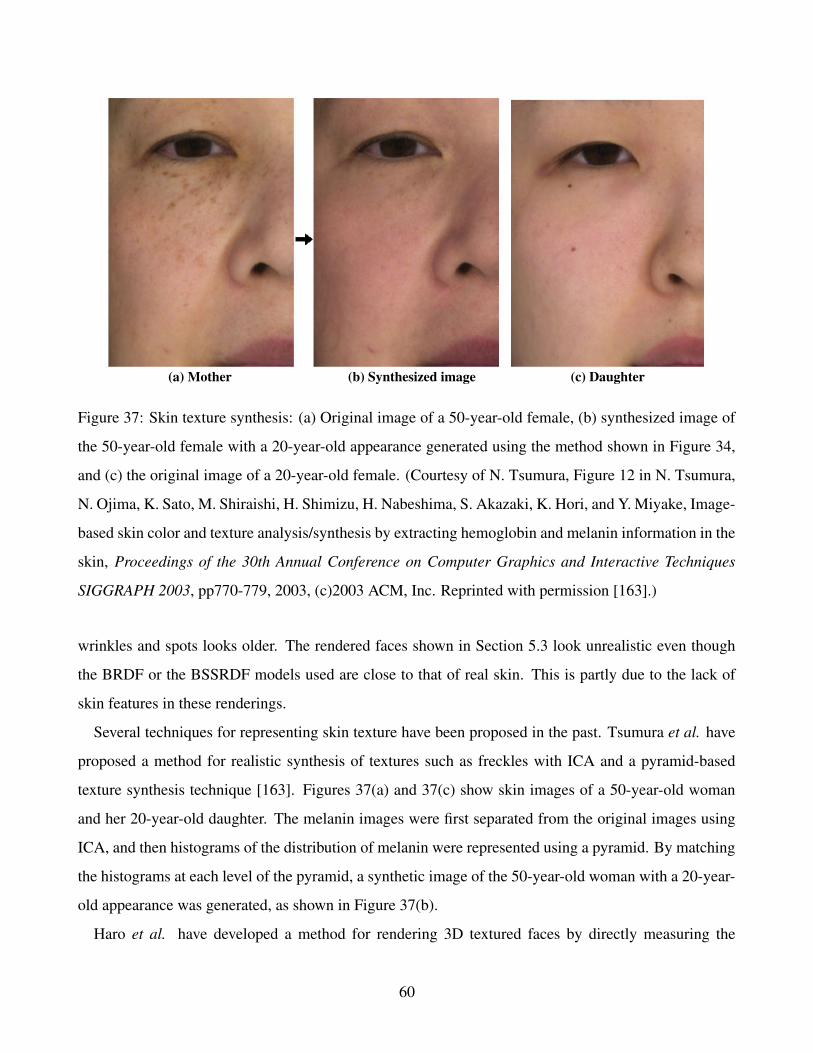
(a) Mother (b) Synthesized image (c) Daughter
Figure 37: Skin texture synthesis: (a) Original image of a 50-year-old female, (b) synthesized image of
the 50-year-old female with a 20-year-old appearance generated using the method shown in Figure 34,
and (c) the original image of a 20-year-old female. (Courtesy of N. Tsumura, Figure 12 in N. Tsumura,
N. Ojima, K. Sato, M. Shiraishi, H. Shimizu, H. Nabeshima, S. Akazaki, K. Hori, and Y. Miyake, Image-
based skin color and texture analysis/synthesis by extracting hemoglobin and melanin information in the
skin, Proceedings of the 30th Annual Conference on Computer Graphics and Interactive Techniques
SIGGRAPH 2003, pp770-779, 2003, (c)2003 ACM, Inc. Reprinted with permission [163].)
wrinkles and spots looks older. The rendered faces shown in Section 5.3 look unrealistic even though
the BRDF or the BSSRDF models used are close to that of real skin. This is partly due to the lack of
skin features in these renderings.
Several techniques for representing skin texture have been proposed in the past. Tsumura et al. have
proposed a method for realistic synthesis of textures such as freckles with ICA and a pyramid-based
texture synthesis technique [163]. Figures 37(a) and 37(c) show skin images of a 50-year-old woman
and her 20-year-old daughter. The melanin images were first separated from the original images using
ICA, and then histograms of the distribution of melanin were represented using a pyramid. By matching
the histograms at each level of the pyramid, a synthetic image of the 50-year-old woman with a 20-year-
old appearance was generated, as shown in Figure 37(b).
Haro et al. have developed a method for rendering 3D textured faces by directly measuring the
60
geometrically fine structure of the skin surface [67]. In order to capture the fine structure, they took
imprints from skin and then computed the surface normals using a shape from shading algorithm. By
using the computed surface normals and measured BRDF, the synthetic face shown in the right column
of Figure 38 was generated. By comparing this textured skin to skin without texture (the left column of
Figure 38), we see that the fine details of the skin surface add realism to the rendered faces. For instance,
specular highlights such as those on the forehead and the left cheek look more realistic when there is
fine detail within the highlights.
The appearance of skin texture varies significantly depending on the direction from which it is viewed
and illuminated. Figure 39 shows an example of the directional variation of skin texture. The appearance
of the texture varies dramatically with the lighting direction. While frontal illumination brings out
the color variations, more oblique lighting makes the surface details more visible. Figure 40 shows
another example. Here, the change in viewing direction gives rise to the visible effects of occlusion,
foreshortening, etc.
The above directional variations due to illumination and viewing are caused by geometrical phenom-
ena such as shadowing and interreflection. Conventional two-dimensional approaches for representing
skin texture [67, 122, 22, 76] cannot describe such directional variations. The Bidirectional Texture
Function (BTF) [38] is a useful concept for modeling the directional variation of the appearance of tex-
ture. Figure 41 illustrates the optical phenomena underlying the BTF. Similar to the BRDF that describes
the directional variation of reflectance at a surface point, the BTF models the directional property of tex-
ture as a function of four imaging angles (viewing and illumination directions). A detailed study of the
BTF of skin has been conducted by Cula et al. [36, 33, 35].
In order to build a database of skin BTF, Cula et al. captured images of skin surfaces with a CCD
camera while changing the viewing and illumination directions. Skin texture tends to vary according to
body region, age and gender. Therefore, the images were obtained for different body regions (the cheek,
nose, forehead and chin on the face, a fingertip, a bottom segment on the palm and the back side of the
index finger) of both females and males whose ages range from 24 to 53 years. Figure 42 and 43 are
examples (from facial regions and fingers) from the acquired BTF database. This database is unique as
it includes high resolution images of various types of skin textures and can help further research on skin
texture. The full database is available at http://www.caip.rutgers.edu/rutgers texture [34].
61
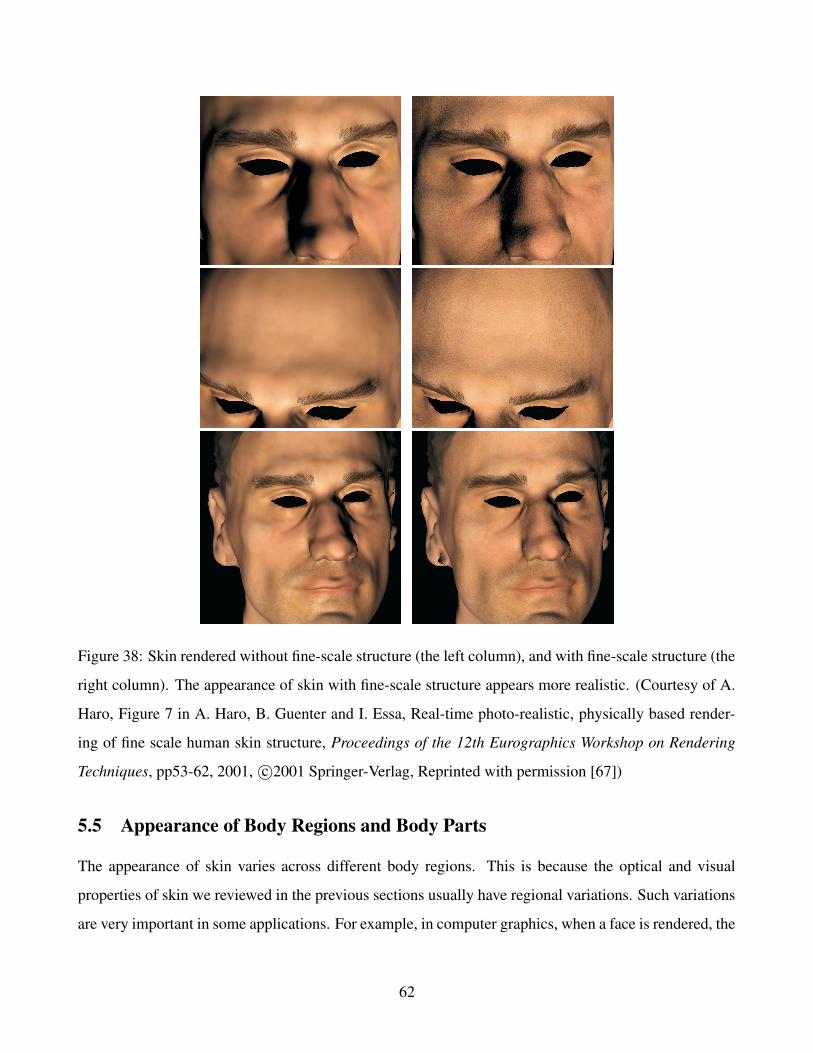
Figure 38: Skin rendered without fine-scale structure (the left column), and with fine-scale structure (the
right column). The appearance of skin with fine-scale structure appears more realistic. (Courtesy of A.
Haro, Figure 7 in A. Haro, B. Guenter and I. Essa, Real-time photo-realistic, physically based render-
ing of fine scale human skin structure, Proceedings of the 12th Eurographics Workshop on Rendering
Techniques, pp53-62, 2001, c©2001 Springer-Verlag, Reprinted with permission [67])
5.5 Appearance of Body Regions and Body Parts
The appearance of skin varies across different body regions. This is because the optical and visual
properties of skin we reviewed in the previous sections usually have regional variations. Such variations
are very important in some applications. For example, in computer graphics, when a face is rendered, the
62
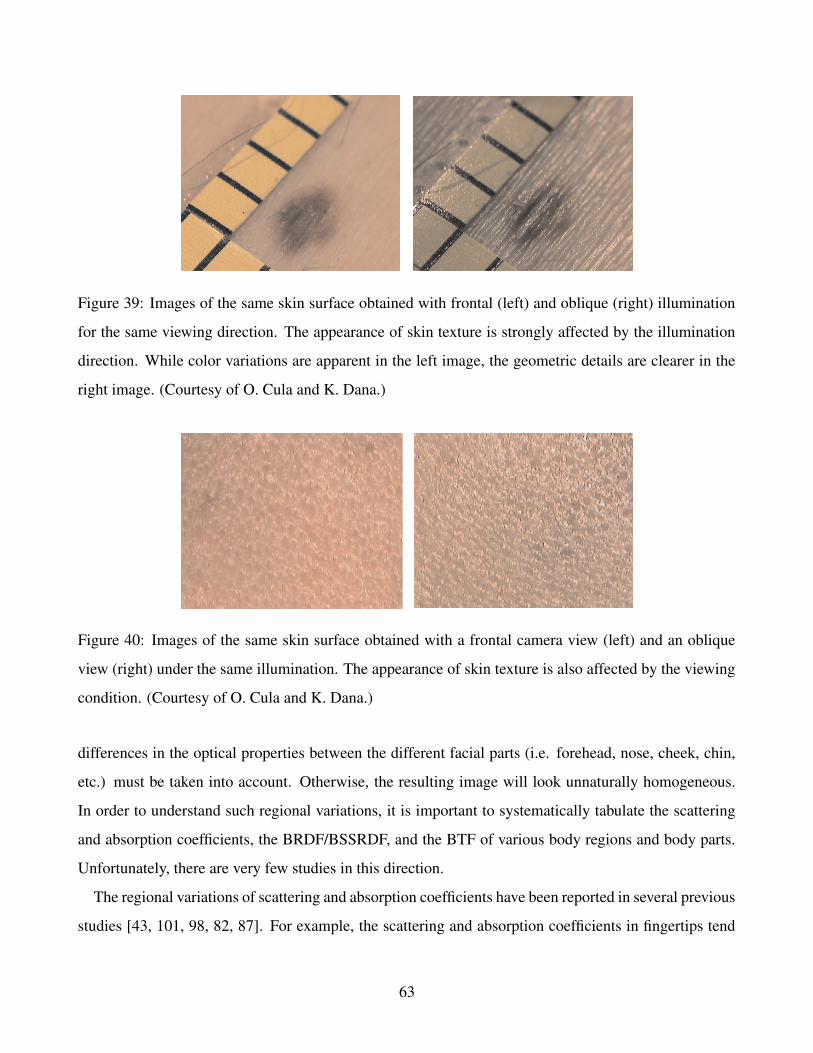
Figure 39: Images of the same skin surface obtained with frontal (left) and oblique (right) illumination
for the same viewing direction. The appearance of skin texture is strongly affected by the illumination
direction. While color variations are apparent in the left image, the geometric details are clearer in the
right image. (Courtesy of O. Cula and K. Dana.)
Figure 40: Images of the same skin surface obtained with a frontal camera view (left) and an oblique
view (right) under the same illumination. The appearance of skin texture is also affected by the viewing
condition. (Courtesy of O. Cula and K. Dana.)
differences in the optical properties between the different facial parts (i.e. forehead, nose, cheek, chin,
etc.) must be taken into account. Otherwise, the resulting image will look unnaturally homogeneous.
In order to understand such regional variations, it is important to systematically tabulate the scattering
and absorption coefficients, the BRDF/BSSRDF, and the BTF of various body regions and body parts.
Unfortunately, there are very few studies in this direction.
The regional variations of scattering and absorption coefficients have been reported in several previous
studies [43, 101, 98, 82, 87]. For example, the scattering and absorption coefficients in fingertips tend
63
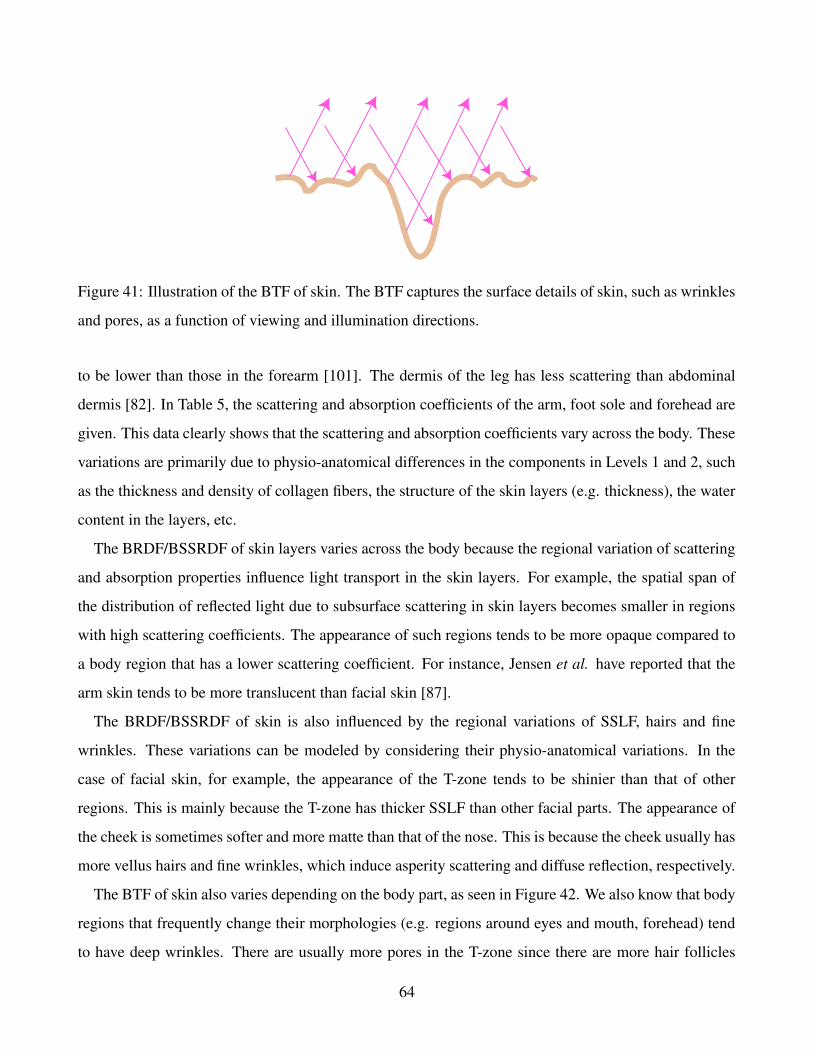
Figure 41: Illustration of the BTF of skin. The BTF captures the surface details of skin, such as wrinkles
and pores, as a function of viewing and illumination directions.
to be lower than those in the forearm [101]. The dermis of the leg has less scattering than abdominal
dermis [82]. In Table 5, the scattering and absorption coefficients of the arm, foot sole and forehead are
given. This data clearly shows that the scattering and absorption coefficients vary across the body. These
variations are primarily due to physio-anatomical differences in the components in Levels 1 and 2, such
as the thickness and density of collagen fibers, the structure of the skin layers (e.g. thickness), the water
content in the layers, etc.
The BRDF/BSSRDF of skin layers varies across the body because the regional variation of scattering
and absorption properties influence light transport in the skin layers. For example, the spatial span of
the distribution of reflected light due to subsurface scattering in skin layers becomes smaller in regions
with high scattering coefficients. The appearance of such regions tends to be more opaque compared to
a body region that has a lower scattering coefficient. For instance, Jensen et al. have reported that the
arm skin tends to be more translucent than facial skin [87].
The BRDF/BSSRDF of skin is also influenced by the regional variations of SSLF, hairs and fine
wrinkles. These variations can be modeled by considering their physio-anatomical variations. In the
case of facial skin, for example, the appearance of the T-zone tends to be shinier than that of other
regions. This is mainly because the T-zone has thicker SSLF than other facial parts. The appearance of
the cheek is sometimes softer and more matte than that of the nose. This is because the cheek usually has
more vellus hairs and fine wrinkles, which induce asperity scattering and diffuse reflection, respectively.
The BTF of skin also varies depending on the body part, as seen in Figure 42. We also know that body
regions that frequently change their morphologies (e.g. regions around eyes and mouth, forehead) tend
to have deep wrinkles. There are usually more pores in the T-zone since there are more hair follicles
64

Figure 42: Examples of facial skin texture images from http://www.caip.rutgers.edu/rutgers texture [34].
Each row contains images from a certain human subject, while the columns correspond to the forehead,
cheek, chin and nose (left to right). These examples clearly show the differences between skin textures
at different locations of the same subject and at same locations across different subjects. (Courtesy of O.
Cula and K. Dana.)
there compared to other facial regions. At this point in time, the skin texture database compiled by Cula
and Dana [34] is the only database that provides some insights into the variation of skin appearance with
respect to body regions/parts.
65
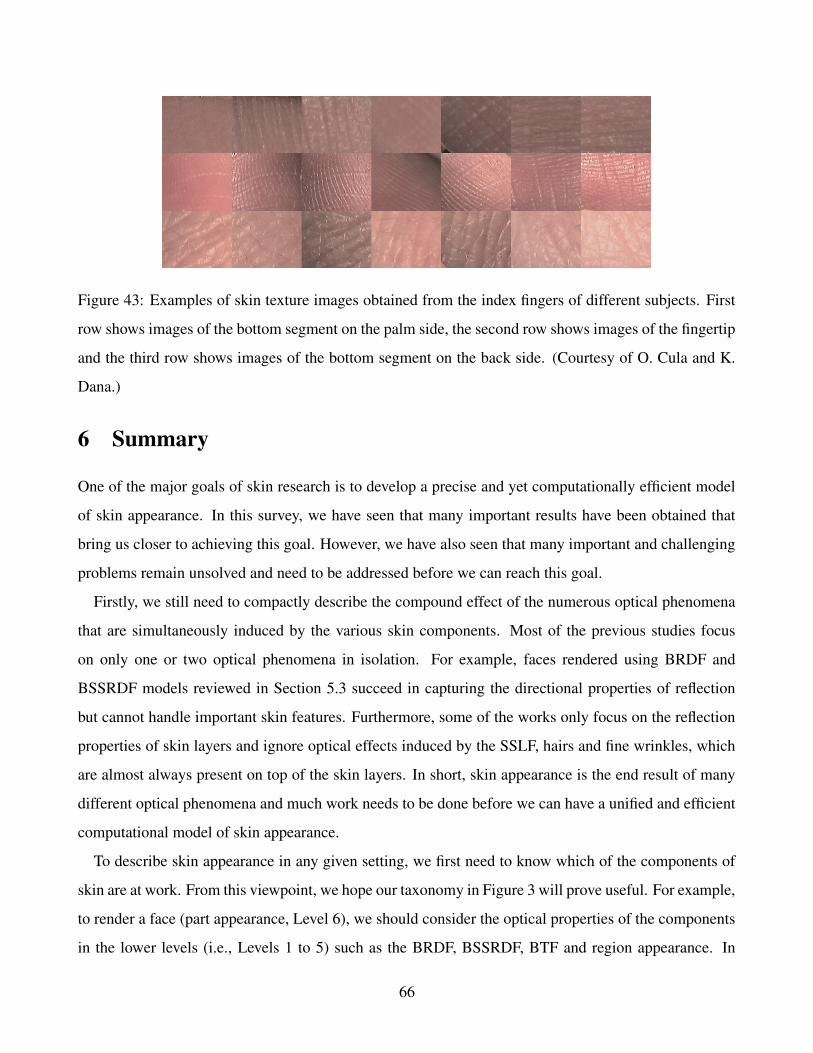
Figure 43: Examples of skin texture images obtained from the index fingers of different subjects. First
row shows images of the bottom segment on the palm side, the second row shows images of the fingertip
and the third row shows images of the bottom segment on the back side. (Courtesy of O. Cula and K.
Dana.)
6 Summary
One of the major goals of skin research is to develop a precise and yet computationally efficient model
of skin appearance. In this survey, we have seen that many important results have been obtained that
bring us closer to achieving this goal. However, we have also seen that many important and challenging
problems remain unsolved and need to be addressed before we can reach this goal.
Firstly, we still need to compactly describe the compound effect of the numerous optical phenomena
that are simultaneously induced by the various skin components. Most of the previous studies focus
on only one or two optical phenomena in isolation. For example, faces rendered using BRDF and
BSSRDF models reviewed in Section 5.3 succeed in capturing the directional properties of reflection
but cannot handle important skin features. Furthermore, some of the works only focus on the reflection
properties of skin layers and ignore optical effects induced by the SSLF, hairs and fine wrinkles, which
are almost always present on top of the skin layers. In short, skin appearance is the end result of many
different optical phenomena and much work needs to be done before we can have a unified and efficient
computational model of skin appearance.
To describe skin appearance in any given setting, we first need to know which of the components of
skin are at work. From this viewpoint, we hope our taxonomy in Figure 3 will prove useful. For example,
to render a face (part appearance, Level 6), we should consider the optical properties of the components
in the lower levels (i.e., Levels 1 to 5) such as the BRDF, BSSRDF, BTF and region appearance. In
66
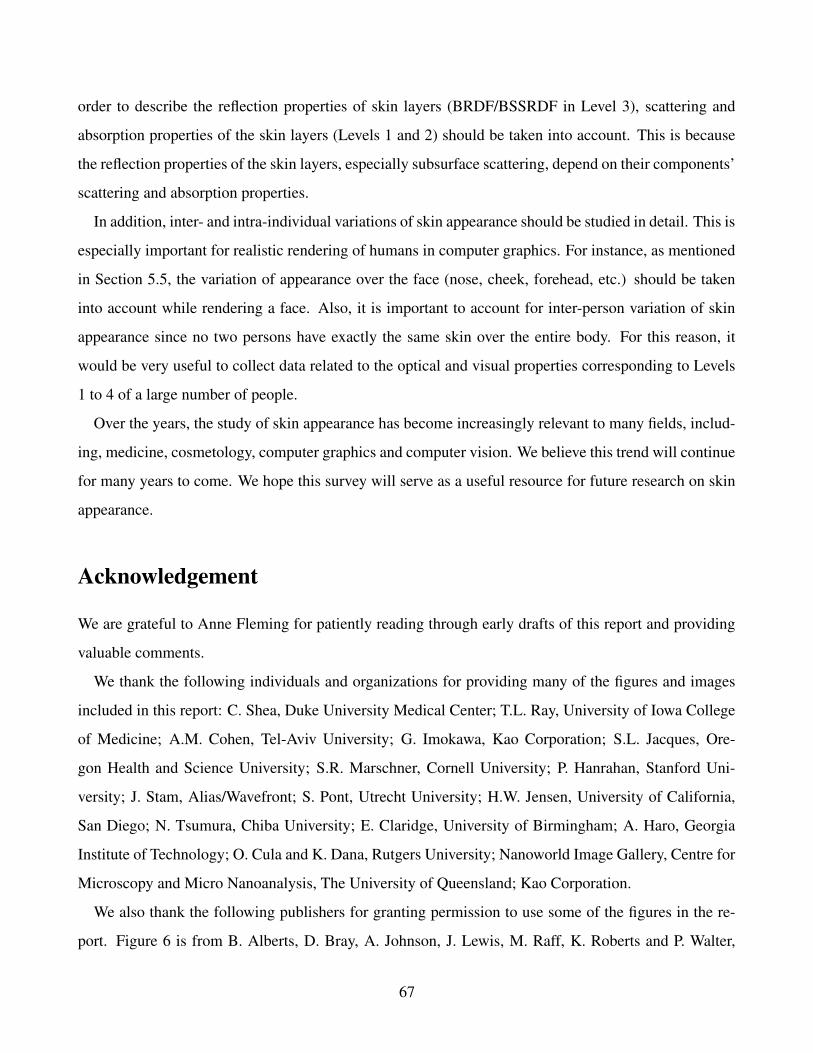
order to describe the reflection properties of skin layers (BRDF/BSSRDF in Level 3), scattering and
absorption properties of the skin layers (Levels 1 and 2) should be taken into account. This is because
the reflection properties of the skin layers, especially subsurface scattering, depend on their components’
scattering and absorption properties.
In addition, inter- and intra-individual variations of skin appearance should be studied in detail. This is
especially important for realistic rendering of humans in computer graphics. For instance, as mentioned
in Section 5.5, the variation of appearance over the face (nose, cheek, forehead, etc.) should be taken
into account while rendering a face. Also, it is important to account for inter-person variation of skin
appearance since no two persons have exactly the same skin over the entire body. For this reason, it
would be very useful to collect data related to the optical and visual properties corresponding to Levels
1 to 4 of a large number of people.
Over the years, the study of skin appearance has become increasingly relevant to many fields, includ-
ing, medicine, cosmetology, computer graphics and computer vision. We believe this trend will continue
for many years to come. We hope this survey will serve as a useful resource for future research on skin
appearance.
Acknowledgement
We are grateful to Anne Fleming for patiently reading through early drafts of this report and providing
valuable comments.
We thank the following individuals and organizations for providing many of the figures and images
included in this report: C. Shea, Duke University Medical Center; T.L. Ray, University of Iowa College
of Medicine; A.M. Cohen, Tel-Aviv University; G. Imokawa, Kao Corporation; S.L. Jacques, Ore-
gon Health and Science University; S.R. Marschner, Cornell University; P. Hanrahan, Stanford Uni-
versity; J. Stam, Alias/Wavefront; S. Pont, Utrecht University; H.W. Jensen, University of California,
San Diego; N. Tsumura, Chiba University; E. Claridge, University of Birmingham; A. Haro, Georgia
Institute of Technology; O. Cula and K. Dana, Rutgers University; Nanoworld Image Gallery, Centre for
Microscopy and Micro Nanoanalysis, The University of Queensland; Kao Corporation.
We also thank the following publishers for granting permission to use some of the figures in the re-
port. Figure 6 is from B. Alberts, D. Bray, A. Johnson, J. Lewis, M. Raff, K. Roberts and P. Walter,
67

Essential Cell Biology p601 c©1998 Garland Science Publishing Reprinted with permission; Figure 11
is from K.P. Wilhelm, P. Elsner, E. Berardesca and H.I. Maibach, Bioengineering of the Skin: Skin
Surface Imaging and Analysis, p202 and 205, c©1997 CRC Press Reprinted with permission; Figure
13 is from S. Akazaki, H. Nakagawa, H. Kazama, O. Osanai, M. Kawai, Y. Takema and G. Imokawa,
British Journal of Dermatology, 147, 689, 2002 c©2002 Blackwell Publishing Reprinted with permis-
sion; Figure 26 is from P. Hanrahan and W. Krueger, Proceedings of the 20th Annual Conference on
Computer Graphics and Interactive Techniques SIGGRAPH 1993, 165-174, 1993 c©1993 ACM, Inc.
Reprinted with permission; Figure 27 is from J. Stam, Proceedings of the 12th Eurographics Workshop
on Rendering Techniques, 39-52, 2001 c©2001 Springer-Verlag Reprinted with permission; Figure 29
and 30 are from J. Koenderink and S. Pont, Machine Vision and Application; Special Issue on Human
Modeling, Analysis and Synthesis, 14, 260-268, 2003 c©2003 Springer-Verlag Reprinted with permis-
sion; Figure 32 is from H.W. Jensen, S.R. Marschner, M. Levoy and P. Hanrahan, Proceedings of the
28th Annual Conference on Computer Graphics and Interactive Techniques SIGGRAPH 2001, 511-518,
2001 c©2001 ACM, Inc. Reprinted with permission; Figure 33 is from N. Tsumura, H. Haneishi and
Y. Miyake, Journal of Optical Society of America A, 16, 2169-2176, 1999 c©1999 Optical Society of
America Reprinted with permission; Figure 34, 35 and 37 are from N. Tsumura, N. Ojima, K. Sato, M.
Shiraishi, H. Shimizu, H. Nabeshima, S. Akazaki, K. Hori and Y. Miyake, Proceedings of the 30th An-
nual Conference on Computer Graphics and Interactive Techniques SIGGRAPH 2003, 770-779, 2003
c©2003 ACM, Inc. Reprinted with permission; Figure 36 is from E. Claridge, S. Cotton, P. Hall and M.
Moncrieff, In Medical Image Computing and Computer-assisted Intervention, 730-738, 2002 c©2002
Springer-Verlag Reprinted with permission; Figure 38 is from A. Haro, B. Guenter and I. Essa, Proceed-
ings of the 12th Eurographics Workshop on Rendering Techniques, 53-62, 2001 c©2001 Springer-Verlag
Reprinted with permission.
References
[1] S. Akazaki, H. Nakagawa, H. Kazama, O. Osanai, M. Kawai, Y. Takema, and G. Imokawa. Age-
related changes in skin wrinkles assessed by a novel three-dimensional morphometric analysis.
British Journal of Dermatology, 147:689–695, 2002.
68

[2] B. Alberts, D. Bray, A. Johnson, J. Lewis, M. Raff, K. Roberts, and P. Walter. Essential Cell
Biology p601. Garland, 1998.
[3] P.H. Andersen. Reflectance spectroscopic analysis of selected experimental dermatological mod-
els. Skin Research and Technology, 3:8–15, 1997.
[4] R.R. Anderson. Polarized light examination and photography of the skin. Archives in Dermatol-
ogy, 127:1000–1005, 1991.
[5] R.R. Anderson and J.A. Parrish. The optics of human skin. Journal of Investigative Dermatology,
77:13–19, 1981.
[6] R.R. Anderson and J.A. Parrish. The science of photomedicine Chapter 6: Optical properties of
human skin. Plenum Press, 1982.
[7] E. Angelopoulou. The reflectance spectrum of human skin. Technical report, University of Penn-
sylvania, 1999.
[8] E. Angelopoulou. Understandking the color of human skin. In Proceedings of the SPIE Confer-
ence on Human Vision and Electronic Imaging VI, volume 4299, pages 243–251, 2001.
[9] E. Angelopoulou. The uniqueness of the color of human skin. Electronic imaging, 11:5, 2001.
[10] E. Angelpopulou, R. Molana, and K. Daniilidis. Multispectral skin color modeling. In Proceed-
ings of Computer Vision and Pattern Recognition: Technical Sketches, pages 635–642, 2001.
[11] E. Angelpopulou, R. Molana, and K. Daniilidis. Multispectral skin color modeling. Technical
report, University of Pennsylvania, 2001.
[12] R. Aronson. Boundary conditions for diffusion of light. Journal of Optical Society of America A,
12:2532–2539, 1995.
[13] R. Aronson and N. Corngold. Photon diffusion coefficient in an absorbing medium. Journal of
Optical Society of America A, 16:1066–1071, 1999.
[14] S.R. Arridge, M. Schweiger, M. Hiraoka, and D.T. Delpy. A finite element approach for modeling
photon transport in tissue. Medical Physics, 20:299–309, 1993.
69
[15] V. Backman, R. Gurjar, K. Badizadegan, I. Itzkan, R.R. Dasari, L.T. Perelman, and M.S. Feld. Po-
larized light scattering spectroscopy for quantitative measurement of epithelial cellular structures
in situ. IEEE Journal of Selected Topics in Quantum Electronics, 5:1019–1026, 1999.
[16] M. Bassani, F. Martelli, G. Zaccanti, and D. Contini. Independence of the diffusion coefficient
from absorption: experimental and numerical evidence. Optics Letters, 22:853–855, 1997.
[17] D. Batisse, R. Bazin, T. Baldeweck, B. Querleux, and J.L. Leveque. Influence of age on the
wrinkling capacities of skin. Skin Research and Technology, 8:148–154, 2002.
[18] B. Beauvoit, T. Kitai, and B. Chance. Contribution of the mitochondrial compartment to the
optical properties of the rat liver: A theoretical and practical approach. Biophysical Journal,
67:2501–2510, 1994.
[19] B. Beauvoit, T. Kitai, and B. Chance. Time-resolved spectroscopy of mitochondria, cells and tis-
sues under normal and pathological conditions. Molecular and Cellular Biochemistry, 184:445–
455, 1998.
[20] J. Beuthan, O. Minet, J. Helfmann, M. Herring, and G. Muller. The spatial variation of the
refractive index in biological cells. Physics in Medicine and Biology, 41:369–382, 1996.
[21] F. Bevilacqua and C. Depeursinge. Monte carlo study of diffuse reflectance at sourcedetector
separations close to one transport mean free path. Journal of Optical Society of America, 16:2935–
2945, 1999.
[22] L. Boissieux, G. Kiss, N. Thalman, and P. Kalra. Simulation of skin aging and wrinkles with
cosmetics insight. In Europraphics Workshop on Animation and Simulation, pages 15–28, 2000.
[23] W.A.G. Bruls and J.C. van der Leun. Forward scattering properties of human epidermal layers.
Photochemistry and Photobiology, 40:231–242, 1984.
[24] A. Brunsting and P. Mullaney. Light scattering from coated spheres: model for biological cells.
Applied Optics, 11:675–680, 1972.
70
[25] E.K. Chan, B. Sorg, D. Protsenko, M. O’Neil, M. Motamedi, and A.J. Welch. Effects of compres-
sion on soft tissue optical properties. IEEE Journal of Selected Topics in Quantum Electronics,
2:943–950, 1996.
[26] B. Chen, K. Stamnes, and J.J. Stamnes. Validity of the diffusion approximation in bio-optical
imaging. Applied Optics, 40:6356–6366, 2001.
[27] J.H. Chung. Photoaging in asians. photodermatol Photoimmunol. Phtomed., 19:109–121, 2003.
[28] E. Claridge, S. Cotton, P. Hall, and M. Moncrieff. From colour to tissue histology: physics based
interpretation of images of pigmented skin lesions. In Medical image computing and computer-
assisted intervention, pages 730–738, 2002.
[29] R.L. Cook and K.E. Torrance. A reflectance model for computer graphics. ACM Transactions on
Graphics, 1(1):7–24, 1982.
[30] P. Corcuff, J.L. Leveque, G.L. Grove, and A.M. Kligman. The impact of aging on the microrelief
of peri-orbital and leg skin. Journal of The Society of Cosmetic Chemists, 82:145–152, 1987.
[31] S.D. Cotton. Developing a predictive model of human skin colouring. In Proceedings of SPIE
Medical Imaging 1996, volume 2708, pages 814–825, 1996.
[32] S.D. Cotton and E. Claridge. Do all human skin colours lie on a defined surface within lms space?
Technical Report CSR-96-1, School of Computer Science, The Univeristy of Birmingham, 1996.
[33] O.G. Cula and K.J. Dana. Image-based skin analysis. In Proceedings of texture 2002, pages
35–94, 2002.
[34] O.G. Cula, K.J. Dana, F.P. Murphy, and B.K. Rao. Skin Texture Database at Rutgers University.
http://www.caip.rutgers.edu/rutgers texture/cvg/index.html.
[35] O.G. Cula, K.J. Dana, F.P. Murphy, and B.K. Rao. Bidirectional imaging and modeling of skin
texture. To appear in IEEE Transaction on Biomedical Engineering, 2004.
[36] O.G. Cula, K.J. Dana, F.P. Murphy, and B.K. Rao. Skin texture modeling. To appear in Interna-
tional Journal of Computer Vision, 2004.
71

[37] K. Dana, B. Ginneken, S. Nayar, and J. Koenderink. Columbia-Utrecht Reflectance and Texture
(CuReT) Database. http://www1.cs.columbia.edu/CAVE/curet/.
[38] K.J. Dana, B.V. Ginneken, S.K. Nayar, and J.J. Koenderink. Reflectance and texture of real-world
surfaces. ACM Transactions on Graphics, 18(1):1–34, 1999.
[39] P. Debevec, T. Hawkins, C. Tchou, H-P. Duiler, W. Sarokin, and M. Sagar. Acquiring the
reflectance field of a human face. In Proceedings of ACM Transactions on Graphics, SIG-
GRAPH2000, pages 145–156, 2000.
[40] D.T. Delpy, M. Cope, P. van der Zee, S. Arridge, S. Wray, and J. Wyatt. Estimation of opti-
cal pathlength through tissue from direct time of flight measurement. Physics in Medicine and
Biology, 33:1433–1442, 1988.
[41] S.G. Demos and R.R. Alfano. Optical polarization imaging. Applied Optics, 36:150–155, 1997.
[42] M. Denda and M. Takahashi. Measurement of facial skin thickness by ultrasound method. Journal
of Society Cosmetic Chemists Japan, 23:316–319, 1990.
[43] R.M.P. Doombos, R. Lang, M.C. Aalders, and H.J.C.M. Sterenborg. The determination of in vivo
human tissue optical properties and absolute chromophore concentrations using spatially resolved
steady-state diffuse reflectance spectroscopy. Physics in medicine and biology, 44:967–981, 1998.
[44] R. Drezek, A. Dunn, and R.R. Kortum. Light scattering from cells: finite-difference time-domain
simulations and goniometric measurements. Applied Optics, 38:3651–3661, 1999.
[45] R. Drezek, A. Dunn, and R. Richards-Kortum. A pulsed finite-difference time-domain (fdtd)
method for calculating light scattering from biological cells over broad wavelength ranges. Opti-
cal Express, pages 147–157, 2000.
[46] A. Dunn. Light scattering properties of cells. PhD thesis, University of Texas at Austin, 1997.
[47] A. Dunn and R.R. Kortum. Three-dimensional computation of light scattering from cells. IEEE
Journal of Selected Topics in Quantum Electronics, 2:898–905, 1998.
72

[48] T. Durduran, D.A. Boas, B. Chance, and A.G. Yodh. Validity of the difusion equation for small
heterogeneities. Advances in Optical Imaging and Photon Migration OSA Trends in Optics and
Photonics Series, 2:60–63, 1996.
[49] T. Durduran, A.G. Yodh, B. Chance, and D.A. Boas. Does the photon-diffusion coefficient depend
on absorption? Journal of Optical Society of America, 14:3358–3365, 1997.
[50] D.J. Durian. The diffusion coefficient depends on absorption. Opticas Letters, 23:1502–1504,
1998.
[51] L.G. Farkas, editor. Anthropometry of the head and face. Raven Press, 1994.
[52] T.J. Farrell and M.S. Patterson. A diffusion theory model of spatially resolved, steady-state diffuse
reflectance for the noninvasive determination of tissue optical properties in vivo. Medical Physics,
19:879—888, 1992.
[53] T.J. Farrell and M.S. Patterson. Experimental verification of the effect of refractive index mis-
match on the light fluence in a turbid medium. Journal of Biomedical Optics, 6:468–473, 2001.
[54] T.J. Farrell, M.S. Patterson, and M. Essenpreis. Influence of layered tissue architecture on esti-
mates of tissue optical properties obtained from spatially resolved diffuse reflectometry. Applied
Optics, 37:1958–1972, 1998.
[55] J.F. Federici, N. Guzelsu, H.C. Lim, G. Jannuzzi, T. Findley, H.R. Chaudhry, and A.B. Ritter.
Noninvasive light-reflection technique for measuring soft-tissue stretch. Applied Optics, 38:6653–
6660, 1999.
[56] G.H. Findlay. Blue skin. British Journal of Dermatology, 83:127–134, 1970.
[57] K. Furutsu. Diffusion equation derived from space-time transport equation. Journal of Optical
Society of America, 70:360–366, 1980.
[58] K. Furutsu. Boundary conditions of the diffusion equation and applications. Physical Review A,
39:1386–1401, 1989.
[59] K. Furutsu and Y. Yamada. Diffusion approximation for a dissipative random medium and the
applications. Physical Review E, 50:3634–3640, 1994.
73
[60] M. Gniadecha and G.B.E. Jemec. Quantitative evaluation of chronological ageing and photoage-
ing in vivo: studies on skin echogenicity and thickness. British Journal of Dermatology, 139:815–
821, 1998.
[61] L. Gobin, L. Blanchot, and H. Saint-Jalmes. Integrating the digitized backscattered image to
measure absorption and reduced-scattering coefficients in vivo. Applied Optics, 38:4217–4227,
1999.
[62] R. Graaff, A.C.M. Dassel, M.H. Koelink, F.F.M. de Mul, J.G. Aarnoudse, and W.G. Zijlstra.
Optical properties in human dermis in vitro and in vivo. Applied Optics, 32:435–447, 1993.
[63] R. Grover, O. Grobbelaar, B.D.G. Morgan, and D.T. Gault. A quantitative method for the assess-
ment of facial rejuvenation: a prospective study investigating the carbon dioxide laser. British
Journal of Plastic Surgery, 51:8–13, 1998.
[64] N. Guzlksu, J.F. Federici, H.C. Lim, H.R. Chauhdry, A.B. Ritter, and T. Findley. Measurement of
skin stretch via light reflection. Journal of Biomedical Optics, 8:80–86, 2003.
[65] P. Hanrahan and W. Krueger. Reflection from layered surfaces due to subsurface scattering. In
Proceedings of the 20th annual conference on Computer graphics and interactive techniques
SIGGRAPH1993, pages 165–174, 1993.
[66] J.D. Hardy, H.T. Hammell, and D. Murgatroyd. Spectral transmittance and reflectance of excised
human skin. Journal of Applied Physiology, 9:257–264, 1956.
[67] A. Haro, B. Guenter, and I. Essa. Real-time photo-realistic, physically based rendering of fine
scale human skin structure. In Proceedings of the 12th Eurographics workshop on rendering
techniques, pages 53–62, 2001.
[68] R.C. Haskell, L.O. Svaasand, T.T. Tsay, T.C. Feng, M.S. McAdams, and B.J. Tromberg. Boundary
conditions for the diffusion equation in radiative transfer. Journal of Optical Society of America
A, 11:2727–2741, 1994.
[69] J. Hata, M. Shimada, Y. Yamada, A. Uchida, M. Itoh, Y. Nakayama, and T. Yatagai. Treatment of
nevus using medical tattooing. Journal of Biomedical Optics, 8:93–101, 2003.
74
[70] S. Hayashi, K. Mimura, and Y. Nishijima. Changes in surface configuration of the skin caused
by aging and application of cosmetics: three-dimensional analysis according to a new system
based on image analysis and fourier transformation. International Journal of Cosmetic Science,
11:67–85, 1989.
[71] A.H. Hielscher, R.E. Alcouffe, and R.L. Barbour. Comparison of finite-difference transport and
diffusion calculations for photon migration in homogeneous and heterogeneous tissues. Physics
in Medicine and Biology, 43:1285–1302, 1998.
[72] A.H. Hielscher, S.L. Jacques, L. Wang, and F.K. Tittel. The influence of boundary conditions on
the accuracy of diffusion theory in time-resolved reflectance spectroscopy of biological tissues.
Physics in Medical Biology, 40:1957–1975, 1995.
[73] M. Hiraoka, M. Firband, M. Essenpreis, M. Cope, S.R. Arridge, P. van der Zee, and D.T. Delpy.
A monte carlo investigation of optical pathlength in inhomogeneous tissue and its application to
near-infrared spectroscopy. Physics in Medicine and Biology, 38:1859–1876, 1993.
[74] A.F. Hood, T.H. Kwan, M.C. Mihm Jr., T.D. Horn, and B.R. Smoller. Primer of dermatopathol-
ogy. Lippincott Williams & Wilkins, third edition, 2002.
[75] G. Imokawa. Face washing and cleaning foams. Fragrance Journal, 74:38–47, 1985.
[76] T. Ishii, T. Yasuda, S. Yokoi, and J. Toriwaki. A generation model for human skin texture. Com-
municating with Virtual Worlds, pages 139–150, 1993.
[77] S.L. Jacques. Origins of tissue optical properties in the UVA, visible, and NIR regions. Trends in
Optics and Photonics: Advances in Optical Imaging and Photon Migration, 2:364–371, 1996.
[78] S.L. Jacques. Optical absorption of melanin. Oregon Medical Laser Center Monthly news and ar-
ticles on Biomedical Optics and Medical Lasers, http://omlc.ogi.edu/spectra/melanin/index.html,
1998.
[79] S.L. Jacques. Skin optics. Oregon Medical Laser Center Monthly news and articles on Biomedical
Optics and Medical Lasers, http://omlc.ogi.edu/news/jan98/skinoptics.html, 1998.
75
[80] S.L. Jacques. Video imaging with polarized light finds skin cancer margins not visible to der-
matologists. Oregon Medical Laser Center Monthly news and articles on Biomedical Optics and
Medical Lasers, http://omlc.ogi.edu/news/feb98/polarization/index.html, 1998.
[81] S.L. Jacques. Scattering of polarized light by biological tissues. Oregon Medi-
cal Laser Center Monthly news and articles on Biomedical Optics and Medical Lasers,
http://omlc.ogi.edu/news/oct99/saratov/index.htm, 1999.
[82] S.L. Jacques, C.A. Alter, and S.A. Prahl. Angular dependence of HeNe laser light scattering by
human dermis. Lasers in the Life Science, 1:309–333, 1987.
[83] S.L. Jacques and S.A. Prahl. Modeling optical and thermal distributions in tissue during laser
irradiation. Lasers in Surgery and Medicine, 6:494–503, 1987.
[84] S.L. Jacques, J.C.R. Roman, and K. Lee. Imaging skin pathology with polarized light. Journal of
Biomedical Optics, 7:329–340, 2002.
[85] S.L. Jacques, J.R. Roman, and K. Lee. Imaging superficial tissues with polarized light. Lasers in
Surgery and Medicine, 26:119–129, 2000.
[86] S. Jaspers, H. Hopermann, G. Saurermann, U. Hoppe, R. Lunderstadt, and J. Ennen. Rapid in
vivo measurement of the topography of human skin by active image triangulation using a digital
micromirror device. Skin Research Technology, 5:195–207, 1999.
[87] H.W. Jensen, S.R. Marschner, M. Levoy, and P. Hanrahan. A practical model for subsurface light
transport. In Proceedings of the 28th annual conference on Computer graphics and interactive
techniques SIGGRAPH 2001, pages 511–518, 2001.
[88] M. Keijzer, S.L. Jacques, S.A. Prahl, and A.J. Welch. Light distributions in artery tissue. Lasers
in Surgery and Medicine, 9:148–154, 1989.
[89] M. Keijzer, J.W. Pickering, and M.J.C. van Gemert. Laser beam diameter for port wine stain
treatment. Lasers in Surgery and Medicine, 11:601–605, 1991.
[90] M. Keijzer, W.M. Star, and P.R.M. Storchi. Optical diffusion in layered media. Applied Optics,
27:1820–1824, 1988.
76
[91] A. Kienle, L. Lilge, M.S. Patterson, R. Hibst, R. Steiner, and B.C. Wilson. Spatially resolved
absolute diffuse reflectance measurements for noninvasive determination of the optical scattering
and absorption coefficients of biological tissue. Applied Optics, 35:2304–2314, 1996.
[92] A. Kienle and M.S. Patterson. Improved solutions of the steady-state and the time-resolved diffu-
sion equations for reflectance from a semi-infinite turbid medium. Journal of Optical Society of
America A, 14, 1997.
[93] A. Kienle, M.S. Patterson, N. Dgnitz, R. Bays, G. Wagnires, and H. van den Bergh. Noninvasive
determination of the optical properties of two-layered turbid media. Applied Optics, 37:779–791,
1998.
[94] A. Kim and A. Ishimaru. Optical diffusion of continuous-wave, pulsed, and density waves in
scattering media and comparisons with radiative transfer. Applied Optics, 37:5313–5319, 1998.
[95] M. Kobayashi, Y. Ito, N. Sakauchi, I. Oda, I. Konishi, and Y. Tsunazawa. Analysis of nonlinear
relation for skin hemoglobin imaging. Optics Express, 9:802–812, 2001.
[96] J. Koenderink and S. Pont. The secret of velvety skin. Machine Vision and Applications; Special
Issue on Human Modeling, Analysis and Synthesis, 14:260–268, 2003.
[97] J.S. Koh, H. Kang, S.W. Choi, and H.O. Kim. Cigarette smoking associated with premature
facial wrinkling: image analysis of facial skin replicas. International Journal of Dermatology,
41:21–27, 2002.
[98] H. Kolarova, D. Ditrichov, and J. Wagner. Penetration of the laser light into the skin in vitro.
Lasers in Surgery and Medicine, 24:231–235, 1999.
[99] N. Kollias. The physical basis of skin colour and its evaluation. Clinical Dermatology, 13:361–
367, 1995.
[100] G. Kumar and J.M. Schmitt. Micro-optical properties of tissue. In Proceedings of SPIE: Advances
in Laser and Light Spectroscopy to Diagnosis Cancer and Other Diseases 3: Optical Biopsy,
volume 2679, pages 106–116, 1996.
77
[101] M. Larsson, H. Nilsson, and T. Stromberg. In vivo determination of local skin optical properties
and photon path length by use of spatially resolved diffuse reflectance with applications in laser
doppler flowmetry. Applied Optics, 42:124–134, 2003.
[102] C. Lasagni and S. Seidenari. Echographic assessment of age-dependent variations of skin thick-
ness. Skin Research and Technology, 1:81–85, 1995.
[103] M. Lees. Skin Care:Beyond the Basis. Milady, 2001.
[104] J.L. Leveque. Eemco guidance for the assessment of skin topography. Journal of European
Academic Dermatol, 12:103–114, 1999.
[105] J.L. Leveque and P. Corcuff. Noninvasive methods for the quantification of skin functions.
Springer, 1993.
[106] W.F. Lever and G.Schaumburg-Lever. Histopathology of the skin. J.B.Lippincott Company, sev-
enth edition edition, 1990.
[107] J.Q. Lu, X.H. Hu, and K. Dong. Modeling of the rough-interface effect on a converging light
beam propagating in a skin tissue phantom. Applied Optics, 39:5890–5897, 2000.
[108] R. Marchesini, A. Bertoni, S. Andreola, E. Melloni, and A.E. Sichirollo. Extinction and ab-
sorption coefficients and scattering phase functions of human tissues in vitro. Applied Optics,
28:2318–2324, 1989.
[109] P. Marquet, F. Bevilacqua, C. Depeursinge, and E.B de Haller. Determination of reduced scat-
tering and absorption coefficients by a single charge-coupled-device array measurement, part 1:
comparison between experiments and simulations. Optical Engineering, 34:2055–2062, 1995.
[110] S.R. Marschner, S.H. Westin, E.P.F. Lafortune, K.E. Torrance, and D.P. Greenberg. Image-based
brdf measurement including human skin. In Proceedings of 10th Eurographics Workshop on
Rendering, pages 139–152, 1999.
[111] S.R. Marschner, S.H. Westin, E.P.F. Lafortune, K.E. Torrance, and D.P. Greenberg. Reflectance
measurement of human skin. Technical report, Cornell University, 1999.
78
[112] M.L. Mello, B.C. Vidal, A.C. de Carvalho, and A.C. Caseiro-Filho. Change with age of
anisotropic properties of collagen bundles. Gerontology, 25:2–8, 1979.
[113] J. Mobley and T. Vo-Dinh. Biomedical Photonics Handbook. CRC Press, 2003.
[114] S.P. Morgan, M.P. Khong, and M.G. Somekh. Effects of polarization state and scatterer concen-
tration on optical imaging through scattering media. Applied Optics, 36:1560–1565, 1997.
[115] S.P. Morgan and M.E. Ridgmay. Polarization properties of light backscattered from a two layer
scattering medium. Optics Express, 7:395–402, 2000.
[116] M. Motamedi, S. Rastegar, G. LeCarpentier, and A.J. Welch. Light and temperature distribution
in laser irradiated tissue: the influence of anisotropic scattering and refractive index. Applied
Optics, 28:2230–2237, 1989.
[117] J.R. Mourant, M. Canpolat, C. Brocker, O. Esponda-Ramos, T.M. Johnson, A. Matanock, K. Stet-
ter, and J.P. Freyer. Light scattering from cells: the contribution of the nucleus and the effects of
proliferative status. Journal of Biomedical Optics, 5:131–137, 2000.
[118] J.R. Mourant, J.P. Freyer, A.H. Hielscher, A.A. Eick, D. Shen, and T.M. Johnson. Mechanisims
of light scattering from biological cells relecant to noninvasive optical-tissue diagnosis. Applied
Optics, 37:3586–3593, 1998.
[119] J.R. Mourant, T.M. Johnson, and J.P. Freyer. Characterizing mammalian cells and cell phantoms
by polarized backscattering fiber-optic measurements. Applied Optics, pages 5114–5123, 2001.
[120] H. Murakami, T. Horii, N. Tsumura, and Y. Miyake. Measurement and simulation of 3D gonio
spectral reflectance of skin surface. Digital biocolor journal, pages 2.1–2.6, 2002.
[121] R. Murphy and D.W.K. Cotton. Computer-assisted image analysis of skin surface replicas. British
Journal of Dermatology, 124:571–575, 1991.
[122] M. Nahas, H. Huitric, M. Rioux, and J. Domey. Facial image synthesis using skin texture record-
ing. The Visual Computer, 6:337–343, 1990.
79
[123] H. Nakai, Y. Manabe, and S. Inokuchi. Simulation and analysis of spectral distributions of human
skin. In Pattern Recognition, 1998. Proceedings of 14th International Conference of, volume 2,
pages 1065–1067, 1998.
[124] S.K. Nayar and M. Oren. Generalization of the Lambertian Model and Implications for Machine
Vision. International Journal of Computer Vision, 14:227–251, 1995.
[125] E.J. Naylor. The structure of the cornea as revealed by polarized light. Quarterly Journal of
Microsopical Science, 94:83–88, 1953.
[126] S. Nickell, M. Hermann, M. Essenpreis, T.J. Farrell, U. Kramer, and M.S. Patterson. Anisotropy
of light propagation in human skin. Physics in medicine and biology, 45:2873–2886, 200.
[127] F.E. Nicodemus, J.C. Richmond, J.J. Hsia, I.W. Ginsberg, and T. Limperis. Geometric Consider-
ations and Nomenclature for Reflectance. National Bureau of Standards (US), 1977.
[128] A. Nilsson, P. Alsholm, A. Karlsson, and S. Andresson-Engels. T -matrix computations of light
scattering by red blood cells. Applied Optics, 37:2735–2748, 1998.
[129] H. Nilsson, M. Larsson, G.E. Nilsson, and T. Stromberg. Photon pathlength determination based
on spatially resolved diffuse reflectance. Journal of Biomedical Optics, 7:478–485, 2002.
[130] Y. Nomura, O. Hazeki, and M. Tamura. Exponential attenuation of light along nonlinear path.
Advanced Experimental Medical Biology, 248:77–80, 1989.
[131] Y. Nomura, O. Hazeki, and M. Tamura. Relationship between time-resolved and non-time-
resolved beer-lambert law in turbid media. Physics in Medicine and Biology, 42:1009–1022,
1997.
[132] L.O. Olsen, H. Takiwaki, and J. Serup. Skin thickness and echographic density of 22 anatomical
sites. Skin Research and Technology, 1:74–82, 1995.
[133] M. Ooe and H. Shiroshita. The relationship between transparent skin and optical properties of
stratum corneum. Fragrance Journal, 4:38–44, 2002.
[134] L.T. Perelman, J. Wu, I. Itzkan, and M.S. Feld. Photon migration in turbid media using path
integrals. Physical Review letters, 72:1341–1344, 1994.
80
[135] C. Pierard-Franchimont and G.E. Pierard. Assessment of aging and actinic damages by cyanoar-
cylate skin surface strippings. American journal of dermapathology, 9:500–507, 1987.
[136] S. Prahl. Optical absorption of hemoglobin. Oregon Medical Laser Cen-
ter Monthly news and articles on Biomedical Optics and Medical Lasers,
http://omlc.ogi.edu/spectra/hemoglobin/index.html, 1998.
[137] S.A. Prahl. Light transport in tissue. PhD thesis, University of Texas at Austin, 1988.
[138] S.A. Prahl, M.J.C. van Gemert, and A.J. Welch. Determining the optical properties of turbid
media by using the adding-doubling method. Applied Optics, 32:559–568, 1993.
[139] P.T. Pugliese. Physiology of the Skin, chapter 1, page 1. Allured Publishing Corporation, 2001.
[140] M.H. Ross and L.J. Romrell. Histology a text and atlas. Williams and Wilkins, 1989.
[141] I.S. Saidi, S.L. Jacques, and F.K. Tittel. Mie and rayleigh modeling of visible-light scattering in
neonatal skin. Applied Optics, 34:7410–7418, 1995.
[142] F.A. Schellander and J.T. Headington. The stratum corneum: some structural and functional
correlates. British Journal of Dermatology, 91:507–515, 1974.
[143] R.J. Scheuplein. A survey of some fundamental aspects of the absorption and reflection of light
by tissue. Journal of Society of Cosmetic Chemists, 15:111–122, 1964.
[144] J. Schmitt and G. Kumar. Optical scattering properties of soft tissue: A discrete particle model.
Applied Optics, 37:2788–2797, 1998.
[145] J.M. Schmitt, G.X. Zhou, and E.C. Walker. Multilayer model of photon diffusion in skin. Journal
of Optical Society of America A, 7:2141–2153, 1990.
[146] H.M. Sheu, S.C.Chao, T.W.Wong, Y.Y.Lee, and J.C.Tsai. Human skin surface lipid film: an ul-
trastructural study and interaction with corneocytes and intercellular lipid lamellae of the stratum
corneum. British Journal of Dermatology, 140:385–391, 1999.
81
[147] M. Shimada, Y. Masuda, Y. Yamada, M. Itoh, M. Takahashi, and T. Yatagai. Explanation of
human skin color by multiple linear regression analysis based on the modified lambert-beer law.
Optical Review, 7:348–352, 2000.
[148] C.R. Simpson, M. Kohl, M. Essenpreis, and M. Cope. Near-infrared optical properties of ex
vivo human skin and subcutaneous tissues measured using the monte carlo inversion technique.
Physics in Medicine and Biology, 43:2465–2478, 1998.
[149] C. So-Ling and L. Ling. A multi-layered reflection model of natural human skin. In Proceedings
of Computer Graphics International 2001, pages 249–256, 2001.
[150] K. Sokolov, R. Drezek, K. Gossage, and R. Richards-Kortum. Reflectance spectroscopy with
polarized light: is it sensitive to celluar and nuclear morphology. Optical Express, 5:302–317,
1999.
[151] Adams Media Corporation Staff. Milady’s Standard: Textbook of cosmetology. Thomson Learn-
ing, 2000.
[152] J. Stam. An illumination model for a skin layer bounded by rough surfaces. In Proceedings of the
12th Eurographics Workshop on Rendering, pages 39–52, 2001.
[153] I.M. Stockford, S.P. Morgan, P.C.Y. Chang, and J.G. Walker. Analysis of the spatial distribution
of polarized light backscattered from layered scattering media. Journal of Biomedical Optics,
7:313–320, 2002.
[154] G. Streekstra, A. Hoekstra, E. Nijhof, and R. Heethaar. Light scattering by red blood cells in
ektacytometry: Fraunhofer versus anomalous diffraction. Applied Optics, 32:2266–2272, 1993.
[155] G.J. Streekstra, A.G. Hoekstra, E.J. Nijhof, and R.M. Heethaar. Anomalous diffraction by arbitar-
ily oriented ellipsoids: applications in ektacytometry. Applied Optics, 33:7288–7296, 1994.
[156] S. Takatani and M.D. Graham. Theoretical analysis of diffuse reflectance from a two-layer tissue
model. IEEE Transactions on Biomedical Engineering, BME-26:656–664, 1979.
[157] H. Takiwaki, Y. Kanno, Y. Miyaoka, and S. Arase. Computer simulation of skin color based on a
multilayered skin model. Skin Research and Technology, 3:36–41, 1997.
82
[158] K. Torrance and E. Sparrow. Theory for off-specular reflection from roughened surfaces. Journal
of Optical Society of America, (57):1105–1114, 1967.
[159] C. Tsai, Y.F. Yang, C.C. Han, J.H. Hsieh, and M. Chang. Measurement and simulation of light
distribution in biological tissues. Applied Optics, 40:5770–5777, 2001.
[160] K. Tsukahara, Y. Takema, T. Fujimura, S. Moriwaki, and M. Hattori. Quantitative two-
dimensional analysis of facial wrinkles of japanese women at various ages. International Journal
of Cosmetic Science, 24:71–80, 2002.
[161] N. Tsumura, H. Haneish, and Y. Miyake. Independent component analysis of spectral absorbance
image in human skin. Optical Review, 7:479–482, 2000.
[162] N. Tsumura, H. Haneishi, and Y. Miyake. Independent component analysis of skin color image.
Journal of optical society of America A, 16:2169–2176, 1999.
[163] N. Tsumura, N. Ojima, K. Sato, M. Shiraishi, H. Shimizu, H. Nabeshima, S. Akazaki, K. Hori,
and Y. Miyake. Image-based skin color and texture analysis/synthesis by extracting hemoglobin
and melanin information in the skin. In Proceedings of the 30th annual conference on computer
graphics and interactive technicques SIGGRAPH 2003, pages 770–779, 2003.
[164] N. Tsumura, K. Uetsuki, N. Ojima, and Y. Miyake. Correlation map analysis between appearance
of japanese facial images and amount of melanin and hemoglobin components in the skin. In
Proceedings of SPIE: Human Vision and Electronic Imaging 6, volume 4299, pages 252–260,
2001.
[165] V.V. Tuchin. Light scattering study of tissue. Physics-Uspekhi, 40:495–515, 1997.
[166] V.V. Tuchin, S.R. Utz, and I.V. Yaroslavsky. Tissue optics, light distribution, and spectroscopy.
Optical Engineering, 33:3178–3188, 1994.
[167] T. Uchida, T. Komeda, M. Miyagi, H. Koyama, and H. Funakubo. Quantification of skin aging
by three-dimensional measurement of skin surface contour. In Systems, Man, and Cybernetics,
1996., IEEE International Conference, volume 1, pages 450–455, 1996.
83
[168] M.J.C. van Gemert, S.L. Jacques, H.J.C.M. Sterenborg, and W.M. Star. Skin optics. IEEE Trans-
action on Biomedical Engineering, 36:1146–1154, 1989.
[169] W. Verkruysse, G.W. Lucassen, and M.J.C. van Gemert. Simulation of color of port wine stain:
skin and its dependence on skin variables. Lasers in Surgery and Medicine, 25:131–139, 1999.
[170] G. Videen and D. Ngo. Light scattering multipole solution for a cell. Journal of Biomedical
Optics, 3:212–220, 1998.
[171] S. Wan, R.R. Anderson, and J.A. Parish. Analytical modeling for the optical properties of the skin
with in vitro and in vivo appplications. Photochemistry and Photobiology, 34:493–499, 1981.
[172] L. Wang and S.L. Jacques. Monte Carlo Modeling of Light Transport in Multi-layered Tissues in
Standard C. PhD thesis, University of Texas M.D.Anderson Cancer Center, 1992.
[173] L. Wang, S.L. Jacques, and L. Zheng. MCML – monte carlo modeling of light transport in multi-
layered tissues. Computer Methods & Programs in Biomedicine, 47:131–146, 1995.
[174] L. Wang, S.L. Jacques, and L. Zheng. CONV–convolution for responses to a finite diameter
photon beam indident on multi-layered tissues. Computer Methods and Programs in Biomedicine,
54:141–150, 1997.
[175] L.H. Wang and S.L. Jacques. Source of error in calculation of optical diffuse reflectance from
turbid media using diffusion theory. Computer Methods and Programs in Biomedicine, 61:163–
170, 2000.
[176] A.J. Welch, G. Yoon, and M.J.C. van Gemert. Practical models for light distribution in laser-
irradiated tissue. Lasers in Surgery and Medicine, 6:488–493, 1987.
[177] A.J. Weltch and M.J.C. van Gemert, editors. Optical thermal response of laser-irradiated tissue.
Plenum Press, 1995.
[178] K. Wilhelm, P. Elsner, E. Berardesca, and H.I. Maibach, editors. Bioengineering of the Skin: Skin
Surface Imaging and Analysis. CRC Press, 1997.
[179] B.C. Wilson and G. Adam. A monte carlo model for the absorption and flux distributions of light
in tissue. Medical Physics, 10:824–834, 1983.
84

[180] Y. Wu, P. Kalra, and N.M. Thalmann. Simulation of static and dynamic wrinkles of skin. The
Visual Computer, 15:183–198, 1999.
[181] M.A. Wverett, E. Yeargers, R.M. Sayre, and R.L. Olson. Penetration of epidermis by ultraviolet
rays. Photochemistry and Photobiology, 5:533–542, 1966.
[182] Y.E. Yarker, R.M. Aspden, and D.W.L. Hukins. Birefringence of articular cartilage and the distri-
bution of collagen fibril orientations. Connective Tissue Research, 11:207–213, 1983.
[183] A.N. Yaroslavskaya, S.R. Utz, S.N. Tatarinstev, and V.V. Tuchin. Angular scattering properties
of human epidermal layers. In Cell and Biotissue Optics: Application in Laser Diagnostics and
Therapy, volume 2100, pages 38–41. SPIE, 1994.
[184] K.M. Yoo, F. Liu, and R.R. Alfano. When does the diffusion approximation fail to describe photon
transport in random media? Physical Review Letters, 64:2647–2650, 1990.
[185] G. Yoon, S.A. Prahl, and A.J. Welch. Accuracies of the diffusion approximation and its similarity
relations for laser irradiated biological media. Applied Optics, 28:2250–2255, 1989.
[186] G. Yoon, A.L. Welch, M. Motamedi, and M.C.J. van Gemert. Development and application of
three-dimensional light distribution model for laser irradiated tissue. IEEE Journal of Quantum
Electronics, QE-23:1721–1733, 1987.
[187] A.R. Young. Chromophores in human skin. Physics in Medicine and Biology, 42:789–802, 1997.
[188] W.G. Zijlstra, A. Buursma, and W.P. Meeuwsen van der Roset. Absorption spectra of human fetal
and adult oxyhemoglobin, de-oxyhemoglobin, carboxyhemoglobin, and methemohlobin. Clinical
Chemistry, 37:1633–1638, 1991.
[189] G. Zonios, J. Bykowski, and N. Kollias. Skin melanin, hemoglobin, and light scattering prop-
erties can be quantitatively assessed in vivo using diffuse reflectance spectroscopy. Journal of
Investigative Dermatology, 117:1452–1457, 2001.
85