the annual homeless assessment report to …...foreword i am pleased to submit the u.s. department...
TRANSCRIPT


The 2009 Annual Homeless Assessment Report
June 2010
U.S. Department of Housing and Urban Development Office of Community Planning and Development
Corrected June 18, 2010

FOREWORD
I am pleased to submit the U.S. Department of Housing and Urban Development’s (HUD) 2009 Annual Homeless Assessment Report (AHAR) to Congress. The tragedy of homelessness is faced by every community. To tackle this challenge, we need the best data available and a coordinated federal response.
Indeed, this year’s AHAR is delivered at a critical moment – as the Federal government continues to shift its focus toward preventing homelessness and on the eve of the first-ever federal plan to end homelessness. The fifth in a series of annual reports about homelessness in the United States, the 2009 AHAR for the first time, captures a large portion of the economic crisis in its reporting period. It provides real evidence that the economic downturn is impacting the housing stability of low-income and vulnerable Americans – as we see a rise in family homelessness for the second consecutive year.
By adding data on sheltered homeless people for another full year, this year’s report builds on last year’s, allowing for a comparative analysis of homelessness that spans three years—2007, 2008, and 2009. Specifically, the 2009 AHAR draws on two types of national estimates of homelessness to provide a portrait of homelessness nationwide. The first is point-in-time (PIT) estimates, which provide the total number of sheltered and unsheltered homeless persons on a single-night in January. The report also provides one-year estimates of the total sheltered population based on information from local Homeless Management Information Systems. These estimates account for individuals who used a homeless residential program at any time during a 12-month period.
In addition, this year’s report marks another significant increase in the capacity of communities nationwide to participate in the AHAR. Between 2008 and 2009, the number of communities participating in the AHAR increased by more than 66 percent, marking another step forward in our ability to collect critical information on homelessness and inform public policies. All told, this report compiles data from 2,988 counties and 1,056 cities. I applaud these communities for their hard work and commitment to helping end homelessness.
By building on the remarkable innovations demonstrated at the local level nationwide, the Obama Administration is committed to providing all Americans—from the most capable to the most vulnerable—the opportunity to reach their full potential. With essential research tools like AHAR and a new strategy that makes ending and preventing homelessness a priority for every federal agency, that opportunity is closer than ever for all Americans.
Shaun Donovan Secretary U.S. Department of Housing and Urban Development

ACKNOWLEDGEMENTS This 2009 Annual Homeless Assessment Report (AHAR) was developed by a team of researchers from Abt Associates Inc. and the University of Pennsylvania Center for Mental Health Services and Research. The team was led by Principal Investigators, Dr. Jill Khadduri (Abt) and Dr. Dennis Culhane (University of Pennsylvania). Dr. Alvaro Cortes (Abt) served as project director and was responsible for leading the data collection and analysis effort. Additional team members include: Christopher Blaine, Larry Buron, RJ de la Cruz, Tracy D’Alanno, Lauren Dunton, Justin Epner, Nichole Fiore, Lindsay Fox, Tyronda Gibson, John Griffith, Mary Joel Holin, Emily Holt, Bulbul Kaul, Michelle Klausner, Joshua Leopold, Saty Patrabansh, Maura Pillsbury, Louise Rothschild, Kate Ryan, Brian Sokol, K.P. Srinath, Jennifer Turnham, Joshua Vaughn, Jeff Ward, Michelle Woodford, Matt White, and Jeff Smith (all from Abt Associates) and Stephen Poulin (University of Pennsylvania). This year’s report also benefited greatly from the contributions of a number of HUD staff. Julie Hovden and Michael Roanhouse of the Office of Community Planning and Development, and Anne Fletcher of the Office of Policy Development and Research have provided overall leadership and vision. The project has also benefited from the support of other HUD staff in the Office of Community Planning and Development, especially Mark Johnston and Ann Oliva. Finally, this project and this report could not have been possible without the participation of staff from Continuums of Care, local government agencies and nonprofit agencies responsible for HMIS implementation in communities across the country as well as HMIS software solution providers. Their continued commitment is greatly appreciated.
Table of Contents Executive Summary..........................................................................................................................i
Point-in-Time Estimates of Homeless People................................................................................i One-Year Estimates of Sheltered Homeless People ................................................................... iii Sheltered Homeless People in 2009 ............................................................................................ iii Trends in Sheltered Homelessness, 2007-2009 ...........................................................................iv The Nationwide Capacity of Residential Programs for Homeless People...................................v Looking Ahead...............................................................................................................................v
Chapter 1 Introduction....................................................................................................................1 1.1 History of the AHAR ........................................................................................................1 1.2 AHAR Estimates for 2009................................................................................................3 1.3 This Report ........................................................................................................................4 1.4 Trends in Homelessness and the Economic Crisis...........................................................5
Chapter 2 National Estimates of All Homeless People, Sheltered and Unsheltered ...............7 2.1 One-Day Count of Homeless People................................................................................7 2.2 Trends in PIT Counts of Homeless People ......................................................................8 2.3 Where People were Homeless on the Night of the PIT Count ......................................12 2.4 PIT Counts of Homeless Subpopulations.......................................................................14 2.5 Estimates of Sheltered Homeless Individuals and Families during a
One-Year Period .............................................................................................................17 2.6 Summary of the National Estimates of All Homeless People .......................................18
Chapter 3 Sheltered Homeless People in 2009 ...........................................................................21 3.1 Characteristics of People Using Homeless Shelters, 2009 ............................................21 3.2 Location of Homeless Service Use, 2009.......................................................................31 3.3 Patterns of Homeless Service Use, 2009........................................................................35 3.4 Summary of All Sheltered Homeless People in 2008....................................................38
Chapter 4 Trends in Sheltered Homelessness between 2007 and 2009...................................41 4.1 Changes in the Sheltered Homeless Population between 2007 and 2009.....................41 4.2 Changing Patterns of Becoming Homeless, 2007-2009 ................................................51 4.3 Changing Use of the Residential System for Homeless People, 2007-2009.................54 4.4 Summary of Trends in Sheltered Homelessness between 2007 and 2009....................59
Chapter 5 The Nationwide Capacity of Residential Programs for Homeless People ...........61 5.1 Inventory of Residential Programs and Beds, 2009.......................................................62 5.2 Geographic Location of Beds, 2009...............................................................................65 5.3 Bed Utilization and Turnover Rates, 2009.....................................................................67 5.4 Changes in the National Inventory and Utilization of Beds, 2006-2009.......................69 5.5 Summary of the Nationwide Capacity of Residential Programs for Homeless People72
Chapter 6 Looking Ahead.............................................................................................................75 6.1 The 2010 AHAR .............................................................................................................76

Appendix A: List of 2009 AHAR Sample Sites and Contributing Communities
Appendix B: Data Collection and Analysis Methodology
Appendix C: Continuum of Care Point-in-Time Counts of Homeless Persons
Appendix D: Counts of Homeless Sheltered Persons Using HMIS Data

Executive Summary
The U.S. Department of Housing and Urban Development (HUD) is pleased to present the 2009 Annual Homeless Assessment Report (AHAR), the fifth in a series of reports on homelessness in the United States. The reports respond to a series of Congressional directives calling for the collection and analysis of data on homelessness. The AHAR reports provide the latest counts of homelessness nationwide—including counts of individuals, persons in families, and special population groups such as veterans and chronically homeless people. The report also covers the types of locations where people use emergency shelter and transitional housing; where people were just before they entered a residential program; how much time they spend in shelters over the course of a year; and the size and use of the U.S inventory of residential programs for homeless people. With the 2009 AHAR, we now have three complete years of data on the numbers and characteristics of sheltered homeless people, how they became homeless, and how they used the homeless services system. This is important, because we can begin to see discernable trends in homelessness, including the effects of the recession and of changes over time to the homeless services system. The 2009 AHAR also marks continued improvement in both sources of estimates of homelessness used in the reports. A larger number of communities are reporting Homeless Management Information System (HMIS) data to the AHAR, which is used in the analysis of patterns of homelessness over a year’s time. In 2009, 334 communities—representing 2,988 counties and 1,056 cities—reported usable HMIS data to the report, a sizable increase from last year’s report (222 communities). At the same time, the point-in-time (PIT) counts essential for estimating the numbers and characteristics of all homeless people, both sheltered and unsheltered, are improving as communities use more rigorous methodologies for conducting the counts. For the first time, this 2009 AHAR includes information from in-person interviews with local service providers located in nine communities nationwide. This qualitative information provides a contextual backdrop for understanding how homelessness is changing.
Point-in-Time Estimates of Homeless People
On a single night in January 2009, there were an estimated 643,067 sheltered and unsheltered homeless people nationwide. More than 6 in 10 people who were homeless at a single point-in-time were in emergency shelters or transitional housing programs, while 37 percent were unsheltered on the “street” or in other places not meant for human habitation. The total number of people homeless on a single night has remained fairly stable from year to year, but over time a smaller share of all homeless people is unsheltered, and a larger share is
Executive Summary i

found in emergency shelters or transitional housing. This may in part reflect better “street counts,” but it probably also reflects community success in getting people off the streets and into shelters or housing.
2. Homeless Management Information System (HMIS) are electronic administrative databases that are designed to record and store client-level information on the characteristics and service needs of homeless persons. HMIS data is used to produce counts of the sheltered homeless population over a full year—that is, people who used emergency shelter or transitional housing programs at some time during the course of a year. The 2009 AHAR uses HMIS data for the most recent, one-year reporting period and compares these data to previous HMIS-based findings.
Data Sources Used in the AHAR
The AHAR is based on two data sources: 1. Continuum of Care applications are submitted to HUD annually as part of the competitive
funding process and provide one-night, Point-in-Time (PIT) counts of both sheltered and unsheltered homeless populations. The PIT counts are based on the number of homeless persons on a single night during the last week in January, and the most recent PIT counts for which data are available nationally were conducted in January 2009.
Nearly two thirds of the people homeless on a single night were homeless as individuals (63 percent), while more than a third (37 percent) were homeless as part of a family. Family members were much less likely than individuals to be unsheltered. Only 21 percent of all homeless family members were unsheltered on the night of the point-in-time count, while almost half of homeless individuals were unsheltered. Information from CoC applications includes counts of particular homeless subpopulations, including people whose homelessness is chronic—that is, individuals with disabilities and long or frequent patterns of homelessness. National policy has focused on ending chronic homelessness through funding incentives to develop permanent supportive housing and through the dissemination of best practice strategies for reducing chronic homelessness. The January 2009 PIT estimate of chronic homelessness is 110,917 people, more than a 10 percent drop from the PIT count of 124,135 chronically homeless people in 2008. All of the decrease occurred among unsheltered chronically homeless people. While measuring the scope of chronic homelessness remains challenging, a majority of CoCs (53 percent) reported a decrease in chronic homelessness between 2008 and 2009. Homelessness is heavily concentrated in large coastal states, with California, New York, and Florida accounting for 39 percent of the PIT count in 2009. On a single night in January 2009, the states with the highest concentrations of homeless people were Nevada, where .85 percent of the total population was homeless, followed by Oregon, Hawaii, California, and
ii Executive Summary

Washington. Kansas, South Dakota, and West Virginia had the nation’s lowest concentrations of homeless persons.
One-Year Estimates of Sheltered Homeless People
Nearly 1.56 million people used an emergency shelter or a transitional housing program during the 12-month period (October 1, 2008 through September 30, 2009). Two thirds were homeless as individuals, and one-third were homeless as members of families. For the second straight year, the number of sheltered homeless families increased, while the number of sheltered homeless individuals dropped. In 2009, approximately 1,035,000 individuals used sheltered or transitional housing at some time during the year, as did 535,000 people who were there as part of a family. A family is a household that includes an adult 18 years of age or older and at least one child. All other sheltered homeless people are considered individuals. Considered as households rather than separate people, slightly more than 170,000 families were sheltered homeless in 2009, about a 30 percent increase since 2007.
Sheltered Homeless People in 2009
A typical sheltered homeless person in 2009 was an adult male, a member of a minority group, middle-aged, and alone. Men are overrepresented in the sheltered homeless population--63.7 percent of homeless adults are men, compared to 40.5 percent of adults in poverty. African Americans make up 38.7 percent of the sheltered homeless population, about 1.5 times their share of the poverty population. Only 2.8 percent of the sheltered homeless population is 62 years old or older. Homeless people have higher rates of disability than either the poverty population or the total U.S. population; slightly over two-thirds of sheltered homeless adults have a disability, according to HMIS data. People who are homeless by themselves are very different from those who are homeless with children. Sheltered individuals are overwhelmingly male. More than three quarters are over 30, more than 10 percent are veterans, and more than 40 percent have a disability. In contrast, adults in sheltered homeless families are overwhelmingly female, most are under age 31, and very few are veterans or have a disability. Three-fifths of the people in homeless families are children, and more than half of the children are under age 6. The geographic distribution of homelessness is markedly different from the distribution of the nation’s poverty and total populations. The share of sheltered homeless people in principal cities in 2009 is nearly twice the share of the poverty population in these areas, 68.2 vs. 35.6 percent. Homeless individuals are particularly likely to be in urban areas. Nearly three-quarters of all sheltered individuals (72.2 percent) accessed a homeless residential program in a principal city, compared with 61.2 percent of persons in families.
Executive Summary iii
Almost two-fifths of people entering an emergency shelter or transitional housing program during 2009 came from another homeless situation. Among those already homeless, almost two thirds were in shelter rather than in a place not intended for human habitation. Another two-fifths of people who entered shelter in 2009 came from a housed situation (in their own or someone else’s home), and the remaining one-fifth were split between institutional settings or other situations such as hotels or motels. Families were particularly likely to be housed the night before becoming homeless: more than 6 in 10 were either in their own housing unit (20 percent), staying with family (29 percent), or staying with friends (14 percent). More than three quarters of sheltered homeless people in 2009 used only emergency shelter, 77 percent. Families were more likely than individuals to use transitional housing either alone or in combination with emergency shelter, 30 vs. 19 percent. Most people had relatively short lengths of stay in emergency shelters: the median length of stay was 17 days for individuals and 36 days for persons in families.
Trends in Sheltered Homelessness, 2007-2009
The overall number of sheltered homeless people increased slightly between 2007 and 2008 before dropping slightly—by about 2 percent or 35,000 people—between 2008 and 2009. The continued rise in family homelessness across the three years, from 131,000 families in 2007 to 170,000 families in 2009, is almost certainly related to the recession. However, the increase was more pronounced between 2007 and 2008, even through unemployment rates remained high during the 2009 reporting period (October 2008 through September 2009). It may be that many families already at risk of becoming homeless lacked sufficient support networks and became homeless almost immediately after the economy turned down. A much larger group turned to family and friends and may be doubled up and still at great risk of becoming homeless. The percentage of adults in families who reported that they had been staying with families before entering shelter increased steadily over the three-year period, from 24.2 percent in 2007 to 29.4 percent in 2009, as did the total percentage reporting that they had been in some sort of “housed” situation before becoming homeless, reaching 62.5 percent in 2009. All of the increase in family homelessness in 2009 compared with 2008 was in the use of emergency shelter by family members, rather than transitional housing. Families stayed longer in shelters in 2009 than in 2008, with the median number of nights rising from 30 to 36. Not only did family homelessness continue to increase between 2008 and 2009, it also seems to have become more severe in the sense that it took the typical family longer to leave shelter. More individuals—adults entering shelter by themselves—reported that their previous living situation was a place not meant for human habitation in 2009 compared with 2008. This may suggest that communities are having some success in getting people off the “street” and into
iv Executive Summary
shelter or other forms of housing, especially since the overall number of unsheltered homeless individuals reported by communities in the PIT count did not go up. Few changes occurred in the demographic characteristics of sheltered homeless people. A slight aging of the adult homeless population (more people over 50) is consistent with other research that points to the aging of a cohort of people who became susceptible to homelessness when they were younger. Both families and individuals identifying themselves as African American have dropped steadily, from a high starting point. Adults in sheltered homeless families were more likely in 2009 to be men (20.4 percent) than they were in 2007 (18.0 percent). This likely reflects the pressures of the recession and is consistent with reports from the in-person interviews with providers conducted for this report.
The Nationwide Capacity of Residential Programs for Homeless People
In their annual applications to HUD, CoCs submit information on their inventories of residential beds for homeless people. In 2009, CoCs reported a total of 643,423 year-round beds nationwide in 20,065 separate emergency shelter, transitional housing, permanent supportive housing, and safe haven programs. For several years, one of HUD’s policy priorities has been the development of permanent supportive housing programs that provide a combination of housing and supportive services to people who were formerly homeless and with disabilities. In 2009 for the first time, the number of beds in permanent supportive housing surpassed the numbers of beds in emergency shelter or transitional housing. Permanent supportive housing increased by almost 60,000 beds between 2006 and 2009. More than half the growth was in the last year, from just under 196,000 beds in 2008 to more than 219,000 in 2009. Although there may be other factors that contributed to the decline in unsheltered homelessness and chronic homelessness in the PIT counts—including improved enumeration strategies—we believe the reported reductions reflect this increase in permanent supportive housing.
Looking Ahead
The 2010 AHAR will continue to provide Congress and the nation with updated counts of homelessness nationwide, including counts of individuals, persons in families, and special population groups such as chronically homeless people and persons with disabilities. These topics will be explored using data from an ever-expanding group of communities that participate in the AHAR, which now includes the majority of Continuums of Care nationwide. The 2010 AHAR also will add another full-year of HMIS data to further highlight trends in homelessness and identify any long-term impacts of the economic recession.
Executive Summary v
vi Executive Summary
The 2010 AHAR will be the first to include data on people served in permanent supportive housing programs, in addition to the data from emergency shelter and transitional housing programs that have constituted the first five AHARs. The slight decrease in the number of people using transitional housing programs in 2009 may have been a result of communities moving families directly from emergency shelters to permanent supportive housing. The 2010 AHAR will be able to assess this question, among many others, in a more nuanced fashion. The 2010 AHAR will also be the first to examine trends in homelessness among veterans, comparing the 2009 supplemental report on homeless veterans (to be released later in 2010) with the 2010 supplemental report. HUD continues to view the AHAR as the primary resource for up-to-date information about homelessness based on locally-derived HMIS data and is exploring ways to make these data readily accessible to states, localities, and the general public. Based on the AHAR, policymakers and practitioners alike will be able to better understand homelessness in their communities, allocate local homeless assistance funds effectively, improve program operations, and work toward the ultimate goal of ending homelessness.

Chapter 1: Introduction 1
Chapter 1 Introduction
This report is the fifth Annual Homeless Assessment Report (AHAR) on homelessness in the United States. The report provides estimates of the prevalence of homelessness nationwide, the demographic characteristics of homeless people, and the way homeless people use the residential services system. The estimates include the most recent counts of homeless individuals, persons in families, and special population groups such as veterans and persons experiencing chronic homelessness. The report also covers the types of locations where people use emergency shelter and transitional housing; where people were just before they entered a residential program; how much time they spent in shelters over the course of a year; and the size and use of the U.S inventory of residential programs for homeless people. This report builds on last year’s report by adding data on sheltered homeless people for another full year, allowing for a comparative analysis of homelessness that spans three years—2007, 2008, and 2009. The inclusion of data for a third year is important because it marks the establishment of discernable trends in homelessness. This report is also the first to include information from in-person interviews with local service providers located in nine communities nationwide.1 The qualitative information provides a contextual backdrop for understanding how homelessness is changing throughout the nation. Finally, the report adds Point-in-Time (PIT) counts of sheltered and unsheltered persons and of homeless subpopulations for another year, providing trend data for 2006 through 2009. The trend information reported in the AHAR is useful for several reasons. Trend information can help federal, state and local policymakers understand whether the nation’s policy responses are making a difference. They also show how the portrait of homelessness is changing over time, which may suggest a need to provide additional assistance to particular homeless subpopulations. Finally, trend information on the use of the nation’s homeless residential system may suggest the need reallocate funds to support programs that are in high demand.
1.1 History of the AHAR
At the direction of Congress, the U.S. Department of Housing and Urban Development (HUD) initiated a process to collect and analyze data on homelessness nationwide. HUD created uniform, national data definitions for local Homeless Management Information Systems (HMIS), which are designed primarily to be case management tools for local service providers
1 The nine Continuums of Care are: Cincinnati-Hamilton County CoC, Detroit CoC, Idaho Balance of State
CoC, Iowa Balance of State CoC, Memphis CoC, New York City CoC, Phoenix-Maricopa County CoC, San Francisco CoC, and Seaside-Monterey County CoC. The interview participants were local service providers located within each of these communities. The interviews in Idaho and Iowa were with service providers located throughout the state.

2 Chapter 1: Introduction
and communities. HMIS are maintained by localities, and the geographic coverage of HMIS systems varies considerably. Some systems cover just a city, others a city together with the rest of a metropolitan area. Still others are statewide or cover several counties in a state.. HUD instructed programs receiving HUD McKinney-Vento funding to report to the HMIS and encouraged all programs for homeless people—regardless of their funding source—to report as well. HMIS implementations have grown stronger over the past several years, and participation among local providers in these systems is rising. Currently, about 68 percent of all beds that are available for homeless and formerly homeless people are included in HMIS.2 In concert with the implementation and support of HMIS, HUD established a nationally representative sample of communities and began working with them to produce unduplicated estimates of the sheltered homeless population (i.e., people in emergency shelters and transitional housing).3 These estimates were supplemented by data from additional communities willing to provide their HMIS data. Since 2005, sample communities and others have been submitting unduplicated counts of shelter users, as well as other information about their demographic characteristics and patterns of service use for analysis and reporting in the AHAR. Five reports have been submitted to Congress since HUD launched this effort:
The 2005 AHAR covered a three-month period in 2005 and was based on HMIS data reported by 63 communities.
The 2006 AHAR covered six months, January through June 2006, and included information from 74 communities.
The 2007 AHAR was the first report to cover an entire year, October 2006-September 2007, and serves as the baseline for analyzing trends over time. For this report, 98 communities provided useable data.
The 2008 AHAR covered the next 12-month period, October 2007 through September 2008, and used HMIS data from 222 communities.
This report, or the 2009 AHAR, covers the October 2008 to September 2009 period and includes data from 334 communities— representing 2,988 counties and 1,056 cities.4 The report is based on 570,335 person records that were aggregated and reported to the AHAR.
2 This includes all year-round and seasonal beds, but excludes overflow or voucher beds. HMIS-bed
coverage is lowest among emergency shelters (65.2 percent) and highest among permanent supportive housing (72.9 percent) and safe havens (96.3 percent).
3 An unduplicated estimate means that each person is counted once during a given time period, even if the person is served multiple times during that period.
4 Some Continuums of Care submitted data for the sample site located within its jurisdiction, as well as data for the balance of the CoC. The unduplicated count of CoCs that participated in the 2009 AHAR is 296.

HUD also requires CoCs to report point-in-time (PIT) data collected for a single night in January as part of their annual applications for McKinney-Vento funding. The PIT data provide a one-night “snapshot” of homelessness within each CoC, including both the sheltered and unsheltered homeless populations. For several years, HUD has provided extensive technical assistance to communities on how to conduct these PIT counts and, as a result, the reliability of PIT data has improved greatly over time. The CoC applications also provide information on the inventory of residential programs, beds, and units for homeless and formerly homeless people.
Definitions of Key Terms
1. Homeless Management Information System (HMIS): HMIS is a software application designed to record and store client-level information on the characteristics and service needs of homeless persons.
2. Individuals: The HMIS-based estimates of sheltered homeless individuals include single adults, unaccompanied youth, persons in multi-adult households, and persons in multi-child households. A multi-adult household is a household composed of adults only—no children are present. A multi-child household is composed of children only (e.g., parenting youth)—no adults are present.
3. One-Year Sheltered Counts: 12-month counts of homeless persons who use an emergency shelter or transitional housing program at any time from October though September of the following year. The one-year counts are derived from communities’ administrative databases, or Homeless Management Information Systems (HMIS).
4. Persons in Families: The HMIS-based estimates of homeless persons in families include persons in households with at least one adult and one child.
5. Point-in-Time (PIT) Counts: One-night counts of both sheltered and unsheltered homeless populations. The one-night counts are reported on CoC applications and reflect a single-night during the last week in January.
6. Principal City: Following guidance from the U.S. Office of Management and Budget, the AHAR replaces the term “central city” with “principal city.” The largest city in each metropolitan or micropolitan statistical area is designated a principal city, and other cities may qualify if specified requirements (population size and employment) are met.
7. Sheltered: A homeless person who is in an emergency shelter or transitional housing program for homeless persons.
8. Unsheltered: A homeless person who is living in a place not meant for human habitation, such as the streets, abandoned buildings, vehicles, parks, and train stations.
1.2 AHAR Estimates for 2009
The AHAR provides two types of estimates. Estimates that are based on CoC PIT data provide one-night counts of all people who are homeless either in shelters or in places not meant for human habitation (colloquially, “the street”). Estimates that are based on HMIS data provide counts of all people who are sheltered homeless at any time during a year. Both types of estimates are important:
Chapter 1: Introduction 3

4 Chapter 1: Introduction
The PIT data provide a total count of all homeless people on a single night in January
and describe the share of people who are sheltered (i.e., in emergency shelter or transitional housing) or unsheltered (i.e., in a place not meant for human habitation) on that night.
The HMIS data provide longitudinal counts of shelter use over a 12-month period, offer a more detailed demographic profile of sheltered homeless people, and described their use of the residential services system.
At this time, neither PIT nor HMIS-based data support an unduplicated estimate of the total number of people who are sheltered and unsheltered homeless over the course of a year.5 However, given the information provided in this report, we can estimate that roughly 2 million people were homeless—sheltered and unsheltered—at some time during 2009.
1.3 This Report
Chapter 2 provides more detail on the counts of homeless persons. The counts reported in chapter 2 include both the PIT estimates of people who are in shelters and on the streets and the HMIS-based estimates of people who access a shelter at some time during 2009. The counts are presented separately for people who are homeless as individuals and those who are part of a family. The chapter describes trends in the PIT estimates over a four-year period, 2006-2009, and also provides detail on how homelessness varies from state to state. Chapter 3 describes the sheltered homeless population in 2009. The chapter focuses on the demographic characteristics of sheltered homeless people and compares this profile to the characteristics of people living in poverty and the total U.S. population. The chapter also discusses the types of locations where people use residential programs for homeless people and how they use programs—for example, do they use emergency shelter or transitional housing programs and how long do they stay?. Chapter 4 focuses on trends in sheltered homelessness between 2007 and 2009. The chapter describes shifts in the homeless population between individuals and families, the changing geography of homelessness, and changes in the use of the residential system for homeless people. The chapter also reports changes in the patterns of becoming homeless—that is, where people said they were the night before entering an emergency shelter or a transitional housing program and how long they had been there.
5 Adding the unsheltered count from the Point-in-Time estimate to the HMIS-based one-year count would
miss people who were unsheltered on some other night during the year but not when the “street count” was conducted. On the other hand, adding the unsheltered count also would double-count the large fraction of the people who are unsheltered homeless on a particular night but who go to emergency shelters at some time during a year and are already counted in the HMIS data.

Chapter 5 documents the numbers and locations of residential programs for homeless people, including permanent supportive housing, as well and emergency shelters and transitional housing programs. The chapter also reports how intensively emergency shelters and transitional housing programs are used and how that has changed over time. Appendix A provides a list of the communities providing useable data to this 2009 AHAR. Appendix B describes the methodology for selecting the nationally representative sample of communities, collecting and cleaning the data, and for weighting and adjusting the data to create the national estimates. Appendix C presents the PIT estimates for each state and CoC. Appendix D consists of detailed tables based on the HMIS data. The tables provide counts of sheltered homeless people in numerous categories for 2009 and are intended to supplement the information provided in the body of the report. Tables for 2007 and 2008 may be found in the appendices to those AHAR reports.
1.4 Trends in Homelessness and the Economic Crisis
This report captures information on the use of the homeless residential system during the height of the economic and foreclosure crisis, which began in December 2007. The three-year changes documented in this report provide some evidence of how the recession has affected homelessness in America. The one-year estimates of shelter use show that almost 62,000 more family members were in shelter at some point during 2009 than had been during 2007, making up almost 40,000 families. The continued growth in sheltered family homelessness almost certainly reflects the ongoing effect of the recession. When compared to 2008, a slightly higher proportion of families came from housed situations, most commonly staying with family. The fragile economic circumstances of the relatives of struggling parents may mean that, as soon as job losses begin in an economic downturn, support networks for families at risk of homelessness fall apart. Doubled-up housing situations cannot be sustained, cash is no longer available to help others with rent payments, and families turn to homeless shelters as the only way of keeping a roof over their heads. The data also show that adults in families were somewhat more likely to be men in 2009 than they were in 2007. Because of the recession, more families with two adults may have become homeless, as well as more families with only a father present. Local service providers in six of the nine communities visited for this report said they had seen an increase in two-parent families and male-headed families. Providers attribute the increase in two-parent families to the effects of the recession, which is making it difficult for even one parent to find a job.
Chapter 1: Introduction 5

6 Chapter 1: Introduction
Looking ahead, the long-term impacts of the recession are unclear. A recent study found that the recession has caused a dramatic increase, almost five-fold, in the rate of overcrowding, suggesting that many families are doubling up in response to the economic downturn.6 If some of these family support networks already are struggling to make ends meet, some of the doubled-up families may find their way into the homeless residential service system during 2010. On the other hand, as the nation comes out of the recession and as the stimulus funding made available through the Homelessness Prevention and Re-housing Program (HPRP) starts helping families in crisis avoid shelter, it also is possible that family homelessness will decline during the next reporting period. Indeed, as of May 2010, HPRP has already served more than 300,000 people and approximately 75 percent of the funds have been used for prevention services.
6 Painter, Gary. 2010. What Happens to Household Formation in a Recession? Research Institute for
Housing America and the Mortgage Bankers Association.

Chapter 2: National Estimates of All Homeless People, Sheltered and Unsheltered 7
Chapter 2 National Estimates of All Homeless People, Sheltered and Unsheltered
This chapter provides the 2009 national estimates of the prevalence of homelessness on a single night and during a 12-month period (October 2008 to September 2009). Using point-in-time (PIT) and HMIS data reported by Continuums of Care, this chapter:
Presents the PIT counts of all sheltered and unsheltered homeless people, distinguishing between sheltered and unsheltered homeless people and between people who are homeless as individuals and as members of families. The chapter also describes how these estimates changed between 2006 and 2009 and describes which states have disproportionate numbers of homeless people compared with the state’s overall population.
Presents the PIT counts of homeless “subpopulations,” including people who are chronically homeless; people with severe mental illness; people with substance abuse issues; veterans; unaccompanied youth; and people living with HIV/AIDS.
Presents the one-year estimates of sheltered homeless people based on HMIS data. This chapter summarizes the estimates for 2009 and prior years that are discussed in more detail in Chapters 3 and 4.
2.1 One-Day Count of Homeless People
On a single night in January 2009, all Continuums of Care across the country were required to conduct a thorough enumeration of the homeless.7 In total, the 452 CoCs found 643,067 people who were literally homeless on the night of the count. Sixty-three percent of those counted were sheltered—sleeping in emergency shelters or transitional housing—while the other 37 percent were unsheltered—sleeping on the streets, in their cars, in abandoned buildings, or in other places not meant for human habitation. Nearly two-thirds (63 percent) of people who were homeless on the night of the PIT count were individuals. Although the PIT count was conducted in the middle of winter, nearly half of all homeless individuals were unsheltered. Persons in families—households
7 CoCs are required by HUD to conduct an annual count of their sheltered and unsheltered homeless
population every other year, starting in 2007, then 2009, and so on. Many CoCs, however, voluntarily choose to conduct a PIT count each year. In 2008, a third of CoCs did not conduct a new count, but rather reported their 2007 data for the 2008 counts.
On a single night in January 2009, there
were 643,000 homeless people in shelters or on
the streets.

with at least one adult and one child—accounted for 37 percent of those homeless on the night of the PIT count. Less than a quarter of homeless persons in families were unsheltered. The results of the 2009 PIT count confirm that homelessness is still a serious problem that affects far too many people. However, the percentage of all people in the U.S. who are literally homeless on any night is very small. On the night of the January 2009 PIT count roughly one in every 500 people and one in every 75 people living below the poverty line was literally homeless. This suggests that the long-stated goal of eliminating homelessness could be achieve with adequate and effectively targeted resources.
Exhibit 2-1: Homeless Persons and Households by Sheltered Status, Single Night in 2009
Household Type Number Percentage
Total People Sheltered 403,308 62.7% Unsheltered 239,759 37.3% Total 643,067 100.0%
Individuals Sheltered 215,995 53.3% Unsheltered 188,962 46.7% Total 404,957 100.0%
Persons in Families Sheltered 187,313 78.7% Unsheltered 50,797 21.3% Total 238,110 100.0%
Total Family Households Sheltered 60,843 77.5% Unsheltered 17,675 22.5% Total 78,518 100.0%
Source: 2009 Continuum of Care Applications: Exhibit 1, CoC Point-in-Time Homeless Population and Subpopulations Charts
2.2 Trends in PIT Counts of Homeless People
Exhibit 2-2 shows the change in the PIT count of all homeless people between January 2008 and January 2009. The top panel of the exhibit includes all 452 CoCs that submitted data in 2009, while the bottom panel excludes 3 CoCs that experienced important methodological issues in either 2008 or 2009 that merit special attention. The top panel shows a 3.2 percent decrease in the total PIT count of all homeless people from January 2008 to January 2009, from 664,414 to 643,067. The decline includes 2.5 percent decrease in the number of homeless individuals and a 4.5 percent decrease in the number of homeless persons in families. The exhibit also shows a 4.3 percent increase in the number of sheltered homeless people that was offset by a 13.7 percent decline in the number of people who were unsheltered.
8 Chapter 2: National Estimates of All Homeless People, Sheltered and Unsheltered

Chapter 2: National Estimates of All Homeless People, Sheltered and Unsheltered 9
The decline in homelessness in 2009 was driven primarily by a single city with a large homeless population, the City of Los Angeles. Between 2007 and 2009, the total count of homeless people on a single night in Los Angeles decreased from 68,608 to 42,694, and the city’s unsheltered homeless count decreased by almost half from 57,166 to 28,644.8 In addition to Los Angeles, two other cities experienced significant methodological issues with their annual PIT count of homeless people—New Orleans and Detroit.9 Removing these three cities from both the 2008 and 2009 counts reveals a much different trend—the count of sheltered and unsheltered people on a single night in January 2008 and 2009 increases by 2.1 percent. The increase in homelessness includes a 4.1 percent increase in sheltered homelessness and a 1.7 percent decrease in unsheltered homelessness. The removal of these large cities from the PIT counts and the resulting shift in trends illustrates the need to interpret changes in one-night PIT counts carefully. Unlike HMIS-based counts (presented in chapters 3 and 4), one-night PIT counts are particularly sensitive to dramatic changes within the nation’s largest cities and to evolving enumeration strategies.
8 Los Angeles' point-in-time totals were based on four sources. First, a street count of unsheltered homeless
persons conducted over a three-day period in January, covering over 40 percent of the city’s census tracts. Several "hot spot" census tracts were selected with certainty (the same hot spots identified in the 2007 PIT count), and all other tracts were selected through stratified random sampling. The results from selected census tracts were extrapolated to provide estimates for the entire CoC. Between 2007 and 2009 the number of people found living in unsheltered locations within Los Angeles decreased from 35,333 to 17,750. Second, the CoC conducted a count of sheltered persons in all of Los Angeles' 452 emergency shelters and transitional housing programs. The number of persons in the sheltered count increased from 11,442 in 2007 to 14,050 in 2009. Third, an enumeration of the "hidden homeless" was conducted via a telephone survey to estimate the number of homeless persons who were sleeping on private property outside a place of residence' (e.g., a car or encampment) at the time of the PIT count. A total of 4,288 households within the Los Angeles CoC responded to the telephone survey and the results were extrapolated to provide a CoC-wide estimate of the hidden homeless. This estimate was included in city’s unsheltered count. The 'hidden homeless' estimate decreased from 20,746 in 2007 to 9,968 in 2009. Finally, a separate count of unsheltered homeless youth was conducted in March. The count was organized by eight providers of services to homeless youth, and the enumeration took place in neighborhoods where homeless youth are typically found. Unlike the unsheltered street count, the CoC did not extrapolate the estimates of homeless youth. The homeless youth count declined from 1,087 in 2007 to 926 in 2009.Taken together, these four sources indicated that the total count of homeless people on a single night in Los Angeles decreased from 68,608 to 42,694 between 2007 and 2009.
9 The City of New Orleans did not conduct a new PIT count of homeless people in 2008, reporting their 2007 data in their 2008 application. However, the city’s 2007 data were highly unreliable because the aftermath of Hurricanes Katrina and Ike made it very difficult to produce an accurate PIT count of homeless people. As a result, the change in the number of homeless people from 2007 to 2009 increased dramatically, from 1,619 to 8,725. In the City of Detroit, the city applied an extrapolation factor to their 2008 data to account for people who may have been missed during their count of unsheltered people. The city chose not to apply this extrapolation factor to their 2009 counts, reporting their raw 2009 count without the extrapolation. As a result, the PIT count of homeless people declined dramatically, from 18,062 (in 2008) to 3,694 (in 2009).

Exhibit 2-2: Changes in PIT Counts of Homeless People by Sheltered Status and Household Type, 2008-2009
2008 Count 2009 Count Percent Change 2008-2009
All Continuums of Care
Sheltered Status Sheltered 386,361 403,308 +4.3% Unsheltered 278,053 239,759 -13.7%
Household Type Individuals 415,202 404,957 -2.5% Persons in Families 249,212 238,110 -4.5%
Total 664,414 643,067 -3.2% Excluding Three Continuums of Care a
Sheltered Status Sheltered 369,191 384,486 +4.1% Unsheltered 206,934 203,468 -1.7%
Household Type Individuals 350,523 356,222 +1.6% Persons in Families 225,602 231,732 +2.7%
Total 576,125 587,954 +2.1%
a The three CoCs are The City of Los Angles CoC, the City of Detroit CoC and the City of New Orleans CoC. These CoCs were excluded from the analysis because there were significant methodological issues related to their 2008 or 2009 PIT count of homeless persons.
Source: 2009 Continuum of Care Applications: Exhibit 1, CoC Point-in-Time Homeless Population and Subpopulations Charts excluding Los Angeles, Detroit, and New Orleans data from both 2008 and 2009.
Exhibit 2-3 shows a gradual decline from 2006 to 2009 in the number of individuals and persons in families who were homeless on the night of the annual PIT count. The largest decline occurred between 2006 and 2007 and the counts have been fairly stable since then. While the decline is welcome news, particularly given overall changes to the economy and the housing market, it is difficult to disentangle the effects of successful policy interventions from nationwide improvements in PIT enumeration methods that have lead to greater accuracy.
10 Chapter 2: National Estimates of All Homeless People, Sheltered and Unsheltered

Chapter 2: National Estimates of All Homeless People, Sheltered and Unsheltered 11
In addition, these national trends mask some of the changes that occurred within CoCs. As shown in Exhibit 2-4, one-third of CoCs reported an increase in both individual and family homelessness, one-quarter reported a decrease in both categories, and the remainder reported an increase in one category and a decrease in the other. A majority of CoCs reported an increase in sheltered homelessness (58 percent) but a decrease in unsheltered homelessness (53 percent) (see Exhibit 2-5). The increase in the proportion of sheltered homeless people could suggest that communities are successfully moving people off of the streets and into shelter or other forms of housing. HMIS data (reported in Chapter 4) also show that more individuals report sleeping in a place not suitable for human habitation before entering shelter. Exhibit 2-5 also shows considerable fluctuations in the magnitude of change in CoC’s PIT counts of homeless people. Forty percent of CoCs reported an increase or decrease of 50 percent or more in their unsheltered count, and only 14 percent reported such large changes in their sheltered counts. Unsheltered counts are more prone to large shifts from one year to the next for several reasons. First, shelters have capacity constraints that limit how many people they can serve on any night. Unless CoCs change their capacity by adding or reducing shelter beds, their sheltered counts can fluctuate only within a limited range. In contrast, there is no fixed limit on how many people can be living in unsheltered conditions at any time. Also, conducting a count of sheltered people can be relatively straightforward
643,067
404,957
671,888
759,101
664,414
452,580423,377 415,202
238,110
306,521
248,511 249,212
0
100,000
200,000
300,000
400,000
500,000
600,000
700,000
800,000
2006 2007 2008 2009
Source: 2006 through 2009 Continuum of Care Application: Exhibit 1, CoC Point-in-Time Homeless Population and Subpopulations Charts
Exhibit 2.3 Trends in Homeless PIT Counts, 2006-2009
Total
Individuals
Persons in Families

while conducting accurate counts of unsheltered people can be very challenging. Street count methodologies differ greatly by CoC and year, and even marginal changes to these methodologies can result in substantial impacts on the counts. Finally, inclement weather conditions can hamper CoCs abilities to conduct thorough street counts on any given year, and thus lead to considerable changes in their counts of unsheltered homeless persons. For the 2009 PIT count, HUD contacted any CoC that reported either a greater than 100 percent increase or a greater than 50 percent decrease in its unsheltered homeless count between 2008 and 2009. Of the 79 CoCs contacted, 41 (or 52 percent) attributed the change to a change in their methodology, 23
(or 29 percent) to a change in the weather, and 15 (or 19 percent) believed the change was an accurate reflection of the number of unsheltered homeless people in their CoC. These results highlight the need for caution when attempting to attribute changes in the data to larger policy or economic factors.
Exhibit 2.4 Change in Homelessness Among CoCs, 2008-2009
21.3%20.6%
33.2%24.8%
Increase in family and individual homelessness
Increase in families; decrease in individuals
Increase in individuals; decrease in families
Decrease in both individual and familyhomelessness
CoCs Reporting:
21.3%20.6%
33.2%24.8%
Increase in family and individual homelessness
Increase in families; decrease in individuals
Increase in individuals; decrease in families
Decrease in both individual and familyhomelessness
CoCs Reporting:
Exhibit 2-5: Magnitude of Change in PIT Counts of Homeless People by Sheltered Status and Household Type, 2008-2009
Decrease of more
than 50% 20-50%
Decrease
Decrease of less
than 20% No
Change
Increase of less
than 20% 20-50%
Increase
Increase of more than
50%
Sheltered Status Sheltered 3% 11% 26% 2% 32% 15% 11% Unsheltered 20% 19% 14% 1% 13% 13% 20%
Household Type Individuals 4% 16% 24% 1% 28% 13% 12% Persons in Families
6% 15% 25% 2% 21% 16% 15%
Total Persons 4% 13% 27% <1% 32% 14% 10%
Source: 2008 and 2009 Continuum of Care Applications: Exhibit 1, CoC Point-in-Time Homeless Population and Subpopulations Charts
12 Chapter 2: National Estimates of All Homeless People, Sheltered and Unsheltered

2.3 Where People were Homeless on the Night of the PIT Count
Exhibit 2-6 shows the percentage of the homeless and total U.S. population within each census region. Compared to their portion of the total population, people in the West are over-represented within the homeless population and people in the Midwest and South are under-represented. Between 2008 and 2009 the number of homeless people stayed the same in the Northeast, decreased in the Midwest and West, and increased in the South.
Appendix C provides the results of the 2009 homeless PIT counts for each state. The data show that, while homelessness occurs everywhere throughout the United States, it is particularly concentrated in large coastal states. Thirty-nine percent of people counted as homeless on the night
of the PIT count were located in California, New York, or Florida. These three states account for 25 percent of the total U.S. population. The disproportionate presence of homelessness in these states could be because of high housing costs in these states.
Exhibit 2-6: PIT Count of Homeless People by Census Region, 2009
Percent of Homeless Population
Percent of Total U.S. Population
Northeast 18% 18% Midwest 12% 22% South 32% 37% West 37% 23%
Source: 2009 Continuum of Care Application: Exhibit 1, CoC Point-in-Time Homeless Population and Subpopulations Chart. Total population count comes from 2006-2008 weighted averages from the American Community Survey.
States that have large shares of homeless people when compared to their total state populations include some smaller states as well (see Exhibit 2-7). Excluding Washington, DC, which is not a state, Nevada has the highest number of homeless people per capita, followed by Oregon, Hawaii, California, and Washington State. All of these states are located in the West and, as discussed in chapter 5, have the largest bed per capita rates in the nation. Their high percentages of homeless people could reflect a high percentage of total population found in principal cities (Nevada), high housing costs (California and Hawaii), or a high percentage of adult men without family attachments (Oregon and Washington) Kansas, South Dakota, and West Virginia had the lowest reported rates of homelessness.
Chapter 2: National Estimates of All Homeless People, Sheltered and Unsheltered 13

14 Chapter 2: National Estimates of All Homeless People, Sheltered and Unsheltered
Exhibit 2-7: Percentage of National Homeless Population by State
2.4 PIT Counts of Homeless Subpopulations
The PIT data also provide information on the number of homeless people who are in particular subpopulations. CoCs are required to collect information on the number of chronically homeless people (for both sheltered and unsheltered locations) and on other subpopulations, such as veterans and people with severe mental illness (for sheltered conditions only).
Chronic Homelessness
The 2009 PIT count identified 110,917 individuals who met the definition of chronic homelessness.10 The majority of chronically homeless individuals (58 percent) were unsheltered. Overall, 27 percent of all homeless individuals, 21 percent of sheltered homeless individuals, and 35 percent of unsheltered homeless individuals experienced chronic homelessness.
10 A chronically homeless person is defined as an unaccompanied homeless individual with a disabling
condition who has been either continuously homeless for a year or more or who has had at least four episodes of homelessness in the past three years. To be considered chronically homeless, a person must have been on the streets or in emergency shelter (e.g., not in transitional or permanent housing) during these stays. Prior to the passage of the HEARTH Act persons in families could not be considered chronically homeless.

Chapter 2: National Estimates of All Homeless People, Sheltered and Unsheltered 15
As shown in Exhibit 2-8, the number of chronically homeless individuals decreased by 10.6 percent from 2008 to 2009, from 124,135 to 110,917. The number of sheltered chronically homeless individuals stayed the same, while the number of unsheltered homeless individuals decreased. As in the overall PIT counts, the majority of the decline in chronic homelessness occurred within the City of Los Angeles. Excluding the City of Los Angeles from both the 2008 and 2009 counts, there was a 1.1 percent decline in chronic homelessness. A slight majority of CoCs (53 percent) reported a decrease in chronic homelessness between 2008 and 2009 (see Exhibit 2-9). As the exhibit suggests, only 13 percent of CoCs reported a 50 percent or greater decline in chronic homelessness, but this small proportion of CoCs accounted for more than 23,000 fewer chronically homeless people between 2008 and 2009.
110,917
45,592
123,833
155,623
124,135
53,137
41,76845,418
65,325
102,486
82,06578,717
0
20,000
40,000
60,000
80,000
100,000
120,000
140,000
160,000
180,000
2006 2007 2008 2009
Source: 2006 through 2009 Continuum of Care Applications: Exhibit 1, CoC Point-in-Time Homeless Population and Subpopulations Charts
Exhibit 2.8: Trends in Chronic Homelessness, 2006-2009
Total
Sheltered
Unsheltered
Nu
mb
er o
f P
eop
le

16 Chapter 2: National Estimates of All Homeless People, Sheltered and Unsheltered
Other Subpopulations
CoCs were also asked to report on the number of sheltered homeless people on a single night in January who are veterans, have severe mental illness, chronic substance abuse problems, HIV/AIDS, are victims of domestic violence, or who are unaccompanied youth (see Exhibit 2-10).11 Based on these PIT estimates, one-third of sheltered homeless persons were reported to have a chronic substance abuse problem and one-quarter reportedly had a severe mental illness on a single night in January 2009. Thus, a large percentage of the homeless population has issues that go beyond a temporary housing crisis, and supportive services maybe needed to address those issues. However, contrary to the perceptions that some people have of homelessness, a majority of homeless shelter users do not have chronic substance abuse problems or severe mental illness. Thirteen percent of sheltered homeless adults were veterans, a lower percentage than has been reported elsewhere. There are several possible explanations for this discrepancy. First, the PIT data on veteran status are only for sheltered homeless people, and homeless veterans may be more likely to be unsheltered than other homeless people. If so, the percentage of sheltered homeless people who are veterans would be lower than the percentage of all homeless people who are veterans. Second, in some areas of the country, residential programs for the homeless that are funded through the U.S. Department of Veterans Affairs do not report data to the CoC. Finally, there is anecdotal evidence that homeless veterans sometimes do not divulge their veteran status to homeless program staff. Victims of domestic violence constituted twelve percent of the sheltered homeless population, four percent had HIV/AIDS, and only one percent consisted of unaccompanied people less than 18 years of age. The percent of the sheltered population with any of these characteristics or experiences in January 2009 was lower than it was in January 2008 or in January 2006. The reasons for the
11 Veterans status was only asked of adults. Substance abuse, mental illness, and HIV/AIDS status was asked
of all adults and unaccompanied youth but not children in families.
Exhibit 2-9: Magnitude of Change in PIT Counts of Chronically Homeless People, 2008-2009
Decrease of more
than 50%
20-50% Decrease
Decrease of less
than 20%
No Change
Increase of less
than 20%
20-50% Increase
Increase of more than
50%
Percent of CoCs 13% 20% 20% 4% 13% 14% 16%
Total Change -23,116 -9,166 -2,255 0 775 4,749 15,320
Source: 2008 and 2009 Continuum of Care Applications: Exhibit 1, CoC Point-in-Time Homeless Population and Subpopulations Charts

Chapter 2: National Estimates of All Homeless People, Sheltered and Unsheltered 17
decrease are difficult to pinpoint. One possible factor is the development of permanent supportive housing specifically targeted to certain subpopulations (HIV/AIDS, veterans, chronic substance abusers, people with severe mental illness). Second, improvements in methodology may have contributed to the decline, as CoCs have stopped including substance abuse programs, orphanages, or other programs with residents who should not be considered homeless in their PIT counts. Finally, the recession may be causing an increase in the number of people who are homeless for purely economic reasons.
2.5 Estimates of Sheltered Homeless Individuals and Families during a One-Year Period
This section shifts from information based on CoC PIT data to longitudinal estimates of the number of people using emergency shelters and transitional housing at any time during the one-year period from October 1, 2008 to September 30, 2009. These estimates are based on CoCs’ HMIS data. Unlike the PIT counts, CoCs are not required to participate in the AHAR, and thus some CoCs do not submit HMIS data to HUD. Participation in the AHAR is growing immensely, from 222 communities in 2008 to 334 communities in 2009, spurred by the inclusion of AHAR-related questions in the CoC competitive scoring process for McKinney-Vento funds. Altogether, the 334 communities that participated in the 2009 AHAR submitted usable data on 570,335 person records. These data were statistically
33.9%
24.9%
12.1%
3.9%
1.4%
39.0%
36.4%36.5%
25.3%27.6%
26.3%
13.1%
15.5% 15.0% 15.1%
12.8%13.0%12.6%
4.2%4.1%4.7%
2.1%2.3%4.8%
0.00%
5.00%
10.00%
15.00%
20.00%
25.00%
30.00%
35.00%
40.00%
45.00%
2006 2007 2008 2009
Source: 2006 – 2009 Continuum of Care Applications: Exhibit 1, CoC Point-in-Time Homeless Population and Subpopulations Charts
Exhibit 2-10: Trends in Sheltered Homeless Subpopulations 2006-2008
Chronic Substance Abusers
Severely Mentally Ill
Veterans
Victims of Domestic Violence
Unaccompanied Youth
Persons with HIV/AIDS

18 Chapter 2: National Estimates of All Homeless People, Sheltered and Unsheltered
adjusted to produce the national estimates that are summarized here and presented in more detail in Chapters 3 and 4.12 Roughly 1.56 million people, or one in every 200 Americans, spent at least one night in an emergency shelter or transitional housing program in 2009. Two-thirds of sheltered persons were individuals and one-third were persons in families. The total number of homeless shelter users declined by nearly 30,000 people from 2008 to 2009. However, for the second straight year the number of homeless families increased: 473,541 in 2007; 516,724 in 2008; and 535,447 in 2009. Overall, family homelessness increased by about 7 percent between 2008 and 2009 and 30 percent from 2007 to 2009. As a result of this increase, along with the drop in the number of individual homeless people, the percentage of sheltered homeless people who were homeless as part of families rather than by themselves increased from 29.8 percent in 2007 to 34.1 percent in 2009.
12 See Appendix B for a description of the weighting techniques used to produce national estimates from
HMIS data.
Exhibit 2-11: Estimates of Sheltered Homeless Individuals and Persons in Families During a One-Year Period, 2007-2009
2007 2008 2009
Total
Number
% of Sheltered Homeless Population
Total Number
% of Sheltered Homeless Population
Total Number
% of Sheltered Homeless Population
Total Number of Sheltered Persons a
1,588,595c 1,593,794 c 1,558,917 c
Individuals b 1,115,054 70.2% 1,092,612 67.9% 1,034,659 65.9% Persons in families 473,541d 29.8% 516,724 d 32.1% 535,447 d 34.1%
Number of Sheltered Households with Children
130,968 d - 159,142 d - 170,129 d -
a These estimated totals reflect the number of homeless persons in the 50 states and the District of Columbia who used emergency shelters or transitional housing programs during the one-year period from October 1 through September 30 of the following year. The estimates do not cover the U.S. Territories and Puerto Rico and do not include persons served by “victim service providers.” The estimated totals include an extrapolation adjustment to account for people who use emergency shelters and transitional housing programs but whose jurisdictions do not yet participate in their respective HMIS. However, a homeless person who does not use an emergency shelter or transitional housing during the 12-month period is not included in this estimate. Percentages may not sum to 100 percent due to rounding.
b This category includes unaccompanied adults and youth as well as multi-adult households without children. c This estimate includes unaccompanied individuals and persons in households. In 2007, the 95 percent confidence interval for
the estimated number of sheltered homeless persons in the population was 1,043,775 to 2,133,415 persons (or +/- 544,820 persons). In 2008, the 95 percent confidence interval is 1,180,758 to 2,006,830 (or +/- 413,036 persons). In 2009, the 95 percent confidence interval is 1,265,075 to 1,922,513 (or +/- 328,719).
d In 2007 - 2009, approximately 1 percent of homeless persons were served both as an unaccompanied individual and a person in a family. In this exhibit, such people appear in both categories in 2008, so the total number of sheltered persons is slightly less than the sum of individuals and families.
Source: Homeless Management Information System data, 2007-2009

Chapter 3 provides information on the characteristics of people who used emergency shelter and transitional in 2009, and Chapter 4 provides detailed information on the trends in sheltered homelessness across the three years from 2007 to 2009.
2.6 Summary of the National Estimates of All Homeless People
Results from the single-night PIT count:
On a single night in January 2009, 643,000 people were homeless. Nearly two-thirds stayed in an emergency shelter or transitional housing program and the other third were living on the street, in an abandoned building, or another place not meant for human habitation.
The number of homeless persons on the night of the PIT count decreased 3.2 percent from January 2008 to January 2009. However, this decline reflects a steep decline in the homeless population of a single city, Los Angeles. Removing Los Angeles from both counts, the total number of homeless people increased although the number of unsheltered homeless people still decreased.
A majority of CoCs reported an increase in sheltered homelessness and a decrease in unsheltered homelessness. Communities may be successfully moving people of the street and into shelter or other forms of housing.
Large coastal states—California, New York, and Florida—accounted for 39 percent of people who were homeless on the night of the PIT count. Several other western states, besides California, had large shares of homeless people compared to their total state populations.
Chronic homelessness seems to have continued a long-term pattern of decline between 2008 and 2009.
Results from one-year estimates from HMIS data:
Nearly 1.56 million people spent at least one night in an emergency shelter or transitional housing program between October 1, 2008 and September 30, 2009.
Nearly 35,000 fewer people used emergency shelter or transitional housing in 2009 than in 2008. However, the number of families in homeless programs increased by nearly 11,000. Since 2007 there has been a nearly 30 percent increase in the number of sheltered families.
Chapter 2: National Estimates of All Homeless People, Sheltered and Unsheltered 19

20 Chapter 2: National Estimates of All Homeless People, Sheltered and Unsheltered

Chapter 3: Sheltered Homeless People in 2009 21
Definition of Sheltered Homeless Individuals and Persons in Families
Sheltered homeless individuals include single adults, unaccompanied youth, persons in multi-adult households, and persons in multi-child households.
Sheltered homeless persons in families include persons in households with at least one adult and one child.
Chapter 3 Sheltered Homeless People in 2009
This chapter provides a profile of the estimated 1.56 million sheltered homeless people in 2009. The chapter is based on HMIS data reported by 334 jurisdictions nationwide and weighted to represent the entire nation. The data were collected on anyone who used an emergency shelter or transitional housing program at some time from October 2008 through September 2009. As in past reports, the profile of sheltered homeless people focuses on three topics:
The demographic characteristics of sheltered homeless people. Who were the sheltered homeless? How did the characteristics of homeless people compare to those of the overall population living in poverty and the U.S. population as a whole?
The location of homeless service use. In what types of communities (urban, suburban or rural) did people use emergency and transitional housing programs? Where did they stay before using residential homeless services?
The patterns of homeless service use. How did people use emergency and transitional housing programs? How long did people stay in homeless residential facilities?
These topics are discussed for the total, sheltered homeless population and separately for individuals and for persons in families. Most individuals are unaccompanied adults. For the purposes of this report, a family includes persons in households with at least one adult and one child, so all other households (e.g., unaccompanied youth and two adults who are homeless together but without children) are considered to be homeless as individuals.
3.1 Characteristics of People Using Homeless Shelters, 2009
Characteristics of All Sheltered Persons
Homelessness can befall people of all genders, races and ages. A portrait of the estimated 1.6 million people who used a shelter between October 2009 and September 2010 is provided in Exhibit 3-1. In 2009, a typical sheltered homeless person had the following characteristics:

22 Chapter 3: Sheltered Homeless People in 2009
A typical homeless person is a middle-aged, adult male who is a member of a minority group and is by himself.
Adult—78 percent of all sheltered homeless persons are adults.
Male–61 percent are male. Minority—62 percent are members of a minority
group. Middle-age—38 percent are 31 to 50 years old. Alone—64 percent are in one-person households. No special needs—62 percent do not have a disability.
Exhibit 3-1 also compares the characteristics of the sheltered homeless population with those of the U.S. poverty and total populations, highlighting several important differences. When compared to these populations, homeless people are much more likely to be adult males, African-Americans, not elderly, alone, veterans, and disabled. Adult males. Adult men are overrepresented in the sheltered homeless population. An estimated 63.7 percent of homeless adults are men, compared to 48.7 percent of the overall population and 40.5 percent of the poverty population. As noted in previous reports, the large proportion of adult men in the shelter system is likely associated with several factors: gaps in the Unemployment Insurance program; an inability to qualify for the largest safety net programs (e.g., Temporary Assistance for Needy Families and Social Security);13 higher rates of substance abuse than among women; and a greater likelihood that men have institutional histories that are related to homelessness (e.g., incarceration).14 13 Single men who are poor may be more vulnerable to homelessness because of large gaps in the
Unemployment Insurance program and because the largest safety net programs, such as Temporary Assistance for Needy Families (TANF) and Social Security, are for families or elderly people. The share of unemployed workers receiving unemployment insurance has declined in recent decades and the gap may be particularly perilous for men because poor women are likely to be accompanied by children and thus eligible for TANF. Adult poor men also have higher rates of substance abuse than women, but substance abuse has not been a categorical eligibility criterion for SSI since 1996. Thus, some women may fall through one social safety net but be caught by another; men may miss them all. See the 2008 Annual Homeless Assessment Report. U.S. Department of Housing and Urban Development, Washington D.C.
14 The share of individual sheltered homeless men reported in the HMIS may be artificially high. First, the HMIS data do not include adults served by domestic violence providers, most of whom are women, because domestic violence providers are prohibited by the Violence Against Women Act of 1994 (reauthorized in 2000 and 2005) from participating in HMIS. Second, some shelters have policies prohibiting men over a certain age from sleeping in family shelters, requiring men and teenage boys to stay at men’s shelters alone.
A study of patterns of homelessness among families in four communities—Houston TX, Washington DC, Kalamazoo MI, and upstate South Carolina—tracked people from their first entry into the homeless services system (based on HMIS data) for 18 months (30 months in DC) and found that many adults who were homeless as part of a family during part of the tracking period used shelters for individuals at other times during the tracking period. Brooke Spellman, Jill Khadduri, Brian Sokol, and Josh Leopold, Costs Associated with First-Time Homelessness for Families and Individuals. U.S. Department of Housing and Urban Development, March 2010.

Exhibit 3-1: Demographic Characteristics of Sheltered Homeless Persons in 2009 Compared to the 2008 U.S. and Poverty Populations
Characteristic
Percentage of All Sheltered Homeless
Persons, 2009
Percentage of the 2008 U.S. Poverty
Population
Percentage of the 2008 U.S.
Population Gender of Adults
Male 63.7% 40.5% 48.7%
Female 36.3% 59.5% 51.3% Ethnicity
Non-Hispanic/non-Latino 80.5% 75.1% 84.6%
Hispanic/Latino 19.5% 24.9% 15.4% Race
White, Non-Hispanic 38.1% 46.2% 65.4%
White, Hispanic 11.6% 15.0% 9.6%
Black or African American 38.7% 22.1% 12.4% Other Single Race 4.7% 13.8% 10.3% Multiple Races 7.0% 2.9% 2.3%
Age a
Under age 18 22.2% 33.9% 24.3%
18 to 30 22.3% 23.8% 18.2% 31 to 50 38.3% 21.9% 28.2% 51 to 61 14.4% 9.2% 13.9%
62 and older 2.8% 11.3% 15.4% Household Size b
1 person 64.1% 16.6% 13.0%
2 people 10.0% 18.4% 25.6% 3 people 10.2% 17.1% 18.9% 4 people 7.9% 18.5% 20.9%
5 or more people 7.9% 29.4% 21.6% Special Populations
Veteran (adults only) c 11.1% 5.2% 9.7%
Disabled (adults only) c 37.8% 26.2% 15.5% a Age is calculated based on a person’s first time in shelter during the one-year reporting period. b If a person is part of more than one household or the household size changed during the reporting period, the household size reflects the size of
the first household in which the person presented during the one-year reporting period. For all population types, past reports counted each person in a multi-adult or multi-child household as an individual household composed of one person. In this report, persons in these households are counted as one household composed of multiple people. For example, a household composed of two adults with no children is counted as one household with a household size equal to two, rather than two households with each household size equal to 1.
c Veteran and disability status are recorded only for adults in HMIS. The percentage calculations shown indicate the percent of homeless adults with this characteristic. Some records were missing information on disability status (10.5 percent) and veteran status (5.3 percent) in 2009. The percentage calculations are for those whose disability and veteran status was known.
Sources: Homeless Management Information System data, 2009; 2008 American Community Survey
Chapter 3: Sheltered Homeless People in 2009 23

24 Chapter 3: Sheltered Homeless People in 2009
African Americans. African Americans represent 38.7 percent of the sheltered homeless population, more than 3 times their share of the U.S. population and about 1.75 times their share of the poverty population. The overrepresentation of African Americans in the homeless population is related to urban concentrations of homelessness. According to 2008 data from the U.S. Census Bureau, about 46 percent of the African American population and 57.7 percent of the poor African American population lives in principal cities. By contrast, only 16 percent of the white non–Hispanic population and 35 percent of the white Hispanic population lives in these areas.15 Non-elderly. Only 2.8 percent of the sheltered homeless population is 62 years old or older, compared to 11.3 percent of the poverty population and 15.4 percent of the total U.S. population. The lower rate of elderly people among the shelter population is likely associated with two factors. First, an array of social safety-net programs in the United States for people aged 65 or older—including Supplemental Security Income (SSI), Social Security, Medicare, and public and other assisted housing for seniors—should help many vulnerable persons avoid shelter. Second, medical morbidity rates—or the incidence of a disease, mental health issues, or substance abuse disorders—are much higher among homeless people, especially chronically homeless persons.16 High medical morbidity rates, in turn, place homeless people at higher risk of mortality than their housed counterparts. Homeless people are 3 to 4 times more likely to die prematurely than the general population.17 Alone. Nearly two-thirds of the total sheltered population (64.1 percent) are in single-person households, nearly 4 times the proportion of such households in the poverty population and about 5 times the proportion in the national population.18 Since most homeless individuals are men, the reasons both single-person households and men are disproportionately represented in tsheltered homeless population are likely the same.
he
15 Steven Ruggles, J. Trent Alexander, Katie Genadek, Ronald Goeken, Matthew B. Schroeder, and Matthew
Sobek. Integrated Public Use Microdata Series: Version 5.0 [Machine-readable database]. Minneapolis: University of Minnesota, 2010.
16 Burt, Martha, Laudan Aron, Edgar Lee and Jesse Valente. 2001. Helping America’s Homeless. Urban Institute Press. Washington DC; Caton, Carol, Carol Wilkins, and Jacquelyn Anderson. 2007. “People Who Experience Long-Term Homelessness: Characteristics and Interventions.” Toward Understanding Homelessness: The 2007 National Symposium on Homelessness Research. U.S. Department of Health and Human Services and the U.S. Department of Housing and Urban Development. Washington DC.
17 O’Connell, James J. “Premature Mortality in Homeless Populations: A Review of the Literature,” National Health Care for the Homeless Council. December 2005.
18 Past reports counted each person in a multi-adult or multi-child household as an individual household composed of one person (i.e., a 1-person household). In this report, persons in these household compositions are counted as one household composed of multiple people. For example, a household composed of two adults with no children is counted as one household with a household size equal to two, rather than two households with household size equal to one each.

Chapter 3: Sheltered Homeless People in 2009 25
When compared to their counterparts nationwide, homeless people are much more likely to be adult males, African-Americans, non-elderly, alone, veterans, and disabled.
Veterans. Veterans are slightly more likely to be represented in the sheltered homeless population than the general population. Veterans represent about 11.1 percent of all sheltered adults, compared to 5.2 percent of the poverty population and 9.7 percent of the total U.S. adult population. Many veterans confront the same issues that lead others into homelessness, such lack of affordable housing and inadequate income and savings. But they also have barriers that can be particularly acute among service-men and -women returning from active duty, such as the lingering effects of post-traumatic stress disorder (PTSD) and substance abuse. These issues can make it difficult for veterans to find and maintain gainful employment, which in turn can make it difficult to pay for housing. Disabled. Nearly four in ten sheltered adults (37.8 percent) has a disability, compared to 26.2 percent of the poverty population and 15.5 percent of the total U.S. population.19 Thus, a homeless adult is nearly 2.5 times more likely to have a disability than an adult in the U.S. population. The higher disability rates among the homeless population are expected because a disability, particularly one relating to substance abuse or mental health, can make it difficult to work enough to afford housing. People with disabilities also have higher rates of housing discrimination and, therefore, may have difficulties finding suitable housing.20 Finally, as noted in the 2008 AHAR, the ability of SSI and SSDI to avert homelessness among persons with disabilities is uncertain. A disabled person whose only income in 2009 was a monthly SSI payment in 2009 was well under the poverty level for a single-person household. The average annual SSI payment is about 44 percent below the poverty level.21 Even so, only an
19 In the HMIS Data and Technical Standards (69 FR 45888, July 30, 2004), a disabling condition includes a
diagnosable substance abuse disorder, in order to match the definition found in the regulations implementing the McKinney-Vento Act’s Supportive Housing and Shelter Plus Care programs. However, the U.S. Census Bureau does not include substance abuse disorders as a form of disability, and thus the broader definition used by HUD is likely to result in larger estimates of homeless persons with disabilities compared to the U.S. poverty and general population.
20 Turner, Margery, Carla Herbig, Deborah Kaye, Julie Fenderson, and Diane Levy. 2005. Discrimination Against Persons with Disabilities. U.S. Department of Housing and Urban Development. Washington DC.
21 In 2009, the average monthly SSI payment was $504 (or about $6,048 annually) and the poverty level for a single-person household was $10,830. U.S. Social Security Administration Office of Retirement and Disability Policy. Monthly Statistical Snapshot, March 2009. Available at http://www.ssa.gov/policy/docs/quickfacts/stat_snapshot/. See also: U.S. Department of Health and Human Services. The 2009 HHS Poverty Guidelines. Washington, DC. Available at http://aspe.hhs.gov/poverty/09poverty.shtml.
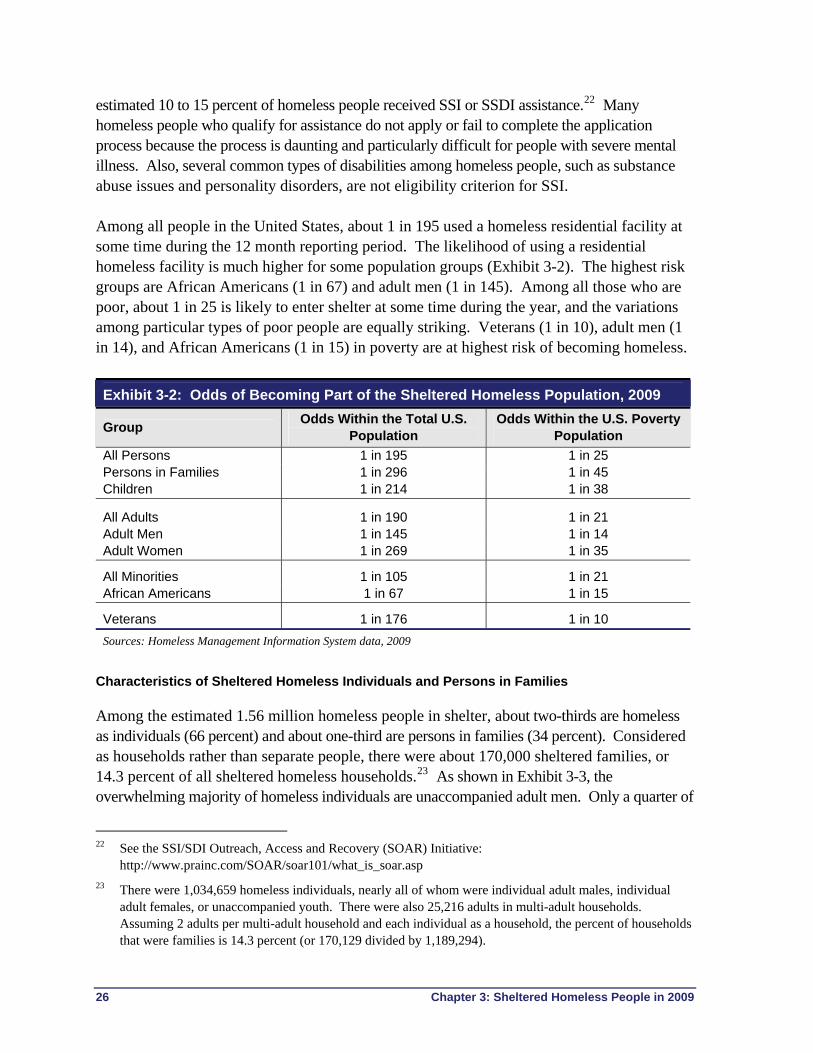
26 Chapter 3: Sheltered Homeless People in 2009
estimated 10 to 15 percent of homeless people received SSI or SSDI assistance.22 Many homeless people who qualify for assistance do not apply or fail to complete the application process because the process is daunting and particularly difficult for people with severe mental illness. Also, several common types of disabilities among homeless people, such as substance abuse issues and personality disorders, are not eligibility criterion for SSI. Among all people in the United States, about 1 in 195 used a homeless residential facility at some time during the 12 month reporting period. The likelihood of using a residential homeless facility is much higher for some population groups (Exhibit 3-2). The highest risk groups are African Americans (1 in 67) and adult men (1 in 145). Among all those who are poor, about 1 in 25 is likely to enter shelter at some time during the year, and the variations among particular types of poor people are equally striking. Veterans (1 in 10), adult men (1 in 14), and African Americans (1 in 15) in poverty are at highest risk of becoming homeless.
Exhibit 3-2: Odds of Becoming Part of the Sheltered Homeless Population, 2009
Group Odds Within the Total U.S.
Population Odds Within the U.S. Poverty
Population
All Persons 1 in 195 1 in 25 Persons in Families 1 in 296 1 in 45 Children 1 in 214 1 in 38
All Adults 1 in 190 1 in 21 Adult Men 1 in 145 1 in 14 Adult Women 1 in 269 1 in 35
All Minorities 1 in 105 1 in 21 African Americans 1 in 67 1 in 15
Veterans 1 in 176 1 in 10
Sources: Homeless Management Information System data, 2009
Characteristics of Sheltered Homeless Individuals and Persons in Families
Among the estimated 1.56 million homeless people in shelter, about two-thirds are homeless as individuals (66 percent) and about one-third are persons in families (34 percent). Considered as households rather than separate people, there were about 170,000 sheltered families, or 14.3 percent of all sheltered homeless households.23 As shown in Exhibit 3-3, the overwhelming majority of homeless individuals are unaccompanied adult men. Only a quarter of
22 See the SSI/SDI Outreach, Access and Recovery (SOAR) Initiative:
http://www.prainc.com/SOAR/soar101/what_is_soar.asp
23 There were 1,034,659 homeless individuals, nearly all of whom were individual adult males, individual adult females, or unaccompanied youth. There were also 25,216 adults in multi-adult households. Assuming 2 adults per multi-adult household and each individual as a household, the percent of households that were families is 14.3 percent (or 170,129 divided by 1,189,294).

Chapter 3: Sheltered Homeless People in 2009 27
are unaccompanied adult females. However, the profile of the individual homeless population varies from community to community, and the site visits conducted for this report provided an opportunity to explore some of this variation (see side bar on “Local Faces of Individual Homelessness”). As Exhibit 3-3 suggests, very few people are homeless only with other adults or are people under age 18 without accompanying adults.24 Together, these groups represent only 4 percent of all sheltered homeless individuals. About three fifths of homeless people in families are children under age 18 (61 percent); the rest are adults (39 percent).
The portrait of homelessness differs significantly by household type—that is, people who are homeless by themselves are very different than those who are homeless as part of a family. In 2009, sheltered homeless individuals and persons in families looked different along several key characteristics (see Exhibit 3-4 for more details).
24 The percentage of unaccompanied youth in the shelter system may be higher if facilities that specifically
target homeless youth—such as Runaway and Homeless Youth programs funded by the U.S. Department of Health and Human Services—are disproportionately not participating in HMIS. Bed inventory information reported by CoCs for 2009 suggests that 62.3 percent of all beds targeted to homeless youth currently participate in HMIS, compared to 74.5 percent of all beds in the national inventory. Thus, it is possible that the one-year estimates slightly undercount the total number of homeles youth in shelters.
Sheltered Persons in Families
39%
61%
Adults in households with children
Children in households with adults
Sheltered Individuals
71%
25%
2% 2%
Single adult male households
Single adult female households
Unaccompanied youth and several-children households
Several-adult households
Exhibit 3-3: Household Composition of Sheltered Individuals and Persons in Families, 2009

Characteristic Sheltered Individuals Sheltered Persons in Families
Gender of Adults Overwhelmingly male Overwhelmingly female adults
Race Nearly as likely to be a non-minority Almost half are African-Americans
Age Three-quarters are over 30 More than four-fifths are under 31
Veterans More than 1 in 10 are veterans Very unlikely to be a veteran
Disabled More than 4 in 10 are disabled Low rates of disability
Gender of Adults. Most sheltered homeless individuals are men. In 2009, 71 percent of all sheltered individuals were adult men and only 25 percent were adult women staying alone. Assuming that most homeless persons are poor before using a shelter, the high rate of men among individuals suggests that for every 14 men living by themselves with incomes below the poverty line, 1 is likely to access a homeless shelter at some time during the year. Only 1 of every 35 women living alone in poverty access the homeless shelter system By comparison, adults who become homeless together with children are usually, but not always, women. In 2009, 79.6 percent of adults in families with children were women. Women in families with incomes below the poverty line are 2 times more likely to use a shelter than their male counterparts. Race. Even though the majority of all sheltered people are minorities, almost half of all individuals (45.4 percent) are white and not Hispanic. By contrast, less than one-quarter of persons in families are non-Hispanic and white (23.6 percent) and nearly half are African American (47.9 percent). Thus, people of different racial and ethnic groups may experience homelessness differently—non-minorities more often as single persons and minorities more often with accompanying children.
The profile of homeless individuals and persons in families differs considerably, especially in terms of gender, race, age, and veteran and disability status.
Age. Half of all homeless individuals in shelter are 31-50 years old and three-quarters are over age 30. Sheltered families are much younger. Three-fifths of all persons in families are children (under age 18), and more than half (55.2 percent) of the adults in families are between age 18 and 30. Homeless children in shelters are also fairly young. More than half (52.6 percent) are under age 6; 32.5 percent are age 6 to 12, and 14.8 percent are age 13 to17. Veteran Status. A much larger proportion of adult individuals are veterans compared to adults in families. An estimated 13.0 percent of adult individuals are veterans compared to 2.1 percent of adults in families. The higher rate of veterans among individuals is expected because the overwhelming majority of sheltered individuals are men and men are more likely to be in the military. Disability. More than 4 in 10 individual homeless adults (42.9 percent) have disabilities, compared to 14 percent of adults in families. The significantly higher prevalence of disabilities among homeless individuals is likely explained by the disproportionate presence of older people and men in individual homeless households. Many epidemiologic survey studies have shown
28 Chapter 3: Sheltered Homeless People in 2009

Chapter 3: Sheltered Homeless People in 2009 29
that rates of drug and alcohol disorders are consistently higher among men than among women. For example, the National Epidemiologic Survey on Alcohol and Related Conditions (NESARC) surveyed more than 40,000 adults and found that men are twice as likely as women to abuse drugs and three times more likely to abuse alcohol.25
25 Conway KP, Compton W, Stinson FS, Grant BF. “Lifetime comorbidity of DSM-IV mood and anxiety
disorders and specific drug use disorders: results from the National Epidemiologic Survey on Alcohol and Related Conditions.” J Clin Psychiatry. 2006;67: 247-257.
Local “Faces” of Individual Homelessness City of Detroit. The typical homeless individual in Detroit is similar to the national average: he is an African-American man between the ages of 31 and 50. However, providers in Detroit also described other types of individuals in need of housing. Senior citizens, for example, comprise an increasing share of Detroit’s homeless population. As described further in Chapter 4, some of these seniors have been homeless for much of their adult lives, while others only became homeless after retirement. Detroit providers also report that the city has a large population of homeless teens (aged 17 to 20) who have trouble leasing housing on their own, struggle in doubled-up situations, and are turned away from shelters that cannot accommodate teenage boys. Seaside and Monterey Counties. In Seaside and Monterey Counties, on the central Californian coast, homeless individuals are more likely to be white and female. They are also somewhat more likely to be young, between the ages of 18 and 30. But providers also report that the number of older single women accessing homeless services is on the rise. Most of these women are single following a divorce or as a result of domestic violence, and many have recently lost their jobs. Some became homeless after their apartment building went into foreclosure. Locally, there are few services dedicated to serving senior homeless women, and providers that typically serve individuals struggle to accommodate their needs. Phoenix and Maricopa County. Phoenix and Maricopa County (Arizona) also have a relatively large proportion of single homeless women. Providers suggest that they have seen a significant increase in single adult homelessness and that this trend is likely to continue into the next year. They report that single women are more likely than women in families to have severe mental disabilities and a history of drug addiction. They also suggest that single women are hard to engage in housing and servicers when transitional housing and permanent supportive housing programs require treatment compliance. Idaho Balance of State. In contrast to the national average, the individual homeless population in the Idaho Balance of State Continuum of Care is predominantly white and mostly between the ages of 18 and 30. The majority of homeless individuals are men, but women make up about one-third of the emergency shelter population and about one-fifth of the transitional housing population.

Exhibit 3-4: Demographic Characteristics of Sheltered Homeless Persons by Household Type, 2009
Characteristic
Percentage of All Sheltered Homeless
Population Percentage
of Individuals Percentage of
Persons in Families Gender of Adults
Male 63.7% 72.7% 20.4%
Female 36.3% 27.3% 79.6% Ethnicity
Non-Hispanic/non-Latino 80.5% 83.9% 74.2%
Hispanic/Latino 19.5% 16.1% 25.8% Race
White, Non-Hispanic 38.1% 45.4% 23.6%
White, Hispanic 11.6% 10.4% 13.9%
Black or African-American 38.7% 34.1% 47.9%
Other Single Race 4.7% 3.8% 6.2%
Multiple Races 7.0% 6.4% 8.5% Age a
Under age 18 22.2% 2.2% 60.6%
18 to 30 22.3% 22.6% 21.8%
31 to 50 38.3% 49.7% 16.4%
51to 61 14.4% 21.3% 1.1%
62 and older 2.8% 4.2% 0.1% Household Size b
1 person 64.1% 97.2% 0.0%
2 people 10.0% 2.5% 24.4%
3 people 10.2% 0.2% 29.4%
4 people 7.9% 0.1% 23.0%
5 or more people 7.9% 0.0% 23.1% Special Populations
Veteran (adults only) c 11.1% 13.0% 2.1%
Disabled (adults only) c 37.8% 42.9% 14.0% a Age is calculated based on a person’s first time in shelter during the one-year reporting period. b If a person is part a household consisting of more than one person or the household size changed during the reporting period, the household
size reflects the size of the first household in which the person presented during the one-year reporting period. c Veteran and disability status are recorded only for adults in the HMIS. The percentage calculations are for homeless adults with this characteristic.
Some records were missing information on disability status (10.5 percent) and veteran status (5.3 percent) in 2009. The percentage calculations include only persons whose disability or veteran status was known.
Source: Homeless Management Information System data, 2008
30 Chapter 3: Sheltered Homeless People in 2009

Chapter 3: Sheltered Homeless People in 2009 31
In addition to these characteristics, sheltered families are also larger than individual households, as expected. A typical homeless family consists of a mother and two children (the average number of children per family is 1.9). As demonstrated in Exhibit 3-5, homeless families have smaller household sizes than both the poverty population and the total U.S. population. Fewer than one-quarter of sheltered families (23.1 percent) have large families (5 or more people), compared with about 4 in 10 families in poverty. The household sizes among homeless families suggest that some homeless families could be appropriately housed in a two-bedroom apartment or house.26
Exhibit 3-5: Household Sizes of Sheltered Homeless Families and Poor Families 2008
Household Size Percentage of
Sheltered Homeless Families
Percentage of Poor Families
Percentage of All Families in the U.S.
2 people 24.4% 7.6% 4.2% 3 people 29.4% 20.4% 22.2% 4 people 23.0% 26.4% 34.3% 5 or more people 23.1% 45.5% 39.3%
Sources: Homeless Management Information System data, 2009
3.2 Location of Homeless Service Use, 2009
Geographic Location of Sheltered Homeless Persons
Sheltered homelessness is concentrated in urban areas (see Exhibit 3-6). About 68.2 percent of all sheltered homeless people are located in principal cities, and less than one-third (31.8 percent) are in suburban or rural jurisdictions. Homeless individuals are particularly likely to be in urban areas. Nearly three-quarters of all sheltered individuals (72.2 percent) accessed a homeless residential program that is located in a principal city, compared with 61.2 percent of persons in families. The geographic distribution of sheltered homelessness is markedly different than the distribution of the nation’s poverty and total populations. The share of sheltered homeless people in principal cities is nearly twice the share of the poverty population in these areas (68.2 versus 35.6 percent) and almost three times the share of the entire U.S. population (68.2 percent versus 24.3 percent). About 1 in every 92 persons living in a principal city in the United States was homeless in emergency shelter or transitional housing, compared with about 1 in every 415 persons living in a suburban or rural area.
26 Homeless families may have additional children who are not with them in a residential program for homeless
people because they have been left with relatives or friends or experienced out-of-home placements by the child welfare system.

32 Chapter 3: Sheltered Homeless People in 2009
As noted in previous reports, the concentration of homeless people in urban areas is related to several issues:
Principal cities have high rates of unemployment and lack of affordable housing, which are risk factors for homelessness.
The social service system in large cities may be saturated or experiencing large funding reductions, which may limit the ability of these systems to adequately serve persons at risk of becoming homeless.
The majority of homeless residential services are located in principal cities—approximately 51.6 percent of all programs and 65.4 percent of beds for homeless persons are located in these areas.27 The location of homeless residential services in principal cities may produce a “magnet effect,” attracting homeless people to the area because services are more accessible than elsewhere. While plausible, this interpretation is complicated by the difficulty in establishing cause-and-effect: do homeless people move to service-rich areas or are homeless service providers purposively located where the demand for services is greatest? Future analysis in the AHAR will explore ways to disentangle these issues.
27 This includes 2,853 emergency shelters (150,965 beds), 3,961 transitional housing facilities (124,804 beds),
and 87 Safe Havens (1,448 beds).
68.2% 72.2%61.2%
35.6%24.3%
31.8% 27.8%38.8%
64.4%75.7%
0%
10%
20%
30%
40%
50%
60%
70%
80%
90%
100%
Percentage of AllSheltered Persons
Percentage of AllSheltered Individuals
Percentage of AllSheltered Persons in
Families
U.S. PovertyPopulation
Total U.S. Population
Principal Cities Suburban and Rural Areas
Exhibit 3-5: Geographic Distribution of the Sheltered Homeless PopuHousehold Type, 2009
lation by
Sources: Homeless Management Information System data, 2009
Exhibit 3-6: Geographic Distribution of the Sheltered Homeless Pby Household Type, 2009
opulation

Movement into the Shelter System
Communities participating in the AHAR provided information on where people stayed the night before they entered an emergency shelter or transitional living facility. The information is associated with each person’s first program entry during the 12-month reporting period. Thus, this information is intended to suggest how people flow into the homeless residential system, rather than how people churn through the system. In 2009, the night before entering shelter, almost two-fifths of all sheltered persons (38.5 percent) came from another homeless situation. Among those who were already homeless, more than one-half came from an emergency shelter (54.9 percent), nearly two-thirds came from an unsheltered situation (38.6 percent), and a few came from transitional housing (6.6 percent). Another two-fifths of all sheltered persons (41.1 percent) moved from a housed situation (their own or someone else’s home), and the remaining one-fifth were split between institutional settings (e.g., a substance abuse facility or jail) and hotels, motels, or other unspecified living arrangements (see Exhibit 3-7). The most common prior living arrangement among all sheltered people was with friends or family (29.5 percent) and staying in another homeless residential service facility (23.7 percent).
Exhibit 3-7: Previous Living Situation of People Using Homeless Residential Services, 2009 a
Living Arrangement the Night before Program Entry Total
Percentage of Individual Adults b
Percentage of Adults in Families
Total Already Homeless 38.5% 41.1% 26.0% Place not meant for human habitation 14.8% 17.1% 4.0% Emergency shelter or transitional housing 23.7% 24.0% 22.0%
Total from “Housing” 41.1% 36.6% 62.6% Rented or owned housing unit c 11.5% 9.8% 19.7% Staying with family 17.3% 14.8% 29.4%
Staying with friends 12.2% 12.0% 13.5%
Total from Institutional Settings 12.5% 14.5% 2.7% Psychiatric facility, substance abuse center, or hospital 7.2% 8.3% 2.1% Jail, prison, or juvenile detention 4.8% 5.8% 0.4% Foster care home 0.4% 0.5% 0.1%
Total from Other Situations 8.1% 7.9% 8.7% Hotel, motel (no voucher) or “other” 8.1% 7.9% 8.7%
Number of Homeless Adults 1,235,236 1,034,659 210,510 a The exhibit reports on adults and unaccompanied youth only because the HMIS Data and Technical Standards require
the information to be collected only from these persons. About 11 percent of the records in HMIS were missing this information in 2009.
b This category includes unaccompanied adults and youth as well as multiple-adult households without children. c Includes a small percentage in permanent supportive housing.
Sources: Homeless Management Information System data, 2009
Chapter 3: Sheltered Homeless People in 2009 33

The most common pathway into the
shelter system for homeless
individuals was another homeless location, whereas among persons in
families it was from a housed
situation.
A comparison of living arrangements between sheltered individuals and persons in families reveals several striking differences. More than 6 in 10 persons in families (62.6 percent) came from a housed situation, including almost one-third (29.4 percent) who were staying with family and one-fifth who came from a rented or owned housing unit (19.7 percent) prior to entering the shelter system. Slightly over one-quarter of persons in families were already homeless prior to entering the shelter system during the one-year reporting period (26 percent). A very small proportion of persons in families were in institutional settings (2.7 percent). By comparison, homeless individuals were much more likely than family members to be already homeless and come from institutional settings. Fewer than 4 in 10 individuals came from a housed situation (36.6 percent), and more than 1 in 10 were in a medical or correctional facility (14.5 percent) just prior to entering the shelter system. Thus, for individuals, the most common pathway into the shelter system during the one-year reporting period was another homeless location, whereas among persons in families it was from their own housing or someone else’s. Focusing on people who were not homeless prior to entering shelter, less than one-fifth came from their own housing unit (18.7 percent) nearly one-half were staying with family or friends (48.0 percent), about one-fifth were previously in an institutional setting (19.6 percent), and the rest were in other locations (13.7 percent). Thus, for people who were not already homeless, more than two thirds were “housed” in their own unit or someone else’s, and the single most common pathway into the shelter system was staying with family or friends. But here, again, the pathway into homelessness for those who were not previously homeless varies dramatically by household type. Less than one-half of individuals had been staying with family or friends (45.4 percent), compared with 58.0 percent of adults in families. Only 16.7 percent of individuals had been in their own housing unit, compared with 26.6 percent of families. Many more individuals than families came from institutional settings, 24.6 percent vs. 3.6 percent. About 85 percent of adults in families who were not previously homeless were staying with family and friends or living in their own place just prior to entering the shelter system. This finding is especially useful to local programs that are designing targeted approaches to preventing homelessness among families. The finding suggests that homelessness prevention programs may be particularly successful at staving off homelessness among families with services that help families retain their existing housing, such as emergency rental assistance or family mediation services.
34 Chapter 3: Sheltered Homeless People in 2009

Chapter 3: Sheltered Homeless People in 2009 35
3.3 Patterns of Homeless Service Use, 2009
Emergency Shelters or Transitional Housing
A long-standing assumption about how homeless people use a community-wide, homeless residential service system is that people flow linearly through the shelter system—entering first into an emergency shelter, moving on to transitional housing, and then eventually finding a permanent (or permanent supportive) housing arrangement. The 2009 estimates further support previous findings that few sheltered homeless persons follow a linear progression through the shelter system during a 12-month period. As shown in Exhibit 3-8, very few sheltered persons use multiple program types. In 2009, more than three-quarters of the estimated 1.56 million homeless people in shelter used an emergency shelter only (77.4 percent), less than one-fifth used a transitional housing program only (18.3 percent), and a small proportion of people used both types of homeless residential facilities (4.3 percent). These estimates do not describe the potential “churning” that may exist within the homeless residential system—that is, people who repeatedly cycling in and out of emergency shelters or transitional housing during the one-year reporting period. Nonetheless, the estimates reinforce findings from previous studies that concluded, similarly, that few homeless persons use the shelter system sequentially and some use the system in unpredictable ways (e.g., starting in transitional housing and then entering an emergency shelter).28 Others find ways to resolve their homeless episode fairly quickly and, as a result, do not use transitional housing.29
28 Spellman, Khadduri, Sokol, and Leopold, Costs Associated with First-Time Homelessness for Families and
Individuals, op. cit.
29 Culhane, D.P., S. Metraux, J.M. Park, M.A. Schretzmen, and J. Valente. 2007. Testing a Typology of Family Homelessness Based on Public Shelter Utilization in Four U.S. Jurisdictions: Implications for Policy and Program Planning. Housing Policy Debate, 18(1): 1-28. Kuhn, R., and D.P. Culhane. 1998. Applying Cluster Analysis to Test of a Typology of Homelessness: Results from the Analysis of Adminstrative Data. American Journal of Commnity Psychology, 17(1): 23-43.
Source: Homeless Management Information System data, 2009
Exhibit 3-8: Type of Program Used Among All Sheltered Homeless People, 2009
Emergency Shelters Only
77.4%
4.3% Both Emergency
Shelters and Transitional Housing
18.3% Transitional
Housing Only
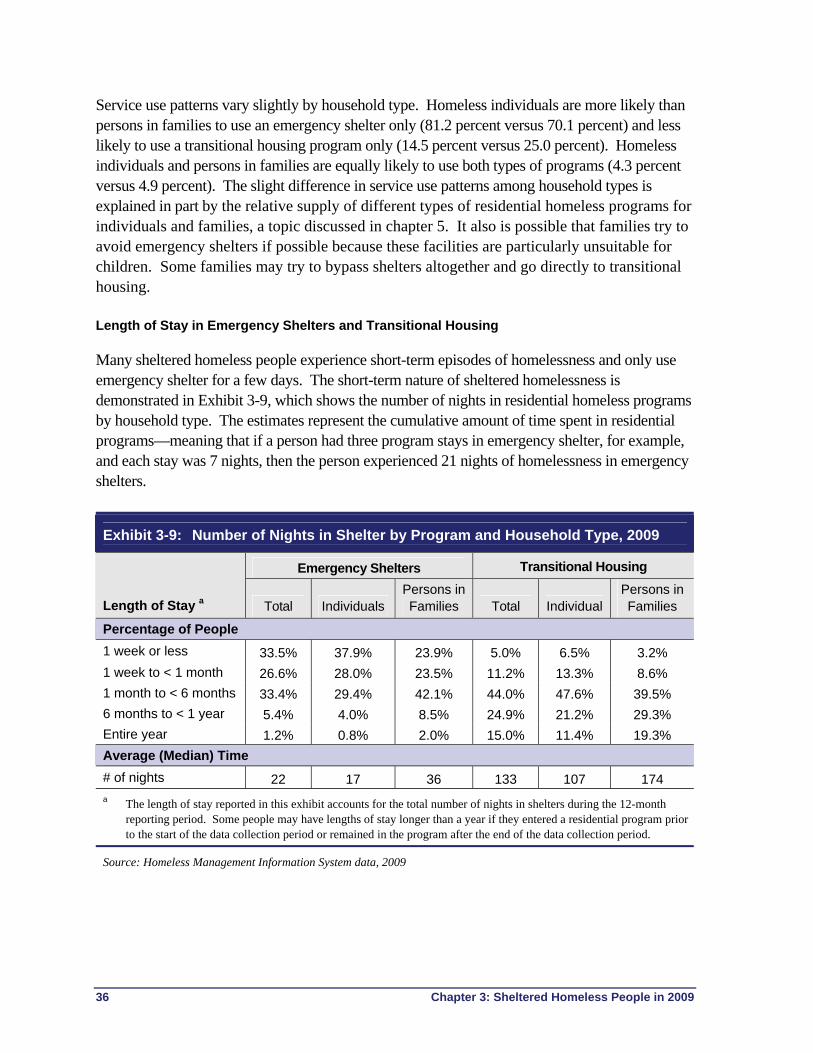
Service use patterns vary slightly by household type. Homeless individuals are more likely than persons in families to use an emergency shelter only (81.2 percent versus 70.1 percent) and less likely to use a transitional housing program only (14.5 percent versus 25.0 percent). Homeless individuals and persons in families are equally likely to use both types of programs (4.3 percent versus 4.9 percent). The slight difference in service use patterns among household types is explained in part by the relative supply of different types of residential homeless programs for individuals and families, a topic discussed in chapter 5. It also is possible that families try to avoid emergency shelters if possible because these facilities are particularly unsuitable for children. Some families may try to bypass shelters altogether and go directly to transitional housing. Length of Stay in Emergency Shelters and Transitional Housing
Many sheltered homeless people experience short-term episodes of homelessness and only use emergency shelter for a few days. The short-term nature of sheltered homelessness is demonstrated in Exhibit 3-9, which shows the number of nights in residential homeless programs by household type. The estimates represent the cumulative amount of time spent in residential programs—meaning that if a person had three program stays in emergency shelter, for example, and each stay was 7 nights, then the person experienced 21 nights of homelessness in emergency shelters.
Exhibit 3-9: Number of Nights in Shelter by Program and Household Type, 2009
Emergency Shelters Transitional Housing
Length of Stay a Total Individuals Persons in Families Total Individual
Persons in Families
Percentage of People
1 week or less 33.5% 37.9% 23.9% 5.0% 6.5% 3.2%
1 week to < 1 month 26.6% 28.0% 23.5% 11.2% 13.3% 8.6%
1 month to < 6 months 33.4% 29.4% 42.1% 44.0% 47.6% 39.5%
6 months to < 1 year 5.4% 4.0% 8.5% 24.9% 21.2% 29.3%
Entire year 1.2% 0.8% 2.0% 15.0% 11.4% 19.3%
Average (Median) Time
# of nights 22 17 36 133 107 174 a The length of stay reported in this exhibit accounts for the total number of nights in shelters during the 12-month
reporting period. Some people may have lengths of stay longer than a year if they entered a residential program prior to the start of the data collection period or remained in the program after the end of the data collection period.
Source: Homeless Management Information System data, 2009
36 Chapter 3: Sheltered Homeless People in 2009

During the one-year reporting period, one-third of all people in emergency shelters (33.5 percent) stayed for less than 1 week, and three-fifths (60.1 percent) stayed less than a month. Very few people stayed 6 months or more (6.6 percent). Individuals in emergency shelters stayed the shortest amount of time—nearly 4 in 10 stayed less than 1 week (37.9 percent),and almost two-thirds stayed less than one month (65.9 percent). The median length of stay for individuals in emergency shelters was 17 days. By comparison, families in emergency shelters stayed longer—about one-quarter stayed 1 week or less (23.9 percent) and less than half stayed less than one month (47.4 percent). Twice as many persons in families than individuals stayed for 6 months or more, and the median length of stay among family members was 36 days. As described in previous reports, the longer lengths of stay among families is expected because unsheltered homelessness can be particularly dangerous for families with children, and families may have a more difficult time finding affordable and appropriately-sized housing. (As shown in Exhibit 3-5, about 4 in 10 sheltered persons in families have 4 or more household members.) People in transitional housing programs generally stay for much longer periods of time, which is expected because these programs are designed to serve clients for up to two years while helping them transition to permanent housing. In 2009, the average (median) length of stay in transitional housing was 133 nights (or about four and one-half months), and about 40 percent of all persons stayed in transitional housing for 6 months or more (39.9 percent). A considerable proportion of people stayed for the full 12-month reporting period (15.0 percent). Here again, persons in families stay longer than individuals. The median number of days among persons in families was 174 compared to 107 for individuals, and nearly 1 in 5 persons in families stayed for 12 months (19.3 percent) compared to about 1 in 10 individuals (11.4 percent).
“Heavy Users” of Emergency Shelters
Communities participating in the 2009 AHAR were asked to report the number and the characteristics of “heavy users” of the homeless services system, or people who stayed in emergency shelters for six months or longer during the one-year reporting period. These heavy users represent only 6.5 percent of all persons who used emergency shelters in 2009 (or about 83,000 people out of the 1.27 million shelter users). Heavy users are nearly as likely to be individuals as persons in families.
As shown in Exhibit 3-10, heavy users of emergency shelters look very different from those who use shelters less intensely. Heavy users are much more likely to be minorities (Hispanics and African Americans). They also are more likely to be in families—that is, to have children under age 18 and to have larger families than all people in emergency shelters.
Chapter 3: Sheltered Homeless People in 2009 37

Exhibit 3-10: Demographic Characteristics Associated with Staying in Emergency Shelters More than Six Months, 2009
Long-Term Stayers in Emergency Shelters in 2009
Race All Persons in Emergency
Shelters in 2009 Total a Individuals Persons in Families
Hispanic/Latino Ethnicity 19.8% 31.2% 17.4% 44.9%
Black or African American 38.6% 56.0% 45.2% 68.8%
Children under Age 18 20.2% 30.5% 1.2% 59.4%
Household with 5 or more People 7.4% 13.3% 0.0% 26.6%
Number of People 1,274,301 82,978 41,835 42,140
a The number of long-terms stayers who were individuals and persons in families will not sum to the total number of long-term stayers because a small proportion of persons (about 1 percent) were served as both individuals and as persons in families during the 12-month reporting period.
Source: Homeless Management Information System data, 2009
3.4 Summary of All Sheltered Homeless People in 2009
The estimates of the sheltered homeless population in 2009 indicate that:
A typical sheltered homeless person—whether an individual or a member of a family—is a middle-aged, adult male who is a member of a minority group and is homeless by himself. Chances are that he does not have any type of disability.
When compared to their counterparts nationwide, sheltered homeless people are much more likely to be adult males, African-Americans, non-elderly, alone, veterans, and disabled.
Homeless sheltered individuals most often are male, over age 30, disabled, and experiencing homelessness alone. By contrast, family households in the shelter system are very likely to be headed by a minority woman without a male partner, under age 30, and in a household with 2 or 3 members.
About 68.2 percent of all sheltered homeless people are located in principal cities, and less than one-third (31.8 percent) are located in suburban or rural jurisdictions.
About 1 in every 92 persons living in principal cities in the United States was homeless, compared with about 1 in every 415 persons living in suburban or rural areas.
The share of sheltered homeless people in principal cities is nearly twice the share of the poverty population in these areas (68.2 versus 35.6 percent) and almost three times the share of the entire U.S. population (68.2 percent versus 24.3 percent).
38 Chapter 3: Sheltered Homeless People in 2009
In 2009, the night before entering shelter, almost two-fifths of all sheltered persons came from another homeless situation, another two-fifths moved from a housed situation (their own or someone else’s home), and the remaining one-fifth were split between institutional settings and hotels, motels, or other unspecified living arrangements.
The most common pathway into the shelter system for homeless individuals was another homeless location, whereas among persons in families it was from a housed situation.
During the one-year reporting period, one-third of all people in emergency shelters stayed for less than 1 week, and three-fifths stayed less than a month. About 40 percent of all persons in transitional housing stayed for 6 months or more.
Heavy users of emergency shelters look very different than those who use shelters less intensely. Heavy users are much more likely to be minorities (specifically Hispanics and African Americans), have children under age 18, and have larger families than all people in emergency shelters.
Chapter 3: Sheltered Homeless People in 2009 39

40 Chapter 3: Sheltered Homeless People in 2009

Chapter 4 Trends in Sheltered Homelessness between 2007 and 2009
The 2008 AHAR was the first to describe year to year changes in the sheltered homeless population. Now, in this 2009 AHAR, we can look across three years of HMIS data and present both changes that occurred between the most recent two years, 2008 and 2009, and changes across the three year period from 2007 through 2009.
The chapter focuses on three types of changes:
Changes in the sheltered homeless population between 2007 and 2009, including the number of people, the types of locations in which they are homeless, and their demographic characteristics.
Changes in the patterns of becoming homeless, based on information about where people were the night before they became homeless and how long they had been there.
Changes in how people use the homeless services system and, specifically, whether they use emergency shelter or transitional housing and how long they stay in residential programs for homeless persons during a 12-month period.
The HMIS-based estimates discussed in this chapter are considerably more robust than those based on PIT data. Unlike PIT data, HMIS data are not influenced heavily by unexpected events that may occur on the night of the point-in-time count, such as a winter storm, or by variations in enumeration strategies. HMIS is now a widely used tool, and communities are increasingly capable of collecting and reporting reliable HMIS data to the AHAR. As a result, the precision of the HMIS-based estimates has continued to improve with each successive report. More importantly, the HMIS-based estimates presented in this chapter begin to show a few consistent patterns that we believe are real, despite the fact that some communities were unable to provide complete data and thus the estimates have wide confidence intervals (Exhibit 4-1).
4.1 Changes in the Sheltered Homeless Population between 2007 and 2009
Overall sheltered homelessness declined slightly between 2008 and 2009, by about 35,000 people or 2 percent of the number of sheltered homeless people in 2008 (Exhibit 4-1). Individual sheltered homelessness dropped by almost 58,000 people or 5 percent, while sheltered homeless persons in families increased by almost 19,000 people or 3.6 percent.
Chapter 4: Trends in Sheltered Homelessness between 2007 and 2009 41

When families are considered as households rather than as the separate people in the households, the increase was almost 11,000 families between 2009 and 2008, a 7 percent increase over the 159,142 sheltered homeless families in 2008.
Exhibit 4-1: Changes in Total Sheltered Homeless Individuals and Persons in Families, 2008-2009
2008 2009
Household Type Total Number Total Number
Change 2008-2009
Percent change 2008-
2009 Total Number of Sheltered Persons a
1,593,794 c 1,558,917 c -34,877 -2.2%
Individuals b 1,092,612 d 1,034,659 d -57,953 -5.3%
Persons in Families 516,724 d 535,477 d +18,723 +3.6%
Number of Sheltered Households with Children
159,142 170,129 +10,987 +6.9%
a These estimated totals reflect the number of homeless persons in the 50 states and the District of Columbia who used emergency shelters or transitional housing programs during the one-year period of October 1 through September 30 of the following year. The estimates do not cover the U.S. Territories and Puerto Rico and do not include persons served by “victim service providers.” The estimated totals include an extrapolation adjustment to account for people who use emergency shelters and transitional housing programs but whose jurisdictions do not yet participate in their HMIS. People who are homeless but do not use an emergency shelter or transitional housing program during the 12-month period are not included. Percentages may not sum to 100 percent due to rounding.
b This category includes unaccompanied adults, unaccompanied people under 18 years, and multi-adult households without children.
c In 2009, the 95 percent confidence interval for the estimated number of sheltered homeless persons in the population was 1,230,198 to 1,887,636 persons (or +/- 328,719 persons). In 2008, the 95 percent confidence interval was 1,180,758 to 2,006,830 (or +/- 413,036 persons).
d In both 2008 and 2009, approximately 1 percent of homeless persons were served both as an individual and as a person in a family. In this exhibit, such people appear in both categories, so the total number of sheltered persons is slightly less than the sum of individuals and families.
Source: Homeless Management Information System data, 2007-2009
The overall number of sheltered homeless people had increased slightly between 2007 and 2008 before dropping slightly in 2009, as shown in Exhibit 4-2. The drop in sheltered homelessness among individuals was 80,000 people or about 7 percent across the three-year period from 2007 through 2009. The decline in the numbers of people in emergency shelters or transitional housing as individuals probably reflects community success in getting people out of shelters and into permanent supportive or other housing and also perhaps placing them into permanent housing directly from the street. Indeed, as shown in chapter 5, the inventory of beds in permanent supportive housing programs has increased dramatically, from about 177,000 to 219,000 beds.
42 Chapter 4: Trends in Sheltered Homelessness between 2007 and 2009

Chapter 4: Trends in Sheltered Homelessness between 2007 and 2009 43
In contrast, in 2009, almost 62,000 more family members were in emergency shelter or transitional housing at some point during the year than had been in 2007. Considered as households rather than as separate people, the growth in sheltered family homelessness over the three years was almost 40,000 families or a 30 percent increase. The continued growth in sheltered family homelessness almost certainly reflects the ongoing effect of the recession. Somewhat surprisingly, the increase in sheltered homeless families was more pronounced between 2007 and 2008 than between 2008 and 2009, even though the 2008 reporting period (October 2007 through September 2008) was fairly early in the recession, and unemployment rates remained high during the 2009 reporting period (October 2008 through September 2009).30 It may be that some families who were already at risk of becoming homeless and lacked sufficient support networks to ease the impact of the recession became homeless almost immediately. But a much larger group of families turned to family and friends to stave off the effects of the recession. Indeed, a recent study found that the recession has caused a dramatic increase, almost five-fold, in the rates of overcrowding, indicating that 30 According to the Department of Labor’s Bureau of Labor Statistics, the seasonally adjusted unemployment
rate increased from 6.6 percent to 9.8 percent between October 2008 and September 2009. By December 2009 (after the study period for this report), it had increased to 10.0 percent. See Bureau of Labor Statistics, U.S. Department of Labor, Databases, "Tables & Calculators by Subject: Unemployment," http://www.bls.gov/data/#unemployment (accessed May 11, 2010).
1,593,7941,588,595 1,558,917
1,115,054 1,092,6121,034,659
473,541516,724 535,447
130,968 159,142 170,129
0
200,000
400,000
600,000
800,000
1,000,000
1,200,000
1,400,000
1,600,000
1,800,000
2007 2008 2009
Source: Homeless Management Information System data, 2007-2009
Exhibit 4-2: Trends in Homelessness by Household Type, 2007-2009
All Sheltered Persons
Individuals
Households with Children
Persons in Families

44 Chapter 4: Trends in Sheltered Homelessness between 2007 and 2009
may families are doubling up in response to the economic downturn.31 Thus, the fortunes of many struggling families may still be in the balance. For some of these families, the fragile economic circumstances of the relatives and friends of struggling parents may mean that, as soon as job losses begin in an economic downturn, support networks for families at risk of homelessness fall apart. Doubled up housing situations cannot be sustained, cash is no longer available to help others with rent payments, and families turn to homeless shelters as the only way of keeping a roof over their heads. Then, as the recession continues, the flow of fragile families into homelessness remains at a high level but does not increase. Alternatively, as the nation comes out of the recession and as the stimulus funding made available through the Homelessness Prevention and Re-housing Program (HPRP) begins to serve families, some of these at-risk families may avoid shelter altogether. (HPRP funding only started to become available in October 2009, the month after the 2009 AHAR reporting period ended). It is also possible that some of these families may find a way to regain their financial footing on their own and become self sufficient. As a result of the slight drop in homelessness among individuals and the increase among families, family members represent a larger percentage of sheltered homeless people each year, rising from 29.8 percent in 2007 to 34.1 percent in 2009, as shown on Exhibit 4-3. Changes in the Geography of Homelessness
The types of locations in which homeless people were found in emergency shelters or transitional
31 Painter, Gary. 2010. “What Happened to Household Formation in a Recession?” Research Institute for
Housing America and the Mortgage Bankers Association.
70.2% 67.9% 65.9%
29.8% 32.1% 34.1%
0%
10%
20%
30%
40%
50%
60%
70%
80%
90%
100%
2007 2008 2009
Individuals Persons in Families
Source: Homeless Management Information System data, 2007-2009
Exhibit 4-3: Change in the Household Composition of Homelessness, 2007-2009
Impact of the Economic Downturn on Family Homelessness From rural Iowa to New York City, providers report increases in family homelessness they attribute to the recession. In San Francisco, for example, the waiting list for family shelter increased 30 percent between 2008 and 2009. In eight of the nine continuums visited for this report, providers noted a significant jump in the number of families in shelters or transitional housing who are homeless for the first time, mostly as a result of unemployment. In Phoenix, nearly half (47.9 percent) of families entering shelter in 2009 had not been homeless before, and in New York City, the rate of first-time homelessness among families is about 30 percent. The Idaho Balance of State CoC has not yet seen a major increase in the number of homeless families, but providers expect this might be coming. Several Idaho providers noted an increase in the number of families accessing homeless services for the first-time and in the number of formerly “middle class” families seeking assistance. Memphis providers comment that families are increasingly being admitted to shelter with high debts, coming from expenses incurred while the family had employment. Five of the communities reported longer stays by families in shelters as it takes longer to find employment that would allow them to secure permanent housing. For example, one transitional housing provider in Marshalltown, Iowa, reported that prior to 2008, her facility served about two families per year, and these families would stay between two and four weeks. Since 2008, the facility has served 9 to 12 families per year, with an average length of stay of approximately four months. Lack of employment opportunities and affordable housing are among the most common reasons cited by local providers for the rise in family homelessness. Although the typical homeless family is composed of a mother with children, providers in Iowa, Monterrey, and Phoenix also report an increase in the number of two-parent families being served, signaling that the lack of employment is a critical factor in the growth of family homelessness. Also, the lack of affordable housing continues to play an important role in family homelessness in most communities, even though the recession has generally put downward pressure on rents. In some markets, such as Memphis, Tennessee, and Ames, Iowa, the supply of affordable housing has decreased in recent years due to public housing transformation, Section 8 opt outs, and the redevelopment of alternative housing options, such as trailer parks. In other parts of the country, costs for rental housing remain high in spite of the recession. In San Francisco, for example, 20 to 25 percent of families in shelter have one adult who is working, suggesting that the lack of affordable housing is the major problem.
Chapter 4: Trends in Sheltered Homelessness between 2007 and 2009 45

housing were almost exactly the same in 2009 as in 2008. About 68 percent of all sheltered homeless people were in principal cities and 32 percent in suburban and rural areas in both years, as shown in Exhibit 4-4. Between 2008 and 2009, the share of individuals in principal cities grew very slightly, from 71.0 percent to 72.2 percent, while the share of family members in suburban and rural areas grew by half a percentage point to 38.8 percent in 2009. Exhibit 4-4: Change in the Geographic Location of the Sheltered Homeless
Population, 2008-2009
Homeless Persons in 2008
Homeless Persons in 2009
Geographic Location Number Percent Number Percent
Change from 2008 to 2009 in
Percentage Points All Sheltered Persons
Principal Cities 1,084,335 68.0% 1,063,613 68.2% 0.2% Suburban and Rural Areas 509,459 32.0% 495,304 31.8% -0.2%
Individuals Principal Cities 775,977 71.0% 746,563 72.2% 1.1% Suburban and Rural Areas 316,634 29.0% 288,096 27.8% -1.1%
Persons in Families Principal Cities 318,683 61.7% 327,758 61.2% -0.5% Suburban and Rural Areas 198,041 38.3% 207,689 38.8% 0.5%
Source: Homeless Management Information System data, 2008-2009
These very small changes in the locations of sheltered homeless people between 2008 and 2009 followed a much larger shift in the geography of sheltered homelessness between 2007 and 2008. Sheltered homelessness became markedly more suburban and rural between 2007 and 2008. In contrast the continued growth in family homelessness between 2008 and 2009 did not occur disproportionately in suburban and rural areas. Exhibit 4-5 shows the pattern across the three-year period.
46 Chapter 4: Trends in Sheltered Homelessness between 2007 and 2009

Chapter 4: Trends in Sheltered Homelessness between 2007 and 2009 47
Changes in the Demographic Characteristics of Homeless Individuals and Families
Overall, the demographic characteristics of sheltered homeless people did not change much over the three-year period from 2007 through 2009. The following exhibits (4-6 through 4-8) show a few notable changes: the aging of homeless population, the number of veterans and people with disabilities, the racial composition of sheltered homelessness, and the composition of homeless families.32 Aging of the Homeless Population
Exhibit 4-6 shows a slight increase in the percentage of all homeless people who give their age as greater than 50. This is consistent with other research that shows an increase in homelessness among a relatively older population as the baby boom generation ages.33 It is also consistent with the information gathered through interviews with homeless assistance providers in nine communities across the country. San Francisco, for example, has a large population of individuals who have been homeless for a long time and whose physical health
32 See Appendix Exhibit D-4 in this report for other demographic characteristics of sheltered homeless
families in 2009. The appendices in the 2007 and 2008 Annual Homeless Assessment Reports provide the demographic characteristics of sheltered persons for these years.
33 Culhane, Dennis P., Stephen Metraux, and Jay Bainbridge. “The Age Structure of Contemporary Homelessness: Risk Period or Cohort Effect?” Working Paper: The University of Pennsylvania.
32.00%
22.90%
31.80%
21.30%
29.00%27.80%
26.90%
38.30% 38.80%
0%
5%
10%
15%
20%
25%
30%
35%
40%
45%
2007 2008 2009
Source: Homeless Management Information System data, 2007-2009
Exhibit 4-5: Change in the Percentage of Sheltered Homeless People, in Suburban and Rural Areas, 2007-2009
Persons in Families
All Sheltered Persons
Individuals

needs have increased over time. Providers in Detroit also commented on the aging of the homeless population.
Exhibit 4-6 Change in the Ages and Veteran and Disabled Status of Sheltered Homeless Adults, 2007-2009
Percentage of All Sheltered Homeless Adults Characteristic 2007 2008 2009
Age a
18 to 30 26.2% 28.0% 28.7%
31 to 50 52.7% 50.9% 49.2%
51to 61 17.4% 17.6% 18.5%
62 and older 3.8% 3.5% 3.6%
Veteran (adults) a 13.2% 11.6% 11.1%
Disabled (adults) a 37.1% 42.8% 37.8% a Age is calculated based on a person’s first time in shelter during the covered time period. A child is defined as a
person age 17 or under, and an adult is defined as a person age 18 or older.
Veteran status and whether a person had a disabling condition are recorded only for adults in HMIS. The percentage calculations shown indicate the percent of homeless adults with this characteristic. The number of records missing information on disability status dropped from 32.4 percent in 2007 to 22.0 percent in 2008 and 10.6 percent in 2009. Similarly, the percent of adults with missing information on veteran status dropped from 15.9 percent in 2007 to 7.5 percent in 2008 and to only 5.4 percent in 2009. The percentage calculations include only persons whose disability and veteran status was recorded.
Source: Homeless Management Information System data, 2007-2009
Veterans and People with Disabilities in the Sheltered Homeless Population
Exhibit 4-6 also shows the percentages of homeless adults who reported being veterans and who reported having a disability in 2007, 2008, and 2009. Over time the rates of missing information for disability and veteran status have declined considerably, and as a result, the accuracy of these estimates has improved substantially. The slight drops between 2008 and 2009 in the percentages of all adults who report that they are veterans or that they have a disability may reflect more accurate estimates or may reflect the increase in family homelessness over the three-year period. Homeless adults in families are much less likely than individual adults to be veterans (because they are younger and less likely to be men) and also less likely to report having a disability. Substantial differences in disability rates and veterans status by household type have been observed repeatedly in past AHAR reports. Interviews with homeless assistance providers conducted for this report suggest that veterans of the Iraq and Afghanistan conflicts have not yet become homeless in great numbers, perhaps because it takes some years for the mental disabilities associated with war to become acute. However, several providers suggested that that the average age of homeless veterans is decreasing. In Phoenix, for example, the average age of homeless veterans in 2009 was 47,
48 Chapter 4: Trends in Sheltered Homelessness between 2007 and 2009

Chapter 4: Trends in Sheltered Homelessness between 2007 and 2009 49
down from 57 only five years earlier.34 Providers also noted that they are seeing a “higher level of impairment” among homeless veterans, including more cases of substance abuse, Post-Traumatic Stress Disorder (PTSD), traumatic brain injury and other mental and physical impairments. Several providers, including those in San Francisco, Monterrey and Phoenix, reported seeing an increase in homeless veteran families related to worsening economic conditions. As one California provider noted, “there are just no jobs when they are discharged.” Race and Ethnicity of Sheltered Homeless People
Homelessness became somewhat more prevalent among people who are white and not Hispanic over the three-year period from 2007 to 2009. The share of sheltered homeless individuals who do not identify themselves as members of minority groups increased from 42.6 percent in 2007 to 45.4 percent in 2009, and the share of sheltered homeless family members who were not minorities increased from 21.3 to 23.6 percent between 2007 and 2008 and held steady in 2009, as shown in Exhibit 4-7.
34 The AHAR data collected for this report do not permit estimates of the age ranges of sheltered homeless
veterans. A supplementary effort collected 2009 data just on veterans in the standard AHAR reporting categories, and an analysis of that information will be published later in 2010.
Exhibit 4-7 Change in the Race and Ethnicity of Sheltered Homeless Individuals and Persons in Families, 2007 - 2009 a
Sheltered Individuals
Race % of Individuals
2007 % of Individuals
2008 % of Individuals
2009 White, non–Hispanic/Latino 42.6% 44.6% 45.4% White Hispanic, Latino 14.1% 11.0% 10.4% Black or African American 33.2% 37.0% 34.1%
Other Racial Groups b 10.1% 7.5% 10.2%
Sheltered Persons in Families
Race % of Persons in Families 2007
% of Persons in Families 2008
% of Persons in Families 2009
White, non–Hispanic/Latino 21.3% 24.4% 23.6% White Hispanic, Latino 9.8% 13.1% 13.9% Black or African American 55.2% 50.9% 47.9% Other Racial Groups b 13.6% 11.6% 14.7%
a Percentages may not sum to 100 percent due to rounding. b Includes persons who identify as multiple races.
Source: Homeless Management Information System data, 2007- 2009

While African-American families and individuals have higher rates of homelessness than in the U.S. population as a whole or in the poverty population (see chapter 3), the share of sheltered homeless family members identifying themselves as black or African American decreased steadily over the three year period—for example, from 55.2 percent of persons in families in 2007 to 47.9 percent in 2009 (Exhibit 4-7). More Men in Sheltered Homeless Families
The ratio between adults and children in sheltered homeless families changed very little over the 2007-2009 time period. However, adults in families were somewhat more likely to be men in 2009 than they were in 2007, 20.4 percent vs. 18.0 percent, as shown in Exhibit 4-8. This probably accounts for the slight increases in the percentages of 3 and 4 person households shown on the exhibit, despite the lack of change in the percentage of people in sheltered homeless families who are children. Because of the recession, more families with two adults may have become homeless, as well as more families with only a father present. Providers in six of the nine communities visited for this report said they had seen an increase in two-parent families and male-headed families. Providers generally attribute the increase in two-parent families to the effects of the recession, which is making it difficult for even one parent to find a job. According to one provider in Monterey, California, two-parent households now represent about half of all families seeking shelter. Located on the ocean, Monterey has very high housing costs and in recent years has lost affordable rental housing due to foreclosures. According to this provider, “You can’t afford to make the rent working at Starbucks.” Providers in northeast Iowa also commented on the increase in two-parent households seeking shelter, which they attribute to the lingering effects of the closure of a major manufacturing plant a couple of years ago. Providers had fewer explanations for the increase in male-headed families. Providers in Detroit suggested that it could reflect higher rates of drug abuse or incarceration among women, or be related to local efforts to encourage men to take a greater role in raising their children. Providers in several communities noted that it can be harder for male-headed and two-parent families to access shelter, because most facilities are geared toward serving single women and their children.
50 Chapter 4: Trends in Sheltered Homelessness between 2007 and 2009

4.2 Changing Patterns of Becoming Homeless, 2007-2009
Exhibit 4-8: Changes in the Composition of Sheltered Homeless Families, 2007-2009 a
Characteristic
Percentage of Sheltered Homeless Persons in
Families 2007
Percentage of Sheltered Homeless Persons in
Families 2008
Percentage of Sheltered Homeless Persons in Families
2009
Adults and Children
Adults 38.4% 39.7% 39.4% Children 61.6% 60.3% 60.6%
Gender of Adults
Women 82.0% 80.9% 79.6% Men 18.0% 19.2% 20.4% Household Size 2 people 26.6% 25.0% 24.4% 3 people 27.9% 29.6% 29.4% 4 people 22.1% 21.8% 23.0% 5 or more people 23.4% 23.7% 23.1% a Percentages may not sum to 100 percent due to rounding.
Source: Homeless Management Information System data, 2007-2009
The pathways through which people entered shelters or transitional housing changed to some extent between 2008 and 2009. Exhibits 4-9 and 4-10 show the trends over the 2007 through 2009 period separately for sheltered homeless individuals (Exhibit 4-9) and for adults in homeless families (Exhibit 4-10). Sheltered Homeless Individuals
People in emergency shelter or transitional housing as individuals were more likely to have come from a place not meant for human habitation in 2009 than was the case in 2007 or 2008, as shown on Exhibit 4-9. According to Continuum of Care point-in-time counts, the number of unsheltered individuals dropped between 2008 and 2009 (see chapter 2). Therefore, the increase of about 31,000 in the number of individuals coming into the shelter system from the “street” between 2008 and 2009 may reflect the success of the homeless services system in reducing unsheltered homelessness rather than a growth in street homelessness. Overall, the share of homeless individuals coming into shelter from some type of housing (their own housing unit or someone else’s) was essentially unchanged over the three-year period, but the share coming from their own housing unit went down slightly, while the percentage who had been staying with friends or family increased from 24.3 percent in 2007 to 25.8 percent in 2008 and 26.8 percent in 2009.
Chapter 4: Trends in Sheltered Homelessness between 2007 and 2009 51

Exhibit 4-9: Change in Previous Living Situation of Individuals Using Homeless Residential Services, 2007-2009
Living Arrangement the Night before Program Entry
Percentage Distribution
2007
Percentage Distribution
2008a
Percentage Distribution
2009 a
Total Already Homeless 43.3% 39.5% 41.1% Place not meant for human habitation
14.8% 14.7% 17.1%
Emergency shelter 25.2% 22.0% 21.4% Transitional housing 3.2% 2.7% 2.6%
Total from Some Type of Housing 36.5% 37.0% 36.6% Rented housing unitb 10.3% 9.2% 8.0% Owned housing unit 1.9% 2.0% 1.9% Staying with family 15.2% 14.2% 14.8% Staying with friends 9.1% 11.6% 12.0%
Total from Institutional Settings 12.1% 13.6% 14.6% Psychiatric facility 1.6% 1.7% 1.5% Substance abuse treatment center 3.6% 4.4% 5.3% Hospital (non-psychiatric) 1.4% 1.5% 1.5% Jail, prison, or juvenile detention 5.0% 5.6% 5.8% Foster care home 0.5% 0.5% 0.5%
Total from Other Situations 8.2% 9.9% 8.4% Hotel, Motel (no voucher) or “other” 8.2% 9.9% 8.4%
Number of Homeless Adults 1,115,054 1,092,612 1,034,659 a The percentage of HMIS records missing this information dropped from 32 percent in 2007 to 21 percent in 2008 and
to 11 percent in 2009. b Includes a small percentage in permanent supportive housing.
Source: Homeless Management Information System data, 2007-2009
A growing number of people homeless in shelters or transitional housing as individuals came there from substance abuse or detoxification centers over the three-year period. As shown on Exhibit 4-9, the percentage of homeless individuals coming into shelter from that type of institutional setting grew from 3.6 percent in 2007 to 5.3 percent in 2009. In 2009, the number was 48,645, compared with 27,131 in 2007. As part of the site visits conducted for this report, providers of homeless services in several communities reported that some individuals exhibited mental health problems of greater severity than in previous years This could be interpreted as a success in reaching the most needy unsheltered people or, alternatively, could reflect budget-related declines in mental health services reaching unsheltered homeless people. Many state and local governments have made significant cuts to social services as a result of budget shortfalls. Providers in several of the communities visited described the impact of those cuts on the size and nature of the homeless populations they serve.
52 Chapter 4: Trends in Sheltered Homelessness between 2007 and 2009

State Funding Cuts and Homelessness In California, the state fiscal crisis has led to sharp decreases in mental health funding and a lack of discharge planning from state institutions, as well as what one San Francisco provider described as an “erosion of community resources.” In 2007, funding was eliminated for the state’s Integrated Services for Homeless Adults with Serious Mental Illness program, and in 2009, the state faced a $42 billion budget gap resulting in cutbacks in many social services usually provided at the county level. According to providers, these reductions have limited provision of services to those with the most severe cases of mental illness. Others with only slightly less severe illness cannot be served and end up in the homeless system. As a result, homeless service providers indicated a much higher proportion of their population is afflicted with mental illness. San Francisco providers note that, although they have not seen a substantial increase in the homeless population overall, those they are serving have greater needs. Providers in Phoenix and Maricopa County told a similar story. The recession has resulted in fewer state and local government resources for safety net services; particularly behavioral health services. In 2009, the City of Phoenix reduced the number of human service one-stop service centers from five to three. The State of Arizona cut Medicaid-funded drug treatment services, and the result has been longer lengths of stay in treatment and fewer available slots opening up for new clients to enter treatment. Many of those who are unable to enter treatment are homeless and remain in the homeless system.
Sheltered Homeless Persons in Families
There were few changes in the prior living arrangements of persons in families between 2007 and 2009 (Exhibit 4-10). Perhaps the most interesting finding is that the percentages coming from housing units they owned or rented were very little different in 2009 than they were in 2008. The effect of the foreclosure crisis on homelessness seems to be mainly indirect, reflected by the increase in the percentage of families that had been staying with relatives before they became homeless. The change between 2008 and 2009 in the number who said they had been staying with family before becoming homeless was about 9,500, and the three-year change between 2007 and 2009 was 27,330. Families were less likely to report that they were already homeless when they entered an emergency shelter or transitional housing program in 2009 than they were in 2007, suggesting that much of the increase in family homelessness in recent years has been for families becoming homeless for the first time. A slightly higher percentage of adults in families said that they had been in substance abuse treatment centers in 2009 compared with 2008. A slightly lower percentage reported that they had been living unsubsidized in a hotel or motel, continuing a pattern of decline in the use of this type of living arrangement by families at risk of homelessness also observed between 2007 and 2008.
Chapter 4: Trends in Sheltered Homelessness between 2007 and 2009 53

Exhibit 4-10: Change in Previous Living Situation of Adults in Families Using Homeless Residential Services, 2007-2009
Living Arrangement the Night before Program Entry
Percentage of Adults in
Families 2007
Percentage of Adults in
Families 2008
Percentage of Adults in
Families 2009
Total Already Homeless 30.3% 25.9% 26.0% Place not meant for human habitation 3.6% 4.0% 4.0% Emergency shelter 23.3% 19.8% 19.5% Transitional housing 3.4% 2.2% 2.5%
Total from Some Type of Housing 54.4% 61.5% 62.5% Rented housing unit a 13.0% 16.8% 17.1% Owned housing unit 3.8% 2.4% 2.6% Staying with family 24.2% 27.8% 29.4% Staying with friends 13.4% 14.5% 13.5%
Total from Institutional Settings 2.3% 2.4% 2.7% Psychiatric facility, substance abuse center, or hospital
1.9% 1.8% 2.1%
Jail, prison, or juvenile detention 0.4% 0.5% 0.4% Foster care home 0.0% 0.1% 0.1%
Total from Other Situations 13.0% 10.2% 8.7% Hotel, motel (no voucher) or “other” 13.0% 10.2% 8.7%
Total Homeless Adults in Families 179,401 203,199 210,510
a Includes a small percentage in permanent supportive housing.
Source: Homeless Management Information System data, 2007-2009
4.3 Changing Use of the Residential System for Homeless People, 2007-2009
All of the increase in family homelessness in 2009 compared with 2008 was in the use of emergency shelters by family members, rather than transitional housing. Exhibit 4-11 shows the number of persons in families using only emergency shelter, only transitional housing, or both programs during the course of a year. The number of persons in families staying just in emergency shelters grew by more than 20,000 people, while the numbers using transitional housing alone or in combination with emergency shelter dropped slightly. This pattern may reflect efforts by communities to help families move quickly to permanent housing rather than using a transitional housing program first. Also, it could reflect a shift in the types of families becoming homeless, with a smaller number needing the additional stabilizing services offered by transitional housing programs. Adult family members who reported that they had a disability dropped from 18.4 percent in 2008 to 14.0 percent in 2009, consistent with the idea that the growth in family homelessness over the two-year period was driven by economic factors.
54 Chapter 4: Trends in Sheltered Homelessness between 2007 and 2009

Exhibit 4-11 Family Members in Emergency Shelter and Transitional Housing, 2008 -2009
All Sheltered Persons in Families 2008 2009 Change 2008-2009
Emergency shelter only 354,997 375,334 +20,337
Transitional housing only 134,678 134,069 -609
Both emergency shelter and transitional housing
27,050 26,044 -1006
Total 516,724 535,447 +18,723
Source: Homeless Management Information System data, 2008-2009
Changes in Lengths of Stay in the Homeless Services System
Exhibit 4-12 shows median lengths of stay in emergency shelter and transitional housing separately for individuals and persons in families. The median number of nights in emergency shelter increased from 14 to 18 for individuals from 2007 to 2008 and then dropped back to 17 nights in 2009. In contrast, the median number of nights in emergency shelter for persons in families was 30 in both 2007 and 2008 and then increased to 36 nights in 2009. Not only did family homelessness continue to increase between 2008 and 2009, it also seems to have become more severe in the sense that it took the typical family longer to leave shelter. The differing patterns for individuals and family members hold for lengths of stay in transitional housing as well, with the median number of nights for individuals remaining constant between 2008 and 2009 but growing for persons in families, from 161 nights in 2008 to 174 nights in 2009. Growing lengths of stay for families in transitional housing are more difficult to interpret. Six months may be an appropriate stay in transitional housing for families that need the intensive services that transitional housing programs are supposed to provide.
Chapter 4: Trends in Sheltered Homelessness between 2007 and 2009 55

56 Chapter 4: Trends in Sheltered Homelessness between 2007 and 2009
In 2009 as in previous years, many people homeless as individuals spent a week or less in emergency shelter over the course of a year. That percentage dropped from 42 percent in 2007 to 37 percent in 2008, but then remained almost the same (38 percent) in 2009, as shown on Exhibit 4-13. The percentage of homeless individuals spending between one and six months in emergency shelter rose from 26 percent in 2007 to almost 30 percent in 2008 and then stayed about the same between 2008 and 2009.
Exhibit 4-14 focuses on those individuals who stayed in emergency shelter for six months or more during a year, a group that made up less than 5 percent of all individuals using emergency shelters in 2009. The comparison of the demographic characteristics of these “heavy users” of the shelter system across the three years—2007, 2008, and 2009—show a steady increase in the percentage of non-minority individuals (white and not Hispanic). This change may be related to bringing more non-minority individuals off the streets and into shelters. (The increasing percentage of heavy users of emergency shelter identifying themselves as belonging to “other” racial groups mainly reflects the growing tendency of people to identify themselves as belonging to several races.)
Exhibit 4-12: Change in Median Length of Stay, by Shelter and Household Type, 2007-2009
Median Nights in Shelter
2007 2008 2009
Emergency Shelters
Individuals 14 nights 18 nights 17 nights
Persons in Families 30 nights 30 nights 36 nights
Transitional Housing
Individuals 91 nights 107 nights 107 nights
Persons in Families 151 nights 161 nights 174 nights
Source: Homeless Management Information System data, 2007-2009

Chapter 4: Trends in Sheltered Homelessness between 2007 and 2009 57
Exhibit 4-14 shows a dramatic increase in the percentage of heavy users of emergency shelter who are individuals older than 50 years of age, from 30.6 percent in 2008 to 40.5 percent in 2009. This is consistent with other information on the aging of a cohort of individuals that began to exhibit patterns of chronic homelessness in the 1980s.35 The percentage of heavy users with a disability dropped slightly, but this may simply reflect more precise estimates resulting from the lower rate of missing data on disability in 2009 than in 2008.
Families are much less likely than individuals to stay in emergency shelter for a week or less. The percentage doing so stayed essentially the same over the three-year period, between 23 and 24 percent. As shown in Exhibit 4-15, the increase in median lengths of stay for families in shelter between 2008 and 2009 resulted mainly from more persons in families spending between two and six months in shelter.
35 Culhane, Dennis P., Stephen Metraux, and Jay Bainbridge. “The Age Structure of Contemporary
Homelessness: Risk Period or Cohort Effect?” Working Paper: The University of Pennsylvania.
Exhibit 4-14: Individuals Who Stayed in Emergency Shelter More Than 180 Days, 2007-2009
Characteristics Percentage of Long-Stayers
2007
Percentage of Long-Stayers
2008
Percentage of Long-Stayers
2009
Gender
Male 73.5% 77.0% 72.1% Female 26.5% 23.0% 27.9%
Race/Ethnicity
White, non–Hispanic/Latino 31.9% 34.8% 36.9% White, Hispanic/Latino 11.0% 12.8% 8.1% Black or African American 49.9% 45.4% 45.2% Other racial groups 7.3% 7.1% 9.8%
Age a
18 to 30 12.6% 16.7% 11.3% 31 to 50 50.3% 51.9% 47.0% 51 and older 34.9% 30.6% 40.5%
Veteran (adults only)b -- 15.4% 14.3% Disabled (adults only)b -- 39.7% 34.6%
a Age categories do not sum to 100 percent because of the small numbers of people homeless alone who were under 18 years of age.
b Because of the very different rates of missing data between 2007 and 2008 for veteran and disability status, the comparison to 2007 is not shown for these characteristics.
Source: Homeless Management Information System data, 2007- 2009

58 Chapter 4: Trends in Sheltered Homelessness between 2007 and 2009
Just as is the case for individuals, the percentage of people staying in emergency shelter as families for more than six months of a year who are not members of minority groups increased steadily over the three-year period, from less than 7 percent in 2007 to almost 12 percent in 2009. Long stayers still were more likely to be African American than all sheltered homeless families in 2009, 68.8 percent vs. 47.9 percent (see Exhibit 4-16).
Exhibit 4-16: Change in Race and Ethnicity of Persons in Families Who Stayed in Emergency Shelters More Than 180 Days, 2007-2009
Characteristic Percentage of Long-Stayers
2007
Percentage of Long-Stayers
2008
Percentage of Long-Stayers
2009 White, non–Hispanic/Latino 6.8% 8.0% 11.9% White, Hispanic/Latino 2.6% 9.5% 8.6% Black or African American 87.9% 70.6% 68.8% Other single- and multi-race groups 2.7% 11.9% 10.7%
Source: Homeless Management Information System data, 2007-2009
22.8% 23.5% 23.9%
28.2% 26.7% 23.5%
16.4% 18.7%15.7%
22.4% 21.7%26.4%
10.2% 9.5% 10.5%
0%
10%
20%
30%
40%
50%
60%
70%
80%
90%
100%
2007 2008 2009
1 week or less 1 week to 1 month 1 to 2 months 2 to 6 months More than 6 months
Exhi ies, bit 4-15: Lengths of Stay in Emergency Shelter for Persons in Famil2007-2009
Source: Homeless Management Information System data, 2007-2009

4.4 Summary of Trends in Sheltered Homelessness between 2007 and 2009
The major changes that occurred in sheltered homelessness that occurred between 2007 and 2009 were:
A small overall decline in the number of sheltered homeless people between 2008 and 2009. About 35,000 fewer people were homeless at some time during 2009 than during 2008.
A 7 percent drop in the number of people homeless as individuals across the three-year period between 2007 and 2009. About 80,000 fewer people were in emergency shelter or transitional housing as individuals in 2009 compared to 2007. This may reflect community success in getting people out of shelters and into permanent housing.
A continued increase in family homelessness between 2008 and 2009, following a larger increase between 2007 and 2008. In 2009, more than 170,000 families (including more than 535,000 people) were in shelters or transitional housing, a 30 percent increase over the 2007 number of sheltered homeless families. The sustained high level of family homelessness in 2009 reflects the ongoing effect of the recession.
A slight aging of the adult homeless population, consistent with other research that points to the aging of a cohort of people who became susceptible to homelessness when they were younger.
A steady decrease (from a high starting point) in the percentage of sheltered homeless families and individuals identifying themselves as African American.
A slight increase (from a low starting point) in men who are homeless as part of families.
An increase between 2008 and 2009 in the percentage of individuals reporting that their previous living arrangement was a place not meant for human habitation. Communities may be having some success in getting people off the “street” and into shelters.
A continued increase between 2008 and 2009 in the percentage of adults in families who reported that they had been staying with family before becoming homeless. However, there was no further increase between 2008 and 2009 in the percentage who said they came from an owned or rented housing unit. The effect of the continuing foreclosure crisis on family homelessness seems to be indirect, as families stay with friends or relatives before entering shelters.
An increase in the use of emergency shelters by families, and a slight decrease in the use of transitional housing.
An increase in the median number of nights that family members stayed in emergency shelter, from 30 nights in 2008 to 36 nights in 2009. Family homelessness both increased between 2008 and 2009 and became more severe in the sense that it
Chapter 4: Trends in Sheltered Homelessness between 2007 and 2009 59

60 Chapter 4: Trends in Sheltered Homelessness between 2007 and 2009
took the typical family longer to leave shelter. Looking ahead to the 2010 AHAR, it is possible that lengths of stay will go down as a result of the use of HPRP funds for rapid re-housing.

Chapter 5 The Nationwide Capacity of Residential Programs for Homeless People This chapter describes the nation’s capacity to provide shelter or permanent supportive housing for homeless and formerly homeless people. The inventory of beds is reported for four types of residential programs: emergency shelters, transitional housing, permanent supportive housing, and safe havens. The chapter presents information on:
The 2009 inventory of beds by residential program type, by whether the beds are for individuals or persons in families, and by specific homeless subpopulations: unaccompanied youth, veterans, and victims of domestic violence.
The geographic location of beds in 2009, focusing on the total number of beds by state and the proportion of beds located in urban and suburban or rural areas.
The frequency of bed use (or the bed utilization rate) for emergency shelters and transitional housing programs in 2009.
Changes in the nation’s capacity to provide shelter or permanent supportive housing for homeless and formerly homeless persons from 2006 to 2009.
With one exception, all of the information presented in this chapter was reported by CoCs in a bed inventory that is part of their annual application for funding. The bed utilization and turnover rates use the HMIS-based data on the number of shelter users and beds.
Types of Residential Programs
1. Emergency Shelter: A facility with the primary purpose of providing temporary shelter for people who otherwise would be forced to stay in a place not fit for human habitation.
2. Transitional Housing: A residential program intended to facilitate the movement of homeless people into permanent housing. Homeless people may live in transitional housing for up to 24 months and receive services that prepare them to obtain and retain permanent housing.
3. Safe Havens: A form of supportive housing that serves hard-to-reach homeless people with severe mental illnesses who are on the streets and have been unable or unwilling to participate in supportive services.
4. Permanent Supportive Housing (PSH): Long-term, subsidized housing with supportive services for formerly homeless people with disabilities to enable them to live as independently as possible in a permanent setting.
Chapter 5: The Nationwide Capacity of Residential Programs for Homeless People 61

62 Chapter 5: The Nationwide Capacity of Residential Programs for Homeless People
5.1 Inventory of Residential Programs and Beds, 2009
Total Number of Residential Programs and Beds
In 2009, the nation’s capacity to house homeless and formerly homeless people included an estimated 20,065 residential programs and 643,423 year-round beds36 (see Exhibit 5-1). The number of beds is divided almost evenly among emergency shelters, transitional housing, and permanent supportive housing, but—for the first time—the number of permanent supportive housing beds is larger than each of the other types of beds.
Exhibit 5-1: National Inventory of Residential Programs and Year-Round Beds, 2009a
Programs Beds Program Type
Number Percentage Number Percentage Emergency Shelter 6,009 29.9% 214,425 33.3% Transitional Housing 7,229 36.0% 207,589 32.3% Permanent Supportive Housing 6,701 33.4% 219,381 34.1% Safe Haven 126 0.6% 2,028 0.3%
Total Numberb 20,065 100% 643,423 100% a Year-round beds are available for use throughout the year and are considered part of the stable inventory of beds for
homeless persons. The inventory includes beds in Puerto Rico, the U.S. Territories of Guam and the Virgin Islands. b The 2009 inventory includes beds that were reported by CoCs as part of their current and new inventories. The current
inventory was available for occupancy on or before January 31, 2008. The new inventory was available for occupancy between February 1, 2008 and January 30, 2009.
Source: 2009 Continuum of Care Application: Exhibit 1, CoC Housing Inventory
Emergency Shelter and Transitional Housing In 2009, the national inventory of year-round beds for homeless persons was split almost evenly between emergency shelter and transitional housing programs. However, whereas emergency shelters dedicated slightly more than half of their beds to homeless individuals, transitional housing programs dedicated slightly more than half of their beds to homeless families (see Exhibit 5-2). Family beds are located within units—such as apartments or single rooms that are occupied by one family. Programs that served families had 67,083 family units with an average 3.2 beds per unit. In addition to their year-round beds, CoCs must report their inventories of seasonal beds and overflow or voucher beds. These beds are exclusively for emergency shelter and are typically used during inclement weather conditions. The 2009 national bed inventory had 20,419 seasonal beds and 30,565 overflow or voucher beds. (See Text Box: Types of Beds
36 Year-round beds are available for use throughout the year and are considered part of the stable inventory of
beds for homeless persons.

Reported in a CoC Housing Inventory.) Adding these beds to the total number of year-round shelter beds in emergency shelters and transitional housing programs increases the nation’s peak bed capacity for homeless persons by 12 percent, to 475,026 beds. Including these beds also increases the average size of emergency shelters from 36 beds per program to just over 44 beds per program. Considering the short-term and more congregate housing settings of emergency shelters compared to transitional housing, it is not surprising that bed capacity per program is much larger than the approximately 29 beds per program in transitional housing.
5. Family units: Housing units (e.g., apartments) that serve homeless families. Each family unit includes several beds.
Types of Beds Reported in a CoC Housing Inventory
1. Year-round beds: Beds available for use throughout the year and considered part of the stable inventory of beds for homeless persons.
2. Seasonal beds: Beds usually available during particularly high-demand seasons (e.g., winter months in northern regions and summer months in southern regions), but not available throughout the year.
3. Overflow beds: Beds typically used during emergencies (e.g., a sudden drop in temperature or a natural disaster that displaces residents). Their availability is sporadic.
4. Voucher beds: Beds made available, usually in a hotel or motel. They often function as overflow beds. Some communities, especially rural communities, use vouchers instead of fixed shelters, and thus these beds also can also be year-round beds.
Safe Havens
HUD funds safe haven programs designed to serve people with severe mental illness. Safe haven programs resemble permanent housing in that homeless individuals may stay in these 24-hour residences for an unspecified duration in private or semi-private accommodations. Safe havens are designed to stabilize a person’s housing situation so that his mental health issues can be treated and he can obtain permanent housing. Occupancy in safe havens is limited to no more than 25 people and the average is just under 17 beds per program. In 2009, 126 safe haven programs containing 2,028 beds made up less than one-half percent of the total bed inventory for serving homeless people. Permanent Supportive Housing
For several years, one of HUD’s policy priorities has been the development of permanent supportive housing programs that provide a combination of housing and supportive services to formerly homeless people with disabilities. In 2009, the nation’s permanent supportive housing inventory included more than 219,000 beds, more beds than in either emergency shelters or transitional housing (Exhibit 5-2). The large number of permanent supportive housing beds reflects the continuing efforts by HUD and communities to end homelessness among chronically
Chapter 5: The Nationwide Capacity of Residential Programs for Homeless People 63
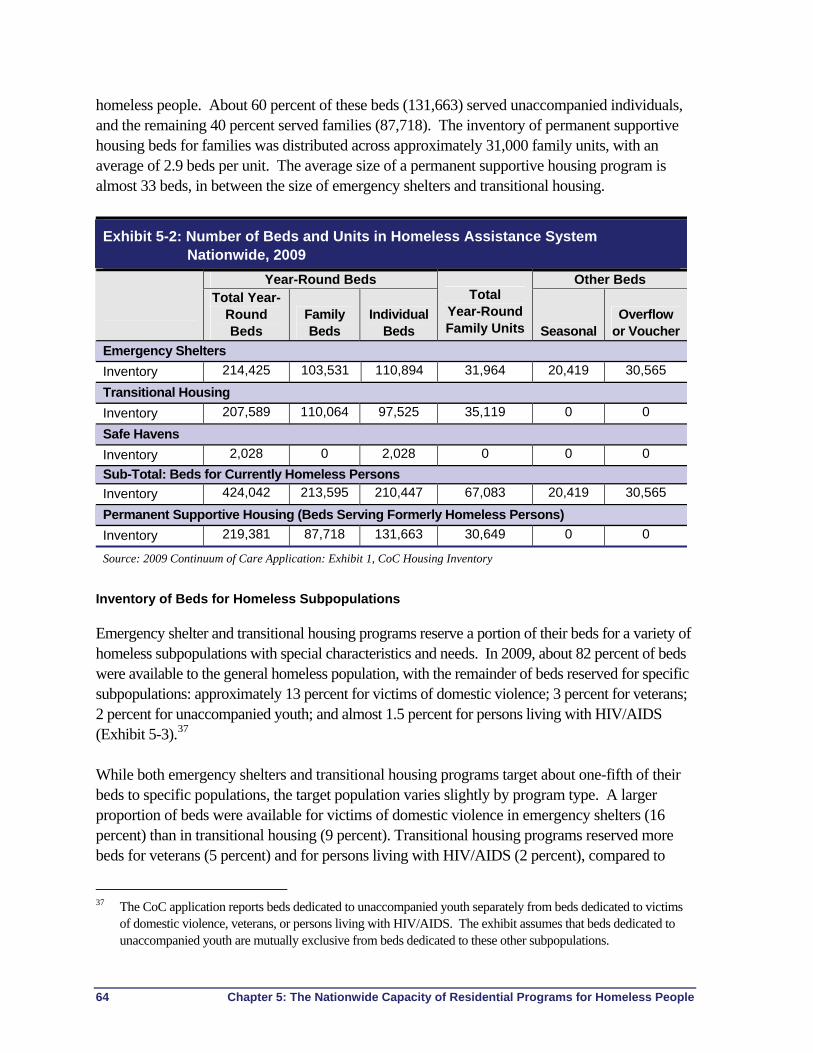
64 Chapter 5: The Nationwide Capacity of Residential Programs for Homeless People
homeless people. About 60 percent of these beds (131,663) served unaccompanied individuals, and the remaining 40 percent served families (87,718). The inventory of permanent supportive housing beds for families was distributed across approximately 31,000 family units, with an average of 2.9 beds per unit. The average size of a permanent supportive housing program is almost 33 beds, in between the size of emergency shelters and transitional housing.
Exhibit 5-2: Number of Beds and Units in Homeless Assistance System Nationwide, 2009
Year-Round Beds Other Beds
Total Year-Round Beds
Family Beds
Individual Beds
Total Year-Round Family Units Seasonal
Overflow or Voucher
Emergency Shelters
Inventory 214,425 103,531 110,894 31,964 20,419 30,565
Transitional Housing
Inventory 207,589 110,064 97,525 35,119 0 0
Safe Havens
Inventory 2,028 0 2,028 0 0 0
Sub-Total: Beds for Currently Homeless Persons
Inventory 424,042 213,595 210,447 67,083 20,419 30,565
Permanent Supportive Housing (Beds Serving Formerly Homeless Persons)
Inventory 219,381 87,718 131,663 30,649 0 0
Source: 2009 Continuum of Care Application: Exhibit 1, CoC Housing Inventory
Inventory of Beds for Homeless Subpopulations
Emergency shelter and transitional housing programs reserve a portion of their beds for a variety of homeless subpopulations with special characteristics and needs. In 2009, about 82 percent of beds were available to the general homeless population, with the remainder of beds reserved for specific subpopulations: approximately 13 percent for victims of domestic violence; 3 percent for veterans; 2 percent for unaccompanied youth; and almost 1.5 percent for persons living with HIV/AIDS (Exhibit 5-3).37 While both emergency shelters and transitional housing programs target about one-fifth of their beds to specific populations, the target population varies slightly by program type. A larger proportion of beds were available for victims of domestic violence in emergency shelters (16 percent) than in transitional housing (9 percent). Transitional housing programs reserved more beds for veterans (5 percent) and for persons living with HIV/AIDS (2 percent), compared to
37 The CoC application reports beds dedicated to unaccompanied youth separately from beds dedicated to victims
of domestic violence, veterans, or persons living with HIV/AIDS. The exhibit assumes that beds dedicated to unaccompanied youth are mutually exclusive from beds dedicated to these other subpopulations.

emergency shelters (0.8 percent for both population types). The share of beds for unaccompanied youth was the same for both emergency shelters and transitional housing programs (2 percent).
5.2 Geographic Location of Beds, 2009
Distribution of Beds by State
Exhibit 5-4 shows the total number of beds by state. The exhibit also provides the number of beds per 1,000 people in the state. In 2009, there were 2.0 beds for homeless and formerly homeless persons for every 1,000 people in the United States. With 17.1 beds per 1,000 persons, the District of Columbia has three times higher a ratio of beds to persons as the highest state, New York, which has a ratio of 4.8 beds per 1,000 persons. New York also has the largest inventory of beds in the country, with approximately 94,500 beds, followed by California with 88,688. No other state has more than 32,000 beds, and New York and California combined have 29 percent of the nation’s bed capacity. Wyoming has the fewest beds of any state (835 beds), but Mississippi has the fewest beds per 1,000 persons (0.6). Kansas is the only other state with less than 1 bed per 1,000 persons.
2.9%
1.4%
1.7%
81.5%
12.5%
Domestic violence victims only
Veterans only
Persons with HIV/AIDS
Unaccompanied youth
General population
Exhibit 5-3: Year-Round Emergency Shelter and Transitional Housing Beds by Homeless Subpopulation 2009
Distribution of Beds by Urban and Suburban or Rural Areas
According to information submitted by CoCs in 2009, more than half of all programs and almost two-thirds of all beds are located in a principal city (Exhibit 5-5). The distribution of programs and beds varies by program type. Transitional housing and permanent supportive housing programs follow a similar distribution as the inventory of beds. In contrast, while 70 percent of emergency shelter beds are located in principal cities, less than half of the programs are located in these areas because emergency shelter programs tend to be larger in principal cities than in suburban and rural areas. The average size of an emergency shelter in principal cities was 53 beds, compared to 20 beds in suburban and rural areas.
Chapter 5: The Nationwide Capacity of Residential Programs for Homeless People 65

Exhibit 5-4: Inventory of Year-Round Beds and Beds Per Capita Rate by State, 20091
Rank State # of
Beds
Beds Per Capita Rate Rank State
# of Beds
Beds Per
Capita Rate
1 District of Columbia 10,091 17.1 Colorado 8,713 1.8 2 New York 94,449 4.8 28 Florida 31,862 1.7 3 Hawaii 5,141 4.0 Louisiana 7,633 1.7 4 Nevada 10,191 3.9 Utah 4,693 1.7 5 Oregon 14,547 3.8 Delaware 1,488 1.7 6 Washington 24,519 3.7 New Hampshire 2,231 1.7 7 Massachusetts 23,376 3.6 Iowa 5,079 1.7 8 Maine 4,570 3.5 34 Wyoming 835 1.6 9 Alaska 2,204 3.2 35 Idaho 2,326 1.5 10 Minnesota 14,245 2.7 Georgia 14,674 1.5 11 Rhode Island 2,737 2.6 Montana 1,438 1.5 12 California 88,688 2.4 Indiana 9,477 1.5 13 Connecticut 8,112 2.3 39 Wisconsin 8,076 1.4 14 Michigan 21,641 2.2 North Carolina 12,607 1.4 15 Nebraska 3,764 2.1 41 Alabama 6,199 1.3 16 South Dakota 1,636 2.0 Tennessee 8,172 1.3
Arizona 12,992 2.0 West Virginia 2,311 1.3 Vermont 1,235 2.0 Virginia 9,895 1.3 North Dakota 1,266 2.0 45 South Carolina 5,461 1.2 New Mexico 3,891 2.0 Arkansas 3,366 1.2
21 Maryland 10,801 1.9 Texas 28,650 1.2 Pennsylvania 23,748 1.9 48 Oklahoma 4,145 1.1 Ohio 21,657 1.9 New Jersey 9,393 1.1
24 Kentucky 7,871 1.8 50 Kansas 2,094 0.7 Illinois 23,363 1.8 51 Mississippi 1,758 0.6 Missouri 10,586 1.8 Total 628,155 2.0
1 The beds per capita rate is the number of residential beds per 1,000 people in the state. Puerto Rico and U.S. Territories are not included: Guam (294 beds and 1.60 beds per capita), Virgin Islands (175 beds and 1.6 beds per capita), and Puerto Rico (3,057 beds and 0.8 beds per capita).
Sources: 2009 Continuum of Care Application: Exhibit 1, CoC Housing Inventory; 2008 American Community Survey
66 Chapter 5: The Nationwide Capacity of Residential Programs for Homeless People
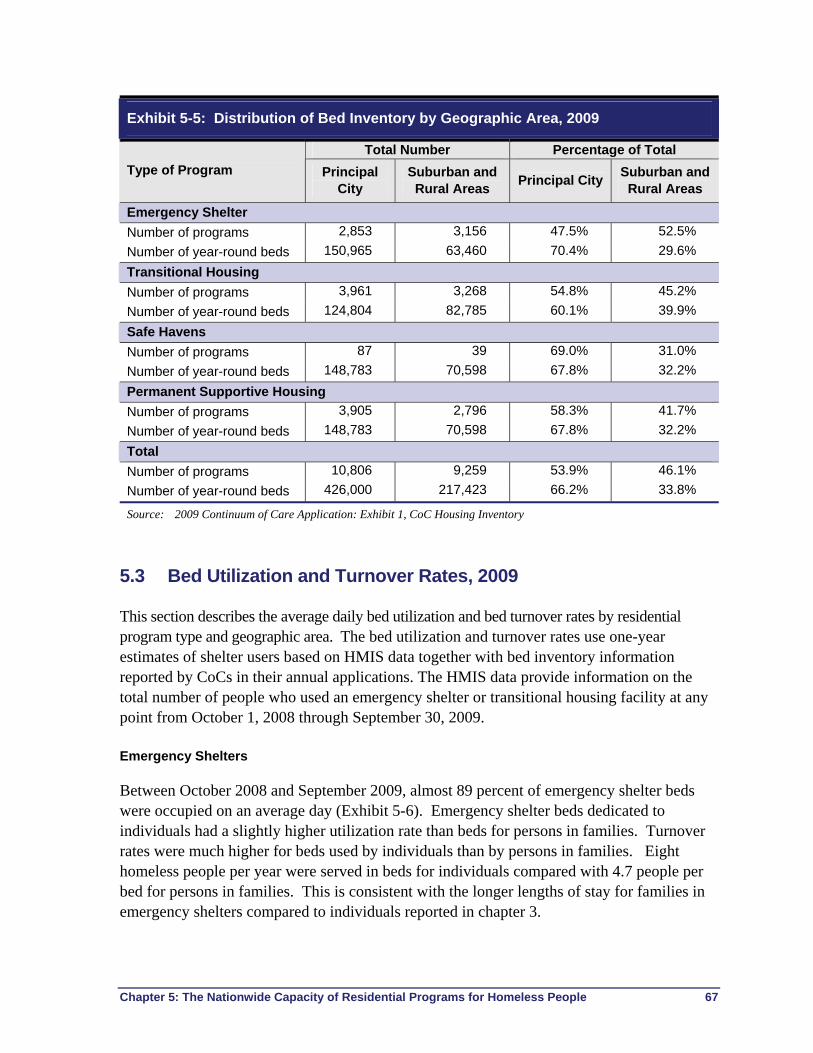
Exhibit 5-5: Distribution of Bed Inventory by Geographic Area, 2009
Total Number Percentage of Total
Type of Program Principal City
Suburban and Rural Areas
Principal City Suburban and
Rural Areas
Emergency Shelter
Number of programs 2,853 3,156 47.5% 52.5%
Number of year-round beds 150,965 63,460 70.4% 29.6%
Transitional Housing
Number of programs 3,961 3,268 54.8% 45.2%
Number of year-round beds 124,804 82,785 60.1% 39.9%
Safe Havens
Number of programs 87 39 69.0% 31.0%
Number of year-round beds 148,783 70,598 67.8% 32.2%
Permanent Supportive Housing
Number of programs 3,905 2,796 58.3% 41.7%
Number of year-round beds 148,783 70,598 67.8% 32.2%
Total
Number of programs 10,806 9,259 53.9% 46.1%
Number of year-round beds 426,000 217,423 66.2% 33.8%
Source: 2009 Continuum of Care Application: Exhibit 1, CoC Housing Inventory
5.3 Bed Utilization and Turnover Rates, 2009
This section describes the average daily bed utilization and bed turnover rates by residential program type and geographic area. The bed utilization and turnover rates use one-year estimates of shelter users based on HMIS data together with bed inventory information reported by CoCs in their annual applications. The HMIS data provide information on the total number of people who used an emergency shelter or transitional housing facility at any point from October 1, 2008 through September 30, 2009. Emergency Shelters
Between October 2008 and September 2009, almost 89 percent of emergency shelter beds were occupied on an average day (Exhibit 5-6). Emergency shelter beds dedicated to individuals had a slightly higher utilization rate than beds for persons in families. Turnover rates were much higher for beds used by individuals than by persons in families. Eight homeless people per year were served in beds for individuals compared with 4.7 people per bed for persons in families. This is consistent with the longer lengths of stay for families in emergency shelters compared to individuals reported in chapter 3.
Chapter 5: The Nationwide Capacity of Residential Programs for Homeless People 67
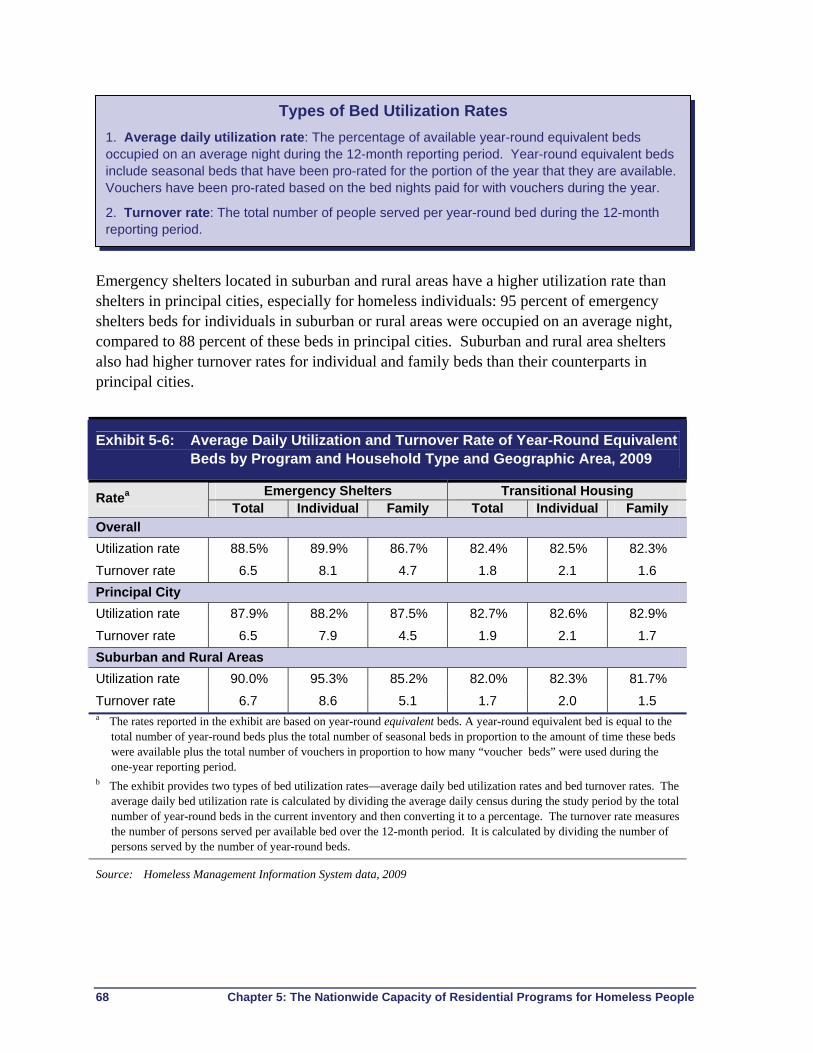
Emergency shelters located in suburban and rural areas have a higher utilization rate than shelters in principal cities, especially for homeless individuals: 95 percent of emergency shelters beds for individuals in suburban or rural areas were occupied on an average night, compared to 88 percent of these beds in principal cities. Suburban and rural area shelters also had higher turnover rates for individual and family beds than their counterparts in principal cities.
Exhibit 5-6: Average Daily Utilization and Turnover Rate of Year-Round Equivalent Beds by Program and Household Type and Geographic Area, 2009
Emergency Shelters Transitional Housing Ratea
Total Individual Family Total Individual Family
Overall
Utilization rate 88.5% 89.9% 86.7% 82.4% 82.5% 82.3%
Turnover rate 6.5 8.1 4.7 1.8 2.1 1.6
Principal City
Utilization rate 87.9% 88.2% 87.5% 82.7% 82.6% 82.9%
Turnover rate 6.5 7.9 4.5 1.9 2.1 1.7
Suburban and Rural Areas
Utilization rate 90.0% 95.3% 85.2% 82.0% 82.3% 81.7%
Turnover rate 6.7 8.6 5.1 1.7 2.0 1.5 a The rates reported in the exhibit are based on year-round equivalent beds. A year-round equivalent bed is equal to the
total number of year-round beds plus the total number of seasonal beds in proportion to the amount of time these beds were available plus the total number of vouchers in proportion to how many “voucher beds” were used during the one-year reporting period.
b The exhibit provides two types of bed utilization rates—average daily bed utilization rates and bed turnover rates. The average daily bed utilization rate is calculated by dividing the average daily census during the study period by the total number of year-round beds in the current inventory and then converting it to a percentage. The turnover rate measures the number of persons served per available bed over the 12-month period. It is calculated by dividing the number of persons served by the number of year-round beds.
Source: Homeless Management Information System data, 2009
Types of Bed Utilization Rates
1. Average daily utilization rate: The percentage of available year-round equivalent beds occupied on an average night during the 12-month reporting period. Year-round equivalent beds include seasonal beds that have been pro-rated for the portion of the year that they are available. Vouchers have been pro-rated based on the bed nights paid for with vouchers during the year.
2. Turnover rate: The total number of people served per year-round bed during the 12-month reporting period.
68 Chapter 5: The Nationwide Capacity of Residential Programs for Homeless People

Chapter 5: The Nationwide Capacity of Residential Programs for Homeless People 69
Transitional Housing
Compared to emergency shelters, transitional housing programs have lower bed utilization and turnover rates. About 82 percent of transitional housing beds were occupied on an average day, and this did not vary much by whether the beds were dedicated to individuals or families or by the location of the beds. Not surprisingly, bed turnover rates in transitional housing were much lower than those of emergency shelters. Transitional housing programs are designed to serve people for up to two years. During the one-year reporting period, a transitional housing bed typically serves a little less than two people. These data reinforce two patterns that have been observed consistently in other studies: (1) emergency shelters have higher average daily utilization rates and turnover rates than transitional housing programs, and (2) beds for unaccompanied individuals have higher average daily utilization rates and turnover rates than beds for persons in families.38 Duration in a shelter and frequency of bed use both affect turnover rates. The shorter the average length of stay and the faster a program can fill a vacant bed, the higher the turnover rate. These findings also are consistent with the information reported in chapter 3, which shows that people who stay in emergency shelters have shorter lengths of stay than those who stay in transitional housing programs, and that individuals who stay in either program type have shorter lengths of stay than families in the same program type.
5.4 Changes in the National Inventory and Utilization of Beds, 2006-2009
Changes in the Total Number of Beds
From 2006 to 2009, the total number of beds available in residential programs throughout the United States increased by almost 60,000 beds (or 10 percent), reflecting an increase in beds across all program types (Exhibit 5-7). The number of emergency shelter beds increased by 7,548 (3.6 percent), the number of transitional housing beds increased by 7,880 (3.9 percent), and the number of permanent supportive housing beds increased by more than both other programs combined by 42,551 (24.1 percent). More than half the growth in permanent supportive housing beds occurred in the last year, from just under196,000 in 2008 to more than 219,000 in 2009. In the same one-year period, the number of permanent supportive housing programs grew by 555, to 6,701 in 2009.
The increase in the inventory of permanent supportive housing programs and beds is particularly noteworthy because it is consistent with HUD’s emphasis on expanding the stock of supportive housing. In collaboration with the Interagency Council on Homelessness, HUD has placed
38 Burt, Martha and Sam Hall. 2008. Transforming the District of Columbia's Public Homeless Assistance
System. Washington D.C.: Urban Institute.

70 Chapter 5: The Nationwide Capacity of Residential Programs for Homeless People
federal policy and funding behind local efforts to end homelessness through permanent supportive housing. Hundreds of city governments have responded by developing “10 year plans” that place a priority on expanding permanent supportive housing in their communities. HUD has also partnered with the Department of Veterans Affairs to administer jointly a new federal Veterans Affairs Supportive Housing (VASH) program. The HUD–VASH program combines rental assistance for homeless veterans with case management and clinical services provided by the Department of Veterans Affairs at its medical centers and in the community. As reported in Chapter 2, the number of persons who were chronically homeless decreased substantially from 2006 to 2009. During the same time period, over 42,000 permanent supportive housing beds were added to the nation’s inventory. These findings suggest that HUD’s efforts to move chronically homeless people off the streets or other places not meant for human habitation and into permanent housing are starting to pay off.
Changes in the Inventory of Beds for Homeless Subpopulations
The overall proportion of beds dedicated to homeless individuals and persons in families has remained fairly constant since 2006. The percentage of emergency shelter beds dedicated to homeless persons in families has increased slightly, from 46 to 48 percent, and also in transitional housing, from 52 to 53 percent (Exhibit 5-8). In contrast, the percentage of permanent supportive housing beds for families has decreased since 2006, from 44 percent to 40 percent in 2009, likely
214,425
207,589
211,451
206,877
211,222
199,709
211,205205,062
219,381
176,830
188,636 195,724
160,000
170,000
180,000
190,000
200,000
210,000
220,000
230,000
2006b 2007 2008 2009
Source: Homeless Management Information System data, 2007-2009
Exhibit 5-7: Change in the National Inventory of Homeless Residential Year-Round Beds, 2006-2009
Permanent Supportive Housing
Emergency Shelters
Transitional Housing

Chapter 5: The Nationwide Capacity of Residential Programs for Homeless People 71
reflecting the increased number of new units resulting from an emphasis on ending chronic homelessness through permanent supportive housing programs. By definition, all chronically homeless persons are individuals.
Changes in Average Daily Utilization and Turnover Rates
The average daily utilization rate for emergency housing in 2009 returned to the 2007 level of 88.5 percent after an increase in 2008. The utilization rate in transitional housing increased between 2007 and 2008 and maintained the higher rate in 2009 (82.4 percent). The bed turnover rate remained constant during this period for transitional housing, suggesting that the increased utilization rate is being driven by retaining the clients longer rather than serving more clients per bed over the year. Changes in bed utilization patterns varied depending on the geographic location of programs and beds. In emergency shelters, the utilization rate in principal cities increased by about five percentage points between 2007 and 2008, but decreased by about four percentage points in suburban and rural areas. By 2009, both types of geographic locations had nearly returned to the rate in 2007. In transitional housing, the utilization rate in principal cities increased steadily between 2007 and 2009, from 78.6 to 82.7 percent. The utilization rate in suburban or rural areas increased considerably from 2007 to 2008 (about 10 percentage points), and then stabilized in 2009, to 82 percent.
48%
53%
46%46%
47%
52% 53%
54%
40%
44%
38%39%
30%
40%
50%
60%
2006 2007 2008 2009
Exhibit 5-8: Change in the Percentage of Beds Dedicated to Persons in Families by Program Type, 2006-2009
Permanent Supportive Housing
Emergency Shelters
Transitional Housing

Exhibit 5-9: Average Daily Utilization and Turnover Rate of All Year-Round Equivalent Beds by Program and Household Type, 2007–2009 a
Total Principal City Suburban/Rural
Ratesb 2007 2008 2009 2007 2008 2009 2007 2008 2009 Average Daily Utilization Rate
Emergency Shelter 88.5% 91.0% 88.5% 87.6% 93.1% 87.9% 91.4% 85.8% 90.0%
Transitional Housing 76.9% 82.7% 82.4% 78.6% 81.8% 82.7% 73.7% 83.9% 82.0%Turnover Rate
Emergency Shelter 7.3 6.9 6.5 7.5 6.7 6.5 6.6 7.3 6.7
Transitional Housing 1.8 1.8 1.8 2.0 1.8 1.9 1.5 1.8 1.7 a The rates reported in the exhibit were based on year-round equivalent beds. A year-round equivalent bed is equal to the
total number of year-round beds plus the total number of seasonal beds in proportion to the amount of time these beds were available during the one-year reporting period.
b The exhibit provides two types of bed utilization rates—average daily bed utilization rates and bed turnover rates. The average daily bed utilization rate is calculated by dividing the average daily census during the study period by the total number of year-round beds in the current inventory and then converting it to a percentage. The turnover rate measures the number of persons served per available bed over the 12-month period. It is calculated by dividing the number of persons served by the number of year-round beds.
Source: Homeless Management Information System data, 2006 – 2009
5.5 Summary of the Nationwide Capacity of Residential Programs for Homeless People
The number of emergency shelter and transitional housing beds for serving homeless people increased by nearly 15,000 beds between 2006 and 2009. The added supply has not gone unused: almost 90 percent of emergency shelter beds are filled on an average night, as are about 82 percent of transitional housing beds. The number of permanent supportive housing beds for serving formerly homeless person has grown even more rapidly, increasing by 24 percent since 2006. There are now more permanent supportive housing beds than either emergency shelter or transitional housing beds. The bed inventory data reported by CoCs show that:
The 2009 national inventory of residential programs and year-round beds serving homeless and formerly homeless people included an estimated 20,065 residential programs and an estimated 643,423 beds.
The 2009 national bed inventory included 20,065 seasonal beds and 30,565 overflow or voucher beds. If these beds are added to the total number of year-round shelter beds in emergency shelters and transitional housing programs, the nation’s peak capacity for homeless persons in 2009 was 475,026 beds.
72 Chapter 5: The Nationwide Capacity of Residential Programs for Homeless People

Between 2006 and 2009, the total number of beds available in residential programs throughout the United States increased by approximately 60,000 (10 percent), reflecting an increase in beds across all program types.
The increase in permanent supportive housing beds (about 43,000) accounts for two-thirds of the increase in beds for homeless and formerly homeless people between 2006 and 2009.
Between 2008 and 2009, the average daily bed utilization rate remained constant in transitional housing 82 percent), but returned to the 2007 level in emergency shelters (89 percent).
Chapter 5: The Nationwide Capacity of Residential Programs for Homeless People 73

74 Chapter 5: The Nationwide Capacity of Residential Programs for Homeless People

Chapter 6 Looking Ahead
This report builds on last year’s report by adding data on sheltered homeless people for another full year, allowing for a comparative analysis of homelessness that spans three years—2007, 2008, and 2009. The inclusion of data for a third year is important because it marks the establishment of discernable trends in homelessness. This report is also the first to include information from in-person interviews with local service providers located in nine communities nationwide. The qualitative information provides a contextual backdrop for understanding how homelessness is changing throughout the nation. Finally, the report adds Point-in-Time (PIT) counts of sheltered and unsheltered persons and of homeless subpopulations for another year, providing trend data for 2006 through 2009. The trends observed in this AHAR reinforce some of the findings from previous reports. Homelessness remains predominately an urban phenomenon, and most people are homeless as individuals rather than as members of families. But trends reported in this 2009 AHAR also provide an indication of how homelessness may be changing over time and whether the current economic and foreclosure crisis has led to higher rates of homelessness. Overall, the number of sheltered homeless persons has remained relatively unchanged between 2007 and 2009, at about 1.6 million people over the course of each year, but the composition of the sheltered homeless population has shifted. During the three-year period, the number of sheltered persons in families increased by 13 percent, and families now represent more than one-third of the entire sheltered population, up from 29 percent in 2007. From 2007 to 2008, the share of the overall sheltered homeless population living in suburban and rural areas increased from 23 percent to 32 percent. From 2008 to 2009, even though the share of the sheltered homeless population in suburban and rural areas remained at 32 percent, the number of sheltered persons in families still increased by nearly 4 percent in suburban and rural areas. So far, both the PIT and HMIS-based estimates of homeless people do not suggest that the economic recession has created a surge in homelessness, but signs of the recession’s impact are present. The continued growth in sheltered family homelessness almost certainly reflects the ongoing effect of the recession. Also, because of the recession, more families with two adults may have become homeless, as well as more families with only a father present. But the long-term effects of the recession are unclear. Many families are doubling up in response to the economic downturn, and data in the 2009 AHAR reinforce this point. Between 2007 and 2008, as well as between 2008 and 2009, there was an increase in the share of people coming to shelters who were living with family or friends the night before entering a homeless residential facility. If some of these family support networks already are struggling to make ends meet, some of the doubled-up families may find their way into the homeless residential service system during 2010. On the other hand, as the nation comes out of the
Chapter 6: Looking Ahead 75

76 Chapter 6: Looking Ahead
recession, and as the stimulus funding made available through the Homelessness Prevention and Re-housing Program (HPRP) starts helping families in crisis avoid shelter, it also is possible that family homelessness will decline over the coming months. Thus, the fortunes of many families who were affected by the recession may still be in the balance. The 2009 AHAR is the first to include a companion report on homeless veterans, which will be published later in 2010. The report on homeless veterans comes at a time when many service men and women are returning from active duty in Iraq and being deployed to Afghanistan. This report will provide an important baseline understanding of homelessness among veterans that, in turn, can be used to assess how homelessness among veterans may change over time.
6.1 The 2010 AHAR
The 2010 AHAR will continue to provide Congress and the nation with updated counts of homelessness nationwide, including counts of individuals, persons in families, and special population groups such as chronically homeless people and persons with disabilities. These topics will be explored using data from an ever-expanding group of communities that participate in the AHAR, which now includes the majority of Continuums of Care nationwide. The 2010 AHAR also will add another full-year of HMIS data to further highlight trends in homelessness and identify any long-term impacts of the economic recession. The 2010 AHAR will be the first to include data on people served in permanent supportive housing programs, in addition to the data from emergency shelter and transitional housing programs that have constituted the first five AHARs. The slight decrease in the number of people using transitional housing programs in 2009 may have been a result of communities moving families directly from emergency shelters to permanent supportive housing. The 2010 AHAR will be able to assess this question, among many others, in a more nuanced fashion. The 2010 AHAR will also be the first to examine trends in homelessness among veterans, comparing the 2009 supplemental report on homeless veterans (to be released later in 2010) with the 2010 supplemental report. HUD continues to view the AHAR as the primary resource for up-to-date information about homelessness based on locally-derived HMIS data and is exploring ways to make these data readily accessible to states, localities, and the general public. Based on the AHAR, policymakers and practitioners alike will be able to better understand homelessness in their communities, allocate local homeless assistance funds effectively, improve program operations, and work toward the ultimate goal of ending homelessness.

Appendix A:
List of 2009 AHAR Sample Sites and Contributing Communities

CoC Code Continuum of Care Name AHAR Jurisidiction Name AHAR Site Type Participated in the AHAR? 1Emergency Shelters for
Families
Transitional Housing for
Families
Emergency Shelters for Individuals
Transitonal Hosing for Individuals
1 AK-501 Alaska Balance of State CoC Hoonah-Angoon Sample No Shelter Providers * * * *
2 AL-502 Florence/Northwest Alabama CoC
Lawrence County Sample No Shelter Providers * * * *
3 AZ-500 Arizona Balance of State CoC Flagstaff Sample Yes Yes Yes Yes Yes
4 AZ-502 Phoenix/Mesa/Maricopa County Regional CoC
Phoenix Sample Yes Yes Yes Yes Yes
5 CA-501 City and County of San Francisco
San Francisco Sample Yes Yes Yes Yes Yes
6 CA-506 Monterrey County Seaside Sample Yes Yes Yes Yes *7 CA-507 Marin County CoC Marin County Sample Yes Yes Yes Yes Yes
8 CA-510 Turlock/Modesto/Stanislaus County CoC
Modesto Sample No No No No No
9 CA-514 Fresno/Madera County CoC Fresno Sample Yes No Yes No Yes10 CA-600 County of Los Angeles Los Angeles Sample No No No No No11 CA-600 County of Los Angeles Los Angeles County Sample No No No No No12 CA-600 County of Los Angeles Pico Rivera Sample No Shelter Providers * * * *13 CA-601 City of San Diego San Diego Sample Yes Yes Yes Yes Yes14 CA-602 Orange County CoC Mission Viejo Sample No Shelter Providers * * * *15 CA-607 Pasadena CoC Pasadena Sample Yes No Yes No No16 CA-608 County of Riverside CoC Moreno Valley Sample No Shelter Providers * * * *17 CO-500 State of Colorado CoC Crowley County Sample No Shelter Providers * * * *
#
Sample Sites
Reporting Categories Used in the AHAR
Appendix A: List of 2009 AHAR Sample Sites and Contributing Communities A-1

CoC Code Continuum of Care Name AHAR Jurisidiction Name AHAR Site Type Participated in the AHAR? 1Emergency Shelters for
Families
Transitional Housing for
Families
Emergency Shelters for Individuals
Transitonal Hosing for Individuals
#
Reporting Categories Used in the AHAR
18 CO-500 Colorado Balance of State Saguache County Sample No Shelter Providers * * * *
19 CO-503 Metropolitan Denver Homeless Initiative
Adams County Sample Yes Yes Yes * *
20 CT-502 Hartford CoC Hartford Sample Yes Yes Yes Yes Yes21 CT-503 Bridgeport CoC Stratford Sample Yes * Yes * *22 DC-500 District of Columbia CoC Washington DC Sample Yes Yes Yes Yes Yes23 DE-500 Wilmington CoC Wilmington Sample Yes Yes No No Yes24 DE-500 Delaware Statewide Sussex County Sample Yes No Yes Yes No
25 FL-500 Sarasota, Bradenton, Manatee Counties CoC
Sarasota Sample Yes Yes No Yes *
26 FL-516 Winterhaven/Polk County CoC Polk County Sample Yes * Yes * Yes
27 FL-504 Daytona Beach/Daytona/Volusia, Flagler Counties CoC
Deltona Sample No Shelter Providers * * * *
28 FL-514 Ocala/Marion County Marion County Sample No No No No No
29 GA-500 Atlanta/Roswell/DeKalb, Fulton Counties CoC
Atlanta Sample Yes No No No Yes
30 GA-501 Georgia Balance of State Macon County Sample No Shelter Providers * * * *31 GA-501 Georgia Balance of State Oconee County Sample No Shelter Providers * * * *32 GA-501 Georgia Balance of State Putnam County Sample No Shelter Providers * * * *33 GA-501 Georgia Balance of State Seminole County Sample No Shelter Providers * * * *34 GA-504 Augusta CoC Augusta-Richmond Sample Yes No Yes No No
Sample Sites
Appendix A: List of 2009 AHAR Sample Sites and Contributing Communities A-2

CoC Code Continuum of Care Name AHAR Jurisidiction Name AHAR Site Type Participated in the AHAR? 1Emergency Shelters for
Families
Transitional Housing for
Families
Emergency Shelters for Individuals
Transitonal Hosing for Individuals
#
Reporting Categories Used in the AHAR
35 IA-501 Iowa Balance of State CoC Monona County Sample No Shelter Providers * * * *36 ID-501 Idaho Balance of State CoC Oneida County Sample No Shelter Providers * * * *37 IL-510 Chicago CoC Chicago Sample Yes No No No Yes38 IL-511 Cook County CoC Cook County Sample Yes Yes Yes Yes Yes39 IL-513 Springfield CoC Sangamon County Sample No Shelter Providers * * * *
40 KS-507 Kansas Balance of State CoC Barton County Sample No No * No No
41 KY-500 Kentucky Balance of State CoC Hardin County Sample Yes * * * Yes
42 LA-502 Shreveport/Bossier/Northwest CoC
Bossier City Sample Yes * Yes * Yes
43 LA-506 Slidell/Southeast Louisiana CoC Slidell Sample Yes Yes Yes Yes *
44 LA-506 Slidell/Southeast Louisiana CoC St. Tammany Parish Sample Yes * * * Yes
45 MA-500 Boston CoC Boston Sample Yes No No No Yes46 MA-512 Lawrence CoC Lawrence Sample Yes No No No Yes
47 MA-519 Attleboro/Taunton/Bristol County CoC
Attleboro Sample Yes Yes Yes Yes Yes
48 MD-601 Montgomery County CoC Montgomery County Sample Yes Yes Yes Yes Yes49 ME-500 Maine Balance of State CoC York County Sample Yes No Yes Yes Yes
50 MI-500 Michigan Balance of State CoC Delta County Sample Yes Yes * Yes Yes
Sample Sites
Appendix A: List of 2009 AHAR Sample Sites and Contributing Communities A-3

CoC Code Continuum of Care Name AHAR Jurisidiction Name AHAR Site Type Participated in the AHAR? 1Emergency Shelters for
Families
Transitional Housing for
Families
Emergency Shelters for Individuals
Transitonal Hosing for Individuals
#
Reporting Categories Used in the AHAR
51 MI-500 Michigan Balance of State CoC Berrien County Sample No * * * No
52 MI-501 City of Detroit CoC Detroit Sample Yes Yes Yes Yes Yes53 MI-503 Macomb County CoC Macomb County Sample Yes Yes Yes Yes Yes
54 MI-504 Pontiac/Royal Oak/Oakland County CoC
Farmington Hills Sample No Shelter Providers * * * *
55 MI-508 Lansing/East Lansing/Ingham County CoC
Lansing Sample Yes Yes Yes Yes Yes
56 MI-509 Washtenaw County CoC Washtenaw County Sample Yes Yes Yes * Yes
57 MN-500 Minneapolis/Hennepin County CoC
Hennepin County Sample Yes Yes Yes * *
58 MN-501 St. Paul/Ramsey County CoC St. Paul Sample Yes Yes Yes * Yes
59 MN-502 Rochester/Southeast Minnesota CoC
Rochester Sample Yes Yes Yes No Yes
60 MN-506 Northwest Minnesota CoC Norman County Sample No No * * *61 MN-508 West Central Minnesota CoC Moorhead Sample Yes Yes Yes Yes Yes62 MN-512 Washington County CoC Washington County Sample Yes Yes Yes * Yes
63 MS-501 Mississippi Balance of State CoC
Hattiesburg Sample No No * No No
64 MS-501 Mississippi Balance of State CoC
Humphreys County Sample No Shelter Providers * * * *
65 MS-501 Mississippi Balance of State Sunflower County Sample No Shelter Providers * * * *66 MT-500 State of Montana CoC Billings Sample No No No No No67 MT-500 State of Montana CoC Great Falls Sample No No No No No
Sample Sites
Appendix A: List of 2009 AHAR Sample Sites and Contributing Communities A-4

CoC Code Continuum of Care Name AHAR Jurisidiction Name AHAR Site Type Participated in the AHAR? 1Emergency Shelters for
Families
Transitional Housing for
Families
Emergency Shelters for Individuals
Transitonal Hosing for Individuals
#
Reporting Categories Used in the AHAR
68 NE-501 City of Omaha Council Bluffs Sample Yes Yes Yes Yes Yes69 NE-501 Omaha/Council Bluffs Douglas County Sample No Shelter Providers * * * *70 NJ-501 Bergen County Bergen County Sample Yes Yes Yes Yes Yes71 NJ-503 Camden City/Camden County Camden Sample Yes Yes No Yes Yes72 NJ-510 Ocean County CoC Brick Township Sample Yes * Yes * Yes73 NV-500 Southern Nevada CoC Clark County Sample No No No No No74 NY-501 Chemung County CoC Elmira Sample Yes Yes * Yes Yes75 NY-505 Syracuse County CoC Onondaga County Sample Yes * * * Yes76 NY-512 Troy/ Rensselear County Rensselaer County Sample Yes Yes * Yes *77 NY-509 Allegany County Allegany County Sample Yes No * No Yes78 NY-600 New York City Coalition/CoC New York City Sample Yes Yes Yes Yes Yes
79 NY-603 Nassau/Suffolk Coalition for the Homeless
Islip Town Sample Yes Yes * * No
80 OH-502 Cleveland/Cuyahoga County/Cleveland CoC
Cleveland Sample Yes Yes Yes Yes Yes
81 OH-507 Lancaster/Ohio Balance of State
Lancaster Sample No No No No *
82 OH-507 Springfield/Ohio Balance of State
Springfield Sample Yes No Yes No No
83 OH-507 Putnam/Ohio Balance of State Putnam County Sample No Shelter Providers * * * *84 OK-500 North Central Oklahoma Pawnee County Sample Yes Yes * Yes *
Sample Sites
Appendix A: List of 2009 AHAR Sample Sites and Contributing Communities A-5

CoC Code Continuum of Care Name AHAR Jurisidiction Name AHAR Site Type Participated in the AHAR? 1Emergency Shelters for
Families
Transitional Housing for
Families
Emergency Shelters for Individuals
Transitonal Hosing for Individuals
#
Reporting Categories Used in the AHAR
85 OK-503 Oklahoma Balance of State CoC
Midwest City Sample No Shelter Providers * * * *
86 PA-500 Philadelphia CoC Philadelphia Sample Yes Yes Yes Yes Yes
87 PA-507 Altoona/Central Pennsylvania CoC
Lycoming County Sample Yes * * * Yes
88 PA-507 Altoona/Central Pennsylvania CoC
Snyder County Sample Yes * Yes No No
89 PA-601 Southwest PA Westmoreland County Sample Yes Yes Yes Yes *90 SD-500 South Dakota Hamlin County Sample No Shelter Providers * * * *
91 TX-600 Dallas City & County/Irving CoC Dallas Sample No No No No No
92 TX-700 Houston/Harris County CoC Houston Sample Yes No Yes No Yes93 TX-603 El Paso CoC El Paso Sample Yes Yes Yes Yes Yes
94 VA-500 Richmond/Henrico, Chesterfield, Hanover Counties CoC
Chesterfield County Sample No * No * No
95 VA-507 Portsmouth CoC Portsmouth Sample Yes Yes Yes Yes Yes96 VT-501 Chittenden County Chittenden County Sample No Shelter Providers * * * *97 WA-500 Seattle-King County CoC Seattle Sample Yes Yes No No Yes
98 WA-501 Washington Balance of State CoC
Skagit County Sample No Shelter Providers * * * *
99 WA-501 Washington Balance of State CoC
Franklin County Sample No Shelter Providers * * * *
100 WA-501 Washington Balance of State CoC
Adams County Sample No Shelter Providers * * * *
101 WA-507 Yakima City and County Yakima Sample Yes No Yes No No
102 WI-500 Forest County/State of Wisconsin CoC
Forest County Sample Yes * Yes Yes *
Sample Sites
Appendix A: List of 2009 AHAR Sample Sites and Contributing Communities A-6

CoC Code Continuum of Care Name AHAR Jurisidiction Name AHAR Site Type Participated in the AHAR? 1Emergency Shelters for
Families
Transitional Housing for
Families
Emergency Shelters for Individuals
Transitonal Hosing for Individuals
#
Reporting Categories Used in the AHAR
103 AK-500 Anchorage CoC Anchorage Contributing Yes Yes No Yes Yes
104 AL-500 'Birmingham/Jefferson, St. Clair, Shelby Counties CoC
Metropolitan Birmingham Contributing Yes Yes Yes Yes No
105 AL-501 Mobile City & County/Baldwin County CoC
Mobile Contributing Yes Yes Yes Yes Yes
106 AL-504 Montgomery City & County CoC Montgomery Contributing Yes No Yes No No
107 AR-500 Little Rock/Central Arkansas CoC
Little Rock CoC Contributing Yes Yes No Yes Yes
108 AR-501 Fayetteville/Northwest Arkansas CoC
Fayetteville/Northwest Arkansas CoC
Contributing Yes Yes Yes Yes Yes
109 AR-505 Southeast Arkansas Southeast Arkansas Contributing Yes Yes * Yes *
110 AR-506 Johnson, Pope, Yell Counties CoC
Arkansas Balance of State Contributing Yes No * Yes *
111 AZ-501 Tucson/Pima County Tucson/Pima County Contributing Yes No Yes No Yes
112 AZ-502 Phoenix/Mesa/Maricopa County Regional CoC
Maricopa County Contributing Yes Yes Yes Yes Yes
113 CA-500 San Jose/Santa Clara City & County CoC
Santa Clara County Contributing Yes Yes Yes Yes Yes
114 CA-504 Santa Rosa/Petaluma/Sonoma County
Sonoma County Contributing Yes Yes Yes Yes Yes
115 CA-505 Richmond/Contra Costa County CoC
Contra Costa County Contributing Yes Yes Yes Yes Yes
116 CA-506 Salinas/Monterey County CoC Monterey County Contributing Yes No No No Yes
117 CA-512 San Mateo County San Mateo County Contributing Yes Yes Yes Yes Yes
118 CA-513 Visalia, Kings, Tulare Counties CoC
Kings/Tulare Contributing Yes No Yes No No
119 CA-519 Chico/Paradise/Butte County CoC
Butte County Contributing Yes Yes Yes Yes No
Contributing Communities
Appendix A: List of 2009 AHAR Sample Sites and Contributing Communities A-7

CoC Code Continuum of Care Name AHAR Jurisidiction Name AHAR Site Type Participated in the AHAR? 1Emergency Shelters for
Families
Transitional Housing for
Families
Emergency Shelters for Individuals
Transitonal Hosing for Individuals
#
Reporting Categories Used in the AHAR
120 CA-609 San Bernardino County San Bernardino County Contributing Yes Yes Yes Yes Yes121 CA-610 San Diego County San Diego County Contributing Yes Yes Yes Yes Yes122 CA-612 Glendale CoC City of Glendale Contributing Yes Yes Yes Yes *
123 CO-504 Colorado Springs/El Paso County CoC
Colorado Springs/El Paso County
Contributing Yes Yes Yes Yes No
124 CT-503 Greater Bridgeport Bridgeport Contributing Yes Yes Yes Yes Yes125 CT-505 Connecticut Balance of State Connecticut Balance of State Contributing Yes No * Yes No126 CT-506 Greater Norwalk Area Greater Norwalk Area Contributing Yes Yes * Yes *127 CT-507 New London New London Contributing Yes Yes Yes Yes Yes128 CT-508 Stamford/Greenwich CoC Stamford Contributing Yes Yes Yes Yes Yes129 CT-509 New Britain CoC New Britain Contributing Yes No * No Yes130 CT-510 Bristol CoC Bristol Contributing Yes Yes Yes Yes Yes131 FL-501 Tampa/Hillsborough County Tampa/Hillsborough County Contributing Yes Yes No Yes No
132 FL-502 St. Petersburg/Clearwater/Largo/Pinellas County CoC
Pinellas Contributing Yes No No Yes No
133 FL-503 Lakeland CoC Lakeland Contributing Yes Yes Yes Yes Yes
134 FL-504 Daytona Beach/Daytona/Volusia, Flagler Counties CoC
Daytona Beach/Daytona/Volusia/Flagler County
Contributing Yes * Yes Yes No
135 FL-506 Tallahassee/Leon County CoC Tallahassee/Leon Contributing Yes Yes Yes No Yes
136 FL-507 Orlando/Orange/Osceola/SeminoleCounty
Orlando/Orange/Osceola/SeminoleCounty
Contributing Yes Yes Yes No Yes
137 FL-509 Fort Pierce/St. Lucie, Indian River, Martin Counties CoC
Ft.Pierce/Saint Lucie/Indian River County
Contributing Yes No Yes No No
Contributing Communities
Appendix A: List of 2009 AHAR Sample Sites and Contributing Communities A-8

CoC Code Continuum of Care Name AHAR Jurisidiction Name AHAR Site Type Participated in the AHAR? 1Emergency Shelters for
Families
Transitional Housing for
Families
Emergency Shelters for Individuals
Transitonal Hosing for Individuals
#
Reporting Categories Used in the AHAR
138 FL-511 Pensacola/Escambia/Santa Rosa County
Pensacola/Escambia/Santa Rosa County
Contributing Yes No Yes No No
139 FL-512 St Johns County St Johns County Contributing Yes * Yes No *
140 FL-520 Citrus, Hernando, Lake, Sumter Counties CoC
Citrus, Hernando, Lake, Sumter Counties
Contributing Yes * No No Yes
141 FL-603 Ft Myers/Cape Coral/Lee County CoC
Lee County Contributing Yes Yes No Yes Yes
142 GA-500 Atlanta/Roswell/DeKalb, Fulton Counties CoC
Atlanta Suburban (Fulton-DeKalb Counties)
Contributing Yes No Yes * No
143 GA-501 Georgia Balance of State Georgia Balance of State Contributing Yes No Yes No Yes144 GA-503 Athens/Clark County Athens/Clark County Contributing Yes Yes Yes No No145 GA-505 Columbus/Muscogee Columbus/Muscogee Contributing Yes No * No Yes146 GA-506 Cobb Cobb Contributing Yes Yes Yes Yes Yes147 GA-507 Savanah/Chatham Savanah/Chatham Contributing Yes Yes Yes Yes Yes148 GU-500 Guam Guam Contributing Yes Yes Yes Yes No149 HI-500 Hawaii Balance of State CoC Hawaii State Contributing Yes Yes Yes No Yes150 HI-501 Honolulu CoC Honolulu CoC Contributing Yes Yes Yes Yes Yes
151 IA-500 Sioux City/Dakota, Woodbury Counties CoC
SiouxCity/Dakota County Contributing Yes No Yes No Yes
152 IA-501 Iowa Balance of State CoC* Iowa CoC* Contributing Yes Yes Yes Yes Yes153 IA-502 Des Moines/Polk County Des Moines Contributing Yes Yes Yes Yes Yes154 ID-500 Boise/Ada County CoC Boise City Contributing Yes No Yes No Yes155 ID-501 Idaho Balance of State CoC Idaho Balance of State Contributing Yes Yes Yes Yes Yes
Contributing Communities
Appendix A: List of 2009 AHAR Sample Sites and Contributing Communities A-9

CoC Code Continuum of Care Name AHAR Jurisidiction Name AHAR Site Type Participated in the AHAR? 1Emergency Shelters for
Families
Transitional Housing for
Families
Emergency Shelters for Individuals
Transitonal Hosing for Individuals
#
Reporting Categories Used in the AHAR
156 IL-502 North Chicago/Lake County CoC
Waukegan/N.Chicago/Lake County
Contributing Yes No Yes No No
157 IL-504 Madison County Madison County Contributing Yes Yes Yes Yes Yes158 IL-505 Evanston CoC Evanston CoC Contributing Yes No Yes No Yes
159 IL-506 Joliet/Bolingbrook/WillCounty Joliet/Bolingbrook/WillCounty Contributing Yes Yes No Yes Yes
160 IL-508 E. St.Louis/Belleville/Saint Clair County
E. St.Louis/Belleville/Saint Clair County
Contributing Yes No Yes No No
161 IL-509 City of Dekalb CoC City of Dekalb CoC Contributing Yes No Yes No *162 IL-512 Central Illinois Central Illinois Contributing Yes Yes Yes Yes Yes163 IL-513 Springfield/Sangamon County Springfield/Sangamon County Contributing Yes Yes Yes Yes Yes164 IL-514 DuPage County DuPageCounty Contributing Yes Yes Yes Yes Yes165 IL-517 Kane County Kane County Contributing Yes No Yes Yes Yes166 IL-520 Southern Illinois Southern Illinois Contributing Yes Yes Yes Yes Yes
167 IN-500 St. Joseph County CoC St. Joseph County/South Bend Contributing Yes No No No Yes
168 IN-502 Indiana Balance of State CoC State of Indiana Contributing Yes No Yes No Yes
169 KS-505 Overland Park/Johnson County CoC
Johnson County Contributing Yes Yes Yes No No
170 KS-507 Kansas Balance of State Kansas Balance of State Contributing Yes Yes No No No
171 KY-500 Kentucky Balance of State Commonwealth of Kentucky/Balance of State
Contributing Yes Yes No Yes Yes
172 KY-501 Louisville/Jefferson County Louisville/Jefferson County Contributing Yes Yes Yes No Yes173 LA-500 Lafayette/Acadiana CoC Acadiana Contributing Yes Yes Yes Yes Yes
Contributing Communities
Appendix A: List of 2009 AHAR Sample Sites and Contributing Communities A-10

CoC Code Continuum of Care Name AHAR Jurisidiction Name AHAR Site Type Participated in the AHAR? 1Emergency Shelters for
Families
Transitional Housing for
Families
Emergency Shelters for Individuals
Transitonal Hosing for Individuals
#
Reporting Categories Used in the AHAR
174 LA-503 New Orleans/Jefferson Parish New Orleans/Jefferson Parish Contributing Yes No Yes No Yes
175 LA-504 Baton Rouge CoC Baton Rouge Contributing Yes Yes Yes Yes Yes
176 LA-505 Monroe/Northeast Louisiana CoC
Northeast Louisiana Contributing Yes No Yes No No
177 LA-508 Houma-Terrebonne/Thibodaux CoC
Houma/Terrebonne Contributing Yes No Yes No No
178 MA-503 Cape Cod/Islands CoC Cape Cod/Islands Contributing Yes Yes Yes Yes No
179 MA-506 Worcester City & County CoC Worcester County Area Contributing Yes Yes Yes No Yes
180 MA-508 Lowell CoC City of Lowell Contributing Yes Yes Yes Yes Yes181 MA-509 Cambridge CoC Cambridge CoC Contributing Yes Yes Yes Yes Yes182 MA-511 Quincy/Weymouth Quincy/Weymouth Contributing Yes Yes No Yes No183 MA-515 City of Fall River City of Fall River Contributing Yes Yes Yes Yes Yes
184 MA-516 Massachusetts Balance of State
MassachusettsBalance of State Contributing Yes No Yes No No
185 MA-518 Brookline/Newton CoC Brookline/Newton Contributing Yes No Yes No No
186 MA-520 Brockton/Plymouth City & County CoC
Brockton/Plymouth Contributing Yes Yes Yes Yes No
187 MD-501 Baltimore City CoC* Baltimore City CoC* Contributing Yes Yes Yes No Yes188 MD-503 Anne Arundel County Anne Arundel County Contributing Yes Yes Yes Yes Yes189 MD-504 Howard County Howard County Contributing Yes Yes Yes Yes *190 MD-505 Baltimore County CoC Baltimore County CoC Contributing Yes No Yes No No191 MD-506 Carroll County Carroll County Contributing Yes Yes * Yes No
Contributing Communities
Appendix A: List of 2009 AHAR Sample Sites and Contributing Communities A-11

CoC Code Continuum of Care Name AHAR Jurisidiction Name AHAR Site Type Participated in the AHAR? 1Emergency Shelters for
Families
Transitional Housing for
Families
Emergency Shelters for Individuals
Transitonal Hosing for Individuals
#
Reporting Categories Used in the AHAR
192 MD-508 Charles, Calvert, St.Mary's Counties CoC
Charles/Calvert/St. Mary`s County
Contributing Yes No No No Yes
193 MD-509 Frederick City/County Frederick City/County Contributing Yes * Yes No No194 MD-511 Mid-Shore Regional Mid-Shore Regional Contributing Yes No Yes No Yes
195 MD-513 Wicomico/Somerset/Worcester County
Wicomico/Somerset/Worcester County
Contributing Yes No Yes No Yes
196 MD-600 Prince George`s County/Maryland
Prince George`s County/Maryland
Contributing Yes Yes Yes Yes Yes
197 ME-500 Maine Balance of State CoC Statewide CoC Contributing Yes No Yes No No198 ME-501 Greater Penobscot/Bangor Greater Penobscot/Bangor Contributing Yes No No Yes No199 ME-502 Portland CoC Portland (ME) Contributing Yes No Yes No No200 MI-500 Michigan Balance of State Michigan Balance of State Contributing Yes Yes * Yes *
201 MI-502 Dearborn/Dearborn Heights/Westland/Wayne County CoC
Out-Wayne Cty Contributing Yes Yes Yes No Yes
202 MI-503 St. Clair Shores/Warren/Macomb County
Macomb County (C) Contributing Yes Yes Yes Yes Yes
203 MI-504 Pontiac/Royal Oak/Oakland County CoC
Oakland County Contributing Yes Yes Yes Yes Yes
204 MI-505 Flint/Genessee County CoC Flint/Genessee County (MI) Contributing Yes No Yes No Yes
205 MI-506 Grand Rapids/Wyoming/Kent County
Grand Rapids CoC* Contributing Yes No Yes No No
206 MI-507 Portage/Kalamazoo City & County
Kalamazoo Contributing Yes No Yes No Yes
207 MI-508 Lansing/Ingham County CoC Lansing/E Lansing/Ingham County CoC
Contributing Yes Yes * Yes Yes208 MI-510 Saginaw County Saginaw County Contributing Yes Yes Yes Yes Yes209 MI-511 Lenawee County Lenawee County Contributing Yes Yes Yes Yes Yes
Contributing Communities
Appendix A: List of 2009 AHAR Sample Sites and Contributing Communities A-12

CoC Code Continuum of Care Name AHAR Jurisidiction Name AHAR Site Type Participated in the AHAR? 1Emergency Shelters for
Families
Transitional Housing for
Families
Emergency Shelters for Individuals
Transitonal Hosing for Individuals
#
Reporting Categories Used in the AHAR
210 MI-512 Grand Traverse/Antrim, Leelanau Counties
Traverse City/Antrim/Leelanau County
Contributing Yes Yes Yes Yes No
211 MI-514 Battle Creek/Calhoun County Battle Creek/Calhoun County Contributing Yes Yes Yes Yes Yes212 MI-516 Muskegon City and County Muskegon City and County Contributing Yes No Yes No Yes213 MI-517 JacksonCity/County JacksonCity/County Contributing Yes Yes Yes Yes No214 MI-518 Livingston County Livingston County Contributing Yes No Yes Yes Yes215 MI-519 Holland/Ottawa County Holland/Ottawa County Contributing Yes Yes Yes Yes Yes216 MI-523 Eaton County Eaton County Contributing Yes Yes Yes Yes Yes217 MN-500 Minneapolis/Hennepin County Minneapolis/Hennepin County Contributing Yes No Yes No Yes218 MN-501 St. Paul/Ramsey County St. Paul/Ramsey County Contributing Yes Yes Yes * *
219 MN-502 Rochester/Southeast Minnesota CoC
Southeast Minnesota Contributing Yes Yes Yes Yes Yes
220 MN-503 Dakota County Dakota/Anoka County Contributing Yes Yes Yes Yes Yes221 MN-504 Northeast Minnesota CoC Northeast Minnesota Contributing Yes Yes Yes Yes Yes222 MN-505 St Cloud Central Minnesota Central Minnesota Contributing Yes Yes Yes Yes *223 MN-506 Northwest Minnesota Northwest Minnesota Contributing Yes Yes Yes Yes Yes
224 MN-508 Moorehead/West Central Minnesota
West Central Minnesota Contributing Yes * Yes * Yes
225 MN-509 Duluth/St. Louis County Duluth/St. Louis County Contributing Yes Yes Yes Yes Yes
226 MN-510 Scott, Carver Counties Scott/Carver/Washington Counties
Contributing Yes Yes Yes Yes Yes
227 MN-511 Southwest Minnesota Southwest Minnesota Contributing Yes Yes Yes Yes Yes
Contributing Communities
Appendix A: List of 2009 AHAR Sample Sites and Contributing Communities A-13

CoC Code Continuum of Care Name AHAR Jurisidiction Name AHAR Site Type Participated in the AHAR? 1Emergency Shelters for
Families
Transitional Housing for
Families
Emergency Shelters for Individuals
Transitonal Hosing for Individuals
#
Reporting Categories Used in the AHAR
228 MO-500 St. Louis County CoC* St. Louis County Contributing Yes Yes Yes Yes Yes229 MO-501 City of St.Louis City of St.Louis Contributing Yes Yes Yes Yes No230 MO-600 Greater Springfield Greater Springfield Contributing Yes Yes Yes No No231 MO-602 Jasper/Newton County Jasper/Newton County Contributing Yes No Yes No Yes
232 MO-603 St. Joseph/Andrew, Buchanan, DeKalb Counties CoC
Greater St.Joseph Contributing Yes No No Yes No
233 MO-604 Kansas City/Independence/ Lee's Summit/Jackson County CoC
Kansas City/Jackson County Contributing Yes Yes Yes Yes No
234 MO-606 Missouri Balance of State Missouri Balance of State Contributing Yes No No No Yes235 MS-500 Jackson/Hinds County Jackson/Hinds County Contributing Yes No No Yes No236 MS-503 Gulf Port/Gulf Coast Regional Gulf Port/Gulf Coast Regional Contributing Yes No Yes No Yes237 MT-500 Montana Montana Contributing Yes No Yes No No238 NC-501 Asheville-Buncombe Asheville-Buncombe Contributing Yes No * No Yes239 NC-504 Greensboro Greensboro Contributing Yes Yes Yes Yes Yes240 NC-505 Charlotte-Mecklenberg Charlotte-Mecklenberg Contributing Yes Yes Yes Yes Yes241 NC-506 Wilmington Tri-County Wilmington Tri-County Contributing Yes Yes No Yes Yes
242 NC-508 Anson/Moore/Montgomery/Richmond
North Carolina Balance of State Contributing Yes No Yes No No
243 NC-509 Gaston/Lincoln/Cleveland Gaston/Lincoln/Cleveland Contributing Yes No No Yes No244 NC-516 Northwest NC Northwest NC Contributing Yes Yes Yes Yes Yes245 ND-500 North Dakota Statewide CoC North Dakota Contributing Yes Yes Yes Yes Yes
Contributing Communities
Appendix A: List of 2009 AHAR Sample Sites and Contributing Communities A-14

CoC Code Continuum of Care Name AHAR Jurisidiction Name AHAR Site Type Participated in the AHAR? 1Emergency Shelters for
Families
Transitional Housing for
Families
Emergency Shelters for Individuals
Transitonal Hosing for Individuals
#
Reporting Categories Used in the AHAR
246 NE-500 North Central Nebraska/Heartland
North Central Nebraska/Heartland
Contributing Yes * Yes No Yes
247 NE-501 Omaha/Council Bluffs CoC Omaha Area Contributing Yes Yes Yes Yes Yes248 NE-502 Lincoln CoC Lincoln Contributing Yes Yes No Yes Yes249 NE-503 Southwest Nebraska Southwest Nebraska Contributing Yes * Yes Yes No250 NE-504 Southeast Nebraska Southeast Nebraska Contributing Yes No Yes No No251 NE-505 Panhandle of Nebraska Panhandle of Nebraska Contributing Yes * No No Yes252 NH-500 New Hampshire BOS New Hampshire BOS Contributing Yes No Yes No Yes253 NH-501 Manchester CoC City of Manchester Contributing Yes No Yes Yes Yes254 NH-502 Greater Nashua CoC Greater Nashua CoC Contributing Yes Yes Yes Yes Yes255 NJ-502 Burlington County Burlington County Contributing Yes Yes No Yes No256 NJ-504 Essex County Essex County Contributing Yes No No No Yes257 NJ-505 Gloucester County Gloucester County Contributing Yes Yes No Yes Yes
258 NJ-506 Jersey City/Bayonne/Hudson County CoC
Jersey City/Hudson County Contributing Yes Yes Yes Yes Yes
259 NJ-507 New Brunswick/Middlesex County CoC
Middlesex County Contributing Yes Yes Yes Yes Yes
260 NJ-508 Monmouth County Monmouth County Contributing Yes Yes Yes Yes *261 NJ-510 Ocean County Ocean County Contributing Yes No * No Yes262 NJ-511 Passiac County Passiac County Contributing Yes Yes No No No263 NJ-512 Salem County Salem County Contributing Yes * Yes * Yes
Contributing Communities
Appendix A: List of 2009 AHAR Sample Sites and Contributing Communities A-15

CoC Code Continuum of Care Name AHAR Jurisidiction Name AHAR Site Type Participated in the AHAR? 1Emergency Shelters for
Families
Transitional Housing for
Families
Emergency Shelters for Individuals
Transitonal Hosing for Individuals
#
Reporting Categories Used in the AHAR
264 NJ-513 Somerset County Somerset County Contributing Yes No No Yes Yes
265 NJ-514 City of Trenton/Mercer County City of Trenton/Mercer County Contributing Yes Yes Yes Yes Yes
266 NJ-515 Union County Union County Contributing Yes No No No Yes267 NJ-520 Cumberland County Cumberland County Contributing Yes Yes Yes Yes *
268 NV-501 Reno/Sparks/Washoe County CoC
Washoe/Reno Alliance Contributing Yes No No Yes No
269 NY-500 Rochester/Irondequoit/Greece/Monroe County CoC
Rochester/Monroe County Contributing Yes Yes Yes Yes Yes
270 NY-503 Albany City & County CoC City/Countyof Albany Contributing Yes Yes Yes Yes Yes
271 NY-507 Schenectady City & County CoC
City/Countyof Schenectady Contributing Yes No Yes Yes No
272 NY-508 Buffalo/Erie County Buffalo/ErieCounty Contributing Yes No No Yes No273 NY-510 Tompkins County Tompkins County Contributing Yes Yes Yes Yes No
274 NY-511 Binghamton/Union Town/Broome County CoC
BroomeCounty/City of Binghamton
Contributing Yes No No Yes No
275 NY-512 City of Troy and Rensselaer City of Troy Contributing Yes No No Yes No276 NY-518 Utica-Oneida County Utica-Oneida County Contributing Yes No Yes No No
277 NY-523 Glen Falls/Saratoga Springs/Saratoga County CoC
Saratoga Contributing Yes Yes * Yes No
278 NY-601 Poughkeepsie/Dutchess County
Dutchess County Contributing Yes Yes Yes Yes Yes
279 NY-603 Islip/Babylon/Huntington/Suffolk County
Babylon/Huntington/Suffolk County
Contributing Yes No Yes No No
280 NY-608 Ulster County Ulster County Contributing Yes Yes Yes Yes Yes
281 OH-500 Cincinnati-Hamilton County CoC*
Cincinnati-Hamilton County CoC*
Contributing Yes Yes Yes Yes Yes
Contributing Communities
Appendix A: List of 2009 AHAR Sample Sites and Contributing Communities A-16

CoC Code Continuum of Care Name AHAR Jurisidiction Name AHAR Site Type Participated in the AHAR? 1Emergency Shelters for
Families
Transitional Housing for
Families
Emergency Shelters for Individuals
Transitonal Hosing for Individuals
#
Reporting Categories Used in the AHAR
282 OH-501 Greater Toledo Greater Toledo Contributing Yes Yes Yes Yes Yes283 OH-503 Columbus/Franklin County Columbus/Franklin County Contributing Yes Yes Yes Yes Yes
284 OH-504 Youngstown/Mahoning County CoC
Youngstown/Mahoning County CoC
Contributing Yes No No No Yes
285 OH-505 Dayton/Kettering/MontgomeryCounty
Dayton/Kettering/MontgomeryCounty
Contributing Yes Yes Yes Yes Yes
286 OH-506 Akron/Baberton/Summit County Akron/Baberton/Summit County Contributing Yes No Yes No No
287 OK-501 Tulsa CoC Tulsa CoC Contributing Yes Yes No Yes No288 OK-502 Oklahoma City Oklahoma City Contributing Yes No No No Yes289 OR-500 Lane County Lane County Contributing Yes Yes Yes No Yes
290 OR-501 Portland-Grasham-Multnomah County CoC
Portland-Gresham-Multnomah County CoC
Contributing Yes Yes No Yes No
291 OR-503 Central Oregon Central Oregon Contributing Yes No Yes No No292 OR-505 Rural Oregon Rural Oregon Contributing Yes No Yes No No293 OR-506 Washington County, OR Washington County, OR Contributing Yes Yes Yes No Yes294 OR-507 Clackamas County Clackamas County Contributing Yes Yes Yes * Yes
295 PA-502 Upper Darby/Chester/Haverford/Delaware County CoC
Delaware County Contributing Yes Yes Yes Yes No
296 PA-503 Wilkes-Barre/Hazleton/Luzerne County CoC
Luzerne County Contributing Yes Yes Yes Yes Yes
297 PA-504 Lower Marion/Norristown/Abington/Montgomery County CoC
Montgomery County PA Contributing Yes No No Yes No
298 PA-505 Chester County Chester County Contributing Yes No No Yes No299 PA-506 Reading/Berks County Reading/Berks County Contributing Yes No No Yes Yes
Contributing Communities
Appendix A: List of 2009 AHAR Sample Sites and Contributing Communities A-17

CoC Code Continuum of Care Name AHAR Jurisidiction Name AHAR Site Type Participated in the AHAR? 1Emergency Shelters for
Families
Transitional Housing for
Families
Emergency Shelters for Individuals
Transitonal Hosing for Individuals
#
Reporting Categories Used in the AHAR
300 PA-508 Scranton/Lackawana PA Scranton/Lackawana PA Contributing Yes Yes Yes Yes Yes301 PA-510 Lancaster City/County Lancaster City/County Contributing Yes Yes Yes Yes Yes302 PA-511 Bucks County Bucks County Contributing Yes Yes No No No
303 PA-600 Pittsburgh/McKeesport/Penn Hills/Allegheny County CoC
Allegheny County/Pittsburg Contributing Yes No Yes No Yes
304 PA-601 Southwest Pennsylvania Southwest Region of PA Contributing Yes No No No Yes305 PA-602 Northwest Pennsylvania Northwest Region of PA Contributing Yes No Yes No No306 PA-603 Beaver County Beaver County Contributing Yes Yes Yes * Yes307 PA-605 Erie City & County CoC* Erie County CoC* Contributing Yes No Yes Yes No308 RI-500 Rhode Island CoC Rhode Island Contributing Yes Yes Yes Yes Yes
309 SC-501 Greenville/Anderson/Spartanburg Upstate CoC
Upstate CoC Contributing Yes Yes Yes No *
310 SC-502 Columbia/Midlands CoC Midlands Contributing Yes Yes Yes Yes Yes311 SC-503 Myrtle Beach/Sumter County Myrtle Beach/Sumter County Contributing Yes No Yes No Yes312 TN-500 Chattanooga CoC* Chattanooga CoC* Contributing Yes Yes Yes Yes Yes313 TN-501 Memphis-Shelby CoC Memphis-Shelby CoC Contributing Yes Yes Yes Yes Yes314 TN-502 Knoxville/Knox County Knoxville/Knox County Contributing Yes No No No Yes315 TN-503 South Central TN South Central TN Contributing Yes No Yes No Yes316 TN-504 Nashville/Davidson County Nashville/Davidson County Contributing Yes No Yes No No317 TN-506 Upper Cumberland Upper Cumberland Contributing Yes * Yes No *
Contributing Communities
Appendix A: List of 2009 AHAR Sample Sites and Contributing Communities A-18

CoC Code Continuum of Care Name AHAR Jurisidiction Name AHAR Site Type Participated in the AHAR? 1Emergency Shelters for
Families
Transitional Housing for
Families
Emergency Shelters for Individuals
Transitonal Hosing for Individuals
#
Reporting Categories Used in the AHAR
318 TN-507 Jackson West TN Jackson West TN Contributing Yes No Yes No Yes319 TN-509 Appalachian Region Appalachian Region Contributing Yes Yes Yes No Yes320 TX-503 Austin/Travis County Austin/Travis County Contributing Yes Yes Yes Yes Yes
321 TX-504 Dewitt, Lavaca, Victoria Counties CoC
Victoria Contributing Yes Yes Yes Yes Yes
322 TX-601 Fort Worth/Arlington/Tarrant County
Tarrant County/Ft. Worth Contributing Yes Yes Yes No Yes
323 TX-604 Waco/McLennan County CoC Waco Contributing Yes * Yes Yes Yes324 TX-610 Denton City & County CoC Denton Contributing Yes * Yes No *325 TX-611 Amarillo Amarillo Contributing Yes Yes Yes Yes Yes
326 TX-701 Bryan/College Station/Brazos Valley CoC
Twin City Mission, Inc. Contributing Yes No Yes Yes Yes
327 TX-704 Galveston/Gulf Coast CoC The Gulf Coast Coalition Contributing Yes No Yes No No
328 VA-500 Richmond/Henrico, Chesterfield, Hanover Counties CoC
Richmond/Henrico County Contributing Yes Yes No No No
329 VA-501 Norfolk CoC City of Norfolk Contributing Yes Yes Yes No Yes330 VA-503 Virginia Beach CoC Virginia Beach Contributing Yes Yes Yes Yes No331 VA-509 Petersburg CoC Petersburg Contributing Yes Yes * No No332 VA-512 Chesapeake Chesapeake Contributing Yes Yes Yes * *
333 VA-514 Fredericksburg/Spotsylvania, Stafford Counties CoC
Frederickburg Contributing Yes Yes Yes Yes No
334 VA-601 Fairfax County Fairfax County Contributing Yes Yes No Yes No335 VA-602 Loudon County Loudon County Contributing Yes Yes Yes Yes Yes
Contributing Communities
Appendix A: List of 2009 AHAR Sample Sites and Contributing Communities A-19

CoC Code Continuum of Care Name AHAR Jurisidiction Name AHAR Site Type Participated in the AHAR? 1Emergency Shelters for
Families
Transitional Housing for
Families
Emergency Shelters for Individuals
Transitonal Hosing for Individuals
#
Reporting Categories Used in the AHAR
336 VI-500 Virgin Islands Virgin Islands Contributing Yes Yes Yes Yes Yes337 VT-500 Vermont Vermont Contributing Yes No Yes No Yes338 WA-502 Spokane CoC* Spokane CoC Contributing Yes No Yes No No
339 WA-503 Tacoma/Lakewood/Pierce County
Tacoma/Lakewood/Pierce County
Contributing Yes Yes Yes No No
340 WA-508 Vancouver/Clark County Vancouver/Clark County Contributing Yes No Yes Yes No341 WI-500 Wisconsin Wisconsin Contributing Yes Yes Yes Yes Yes342 WI-501 Milwaukee Milwaukee Contributing Yes Yes Yes No Yes343 WI-502 Racine City & County Racine City/County Contributing Yes Yes Yes Yes Yes344 WI-503 Madison/Dane County Madison/Dane County Contributing Yes Yes Yes Yes Yes
345 WV-500 Wheeling-Weirton Area CoC* Wheeling-Weirton County Contributing Yes Yes No Yes Yes
346 WV-501 Cabell/Huntington/Wayne Cabell/Huntington/Wayne Contributing Yes No Yes Yes Yes
347 WV-503 Charleston/Kanawha, Putnam, Boone, Clay Counties CoC
Charleston/Kanawha County Contributing Yes No No Yes Yes
348 WY-500 Wyoming Statewide CoC Wyoming Contributing Yes No Yes No No
1 A commmunity designated as a "complete zero provider" does not have any emergency shelters or transitional housing programs located in their jurisidiciton.* Indicates a zero-provider reporting category, meaning that the community does not have any programs in the category.
Contributing Communities
Appendix A: List of 2009 AHAR Sample Sites and Contributing Communities A-20

Appendix B:
Data Collection and Analysis Methodology

Appendix B: Data Collection and Analysis Methodology 1
Appendix B Data Collection and Analysis Methodology
B.1 Introduction
This document summarizes the methodology for producing the 2009 Annual Homeless Assessment Report (AHAR). Abt Associates and the University of Pennsylvania Center for Mental Health Policy and Services Research (the AHAR research team) developed the methodology. The 2009 AHAR is based on two primary sources of data:
1. Homeless Management Information Systems (HMIS). The HMIS data were collected from a nationally representative sample of communities1 and cover a one-year reporting period, October 1, 2008 to September 30, 2009. The data contain information on homeless persons who used emergency shelters or transitional housing at any point during this time period. Data are unduplicated at the community-level and reported in the aggregate. HMIS data include information on the number, characteristics, and service-use patterns of homeless persons. Each AHAR incorporates HMIS data for the most recent, one-year reporting period and compares these data to previous findings. The 2009 AHAR provides comparisons of HMIS data from 2007-2008 (first reported in the 2008 AHAR) to data from 2008-2009.
2. Continuum of Care (CoC) applications. The CoC application data were collected
from all CoCs in 2009, and the 2009 AHAR compares these data to data from the previous two years. The CoC application data complement the HMIS-based data by including an estimate of the number of unsheltered homeless persons on a single night in January. They also include an estimate of the number and basic demographic characteristics of sheltered homeless persons on that night and the number of emergency shelter and transitional housing beds available to serve homeless persons. The information comes from the CoC applications that all CoCs must complete to be eligible for HUD McKinney-Vento Act funding.
1 Data from AHAR sample sites is supplemented with data from other Continuums of Care that were not
selected as part of the original sample but chose to contribute their HMIS data for the AHAR. These communities are called ‘contributing communities’; unlike AHAR sample sites, contributing communities only represent themselves in the national estimates, meaning their data is not weighted to represent other communities to produce the national estimate.

2 Appendix B: Data Collection and Analysis Methodology
The remainder of this appendix describes the AHAR sample data in more detail. Section B-2 discusses the population represented by the AHAR sample and the information collected about persons experiencing homelessness. Section B-3 describes how the nationally representative sample was selected and the number of communities that were able to contribute local HMIS data to the AHAR. Section B-4 presents the results of the data cleaning process and describes how usable data were identified for the final AHAR analysis file. Section B-5 describes the process for developing the analysis weights for each site to produce nationally representative estimates.
B.2 Data and AHAR Reporting Categories
This section describes the target population for inclusion in the AHAR sample, the source of data, and the data collection process. Target Population for the AHAR Sample
The HMIS-based data in the AHAR sample includes information on all persons experiencing homelessness who used an emergency shelter or transitional housing facility at any time during a one-year period, from October 1, 2008 through September 30, 2009. The sample does not include individuals who are homeless but live in an area not within a Continuum of Care, or individuals who live in a CoC community but do not use an emergency shelter or transitional housing program. However, given that CoCs cover 97 percent of the U.S. population, including all areas thought to face a high rate of homelessness, few homeless persons are likely to live outside CoC communities. The target population also excludes CoCs in Puerto Rico and other U.S. Territories. Hence, the estimates represent the 50 states and the District of Columbia. The unsheltered homeless population—persons who live on the streets or other places not meant for human habitation—is not represented by the HMIS data in the sample if such persons do not use an emergency shelter or transitional housing facility at any time during the one-year data collection period. One caveat associated with the use of HMIS data for national reporting is that an important subset of homeless service providers is not permitted to participate fully in data collection. The 2005 Violence against Women and Department of Justice Reauthorization Act prohibits “victim service providers”2 from entering personally identifying information into an HMIS. Even though CoCs were required to include these programs as part of their housing inventory in their funding application, we excluded their beds from our extrapolations; thus, the
2 The term victim service provider is defined as “a nonprofit, nongovernmental organization, including rape
crisis centers, battered women’s shelters, domestic violence transitional housing programs, and other programs whose primary mission is to provide services to victims of domestic violence, dating violence, sexual assault, or stalking” (72 FR 5056, March 16, 2007).

Appendix B: Data Collection and Analysis Methodology 3
national estimate of the sheltered homeless population does not include persons using residential “victim service” providers. Homeless Management Information System Data
The information on homeless persons in the AHAR sample is based on HMIS data collected by local homeless assistance providers. HMIS are computerized data collection applications operated by CoCs that store data on homeless individuals and families who use homelessness assistance services. HMIS data have some important features. First, they have been standardized nationally in accordance with HUD’s National HMIS Data and Technical Standards Notice (Data Standards).3 All HUD McKinney-Vento–funded homeless programs are required to collect 14 universal data elements from every client served.4 The Data Standards define each data element. The universal data elements include information on a client’s demographic characteristics (e.g., date of birth, ethnicity and race, gender, veteran status, and disability status) and recent residential history (e.g., residence before program entry, program entry and exit dates, and zip code of last permanent address). The data are essential to obtaining an accurate picture of the extent, characteristics, and patterns of service use of the local homeless population. Second, HMIS data include personally identifying information that allows local communities to produce an accurate de-duplicated count of homeless persons in their communities. For each person served, programs must collect a client’s full name and Social Security Number. The personally identifying information may be used in combination with other client-level information to calculate the number of unique users of homeless services and to identify persons who use several types of services. Third, HMIS data may be manipulated to produce a more comprehensive picture of homelessness when compared to older data collection systems (e.g., paper records). Given that the data are stored electronically in sophisticated software applications, data users may produce cross-tabulations and other outputs that were impractical or impossible before the advent of HMIS. As a result, HMIS data offer new opportunities to study the nature and extent of homelessness. AHAR Reporting Categories
To facilitate the AHAR reporting process, the AHAR research team developed five reporting categories that are used to collect information from participating communities. All of the
3 69 FR 45888, July 30, 2004.
4 Two of the universal data elements (Veterans Status and Disabling Condition) are asked of adults only; two other data elements (Residence Prior to Program Entry and Zip Code of Last Permanent Address) are asked of adults and unaccompanied youth only.

4 Appendix B: Data Collection and Analysis Methodology
information required in the reporting categories is based on the universal data elements specified in the HMIS Data Standards. The five reporting categories are:
1. Individuals served by emergency shelters (ES-IND)
2. Individuals served by transitional housing facilities (TH-IND)
3. Families served by emergency shelters (ES-FAM)
4. Families served by transitional housing facilities (TH-FAM)
5. A summary table Reporting categories 1 through 4 contain several sections. The first section is an extrapolation worksheet for estimating the total number of individuals or persons in families that used an emergency shelter or transitional housing facility during the data collection period. This section guides the community through a process for estimating the number of individuals or persons in families served by providers participating in HMIS as well as by nonparticipating providers. A limited amount of data from the HMIS and communities’ bed inventory is required to complete the extrapolation. The remaining sections in each set of reporting categories are designed to capture information about the homeless population in the community. Each set of reporting categories is designed with embedded codes to check for data errors, such as missing values or inconsistent information. A summary sheet of data errors is automatically generated as communities complete the reporting categories, prompting communities to review and correct any errors. The final set of reporting categories —the summary tables—is designed to save time and increase data accuracy. The tables provide estimates of the total unduplicated count of persons who used a participating and nonparticipating emergency shelter or transitional housing program in each jurisdiction during the data collection period. The summary tables also show estimates of the demographic characteristics of the service-using population, patterns of program use, and the average daily utilization rate among persons accessing shelters and transitional housing. The summary tables automate many calculations and are designed with embedded data quality checks that list error messages when inconsistent information is entered. The data submission process is channeled through the AHAR Exchange, a web-based data collection instrument designed specifically for the AHAR. Communities login to the AHAR Exchange using a unique username and password and submit the data by either typing the aggregate data into each reporting category or by uploading all their data via an XML schema into the appropriate reporting category. Each community is assigned a data quality reviewer (a member of the research team) who reviews each submission and works collaboratively with representatives from the community to fix any data quality issues. A public version of the AHAR Exchange is available for viewing and local use: http://sandbox.hmis.info/.

Appendix B: Data Collection and Analysis Methodology 5
B.3 Sample Selection
This section describes the procedures for selecting a nationally representative sample of 102 jurisdictions for the AHAR.5 CDBG Jurisdictions Are Primary Sampling Units
The AHAR uses the geographic areas defined for the allocation of CDBG funds as the primary sampling unit. The four types of CDBG jurisdictions are:
Principal cities6 Cities with 50,000 or more persons (that are not principal cities) Urban counties Rural areas or non-entitlement jurisdictions
CDBG jurisdictions constitute the basic building blocks of CoCs. In some cases, the CDBG jurisdiction and the CoC represent the same geographic area (e.g., principal cities are often a single CoC), but, in other situations, the CDBG jurisdiction is a geographic subunit of the CoC (e.g., a small city with 50,000 or more persons may be a subunit of a countywide CoC). The selection of 102 CDBG jurisdictions ensures the inclusion of a wide range of sites in the AHAR as well as the reasonably precise measurement of the characteristics of homeless persons and their patterns of service use. The U.S. Department of Housing and Urban Development provided a sampling frame for the selection of CDBG jurisdictions. The sampling frame is a list of all 3,142 CDBG
5 The initial AHAR sample consisted of 80 jurisdictions. Some jurisdictions from the original sample—
especially jurisdictions representing rural areas—were unable to provide data to the AHAR because of HMIS implementation issues or other data quality concerns. In addition, several of the rural sample sites did not have any homeless residential service providers located in their jurisdiction. As a result, we were unable to report data by geography. In an effort to improve the scope and quality of data from rural jurisdictions, 22 additional rural jurisdictions were added to the AHAR sample. Thus, there are now 102 AHAR sample sites.
6 The original file from which the sample was selected used the category of “central city” for CDBG jurisdictions rather than “principal city.” However, the CDBG program moved to designation of principal city rather than central city following the OMB guidance, and the definition of central city and principal city are slightly different (see 24 CFR Part 570). Of the 482 CDBG central city jurisdictions that existed both before and after the definition change, 327 central city jurisdictions (68%) became principle cities with the definition change. A small number of non-central cities (85 out of 2,501) in the original file were categorized as principal cities in the 2007 CDBG file. In our analysis by CDBG jurisdiction and in procedures for adjusting the sampling weights, we used the community’s current CDBG jurisdiction to ensure that our results accurately represented the current system for designating CDBG jurisdictions.
6 Appendix B: Data Collection and Analysis Methodology
jurisdictions within the 430 CoCs in the 50 states as of 2002.7 The next section describes the decision to stratify the sites based on geographic type, along with the procedures for selecting certainty and non-certainty sites. Stratifying the Sample by Type of Geographic Area
A CDBG jurisdiction may be a large principal city of a metropolitan area, a smaller city with a population of 50,000 or more, one or more suburban or urban fringe counties, or a rural area. As such, the number of homeless persons in each jurisdiction varies considerably. Using the relative size of the homeless population in each CDBG jurisdiction to select a sample may increase the precision of the estimates for any particular sample size. However, with the number of homeless persons in each CDBG jurisdiction unknown, the study team assumed that the total population in each CDBG jurisdiction provided a measure of relative size of the homeless population for purposes of sample selection. The study team premised the assumption on the likelihood that the number of homeless persons is correlated with the total population in the area served by the CDBG jurisdiction. The team further refined the assumption by dividing the sample into strata based on the expected rate of homelessness.8 Earlier research on homelessness indicates that the rate of homelessness varies by type of geographic area. For example, Burt (2001) found that 71 percent of the homeless persons using homeless-related services are located in principal cities but that only 30 percent of the total U.S. population lives in principal cities.9 By contrast, rural areas account for 9 percent of the homeless population, but 20 percent of the overall population. Further, suburban/urban fringe areas represent 21 percent of homeless persons, but 50 percent of the overall population. These findings suggest that, before using the total population as a proxy
7 HUD provided a file called “COC_GeoAreasInfo.xls” with a list of 3,219 CDBG jurisdictions, jurisdiction
type, and population of each jurisdiction. Geographic areas in the U.S Territories and Puerto Rico and three duplicate records were eliminated, resulting in a sampling frame of 3,142 CDBG jurisdictions. In addition, four CDBG areas in Massachusetts and one in New Hampshire included overlapping geographic areas and double-counted the population; therefore, the population was evenly divided across the overlapping CDBG jurisdictions before sampling.
8 Sampling based on the expected rate of homelessness is an attempt to obtain more precise estimates than those yielded by a simple random sample. If the proxy for the expected rate of homelessness is not correlated with the actual rate of homelessness, the resulting estimates will still be unbiased; however, the extra precision gains go unrealized.
9 Burt, Martha. 2001. Homeless Families, Singles, and Others: Findings from the 1996 National Survey of Homeless Assistance Providers and Clients. Housing Policy Debate, V12 (4), 737-780. This report presents the share of the homeless population by urban/rural status. The share of the population in each type of geographic area comes from the author’s calculations based on March 1996 Current Population Survey data. The results from the Burt study were based on central cities rather than principal cities, but we refer to them as principal cities here because of the high degree of overlap and to make the discussion easier to follow.

Appendix B: Data Collection and Analysis Methodology 7
for the relative size of the homeless population, the CDBG jurisdictions should be stratified by type of geographic area to account for the fact that the ratio of homeless persons to the population varies across geographic areas. Hence, the study team divided the CDBG jurisdictions into four groups based on their classification for the allocation of CDBG funds: principal cities, other cities larger than 50,000, urban counties, and rural areas (i.e., counties that are part of non-entitlement areas). Such stratification increases the precision of estimates. Very Large CDBG Jurisdictions Selected with Certainty
Given that the size of the population across CDBG jurisdictions is skewed by a few very large jurisdictions covering areas with several million residents, a useful strategy for reducing sampling variability in the estimated number and characteristics of homeless persons is to select very large jurisdictions in the sample with certainty. Selecting a CDBG jurisdiction with certainty means that the CDBG jurisdiction represents only itself in the sample estimates but ensures that the sample does not exclude the largest jurisdictions, whose number and characteristics of the homeless population could substantially affect national estimates. Exhibit B-1 lists the 18 CDBG jurisdictions selected with certainty. For selecting the certainty sites, the study team divided the CDBG jurisdictions into the four geographic-type strata. Assuming the rate of homelessness was the same in each area within each stratum, the study team calculated the standard deviation (square root of the variance) of the number of homeless persons for the entire stratum. The team then recalculated the standard deviation by excluding the largest site (as if that site were taken with certainty) to obtain a relative estimate of the reduction in the variance of the estimates that would occur if that site were selected with certainty. In the event of substantial reduction in the variance due to the selection of the certainty unit, the overall variance of the sample estimates will be smaller as the variance contribution to the estimate from the certainty sites is zero. The process of selecting the next-largest site as a certainty site continued until the reduction of the variance or standard deviation was small or marginal. The process resulted in the identification of 11 certainty sites consisting of eight principal cities, one other city larger than 50,000, and two urban counties (but no non-entitlement areas).

8 Appendix B: Data Collection and Analysis Methodology
Exhibit B-1: Geographic Characteristics and Population of 18 Certainty Sites
Geographic Area Type of
CDBG Entity
Size of Housed
Population Census Region CoC Name
1 NEW YORK CITY Principal City 8,008,278 Northeast New York City Coalition/CoC
2 LOS ANGELES Principal City 3,694,820 West County of Los Angeles, CA
3 CHICAGO Principal City 2,896,016 Midwest Chicago CoC
4 HOUSTON Principal City 1,953,631 South Houston/Harris County
5 PHILADELPHIA Principal City 1,517,550 Northeast City of Philadelphia
6 PHOENIX Principal City 1,321,045 West Maricopa CoC
7 SAN DIEGO Principal City 1,223,400 West City of San Diego Consortium
8 DALLAS Principal City 1,188,580 South Dallas Homeless CoC
9 DETROIT Principal City 951,270 Midwest City of Detroit CoC
10 SAN FRANCISCO Principal City 776733 West City and County of San Francisco
11 BOSTON Principal City 589,141 Northeast City of Boston
12 WASHINGTON, DC Principal City 572,059 South District of Columbia Homeless Services
13 SEATTLE Principal City 563,374 West Seattle-King County CoC
14 CLEVELAND Principal City 478,403 Midwest Cuyahoga County/Cleveland CoC
15 ATLANTA Principal City 416,474 South Atlanta Tri- Jurisdictional
16 LOS ANGELES COUNTY
Urban County 2,205,851 West County of Los Angeles, CA
17 COOK COUNTY Urban County 1,712,784 Midwest Cook County CoC
18 ISLIP TOWN City >50,000 322,612 Northeast Suffolk County CoC Group
Based on earlier research findings showing that homeless persons are disproportionately located in principal cities, the study team identified 7 additional principal cities as certainty sites, for a total of 15 principal cities in the certainty sample (and 18 certainty sites in total). The team selected the 7 additional principal cities with certainty because the cities had among the largest populations of persons living in emergency and transitional shelters in the

Appendix B: Data Collection and Analysis Methodology 9
1990 and 2000 Census counts.10 All 7 certainty sites had one of the 10 largest counts in either 1990 or 2000.11 Given that so many homeless persons live in these cities, it is important to include them with certainty in a nationally representative sample. Selection of Non-Certainty Sample
There are currently 102 AHAR sample sites. The selection of the non-certainty sites occurred in two phases. Phase one was completed in 2005 and included 62 non-certainty sites. The 62 non-certainty sites and the 18 certainty sites (80 total sample sites) constituted the original sample for the 2005, 2006, and 2007 AHARs. Phase 2 was completed for the 2008 AHAR and added 22 non-certainty sites to the original sample. Phase 1: Selecting 62 Non-Certainty Sites. To select the 62 non-certainty sites for the original sample, the study team divided the 3,124 CDBG jurisdictions into 16 strata based on the four types of geographic areas and Census regions. As discussed earlier, the team divided the sample into strata based on the type of geographic area because earlier research indicated that the rate of homelessness is higher in principal cities than in other areas. The team further divided the sample into Census regions because business cycles might affect regions differently and result in variation in rates of and trends in homelessness across regions. Dividing the sample into strata that are more similar in terms of the rate of homelessness and the characteristics of homeless persons than the overall population reduces the variance of the sample estimates for a particular sample size. Stratified sampling also eliminates the possibility of some undesirable samples. For example, with a simple random sample, one possible sample might include sites only in rural areas or sites only in the Northeast, both of which are undesirable samples. One possibility considered for the non-certainty sample was allocation of the sample to the stratum in proportion to the population in each stratum. However, such an approach ignores the research indicating that a disproportionate share of the homeless is located in principal cites. Ignoring information on the location of the homeless population would lead to a relatively high degree of imprecision in national estimates such that 20 of the 62 non-certainty sites would be allocated to principal cities, 6 to non– principal cities, 16 to urban counties, and 20 to rural areas. The same number of rural areas as principal cities would be selected even though earlier research suggests that only 9 percent of the homeless population lives in rural areas whereas 70 percent lives in principal cities.
10 For 1990 counts, see U.S. Department of Housing and Urban Development. “Allocating Homeless
Assistance by Formula.” A Report to Congress, 1992. For 2000 counts, see U.S. Census Bureau. “Emergency and Transitional Shelter Population: 2000.” A Census 2000 Special Report.
11 The other 8 certainty sites in principal cities were all ranked in the top 15 in the 1990 or 2000 Census counts.

10 Appendix B: Data Collection and Analysis Methodology
Another possibility under consideration for the non-certainty sample was allocation of the total non-certainty sample of 62 CDBG jurisdictions to each of the 16 strata in proportion to the adjusted population in each stratum, where the adjustment accounts for different rates of homelessness across geographic areas. This allocation method produces the highest degree of precision of national estimates for a given sample size. The adjusted population is the population of persons living in an area multiplied by an adjustment factor for the expected rate of homelessness in that area. With the rate of homelessness in principal cities roughly five times that of other areas,12 the study team multiplied the population in principal cities by five so that the adjusted populations would reflect the relative number of homeless persons expected in each stratum. If the adjusted population were used to allocate the non-certainty sites across the strata, 39 of the 62 original non-certainty sample sites would have been allocated to principal cities, 4 to non– principal cities, 8 to urban counties, and 11 to rural areas. While optimal for national estimates, the number of sites in the non–principal city stratum was too small for subnational estimates. The sampling allocation procedure ultimately used for AHAR data collection strikes a balance between the most precise national estimates possible with a sample of 62 non-certainty sites and reasonably sized samples from each of the four types of geographic areas. The study team allocated the 62 original non-certainty sample sites across the 16 strata based on the square root of the adjusted population. The result is a sample allocation between the allocation in proportion to the population and the allocation in proportion to the adjusted population. Accordingly, 27 of the 62 original non-certainty sites are in principal cities, 8 are in non-principal cities, 13 are in urban counties, and 14 are in rural areas. The allocation means lower variances of the estimates than either simple random sampling or sampling in direct proportion to the population and provides better representation of non– principal city areas than the allocation in proportion to the adjusted population. To select the non-certainty sites in each stratum, the study team divided the sites into groups based on size and then randomly selected one site from each group. The number of non-certainty sites allocated to each stratum determined the number of groups, and each group in a stratum contained the same number of sites. Sampling from groups based on population size is beneficial in that it ensures that the sample has a similar distribution of CDBG jurisdiction sizes as the population. Given that the size of the homeless population is expected to correlate with the total population within strata, similarity in distribution is an important feature of the sample.
12 The ratio was determined as follows. Burt (2001) found that 71 percent of the homeless population lived in
central cities in 1996. At the same time, Current Population Survey data indicate that only 30 percent of the overall population lived in central cities at that time. The ratio of the share of the homeless population to the share of the overall population in central cities is 2.36. The ratio is 0.42 for non– principal city portions of Metropolitan Statistical Areas and 0.46 for rural areas. Dividing the principal city ratio by the rural ratio (2.36/0.46) equal 5.1, suggesting that the rate of homelessness is about five times higher in central cities than in rural areas.

Appendix B: Data Collection and Analysis Methodology 11
Phase 2: Adding 22 Rural Non-Certainty Sites. The data collection results from the 2005-2007 AHAR reports indicated that many rural communities (or non-entitlement CDBG areas) did not have emergency shelters or transitional housing programs located in these jurisdictions. Among the few rural sample sites that did have emergency shelters and/or transitional housing programs, many of those programs were not entering data into an HMIS. As a result, previous AHAR reports did not capture information from many rural jurisdictions, and the lack of data increased the variance of the AHAR estimates and made the analysis of rural/suburban versus urban homelessness less reliable. In 2008, 22 new rural communities were added to the AHAR sample, increasing the total number of rural jurisdictions to 36 and the total number of AHAR sample sites to 102. The 22 AHAR sample sites that were added in 2008 were selected in the same manner as the original non-certainty sample sites. The original 2002 sampling frame of 3,142 CDBG jurisdictions within the 430 CoCs in the 50 states was used to select the new rural communities. However, the original file was compared with an updated 2006 CDBG list of jurisdictions to remove from the sampling frame jurisdictions that had either merged with other jurisdictions since 2002 or had changed their status from non-entitlement (rural) areas to entitlement areas. The sample was stratified to ensure that each of the four census regions was represented. The goal was to select at least three rural communities from each census region that had at least one emergency shelter or transitional housing program. In some cases, more than three communities for a particular region were selected if inventory information reported by CoC suggested that the communities did not have any emergency shelters or transitional housing programs. That is, from each region, we randomly selected rural jurisdictions until we had at least three rural jurisdictions with at least one emergency shelter or transitional housing program. In total, 22 new rural sample sites were added in 2008; three from the Northeast region; seven from the South region; seven from the Midwest region; and five from the West region. The final AHAR sample contains 102 sample sites, and Exhibit B-2 shows the total number of certainty and non-certainty sites selected from each region-CDBG type stratum. The sample sites contain over 40 million persons, or approximately 16 percent of the population living within CoC communities and 14 percent of the U.S. population. The expectation is that the sample will contain an even higher proportion of the U.S. homeless population because the selection procedures intentionally oversampled areas with a high rate of homelessness (i.e., principal cities). About two-fifths of the selected sites (42 sites) are principal cities, even though only one-third of the total population lives there. The other 60 sample sites were distributed across the three remaining CDBG jurisdictions: non-principal cities with a population over 50,000 (9 sites), urban counties (15 sites), and non-entitlement/rural areas (36 sites). Appendix A lists all CDBG jurisdictions in the sample.

12 Appendix B: Data Collection and Analysis Methodology
Exhibit B-2: Number of Sites in Universe and Sample by Region-CDBG Type
Stratum
Number of Geographic Areas
in Universe
Number of Certainty Sites
in Sample
Number of Noncertainty
Sites in Sample
Total Sample
Northeast Principal City 86 3 5 8
South Principal City 151 4 8 12
Midwest Principal City 124 3 7 10
West Principal City 106 5 7 12
Northeast City >50,000 81 1 2 3
South City >50,000 48 0 2 2
Midwest City >50,000 55 0 1 1
West City >50,000 114 0 3 3
Northeast Urban County 33 0 3 3
South Urban County 54 0 4 4
Midwest Urban County 33 1 3 4
West Urban County 34 1 3 4
Northeast Non-entitlement County
148 0 6 6
South Non-entitlement County 812 0 11 11
Midwest Non-entitlement County
890 0 11 11
West Non-entitlement County 373 0 8 8
Total 3,142 18 84 102
Addition of Contributing Sites
In addition to the 102 sample sites selected for the study, many other communities nationwide volunteered to provide data for the report to help produce more precise national estimates. The additional communities are entire Continuums of Care and are termed “contributing sites.” In the 2009 AHAR, 246 contributing communities provided data for use in the AHAR report. As with the sites selected with certainty, data from the contributing sites represent themselves in the national estimates. Appendix A lists the sample and contributing communities in the 2009 AHAR.
B.4 AHAR Data Cleaning
This section presents the data cleaning results for the AHAR. For each AHAR sample site and contributing community, the study team reviewed each reporting category (e.g., ES-IND) for reporting irregularities, focusing on three indicators:
HMIS-bed coverage rate Average daily bed utilization rate Proportion of missing variables

Appendix B: Data Collection and Analysis Methodology 13
Bed Coverage Rate
HMIS-bed coverage rate refers to the proportion of beds in a community that participate in HMIS. The HMIS-bed coverage rate is equal to the total number of HMIS-participating beds divided by the total number of beds in a community. The indicator is important because the accuracy of the extrapolation technique depends on obtaining reasonably high bed coverage rates.13 The study team evaluated each reporting category on its own merits—that is, calculated an HMIS-bed coverage rate for ES-IND, ES-FAM, TH-IND, and TH-FAM separately—and excluded from the final AHAR analysis any reporting category with an HMIS-bed coverage rate below 50 percent. Average Daily Bed Utilization Rate
Average daily bed utilization rate refers to the frequency of bed use on an average day. It is equal to the number of homeless persons who use a program on an average day during a specified period divided by the total number of year-round equivalent beds14 in the current inventory during the same period. Utilization rates above 100 percent typically indicated missing exit dates in the HMIS; unusually low utilization rates often suggested that providers did not enter data on all clients served into HMIS. In situations where unusually high or low utilization rates could not be explained or confirmed as accurate by the community, the study team excluded from analysis all data from the reporting category. Proportion of Missing Variables
Missing data limit the ability to present a complete picture of homelessness. Exhibit B-3 presents the proportion of missing values for the weighted 2009 AHAR data. The data element most constrained by missing values was length of stay in prior living arrangement, which was missing for 24 percent of adult clients. Though still a high rate, 2009’s rate of missing disability status is considerably lower than the missing disability rate in the 2008 AHAR (28.9 percent). The missing data rates for disability status (10.6 percent) and prior living situation (10.9 percent) were around half the rate in earlier AHARs. Missing rates have also declined for most other data elements but still remain high for data that
13 Before releasing the AHAR reporting requirements, the study team tested the extrapolation procedures with data
from Philadelphia and Massachusetts under a variety of coverage rate assumptions, taking a random sample of providers (to match 50, 75, and 90 percent HMIS bed-coverage rates) and comparing the extrapolated estimates to the true population counts for these jurisdictions. The findings show that extrapolation estimates were accurate for HMIS bed-coverage rates above 50 percent and were more precise with higher coverage rates. The threshold of an HMIS bed-coverage rate of 50 percent was as representative as possible of a set of participating sample sites. (See 2004 National HMIS Conference Breakout Session Materials “Extrapolation Methods” for more information on the extrapolation testing, available at www.hmis.info.)
14 A year-round equivalent bed counts seasonal beds as partial beds in direct proportion to the length of the covered period for which the provider makes the bed available. For example, a bed from a provider with a seasonal bed open in January, February, and March would count as one-fourth of a bed if the covered period were 12 months.

14 Appendix B: Data Collection and Analysis Methodology
communities were not required to collect before release of HUD’s Data Standards, such as ZIP code of last permanent address (19.1 percent). Exhibit B-3: Proportion of Missing Values across All AHAR Reporting Categories
(weighted data), 2009
Variable Percentage
Missing Variable Percentage
Missing
1. Gender of adults 0.2 8. Disability status 10.6
2. Gender of children 0.2 9. Household type 0.3
3. Ethnicity 2.5 10. Living arrangement before program entry 10.9
4. Race 6.7 11. Length of stay in earlier living arrangement 24.2
5. Age 0.5 12. ZIP code of last permanent address 19.1
6. Household size 0.2 13. Number of nights in program (adult males) .1
7. Veteran status 5.4 14. Number of nights in program (adult females) .1
The study team did not exclude reporting categories from the AHAR analysis file because of missing data. Instead, the estimates are based on non-missing data, and the team has marked estimates in the AHAR report based on data elements with missing rates over 20 percent. Based on the data-quality indicators, the study team classified all sample sites and the contributing communities into five categories describing the usability of their AHAR data. Exhibit B-4 summarizes the findings. Overall, 334 communities participated in the AHAR, including 88 sample sites and 246 contributing communities. Overall, 137 communities (42 sample sites and 95 contributing communities) provided usable data across all four reporting categories; 171 communities (20 sample sites and 151 contributing communities) submitted usable data for only some of their reporting categories; and 26 had no emergency shelter or transitional housing providers located within the sample site.15
15 These sites still contribute to the national count of homelessness because they represent other communities
with no providers.

Appendix B: Data Collection and Analysis Methodology 15
Exhibit B-4: 2009 AHAR Participation Status of Sample and Contributing Communities
Total Status
Percentage Number
Number of Sample Sites
Number of Contributing Communities
Participating in the AHAR
All table shells 30 137 42 95
Partial table shells 37 171 20 151
Complete Zero Providers 6 26 26 -
Subtotal 72 334 88 246
Not Participating in the AHAR
Submitted unusable data 14 63 9 54
No data submitted 14 66 5 61
Subtotal 28 129 14 115
Total Communities 100 463 102 361
In total, 14 of the 102 sample sites (14 percent) were unable to participate in the AHAR, in most cases because implementation issues prevented the site from producing information from their HMIS. A few of the sites were far enough along to submit data but were still working through implementation problems or had recently made major changes to their system that raised questions about the data quality. The study team judged data to be unusable if the bed coverage rate was below 50 percent; if the bed utilization rates were unreasonably high/low and could not be properly explained; if the community contact expressed concern over data accuracy; or if the other quality control procedures raised issues that site staff could not rectify. The 2009 AHAR witnessed a year-over-year increase of 112 communities contributing useable data (from 222 in 2008 to 334), an increase of 50 percent. Moreover, the number of usable reporting categories increased from 507 in the 2008 AHAR to .794 in the 2009 AHAR. (Exhibit B-5 shows the number of usable reporting categories for the 2009 AHAR.) In total, there were 607,140 person-records reported across the AHAR reporting categories and used to generate the national estimates.

16 Appendix B: Data Collection and Analysis Methodology
Exhibit B-5: Number of Usable Reporting Categories by Program-Household Type, 2009
Program-Household Type Total Sample Sites Contributing Communities
Emergency shelters for individuals 179 33 146 Transitional housing for individuals 198 45 (44) 153 Emergency shelters for families 185 39 146 Transitional housing for families 232 44 188 Total 794 161 633
Note: The tallies include only the reporting categories where the site has providers in a given category and provides usable data. The table does not include the 29 complete zero provider sites.
B.5 AHAR Weighting and Analysis Procedures
This section describes the process of obtaining national estimates from the raw HMIS data submitted by participating communities. The estimates of the number and characteristics of the homeless population using homelessness services are based on weighted data. The study team designed the sampling weights to produce nationally representative estimates from the sites that provided data. The steps for obtaining the final estimate are listed here and described in more detail below.
Step 1: Staff from the AHAR sample sites filled out reporting categories with information (raw data) from emergency shelters and transitional housing providers that had entered data into their local HMIS.
Step 2: The raw data were adjusted by reporting category within each site to account for providers that did not participate in the site’s HMIS.
Step 3: Base sampling weights were developed for all selected sites based on the assumption that 100 percent of the AHAR sample sites provided information.
Step 4: Base sampling weights were adjusted to account for contributing sites.
Step 5: Weights were adjusted for nonresponse to determine the preliminary analysis weights.
Step 6: Based on national totals of emergency and transitional housing beds, a post-stratification adjustment was made to arrive at the final analysis weights.
Step 7: A final adjustment factor was derived to account for people who used more than one type of homeless service provider.
Step 8: National estimates were calculated by using the final weight (Step 6) and the final adjustment factor (Step 7).
Appendix B: Data Collection and Analysis Methodology 17
Step 1: Staff from AHAR sites filled out reporting categories with information from emergency shelters and transitional housing providers that had entered data into their local HMIS.
Participating communities logged into the AHAR Exchange—the web-based data collection tool designed for the AHAR—and entered the information (raw data) on the number of homeless persons, their characteristics, and their patterns of service use. The information was reported separately for each reporting category: individuals using emergency shelters (ES-IND); persons in families using emergency shelters (ES-FAM); individuals using transitional housing (TH-IND); and persons in families using transitional housing (TH-FAM). The information was then aggregated into a fifth set of tables, the summary tables, to provide total cross-program estimates for the site. A public version of the AHAR Exchange is available for viewing and local use: http://sandbox.hmis.info/.
Step 2: The raw data were adjusted by reporting category within each site to account for providers that did not participate in the site’s HMIS.
Where participation in the HMIS was less than 100 percent, the raw data at each site were upwardly adjusted to account for nonparticipating providers (i.e., providers that did not submit data to HMIS). This adjustment, or extrapolation, was carried out separately by reporting category within each site. The extrapolation technique assumes that nonparticipating providers serve the same number of unique persons per available bed as participating providers during the study period. It makes a small adjustment for the overlap between users of participating and nonparticipating providers.16 The post-extrapolation results for each site are estimates of the homeless population served by each reporting category and the total sheltered homeless population at all emergency shelters and transitional housing in the entire site during the study period. Step 3: Base sampling weights were developed on the assumption that 100 percent of the
AHAR sample sites provided information.
The study team selected the largest sites (i.e., the CDBG jurisdictions with the largest populations) with certainty. As such, each site’s base sampling weight is 1.0, meaning that each respective site’s data represent only that site. The study team divided the noncertainty sites into 16 strata based on the four Census regions (East, West, Midwest, and South) and four CDBG types (three types of entitlement communities—principal city, urban county, other city with population greater than 50,000—and one type of non-entitlement community). The base sampling weights for the noncertainty sites are the inverse of the probability of selection. For example, if 1 out of 100 sites was selected in a stratum, the base sampling weight for selected
16 Given that data from nonparticipating providers were not available, it is impossible to verify this
assumption. However, it is the most reasonable assumption in that it is accurate when nonparticipating providers are missing at random or at least not systematically missing in a way correlated with the number of people they serve per available bed.

18 Appendix B: Data Collection and Analysis Methodology
sites in that stratum would be 100 (the inverse of 1/100 = 100). Each noncertainty site in a stratum had the same chance of being selected; therefore, each has the same weight. If all the sample sites provided full AHAR data (in the absence of contributing sites), national estimates of the homeless population would be calculated by multiplying each site’s base sampling weight by the extrapolated number of persons with each characteristic at the site and then aggregating across sites.
Step 4: Base sample weights were adjusted to account for contributing sites.
Two hundred forty-six communities volunteered to provide their HMIS-based data for the 2009 AHAR. The data from these communities—or contributing communities—increase the reliability of the AHAR estimates. The study team treated all of these sites as certainty sites and assigned them a weight of 1.0 such that each site would represent only itself in the national estimates. The study team adjusted the base sampling weights of the noncertainty sites downward to represent only the noncontributing sites in their respective stratum. For example, assume that there were two sample sites in a stratum and that both originally had a base weight of 100. If the contributing sites represented 10 CDBG jurisdictions in that stratum, the sample weight for each sample site would be downwardly adjusted to 95. In other words, the two sample sites originally represented 200 sites in their stratum, but, with the contributing sites now representing 10 of those 200 sites, the sample site needs to represent 190 sites. The addition of the contributing sites did not affect the base sampling weights of the certainty sites. If all the sample sites and contributing sites provided full AHAR data, the study team would calculate national estimates of the homeless population by multiplying each site’s base weight by the extrapolated number of persons with each characteristic at the site and then aggregating across sites. Step 5: The base weights were adjusted for nonresponse to derive the preliminary analysis
weights.
The above base weights assume that all the sample and contributing sites provided data for all four reporting categories except for those for which they have no providers in their jurisdiction. Unfortunately, 14 sample sites were not able to provide any usable data, and 20 other sample sites were unable to provide data for all their reporting categories (i.e., they provided partial data). One hundred fifty-one contributing sites also provided only partial data. In addition, 26 sample sites had no providers (i.e., no emergency shelters or transitional housing programs). The ‘zero provider sites’ are part of the estimate (because they represent themselves and all nonsample zero provider sites in the population) but need to be treated differently from the other sites. Once the study team confirmed that the site had no providers, it needed no further information. Given that the zero provider sites did not have any information for the AHAR reporting categories, none of them was a nonrespondent.

Appendix B: Data Collection and Analysis Methodology 19
Recognizing that some participating sites provided only partial data (i.e., data on some but not all of their reporting categories) and that the data proved useful for the AHAR report, the study team carried out the nonresponse adjustment to the weights separately for each of the four reporting categories. That is, each site contributing data to the AHAR has four analytic weights—one for each reporting category. However, for any reporting category for which a site was not able to provide data, the analytic weight is zero. The respondent sites for that reporting category represent the site. (Step 8 describes the procedure for aggregating across reporting categories to arrive at national estimates.) Below is a description of how the weight for each type of site was adjusted for nonresponse to derive the final analysis weights.
(a) The weights of the contributing sites did not change; each contributing site continued to represent itself with an analytic weight of 1.0 for each program-household type for which it provided data.
(b) The weights of the no-provider sites did not change. Their weight remained the base weight calculated in Step 4 because all zero provider sites in the sample are considered respondents. In essence, the no-provider sites produced a response of 100 percent. Stated differently, since none of the non-response sites has no providers, the no-provider sites would not appropriately represent them.
(c) For the certainty sites providing data, base weights were adjusted so that the analytic weights represented all certainty sites. The adjustment was made separately for each program-household type within four weighting classes based on region: North, South, East, and Midwest. 17 The nonresponse adjustment was based on the relative number of shelter beds in the nonrespondent sites and accounts for the possibility of a high degree of size variation among certainty sites. The nonresponse adjustment formula follows:
Total number of beds within a reporting category at certainty sites in
region ÷
Number of beds within reporting category at respondent certainty sites
in region
For example, assume that six of the seven certainty sites in the West provided TH-IND data and that one site did not. If the nonrespondent certainty site had 1,000 TH-IND beds and the six participating certainty sites had 5,000 beds, the weight of the six participating certainty sites would be multiplied by 6/5 (6,000 divided by 5,000).
17 Fifteen of the 18 certainty sites are principal cities; therefore, the nonresponse adjustment essentially occurs
within CDBG type.
20 Appendix B: Data Collection and Analysis Methodology
The adjustment assumes that the nonrespondent certainty sites would serve approximately the same number of persons per bed as the participating certainty sites. The nonresponse adjustment for certainty sites was derived separately by region based on the judgment that homeless providers in principal cities in the same region were more likely than principal cities overall to serve persons with similar characteristics.
(d) For the noncertainty sites, the weights of the participating sites were upwardly adjusted to represent all the sites meant to be represented by the nonrespondent sample sites. The adjustment was carried out separately for each program-household type within 16 weighting classes based on type of CDBG jurisdiction and region: (1) principal city, (2) city with greater than 50,000 population, (3) urban counties, and (4) and nonentitlement areas. The nonresponse adjustment was the same as that used for certainty sites--the ratio of total number of beds in the weighting class divided by number of beds in participating sites.
Step 6: A post-stratification adjustment was carried out to create final analysis weights.
A post-stratification adjustment based on national totals of emergency and transitional housing beds accounted for new CDBG jurisdictions added since 2002 as well as for any differences in the average size of sample and nonsample sites. This final adjustment to the analysis weights applied only to noncertainty sample sites. The preliminary analysis weight (from Step 5) is the final analysis weight for certainty sites, no-provider sites, and contributing sites.
The initial AHAR sample was drawn from the number of CDBG jurisdictions in existence in 2002. Since that time, however, the number of CDBG jurisdictions has increased from 3,142 to 4,115.18 Therefore, the study team adjusted the analysis weights to account for the expansion. The increase in CDBG jurisdictions was not evenly distributed; most of the growth occurred in the South, particularly in the rural South. Thus, we adjusted the weights separately for each of the 16 strata. The adjustment factor was the ratio of total number of beds in the strata in 2009 (after excluding beds from certainty and contributing communities) to the weighted number of beds in the noncertainty sample sites in the strata providing usable data. The number of beds for the adjustment was based on the housing inventory chart submitted as part of the 2009 CoC application. The adjustment both corrected for the difference in the number of CDBG jurisdictions in CoCs between 2002 and 2009 and adjusted for any differences in the number of beds per CDBG sample site and CDBG nonsample site in the same stratum.
18 The 4,115 CDBG jurisdictions also include nonfunded CDBG jurisdictions not part of the original
sampling frame.

Appendix B: Data Collection and Analysis Methodology 21
The Step 6 weights are the final analysis weights for use with the sample and data provided to produce separate national estimates of the homeless population for each reporting category. However, to aggregate the data across reporting categories, a further adjustment is needed to account for persons who used more than one program type during the study period. Step 7: Final adjustment factor was derived to account for users of several program types.
To calculate national estimates that require data aggregation across the four reporting categories, an adjustment is needed for persons who used more than one program-household type during the study period. That is, if a person used an emergency shelter for individuals and then a transitional housing program for individuals, the person will appear in more than one set of reporting categories for the study period; aggregation of the numbers from the four reporting categories would double count that person. The needed adjustment is the same type of adjustment embedded in the AHAR summary table for sites providing data on all four reporting categories. For the 137 participating sites (42 sample sites and 95 contributing communities) providing data on all four reporting categories, the adjustment factor was the actual adjustment factor calculated from how much overlap the sites reported with their HMIS data. However, for the 171 participating sites that provided only partial data, it was not possible to calculate the overlap adjustment factor from their data. Instead, for all partial reporting sites, the study team used the average overlap adjustment factor from the 137 sites providing full data. Thus, for partial reporting sites, the overlap adjustment factor was assumed to be 0.956. The overlap adjustment factor was calculated as follows:
Total unduplicated number of persons served at the full-reporting sites
÷
Total number of persons served at the full-reporting sites before accounting for persons served by more than one program-household
type
Step 8: Calculate national estimates.
To calculate national estimates, the study team first calculated the total number of persons with each characteristic within each of the four reporting categories. Then, within each reporting category, the team multiplied the final analysis weight (from Step 7) for each site by the number of persons with that characteristic in that site’s reporting category. Next, the team summed the number of persons in each site across sites to arrive at the estimated number of persons with that characteristic who were served in that reporting category. For estimates of the number of persons served by all four reporting categories, the team summed totals across the four reporting categories and then multiplied by the adjustment factor from Step 7. Percentage calculations followed the same procedures by calculating both the numerator and denominator of the desired percentage.

Appendix C:
Continuum of Care Point-in-Time Counts of Homeless Persons

CoC Number CoC NameAK-500 Anchorage CoCAK-501 Alaska Balance of State CoCAL-500 Birmingham/Jefferson, St. Clair, Shelby Counties CoCAL-501 Mobile City & County/Baldwin County CoCAL-502 Florence/Northwest Alabama CoCAL-503 Huntsville/North Alabama CoCAL-504 Montgomery City & County CoCAL-505 Gadsden/Northeast Alabama CoCAL-506 Tuscaloosa City & County CoCAL-507 Alabama Balance of State CoCAR-500 Little Rock/Central Arkansas CoCAR-501 Fayetteville/Northwest Arkansas CoCAR-502 Conway/Arkansas River Valley CoCAR-504 Delta Hills CoCAR-505 Southeast Arkansas CoCAR-506 Johnson, Pope, Yell Counties CoCAR-507 Eastern Arkansas CoCAZ-500 Arizona Balance of State CoCAZ-501 Tucson/Pima County CoCAZ-502 Phoenix/Mesa/Maricopa County Regional CoCCA-500 San Jose/Santa Clara City & County CoCCA-501 San Francisco CoCCA-502 Oakland/Alameda County CoCCA-503 Sacramento City & County CoCCA-504 Santa Rosa/Petaluma/Sonoma CountyCA-505 Richmond/Contra Costa County CoCCA-506 Salinas/Monterey County CoCCA-507 Marin County CoCCA-508 Watsonville/Santa Cruz City & County CoCCA-509 Mendocino County CoCCA-510 Turlock/Modesto/Stanislaus County CoCCA-511 Stockton/San Joaquin County CoCCA-512 Daly/San Mateo County CoCCA-513 Visalia, Kings, Tulare Counties CoCCA-514 Fresno/Madera County CoCCA-515 Roseville/Placer County CoCCA-516 Redding/Shasta County CoCCA-517 Napa City & County CoCCA-518 Vallejo/Solano County CoCCA-519 Chico/Paradise/Butte County CoCCA-520 Merced City & County CoCCA-521 Davis/Woodland/Yolo County CoCCA-522 Humboldt County CoCCA-523 Colusa/Glenn/Tehama/Trinity Counties CocCA-524 Yuba City, Marysville/Sutter, Yuba Counties CoCCA-525 El Dorado County CoCCA-526 Tuolumne, Calaveras, Amador Counties CoCCA-527 Nevada County CoC
Appendix C-12010 List of Continuums of Care

CoC Number CoC Name
Appendix C-12010 List of Continuums of Care
CA-600 Los Angeles City & County CoCCA-601 San Diego CoCCA-602 Santa Ana/Anaheim/Orange County CoCCA-603 Santa Maria/Santa Barbara CountyCA-604 Bakersfield/Kern County CoCCA-605 San Buena Ventura/Ventura CountyCA-606 Long Beach CoCCA-607 Pasadena CoCCA-608 Riverside City & County CoCCA-609 San Bernardino City & County CoCCA-610 San Diego County CoCCA-611 Oxnard CoCCA-612 Glendale CoCCA-613 Imperial County CoCCA-614 San Luis Obispo County CoCCO-500 Colorado Balance of State CoCCO-503 Metropolitan Denver Homeless InitiativeCO-504 Colorado Springs/El Paso County CoCCT-500 Danbury CoCCT-501 New Haven CoCCT-502 Hartford CoCCT-503 Bridgeport/Stratford/Fairfield CoCCT-504 Middletown/Middlesex County CoCCT-505 Connecticut Balance of State CoCCT-506 Norwalk/Fairfield County CoCCT-507 Norwich/New London City & County CoCCT-508 Stamford/Greenwich CoCCT-509 New Britain CoCCT-510 Bristol CoCCT-512 City of Waterbury CoCDC-500 District of Columbia CoCDE-500 Delaware Statewide CoCFL-500 Sarasota, Bradenton, Manatee Counties CoCFL-501 Tampa/Hillsborough County CoCFL-502 St. Petersburg/Clearwater/Largo/Pinellas County CoCFL-503 Lakeland CoCFL-504 Daytona Beach/Daytona/Volusia, Flagler Counties CoCFL-505 Fort Walton Beach/Okaloosa, Walton Counties CoCFL-506 Tallahassee/Leon County CoCFL-507 Orlando/Orange, Osceola, Seminole Counties CoCFL-508 Gainesville/Alachua, Putnam Counties CoCFL-509 Fort Pierce/St. Lucie, Indian River, Martin Counties CoCFL-510 Jacksonville-Duval, Clay Counties CoCFL-511 Pensacola/Esca/Santa Rosa County CoCFL-512 Saint Johns County CoCFL-513 Palm Bay/Melbourne/Brevard County CoCFL-514 Ocala/Marion County CoCFL-515 Panama City/Bay, Jackson Counties CoC

CoC Number CoC Name
Appendix C-12010 List of Continuums of Care
FL-516 Winterhaven/Polk County CoCFL-517 Hendry, Hardee, Highlands Counties CoCFL-518 Columbia, Hamilton, Lafayette, Suwannee Counties CoCFL-519 Pasco County CoCFL-520 Citrus, Hernando, Lake, Sumter Counties CoCFL-600 Miami/Dade County CoCFL-601 Ft Lauderdale/Broward County CoCFL-602 Punta Gorda/Charlotte County CoCFL-603 Ft Myers/Cape Coral/Lee County CoCFL-604 Monroe County CoCFL-605 West Palm Beach/Palm Beach CountyFL-606 Naples/Collier County CoCGA-500 Atlanta/Roswell/DeKalb, Fulton Counties CoCGA-501 Georgia Balance of State CoCGA-503 Athens/Clarke County CoCGA-504 Augusta CoCGA-505 Columbus-Muscogee/Russell County CoCGA-506 Marietta/Cobb County CoCGA-507 Savannah/Chatham County CoCGU-500 Guam CoCHI-500 Hawaii Balance of State CoCHI-501 Honolulu CoCIA-500 Sioux City/Dakota, Woodbury Counties CoCIA-501 Iowa Balance of State CoCIA-502 Des Moines/Polk County CoCID-500 Boise/Ada County CoCID-501 Idaho Balance of State CoCIL-500 McHenry County CoCIL-501 Rockford/Winnebago, Boone Counties CoCIL-502 North Chicago/Lake County CoCIL-503 Champaign/Urbana/Rantoul/Champaign County CoCIL-504 Madison County CoCIL-505 Evanston CoCIL-506 Joliet/Bolingbrook/Will County CoCIL-507 Peoria/Perkin/Fulton, Peoria, Tazewell, Woodford CoCIL-508 East Saint Louis/Belleville/Saint Clair County CoCIL-509 DeKalb City & County CoCIL-510 Chicago CoCIL-511 Cook County CoCIL-512 Bloomington/Central Illinois CoCIL-513 Springfield/Sangamon County CoCIL-514 Dupage County CoCIL-515 South Central Illinois CoCIL-516 Decatur/Macon County CoCIL-517 Aurora/Elgin/Kane County CoCIL-518 Rock Island/Moline/Northwestern Illinois CoCIL-519 West Central Illinois CoCIL-520 Southern Illinois CoC

CoC Number CoC Name
Appendix C-12010 List of Continuums of Care
IN-500 St. Joseph County CoCIN-502 Indiana Balance of State CoCIN-503 Indianapolis CoCKS-501 Kansas City/Wyandotte County CoCKS-502 Wichita/Sedgwick County CoCKS-503 Topeka/Shawnee County CoCKS-505 Overland Park/Johnson County CoCKS-507 Kansas Balance of State CoCKY-500 Kentucky Balance of State CoCKY-501 Louisville/Jefferson County CoCKY-502 Lexington/Fayette County CoCLA-500 Lafayette/Acadiana CoCLA-501 Lake Charles/Southwestern Louisiana CoCLA-502 Shreveport/Bossier/Northwest CoCLA-503 New Orleans/Jefferson Parish CoCLA-504 Baton Rouge CoCLA-505 Monroe/Northeast Louisiana CoCLA-506 Slidell/Southeast Louisiana CoCLA-507 Alexandria/Central Louisiana CoCLA-508 Houma-Terrebonne/Thibodaux CoCMA-500 Boston CoCMA-501 Holyoke/Franklin, Hampden, Hampshire Counties CoCMA-502 Lynn CoCMA-503 Cape Cod Islands CoCMA-504 Springfield CoCMA-505 New Bedford CoCMA-506 Worcester City & County CoCMA-507 Pittsfield/Berkshire County CoCMA-508 Lowell CoCMA-509 Cambridge CoCMA-510 Gloucester/Haverhill/Salem/Essex County CoCMA-511 Quincy/Weymouth CoCMA-512 Lawrence CoCMA-513 Malden/Medford CoCMA-515 Fall River CoCMA-516 Massachusetts Balance of State CoCMA-517 Somerville CoCMA-518 Brookline/Newton CoCMA-519 Attleboro/Taunton/Bristol County CoCMA-520 Brockton/Plymouth City & County CoCMD-500 Cumberland/Allegany County CoCMD-501 Baltimore City CoCMD-502 Harford County CoCMD-503 Annapolis/Anne Arundel County CoCMD-504 Howard County CoCMD-505 Baltimore County CoCMD-506 Carroll County CoCMD-507 Cecil County CoC

CoC Number CoC Name
Appendix C-12010 List of Continuums of Care
MD-508 Charles, Calvert, St.Mary's Counties CoCMD-509 Frederick City & County CoCMD-510 Garrett County CoCMD-511 Mid-Shore Regional CoCMD-512 Hagerstown/Washington County CoCMD-513 Wicomico/Somerset/Worcester CoCMD-600 Prince George's County CoCMD-601 Montgomery County CoCME-500 Maine Balance of State CoCME-501 Bangor/Penobscot County CocME-502 Portland CoCMI-500 Michigan Balance of State CoCMI-501 Detroit CoCMI-502 Dearborn/Dearborn Heights/Westland/Wayne County CoCMI-503 St. Clair Shores/Warren/Macomb CountyMI-504 Pontiac/Royal Oak/Oakland County CoCMI-505 Flint/Genesee County CoCMI-506 Grand Rapids/Wyoming/Kent CountyMI-507 Portage/Kalamazoo City & CountyMI-508 Lansing/East Lansing/Ingham CountyMI-509 Ann Arbor/Washtenaw County CoCMI-510 Saginaw City & County CoCMI-511 Lenawee County CoCMI-512 Grand Traverse/Antrim, Leelanau CountiesMI-513 Marquette, Alger Counties CoCMI-514 Battle Creek/Calhoun County CoCMI-515 Monroe City & County CoCMI-516 Norton Shores/Muskegon City & CountyMI-517 Jackson City & County CoCMI-518 Livingston County CoCMI-519 Holland/Ottawa County CoCMI-522 Alpena, Iosca, Presque Isle/NE Michigan CoCMI-523 Eaton County CoCMN-500 Minneapolis/Hennepin County CoCMN-501 Saint Paul/Ramsey County CoCMN-502 Rochester/Southeast Minnesota CoCMN-503 Dakota County CoCMN-504 Northeast Minnesota CoCMN-505 St. Cloud/Central Minnesota CoCMN-506 Northwest Minnesota CoCMN-508 Moorehead/West Central Minnesota CoCMN-509 Duluth/Saint Louis County CoCMN-510 Scott, Carver Counties CoCMN-511 Southwest Minnesota CoCMO-500 St. Louis County CoCMO-501 St. Louis City CoCMO-503 St. Charles, Lincoln, Warren Counties CoCMO-600 Springfield/Greene, Christian, Webster Counties CoC

CoC Number CoC Name
Appendix C-12010 List of Continuums of Care
MO-602 Joplin/Jasper, Newton Counties CoCMO-603 St. Joseph/Andrew, Buchanan, DeKalb Counties CoCMO-604 Kansas City/Independence/ Lee's Summit/Jackson County CoCMO-606 Missouri Balance of State CoCMS-500 Jackson/Rankin, Madison Counties CoCMS-501 Mississippi Balance of State CoCMS-503 Gulf Port/Gulf Coast Regional CoCMT-500 Montana Statewide CoCNC-500 Winston Salem/Forsyth County CoCNC-501 Asheville/Buncombe County CoCNC-502 Durham City & County CoCNC-503 North Carolina Balance of State CoCNC-504 Greensboro/High Point CoCNC-505 Charlotte/Mecklenburg County CoCNC-506 Wilmington/Brunswick, New Hanover, Pender Counties CoCNC-507 Raleigh/Wake County CoCNC-509 Gastonia/Cleveland, Gaston, Lincoln Counties CoCNC-511 Fayetteville/Cumberland County CoCNC-513 Chapel Hill/Orange County CoCNC-516 Northwest North Carolina CoCND-500 North Dakota Statewide CoCNE-500 North Central Nebraska CoCNE-501 Omaha/Council Bluffs CoCNE-502 Lincoln CoCNE-503 Southwest Nebraska CoCNE-504 Southeast Nebraska CoCNE-505 Panhandle of Nebraska CoCNE-506 Northeast Nebraska CoCNH-500 New Hampshire Balance of State CoCNH-501 Manchester CoCNH-502 Nashua/Hillsborough County CoCNJ-500 Atlantic City & County CoCNJ-501 Bergen County CoCNJ-502 Burlington County CoCNJ-503 Camden City & County CoCNJ-504 Newark/Essex County CoCNJ-505 Gloucester County CoCNJ-506 Jersey City/Bayonne/Hudson County CoCNJ-507 New Brunswick/Middlesex County CoCNJ-508 Monmouth County CoCNJ-509 Morris County CoCNJ-510 Lakewood Township/Ocean County CoCNJ-511 Paterson/Passaic County CoCNJ-512 Salem County CoCNJ-513 Somerset County CoCNJ-514 Trenton/Mercer County CoCNJ-515 Elizabeth/Union County CoCNJ-516 Warren County CoC

CoC Number CoC Name
Appendix C-12010 List of Continuums of Care
NJ-518 Ocean City/Cape May County CoCNJ-519 Sussex County CoCNJ-520 Cumberland County CoCNM-500 Albuquerque CoCNM-501 New Mexico Balance of State CoCNV-500 Las Vegas/Clark County CoCNV-501 Reno/Sparks/Washoe County CoCNV-502 Nevada Balance of State CoCNY-500 Rochester/Irondequoit/Greece/Monroe County CoCNY-501 Elmira/Steuben, Allegany, Chemung, Schuyler Counties COCNY-502 Auburn/Cayuga County CoCNY-503 Albany City & County CoCNY-504 Cattaraugus County CoCNY-505 Syracuse/Onondaga County CoCNY-506 Fulton, Montgomery, Schoharie Counties CoCNY-507 Schenectady City & County CoCNY-508 Buffalo/Erie County CoCNY-509 Oswego County CoCNY-510 Tompkins County CoCNY-511 Binghamton/Union Town/Broome County CoCNY-512 Troy/Rensselaer County CoCNY-513 Wayne, Ontario, Seneca, Yates Counties CoCNY-514 Jamestown/Dunkirk/Chautauqua County CoCNY-515 Cortland County CoCNY-516 Clinton County CoCNY-517 Orleans County CoCNY-518 Utica/Rome/Oneida County CoCNY-519 Columbia/Greene County CoCNY-520 Franklin County CoCNY-522 Jefferson, Lewis, St. Lawrence Counties CoCNY-523 Glen Falls/Saratoga Springs/Saratoga County CoCNY-524 Niagara CoCNY-600 New York City CoCNY-601 Poughkeepsie/Dutchess County CoCNY-602 Newburgh/Middletown/Orange County CoCNY-603 Islip/Babylon/Huntington/Suffolk County CoCNY-604 Yonkers/Mount Vernon/New Rochelle/Westchester County CoCNY-605 Nassau County CoCNY-606 Rockland County CoCNY-607 Sullivan County CoCNY-608 Kingston/Ulster County CoCOH-500 Cincinnati/Hamilton County CoCOH-501 Toledo/Lucas County CoCOH-502 Cleveland/Cuyahoga County CoCOH-503 Columbus/Franklin County CoCOH-504 Youngstown/Mahoning County CoCOH-505 Dayton/Kettering/Montgomery CoCOH-506 Akron/Baberton/Summit County CoC

CoC Number CoC Name
Appendix C-12010 List of Continuums of Care
OH-507 Ohio Balance of State CoCOH-508 Canton/Massillon/Alliance/Stark County CoCOK-500 North Central Oklahoma CoCOK-501 Tulsa City & County/Broken Arrow CoCOK-502 Oklahoma City CoCOK-503 Oklahoma Balance of State CoCOK-504 Norman / Cleveland CountyOK-505 Northeast Oklahoma CoCOK-506 Southewst Oklahoma CoCOK-507 Southeastern Oklahoma Regional CoCOR-500 Eugene/Springfield/Lane County CoCOR-501 Portland/Gresham/Multnomah County CoCOR-502 Medford/Ashland/Jackson County CoCOR-503 Central Oregon CoCOR-504 Salem/Marion/Polk Counties CoCOR-505 Oregon Balance of State CoCOR-506 Hillsboro/Beaverton/Washington County CoCOR-507 Clackamas County CoCPA-500 Philadelphia CoCPA-501 Harrisburg/Dauphin County CoCPA-502 Upper Darby/Chester/Haverford/Delaware County CoCPA-503 Wilkes-Barre/Hazleton/Luzerne County CoCPA-504 Lower Marion/Norristown/Abington/Montgomery County CoCPA-505 Chester County CoCPA-506 Reading/Berks County CoCPA-507 Altoona/Central Pennsylvania CoCPA-508 Scranton/Lackawanna County CoCPA-509 Allentown/Northeast Pennsylvania CoCPA-510 Lancaster City & County CoCPA-511 Bristol/Bensalem/Bucks County CoCPA-600 Pittsburgh/McKeesport/Penn Hills/Allegheny County CoCPA-601 Southwest Pennsylvania CoCPA-602 Northwest Pennsylvania CoCPA-603 Beaver County CoCPA-605 Erie City & County CoCPR-502 Puerto Rico Balance of Commonwealth CoCPR-503 South/Southeast Puerto Rico CoCRI-500 Rhode Island Statewide CoCSC-500 Charleston/Low Country CoCSC-501 Greenville/Anderson/Spartanburg Upstate CoCSC-502 Columbia/Midlands CoCSC-503 Myrtle Beach/Sumter City & County CoCSC-504 Florence City & County/Pee Dee CoCSD-500 South Dakota Statewide CoCTN-500 Chattanooga/Southeast Tennessee CoCTN-501 Memphis/Shelby County CoCTN-502 Knoxville/Knox County CoCTN-503 South Central Tennessee CoC

CoC Number CoC Name
Appendix C-12010 List of Continuums of Care
TN-504 Nashville/Davidson County CoCTN-506 Oak Ridge/Upper Cumberland CoCTN-507 Jackson/West Tennessee CoCTN-509 Appalachian Regional CoCTN-510 Murfreesboro/Rutherford City CoCTN-512 Morristown/Blount, Sevier, Campbell, Cocke Counties CoCTX-500 San Antonio/Bexar County CoCTX-501 Corpus Christi/Nueces County CoCTX-503 Austin/Travis County CoCTX-504 Dewitt, Lavaca, Victoria Counties CoCTX-600 Dallas City & County/Irving CoCTX-601 Fort Worth/Arlington/Tarrant CountyTX-603 El Paso City & County CoCTX-604 Waco/McLennan County CoCTX-607 Texas Balance of State CoCTX-610 Denton City & County CoCTX-611 Amarillo CoCTX-613 Longview/Marshall Area CoCTX-624 Wichita Falls/Wise, Palo Pinto, Wichita, Archer Counties CoCTX-700 Houston/Harris County CoCTX-701 Bryan/College Station/Brazos Valley CoCTX-702 Montgomery County CoCTX-703 Beaumont/Port Arthur/South East Texas CoCTX-704 Galveston/Gulf Coast CoCUT-500 Salt Lake City & County CoCUT-503 Utah Balance of State CoCUT-504 Provo/Mountainland CoCVA-500 Richmond/Henrico, Chesterfield, Hanover Counties CoCVA-501 Norfolk CoCVA-502 Roanoke City & County/Salem CoCVA-503 Virginia Beach CoCVA-504 Charlottesville CoCVA-505 Newport News/Hampton/Virginia Peninsula CoCVA-507 Portsmouth CoCVA-508 Lynchburg CoCVA-509 Petersburg CoCVA-510 Staunton/Waynesboro/Augusta, Highland Counties CoCVA-512 Chesapeake CoCVA-513 Winchester/Shenandoah, Frederick, Warren Counties CoCVA-514 Fredericksburg/Spotsylvania, Stafford Counties CoCVA-517 Danville/Martinsville CoCVA-518 Harrisburg/ Rockingham County CoCVA-519 Suffolk CoCVA-521 Virginia Balance of State CoCVA-600 Arlington County CoCVA-601 Fairfax County CoCVA-602 Loudoun County CoCVA-603 Alexandria CoC
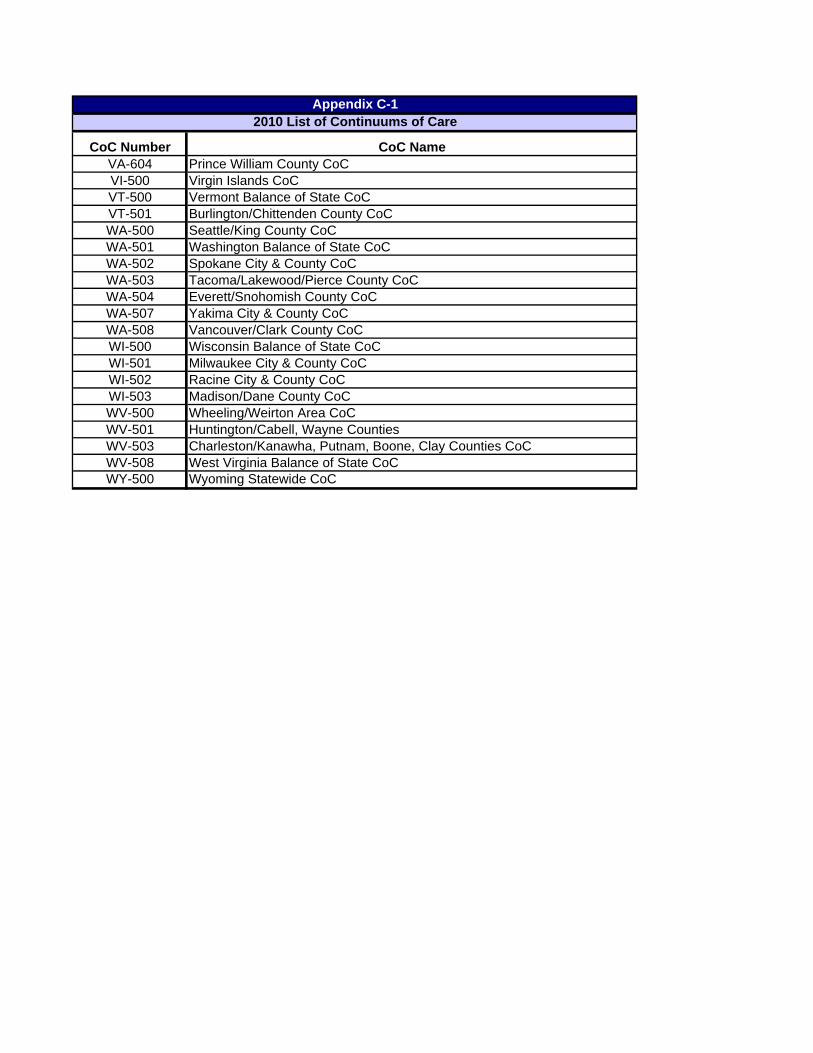
CoC Number CoC Name
Appendix C-12010 List of Continuums of Care
VA-604 Prince William County CoCVI-500 Virgin Islands CoCVT-500 Vermont Balance of State CoCVT-501 Burlington/Chittenden County CoCWA-500 Seattle/King County CoCWA-501 Washington Balance of State CoCWA-502 Spokane City & County CoCWA-503 Tacoma/Lakewood/Pierce County CoCWA-504 Everett/Snohomish County CoCWA-507 Yakima City & County CoCWA-508 Vancouver/Clark County CoCWI-500 Wisconsin Balance of State CoCWI-501 Milwaukee City & County CoCWI-502 Racine City & County CoCWI-503 Madison/Dane County CoCWV-500 Wheeling/Weirton Area CoCWV-501 Huntington/Cabell, Wayne CountiesWV-503 Charleston/Kanawha, Putnam, Boone, Clay Counties CoCWV-508 West Virginia Balance of State CoCWY-500 Wyoming Statewide CoC

State
2009 Total Homeless Population
2008 Total Homeless Population
2007 Total Homeless Population
2008-2009 Total Change
2008-2009 Percent Change
2007-2009 Total Change
2007-2009 Percent Change
Alabama 6,080 5,387 5,452 693 12.86% 628 11.52%Alaska 1,992 1,646 1,642 346 21.02% 350 21.32%Arizona 14,721 12,488 14,646 2,233 17.88% 75 0.51%Arkansas 2,852 3,255 3,836 -403 -12.38% -984 -25.65%California 133,129 157,277 159,732 -24,148 -15.35% -26,603 -16.65%Colorado 15,268 14,747 14,225 521 3.53% 1,043 7.33%Connecticut 4,605 4,627 4,482 -22 -0.48% 123 2.74%Delaware 1,130 933 1,061 197 21.11% 69 6.50%District Of Columbia 6,228 6,044 5,320 184 3.04% 908 17.07%Florida 55,599 50,158 48,069 5,441 10.85% 7,530 15.66%Georgia 20,360 19,095 19,639 1,265 6.62% 721 3.67%Guam 1,088 725 725 363 50.07% 363 50.07%Hawaii 5,782 6,061 6,070 -279 -4.60% -288 -4.74%Idaho 1,939 1,464 1,749 475 32.45% 190 10.86%Illinois 14,055 14,724 15,487 -669 -4.54% -1,432 -9.25%Indiana 6,984 7,395 7,358 -411 -5.56% -374 -5.08%Iowa 3,380 3,346 2,734 34 1.02% 646 23.63%Kansas 1,892 1,738 2,111 154 8.86% -219 -10.37%Kentucky 5,999 8,137 8,061 -2,138 -26.28% -2,062 -25.58%Louisiana 12,504 5,481 5,494 7,023 128.13% 7,010 127.59%Maine 2,444 2,632 2,638 -188 -7.14% -194 -7.35%Maryland 11,698 9,219 9,628 2,479 26.89% 2,070 21.50%Massachusetts 15,482 14,506 15,127 976 6.73% 355 2.35%Michigan 14,005 28,248 28,295 -14,243 -50.42% -14,290 -50.50%Minnesota 7,718 7,644 7,323 74 0.97% 395 5.39%Mississippi 2,797 1,961 1,377 836 42.63% 1,420 103.12%Missouri 6,959 7,687 6,247 -728 -9.47% 712 11.40%Montana 1,196 1,417 1,150 -221 -15.60% 46 4.00%Nebraska 3,718 3,985 3,531 -267 -6.70% 187 5.30%Nevada 14,478 12,610 12,526 1,868 14.81% 1,952 15.58%New Hampshire 1,645 2,019 2,248 -374 -18.52% -603 -26.82%New Jersey 13,169 13,832 17,314 -663 -4.79% -4,145 -23.94%New Mexico 3,475 3,015 3,015 460 15.26% 460 15.26%New York 61,067 61,125 62,601 -58 -0.09% -1,534 -2.45%North Carolina 12,918 12,411 11,802 507 4.09% 1,116 9.46%North Dakota 773 615 636 158 25.69% 137 21.54%Ohio 12,700 12,912 11,264 -212 -1.64% 1,436 12.75%Oklahoma 4,838 3,846 4,221 992 25.79% 617 14.62%Oregon 17,309 20,653 17,590 -3,344 -16.19% -281 -1.60%Pennsylvania 15,096 15,378 16,220 -282 -1.83% -1,124 -6.93%Puerto Rico 4,070 3,012 4,309 1,058 35.13% -239 -5.55%Rhode Island 1,607 1,196 1,372 411 34.36% 235 17.13%South Carolina 4,473 5,660 5,660 -1,187 -20.97% -1,187 -20.97%South Dakota 731 579 579 152 26.25% 152 26.25%Tennessee 10,532 9,705 11,210 827 8.52% -678 -6.05%Texas 36,761 40,190 39,788 -3,429 -8.53% -3,027 -7.61%Utah 3,795 3,434 3,011 361 10.51% 784 26.04%Vermont 1,214 954 1,035 260 27.25% 179 17.29%Virgin Islands 471 602 559 -131 -21.76% -88 -15.74%Virginia 8,852 8,469 9,746 383 4.52% -894 -9.17%Washington 22,782 21,954 23,379 828 3.77% -597 -2.55%West Virginia 1,667 2,016 2,409 -349 -17.31% -742 -30.80%Wisconsin 6,525 5,449 5,648 1,076 19.75% 877 15.53%Wyoming 515 751 537 -236 -31.42% -22 -4.10%TOTAL 643,067 664,414 671,888 -21,347 -3.21% -28,821 -4.29%
Appendix C-2Changes in Point-In-Time Estimates of Homeless Population by State, 2007-2009

State
Total Sheltered
Population
Total Unsheltered Population
Total Homeless Population
State Population
Homeless Rate
Alabama 3,913 2,167 6,080 4,708,708 0.13%Alaska 1,665 327 1,992 698,473 0.29%Arizona 8,366 6,355 14,721 6,595,778 0.22%Arkansas 1,730 1,122 2,852 2,889,450 0.10%California 50,777 82,352 133,129 36,961,664 0.36%Colorado 9,031 6,237 15,268 5,024,748 0.30%Connecticut 4,103 502 4,605 3,518,288 0.13%Delaware 1,083 47 1,130 885,122 0.13%District of Columbia 5,907 321 6,228 599,657 1.04%Florida 21,867 33,732 55,599 18,537,969 0.30%Georgia 9,419 10,941 20,360 9,829,211 0.21%Guam 182 906 1,088 178,430 0.61%Hawaii 3,268 2,514 5,782 1,295,178 0.45%Idaho 1,477 462 1,939 1,545,801 0.13%Illinois 11,851 2,204 14,055 12,910,409 0.11%Indiana 5,206 1,778 6,984 6,423,113 0.11%Iowa 3,221 159 3,380 3,007,856 0.11%Kansas 1,696 196 1,892 2,818,747 0.07%Kentucky 5,299 700 5,999 4,314,113 0.14%Louisiana 4,118 8,386 12,504 4,492,076 0.28%Maine 2,406 38 2,444 1,318,301 0.19%Maryland 7,446 4,252 11,698 5,699,478 0.21%Massachusetts 14,476 1,006 15,482 6,593,587 0.23%Michigan 11,298 2,707 14,005 9,969,727 0.14%Minnesota 6,772 946 7,718 5,266,214 0.15%Mississippi 1,221 1,576 2,797 2,951,996 0.09%Missouri 5,469 1,490 6,959 5,987,580 0.12%Montana 833 363 1,196 974,989 0.12%Nebraska 3,079 639 3,718 1,796,619 0.21%Nevada 7,792 6,686 14,478 2,643,085 0.55%New Hampshire 1,406 239 1,645 1,324,575 0.12%New Jersey 11,871 1,298 13,169 8,707,739 0.15%New Mexico 2,108 1,367 3,475 2,009,671 0.17%New York 57,454 3,613 61,067 19,541,453 0.31%North Carolina 8,473 4,445 12,918 9,380,884 0.14%North Dakota 765 8 773 646,844 0.12%Ohio 10,929 1,771 12,700 11,542,645 0.11%Oklahoma 3,307 1,531 4,838 3,687,050 0.13%Oregon 7,442 9,867 17,309 3,825,657 0.45%Pennsylvania 13,819 1,277 15,096 12,604,767 0.12%Puerto Rico 1,325 2,745 4,070 3,967,179 0.10%Rhode Island 1,556 51 1,607 1,053,209 0.15%South Carolina 3,036 1,437 4,473 4,561,242 0.10%South Dakota 667 64 731 812,383 0.09%Tennessee 7,133 3,399 10,532 6,296,254 0.17%Texas 21,658 15,103 36,761 24,782,302 0.15%Utah 3,540 255 3,795 2,784,572 0.14%Vermont 1,057 157 1,214 621,760 0.20%Virgin Islands 76 395 471 109,825 0.43%Virginia 7,284 1,568 8,852 7,882,590 0.11%Washington 16,237 6,545 22,782 6,664,195 0.34%West Virginia 1,278 389 1,667 1,819,777 0.09%Wisconsin 5,465 1,060 6,525 5,654,774 0.12%Wyoming 451 64 515 544,270 0.09%TOTAL 403,308 239,759 643,067 311,261,984 0.21%
Appendix C-3Point-In-Time Estimates from January 2009 of Homeless Population by State

2009 2008 2007 2006Total Change
08-09% Change 08-
09Total Change
07-08% Change 07-
08Total Change
06-07% Change 06-
07Total Change
06-09% Change 06-
09
1 AK-500 Anchorage CoC 1,110 921 842 1,042 189 20.5% 79 9.4% -200 -19.2% 68 6.5% 66.67%
2 AK-501 Alaska Balance of State CoC 555 531 545 544 24 4.5% -14 -2.6% 1 0.2% 11 2.0% 33.33%
3 AL-500 Birmingham/Shelby Counties CoC 1,069 1,240 1,240 1,653 -171 -13.8% 0 0.0% -413 -25.0% -584 -35.3% 27.32%
4 AL-501 Mobile City & County/Baldwin County 411 341 410 482 70 20.5% -69 -16.8% -72 -14.9% -71 -14.7% 10.50%
5 AL-502 Florence/Northwest Alabama CoC 213 178 131 109 35 19.7% 47 35.9% 22 20.2% 104 95.4% 5.44%
6 AL-503 Huntsville/North Alabama CoC 574 637 756 928 -63 -9.9% -119 -15.7% -172 -18.5% -354 -38.1% 14.67%
7 AL-504 Montgomery City & County CoC 263 327 331 373 -64 -19.6% -4 -1.2% -42 -11.3% -110 -29.5% 6.72%
8 AL-505 Gadsden/Northeast Alabama CoC 307 262 104 95 45 17.2% 158 151.9% 9 9.5% 212 223.2% 7.85%
9 AL-506 Tuscaloosa City & County CoC 261 192 332 177 69 35.9% -140 -42.2% 155 87.6% 84 47.5% 6.67%
10 AL-507 Alabama Balance of State 815 666 492 263 149 22.4% 174 35.4% 229 87.1% 552 209.9% 20.83%
11 AR-500 Little Rock/Central Arkansas CoC 973 1,176 1,187 12,495 -203 -17.3% -11 -0.9% -11,308 -90.5% -11,522 -92.2% 56.24%
12 AR-501 Fayetteville/Northwest Arkansas CoC 191 273 244 170 -82 -30.0% 29 11.9% 74 43.5% 21 12.4% 11.04%
13 AR-502 Conway/Faulkener, Perry Counties CoC 34 59 59 1,048 -25 -42.4% 0 0.0% -989 -94.4% -1,014 -96.8% 1.97%
14 AR-504 Delta Hills CoC 459 374 391 681 85 22.7% -17 -4.3% -290 -42.6% -222 -32.6% 26.53%
15 AR-505 Southeast Arkansas CoC 51 120 120 53 -69 -57.5% 0 0.0% 67 126.4% -2 -3.8% 2.95%
16 AR-506 Johnson, Pope, Yell Counties CoC 22 18 18 0 4 22.2% 0 0.0% 18 - 22 - 1.27%
17 AZ-500 Arizona Balance of State CoC 1,172 956 1,013 998 216 22.6% -57 -5.6% 15 1.5% 174 17.4% 14.01%
18 AZ-501 Tucson/Pima County CoC 2,223 1,251 2,010 1,938 972 77.7% -759 -37.8% 72 3.7% 285 14.7% 26.57%
19 AZ-502 Phoenix/Mesa/Maricopa County 4,971 4,763 5,595 5,416 208 4.4% -832 -14.9% 179 3.3% -445 -8.2% 59.42%
20 CA-500 San Jose/Santa Clara City & County 2,103 2,101 2,101 2,623 2 0.1% 0 0.0% -522 -19.9% -520 -19.8% 4.14%
21 CA-501 San Francisco CoC 2,881 2,400 2,912 2,749 481 20.0% -512 -17.6% 163 5.9% 132 4.8% 5.67%
22 CA-502 Oakland/Alameda County CoC 2,378 2,342 2,342 2,590 36 1.5% 0 0.0% -248 -9.6% -212 -8.2% 4.68%
23 CA-503 Sacramento City & County CoC 1,606 1,349 1,447 1,584 257 19.1% -98 -6.8% -137 -8.6% 22 1.4% 3.16%
24 CA-504 Santa Rosa/Petaluma/Sonoma County 1,025 782 782 954 243 31.1% 0 0.0% -172 -18.0% 71 7.4% 2.02%
25 CA-505 Richmond/Contra Costa County CoC 887 903 903 993 -16 -1.8% 0 0.0% -90 -9.1% -106 -10.7% 1.75%
26 CA-506 Salinas/Monterey County CoC 779 509 509 539 270 53.0% 0 0.0% -30 -5.6% 240 44.5% 1.53%
27 CA-507 Marin County CoC 597 602 602 575 -5 -0.8% 0 0.0% 27 4.7% 22 3.8% 1.18%
28 CA-508 Watsonville/Santa Cruz City & County 729 486 486 674 243 50.0% 0 0.0% -188 -27.9% 55 8.2% 1.44%
29 CA-509 Mendocino County CoC 235 285 284 142 -50 -17.5% 1 0.4% 142 100.0% 93 65.5% 0.46%
30 CA-510 Turlock/Modesto/Stanislaus County 801 634 634 678 167 26.3% 0 0.0% -44 -6.5% 123 18.1% 1.58%
31 CA-511 Stockton/San Joaquin County 2,840 2,051 2,176 2,772 789 38.5% -125 -5.7% -596 -21.5% 68 2.5% 5.59%
32 CA-512 Daly/San Mateo County CoC 764 704 704 740 60 8.5% 0 0.0% -36 -4.9% 24 3.2% 1.50%
33 CA-513 Visalia, Kings, Tulare Counties CoC 210 189 280 1,330 21 11.1% -91 -32.5% -1,050 -78.9% -1,120 -84.2% 0.41%
34 CA-514 Fresno/Madera County CoC 1,888 1,951 2,735 2,553 -63 -3.2% -784 -28.7% 182 7.1% -665 -26.0% 3.72%
35 CA-515 Roseville/Placer County CoC 382 450 450 375 -68 -15.1% 0 0.0% 75 20.0% 7 1.9% 0.75%
36 CA-516 Redding/Shasta County CoC 194 201 250 205 -7 -3.5% -49 -19.6% 45 22.0% -11 -5.4% 0.38%
37 CA-517 Napa City & County CoC 186 219 219 194 -33 -15.1% 0 0.0% 25 12.9% -8 -4.1% 0.37%
38 CA-518 Vallejo/Solano County CoC 403 457 457 561 -54 -11.8% 0 0.0% -104 -18.5% -158 -28.2% 0.79%
39 CA-519 Chico/Paradise/Butte County CoC 303 322 936 370 -19 -5.9% -614 -65.6% 566 153.0% -67 -18.1% 0.60%
40 CA-520 Merced City & County CoC 148 135 221 221 13 9.6% -86 -38.9% 0 0.0% -73 -33.0% 0.29%
41 CA-521 Davis/Woodland/Yolo County CoC 202 228 228 230 -26 -11.4% 0 0.0% -2 -0.9% -28 -12.2% 0.40%
42 CA-522 Humboldt County CoC 355 322 322 366 33 10.2% 0 0.0% -44 -12.0% -11 -3.0% 0.70%
43 CA-523 Colusa/Glenn/Tehama/Trinity Counties Coc 74 0 54 - 74 - -54 -100.0% - - - - 0.15%
44 CA-524 Yuba City, Marysville/Sutter, Yuba Counties CoC 303 483 299 202 -180 -37.3% 184 61.5% 97 48.0% 101 50.0% 0.60%
45 CA-525 El Dorado County CoC 63 75 91 0 -12 -16.0% -16 -17.6% 91 - 63 - 0.12%
46 CA-526 Tuolumne, Calaveras, Amador Counties CoC 150 79 79 0 71 89.9% 0 0.0% 79 - 150 - 0.30%
47 CA-527 Nevada County 190 - - - - - - - - - - - 0.37%
48 CA-600 Los Angeles City & County CoC 14,050 11,442 11,442 9,878 2,608 22.8% 0 0.0% 1,564 15.8% 4,172 42.2% 27.67%
49 CA-601 San Diego CoC 2,470 2,618 2,469 3,623 -148 -5.7% 149 6.0% -1,154 -31.9% -1,153 -31.8% 4.86%
50 CA-602 Santa Ana/Anaheim/Orange County CoC 2,609 2,578 2,578 2,101 31 1.2% 0 0.0% 477 22.7% 508 24.2% 5.14%
51 CA-603 Santa Maria/Santa Barbara County 1,148 1,480 1,480 1,147 -332 -22.4% 0 0.0% 333 29.0% 1 0.1% 2.26%
52 CA-604 Bakersfield/Kern County CoC 667 905 905 681 -238 -26.3% 0 0.0% 224 32.9% -14 -2.1% 1.31%
53 CA-605 San Buena Ventura/Ventura County 205 359 359 419 -154 -42.9% 0 0.0% -60 -14.3% -214 -51.1% 0.40%
54 CA-606 Long Beach CoC 2,154 1,679 1,679 1,670 475 28.3% 0 0.0% 9 0.5% 484 29.0% 4.24%
55 CA-607 Pasadena CoC 403 434 434 754 -31 -7.1% 0 0.0% -320 -42.4% -351 -46.6% 0.79%
56 CA-608 Riverside City & County CoC 1,323 1,330 1,330 1,654 -7 -0.5% 0 0.0% -324 -19.6% -331 -20.0% 2.61%
57 CA-609 San Bernardino City & County CoC 768 1,220 1,220 945 -452 -37.0% 0 0.0% 275 29.1% -177 -18.7% 1.51%
58 CA-610 San Diego County CoC 1,511 1,799 1,512 2,799 -288 -16.0% 287 19.0% -1,287 -46.0% -1,288 -46.0% 2.98%
59 CA-611 Oxnard CoC 256 192 67 318 64 33.3% 125 186.6% -251 -78.9% -62 -19.5% 0.50%
Continuum of Care Sheltered Point-In-Time Homeless Counts, 2006-2009
#CoC Number CoC Name 1
Sheltered PIT Counts Change 2006 to 2009 % of Statewide Sheltered
Count

2009 2008 2007 2006Total Change
08-09% Change 08-
09Total Change
07-08% Change 07-
08Total Change
06-07% Change 06-
07Total Change
06-09% Change 06-
09
Continuum of Care Sheltered Point-In-Time Homeless Counts, 2006-2009
#CoC Number CoC Name 1
Sheltered PIT Counts Change 2006 to 2009 % of Statewide Sheltered
Count
60 CA-612 Glendale CoC 138 233 233 104 -95 -40.8% 0 0.0% 129 124.0% 34 32.7% 0.27%
61 CA-613 El Centro/Imperial County CoC 157 156 113 0 1 0.6% 43 38.1% 113 - 157 - 0.31%
62 CA-614 San Luis Obispo County CoC 242 281 187 222 -39 -13.9% 94 50.3% -35 -15.8% 20 9.0% 0.48%
63 CO-500 Colorado Balance of State CoC 1,087 1,233 1,093 1,578 -146 -11.8% 140 12.8% -485 -30.7% -491 -31.1% 12.04%
64 CO-503 Metropolitan Denver Homeless Initiative 7,053 4,951 5,185 5,390 2,102 42.5% -234 -4.5% -205 -3.8% 1,663 30.9% 78.10%
65 CO-504 Colorado Springs/El Paso County CoC 891 693 693 752 198 28.6% 0 0.0% -59 -7.8% 139 18.5% 9.87%
66 CT-500 Danbury CoC 126 116 127 258 10 8.6% -11 -8.7% -131 -50.8% -132 -51.2% 3.07%
67 CT-501 New Haven CoC 717 722 641 858 -5 -0.7% 81 12.6% -217 -25.3% -141 -16.4% 17.48%
68 CT-502 Hartford CoC 1,205 1,251 891 829 -46 -3.7% 360 40.4% 62 7.5% 376 45.4% 29.37%
69 CT-503 Bridgeport/Stratford/Fairfield CoC 269 311 324 338 -42 -13.5% -13 -4.0% -14 -4.1% -69 -20.4% 6.56%
70 CT-504 Middletown/Middlesex County CoC 206 187 201 289 19 10.2% -14 -7.0% -88 -30.4% -83 -28.7% 5.02%
71 CT-505 Connecticut Balance of State CoC 512 387 492 399 125 32.3% -105 -21.3% 93 23.3% 113 28.3% 12.48%
72 CT-506 Norwalk/Fairfield County CoC 186 183 213 191 3 1.6% -30 -14.1% 22 11.5% -5 -2.6% 4.53%
73 CT-507 Norwich/New London City & Couny 273 288 248 250 -15 -5.2% 40 16.1% -2 -0.8% 23 9.2% 6.65%
74 CT-508 Stamford/Greenwich CoC 265 255 252 403 10 3.9% 3 1.2% -151 -37.5% -138 -34.2% 6.46%
75 CT-509 New Britain CoC 127 103 91 162 24 23.3% 12 13.2% -71 -43.8% -35 -21.6% 3.10%
76 CT-510 Bristol CoC 58 62 59 58 -4 -6.5% 3 5.1% 1 1.7% 0 0.0% 1.41%
77 CT-512 City of Waterbury CoC 159 155 132 171 4 2.6% 23 17.4% -39 -22.8% -12 -7.0% 3.88%
78 DC-500 District of Columbia CoC 5,907 5,666 4,980 5,286 241 4.3% 686 13.8% -306 -5.8% 621 11.7% 100.00%
79 DE-500 Delaware Statewide CoC 1,083 862 854 876 221 25.6% 8 0.9% -22 -2.5% 207 23.6% 100.00%
80 FL-500 Sarasota, Bradenton, Manatee Counties 348 530 494 945 -182 -34.3% 36 7.3% -451 -47.7% -597 -63.2% 1.59%
81 FL-501 Tampa/Hillsborough County CoC 726 1,050 1,050 6,241 -324 -30.9% 0 0.0% -5,191 -83.2% -5,515 -88.4% 3.32%
82 FL-502 St. Petersburg/Pinellas County CoC 1,691 1,305 1,305 2,214 386 29.6% 0 0.0% -909 -41.1% -523 -23.6% 7.73%
83 FL-503 Lakeland/Highlands Counties CoC 366 499 487 420 -133 -26.7% 12 2.5% 67 16.0% -54 -12.9% 1.67%
84 FL-504 Daytona Beach/Flagler Counties CoC 593 576 569 514 17 3.0% 7 1.2% 55 10.7% 79 15.4% 2.71%
85 FL-505 Fort Walton Beach/Walton Counties CoC 309 330 105 116 -21 -6.4% 225 214.3% -11 -9.5% 193 166.4% 1.41%
86 FL-506 Tallahassee/Leon County CoC 536 495 495 580 41 8.3% 0 0.0% -85 -14.7% -44 -7.6% 2.45%
87 FL-507 Orlando/Orange/Seminole Counties CoC 2,454 2,366 2,003 2,308 88 3.7% 363 18.1% -305 -13.2% 146 6.3% 11.22%
88 FL-508 Gainesville/Alachua, Putnam 301 279 263 278 22 7.9% 16 6.1% -15 -5.4% 23 8.3% 1.38%
89 FL-509 Fort Pierce/St. Lucie/Martin Counties CoC 289 298 458 494 -9 -3.0% -160 -34.9% -36 -7.3% -205 -41.5% 1.32%
90 FL-510 Jacksonville-Duval, Clay Counties CoC 2,019 1,492 1,585 1,462 527 35.3% -93 -5.9% 123 8.4% 557 38.1% 9.23%
91 FL-511 Pensacola/Esca/Santa Rosa County CoC 412 375 347 294 37 9.9% 28 8.1% 53 18.0% 118 40.1% 1.88%
92 FL-512 Saint Johns County CoC 106 106 106 163 0 0.0% 0 0.0% -57 -35.0% -57 -35.0% 0.48%
93 FL-513 Palm Bay/Brevard County CoC 1,002 502 502 1,002 500 99.6% 0 0.0% -500 -49.9% 0 0.0% 4.58%
94 FL-514 Ocala/Marion County CoC 297 312 312 331 -15 -4.8% 0 0.0% -19 -5.7% -34 -10.3% 1.36%
95 FL-515 Panama City CoC 249 211 211 226 38 18.0% 0 0.0% -15 -6.6% 23 10.2% 1.14%
96 FL-516 Winterhaven/Polk County CoC 0 209 0 0 -209 -100.0% 209 - 0 - 0 - 0.00%
97 FL-517 Hardee/Highlands Counties CoC 101 101 664 2,531 0 0.0% -563 -84.8% -1,867 -73.8% -2,430 -96.0% 0.46%
98 FL-518 Columbia/Suwannee CoC 165 92 85 110 73 79.3% 7 8.2% -25 -22.7% 55 50.0% 0.75%
99 FL-519 Passo County 1,674 1,500 1,379 2,499 174 11.6% 121 8.8% -1,120 -44.8% -825 -33.0% 7.66%
100 FL-520 Citrus/Hernando/Lake 236 216 192 411 20 9.3% 24 12.5% -219 -53.3% -175 -42.6% 1.08%
101 FL-600 Miami/Dade County CoC 3,339 3,227 3,012 2,955 112 3.5% 215 7.1% 57 1.9% 384 13.0% 15.27%
102 FL-601 Ft Lauderdale/Broward County CoC 2,425 2,453 2,453 2,672 -28 -1.1% 0 0.0% -219 -8.2% -247 -9.2% 11.09%
103 FL-602 Punta Gorda/Charlotte County CoC 394 450 450 123 -56 -12.4% 0 0.0% 327 265.9% 271 220.3% 1.80%
104 FL-603 Ft Myers/Cape Coral/Lee County CoC 515 386 433 706 129 33.4% -47 -10.9% -273 -38.7% -191 -27.1% 2.36%
105 FL-604 Monroe County CoC 324 477 477 437 -153 -32.1% 0 0.0% 40 9.2% -113 -25.9% 1.48%
106 FL-605 West Palm Beach/Palm Beach County 740 727 727 860 13 1.8% 0 0.0% -133 -15.5% -120 -14.0% 3.38%
107 FL-606 Collier County CoC 256 160 365 277 96 60.0% -205 -56.2% 88 31.8% -21 -7.6% 1.17%
108 GA-500 City of Atlanta CoC 4,855 4,725 4,725 4,368 130 2.8% 0 0.0% 357 8.2% 487 11.1% 51.54%
109 GA-501 Georgia Balance of State CoC 2,134 2,267 1,971 3,319 -133 -5.9% 296 15.0% -1,348 -40.6% -1,185 -35.7% 22.66%
110 GA-503 Athens/Clarke County CoC 248 303 333 388 -55 -18.2% -30 -9.0% -55 -14.2% -140 -36.1% 2.63%
111 GA-504 Augusta CoC 512 496 451 532 16 3.2% 45 10.0% -81 -15.2% -20 -3.8% 5.44%
112 GA-505 Columbus-Muscogee/Russell County CoC 254 244 188 246 10 4.1% 56 29.8% -58 -23.6% 8 3.3% 2.70%
113 GA-506 Marietta/Cobb County CoC 354 329 329 330 25 7.6% 0 0.0% -1 -0.3% 24 7.3% 3.76%
114 GA-507 Savannah/Chatham County CoC 1,062 501 344 316 561 112.0% 157 45.6% 28 8.9% 746 236.1% 11.28%
115 GU-500 Guam CoC 182 103 103 258 79 76.7% 0 0.0% -155 -60.1% -76 -29.5% 100.00%
116 HI-500 Hawaii Balance of State CoC 823 746 755 926 77 10.3% -9 -1.2% -171 -18.5% -103 -11.1% 25.18%
117 HI-501 Honolulu CoC 2,445 1,957 1,957 1,050 488 24.9% 0 0.0% 907 86.4% 1,395 132.9% 74.82%

2009 2008 2007 2006Total Change
08-09% Change 08-
09Total Change
07-08% Change 07-
08Total Change
06-07% Change 06-
07Total Change
06-09% Change 06-
09
Continuum of Care Sheltered Point-In-Time Homeless Counts, 2006-2009
#CoC Number CoC Name 1
Sheltered PIT Counts Change 2006 to 2009 % of Statewide Sheltered
Count
118 IA-500 Sioux City/Dakota County CoC 259 260 159 165 -1 -0.4% 101 63.5% -6 -3.6% 94 57.0% 8.04%
119 IA-501 Iowa Balance of State CoC 1,891 1,824 1,340 1,746 67 3.7% 484 36.1% -406 -23.3% 145 8.3% 58.71%
120 IA-502 Des Moines/Polk County CoC 1,071 1,003 942 1,209 68 6.8% 61 6.5% -267 -22.1% -138 -11.4% 33.25%
121 ID-500 Boise/Ada County CoC 644 553 472 133 91 16.5% 81 17.2% 339 254.9% 511 384.2% 43.60%
122 ID-501 Idaho Balance of State CoC 833 697 653 997 136 19.5% 44 6.7% -344 -34.5% -164 -16.4% 56.40%
123 IL-500 McHenry County CoC 247 195 235 177 52 26.7% -40 -17.0% 58 32.8% 70 39.5% 2.08%
124 IL-501 Rockford/Winnebago, Boone Counties 347 525 525 448 -178 -33.9% 0 0.0% 77 17.2% -101 -22.5% 2.93%
125 IL-502 North Chicago/Lake County CoC 368 430 486 405 -62 -14.4% -56 -11.5% 81 20.0% -37 -9.1% 3.11%
126 IL-503 Champaign/Urbana/Champaign County CoC 530 416 416 295 114 27.4% 0 0.0% 121 41.0% 235 79.7% 4.47%
127 IL-504 Madison County CoC 161 189 203 308 -28 -14.8% -14 -6.9% -105 -34.1% -147 -47.7% 1.36%
128 IL-505 Evanston CoC 93 93 93 95 0 0.0% 0 0.0% -2 -2.1% -2 -2.1% 0.78%
129 IL-506 Joliet/Bolingbrook/Will County CoC 331 299 379 345 32 10.7% -80 -21.1% 34 9.9% -14 -4.1% 2.79%
130 IL-507 Peoria/Perkin/Woodford CoC 330 342 336 362 -12 -3.5% 6 1.8% -26 -7.2% -32 -8.8% 2.78%
131 IL-508 East Saint Louis/Saint Clair County CoC 242 218 442 349 24 11.0% -224 -50.7% 93 26.6% -107 -30.7% 2.04%
132 IL-509 DeKalb City & County CoC 84 106 106 67 -22 -20.8% 0 0.0% 39 58.2% 17 25.4% 0.71%
133 IL-510 Chicago CoC 5,356 4,346 4,346 4,969 1,010 23.2% 0 0.0% -623 -12.5% 387 7.8% 45.19%
134 IL-511 Cook County CoC 1,034 1,069 1,069 1,024 -35 -3.3% 0 0.0% 45 4.4% 10 1.0% 8.73%
135 IL-512 Bloomington/Central Illinois CoC 482 399 399 339 83 20.8% 0 0.0% 60 17.7% 143 42.2% 4.07%
136 IL-513 Springfield/Sangamon County CoC 248 228 245 297 20 8.8% -17 -6.9% -52 -17.5% -49 -16.5% 2.09%
137 IL-514 Dupage County CoC 587 642 642 538 -55 -8.6% 0 0.0% 104 19.3% 49 9.1% 4.95%
138 IL-515 South Central Illinois CoC 234 235 214 127 -1 -0.4% 21 9.8% 87 68.5% 107 84.3% 1.97%
139 IL-516 Decatur/Macon County CoC 150 167 167 180 -17 -10.2% 0 0.0% -13 -7.2% -30 -16.7% 1.27%
140 IL-517 Aurora/Elgin/Kane County CoC 392 418 418 452 -26 -6.2% 0 0.0% -34 -7.5% -60 -13.3% 3.31%
141 IL-518 Rock Island...Northwestern Illinois CoC 348 268 506 676 80 29.9% -238 -47.0% -170 -25.1% -328 -48.5% 2.94%
142 IL-519 West Central Illinois CoC 127 99 148 140 28 28.3% -49 -33.1% 8 5.7% -13 -9.3% 1.07%
143 IL-520 Southern Illinois CoC 160 796 796 401 -636 -79.9% 0 0.0% 395 98.5% -241 -60.1% 1.35%
144 IN-500 South Bend/Mishawaka/St. Joseph County CoC 527 681 584 0 -154 -22.6% 97 16.6% 584 - 527 - 10.12%
145 IN-502 Indiana Balance of State CoC 3,412 3,878 3,878 5,086 -466 -12.0% 0 0.0% -1,208 -23.8% -1,674 -32.9% 65.54%
146 IN-503 Indianapolis CoC 1,267 1,364 1,634 1,993 -97 -7.1% -270 -16.5% -359 -18.0% -726 -36.4% 24.34%
147 KS-501 Kansas City/Wyandotte County CoC 180 109 130 100 71 65.1% -21 -16.2% 30 30.0% 80 80.0% 10.61%
148 KS-502 Wichita/Sedgwick County CoC 352 445 473 394 -93 -20.9% -28 -5.9% 79 20.1% -42 -10.7% 20.75%
149 KS-503 Topeka/Shawnee County CoC 198 316 226 457 -118 -37.3% 90 39.8% -231 -50.5% -259 -56.7% 11.67%
150 KS-505 Overland Park/Johnson County CoC 166 147 147 157 19 12.9% 0 0.0% -10 -6.4% 9 5.7% 9.79%
151 KS-507 Kansas Balance of State CoC 800 483 483 2,026 317 65.6% 0 0.0% -1,543 -76.2% -1,226 -60.5% 47.17%
152 KY-500 Kentucky Balance of State CoC 2,688 2,416 2,421 3,611 272 11.3% -5 -0.2% -1,190 -33.0% -923 -25.6% 50.73%
153 KY-501 Louisville/Jefferson County CoC 1,361 2,537 2,407 1,465 -1,176 -46.4% 130 5.4% 942 64.3% -104 -7.1% 25.68%
154 KY-502 Lexington/Fayette County CoC 1,250 1,242 1,112 841 8 0.6% 130 11.7% 271 32.2% 409 48.6% 23.59%
155 LA-500 Lafayette/Acadiana CoC 538 457 457 508 81 17.7% 0 0.0% -51 -10.0% 30 5.9% 13.06%
156 LA-501 Lake Charles/Southwestern Louisiana 29 54 219 158 -25 -46.3% -165 -75.3% 61 38.6% -129 -81.6% 0.70%
157 LA-502 Shreveport/Bossier/Northwest CoC 739 898 723 605 -159 -17.7% 175 24.2% 118 19.5% 134 22.1% 17.95%
158 LA-503 New Orleans/Jefferson Parish CoC 1,340 990 990 1,460 350 35.4% 0 0.0% -470 -32.2% -120 -8.2% 32.54%
159 LA-504 Baton Rouge CoC 739 675 801 722 64 9.5% -126 -15.7% 79 10.9% 17 2.4% 17.95%
160 LA-505 Monroe/Northeast Louisiana CoC 187 201 262 316 -14 -7.0% -61 -23.3% -54 -17.1% -129 -40.8% 4.54%
161 LA-506 Slidell/Livingston/Southeast Louisiana CoC 217 210 203 246 7 3.3% 7 3.4% -43 -17.5% -29 -11.8% 5.27%
162 LA-507 Alexandria/Central Louisiana CoC 104 93 140 1,379 11 11.8% -47 -33.6% -1,239 -89.8% -1,275 -92.5% 2.53%
163 LA-508 Houma-Terrebonne CoC 225 122 122 135 103 84.4% 0 0.0% -13 -9.6% 90 66.7% 5.46%
164 MA-500 Boston CoC 4,882 5,014 4,798 4,956 -132 -2.6% 216 4.5% -158 -3.2% -74 -1.5% 33.72%
165 MA-501 Franklin/Holyoke County CoC 1,336 1,013 911 517 323 31.9% 102 11.2% 394 76.2% 819 158.4% 9.23%
166 MA-502 Lynn CoC 580 350 208 189 230 65.7% 142 68.3% 19 10.1% 391 206.9% 4.01%
167 MA-503 Cape Cod/Islands CoC 407 424 368 510 -17 -4.0% 56 15.2% -142 -27.8% -103 -20.2% 2.81%
168 MA-504 Springfield CoC 762 676 1,020 410 86 12.7% -344 -33.7% 610 148.8% 352 85.9% 5.26%
169 MA-505 New Bedford CoC 408 299 356 384 109 36.5% -57 -16.0% -28 -7.3% 24 6.3% 2.82%
170 MA-506 Worcester City & County CoC 1,361 1,257 1,268 1,149 104 8.3% -11 -0.9% 119 10.4% 212 18.5% 9.40%
171 MA-507 Pittsfield/Berkshire County CoC 191 210 315 288 -19 -9.0% -105 -33.3% 27 9.4% -97 -33.7% 1.32%
172 MA-508 Lowell CoC 298 390 418 314 -92 -23.6% -28 -6.7% 104 33.1% -16 -5.1% 2.06%
173 MA-509 Cambridge CoC 594 424 376 405 170 40.1% 48 12.8% -29 -7.2% 189 46.7% 4.10%
174 MA-510 Gloucester...Essex County 744 625 584 516 119 19.0% 41 7.0% 68 13.2% 228 44.2% 5.14%
175 MA-511 Quincy/Weymouth CoC 309 233 246 221 76 32.6% -13 -5.3% 25 11.3% 88 39.8% 2.13%

2009 2008 2007 2006Total Change
08-09% Change 08-
09Total Change
07-08% Change 07-
08Total Change
06-07% Change 06-
07Total Change
06-09% Change 06-
09
Continuum of Care Sheltered Point-In-Time Homeless Counts, 2006-2009
#CoC Number CoC Name 1
Sheltered PIT Counts Change 2006 to 2009 % of Statewide Sheltered
Count
176 MA-512 Lawrence CoC 252 270 291 140 -18 -6.7% -21 -7.2% 151 107.9% 112 80.0% 1.74%
177 MA-513 Malden/Medford CoC 282 123 115 140 159 129.3% 8 7.0% -25 -17.9% 142 101.4% 1.95%
178 MA-515 Fall River CoC 144 138 139 143 6 4.3% -1 -0.7% -4 -2.8% 1 0.7% 0.99%
179 MA-516 Massachusetts Balance of State CoC 642 373 599 357 269 72.1% -226 -37.7% 242 67.8% 285 79.8% 4.43%
180 MA-517 Somerville CoC 128 177 196 215 -49 -27.7% -19 -9.7% -19 -8.8% -87 -40.5% 0.88%
181 MA-518 Brookline/Newton CoC 135 118 128 205 17 14.4% -10 -7.8% -77 -37.6% -70 -34.1% 0.93%
182 MA-519 Attleboro/Taunton/Bristol County CoC 113 103 229 230 10 9.7% -126 -55.0% -1 -0.4% -117 -50.9% 0.78%
183 MA-520 Brockton/Plymouth City & County CoC 908 591 573 543 317 53.6% 18 3.1% 30 5.5% 365 67.2% 6.27%
184 MD-500 Cumberland/Allegany County CoC 203 83 141 161 120 144.6% -58 -41.1% -20 -12.4% 42 26.1% 2.73%
185 MD-501 Baltimore City CoC 2,191 1,978 1,978 2,321 213 10.8% 0 0.0% -343 -14.8% -130 -5.6% 29.43%
186 MD-502 Harford County CoC 128 132 132 95 -4 -3.0% 0 0.0% 37 38.9% 33 34.7% 1.72%
187 MD-503 Annapolis/Anne Arundel County CoC 232 240 218 208 -8 -3.3% 22 10.1% 10 4.8% 24 11.5% 3.12%
188 MD-504 Howard County CoC 133 135 151 153 -2 -1.5% -16 -10.6% -2 -1.3% -20 -13.1% 1.79%
189 MD-505 Baltimore County CoC 1,114 393 576 510 721 183.5% -183 -31.8% 66 12.9% 604 118.4% 14.96%
190 MD-506 Carroll County CoC 123 161 161 186 -38 -23.6% 0 0.0% -25 -13.4% -63 -33.9% 1.65%
191 MD-507 Cecil County CoC 146 139 117 80 7 5.0% 22 18.8% 37 46.3% 66 82.5% 1.96%
192 MD-508 Charles, Calvert, St.Mary's CoC 536 253 302 370 283 111.9% -49 -16.2% -68 -18.4% 166 44.9% 7.20%
193 MD-509 Frederick City & County CoC 257 224 214 198 33 14.7% 10 4.7% 16 8.1% 59 29.8% 3.45%
194 MD-510 Garrett County CoC 4 63 63 42 -59 -93.7% 0 0.0% 21 50.0% -38 -90.5% 0.05%
195 MD-511 Mid-Shore Regional CoC 138 139 139 75 -1 -0.7% 0 0.0% 64 85.3% 63 84.0% 1.85%
196 MD-512 Hagerstown/Washington County CoC 110 192 209 219 -82 -42.7% -17 -8.1% -10 -4.6% -109 -49.8% 1.48%
197 MD-513 Wicomico/Somerset/Worcester CoC 240 214 178 157 26 12.1% 36 20.2% 21 13.4% 83 52.9% 3.22%
198 MD-600 Bowie/Prince George's County CoC 771 798 823 890 -27 -3.4% -25 -3.0% -67 -7.5% -119 -13.4% 10.35%
199 MD-601 Montgomery County CoC 1,120 910 1,016 991 210 23.1% -106 -10.4% 25 2.5% 129 13.0% 15.04%
200 ME-500 Maine Balance of State CoC 1,276 1,341 1,358 1,277 -65 -4.8% -17 -1.3% 81 6.3% -1 -0.1% 53.03%
201 ME-501 Bangor/Penobscot County Coc 465 523 486 539 -58 -11.1% 37 7.6% -53 -9.8% -74 -13.7% 19.33%
202 ME-502 Portland CoC 665 724 732 773 -59 -8.1% -8 -1.1% -41 -5.3% -108 -14.0% 27.64%
203 MI-500 Michigan Balance of State CoC 1,874 1,319 1,319 1,377 555 42.1% 0 0.0% -58 -4.2% 497 36.1% 16.59%
204 MI-501 Detroit CoC 3,432 4,738 4,738 4,311 -1,306 -27.6% 0 0.0% 427 9.9% -879 -20.4% 30.38%
205 MI-502 Dearborn/Wayne County CoC 422 618 618 503 -196 -31.7% 0 0.0% 115 22.9% -81 -16.1% 3.74%
206 MI-503 St. Clair Shores/Warren/Macomb County 292 251 251 314 41 16.3% 0 0.0% -63 -20.1% -22 -7.0% 2.58%
207 MI-504 Pontiac/Royal Oak/Oakland County 381 402 402 598 -21 -5.2% 0 0.0% -196 -32.8% -217 -36.3% 3.37%
208 MI-505 Flint/Genesee County CoC 193 227 213 293 -34 -15.0% 14 6.6% -80 -27.3% -100 -34.1% 1.71%
209 MI-506 Grand Rapids/Wyoming/Kent County 834 752 807 814 82 10.9% -55 -6.8% -7 -0.9% 20 2.5% 7.38%
210 MI-507 Portage/Kalamazoo City & County 971 783 593 411 188 24.0% 190 32.0% 182 44.3% 560 136.3% 8.59%
211 MI-508 Lansing/East Lansing/Ingham County 396 391 391 347 5 1.3% 0 0.0% 44 12.7% 49 14.1% 3.51%
212 MI-509 Ann Arbor/Washtenaw County CoC 307 357 357 252 -50 -14.0% 0 0.0% 105 41.7% 55 21.8% 2.72%
213 MI-510 Saginaw City & County CoC 278 274 274 268 4 1.5% 0 0.0% 6 2.2% 10 3.7% 2.46%
214 MI-511 Lenawee County CoC 109 85 85 85 24 28.2% 0 0.0% 0 0.0% 24 28.2% 0.96%
215 MI-512 Grand Traverse/Antrim, Leelanau Counties 279 216 216 109 63 29.2% 0 0.0% 107 98.2% 170 156.0% 2.47%
216 MI-513 Marquette/Alger Counties CoC 63 37 37 78 26 70.3% 0 0.0% -41 -52.6% -15 -19.2% 0.56%
217 MI-514 Battle Creek/Calhoun County CoC 185 164 117 98 21 12.8% 47 40.2% 19 19.4% 87 88.8% 1.64%
218 MI-515 Monroe County CoC 136 131 131 56 5 3.8% 0 0.0% 75 133.9% 80 142.9% 1.20%
219 MI-516 Norton Shores/Muskegon City & County 145 171 147 223 -26 -15.2% 24 16.3% -76 -34.1% -78 -35.0% 1.28%
220 MI-517 Jackson City & County CoC 304 344 282 328 -40 -11.6% 62 22.0% -46 -14.0% -24 -7.3% 2.69%
221 MI-518 Livingston County CoC 108 58 58 57 50 86.2% 0 0.0% 1 1.8% 51 89.5% 0.96%
222 MI-519 Holland/Ottawa County CoC 297 291 306 0 6 2.1% -15 -4.9% 306 - 297 - 2.63%
223 MI-522 Alpena, Iosca, Presque Isle/NE Michigan CoC 157 67 67 0 90 134.3% 0 0.0% 67 - 157 - 1.39%
224 MI-523 Eaton County CoC 135 105 105 110 30 28.6% 0 0.0% -5 -4.5% 25 22.7% 1.19%
225 MN-500 Minneapolis/Hennepin County CoC 3,025 2,813 2,428 3,058 212 7.5% 385 15.9% -630 -20.6% -33 -1.1% 44.67%
226 MN-501 Saint Paul/Ramsey County CoC 1,284 1,170 1,170 809 114 9.7% 0 0.0% 361 44.6% 475 58.7% 18.96%
227 MN-502 Rochester/Southeast Minnesota CoC 413 413 413 420 0 0.0% 0 0.0% -7 -1.7% -7 -1.7% 6.10%
228 MN-503 Dakota County CoC 545 476 303 264 69 14.5% 173 57.1% 39 14.8% 281 106.4% 8.05%
229 MN-504 Northeast Minnesota CoC 120 114 116 90 6 5.3% -2 -1.7% 26 28.9% 30 33.3% 1.77%
230 MN-505 St. Cloud/Central Minnesota CoC 343 313 313 306 30 9.6% 0 0.0% 7 2.3% 37 12.1% 5.06%
231 MN-506 Northwest Minnesota CoC 225 199 235 99 26 13.1% -36 -15.3% 136 137.4% 126 127.3% 3.32%
232 MN-508 Moorehead/West Central Minnesota 192 165 165 160 27 16.4% 0 0.0% 5 3.1% 32 20.0% 2.84%
233 MN-509 Duluth/Saint Louis County CoC 356 294 294 333 62 21.1% 0 0.0% -39 -11.7% 23 6.9% 5.26%

2009 2008 2007 2006Total Change
08-09% Change 08-
09Total Change
07-08% Change 07-
08Total Change
06-07% Change 06-
07Total Change
06-09% Change 06-
09
Continuum of Care Sheltered Point-In-Time Homeless Counts, 2006-2009
#CoC Number CoC Name 1
Sheltered PIT Counts Change 2006 to 2009 % of Statewide Sheltered
Count
234 MN-510 Scott, Carver Counties CoC 188 188 106 75 0 0.0% 82 77.4% 31 41.3% 113 150.7% 2.78%
235 MN-511 Southwest Minnesota CoC 81 125 80 37 -44 -35.2% 45 56.3% 43 116.2% 44 118.9% 1.20%
236 MO-500 St. Louis County CoC 414 396 290 326 18 4.5% 106 36.6% -36 -11.0% 88 27.0% 7.57%
237 MO-501 St. Louis City CoC 973 1,173 1,173 930 -200 -17.1% 0 0.0% 243 26.1% 43 4.6% 17.79%
238 MO-503 St. Charles CoC 549 305 227 133 244 80.0% 78 34.4% 94 70.7% 416 312.8% 10.04%
239 MO-600 Springfield/Webster Counties CoC 383 506 478 495 -123 -24.3% 28 5.9% -17 -3.4% -112 -22.6% 7.00%
240 MO-602 Joplin/Jasper/Newton County CoC 285 307 298 232 -22 -7.2% 9 3.0% 66 28.4% 53 22.8% 5.21%
241 MO-603 St. Joseph/Buchanan County CoC 155 131 100 88 24 18.3% 31 31.0% 12 13.6% 67 76.1% 2.83%
242 MO-604 Kansas City/Lee's Summit CoC 1,390 1,560 1,445 3,590 -170 -10.9% 115 8.0% -2,145 -59.7% -2,200 -61.3% 25.42%
243 MO-606 Clay, Platte Counties CoC 1,320 1,229 1,050 914 91 7.4% 179 17.0% 136 14.9% 406 44.4% 24.14%
244 MS-500 Jackson/Rankin, Madison Counties CoC 426 795 440 514 -369 -46.4% 355 80.7% -74 -14.4% -88 -17.1% 34.89%
245 MS-501 Mississippi Balance of State CoC 660 344 344 1,665 316 91.9% 0 0.0% -1,321 -79.3% -1,005 -60.4% 54.05%
246 MS-503 Gulf Port/Gulf Coast Regional CoC 135 67 67 454 68 101.5% 0 0.0% -387 -85.2% -319 -70.3% 11.06%
247 MT-500 Montana Statewide CoC 833 1,007 855 879 -174 -17.3% 152 17.8% -24 -2.7% -46 -5.2% 100.00%
248 NC-500 Winston Salem/Forsyth County CoC 421 423 479 1,001 -2 -0.5% -56 -11.7% -522 -52.1% -580 -57.9% 4.97%
249 NC-501 Asheville/Buncombe County CoC 426 429 448 418 -3 -0.7% -19 -4.2% 30 7.2% 8 1.9% 5.03%
250 NC-502 Durham City & County CoC 502 554 502 460 -52 -9.4% 52 10.4% 42 9.1% 42 9.1% 5.92%
251 NC-503 North Carolina Balance of State 2,009 1,732 1,460 645 277 16.0% 272 18.6% 815 126.4% 1,364 211.5% 23.71%
252 NC-504 Greensboro/High Point CoC 948 879 980 880 69 7.8% -101 -10.3% 100 11.4% 68 7.7% 11.19%
253 NC-505 Charlotte/Mecklenburg County CoC 2,044 1,550 1,648 1,448 494 31.9% -98 -5.9% 200 13.8% 596 41.2% 24.12%
254 NC-506 Wilmington/Brunswick/Pender CoC 468 427 419 285 41 9.6% 8 1.9% 134 47.0% 183 64.2% 5.52%
255 NC-507 Raleigh/Wake County CoC 905 1,071 973 875 -166 -15.5% 98 10.1% 98 11.2% 30 3.4% 10.68%
256 NC-509 Gastonia/Cleveland/Lincoln CoC 224 257 214 204 -33 -12.8% 43 20.1% 10 4.9% 20 9.8% 2.64%
257 NC-511 Fayetteville/Cumberland County CoC 263 266 313 331 -3 -1.1% -47 -15.0% -18 -5.4% -68 -20.5% 3.10%
258 NC-513 Chapel Hill/Orange County CoC 151 177 183 205 -26 -14.7% -6 -3.3% -22 -10.7% -54 -26.3% 1.78%
259 NC-516 Northwest North Carolina CoC 112 162 168 116 -50 -30.9% -6 -3.6% 52 44.8% -4 -3.4% 1.32%
260 ND-500 North Dakota Statewide CoC 765 596 577 537 169 28.4% 19 3.3% 40 7.4% 228 42.5% 100.00%
261 NE-500 North Central Nebraska CoC 492 840 167 240 -348 -41.4% 673 403.0% -73 -30.4% 252 105.0% 15.98%
262 NE-501 Omaha/Council Bluffs CoC 1,201 1,125 1,632 1,443 76 6.8% -507 -31.1% 189 13.1% -242 -16.8% 39.01%
263 NE-502 Lincoln CoC 947 865 838 833 82 9.5% 27 3.2% 5 0.6% 114 13.7% 30.76%
264 NE-503 Southwest Nebraska CoC 95 72 72 80 23 31.9% 0 0.0% -8 -10.0% 15 18.8% 3.09%
265 NE-504 Southeast Nebraska CoC 144 177 101 149 -33 -18.6% 76 75.2% -48 -32.2% -5 -3.4% 4.68%
266 NE-505 Panhandle of Nebraska CoC 85 79 122 179 6 7.6% -43 -35.2% -57 -31.8% -94 -52.5% 2.76%
267 NE-506 Northeast Nebraska CoC 115 69 75 67 46 66.7% -6 -8.0% 8 11.9% 48 71.6% 3.73%
268 NH-500 New Hampshire Balance of State CoC 719 830 769 612 -111 -13.4% 61 7.9% 157 25.7% 107 17.5% 51.14%
269 NH-501 Manchester CoC 337 373 307 484 -36 -9.7% 66 21.5% -177 -36.6% -147 -30.4% 23.97%
270 NH-502 Nashua/Hillsborough County CoC 350 332 197 212 18 5.4% 135 68.5% -15 -7.1% 138 65.1% 24.89%
271 NJ-500 Atlantic City & County CoC 339 398 425 396 -59 -14.8% -27 -6.4% 29 7.3% -57 -14.4% 2.86%
272 NJ-501 Bergen County CoC 1,354 1,514 1,210 993 -160 -10.6% 304 25.1% 217 21.9% 361 36.4% 11.41%
273 NJ-502 Burlington County CoC 949 780 780 742 169 21.7% 0 0.0% 38 5.1% 207 27.9% 7.99%
274 NJ-503 Camden City & County CoC 425 446 639 595 -21 -4.7% -193 -30.2% 44 7.4% -170 -28.6% 3.58%
275 NJ-504 Newark/Essex County CoC 1,539 884 1,906 1,262 655 74.1% -1,022 -53.6% 644 51.0% 277 21.9% 12.96%
276 NJ-505 Gloucester County CoC 190 176 137 200 14 8.0% 39 28.5% -63 -31.5% -10 -5.0% 1.60%
277 NJ-506 Jersey City/Hudson County CoC 1,650 1,976 2,678 2,677 -326 -16.5% -702 -26.2% 1 0.0% -1,027 -38.4% 13.90%
278 NJ-507 New Brunswick/Middlesex County CoC 583 545 728 468 38 7.0% -183 -25.1% 260 55.6% 115 24.6% 4.91%
279 NJ-508 Monmouth County CoC 638 676 757 1,064 -38 -5.6% -81 -10.7% -307 -28.9% -426 -40.0% 5.37%
280 NJ-509 Morris County CoC 257 189 229 330 68 36.0% -40 -17.5% -101 -30.6% -73 -22.1% 2.16%
281 NJ-510 Lakewood Township/Ocean County 406 309 381 515 97 31.4% -72 -18.9% -134 -26.0% -109 -21.2% 3.42%
282 NJ-511 Paterson/Passaic County CoC 207 314 831 856 -107 -34.1% -517 -62.2% -25 -2.9% -649 -75.8% 1.74%
283 NJ-512 Salem County CoC 146 302 454 178 -156 -51.7% -152 -33.5% 276 155.1% -32 -18.0% 1.23%
284 NJ-513 Somerset County CoC 283 285 343 450 -2 -0.7% -58 -16.9% -107 -23.8% -167 -37.1% 2.38%
285 NJ-514 Trenton/Mercer County CoC 1,020 851 1,242 648 169 19.9% -391 -31.5% 594 91.7% 372 57.4% 8.59%
286 NJ-515 Elizabeth/Union County CoC 1,077 1,072 1,072 1,267 5 0.5% 0 0.0% -195 -15.4% -190 -15.0% 9.07%
287 NJ-516 Warren County CoC 397 394 215 230 3 0.8% 179 83.3% -15 -6.5% 167 72.6% 3.34%
288 NJ-518 Cape May County CoC 221 286 242 259 -65 -22.7% 44 18.2% -17 -6.6% -38 -14.7% 1.86%
289 NJ-519 Sussex County CoC 104 260 355 354 -156 -60.0% -95 -26.8% 1 0.3% -250 -70.6% 0.88%
290 NJ-520 Cumberland County CoC 86 203 106 84 -117 -57.6% 97 91.5% 22 26.2% 2 2.4% 0.72%
291 NM-500 Albuquerque CoC 1,071 989 989 1,168 82 8.3% 0 0.0% -179 -15.3% -97 -8.3% 50.81%
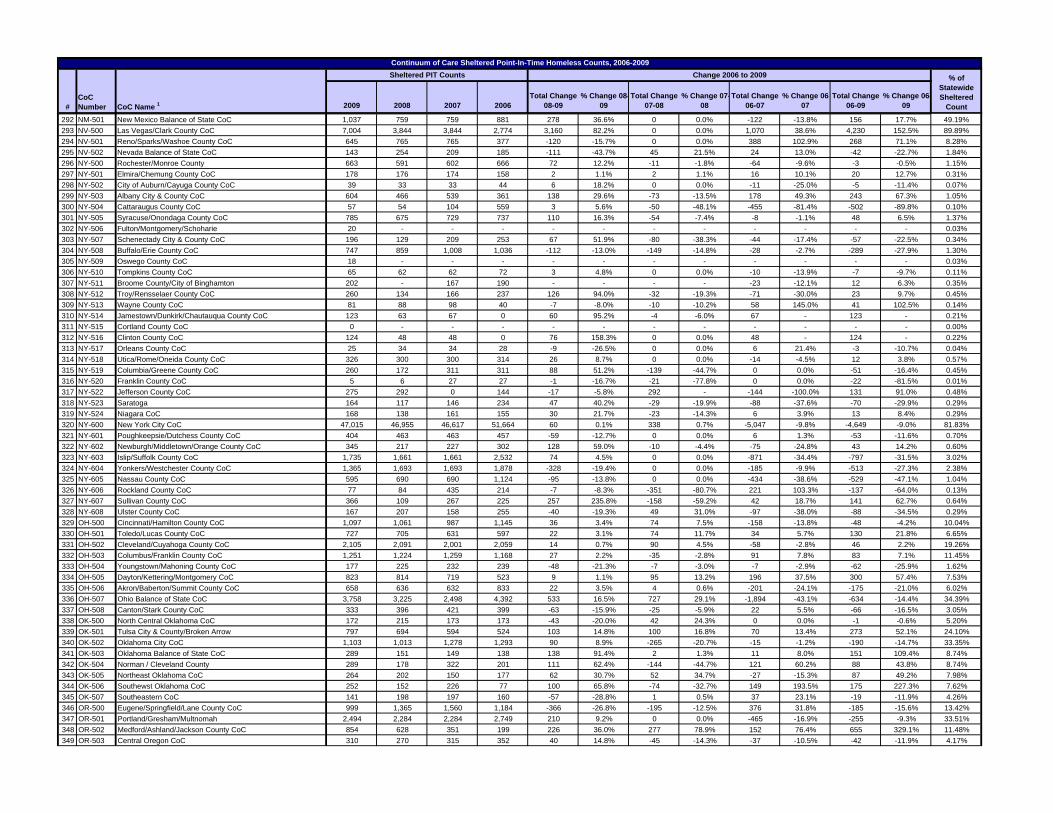
2009 2008 2007 2006Total Change
08-09% Change 08-
09Total Change
07-08% Change 07-
08Total Change
06-07% Change 06-
07Total Change
06-09% Change 06-
09
Continuum of Care Sheltered Point-In-Time Homeless Counts, 2006-2009
#CoC Number CoC Name 1
Sheltered PIT Counts Change 2006 to 2009 % of Statewide Sheltered
Count
292 NM-501 New Mexico Balance of State CoC 1,037 759 759 881 278 36.6% 0 0.0% -122 -13.8% 156 17.7% 49.19%
293 NV-500 Las Vegas/Clark County CoC 7,004 3,844 3,844 2,774 3,160 82.2% 0 0.0% 1,070 38.6% 4,230 152.5% 89.89%
294 NV-501 Reno/Sparks/Washoe County CoC 645 765 765 377 -120 -15.7% 0 0.0% 388 102.9% 268 71.1% 8.28%
295 NV-502 Nevada Balance of State CoC 143 254 209 185 -111 -43.7% 45 21.5% 24 13.0% -42 -22.7% 1.84%
296 NY-500 Rochester/Monroe County 663 591 602 666 72 12.2% -11 -1.8% -64 -9.6% -3 -0.5% 1.15%
297 NY-501 Elmira/Chemung County CoC 178 176 174 158 2 1.1% 2 1.1% 16 10.1% 20 12.7% 0.31%
298 NY-502 City of Auburn/Cayuga County CoC 39 33 33 44 6 18.2% 0 0.0% -11 -25.0% -5 -11.4% 0.07%
299 NY-503 Albany City & County CoC 604 466 539 361 138 29.6% -73 -13.5% 178 49.3% 243 67.3% 1.05%
300 NY-504 Cattaraugus County CoC 57 54 104 559 3 5.6% -50 -48.1% -455 -81.4% -502 -89.8% 0.10%
301 NY-505 Syracuse/Onondaga County CoC 785 675 729 737 110 16.3% -54 -7.4% -8 -1.1% 48 6.5% 1.37%
302 NY-506 Fulton/Montgomery/Schoharie 20 - - - - - - - - - - - 0.03%
303 NY-507 Schenectady City & County CoC 196 129 209 253 67 51.9% -80 -38.3% -44 -17.4% -57 -22.5% 0.34%
304 NY-508 Buffalo/Erie County CoC 747 859 1,008 1,036 -112 -13.0% -149 -14.8% -28 -2.7% -289 -27.9% 1.30%
305 NY-509 Oswego County CoC 18 - - - - - - - - - - - 0.03%
306 NY-510 Tompkins County CoC 65 62 62 72 3 4.8% 0 0.0% -10 -13.9% -7 -9.7% 0.11%
307 NY-511 Broome County/City of Binghamton 202 - 167 190 - - - - -23 -12.1% 12 6.3% 0.35%
308 NY-512 Troy/Rensselaer County CoC 260 134 166 237 126 94.0% -32 -19.3% -71 -30.0% 23 9.7% 0.45%
309 NY-513 Wayne County CoC 81 88 98 40 -7 -8.0% -10 -10.2% 58 145.0% 41 102.5% 0.14%
310 NY-514 Jamestown/Dunkirk/Chautauqua County CoC 123 63 67 0 60 95.2% -4 -6.0% 67 - 123 - 0.21%
311 NY-515 Cortland County CoC 0 - - - - - - - - - - - 0.00%
312 NY-516 Clinton County CoC 124 48 48 0 76 158.3% 0 0.0% 48 - 124 - 0.22%
313 NY-517 Orleans County CoC 25 34 34 28 -9 -26.5% 0 0.0% 6 21.4% -3 -10.7% 0.04%
314 NY-518 Utica/Rome/Oneida County CoC 326 300 300 314 26 8.7% 0 0.0% -14 -4.5% 12 3.8% 0.57%
315 NY-519 Columbia/Greene County CoC 260 172 311 311 88 51.2% -139 -44.7% 0 0.0% -51 -16.4% 0.45%
316 NY-520 Franklin County CoC 5 6 27 27 -1 -16.7% -21 -77.8% 0 0.0% -22 -81.5% 0.01%
317 NY-522 Jefferson County CoC 275 292 0 144 -17 -5.8% 292 - -144 -100.0% 131 91.0% 0.48%
318 NY-523 Saratoga 164 117 146 234 47 40.2% -29 -19.9% -88 -37.6% -70 -29.9% 0.29%
319 NY-524 Niagara CoC 168 138 161 155 30 21.7% -23 -14.3% 6 3.9% 13 8.4% 0.29%
320 NY-600 New York City CoC 47,015 46,955 46,617 51,664 60 0.1% 338 0.7% -5,047 -9.8% -4,649 -9.0% 81.83%
321 NY-601 Poughkeepsie/Dutchess County CoC 404 463 463 457 -59 -12.7% 0 0.0% 6 1.3% -53 -11.6% 0.70%
322 NY-602 Newburgh/Middletown/Orange County CoC 345 217 227 302 128 59.0% -10 -4.4% -75 -24.8% 43 14.2% 0.60%
323 NY-603 Islip/Suffolk County CoC 1,735 1,661 1,661 2,532 74 4.5% 0 0.0% -871 -34.4% -797 -31.5% 3.02%
324 NY-604 Yonkers/Westchester County CoC 1,365 1,693 1,693 1,878 -328 -19.4% 0 0.0% -185 -9.9% -513 -27.3% 2.38%
325 NY-605 Nassau County CoC 595 690 690 1,124 -95 -13.8% 0 0.0% -434 -38.6% -529 -47.1% 1.04%
326 NY-606 Rockland County CoC 77 84 435 214 -7 -8.3% -351 -80.7% 221 103.3% -137 -64.0% 0.13%
327 NY-607 Sullivan County CoC 366 109 267 225 257 235.8% -158 -59.2% 42 18.7% 141 62.7% 0.64%
328 NY-608 Ulster County CoC 167 207 158 255 -40 -19.3% 49 31.0% -97 -38.0% -88 -34.5% 0.29%
329 OH-500 Cincinnati/Hamilton County CoC 1,097 1,061 987 1,145 36 3.4% 74 7.5% -158 -13.8% -48 -4.2% 10.04%
330 OH-501 Toledo/Lucas County CoC 727 705 631 597 22 3.1% 74 11.7% 34 5.7% 130 21.8% 6.65%
331 OH-502 Cleveland/Cuyahoga County CoC 2,105 2,091 2,001 2,059 14 0.7% 90 4.5% -58 -2.8% 46 2.2% 19.26%
332 OH-503 Columbus/Franklin County CoC 1,251 1,224 1,259 1,168 27 2.2% -35 -2.8% 91 7.8% 83 7.1% 11.45%
333 OH-504 Youngstown/Mahoning County CoC 177 225 232 239 -48 -21.3% -7 -3.0% -7 -2.9% -62 -25.9% 1.62%
334 OH-505 Dayton/Kettering/Montgomery CoC 823 814 719 523 9 1.1% 95 13.2% 196 37.5% 300 57.4% 7.53%
335 OH-506 Akron/Baberton/Summit County CoC 658 636 632 833 22 3.5% 4 0.6% -201 -24.1% -175 -21.0% 6.02%
336 OH-507 Ohio Balance of State CoC 3,758 3,225 2,498 4,392 533 16.5% 727 29.1% -1,894 -43.1% -634 -14.4% 34.39%
337 OH-508 Canton/Stark County CoC 333 396 421 399 -63 -15.9% -25 -5.9% 22 5.5% -66 -16.5% 3.05%
338 OK-500 North Central Oklahoma CoC 172 215 173 173 -43 -20.0% 42 24.3% 0 0.0% -1 -0.6% 5.20%
339 OK-501 Tulsa City & County/Broken Arrow 797 694 594 524 103 14.8% 100 16.8% 70 13.4% 273 52.1% 24.10%
340 OK-502 Oklahoma City CoC 1,103 1,013 1,278 1,293 90 8.9% -265 -20.7% -15 -1.2% -190 -14.7% 33.35%
341 OK-503 Oklahoma Balance of State CoC 289 151 149 138 138 91.4% 2 1.3% 11 8.0% 151 109.4% 8.74%
342 OK-504 Norman / Cleveland County 289 178 322 201 111 62.4% -144 -44.7% 121 60.2% 88 43.8% 8.74%
343 OK-505 Northeast Oklahoma CoC 264 202 150 177 62 30.7% 52 34.7% -27 -15.3% 87 49.2% 7.98%
344 OK-506 Southewst Oklahoma CoC 252 152 226 77 100 65.8% -74 -32.7% 149 193.5% 175 227.3% 7.62%
345 OK-507 Southeastern CoC 141 198 197 160 -57 -28.8% 1 0.5% 37 23.1% -19 -11.9% 4.26%
346 OR-500 Eugene/Springfield/Lane County CoC 999 1,365 1,560 1,184 -366 -26.8% -195 -12.5% 376 31.8% -185 -15.6% 13.42%
347 OR-501 Portland/Gresham/Multnomah 2,494 2,284 2,284 2,749 210 9.2% 0 0.0% -465 -16.9% -255 -9.3% 33.51%
348 OR-502 Medford/Ashland/Jackson County CoC 854 628 351 199 226 36.0% 277 78.9% 152 76.4% 655 329.1% 11.48%
349 OR-503 Central Oregon CoC 310 270 315 352 40 14.8% -45 -14.3% -37 -10.5% -42 -11.9% 4.17%
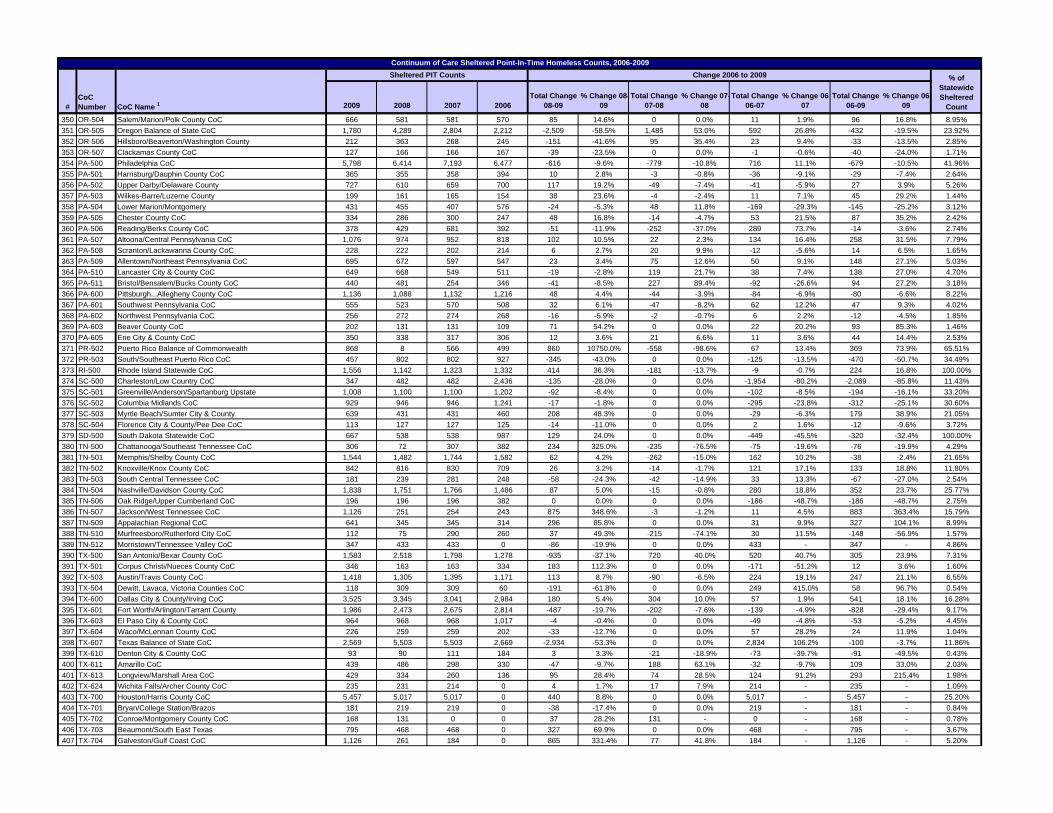
2009 2008 2007 2006Total Change
08-09% Change 08-
09Total Change
07-08% Change 07-
08Total Change
06-07% Change 06-
07Total Change
06-09% Change 06-
09
Continuum of Care Sheltered Point-In-Time Homeless Counts, 2006-2009
#CoC Number CoC Name 1
Sheltered PIT Counts Change 2006 to 2009 % of Statewide Sheltered
Count
350 OR-504 Salem/Marion/Polk County CoC 666 581 581 570 85 14.6% 0 0.0% 11 1.9% 96 16.8% 8.95%
351 OR-505 Oregon Balance of State CoC 1,780 4,289 2,804 2,212 -2,509 -58.5% 1,485 53.0% 592 26.8% -432 -19.5% 23.92%
352 OR-506 Hillsboro/Beaverton/Washington County 212 363 268 245 -151 -41.6% 95 35.4% 23 9.4% -33 -13.5% 2.85%
353 OR-507 Clackamas County CoC 127 166 166 167 -39 -23.5% 0 0.0% -1 -0.6% -40 -24.0% 1.71%
354 PA-500 Philadelphia CoC 5,798 6,414 7,193 6,477 -616 -9.6% -779 -10.8% 716 11.1% -679 -10.5% 41.96%
355 PA-501 Harrisburg/Dauphin County CoC 365 355 358 394 10 2.8% -3 -0.8% -36 -9.1% -29 -7.4% 2.64%
356 PA-502 Upper Darby/Delaware County 727 610 659 700 117 19.2% -49 -7.4% -41 -5.9% 27 3.9% 5.26%
357 PA-503 Wilkes-Barre/Luzerne County 199 161 165 154 38 23.6% -4 -2.4% 11 7.1% 45 29.2% 1.44%
358 PA-504 Lower Marion/Montgomery 431 455 407 576 -24 -5.3% 48 11.8% -169 -29.3% -145 -25.2% 3.12%
359 PA-505 Chester County CoC 334 286 300 247 48 16.8% -14 -4.7% 53 21.5% 87 35.2% 2.42%
360 PA-506 Reading/Berks County CoC 378 429 681 392 -51 -11.9% -252 -37.0% 289 73.7% -14 -3.6% 2.74%
361 PA-507 Altoona/Central Pennsylvania CoC 1,076 974 952 818 102 10.5% 22 2.3% 134 16.4% 258 31.5% 7.79%
362 PA-508 Scranton/Lackawanna County CoC 228 222 202 214 6 2.7% 20 9.9% -12 -5.6% 14 6.5% 1.65%
363 PA-509 Allentown/Northeast Pennsylvania CoC 695 672 597 547 23 3.4% 75 12.6% 50 9.1% 148 27.1% 5.03%
364 PA-510 Lancaster City & County CoC 649 668 549 511 -19 -2.8% 119 21.7% 38 7.4% 138 27.0% 4.70%
365 PA-511 Bristol/Bensalem/Bucks County CoC 440 481 254 346 -41 -8.5% 227 89.4% -92 -26.6% 94 27.2% 3.18%
366 PA-600 Pittsburgh...Allegheny County CoC 1,136 1,088 1,132 1,216 48 4.4% -44 -3.9% -84 -6.9% -80 -6.6% 8.22%
367 PA-601 Southwest Pennsylvania CoC 555 523 570 508 32 6.1% -47 -8.2% 62 12.2% 47 9.3% 4.02%
368 PA-602 Northwest Pennsylvania CoC 256 272 274 268 -16 -5.9% -2 -0.7% 6 2.2% -12 -4.5% 1.85%
369 PA-603 Beaver County CoC 202 131 131 109 71 54.2% 0 0.0% 22 20.2% 93 85.3% 1.46%
370 PA-605 Erie City & County CoC 350 338 317 306 12 3.6% 21 6.6% 11 3.6% 44 14.4% 2.53%
371 PR-502 Puerto Rico Balance of Commonwealth 868 8 566 499 860 10750.0% -558 -98.6% 67 13.4% 369 73.9% 65.51%
372 PR-503 South/Southeast Puerto Rico CoC 457 802 802 927 -345 -43.0% 0 0.0% -125 -13.5% -470 -50.7% 34.49%
373 RI-500 Rhode Island Statewide CoC 1,556 1,142 1,323 1,332 414 36.3% -181 -13.7% -9 -0.7% 224 16.8% 100.00%
374 SC-500 Charleston/Low Country CoC 347 482 482 2,436 -135 -28.0% 0 0.0% -1,954 -80.2% -2,089 -85.8% 11.43%
375 SC-501 Greenville/Anderson/Spartanburg Upstate 1,008 1,100 1,100 1,202 -92 -8.4% 0 0.0% -102 -8.5% -194 -16.1% 33.20%
376 SC-502 Columbia Midlands CoC 929 946 946 1,241 -17 -1.8% 0 0.0% -295 -23.8% -312 -25.1% 30.60%
377 SC-503 Myrtle Beach/Sumter City & County 639 431 431 460 208 48.3% 0 0.0% -29 -6.3% 179 38.9% 21.05%
378 SC-504 Florence City & County/Pee Dee CoC 113 127 127 125 -14 -11.0% 0 0.0% 2 1.6% -12 -9.6% 3.72%
379 SD-500 South Dakota Statewide CoC 667 538 538 987 129 24.0% 0 0.0% -449 -45.5% -320 -32.4% 100.00%
380 TN-500 Chattanooga/Southeast Tennessee CoC 306 72 307 382 234 325.0% -235 -76.5% -75 -19.6% -76 -19.9% 4.29%
381 TN-501 Memphis/Shelby County CoC 1,544 1,482 1,744 1,582 62 4.2% -262 -15.0% 162 10.2% -38 -2.4% 21.65%
382 TN-502 Knoxville/Knox County CoC 842 816 830 709 26 3.2% -14 -1.7% 121 17.1% 133 18.8% 11.80%
383 TN-503 South Central Tennessee CoC 181 239 281 248 -58 -24.3% -42 -14.9% 33 13.3% -67 -27.0% 2.54%
384 TN-504 Nashville/Davidson County CoC 1,838 1,751 1,766 1,486 87 5.0% -15 -0.8% 280 18.8% 352 23.7% 25.77%
385 TN-506 Oak Ridge/Upper Cumberland CoC 196 196 196 382 0 0.0% 0 0.0% -186 -48.7% -186 -48.7% 2.75%
386 TN-507 Jackson/West Tennessee CoC 1,126 251 254 243 875 348.6% -3 -1.2% 11 4.5% 883 363.4% 15.79%
387 TN-509 Appalachian Regional CoC 641 345 345 314 296 85.8% 0 0.0% 31 9.9% 327 104.1% 8.99%
388 TN-510 Murfreesboro/Rutherford City CoC 112 75 290 260 37 49.3% -215 -74.1% 30 11.5% -148 -56.9% 1.57%
389 TN-512 Morristown/Tennessee Valley CoC 347 433 433 0 -86 -19.9% 0 0.0% 433 - 347 - 4.86%
390 TX-500 San Antonio/Bexar County CoC 1,583 2,518 1,798 1,278 -935 -37.1% 720 40.0% 520 40.7% 305 23.9% 7.31%
391 TX-501 Corpus Christi/Nueces County CoC 346 163 163 334 183 112.3% 0 0.0% -171 -51.2% 12 3.6% 1.60%
392 TX-503 Austin/Travis County CoC 1,418 1,305 1,395 1,171 113 8.7% -90 -6.5% 224 19.1% 247 21.1% 6.55%
393 TX-504 Dewitt, Lavaca, Victoria Counties CoC 118 309 309 60 -191 -61.8% 0 0.0% 249 415.0% 58 96.7% 0.54%
394 TX-600 Dallas City & County/Irving CoC 3,525 3,345 3,041 2,984 180 5.4% 304 10.0% 57 1.9% 541 18.1% 16.28%
395 TX-601 Fort Worth/Arlington/Tarrant County 1,986 2,473 2,675 2,814 -487 -19.7% -202 -7.6% -139 -4.9% -828 -29.4% 9.17%
396 TX-603 El Paso City & County CoC 964 968 968 1,017 -4 -0.4% 0 0.0% -49 -4.8% -53 -5.2% 4.45%
397 TX-604 Waco/McLennan County CoC 226 259 259 202 -33 -12.7% 0 0.0% 57 28.2% 24 11.9% 1.04%
398 TX-607 Texas Balance of State CoC 2,569 5,503 5,503 2,669 -2,934 -53.3% 0 0.0% 2,834 106.2% -100 -3.7% 11.86%
399 TX-610 Denton City & County CoC 93 90 111 184 3 3.3% -21 -18.9% -73 -39.7% -91 -49.5% 0.43%
400 TX-611 Amarillo CoC 439 486 298 330 -47 -9.7% 188 63.1% -32 -9.7% 109 33.0% 2.03%
401 TX-613 Longview/Marshall Area CoC 429 334 260 136 95 28.4% 74 28.5% 124 91.2% 293 215.4% 1.98%
402 TX-624 Wichita Falls/Archer County CoC 235 231 214 0 4 1.7% 17 7.9% 214 - 235 - 1.09%
403 TX-700 Houston/Harris County CoC 5,457 5,017 5,017 0 440 8.8% 0 0.0% 5,017 - 5,457 - 25.20%
404 TX-701 Bryan/College Station/Brazos 181 219 219 0 -38 -17.4% 0 0.0% 219 - 181 - 0.84%
405 TX-702 Conroe/Montgomery County CoC 168 131 0 0 37 28.2% 131 - 0 - 168 - 0.78%
406 TX-703 Beaumont/South East Texas 795 468 468 0 327 69.9% 0 0.0% 468 - 795 - 3.67%
407 TX-704 Galveston/Gulf Coast CoC 1,126 261 184 0 865 331.4% 77 41.8% 184 - 1,126 - 5.20%

2009 2008 2007 2006Total Change
08-09% Change 08-
09Total Change
07-08% Change 07-
08Total Change
06-07% Change 06-
07Total Change
06-09% Change 06-
09
Continuum of Care Sheltered Point-In-Time Homeless Counts, 2006-2009
#CoC Number CoC Name 1
Sheltered PIT Counts Change 2006 to 2009 % of Statewide Sheltered
Count
408 UT-500 Salt Lake City & County CoC 1,699 2,138 1,881 2,202 -439 -20.5% 257 13.7% -321 -14.6% -503 -22.8% 47.99%
409 UT-503 Utah Balance of State CoC 1,586 827 630 834 759 91.8% 197 31.3% -204 -24.5% 752 90.2% 44.80%
410 UT-504 Provo/Mountainland CoC 255 213 187 211 42 19.7% 26 13.9% -24 -11.4% 44 20.9% 7.20%
411 VA-500 Richmond/Henrico, Chesterfield, Hanover Counties CoC 1,078 907 1,014 727 171 18.9% -107 -10.6% 287 39.5% 351 48.3% 14.80%
412 VA-501 Norfolk CoC 486 441 436 536 45 10.2% 5 1.1% -100 -18.7% -50 -9.3% 6.67%
413 VA-502 Roanoke City & County/Salem CoC 586 497 528 363 89 17.9% -31 -5.9% 165 45.5% 223 61.4% 8.05%
414 VA-503 Virginia Beach CoC 394 406 430 335 -12 -3.0% -24 -5.6% 95 28.4% 59 17.6% 5.41%
415 VA-504 Charlottesville CoC 185 224 237 163 -39 -17.4% -13 -5.5% 74 45.4% 22 13.5% 2.54%
416 VA-505 Newport News/Virginia Peninsula CoC 514 486 569 622 28 5.8% -83 -14.6% -53 -8.5% -108 -17.4% 7.06%
417 VA-507 Portsmouth CoC 193 177 165 217 16 9.0% 12 7.3% -52 -24.0% -24 -11.1% 2.65%
418 VA-508 Lynchburg CoC 211 211 98 98 0 0.0% 113 115.3% 0 0.0% 113 115.3% 2.90%
419 VA-509 Petersburg CoC 67 29 39 69 38 131.0% -10 -25.6% -30 -43.5% -2 -2.9% 0.92%
420 VA-510 Staunton/Waynesboro/Augusta, Highland Counties CoC 99 94 94 0 5 5.3% 0 0.0% 94 - 99 - 1.36%
421 VA-512 Chesapeake CoC 17 38 86 21 -21 -55.3% -48 -55.8% 65 309.5% -4 -19.0% 0.23%
422 VA-513 Shenandoah/Warren Counties CoC 57 127 218 827 -70 -55.1% -91 -41.7% -609 -73.6% -770 -93.1% 0.78%
423 VA-514 Fredericksburg/Stafford Counties CoC 95 127 515 413 -32 -25.2% -388 -75.3% 102 24.7% -318 -77.0% 1.30%
424 VA-517 Danville, Martinsville CoC 56 77 69 59 -21 -27.3% 8 11.6% 10 16.9% -3 -5.1% 0.77%
425 VA-518 Harrisburg/ Rockingham County CoC 111 61 108 89 50 82.0% -47 -43.5% 19 21.3% 22 24.7% 1.52%
426 VA-519 Suffolk CoC 50 30 21 9 20 66.7% 9 42.9% 12 133.3% 41 455.6% 0.69%
427 VA-521 Virginia Balance of State 377 359 505 474 18 5.0% -146 -28.9% 31 6.5% -97 -20.5% 5.18%
428 VA-600 Arlington County CoC 304 231 243 218 73 31.6% -12 -4.9% 25 11.5% 86 39.4% 4.17%
429 VA-601 Fairfax County CoC 1,601 1,623 1,439 1,337 -22 -1.4% 184 12.8% 102 7.6% 264 19.7% 21.98%
430 VA-602 Loudoun County CoC 108 136 114 103 -28 -20.6% 22 19.3% 11 10.7% 5 4.9% 1.48%
431 VA-603 Alexandria CoC 303 238 283 271 65 27.3% -45 -15.9% 12 4.4% 32 11.8% 4.16%
432 VA-604 Prince William County CoC 392 376 356 318 16 4.3% 20 5.6% 38 11.9% 74 23.3% 5.38%
433 VI-500 Virgin Islands CoC 76 115 72 94 -39 -33.9% 43 59.7% -22 -23.4% -18 -19.1% 100.00%
434 VT-500 Vermont Balance of State CoC 524 439 516 575 85 19.4% -77 -14.9% -59 -10.3% -51 -8.9% 49.57%
435 VT-501 Burlington/Chittenden County CoC 533 257 204 167 276 107.4% 53 26.0% 37 22.2% 366 219.2% 50.43%
436 WA-500 Seattle/King County CoC 6,089 5,808 5,680 5,964 281 4.8% 128 2.3% -284 -4.8% 125 2.1% 37.50%
437 WA-501 Washington Balance of State CoC 4,750 4,660 4,968 4,370 90 1.9% -308 -6.2% 598 13.7% 380 8.7% 29.25%
438 WA-502 City of Spokane CoC 1,072 1,080 889 1,030 -8 -0.7% 191 21.5% -141 -13.7% 42 4.1% 6.60%
439 WA-503 Tacoma/Lakewood/Pierce County CoC 1,853 1,478 1,342 952 375 25.4% 136 10.1% 390 41.0% 901 94.6% 11.41%
440 WA-504 Everett/Snohomish County CoC 1,246 1,205 2,150 1,579 41 3.4% -945 -44.0% 571 36.2% -333 -21.1% 7.67%
441 WA-507 Yakima City & County CoC 300 345 541 458 -45 -13.0% -196 -36.2% 83 18.1% -158 -34.5% 1.85%
442 WA-508 Vancouver-Clarke County CoC 927 880 1,164 1,120 47 5.3% -284 -24.4% 44 3.9% -193 -17.2% 5.71%
443 WI-500 Wisconsin Balance of State CoC 3,207 2,817 2,817 2,907 390 13.8% 0 0.0% -90 -3.1% 300 10.3% 58.68%
444 WI-501 Milwaukee City & County CoC 1,317 1,295 1,295 1,308 22 1.7% 0 0.0% -13 -1.0% 9 0.7% 24.10%
445 WI-502 Racine City & County CoC 353 258 250 278 95 36.8% 8 3.2% -28 -10.1% 75 27.0% 6.46%
446 WI-503 Madison/Dane County CoC 588 564 723 990 24 4.3% -159 -22.0% -267 -27.0% -402 -40.6% 10.76%
447 WV-500 Wheeling/Weirton Area CoC 87 85 96 61 2 2.4% -11 -11.5% 35 57.4% 26 42.6% 6.81%
448 WV-501 Huntington/Cabell, Wayne Counties 190 232 273 227 -42 -18.1% -41 -15.0% 46 20.3% -37 -16.3% 14.87%
449 WV-503 Charleston/Kanawha/Clay Counties CoC 331 264 263 326 67 25.4% 1 0.4% -63 -19.3% 5 1.5% 25.90%
450 WV-508 West Virginia Balance of State CoC 670 841 1,515 354 -171 -20.3% -674 -44.5% 1,161 328.0% 316 89.3% 52.43%451 WY-500 Wyoming Statewide CoC 451 619 397 337 -168 -27.1% 222 55.9% 60 17.8% 114 33.8% 100.00%
TOTAL 403,308 386,361 391,401 427,971 16,947 4.4% -5,040 -1.3% -36,570 -8.5% -24,663 -5.8% -
1 Only active 2009 CoCs are reported in this table. All inactive or closed CoCs have been included in the national totals for 2006, 2007 and 2008, but are not individually reported.

2009 2008 2007 2006
Total Change 08-
09% Change 08-
09
Total Change 07-
08% Change 07-
08
Total Change 06-
07% Change 06-
07
Total Change 06-
09% Change 06-
09
1 AK-500 Anchorage CoC 157 102 132 246 55 53.9% -30 -22.7% -114 -46.3% -89 -36.2% 48.01%
2 AK-501 Alaska Balance of State CoC 170 92 123 195 78 84.8% -31 -25.2% -72 -36.9% -25 -12.8% 51.99%
3 AL-500 Birmingham/Shelby Counties CoC 1,204 864 864 775 340 39.4% 0 0.0% 89 11.5% 429 55.4% 55.56%
4 AL-501 Mobile City & County/Baldwin County 336 183 239 302 153 83.6% -56 -23.4% -63 -20.9% 34 11.3% 15.51%
5 AL-502 Florence/Northwest Alabama CoC 68 71 134 112 -3 -4.2% -63 -47.0% 22 19.6% -44 -39.3% 3.14%
6 AL-503 Huntsville/North Alabama CoC 90 77 74 44 13 16.9% 3 4.1% 30 68.2% 46 104.5% 4.15%
7 AL-504 Montgomery City & County CoC 114 117 125 106 -3 -2.6% -8 -6.4% 19 17.9% 8 7.5% 5.26%
8 AL-505 Gadsden/Northeast Alabama CoC 126 36 15 9 90 250.0% 21 140.0% 6 66.7% 117 1300.0% 5.81%
9 AL-506 Tuscaloosa City & County CoC 9 4 13 7 5 125.0% -9 -69.2% 6 85.7% 2 28.6% 0.42%
10 AL-507 Alabama Balance of State 220 192 192 144 28 14.6% 0 0.0% 48 33.3% 76 52.8% 10.15%
11 AR-500 Little Rock/Central Arkansas CoC 452 635 635 576 -183 -28.8% 0 0.0% 59 10.2% -124 -21.5% 40.29%
12 AR-501 Fayetteville/Northwest Arkansas CoC 30 40 35 21 -10 -25.0% 5 14.3% 14 66.7% 9 42.9% 2.67%
13 AR-502 Conway/Faulkener, Perry Counties CoC 112 104 104 135 8 7.7% 0 0.0% -31 -23.0% -23 -17.0% 9.98%
14 AR-504 Delta Hills CoC 510 443 510 888 67 15.1% -67 -13.1% -378 -42.6% -378 -42.6% 45.45%
15 AR-505 Southeast Arkansas CoC 0 10 10 69 -10 -100.0% 0 0.0% -59 -85.5% -69 -100.0% 0.00%
16 AR-506 Johnson, Pope, Yell Counties CoC 18 3 3 0 15 500.0% 0 0.0% 3 - 18 - 1.60%
17 AZ-500 Arizona Balance of State CoC 2,064 1,984 1,984 1,642 80 4.0% 0 0.0% 342 20.8% 422 25.7% 32.48%
18 AZ-501 Tucson/Pima County CoC 1,373 1,108 1,191 642 265 23.9% -83 -7.0% 549 85.5% 731 113.9% 21.61%
19 AZ-502 Phoenix/Mesa/Maricopa County 2,918 2,426 2,853 2,063 492 20.3% -427 -15.0% 790 38.3% 855 41.4% 45.92%
20 CA-500 San Jose/Santa Clara City & County 4,983 5,101 5,101 4,389 -118 -2.3% 0 0.0% 712 16.2% 594 13.5% 6.05%
21 CA-501 San Francisco CoC 2,942 2,771 2,791 2,655 171 6.2% -20 -0.7% 136 5.1% 287 10.8% 3.57%
22 CA-502 Oakland/Alameda County CoC 1,963 2,496 2,496 2,539 -533 -21.4% 0 0.0% -43 -1.7% -576 -22.7% 2.38%
23 CA-503 Sacramento City & County CoC 1,194 1,266 1,005 645 -72 -5.7% 261 26.0% 360 55.8% 549 85.1% 1.45%
24 CA-504 Santa Rosa/Petaluma/Sonoma County 2,222 532 532 783 1,690 317.7% 0 0.0% -251 -32.1% 1,439 183.8% 2.70%
25 CA-505 Richmond/Contra Costa County CoC 1,872 3,159 3,159 5,278 -1,287 -40.7% 0 0.0% -2,119 -40.1% -3,406 -64.5% 2.27%
26 CA-506 Salinas/Monterey County CoC 1,628 893 893 1,067 735 82.3% 0 0.0% -174 -16.3% 561 52.6% 1.98%
27 CA-507 Marin County CoC 429 400 400 442 29 7.3% 0 0.0% -42 -9.5% -13 -2.9% 0.52%
28 CA-508 Watsonville/Santa Cruz City & County 1,536 2,303 2,303 2,679 -767 -33.3% 0 0.0% -376 -14.0% -1,143 -42.7% 1.87%
29 CA-509 Mendocino County CoC 967 1,138 1,138 1,509 -171 -15.0% 0 0.0% -371 -24.6% -542 -35.9% 1.17%
30 CA-510 Turlock/Modesto/Stanislaus County 999 959 959 935 40 4.2% 0 0.0% 24 2.6% 64 6.8% 1.21%
31 CA-511 Stockton/San Joaquin County 165 303 303 588 -138 -45.5% 0 0.0% -285 -48.5% -423 -71.9% 0.20%
32 CA-512 Daly/San Mateo County CoC 803 1,094 1,094 491 -291 -26.6% 0 0.0% 603 122.8% 312 63.5% 0.98%
33 CA-513 Visalia, Kings, Tulare Counties CoC 756 851 826 668 -95 -11.2% 25 3.0% 158 23.7% 88 13.2% 0.92%
34 CA-514 Fresno/Madera County CoC 2,457 1,556 1,512 0 901 57.9% 44 2.9% 1,512 - 2,457 - 2.98%
35 CA-515 Roseville/Placer County CoC 234 137 137 91 97 70.8% 0 0.0% 46 50.5% 143 157.1% 0.28%
36 CA-516 Redding/Shasta County CoC 146 62 46 87 84 135.5% 16 34.8% -41 -47.1% 59 67.8% 0.18%
37 CA-517 Napa City & County CoC 128 146 146 143 -18 -12.3% 0 0.0% 3 2.1% -15 -10.5% 0.16%
38 CA-518 Vallejo/Solano County CoC 426 1,499 1,499 2,979 -1,073 -71.6% 0 0.0% -1,480 -49.7% -2,553 -85.7% 0.52%
39 CA-519 Chico/Paradise/Butte County CoC 386 270 542 620 116 43.0% -272 -50.2% -78 -12.6% -234 -37.7% 0.47%
40 CA-520 Merced City & County CoC 224 2,320 2,420 2,420 -2,096 -90.3% -100 -4.1% 0 0.0% -2,196 -90.7% 0.27%
41 CA-521 Davis/Woodland/Yolo County CoC 289 186 186 460 103 55.4% 0 0.0% -274 -59.6% -171 -37.2% 0.35%
42 CA-522 Humboldt County CoC 1,000 585 585 1,481 415 70.9% 0 0.0% -896 -60.5% -481 -32.5% 1.21%
43 CA-523 Colusa/Glenn/Tehama/Trinity Counties Coc 123 - - - - - - - - - - - 0.15%
44 CA-524 Yuba City, Marysville/Sutter, Yuba Counties CoC 108 111 63 326 -3 -2.7% 48 76.2% -263 -80.7% -218 -66.9% 0.13%
45 CA-525 El Dorado County CoC 83 75 16 0 8 10.7% 59 368.8% 16 - 83 - 0.10%
46 CA-526 Tuolumne, Calaveras, Amador Counties CoC 222 321 321 0 -99 -30.8% 0 0.0% 321 - 222 - 0.27%
47 CA-527 Nevada County 248 - - - - - - - - - - - 0.30%
48 CA-600 Los Angeles City & County CoC 28,644 57,166 57,166 72,413 -28,522 -49.9% 0 0.0% -15,247 -21.1% -43,769 -60.4% 34.78%
49 CA-601 San Diego CoC 1,868 1,736 1,016 1,849 132 7.6% 720 70.9% -833 -45.1% 19 1.0% 2.27%
50 CA-602 Santa Ana/Anaheim/Orange County CoC 5,724 1,071 1,071 747 4,653 434.5% 0 0.0% 324 43.4% 4,977 666.3% 6.95%
51 CA-603 Santa Maria/Santa Barbara County 2,973 2,773 2,773 2,911 200 7.2% 0 0.0% -138 -4.7% 62 2.1% 3.61%
52 CA-604 Bakersfield/Kern County CoC 832 632 632 625 200 31.6% 0 0.0% 7 1.1% 207 33.1% 1.01%
53 CA-605 San Buena Ventura/Ventura County 1,309 931 931 563 378 40.6% 0 0.0% 368 65.4% 746 132.5% 1.59%
54 CA-606 Long Beach CoC 1,755 2,150 2,150 2,805 -395 -18.4% 0 0.0% -655 -23.4% -1,050 -37.4% 2.13%
55 CA-607 Pasadena CoC 741 549 535 411 192 35.0% 14 2.6% 124 30.2% 330 80.3% 0.90%
56 CA-608 Riverside City & County CoC 2,043 3,178 3,178 3,131 -1,135 -35.7% 0 0.0% 47 1.5% -1,088 -34.7% 2.48%
57 CA-609 San Bernardino City & County CoC 1,258 5,749 5,749 3,530 -4,491 -78.1% 0 0.0% 2,219 62.9% -2,272 -64.4% 1.53%
58 CA-610 San Diego County CoC 2,146 2,302 2,329 2,232 -156 -6.8% -27 -1.2% 97 4.3% -86 -3.9% 2.61%
59 CA-611 Oxnard CoC 423 479 604 324 -56 -11.7% -125 -20.7% 280 86.4% 99 30.6% 0.51%
Unsheltered PIT Counts
Continuum of Care Unsheltered Point-In-Time Homeless Counts, 2006-2009
#CoC Number CoC Name 1
Change 2006 to 2009 % of Statewide
Unsheltered Count
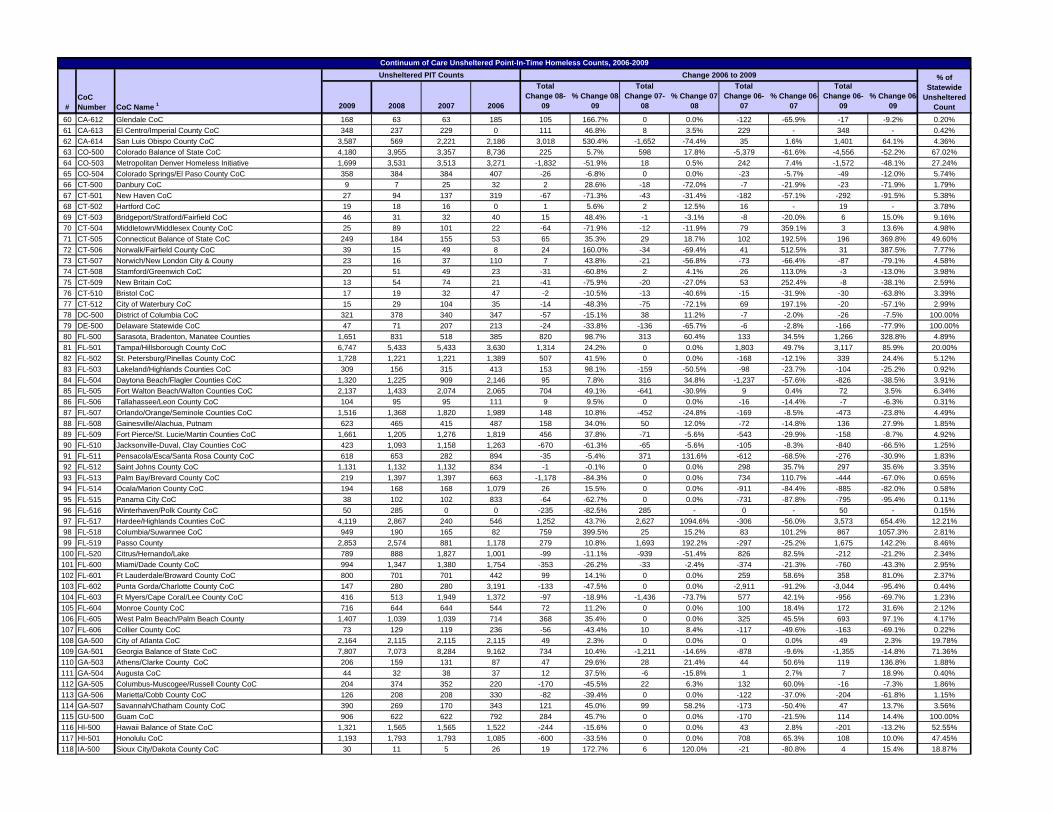
2009 2008 2007 2006
Total Change 08-
09% Change 08-
09
Total Change 07-
08% Change 07-
08
Total Change 06-
07% Change 06-
07
Total Change 06-
09% Change 06-
09
Unsheltered PIT Counts
Continuum of Care Unsheltered Point-In-Time Homeless Counts, 2006-2009
#CoC Number CoC Name 1
Change 2006 to 2009 % of Statewide
Unsheltered Count
60 CA-612 Glendale CoC 168 63 63 185 105 166.7% 0 0.0% -122 -65.9% -17 -9.2% 0.20%
61 CA-613 El Centro/Imperial County CoC 348 237 229 0 111 46.8% 8 3.5% 229 - 348 - 0.42%
62 CA-614 San Luis Obispo County CoC 3,587 569 2,221 2,186 3,018 530.4% -1,652 -74.4% 35 1.6% 1,401 64.1% 4.36%
63 CO-500 Colorado Balance of State CoC 4,180 3,955 3,357 8,736 225 5.7% 598 17.8% -5,379 -61.6% -4,556 -52.2% 67.02%
64 CO-503 Metropolitan Denver Homeless Initiative 1,699 3,531 3,513 3,271 -1,832 -51.9% 18 0.5% 242 7.4% -1,572 -48.1% 27.24%
65 CO-504 Colorado Springs/El Paso County CoC 358 384 384 407 -26 -6.8% 0 0.0% -23 -5.7% -49 -12.0% 5.74%
66 CT-500 Danbury CoC 9 7 25 32 2 28.6% -18 -72.0% -7 -21.9% -23 -71.9% 1.79%
67 CT-501 New Haven CoC 27 94 137 319 -67 -71.3% -43 -31.4% -182 -57.1% -292 -91.5% 5.38%
68 CT-502 Hartford CoC 19 18 16 0 1 5.6% 2 12.5% 16 - 19 - 3.78%
69 CT-503 Bridgeport/Stratford/Fairfield CoC 46 31 32 40 15 48.4% -1 -3.1% -8 -20.0% 6 15.0% 9.16%
70 CT-504 Middletown/Middlesex County CoC 25 89 101 22 -64 -71.9% -12 -11.9% 79 359.1% 3 13.6% 4.98%
71 CT-505 Connecticut Balance of State CoC 249 184 155 53 65 35.3% 29 18.7% 102 192.5% 196 369.8% 49.60%
72 CT-506 Norwalk/Fairfield County CoC 39 15 49 8 24 160.0% -34 -69.4% 41 512.5% 31 387.5% 7.77%
73 CT-507 Norwich/New London City & Couny 23 16 37 110 7 43.8% -21 -56.8% -73 -66.4% -87 -79.1% 4.58%
74 CT-508 Stamford/Greenwich CoC 20 51 49 23 -31 -60.8% 2 4.1% 26 113.0% -3 -13.0% 3.98%
75 CT-509 New Britain CoC 13 54 74 21 -41 -75.9% -20 -27.0% 53 252.4% -8 -38.1% 2.59%
76 CT-510 Bristol CoC 17 19 32 47 -2 -10.5% -13 -40.6% -15 -31.9% -30 -63.8% 3.39%
77 CT-512 City of Waterbury CoC 15 29 104 35 -14 -48.3% -75 -72.1% 69 197.1% -20 -57.1% 2.99%
78 DC-500 District of Columbia CoC 321 378 340 347 -57 -15.1% 38 11.2% -7 -2.0% -26 -7.5% 100.00%
79 DE-500 Delaware Statewide CoC 47 71 207 213 -24 -33.8% -136 -65.7% -6 -2.8% -166 -77.9% 100.00%
80 FL-500 Sarasota, Bradenton, Manatee Counties 1,651 831 518 385 820 98.7% 313 60.4% 133 34.5% 1,266 328.8% 4.89%
81 FL-501 Tampa/Hillsborough County CoC 6,747 5,433 5,433 3,630 1,314 24.2% 0 0.0% 1,803 49.7% 3,117 85.9% 20.00%
82 FL-502 St. Petersburg/Pinellas County CoC 1,728 1,221 1,221 1,389 507 41.5% 0 0.0% -168 -12.1% 339 24.4% 5.12%
83 FL-503 Lakeland/Highlands Counties CoC 309 156 315 413 153 98.1% -159 -50.5% -98 -23.7% -104 -25.2% 0.92%
84 FL-504 Daytona Beach/Flagler Counties CoC 1,320 1,225 909 2,146 95 7.8% 316 34.8% -1,237 -57.6% -826 -38.5% 3.91%
85 FL-505 Fort Walton Beach/Walton Counties CoC 2,137 1,433 2,074 2,065 704 49.1% -641 -30.9% 9 0.4% 72 3.5% 6.34%
86 FL-506 Tallahassee/Leon County CoC 104 95 95 111 9 9.5% 0 0.0% -16 -14.4% -7 -6.3% 0.31%
87 FL-507 Orlando/Orange/Seminole Counties CoC 1,516 1,368 1,820 1,989 148 10.8% -452 -24.8% -169 -8.5% -473 -23.8% 4.49%
88 FL-508 Gainesville/Alachua, Putnam 623 465 415 487 158 34.0% 50 12.0% -72 -14.8% 136 27.9% 1.85%
89 FL-509 Fort Pierce/St. Lucie/Martin Counties CoC 1,661 1,205 1,276 1,819 456 37.8% -71 -5.6% -543 -29.9% -158 -8.7% 4.92%
90 FL-510 Jacksonville-Duval, Clay Counties CoC 423 1,093 1,158 1,263 -670 -61.3% -65 -5.6% -105 -8.3% -840 -66.5% 1.25%
91 FL-511 Pensacola/Esca/Santa Rosa County CoC 618 653 282 894 -35 -5.4% 371 131.6% -612 -68.5% -276 -30.9% 1.83%
92 FL-512 Saint Johns County CoC 1,131 1,132 1,132 834 -1 -0.1% 0 0.0% 298 35.7% 297 35.6% 3.35%
93 FL-513 Palm Bay/Brevard County CoC 219 1,397 1,397 663 -1,178 -84.3% 0 0.0% 734 110.7% -444 -67.0% 0.65%
94 FL-514 Ocala/Marion County CoC 194 168 168 1,079 26 15.5% 0 0.0% -911 -84.4% -885 -82.0% 0.58%
95 FL-515 Panama City CoC 38 102 102 833 -64 -62.7% 0 0.0% -731 -87.8% -795 -95.4% 0.11%
96 FL-516 Winterhaven/Polk County CoC 50 285 0 0 -235 -82.5% 285 - 0 - 50 - 0.15%
97 FL-517 Hardee/Highlands Counties CoC 4,119 2,867 240 546 1,252 43.7% 2,627 1094.6% -306 -56.0% 3,573 654.4% 12.21%
98 FL-518 Columbia/Suwannee CoC 949 190 165 82 759 399.5% 25 15.2% 83 101.2% 867 1057.3% 2.81%
99 FL-519 Passo County 2,853 2,574 881 1,178 279 10.8% 1,693 192.2% -297 -25.2% 1,675 142.2% 8.46%
100 FL-520 Citrus/Hernando/Lake 789 888 1,827 1,001 -99 -11.1% -939 -51.4% 826 82.5% -212 -21.2% 2.34%
101 FL-600 Miami/Dade County CoC 994 1,347 1,380 1,754 -353 -26.2% -33 -2.4% -374 -21.3% -760 -43.3% 2.95%
102 FL-601 Ft Lauderdale/Broward County CoC 800 701 701 442 99 14.1% 0 0.0% 259 58.6% 358 81.0% 2.37%
103 FL-602 Punta Gorda/Charlotte County CoC 147 280 280 3,191 -133 -47.5% 0 0.0% -2,911 -91.2% -3,044 -95.4% 0.44%
104 FL-603 Ft Myers/Cape Coral/Lee County CoC 416 513 1,949 1,372 -97 -18.9% -1,436 -73.7% 577 42.1% -956 -69.7% 1.23%
105 FL-604 Monroe County CoC 716 644 644 544 72 11.2% 0 0.0% 100 18.4% 172 31.6% 2.12%
106 FL-605 West Palm Beach/Palm Beach County 1,407 1,039 1,039 714 368 35.4% 0 0.0% 325 45.5% 693 97.1% 4.17%
107 FL-606 Collier County CoC 73 129 119 236 -56 -43.4% 10 8.4% -117 -49.6% -163 -69.1% 0.22%
108 GA-500 City of Atlanta CoC 2,164 2,115 2,115 2,115 49 2.3% 0 0.0% 0 0.0% 49 2.3% 19.78%
109 GA-501 Georgia Balance of State CoC 7,807 7,073 8,284 9,162 734 10.4% -1,211 -14.6% -878 -9.6% -1,355 -14.8% 71.36%
110 GA-503 Athens/Clarke County CoC 206 159 131 87 47 29.6% 28 21.4% 44 50.6% 119 136.8% 1.88%
111 GA-504 Augusta CoC 44 32 38 37 12 37.5% -6 -15.8% 1 2.7% 7 18.9% 0.40%
112 GA-505 Columbus-Muscogee/Russell County CoC 204 374 352 220 -170 -45.5% 22 6.3% 132 60.0% -16 -7.3% 1.86%
113 GA-506 Marietta/Cobb County CoC 126 208 208 330 -82 -39.4% 0 0.0% -122 -37.0% -204 -61.8% 1.15%
114 GA-507 Savannah/Chatham County CoC 390 269 170 343 121 45.0% 99 58.2% -173 -50.4% 47 13.7% 3.56%
115 GU-500 Guam CoC 906 622 622 792 284 45.7% 0 0.0% -170 -21.5% 114 14.4% 100.00%
116 HI-500 Hawaii Balance of State CoC 1,321 1,565 1,565 1,522 -244 -15.6% 0 0.0% 43 2.8% -201 -13.2% 52.55%
117 HI-501 Honolulu CoC 1,193 1,793 1,793 1,085 -600 -33.5% 0 0.0% 708 65.3% 108 10.0% 47.45%
118 IA-500 Sioux City/Dakota County CoC 30 11 5 26 19 172.7% 6 120.0% -21 -80.8% 4 15.4% 18.87%

2009 2008 2007 2006
Total Change 08-
09% Change 08-
09
Total Change 07-
08% Change 07-
08
Total Change 06-
07% Change 06-
07
Total Change 06-
09% Change 06-
09
Unsheltered PIT Counts
Continuum of Care Unsheltered Point-In-Time Homeless Counts, 2006-2009
#CoC Number CoC Name 1
Change 2006 to 2009 % of Statewide
Unsheltered Count
119 IA-501 Iowa Balance of State CoC 71 126 189 497 -55 -43.7% -63 -33.3% -308 -62.0% -426 -85.7% 44.65%
120 IA-502 Des Moines/Polk County CoC 58 122 99 1,530 -64 -52.5% 23 23.2% -1,431 -93.5% -1,472 -96.2% 36.48%
121 ID-500 Boise/Ada County CoC 142 58 109 11 84 144.8% -51 -46.8% 98 890.9% 131 1190.9% 30.74%
122 ID-501 Idaho Balance of State CoC 320 156 515 310 164 105.1% -359 -69.7% 205 66.1% 10 3.2% 69.26%
123 IL-500 McHenry County CoC 10 4 18 16 6 150.0% -14 -77.8% 2 12.5% -6 -37.5% 0.45%
124 IL-501 Rockford/Winnebago, Boone Counties 105 50 50 1,219 55 110.0% 0 0.0% -1,169 -95.9% -1,114 -91.4% 4.76%
125 IL-502 North Chicago/Lake County CoC 2 9 10 9 -7 -77.8% -1 -10.0% 1 11.1% -7 -77.8% 0.09%
126 IL-503 Champaign/Urbana/Champaign County CoC 4 13 13 13 -9 -69.2% 0 0.0% 0 0.0% -9 -69.2% 0.18%
127 IL-504 Madison County CoC 41 25 37 79 16 64.0% -12 -32.4% -42 -53.2% -38 -48.1% 1.86%
128 IL-505 Evanston CoC 95 90 90 89 5 5.6% 0 0.0% 1 1.1% 6 6.7% 4.31%
129 IL-506 Joliet/Bolingbrook/Will County CoC 9 10 18 43 -1 -10.0% -8 -44.4% -25 -58.1% -34 -79.1% 0.41%
130 IL-507 Peoria/Perkin/Woodford CoC 67 8 98 124 59 737.5% -90 -91.8% -26 -21.0% -57 -46.0% 3.04%
131 IL-508 East Saint Louis/Saint Clair County CoC 294 452 357 757 -158 -35.0% 95 26.6% -400 -52.8% -463 -61.2% 13.34%
132 IL-509 DeKalb City & County CoC 31 24 24 29 7 29.2% 0 0.0% -5 -17.2% 2 6.9% 1.41%
133 IL-510 Chicago CoC 884 1,633 1,633 1,702 -749 -45.9% 0 0.0% -69 -4.1% -818 -48.1% 40.11%
134 IL-511 Cook County CoC 156 168 168 61 -12 -7.1% 0 0.0% 107 175.4% 95 155.7% 7.08%
135 IL-512 Bloomington/Central Illinois CoC 33 68 68 47 -35 -51.5% 0 0.0% 21 44.7% -14 -29.8% 1.50%
136 IL-513 Springfield/Sangamon County CoC 9 7 15 58 2 28.6% -8 -53.3% -43 -74.1% -49 -84.5% 0.41%
137 IL-514 Dupage County CoC 108 124 124 19 -16 -12.9% 0 0.0% 105 552.6% 89 468.4% 4.90%
138 IL-515 South Central Illinois CoC 95 35 32 141 60 171.4% 3 9.4% -109 -77.3% -46 -32.6% 4.31%
139 IL-516 Decatur/Macon County CoC 26 180 180 197 -154 -85.6% 0 0.0% -17 -8.6% -171 -86.8% 1.18%
140 IL-517 Aurora/Elgin/Kane County CoC 53 56 56 54 -3 -5.4% 0 0.0% 2 3.7% -1 -1.9% 2.40%
141 IL-518 Rock Island...Northwestern Illinois CoC 52 84 94 126 -32 -38.1% -10 -10.6% -32 -25.4% -74 -58.7% 2.36%
142 IL-519 West Central Illinois CoC 0 130 157 138 -130 -100.0% -27 -17.2% 19 13.8% -138 -100.0% 0.00%
143 IL-520 Southern Illinois CoC 130 74 74 218 56 75.7% 0 0.0% -144 -66.1% -88 -40.4% 5.90%
144 IN-500 South Bend/Mishawaka/St. Joseph County CoC 716 317 0 0 399 125.9% 317 - 0 - 716 - 40.27%
145 IN-502 Indiana Balance of State CoC 875 1,028 1,028 2,504 -153 -14.9% 0 0.0% -1,476 -58.9% -1,629 -65.1% 49.21%
146 IN-503 Indianapolis CoC 187 127 234 147 60 47.2% -107 -45.7% 87 59.2% 40 27.2% 10.52%
147 KS-501 Kansas City/Wyandotte County CoC 42 57 57 75 -15 -26.3% 0 0.0% -18 -24.0% -33 -44.0% 21.43%
148 KS-502 Wichita/Sedgwick County CoC 32 28 53 195 4 14.3% -25 -47.2% -142 -72.8% -163 -83.6% 16.33%
149 KS-503 Topeka/Shawnee County CoC 19 25 1 19 -6 -24.0% 24 2400.0% -18 -94.7% 0 0.0% 9.69%
150 KS-505 Overland Park/Johnson County CoC 44 87 87 80 -43 -49.4% 0 0.0% 7 8.8% -36 -45.0% 22.45%
151 KS-507 Kansas Balance of State CoC 59 41 41 1,452 18 43.9% 0 0.0% -1,411 -97.2% -1,393 -95.9% 30.10%
152 KY-500 Kentucky Balance of State CoC 486 1,611 1,895 476 -1,125 -69.8% -284 -15.0% 1,419 298.1% 10 2.1% 69.43%
153 KY-501 Louisville/Jefferson County CoC 154 145 180 602 9 6.2% -35 -19.4% -422 -70.1% -448 -74.4% 22.00%
154 KY-502 Lexington/Fayette County CoC 60 186 46 50 -126 -67.7% 140 304.3% -4 -8.0% 10 20.0% 8.57%
155 LA-500 Lafayette/Acadiana CoC 193 174 174 172 19 10.9% 0 0.0% 2 1.2% 21 12.2% 2.30%
156 LA-501 Lake Charles/Southwestern Louisiana 43 40 28 36 3 7.5% 12 42.9% -8 -22.2% 7 19.4% 0.51%
157 LA-502 Shreveport/Bossier/Northwest CoC 91 144 134 143 -53 -36.8% 10 7.5% -9 -6.3% -52 -36.4% 1.09%
158 LA-503 New Orleans/Jefferson Parish CoC 7,385 629 629 591 6,756 1074.1% 0 0.0% 38 6.4% 6,794 1149.6% 88.06%
159 LA-504 Baton Rouge CoC 379 331 241 22 48 14.5% 90 37.3% 219 995.5% 357 1622.7% 4.52%
160 LA-505 Monroe/Northeast Louisiana CoC 41 75 51 78 -34 -45.3% 24 47.1% -27 -34.6% -37 -47.4% 0.49%
161 LA-506 Slidell/Livingston/Southeast Louisiana CoC 162 312 231 154 -150 -48.1% 81 35.1% 77 50.0% 8 5.2% 1.93%
162 LA-507 Alexandria/Central Louisiana CoC 47 35 48 147 12 34.3% -13 -27.1% -99 -67.3% -100 -68.0% 0.56%
163 LA-508 Houma-Terrebonne CoC 45 41 41 65 4 9.8% 0 0.0% -24 -36.9% -20 -30.8% 0.54%
164 MA-500 Boston CoC 219 184 306 261 35 19.0% -122 -39.9% 45 17.2% -42 -16.1% 21.77%
165 MA-501 Franklin/Holyoke County CoC 58 77 53 40 -19 -24.7% 24 45.3% 13 32.5% 18 45.0% 5.77%
166 MA-502 Lynn CoC 30 39 28 3 -9 -23.1% 11 39.3% 25 833.3% 27 900.0% 2.98%
167 MA-503 Cape Cod/Islands CoC 204 317 329 498 -113 -35.6% -12 -3.6% -169 -33.9% -294 -59.0% 20.28%
168 MA-504 Springfield CoC 12 20 33 37 -8 -40.0% -13 -39.4% -4 -10.8% -25 -67.6% 1.19%
169 MA-505 New Bedford CoC 102 81 34 50 21 25.9% 47 138.2% -16 -32.0% 52 104.0% 10.14%
170 MA-506 Worcester City & County CoC 36 34 34 23 2 5.9% 0 0.0% 11 47.8% 13 56.5% 3.58%
171 MA-507 Pittsfield/Berkshire County CoC 95 27 59 67 68 251.9% -32 -54.2% -8 -11.9% 28 41.8% 9.44%
172 MA-508 Lowell CoC 11 8 14 28 3 37.5% -6 -42.9% -14 -50.0% -17 -60.7% 1.09%
173 MA-509 Cambridge CoC 43 62 56 44 -19 -30.6% 6 10.7% 12 27.3% -1 -2.3% 4.27%
174 MA-510 Gloucester...Essex County 69 31 22 54 38 122.6% 9 40.9% -32 -59.3% 15 27.8% 6.86%
175 MA-511 Quincy/Weymouth CoC 13 23 34 35 -10 -43.5% -11 -32.4% -1 -2.9% -22 -62.9% 1.29%
176 MA-512 Lawrence CoC 22 30 19 12 -8 -26.7% 11 57.9% 7 58.3% 10 83.3% 2.19%
177 MA-513 Malden/Medford CoC 8 7 22 18 1 14.3% -15 -68.2% 4 22.2% -10 -55.6% 0.80%

2009 2008 2007 2006
Total Change 08-
09% Change 08-
09
Total Change 07-
08% Change 07-
08
Total Change 06-
07% Change 06-
07
Total Change 06-
09% Change 06-
09
Unsheltered PIT Counts
Continuum of Care Unsheltered Point-In-Time Homeless Counts, 2006-2009
#CoC Number CoC Name 1
Change 2006 to 2009 % of Statewide
Unsheltered Count
178 MA-515 Fall River CoC 10 5 14 11 5 100.0% -9 -64.3% 3 27.3% -1 -9.1% 0.99%
179 MA-516 Massachusetts Balance of State CoC 8 28 24 15 -20 -71.4% 4 16.7% 9 60.0% -7 -46.7% 0.80%
180 MA-517 Somerville CoC 4 2 15 10 2 100.0% -13 -86.7% 5 50.0% -6 -60.0% 0.40%
181 MA-518 Brookline/Newton CoC 0 3 2 11 -3 -100.0% 1 50.0% -9 -81.8% -11 -100.0% 0.00%
182 MA-519 Attleboro/Taunton/Bristol County CoC 29 30 63 90 -1 -3.3% -33 -52.4% -27 -30.0% -61 -67.8% 2.88%
183 MA-520 Brockton/Plymouth City & County CoC 33 54 81 102 -21 -38.9% -27 -33.3% -21 -20.6% -69 -67.6% 3.28%
184 MD-500 Cumberland/Allegany County CoC 15 49 21 26 -34 -69.4% 28 133.3% -5 -19.2% -11 -42.3% 0.35%
185 MD-501 Baltimore City CoC 1,228 629 629 583 599 95.2% 0 0.0% 46 7.9% 645 110.6% 28.88%
186 MD-502 Harford County CoC 24 13 13 20 11 84.6% 0 0.0% -7 -35.0% 4 20.0% 0.56%
187 MD-503 Annapolis/Anne Arundel County CoC 94 50 71 99 44 88.0% -21 -29.6% -28 -28.3% -5 -5.1% 2.21%
188 MD-504 Howard County CoC 47 24 24 29 23 95.8% 0 0.0% -5 -17.2% 18 62.1% 1.11%
189 MD-505 Baltimore County CoC 406 33 58 66 373 1130.3% -25 -43.1% -8 -12.1% 340 515.2% 9.55%
190 MD-506 Carroll County CoC 28 13 13 29 15 115.4% 0 0.0% -16 -55.2% -1 -3.4% 0.66%
191 MD-507 Cecil County CoC 27 13 2 45 14 107.7% 11 550.0% -43 -95.6% -18 -40.0% 0.63%
192 MD-508 Charles, Calvert, St.Mary's CoC 2,024 1,685 1,671 240 339 20.1% 14 0.8% 1,431 596.3% 1,784 743.3% 47.60%
193 MD-509 Frederick City & County CoC 67 22 9 14 45 204.5% 13 144.4% -5 -35.7% 53 378.6% 1.58%
194 MD-510 Garrett County CoC 7 19 19 12 -12 -63.2% 0 0.0% 7 58.3% -5 -41.7% 0.16%
195 MD-511 Mid-Shore Regional CoC 6 171 172 219 -165 -96.5% -1 -0.6% -47 -21.5% -213 -97.3% 0.14%
196 MD-512 Hagerstown/Washington County CoC 27 22 3 23 5 22.7% 19 633.3% -20 -87.0% 4 17.4% 0.63%
197 MD-513 Wicomico/Somerset/Worcester CoC 43 37 37 62 6 16.2% 0 0.0% -25 -40.3% -19 -30.6% 1.01%
198 MD-600 Bowie/Prince George's County CoC 82 145 345 401 -63 -43.4% -200 -58.0% -56 -14.0% -319 -79.6% 1.93%
199 MD-601 Montgomery County CoC 127 240 123 173 -113 -47.1% 117 95.1% -50 -28.9% -46 -26.6% 2.99%
200 ME-500 Maine Balance of State CoC 29 31 40 26 -2 -6.5% -9 -22.5% 14 53.8% 3 11.5% 76.32%
201 ME-501 Bangor/Penobscot County Coc 5 8 13 23 -3 -37.5% -5 -38.5% -10 -43.5% -18 -78.3% 13.16%
202 ME-502 Portland CoC 4 5 9 0 -1 -20.0% -4 -44.4% 9 - 4 - 10.53%
203 MI-500 Michigan Balance of State CoC 922 931 931 713 -9 -1.0% 0 0.0% 218 30.6% 209 29.3% 34.06%
204 MI-501 Detroit CoC 262 13,324 13,324 10,516 -13,062 -98.0% 0 0.0% 2,808 26.7% -10,254 -97.5% 9.68%
205 MI-502 Dearborn/Wayne County CoC 6 247 247 240 -241 -97.6% 0 0.0% 7 2.9% -234 -97.5% 0.22%
206 MI-503 St. Clair Shores/Warren/Macomb County 585 518 518 261 67 12.9% 0 0.0% 257 98.5% 324 124.1% 21.61%
207 MI-504 Pontiac/Royal Oak/Oakland County 280 609 609 695 -329 -54.0% 0 0.0% -86 -12.4% -415 -59.7% 10.34%
208 MI-505 Flint/Genesee County CoC 82 18 141 1,899 64 355.6% -123 -87.2% -1,758 -92.6% -1,817 -95.7% 3.03%
209 MI-506 Grand Rapids/Wyoming/Kent County 34 42 105 55 -8 -19.0% -63 -60.0% 50 90.9% -21 -38.2% 1.26%
210 MI-507 Portage/Kalamazoo City & County 14 79 21 1 -65 -82.3% 58 276.2% 20 2000.0% 13 1300.0% 0.52%
211 MI-508 Lansing/East Lansing/Ingham County 20 17 17 68 3 17.6% 0 0.0% -51 -75.0% -48 -70.6% 0.74%
212 MI-509 Ann Arbor/Washtenaw County CoC 35 56 56 180 -21 -37.5% 0 0.0% -124 -68.9% -145 -80.6% 1.29%
213 MI-510 Saginaw City & County CoC 27 87 87 17 -60 -69.0% 0 0.0% 70 411.8% 10 58.8% 1.00%
214 MI-511 Lenawee County CoC 5 8 8 24 -3 -37.5% 0 0.0% -16 -66.7% -19 -79.2% 0.18%
215 MI-512 Grand Traverse/Antrim, Leelanau Counties 2 25 25 141 -23 -92.0% 0 0.0% -116 -82.3% -139 -98.6% 0.07%
216 MI-513 Marquette/Alger Counties CoC 5 0 0 9 5 - 0 - -9 -100.0% -4 -44.4% 0.18%
217 MI-514 Battle Creek/Calhoun County CoC 53 110 88 49 -57 -51.8% 22 25.0% 39 79.6% 4 8.2% 1.96%
218 MI-515 Monroe County CoC 4 11 11 49 -7 -63.6% 0 0.0% -38 -77.6% -45 -91.8% 0.15%
219 MI-516 Norton Shores/Muskegon City & County 321 180 185 63 141 78.3% -5 -2.7% 122 193.7% 258 409.5% 11.86%
220 MI-517 Jackson City & County CoC 19 70 181 19 -51 -72.9% -111 -61.3% 162 852.6% 0 0.0% 0.70%
221 MI-518 Livingston County CoC 13 5 5 31 8 160.0% 0 0.0% -26 -83.9% -18 -58.1% 0.48%
222 MI-519 Holland/Ottawa County CoC 2 0 13 0 2 - -13 -100.0% 13 - 2 - 0.07%
223 MI-522 Alpena, Iosca, Presque Isle/NE Michigan CoC 0 38 38 0 -38 -100.0% 0 0.0% 38 - 0 - 0.00%
224 MI-523 Eaton County CoC 16 92 92 20 -76 -82.6% 0 0.0% 72 360.0% -4 -20.0% 0.59%
225 MN-500 Minneapolis/Hennepin County CoC 256 556 556 357 -300 -54.0% 0 0.0% 199 55.7% -101 -28.3% 27.06%
226 MN-501 Saint Paul/Ramsey County CoC 93 124 124 0 -31 -25.0% 0 0.0% 124 - 93 - 9.83%
227 MN-502 Rochester/Southeast Minnesota CoC 4 33 33 48 -29 -87.9% 0 0.0% -15 -31.3% -44 -91.7% 0.42%
228 MN-503 Dakota County CoC 86 72 60 182 14 19.4% 12 20.0% -122 -67.0% -96 -52.7% 9.09%
229 MN-504 Northeast Minnesota CoC 90 116 116 47 -26 -22.4% 0 0.0% 69 146.8% 43 91.5% 9.51%
230 MN-505 St. Cloud/Central Minnesota CoC 108 76 76 88 32 42.1% 0 0.0% -12 -13.6% 20 22.7% 11.42%
231 MN-506 Northwest Minnesota CoC 36 31 31 11 5 16.1% 0 0.0% 20 181.8% 25 227.3% 3.81%
232 MN-508 Moorehead/West Central Minnesota 80 77 77 76 3 3.9% 0 0.0% 1 1.3% 4 5.3% 8.46%
233 MN-509 Duluth/Saint Louis County CoC 148 207 207 18 -59 -28.5% 0 0.0% 189 1050.0% 130 722.2% 15.64%
234 MN-510 Scott, Carver Counties CoC 21 64 46 44 -43 -67.2% 18 39.1% 2 4.5% -23 -52.3% 2.22%
235 MN-511 Southwest Minnesota CoC 24 18 89 10 6 33.3% -71 -79.8% 79 790.0% 14 140.0% 2.54%
236 MO-500 St. Louis County CoC 229 62 46 80 167 269.4% 16 34.8% -34 -42.5% 149 186.3% 15.37%

2009 2008 2007 2006
Total Change 08-
09% Change 08-
09
Total Change 07-
08% Change 07-
08
Total Change 06-
07% Change 06-
07
Total Change 06-
09% Change 06-
09
Unsheltered PIT Counts
Continuum of Care Unsheltered Point-In-Time Homeless Counts, 2006-2009
#CoC Number CoC Name 1
Change 2006 to 2009 % of Statewide
Unsheltered Count
237 MO-501 St. Louis City CoC 333 213 213 108 120 56.3% 0 0.0% 105 97.2% 225 208.3% 22.35%
238 MO-503 St. Charles CoC 281 288 271 351 -7 -2.4% 17 6.3% -80 -22.8% -70 -19.9% 18.86%
239 MO-600 Springfield/Webster Counties CoC 35 207 40 59 -172 -83.1% 167 417.5% -19 -32.2% -24 -40.7% 2.35%
240 MO-602 Joplin/Jasper/Newton County CoC 37 73 8 147 -36 -49.3% 65 812.5% -139 -94.6% -110 -74.8% 2.48%
241 MO-603 St. Joseph/Buchanan County CoC 4 28 0 0 -24 -85.7% 28 - 0 - 4 - 0.27%
242 MO-604 Kansas City/Lee's Summit CoC 197 534 154 203 -337 -63.1% 380 246.8% -49 -24.1% -6 -3.0% 13.22%
243 MO-606 Clay, Platte Counties CoC 374 675 346 148 -301 -44.6% 329 95.1% 198 133.8% 226 152.7% 25.10%
244 MS-500 Jackson/Rankin, Madison Counties CoC 496 507 278 71 -11 -2.2% 229 82.4% 207 291.5% 425 598.6% 31.47%
245 MS-501 Mississippi Balance of State CoC 582 41 41 338 541 1319.5% 0 0.0% -297 -87.9% 244 72.2% 36.93%
246 MS-503 Gulf Port/Gulf Coast Regional CoC 498 207 207 139 291 140.6% 0 0.0% 68 48.9% 359 258.3% 31.60%
247 MT-500 Montana Statewide CoC 363 410 295 452 -47 -11.5% 115 39.0% -157 -34.7% -89 -19.7% 100.00%
248 NC-500 Winston Salem/Forsyth County CoC 68 29 24 39 39 134.5% 5 20.8% -15 -38.5% 29 74.4% 1.53%
249 NC-501 Asheville/Buncombe County CoC 92 80 187 80 12 15.0% -107 -57.2% 107 133.8% 12 15.0% 2.07%
250 NC-502 Durham City & County CoC 34 36 37 42 -2 -5.6% -1 -2.7% -5 -11.9% -8 -19.0% 0.76%
251 NC-503 North Carolina Balance of State 812 777 961 573 35 4.5% -184 -19.1% 388 67.7% 239 41.7% 18.27%
252 NC-504 Greensboro/High Point CoC 130 108 202 228 22 20.4% -94 -46.5% -26 -11.4% -98 -43.0% 2.92%
253 NC-505 Charlotte/Mecklenburg County CoC 550 438 328 1,143 112 25.6% 110 33.5% -815 -71.3% -593 -51.9% 12.37%
254 NC-506 Wilmington/Brunswick/Pender CoC 162 69 209 388 93 134.8% -140 -67.0% -179 -46.1% -226 -58.2% 3.64%
255 NC-507 Raleigh/Wake County CoC 247 73 70 106 174 238.4% 3 4.3% -36 -34.0% 141 133.0% 5.56%
256 NC-509 Gastonia/Cleveland/Lincoln CoC 356 663 438 588 -307 -46.3% 225 51.4% -150 -25.5% -232 -39.5% 8.01%
257 NC-511 Fayetteville/Cumberland County CoC 702 808 444 510 -106 -13.1% 364 82.0% -66 -12.9% 192 37.6% 15.79%
258 NC-513 Chapel Hill/Orange County CoC 5 18 25 32 -13 -72.2% -7 -28.0% -7 -21.9% -27 -84.4% 0.11%
259 NC-516 Northwest North Carolina CoC 1,287 1,152 901 860 135 11.7% 251 27.9% 41 4.8% 427 49.7% 28.95%
260 ND-500 North Dakota Statewide CoC 8 19 59 77 -11 -57.9% -40 -67.8% -18 -23.4% -69 -89.6% 100.00%
261 NE-500 North Central Nebraska CoC 499 335 90 159 164 49.0% 245 272.2% -69 -43.4% 340 213.8% 78.09%
262 NE-501 Omaha/Council Bluffs CoC 61 72 238 189 -11 -15.3% -166 -69.7% 49 25.9% -128 -67.7% 9.55%
263 NE-502 Lincoln CoC 26 286 128 614 -260 -90.9% 158 123.4% -486 -79.2% -588 -95.8% 4.07%
264 NE-503 Southwest Nebraska CoC 1 13 13 19 -12 -92.3% 0 0.0% -6 -31.6% -18 -94.7% 0.16%
265 NE-504 Southeast Nebraska CoC 18 7 7 4 11 157.1% 0 0.0% 3 75.0% 14 350.0% 2.82%
266 NE-505 Panhandle of Nebraska CoC 31 42 47 100 -11 -26.2% -5 -10.6% -53 -53.0% -69 -69.0% 4.85%
267 NE-506 Northeast Nebraska CoC 3 3 1 32 0 0.0% 2 200.0% -31 -96.9% -29 -90.6% 0.47%
268 NH-500 New Hampshire Balance of State CoC 50 156 531 632 -106 -67.9% -375 -70.6% -101 -16.0% -582 -92.1% 20.92%
269 NH-501 Manchester CoC 171 203 197 771 -32 -15.8% 6 3.0% -574 -74.4% -600 -77.8% 71.55%
270 NH-502 Nashua/Hillsborough County CoC 18 125 247 370 -107 -85.6% -122 -49.4% -123 -33.2% -352 -95.1% 7.53%
271 NJ-500 Atlantic City & County CoC 122 78 89 252 44 56.4% -11 -12.4% -163 -64.7% -130 -51.6% 9.40%
272 NJ-501 Bergen County CoC 79 113 182 502 -34 -30.1% -69 -37.9% -320 -63.7% -423 -84.3% 6.09%
273 NJ-502 Burlington County CoC 30 116 116 238 -86 -74.1% 0 0.0% -122 -51.3% -208 -87.4% 2.31%
274 NJ-503 Camden City & County CoC 154 272 214 401 -118 -43.4% 58 27.1% -187 -46.6% -247 -61.6% 11.86%
275 NJ-504 Newark/Essex County CoC 191 152 420 420 39 25.7% -268 -63.8% 0 0.0% -229 -54.5% 14.71%
276 NJ-505 Gloucester County CoC 16 14 30 28 2 14.3% -16 -53.3% 2 7.1% -12 -42.9% 1.23%
277 NJ-506 Jersey City/Hudson County CoC 129 251 164 296 -122 -48.6% 87 53.0% -132 -44.6% -167 -56.4% 9.94%
278 NJ-507 New Brunswick/Middlesex County CoC 213 247 268 182 -34 -13.8% -21 -7.8% 86 47.3% 31 17.0% 16.41%
279 NJ-508 Monmouth County CoC 38 87 73 112 -49 -56.3% 14 19.2% -39 -34.8% -74 -66.1% 2.93%
280 NJ-509 Morris County CoC 45 35 63 37 10 28.6% -28 -44.4% 26 70.3% 8 21.6% 3.47%
281 NJ-510 Lakewood Township/Ocean County 47 28 43 41 19 67.9% -15 -34.9% 2 4.9% 6 14.6% 3.62%
282 NJ-511 Paterson/Passaic County CoC 99 204 231 140 -105 -51.5% -27 -11.7% 91 65.0% -41 -29.3% 7.63%
283 NJ-512 Salem County CoC 2 8 11 8 -6 -75.0% -3 -27.3% 3 37.5% -6 -75.0% 0.15%
284 NJ-513 Somerset County CoC 15 17 23 35 -2 -11.8% -6 -26.1% -12 -34.3% -20 -57.1% 1.16%
285 NJ-514 Trenton/Mercer County CoC 42 138 356 186 -96 -69.6% -218 -61.2% 170 91.4% -144 -77.4% 3.24%
286 NJ-515 Elizabeth/Union County CoC 39 116 116 297 -77 -66.4% 0 0.0% -181 -60.9% -258 -86.9% 3.00%
287 NJ-516 Warren County CoC 5 23 7 1 -18 -78.3% 16 228.6% 6 600.0% 4 400.0% 0.39%
288 NJ-518 Cape May County CoC 3 14 8 7 -11 -78.6% 6 75.0% 1 14.3% -4 -57.1% 0.23%
289 NJ-519 Sussex County CoC 8 16 4 17 -8 -50.0% 12 300.0% -13 -76.5% -9 -52.9% 0.62%
290 NJ-520 Cumberland County CoC 21 43 57 66 -22 -51.2% -14 -24.6% -9 -13.6% -45 -68.2% 1.62%
291 NM-500 Albuquerque CoC 931 287 287 2,481 644 224.4% 0 0.0% -2,194 -88.4% -1,550 -62.5% 68.11%
292 NM-501 New Mexico Balance of State CoC 436 980 980 726 -544 -55.5% 0 0.0% 254 35.0% -290 -39.9% 31.89%
293 NV-500 Las Vegas/Clark County CoC 6,334 7,573 7,573 9,424 -1,239 -16.4% 0 0.0% -1,851 -19.6% -3,090 -32.8% 94.74%
294 NV-501 Reno/Sparks/Washoe County CoC 55 98 98 83 -43 -43.9% 0 0.0% 15 18.1% -28 -33.7% 0.82%
295 NV-502 Nevada Balance of State CoC 297 76 37 147 221 290.8% 39 105.4% -110 -74.8% 150 102.0% 4.44%

2009 2008 2007 2006
Total Change 08-
09% Change 08-
09
Total Change 07-
08% Change 07-
08
Total Change 06-
07% Change 06-
07
Total Change 06-
09% Change 06-
09
Unsheltered PIT Counts
Continuum of Care Unsheltered Point-In-Time Homeless Counts, 2006-2009
#CoC Number CoC Name 1
Change 2006 to 2009 % of Statewide
Unsheltered Count
296 NY-500 Rochester/Monroe County 0 4 10 16 -4 -100.0% -6 -60.0% -6 -37.5% -16 -100.0% 0.00%
297 NY-501 Elmira/Chemung County CoC 6 1 1 28 5 500.0% 0 0.0% -27 -96.4% -22 -78.6% 0.17%
298 NY-502 City of Auburn/Cayuga County CoC 0 12 22 73 -12 -100.0% -10 -45.5% -51 -69.9% -73 -100.0% 0.00%
299 NY-503 Albany City & County CoC 35 72 80 46 -37 -51.4% -8 -10.0% 34 73.9% -11 -23.9% 0.97%
300 NY-504 Cattaraugus County CoC 17 15 38 90 2 13.3% -23 -60.5% -52 -57.8% -73 -81.1% 0.47%
301 NY-505 Syracuse/Onondaga County CoC 6 11 11 12 -5 -45.5% 0 0.0% -1 -8.3% -6 -50.0% 0.17%
302 NY-506 Fulton/Montgomery/Schoharie 4 - - - - - - - - - - - 0.11%
303 NY-507 Schenectady City & County CoC 62 66 79 69 -4 -6.1% -13 -16.5% 10 14.5% -7 -10.1% 1.72%
304 NY-508 Buffalo/Erie County CoC 115 208 161 138 -93 -44.7% 47 29.2% 23 16.7% -23 -16.7% 3.18%
305 NY-509 Oswego County CoC 26 - - - - - - - - - - - 0.72%
306 NY-510 Tompkins County CoC 10 16 16 34 -6 -37.5% 0 0.0% -18 -52.9% -24 -70.6% 0.28%
307 NY-511 Broome County/City of Binghamton 11 - - - - - - - - - - - 0.30%
308 NY-512 Troy/Rensselaer County CoC 38 59 46 222 -21 -35.6% 13 28.3% -176 -79.3% -184 -82.9% 1.05%
309 NY-513 Wayne County CoC 0 0 0 2 0 - 0 - -2 -100.0% -2 -100.0% 0.00%
310 NY-514 Jamestown/Dunkirk/Chautauqua County CoC 5 2 8 0 3 150.0% -6 -75.0% 8 - 5 - 0.14%
311 NY-515 Cortland County CoC 0 - - - - - - - - - - - 0.00%
312 NY-516 Clinton County CoC 12 5 5 0 7 140.0% 0 0.0% 5 - 12 - 0.33%
313 NY-517 Orleans County CoC 5 5 5 20 0 0.0% 0 0.0% -15 -75.0% -15 -75.0% 0.14%
314 NY-518 Utica/Rome/Oneida County CoC 17 16 16 36 1 6.3% 0 0.0% -20 -55.6% -19 -52.8% 0.47%
315 NY-519 Columbia/Greene County CoC 7 0 14 14 7 - -14 -100.0% 0 0.0% -7 -50.0% 0.19%
316 NY-520 Franklin County CoC 9 4 1 1 5 125.0% 3 300.0% 0 0.0% 8 800.0% 0.25%
317 NY-522 Jefferson County CoC 1 5 0 34 -4 -80.0% 5 - -34 -100.0% -33 -97.1% 0.03%
318 NY-523 Saratoga 31 49 109 135 -18 -36.7% -60 -55.0% -26 -19.3% -104 -77.0% 0.86%
319 NY-524 Niagara CoC 9 6 8 4 3 50.0% -2 -25.0% 4 100.0% 5 125.0% 0.25%
320 NY-600 New York City CoC 2,328 3,306 3,755 3,843 -978 -29.6% -449 -12.0% -88 -2.3% -1,515 -39.4% 64.43%
321 NY-601 Poughkeepsie/Dutchess County CoC 70 84 84 89 -14 -16.7% 0 0.0% -5 -5.6% -19 -21.3% 1.94%
322 NY-602 Newburgh/Middletown/Orange County CoC 105 94 187 83 11 11.7% -93 -49.7% 104 125.3% 22 26.5% 2.91%
323 NY-603 Islip/Suffolk County CoC 207 67 67 196 140 209.0% 0 0.0% -129 -65.8% 11 5.6% 5.73%
324 NY-604 Yonkers/Westchester County CoC 166 136 136 89 30 22.1% 0 0.0% 47 52.8% 77 86.5% 4.59%
325 NY-605 Nassau County CoC 102 91 91 91 11 12.1% 0 0.0% 0 0.0% 11 12.1% 2.82%
326 NY-606 Rockland County CoC 62 57 53 0 5 8.8% 4 7.5% 53 - 62 - 1.72%
327 NY-607 Sullivan County CoC 3 30 76 32 -27 -90.0% -46 -60.5% 44 137.5% -29 -90.6% 0.08%
328 NY-608 Ulster County CoC 144 188 201 147 -44 -23.4% -13 -6.5% 54 36.7% -3 -2.0% 3.99%
329 OH-500 Cincinnati/Hamilton County CoC 43 55 59 199 -12 -21.8% -4 -6.8% -140 -70.4% -156 -78.4% 2.43%
330 OH-501 Toledo/Lucas County CoC 218 254 114 142 -36 -14.2% 140 122.8% -28 -19.7% 76 53.5% 12.31%
331 OH-502 Cleveland/Cuyahoga County CoC 131 151 184 210 -20 -13.2% -33 -17.9% -26 -12.4% -79 -37.6% 7.40%
332 OH-503 Columbus/Franklin County CoC 108 117 114 189 -9 -7.7% 3 2.6% -75 -39.7% -81 -42.9% 6.10%
333 OH-504 Youngstown/Mahoning County CoC 6 11 17 7 -5 -45.5% -6 -35.3% 10 142.9% -1 -14.3% 0.34%
334 OH-505 Dayton/Kettering/Montgomery CoC 14 30 66 0 -16 -53.3% -36 -54.5% 66 - 14 - 0.79%
335 OH-506 Akron/Baberton/Summit County CoC 162 104 192 195 58 55.8% -88 -45.8% -3 -1.5% -33 -16.9% 9.15%
336 OH-507 Ohio Balance of State CoC 1,012 1,300 1,023 2,780 -288 -22.2% 277 27.1% -1,757 -63.2% -1,768 -63.6% 57.14%
337 OH-508 Canton/Stark County CoC 77 513 115 358 -436 -85.0% 398 346.1% -243 -67.9% -281 -78.5% 4.35%
338 OK-500 North Central Oklahoma CoC 144 26 39 33 118 453.8% -13 -33.3% 6 18.2% 111 336.4% 9.41%
339 OK-501 Tulsa City & County/Broken Arrow 29 35 72 49 -6 -17.1% -37 -51.4% 23 46.9% -20 -40.8% 1.89%
340 OK-502 Oklahoma City CoC 372 322 456 133 50 15.5% -134 -29.4% 323 242.9% 239 179.7% 24.30%
341 OK-503 Oklahoma Balance of State CoC 51 6 82 96 45 750.0% -76 -92.7% -14 -14.6% -45 -46.9% 3.33%
342 OK-504 Norman / Cleveland County 296 400 272 218 -104 -26.0% 128 47.1% 54 24.8% 78 35.8% 19.33%
343 OK-505 Northeast Oklahoma CoC 371 168 155 140 203 120.8% 13 8.4% 15 10.7% 231 165.0% 24.23%
344 OK-506 Southewst Oklahoma CoC 20 16 24 19 4 25.0% -8 -33.3% 5 26.3% 1 5.3% 1.31%
345 OK-507 Southeastern CoC 248 70 32 18 178 254.3% 38 118.8% 14 77.8% 230 1277.8% 16.20%
346 OR-500 Eugene/Springfield/Lane County CoC 1,233 772 772 109 461 59.7% 0 0.0% 663 608.3% 1,124 1031.2% 12.50%
347 OR-501 Portland/Gresham/Multnomah 1,591 1,634 1,634 2,355 -43 -2.6% 0 0.0% -721 -30.6% -764 -32.4% 16.12%
348 OR-502 Medford/Ashland/Jackson County CoC 45 26 273 571 19 73.1% -247 -90.5% -298 -52.2% -526 -92.1% 0.46%
349 OR-503 Central Oregon CoC 432 1,466 1,714 472 -1,034 -70.5% -248 -14.5% 1,242 263.1% -40 -8.5% 4.38%
350 OR-504 Salem/Marion/Polk County CoC 1,700 1,416 1,416 921 284 20.1% 0 0.0% 495 53.7% 779 84.6% 17.23%
351 OR-505 Oregon Balance of State CoC 2,631 3,574 1,630 1,048 -943 -26.4% 1,944 119.3% 582 55.5% 1,583 151.0% 26.66%
352 OR-506 Hillsboro/Beaverton/Washington County 536 409 412 416 127 31.1% -3 -0.7% -4 -1.0% 120 28.8% 5.43%
353 OR-507 Clackamas County CoC 1,699 1,410 1,410 1,601 289 20.5% 0 0.0% -191 -11.9% 98 6.1% 17.22%
354 PA-500 Philadelphia CoC 506 457 447 176 49 10.7% 10 2.2% 271 154.0% 330 187.5% 39.62%

2009 2008 2007 2006
Total Change 08-
09% Change 08-
09
Total Change 07-
08% Change 07-
08
Total Change 06-
07% Change 06-
07
Total Change 06-
09% Change 06-
09
Unsheltered PIT Counts
Continuum of Care Unsheltered Point-In-Time Homeless Counts, 2006-2009
#CoC Number CoC Name 1
Change 2006 to 2009 % of Statewide
Unsheltered Count
355 PA-501 Harrisburg/Dauphin County CoC 56 66 54 85 -10 -15.2% 12 22.2% -31 -36.5% -29 -34.1% 4.39%
356 PA-502 Upper Darby/Delaware County 51 43 37 31 8 18.6% 6 16.2% 6 19.4% 20 64.5% 3.99%
357 PA-503 Wilkes-Barre/Luzerne County 3 10 23 7 -7 -70.0% -13 -56.5% 16 228.6% -4 -57.1% 0.23%
358 PA-504 Lower Marion/Montgomery 38 24 119 53 14 58.3% -95 -79.8% 66 124.5% -15 -28.3% 2.98%
359 PA-505 Chester County CoC 17 28 87 41 -11 -39.3% -59 -67.8% 46 112.2% -24 -58.5% 1.33%
360 PA-506 Reading/Berks County CoC 7 67 58 31 -60 -89.6% 9 15.5% 27 87.1% -24 -77.4% 0.55%
361 PA-507 Altoona/Central Pennsylvania CoC 94 65 65 146 29 44.6% 0 0.0% -81 -55.5% -52 -35.6% 7.36%
362 PA-508 Scranton/Lackawanna County CoC 52 38 20 83 14 36.8% 18 90.0% -63 -75.9% -31 -37.3% 4.07%
363 PA-509 Allentown/Northeast Pennsylvania CoC 43 48 48 42 -5 -10.4% 0 0.0% 6 14.3% 1 2.4% 3.37%
364 PA-510 Lancaster City & County CoC 17 39 40 50 -22 -56.4% -1 -2.5% -10 -20.0% -33 -66.0% 1.33%
365 PA-511 Bristol/Bensalem/Bucks County CoC 34 4 8 51 30 750.0% -4 -50.0% -43 -84.3% -17 -33.3% 2.66%
366 PA-600 Pittsburgh...Allegheny County CoC 282 220 248 81 62 28.2% -28 -11.3% 167 206.2% 201 248.1% 22.08%
367 PA-601 Southwest Pennsylvania CoC 7 58 58 60 -51 -87.9% 0 0.0% -2 -3.3% -53 -88.3% 0.55%
368 PA-602 Northwest Pennsylvania CoC 13 9 9 5 4 44.4% 0 0.0% 4 80.0% 8 160.0% 1.02%
369 PA-603 Beaver County CoC 18 82 82 2 -64 -78.0% 0 0.0% 80 4000.0% 16 800.0% 1.41%
370 PA-605 Erie City & County CoC 39 41 76 90 -2 -4.9% -35 -46.1% -14 -15.6% -51 -56.7% 3.05%
371 PR-502 Puerto Rico Balance of Commonwealth 907 699 1,438 1,335 208 29.8% -739 -51.4% 103 7.7% -428 -32.1% 33.04%
372 PR-503 South/Southeast Puerto Rico CoC 1,838 1,503 1,503 1,603 335 22.3% 0 0.0% -100 -6.2% 235 14.7% 66.96%
373 RI-500 Rhode Island Statewide CoC 51 54 49 108 -3 -5.6% 5 10.2% -59 -54.6% -57 -52.8% 100.00%
374 SC-500 Charleston/Low Country CoC 69 57 57 278 12 21.1% 0 0.0% -221 -79.5% -209 -75.2% 4.80%
375 SC-501 Greenville/Anderson/Spartanburg Upstate 156 506 506 611 -350 -69.2% 0 0.0% -105 -17.2% -455 -74.5% 10.86%
376 SC-502 Columbia Midlands CoC 439 623 623 1,412 -184 -29.5% 0 0.0% -789 -55.9% -973 -68.9% 30.55%
377 SC-503 Myrtle Beach/Sumter City & County 677 1,339 1,339 1,477 -662 -49.4% 0 0.0% -138 -9.3% -800 -54.2% 47.11%
378 SC-504 Florence City & County/Pee Dee CoC 96 49 49 372 47 95.9% 0 0.0% -323 -86.8% -276 -74.2% 6.68%
379 SD-500 South Dakota Statewide CoC 64 41 41 42 23 56.1% 0 0.0% -1 -2.4% 22 52.4% 100.00%
380 TN-500 Chattanooga/Southeast Tennessee CoC 207 15 757 303 192 1280.0% -742 -98.0% 454 149.8% -96 -31.7% 6.09%
381 TN-501 Memphis/Shelby County CoC 69 84 70 194 -15 -17.9% 14 20.0% -124 -63.9% -125 -64.4% 2.03%
382 TN-502 Knoxville/Knox County CoC 117 114 126 155 3 2.6% -12 -9.5% -29 -18.7% -38 -24.5% 3.44%
383 TN-503 South Central Tennessee CoC 45 89 79 140 -44 -49.4% 10 12.7% -61 -43.6% -95 -67.9% 1.32%
384 TN-504 Nashville/Davidson County CoC 398 466 390 496 -68 -14.6% 76 19.5% -106 -21.4% -98 -19.8% 11.71%
385 TN-506 Oak Ridge/Upper Cumberland CoC 1,033 508 508 744 525 103.3% 0 0.0% -236 -31.7% 289 38.8% 30.39%
386 TN-507 Jackson/West Tennessee CoC 1,088 1,936 2,001 1,630 -848 -43.8% -65 -3.2% 371 22.8% -542 -33.3% 32.01%
387 TN-509 Appalachian Regional CoC 199 214 214 208 -15 -7.0% 0 0.0% 6 2.9% -9 -4.3% 5.85%
388 TN-510 Murfreesboro/Rutherford City CoC 92 148 148 84 -56 -37.8% 0 0.0% 64 76.2% 8 9.5% 2.71%
389 TN-512 Morristown/Tennessee Valley CoC 151 471 471 0 -320 -67.9% 0 0.0% 471 #DIV/0! 151 #DIV/0! 4.44%
390 TX-500 San Antonio/Bexar County CoC 1,107 1,545 449 353 -438 -28.3% 1,096 244.1% 96 27.2% 754 213.6% 7.33%
391 TX-501 Corpus Christi/Nueces County CoC 312 114 114 2,766 198 173.7% 0 0.0% -2,652 -95.9% -2,454 -88.7% 2.07%
392 TX-503 Austin/Travis County CoC 1,223 2,146 3,886 1,854 -923 -43.0% -1,740 -44.8% 2,032 109.6% -631 -34.0% 8.10%
393 TX-504 Dewitt, Lavaca, Victoria Counties CoC 38 178 178 257 -140 -78.7% 0 0.0% -79 -30.7% -219 -85.2% 0.25%
394 TX-600 Dallas City & County/Irving CoC 176 213 367 376 -37 -17.4% -154 -42.0% -9 -2.4% -200 -53.2% 1.17%
395 TX-601 Fort Worth/Arlington/Tarrant County 195 203 201 350 -8 -3.9% 2 1.0% -149 -42.6% -155 -44.3% 1.29%
396 TX-603 El Paso City & County CoC 296 273 273 198 23 8.4% 0 0.0% 75 37.9% 98 49.5% 1.96%
397 TX-604 Waco/McLennan County CoC 86 172 172 258 -86 -50.0% 0 0.0% -86 -33.3% -172 -66.7% 0.57%
398 TX-607 Texas Balance of State CoC 8,270 5,133 5,133 10,257 3,137 61.1% 0 0.0% -5,124 -50.0% -1,987 -19.4% 54.76%
399 TX-610 Denton City & County CoC 31 78 96 286 -47 -60.3% -18 -18.8% -190 -66.4% -255 -89.2% 0.21%
400 TX-611 Amarillo CoC 127 54 133 837 73 135.2% -79 -59.4% -704 -84.1% -710 -84.8% 0.84%
401 TX-613 Longview/Marshall Area CoC 106 158 114 0 -52 -32.9% 44 38.6% 114 - 106 - 0.70%
402 TX-624 Wichita Falls/Archer County CoC 7 49 49 0 -42 -85.7% 0 0.0% 49 - 7 - 0.05%
403 TX-700 Houston/Harris County CoC 2,119 5,346 5,346 0 -3,227 -60.4% 0 0.0% 5,346 - 2,119 - 14.03%
404 TX-701 Bryan/College Station/Brazos 84 70 70 0 14 20.0% 0 0.0% 70 - 84 - 0.56%
405 TX-702 Conroe/Montgomery County CoC 295 26 0 0 269 1034.6% 26 #DIV/0! 0 - 295 - 1.95%
406 TX-703 Beaumont/South East Texas 408 242 242 0 166 68.6% 0 0.0% 242 - 408 - 2.70%
407 TX-704 Galveston/Gulf Coast CoC 223 110 83 0 113 102.7% 27 32.5% 83 - 223 - 1.48%
408 UT-500 Salt Lake City & County CoC 112 158 198 203 -46 -29.1% -40 -20.2% -5 -2.5% -91 -44.8% 43.92%
409 UT-503 Utah Balance of State CoC 99 51 86 73 48 94.1% -35 -40.7% 13 17.8% 26 35.6% 38.82%
410 UT-504 Provo/Mountainland CoC 44 47 29 158 -3 -6.4% 18 62.1% -129 -81.6% -114 -72.2% 17.25%
411 VA-500 Richmond/Henrico, Chesterfield, Hanover Counties CoC 72 166 144 214 -94 -56.6% 22 15.3% -70 -32.7% -142 -66.4% 4.59%
412 VA-501 Norfolk CoC 91 61 104 64 30 49.2% -43 -41.3% 40 62.5% 27 42.2% 5.80%
413 VA-502 Roanoke City & County/Salem CoC 11 7 38 18 4 57.1% -31 -81.6% 20 111.1% -7 -38.9% 0.70%

2009 2008 2007 2006
Total Change 08-
09% Change 08-
09
Total Change 07-
08% Change 07-
08
Total Change 06-
07% Change 06-
07
Total Change 06-
09% Change 06-
09
Unsheltered PIT Counts
Continuum of Care Unsheltered Point-In-Time Homeless Counts, 2006-2009
#CoC Number CoC Name 1
Change 2006 to 2009 % of Statewide
Unsheltered Count
414 VA-503 Virginia Beach CoC 39 78 46 293 -39 -50.0% 32 69.6% -247 -84.3% -254 -86.7% 2.49%
415 VA-504 Charlottesville CoC 14 15 28 94 -1 -6.7% -13 -46.4% -66 -70.2% -80 -85.1% 0.89%
416 VA-505 Newport News/Virginia Peninsula CoC 55 40 339 257 15 37.5% -299 -88.2% 82 31.9% -202 -78.6% 3.51%
417 VA-507 Portsmouth CoC 110 45 52 54 65 144.4% -7 -13.5% -2 -3.7% 56 103.7% 7.02%
418 VA-508 Lynchburg CoC 44 45 191 191 -1 -2.2% -146 -76.4% 0 0.0% -147 -77.0% 2.81%
419 VA-509 Petersburg CoC 23 45 41 25 -22 -48.9% 4 9.8% 16 64.0% -2 -8.0% 1.47%
420 VA-510 Staunton/Waynesboro/Augusta, Highland Counties CoC 1 15 1 0 -14 -93.3% 14 1400.0% 1 - 1 - 0.06%
421 VA-512 Chesapeake CoC 20 14 43 186 6 42.9% -29 -67.4% -143 -76.9% -166 -89.2% 1.28%
422 VA-513 Shenandoah/Warren Counties CoC 40 50 47 26 -10 -20.0% 3 6.4% 21 80.8% 14 53.8% 2.55%
423 VA-514 Fredericksburg/Stafford Counties CoC 107 67 46 34 40 59.7% 21 45.7% 12 35.3% 73 214.7% 6.82%
424 VA-517 Danville, Martinsville CoC 76 133 118 22 -57 -42.9% 15 12.7% 96 436.4% 54 245.5% 4.85%
425 VA-518 Harrisburg/ Rockingham County CoC 21 7 9 3 14 200.0% -2 -22.2% 6 200.0% 18 600.0% 1.34%
426 VA-519 Suffolk CoC 21 18 9 65 3 16.7% 9 100.0% -56 -86.2% -44 -67.7% 1.34%
427 VA-521 Virginia Balance of State 182 111 103 201 71 64.0% 8 7.8% -98 -48.8% -19 -9.5% 11.61%
428 VA-600 Arlington County CoC 207 179 219 142 28 15.6% -40 -18.3% 77 54.2% 65 45.8% 13.20%
429 VA-601 Fairfax County CoC 129 212 154 228 -83 -39.2% 58 37.7% -74 -32.5% -99 -43.4% 8.23%
430 VA-602 Loudoun County CoC 35 24 97 81 11 45.8% -73 -75.3% 16 19.8% -46 -56.8% 2.23%
431 VA-603 Alexandria CoC 32 68 92 108 -36 -52.9% -24 -26.1% -16 -14.8% -76 -70.4% 2.04%
432 VA-604 Prince William County CoC 238 174 258 180 64 36.8% -84 -32.6% 78 43.3% 58 32.2% 15.18%
433 VI-500 Virgin Islands CoC 395 487 487 354 -92 -18.9% 0 0.0% 133 37.6% 41 11.6% 100.00%
434 VT-500 Vermont Balance of State CoC 125 194 280 195 -69 -35.6% -86 -30.7% 85 43.6% -70 -35.9% 79.62%
435 VT-501 Burlington/Chittenden County CoC 32 64 35 52 -32 -50.0% 29 82.9% -17 -32.7% -20 -38.5% 20.38%
436 WA-500 Seattle/King County CoC 2,863 2,693 2,222 1,946 170 6.3% 471 21.2% 276 14.2% 917 47.1% 43.74%
437 WA-501 Washington Balance of State CoC 1,807 1,971 2,027 1,634 -164 -8.3% -56 -2.8% 393 24.1% 173 10.6% 27.61%
438 WA-502 City of Spokane CoC 157 290 194 505 -133 -45.9% 96 49.5% -311 -61.6% -348 -68.9% 2.40%
439 WA-503 Tacoma/Lakewood/Pierce County CoC 230 265 254 239 -35 -13.2% 11 4.3% 15 6.3% -9 -3.8% 3.51%
440 WA-504 Everett/Snohomish County CoC 1,110 956 1,303 1,662 154 16.1% -347 -26.6% -359 -21.6% -552 -33.2% 16.96%
441 WA-507 Yakima City & County CoC 146 141 143 152 5 3.5% -2 -1.4% -9 -5.9% -6 -3.9% 2.23%
442 WA-508 Vancouver-Clarke County CoC 232 182 228 271 50 27.5% -46 -20.2% -43 -15.9% -39 -14.4% 3.54%
443 WI-500 Wisconsin Balance of State CoC 785 288 288 357 497 172.6% 0 0.0% -69 -19.3% 428 119.9% 74.06%
444 WI-501 Milwaukee City & County CoC 220 175 175 548 45 25.7% 0 0.0% -373 -68.1% -328 -59.9% 20.75%
445 WI-502 Racine City & County CoC 1 1 6 27 0 0.0% -5 -83.3% -21 -77.8% -26 -96.3% 0.09%
446 WI-503 Madison/Dane County CoC 54 51 94 94 3 5.9% -43 -45.7% 0 0.0% -40 -42.6% 5.09%
447 WV-500 Wheeling/Weirton Area CoC 0 7 22 54 -7 -100.0% -15 -68.2% -32 -59.3% -54 -100.0% 0.00%
448 WV-501 Huntington/Cabell, Wayne Counties 5 32 58 85 -27 -84.4% -26 -44.8% -27 -31.8% -80 -94.1% 1.29%
449 WV-503 Charleston/Kanawha/Clay Counties CoC 51 99 62 76 -48 -48.5% 37 59.7% -14 -18.4% -25 -32.9% 13.11%
450 WV-508 West Virginia Balance of State CoC 333 456 120 124 -123 -27.0% 336 280.0% -4 -3.2% 209 168.5% 85.60%451 WY-500 Wyoming Statewide CoC 64 132 140 192 -68 -51.5% -8 -5.7% -52 -27.1% -128 -66.7% 100.00%
TOTAL 239,759 278,053 280,487 331,130 -38,294 -13.8% -2,434 -0.9% -50,643 -15.3% -91,371 -27.6%
1 Only active 2009 CoCs are reported in this table. All inactive or closed CoCs have been included in the national totals for 2006, 2007 and 2008, but are not individually reported.

2009 2008 2007 2006
Total Change 08-09
% Change 08-09
Total Change 07-08
% Change 07-08
Total Change 06-07
% Change 06-07
Total Change 06-09
% Change 06-09
1 AK-500 Anchorage CoC 1,267 1,023 974 1,288 244 23.9% 49 5.0% -314 -24.4% -21 -1.6% 63.60%2 AK-501 Alaska Balance of State CoC 725 623 668 739 102 16.4% -45 -6.7% -71 -9.6% -14 -1.9% 36.40%3 AL-500 Birmingham/Jefferson, St. Clair, Shelby Counties CoC 2,273 2,104 2,104 2,428 169 8.0% 0 0.0% -324 -13.3% -155 -6.4% 37.38%4 AL-501 Mobile City & County/Baldwin County CoC 747 524 649 784 223 42.6% -125 -19.3% -135 -17.2% -37 -4.7% 12.29%5 AL-502 Florence/Northwest Alabama CoC 281 249 265 221 32 12.9% -16 -6.0% 44 19.9% 60 27.1% 4.62%6 AL-503 Huntsville/North Alabama CoC 664 714 830 972 -50 -7.0% -116 -14.0% -142 -14.6% -308 -31.7% 10.92%7 AL-504 Montgomery City & County CoC 377 444 456 479 -67 -15.1% -12 -2.6% -23 -4.8% -102 -21.3% 6.20%8 AL-505 Gadsden/Northeast Alabama CoC 433 298 119 104 135 45.3% 179 150.4% 15 14.4% 329 316.3% 7.12%9 AL-506 Tuscaloosa City & County CoC 270 196 345 184 74 37.8% -149 -43.2% 161 87.5% 86 46.7% 4.44%10 AL-507 Alabama Balance of State CoC 1,035 858 684 407 177 20.6% 174 25.4% 277 68.1% 628 154.3% 17.02%11 AR-500 Little Rock/Central Arkansas CoC 1,425 1,811 1,822 13,071 -386 -21.3% -11 -0.6% -11,249 -86.1% -11,646 -89.1% 49.96%12 AR-501 Fayetteville/Northwest Arkansas CoC 221 313 279 191 -92 -29.4% 34 12.2% 88 46.1% 30 15.7% 7.75%13 AR-502 Conway/Arkansas River Valley CoC 146 163 163 1,183 -17 -10.4% 0 0.0% -1,020 -86.2% -1,037 -87.7% 5.12%14 AR-504 Delta Hills CoC 969 817 901 1,569 152 18.6% -84 -9.3% -668 -42.6% -600 -38.2% 33.98%15 AR-505 Southeast Arkansas CoC 51 130 130 122 -79 -60.8% 0 0.0% 8 6.6% -71 -58.2% 1.79%16 AR-506 Johnson, Pope, Yell Counties CoC 40 21 21 0 19 90.5% 0 0.0% 21 - 40 - 1.40%17 AZ-500 Arizona Balance of State CoC 3,236 2,940 2,997 2,640 296 10.1% -57 -1.9% 357 13.5% 596 22.6% 21.98%18 AZ-501 Tucson/Pima County CoC 3,596 2,359 3,201 2,580 1,237 52.4% -842 -26.3% 621 24.1% 1,016 39.4% 24.43%19 AZ-502 Phoenix/Mesa/Maricopa County Regional CoC 7,889 7,189 8,448 7,479 700 9.7% -1,259 -14.9% 969 13.0% 410 5.5% 53.59%20 CA-500 San Jose/Santa Clara City & County CoC 7,086 7,202 7,202 7,012 -116 -1.6% 0 0.0% 190 2.7% 74 1.1% 5.32%21 CA-501 San Francisco CoC 5,823 5,171 5,703 5,404 652 12.6% -532 -9.3% 299 5.5% 419 7.8% 4.37%22 CA-502 Oakland/Alameda County CoC 4,341 4,838 4,838 5,129 -497 -10.3% 0 0.0% -291 -5.7% -788 -15.4% 3.26%23 CA-503 Sacramento City & County CoC 2,800 2,615 2,452 2,229 185 7.1% 163 6.6% 223 10.0% 571 25.6% 2.10%24 CA-504 Santa Rosa/Petaluma/Sonoma County 3,247 1,314 1,314 1,737 1,933 147.1% 0 0.0% -423 -24.4% 1,510 86.9% 2.44%25 CA-505 Richmond/Contra Costa County CoC 2,759 4,062 4,062 6,271 -1,303 -32.1% 0 0.0% -2,209 -35.2% -3,512 -56.0% 2.07%26 CA-506 Salinas/Monterey County CoC 2,407 1,402 1,402 1,606 1,005 71.7% 0 0.0% -204 -12.7% 801 49.9% 1.81%27 CA-507 Marin County CoC 1,026 1,002 1,002 1,017 24 2.4% 0 0.0% -15 -1.5% 9 0.9% 0.77%28 CA-508 Watsonville/Santa Cruz City & County CoC 2,265 2,789 2,789 3,353 -524 -18.8% 0 0.0% -564 -16.8% -1,088 -32.4% 1.70%29 CA-509 Mendocino County CoC 1,202 1,423 1,422 1,651 -221 -15.5% 1 0.1% -229 -13.9% -449 -27.2% 0.90%30 CA-510 Turlock/Modesto/Stanislaus County CoC 1,800 1,593 1,593 1,613 207 13.0% 0 0.0% -20 -1.2% 187 11.6% 1.35%31 CA-511 Stockton/San Joaquin County CoC 3,005 2,354 2,479 3,360 651 27.7% -125 -5.0% -881 -26.2% -355 -10.6% 2.26%32 CA-512 Daly/San Mateo County CoC 1,567 1,798 1,798 1,231 -231 -12.8% 0 0.0% 567 46.1% 336 27.3% 1.18%33 CA-513 Visalia, Kings, Tulare Counties CoC 966 1,040 1,106 1,998 -74 -7.1% -66 -6.0% -892 -44.6% -1,032 -51.7% 0.73%34 CA-514 Fresno/Madera County CoC 4,345 3,507 4,247 2,553 838 23.9% -740 -17.4% 1,694 66.4% 1,792 70.2% 3.26%35 CA-515 Roseville/Placer County CoC 616 587 587 466 29 4.9% 0 0.0% 121 26.0% 150 32.2% 0.46%36 CA-516 Redding/Shasta County CoC 340 263 296 292 77 29.3% -33 -11.1% 4 1.4% 48 16.4% 0.26%37 CA-517 Napa City & County CoC 314 365 365 337 -51 -14.0% 0 0.0% 28 8.3% -23 -6.8% 0.24%38 CA-518 Vallejo/Solano County CoC 829 1,956 1,956 3,540 -1,127 -57.6% 0 0.0% -1,584 -44.7% -2,711 -76.6% 0.62%39 CA-519 Chico/Paradise/Butte County CoC 689 592 1,478 990 97 16.4% -886 -59.9% 488 49.3% -301 -30.4% 0.52%40 CA-520 Merced City & County CoC 372 2,455 2,641 2,641 -2,083 -84.8% -186 -7.0% 0 0.0% -2,269 -85.9% 0.28%41 CA-521 Davis/Woodland/Yolo County CoC 491 414 414 690 77 18.6% 0 0.0% -276 -40.0% -199 -28.8% 0.37%42 CA-522 Humboldt County CoC 1,355 907 907 1,847 448 49.4% 0 0.0% -940 -50.9% -492 -26.6% 1.02%43 CA-523 Colusa/Glenn/Tehama/Trinity Counties Coc 197 - - - - - - - - - - - 0.15%44 CA-524 Yuba City, Marysville/Sutter, Yuba Counties CoC 411 594 362 528 -183 -30.8% 232 64.1% -166 -31.4% -117 -22.2% 0.31%45 CA-525 El Dorado County CoC 146 150 107 0 -4 -2.7% 43 40.2% 107 - 146 - 0.11%46 CA-526 Tuolumne, Calaveras, Amador Counties CoC 372 400 400 0 -28 -7.0% 0 0.0% 400 - 372 - 0.28%47 CA-527 Nevada County CoC 438 - - - - - - - - - - - 0.33%48 CA-600 Los Angeles City & County CoC 42,694 68,608 68,608 82,291 -25,914 -37.8% 0 0.0% -13,683 -16.6% -39,597 -48.1% 32.07%49 CA-601 San Diego CoC 4,338 4,354 3,485 5,472 -16 -0.4% 869 24.9% -1,987 -36.3% -1,134 -20.7% 3.26%50 CA-602 Santa Ana/Anaheim/Orange County CoC 8,333 3,649 3,649 2,848 4,684 128.4% 0 0.0% 801 28.1% 5,485 192.6% 6.26%51 CA-603 Santa Maria/Santa Barbara County 4,121 4,253 4,253 4,058 -132 -3.1% 0 0.0% 195 4.8% 63 1.6% 3.10%52 CA-604 Bakersfield/Kern County CoC 1,499 1,537 1,537 1,306 -38 -2.5% 0 0.0% 231 17.7% 193 14.8% 1.13%53 CA-605 San Buena Ventura/Ventura County 1,514 1,290 1,290 982 224 17.4% 0 0.0% 308 31.4% 532 54.2% 1.14%54 CA-606 Long Beach CoC 3,909 3,829 3,829 4,475 80 2.1% 0 0.0% -646 -14.4% -566 -12.6% 2.94%
55 CA-607 Pasadena CoC 1,144 983 969 1,165 161 16.4% 14 1.4% -196 -16.8% -21 -1.8% 0.86%56 CA-608 Riverside City & County CoC 3,366 4,508 4,508 4,785 -1,142 -25.3% 0 0.0% -277 -5.8% -1,419 -29.7% 2.53%57 CA-609 San Bernardino City & County CoC 2,026 6,969 6,969 4,475 -4,943 -70.9% 0 0.0% 2,494 55.7% -2,449 -54.7% 1.52%
Continuum of Care Total Point-In-Time Homeless Counts, 2006-2009
#CoC Number CoC Name 1
% of 2009 Statewide
Total Count
Change 2006 to 2009Total PIT Counts

2009 2008 2007 2006
Total Change 08-09
% Change 08-09
Total Change 07-08
% Change 07-08
Total Change 06-07
% Change 06-07
Total Change 06-09
% Change 06-09
Continuum of Care Total Point-In-Time Homeless Counts, 2006-2009
#CoC Number CoC Name 1
% of 2009 Statewide
Total Count
Change 2006 to 2009Total PIT Counts
58 CA-610 San Diego County CoC 3,657 4,101 3,841 5,031 -444 -10.8% 260 6.8% -1,190 -23.7% -1,374 -27.3% 2.75%59 CA-611 Oxnard CoC 679 671 671 642 8 1.2% 0 0.0% 29 4.5% 37 5.8% 0.51%60 CA-612 Glendale CoC 306 296 296 289 10 3.4% 0 0.0% 7 2.4% 17 5.9% 0.23%61 CA-613 Imperial County CoC 505 393 342 0 112 28.5% 51 14.9% 342 - 505 - 0.38%62 CA-614 San Luis Obispo County CoC 3,829 850 2,408 2,408 2,979 350.5% -1,558 -64.7% 0 0.0% 1,421 59.0% 2.88%63 CO-500 Colorado Balance of State CoC 5,267 5,188 4,450 10,314 79 1.5% 738 16.6% -5,864 -56.9% -5,047 -48.9% 34.50%64 CO-503 Metropolitan Denver Homeless Initiative 8,752 8,482 8,698 8,661 270 3.2% -216 -2.5% 37 0.4% 91 1.1% 57.32%65 CO-504 Colorado Springs/El Paso County CoC 1,249 1,077 1,077 1,159 172 16.0% 0 0.0% -82 -7.1% 90 7.8% 8.18%66 CT-500 Danbury CoC 135 123 152 290 12 9.8% -29 -19.1% -138 -47.6% -155 -53.4% 2.93%67 CT-501 New Haven CoC 744 816 778 1,177 -72 -8.8% 38 4.9% -399 -33.9% -433 -36.8% 16.16%68 CT-502 Hartford CoC 1,224 1,269 907 829 -45 -3.5% 362 39.9% 78 9.4% 395 47.6% 26.58%69 CT-503 Bridgeport/Stratford/Fairfield CoC 315 342 356 378 -27 -7.9% -14 -3.9% -22 -5.8% -63 -16.7% 6.84%70 CT-504 Middletown/Middlesex County CoC 231 276 302 311 -45 -16.3% -26 -8.6% -9 -2.9% -80 -25.7% 5.02%71 CT-505 Connecticut Balance of State CoC 761 571 647 452 190 33.3% -76 -11.7% 195 43.1% 309 68.4% 16.53%72 CT-506 Norwalk/Fairfield County CoC 225 198 262 199 27 13.6% -64 -24.4% 63 31.7% 26 13.1% 4.89%73 CT-507 Norwich/New London City & County CoC 296 304 285 360 -8 -2.6% 19 6.7% -75 -20.8% -64 -17.8% 6.43%74 CT-508 Stamford/Greenwich CoC 285 306 301 426 -21 -6.9% 5 1.7% -125 -29.3% -141 -33.1% 6.19%75 CT-509 New Britain CoC 140 157 165 183 -17 -10.8% -8 -4.8% -18 -9.8% -43 -23.5% 3.04%76 CT-510 Bristol CoC 75 81 91 105 -6 -7.4% -10 -11.0% -14 -13.3% -30 -28.6% 1.63%77 CT-512 City of Waterbury CoC 174 184 236 206 -10 -5.4% -52 -22.0% 30 14.6% -32 -15.5% 3.78%78 DC-500 District of Columbia CoC 6,228 6,044 5,320 5,633 184 3.0% 724 13.6% -313 -5.6% 595 10.6% 100.00%79 DE-500 Delaware Statewide CoC 1,130 933 1,061 1,089 197 21.1% -128 -12.1% -28 -2.6% 41 3.8% 100.00%80 FL-500 Sarasota, Bradenton, Manatee Counties CoC 1,999 1,361 1,012 1,330 638 46.9% 349 34.5% -318 -23.9% 669 50.3% 3.60%81 FL-501 Tampa/Hillsborough County CoC 7,473 6,483 6,483 9,871 990 15.3% 0 0.0% -3,388 -34.3% -2,398 -24.3% 13.44%82 FL-502 St. Petersburg/Clearwater/Largo/Pinellas County CoC 3,419 2,526 2,526 3,603 893 35.4% 0 0.0% -1,077 -29.9% -184 -5.1% 6.15%83 FL-503 Lakeland CoC 675 655 802 833 20 3.1% -147 -18.3% -31 -3.7% -158 -19.0% 1.21%84 FL-504 Daytona Beach/Daytona/Volusia, Flagler Counties CoC 1,913 1,801 1,478 2,660 112 6.2% 323 21.9% -1,182 -44.4% -747 -28.1% 3.44%85 FL-505 Fort Walton Beach/Okaloosa, Walton Counties CoC 2,446 1,763 2,179 2,181 683 38.7% -416 -19.1% -2 -0.1% 265 12.2% 4.40%86 FL-506 Tallahassee/Leon County CoC 640 590 590 691 50 8.5% 0 0.0% -101 -14.6% -51 -7.4% 1.15%87 FL-507 Orlando/Orange, Osceola, Seminole Counties CoC 3,970 3,734 3,823 4,297 236 6.3% -89 -2.3% -474 -11.0% -327 -7.6% 7.14%88 FL-508 Gainesville/Alachua, Putnam Counties CoC 924 744 678 765 180 24.2% 66 9.7% -87 -11.4% 159 20.8% 1.66%89 FL-509 Fort Pierce/St. Lucie, Indian River, Martin Counties CoC 1,950 1,503 1,734 2,313 447 29.7% -231 -13.3% -579 -25.0% -363 -15.7% 3.51%90 FL-510 Jacksonville-Duval, Clay Counties CoC 2,442 2,585 2,743 2,725 -143 -5.5% -158 -5.8% 18 0.7% -283 -10.4% 4.39%91 FL-511 Pensacola/Esca/Santa Rosa County CoC 1,030 1,028 629 1,188 2 0.2% 399 63.4% -559 -47.1% -158 -13.3% 1.85%92 FL-512 Saint Johns County CoC 1,237 1,238 1,238 997 -1 -0.1% 0 0.0% 241 24.2% 240 24.1% 2.22%93 FL-513 Palm Bay/Melbourne/Brevard County CoC 1,221 1,899 1,899 1,665 -678 -35.7% 0 0.0% 234 14.1% -444 -26.7% 2.20%94 FL-514 Ocala/Marion County CoC 491 480 480 1,410 11 2.3% 0 0.0% -930 -66.0% -919 -65.2% 0.88%95 FL-515 Panama City/Bay, Jackson Counties CoC 287 313 313 1,059 -26 -8.3% 0 0.0% -746 -70.4% -772 -72.9% 0.52%96 FL-516 Winterhaven/Polk County CoC 50 494 0 0 -444 -89.9% 0 0.0% 0 - 50 - 0.09%97 FL-517 Hendry, Hardee, Highlands Counties CoC 4,220 2,968 904 3,077 1,252 42.2% 2,064 228.3% -2,173 -70.6% 1,143 37.1% 7.59%98 FL-518 Columbia, Hamilton, Lafayette, Suwannee Counties CoC 1,114 282 250 192 832 295.0% 32 12.8% 58 30.2% 922 480.2% 2.00%99 FL-519 Pasco County CoC 4,527 4,074 2,260 3,677 453 11.1% 1,814 80.3% -1,417 -38.5% 850 23.1% 8.14%100 FL-520 Citrus, Hernando, Lake, Sumter Counties CoC 1,025 1,104 2,019 1,412 -79 -7.2% -915 -45.3% 607 43.0% -387 -27.4% 1.84%101 FL-600 Miami/Dade County CoC 4,333 4,574 4,392 4,709 -241 -5.3% 182 4.1% -317 -6.7% -376 -8.0% 7.79%102 FL-601 Ft Lauderdale/Broward County CoC 3,225 3,154 3,154 3,114 71 2.3% 0 0.0% 40 1.3% 111 3.6% 5.80%103 FL-602 Punta Gorda/Charlotte County CoC 541 730 730 3,314 -189 -25.9% 0 0.0% -2,584 -78.0% -2,773 -83.7% 0.97%104 FL-603 Ft Myers/Cape Coral/Lee County CoC 931 899 2,382 2,078 32 3.6% -1,483 -62.3% 304 14.6% -1,147 -55.2% 1.67%105 FL-604 Monroe County CoC 1,040 1,121 1,121 981 -81 -7.2% 0 0.0% 140 14.3% 59 6.0% 1.87%106 FL-605 West Palm Beach/Palm Beach County 2,147 1,766 1,766 1,574 381 21.6% 0 0.0% 192 12.2% 573 36.4% 3.86%107 FL-606 Naples/Collier County CoC 329 289 484 513 40 13.8% -195 -40.3% -29 -5.7% -184 -35.9% 0.59%108 GA-500 Atlanta/Roswell/DeKalb, Fulton Counties CoC 7,019 6,840 6,840 6,483 179 2.6% 0 0.0% 357 5.5% 536 8.3% 34.47%109 GA-501 Georgia Balance of State CoC 9,941 9,340 10,255 12,481 601 6.4% -915 -8.9% -2,226 -17.8% -2,540 -20.4% 48.83%110 GA-503 Athens/Clarke County CoC 454 462 464 475 -8 -1.7% -2 -0.4% -11 -2.3% -21 -4.4% 2.23%111 GA-504 Augusta CoC 556 528 489 569 28 5.3% 39 8.0% -80 -14.1% -13 -2.3% 2.73%112 GA-505 Columbus-Muscogee/Russell County CoC 458 618 540 466 -160 -25.9% 78 14.4% 74 15.9% -8 -1.7% 2.25%113 GA-506 Marietta/Cobb County CoC 480 537 537 660 -57 -10.6% 0 0.0% -123 -18.6% -180 -27.3% 2.36%

2009 2008 2007 2006
Total Change 08-09
% Change 08-09
Total Change 07-08
% Change 07-08
Total Change 06-07
% Change 06-07
Total Change 06-09
% Change 06-09
Continuum of Care Total Point-In-Time Homeless Counts, 2006-2009
#CoC Number CoC Name 1
% of 2009 Statewide
Total Count
Change 2006 to 2009Total PIT Counts
114 GA-507 Savannah/Chatham County CoC 1,452 770 514 659 682 88.6% 256 49.8% -145 -22.0% 793 120.3% 7.13%115 GU-500 Guam CoC 1,088 725 725 1,050 363 50.1% 0 0.0% -325 -31.0% 38 3.6% 100.00%116 HI-500 Hawaii Balance of State CoC 2,144 2,311 2,320 2,448 -167 -7.2% -9 -0.4% -128 -5.2% -304 -12.4% 37.08%117 HI-501 Honolulu CoC 3,638 3,750 3,750 2,135 -112 -3.0% 0 0.0% 1,615 75.6% 1,503 70.4% 62.92%118 IA-500 Sioux City/Dakota, Woodbury Counties CoC 289 271 164 191 18 6.6% 107 65.2% -27 -14.1% 98 51.3% 8.55%119 IA-501 Iowa Balance of State CoC 1,962 1,950 1,529 2,243 12 0.6% 421 27.5% -714 -31.8% -281 -12.5% 58.05%120 IA-502 Des Moines/Polk County CoC 1,129 1,125 1,041 2,739 4 0.4% 84 8.1% -1,698 -62.0% -1,610 -58.8% 33.40%121 ID-500 Boise/Ada County CoC 786 611 581 144 175 28.6% 30 5.2% 437 303.5% 642 445.8% 40.54%122 ID-501 Idaho Balance of State CoC 1,153 853 1,168 1,307 300 35.2% -315 -27.0% -139 -10.6% -154 -11.8% 59.46%123 IL-500 McHenry County CoC 257 199 253 193 58 29.1% -54 -21.3% 60 31.1% 64 33.2% 1.83%124 IL-501 Rockford/Winnebago, Boone Counties CoC 452 575 575 1,667 -123 -21.4% 0 0.0% -1,092 -65.5% -1,215 -72.9% 3.22%125 IL-502 North Chicago/Lake County CoC 370 439 496 414 -69 -15.7% -57 -11.5% 82 19.8% -44 -10.6% 2.63%126 IL-503 Champaign/Urbana/Rantoul/Champaign County CoC 534 429 429 308 105 24.5% 0 0.0% 121 39.3% 226 73.4% 3.80%127 IL-504 Madison County CoC 202 214 240 387 -12 -5.6% -26 -10.8% -147 -38.0% -185 -47.8% 1.44%128 IL-505 Evanston CoC 188 183 183 184 5 2.7% 0 0.0% -1 -0.5% 4 2.2% 1.34%129 IL-506 Joliet/Bolingbrook/Will County CoC 340 309 397 388 31 10.0% -88 -22.2% 9 2.3% -48 -12.4% 2.42%130 IL-507 Peoria/Perkin/Fulton, Peoria, Tazewell, Woodford CoC 397 350 434 486 47 13.4% -84 -19.4% -52 -10.7% -89 -18.3% 2.82%131 IL-508 East Saint Louis/Belleville/Saint Clair County CoC 536 670 799 1,106 -134 -20.0% -129 -16.1% -307 -27.8% -570 -51.5% 3.81%132 IL-509 DeKalb City & County CoC 115 130 130 96 -15 -11.5% 0 0.0% 34 35.4% 19 19.8% 0.82%133 IL-510 Chicago CoC 6,240 5,979 5,979 6,671 261 4.4% 0 0.0% -692 -10.4% -431 -6.5% 44.40%134 IL-511 Cook County CoC 1,190 1,237 1,237 1,085 -47 -3.8% 0 0.0% 152 14.0% 105 9.7% 8.47%135 IL-512 Bloomington/Central Illinois CoC 515 467 467 386 48 10.3% 0 0.0% 81 21.0% 129 33.4% 3.66%136 IL-513 Springfield/Sangamon County CoC 257 235 260 355 22 9.4% -25 -9.6% -95 -26.8% -98 -27.6% 1.83%137 IL-514 Dupage County CoC 695 766 766 557 -71 -9.3% 0 0.0% 209 37.5% 138 24.8% 4.94%138 IL-515 South Central Illinois CoC 329 270 246 268 59 21.9% 24 9.8% -22 -8.2% 61 22.8% 2.34%139 IL-516 Decatur/Macon County CoC 176 347 347 377 -171 -49.3% 0 0.0% -30 -8.0% -201 -53.3% 1.25%140 IL-517 Aurora/Elgin/Kane County CoC 445 474 474 506 -29 -6.1% 0 0.0% -32 -6.3% -61 -12.1% 3.17%141 IL-518 Rock Island/Moline/Northwestern Illinois CoC 400 352 600 802 48 13.6% -248 -41.3% -202 -25.2% -402 -50.1% 2.85%142 IL-519 West Central Illinois CoC 127 229 305 278 -102 -44.5% -76 -24.9% 27 9.7% -151 -54.3% 0.90%143 IL-520 Southern Illinois CoC 290 870 870 619 -580 -66.7% 0 0.0% 251 40.5% -329 -53.2% 2.06%144 IN-500 St. Joseph County CoC 1,243 998 584 0 245 24.5% 414 70.9% 584 - 1,243 - 17.80%145 IN-502 Indiana Balance of State CoC 4,287 4,906 4,906 7,590 -619 -12.6% 0 0.0% -2,684 -35.4% -3,303 -43.5% 61.38%146 IN-503 Indianapolis CoC 1,454 1,491 1,868 2,140 -37 -2.5% -377 -20.2% -272 -12.7% -686 -32.1% 20.82%147 KS-501 Kansas City/Wyandotte County CoC 222 166 187 175 56 33.7% -21 -11.2% 12 6.9% 47 26.9% 11.73%148 KS-502 Wichita/Sedgwick County CoC 384 473 526 589 -89 -18.8% -53 -10.1% -63 -10.7% -205 -34.8% 20.30%149 KS-503 Topeka/Shawnee County CoC 217 341 227 476 -124 -36.4% 114 50.2% -249 -52.3% -259 -54.4% 11.47%150 KS-505 Overland Park/Johnson County CoC 210 234 234 237 -24 -10.3% 0 0.0% -3 -1.3% -27 -11.4% 11.10%151 KS-507 Kansas Balance of State CoC 859 524 524 3,478 335 63.9% 0 0.0% -2,954 -84.9% -2,619 -75.3% 45.40%152 KY-500 Kentucky Balance of State CoC 3,174 4,027 4,316 4,087 -853 -21.2% -289 -6.7% 229 5.6% -913 -22.3% 52.91%153 KY-501 Louisville/Jefferson County CoC 1,515 2,682 2,587 2,067 -1,167 -43.5% 95 3.7% 520 25.2% -552 -26.7% 25.25%154 KY-502 Lexington/Fayette County CoC 1,310 1,428 1,158 891 -118 -8.3% 270 23.3% 267 30.0% 419 47.0% 21.84%155 LA-500 Lafayette/Acadiana CoC 731 631 631 680 100 15.8% 0 0.0% -49 -7.2% 51 7.5% 5.85%156 LA-501 Lake Charles/Southwestern Louisiana CoC 72 94 247 194 -22 -23.4% -153 -61.9% 53 27.3% -122 -62.9% 0.58%157 LA-502 Shreveport/Bossier/Northwest CoC 830 1,042 857 748 -212 -20.3% 185 21.6% 109 14.6% 82 11.0% 6.64%158 LA-503 New Orleans/Jefferson Parish CoC 8,725 1,619 1,619 2,051 7,106 438.9% 0 0.0% -432 -21.1% 6,674 325.4% 69.78%159 LA-504 Baton Rouge CoC 1,118 1,006 1,042 744 112 11.1% -36 -3.5% 298 40.1% 374 50.3% 8.94%160 LA-505 Monroe/Northeast Louisiana CoC 228 276 313 394 -48 -17.4% -37 -11.8% -81 -20.6% -166 -42.1% 1.82%161 LA-506 Slidell/Southeast Louisiana CoC 379 522 434 400 -143 -27.4% 88 20.3% 34 8.5% -21 -5.3% 3.03%162 LA-507 Alexandria/Central Louisiana CoC 151 128 188 1,526 23 18.0% -60 -31.9% -1,338 -87.7% -1,375 -90.1% 1.21%163 LA-508 Houma-Terrebonne/Thibodaux CoC 270 163 163 200 107 65.6% 0 0.0% -37 -18.5% 70 35.0% 2.16%164 MA-500 Boston CoC 5,101 5,198 5,104 5,217 -97 -1.9% 94 1.8% -113 -2.2% -116 -2.2% 32.95%165 MA-501 Holyoke/Franklin, Hampden, Hampshire Counties CoC 1,394 1,090 964 557 304 27.9% 126 13.1% 407 73.1% 837 150.3% 9.00%166 MA-502 Lynn CoC 610 389 236 192 221 56.8% 153 64.8% 44 22.9% 418 217.7% 3.94%167 MA-503 Cape Cod Islands CoC 611 741 697 1,008 -130 -17.5% 44 6.3% -311 -30.9% -397 -39.4% 3.95%168 MA-504 Springfield CoC 774 696 1,053 447 78 11.2% -357 -33.9% 606 135.6% 327 73.2% 5.00%169 MA-505 New Bedford CoC 510 380 390 434 130 34.2% -10 -2.6% -44 -10.1% 76 17.5% 3.29%

2009 2008 2007 2006
Total Change 08-09
% Change 08-09
Total Change 07-08
% Change 07-08
Total Change 06-07
% Change 06-07
Total Change 06-09
% Change 06-09
Continuum of Care Total Point-In-Time Homeless Counts, 2006-2009
#CoC Number CoC Name 1
% of 2009 Statewide
Total Count
Change 2006 to 2009Total PIT Counts
170 MA-506 Worcester City & County CoC 1,397 1,291 1,302 1,172 106 8.2% -11 -0.8% 130 11.1% 225 19.2% 9.02%171 MA-507 Pittsfield/Berkshire County CoC 286 237 374 355 49 20.7% -137 -36.6% 19 5.4% -69 -19.4% 1.85%172 MA-508 Lowell CoC 309 398 432 342 -89 -22.4% -34 -7.9% 90 26.3% -33 -9.6% 2.00%173 MA-509 Cambridge CoC 637 486 432 449 151 31.1% 54 12.5% -17 -3.8% 188 41.9% 4.11%174 MA-510 Gloucester/Haverhill/Salem/Essex County CoC 813 656 606 570 157 23.9% 50 8.3% 36 6.3% 243 42.6% 5.25%175 MA-511 Quincy/Weymouth CoC 322 256 280 256 66 25.8% -24 -8.6% 24 9.4% 66 25.8% 2.08%176 MA-512 Lawrence CoC 274 300 310 152 -26 -8.7% -10 -3.2% 158 103.9% 122 80.3% 1.77%177 MA-513 Malden/Medford CoC 290 130 137 158 160 123.1% -7 -5.1% -21 -13.3% 132 83.5% 1.87%178 MA-515 Fall River CoC 154 143 153 154 11 7.7% -10 -6.5% -1 -0.6% 0 0.0% 0.99%179 MA-516 Massachusetts Balance of State CoC 650 401 623 372 249 62.1% -222 -35.6% 251 67.5% 278 74.7% 4.20%180 MA-517 Somerville CoC 132 179 211 225 -47 -26.3% -32 -15.2% -14 -6.2% -93 -41.3% 0.85%181 MA-518 Brookline/Newton CoC 135 121 130 216 14 11.6% -9 -6.9% -86 -39.8% -81 -37.5% 0.87%182 MA-519 Attleboro/Taunton/Bristol County CoC 142 133 292 320 9 6.8% -159 -54.5% -28 -8.8% -178 -55.6% 0.92%183 MA-520 Brockton/Plymouth City & County CoC 941 645 654 645 296 45.9% -9 -1.4% 9 1.4% 296 45.9% 6.08%184 MD-500 Cumberland/Allegany County CoC 218 132 162 187 86 65.2% -30 -18.5% -25 -13.4% 31 16.6% 1.86%185 MD-501 Baltimore City CoC 3,419 2,607 2,607 2,904 812 31.1% 0 0.0% -297 -10.2% 515 17.7% 29.23%186 MD-502 Harford County CoC 152 145 145 115 7 4.8% 0 0.0% 30 26.1% 37 32.2% 1.30%187 MD-503 Annapolis/Anne Arundel County CoC 326 290 289 307 36 12.4% 1 0.3% -18 -5.9% 19 6.2% 2.79%188 MD-504 Howard County CoC 180 159 175 182 21 13.2% -16 -9.1% -7 -3.8% -2 -1.1% 1.54%189 MD-505 Baltimore County CoC 1,520 426 634 576 1,094 256.8% -208 -32.8% 58 10.1% 944 163.9% 12.99%190 MD-506 Carroll County CoC 151 174 174 215 -23 -13.2% 0 0.0% -41 -19.1% -64 -29.8% 1.29%191 MD-507 Cecil County CoC 173 152 119 125 21 13.8% 33 27.7% -6 -4.8% 48 38.4% 1.48%192 MD-508 Charles, Calvert, St.Mary's Counties CoC 2,560 1,938 1,973 610 622 32.1% -35 -1.8% 1,363 223.4% 1,950 319.7% 21.88%193 MD-509 Frederick City & County CoC 324 246 223 212 78 31.7% 23 10.3% 11 5.2% 112 52.8% 2.77%194 MD-510 Garrett County CoC 11 82 82 54 -71 -86.6% 0 0.0% 28 51.9% -43 -79.6% 0.09%195 MD-511 Mid-Shore Regional CoC 144 310 311 294 -166 -53.5% -1 -0.3% 17 5.8% -150 -51.0% 1.23%196 MD-512 Hagerstown/Washington County CoC 137 214 212 242 -77 -36.0% 2 0.9% -30 -12.4% -105 -43.4% 1.17%197 MD-513 Wicomico/Somerset/Worcester CoC 283 251 215 219 32 12.7% 36 16.7% -4 -1.8% 64 29.2% 2.42%198 MD-600 Prince George's County CoC 853 943 1,168 1,291 -90 -9.5% -225 -19.3% -123 -9.5% -438 -33.9% 7.29%199 MD-601 Montgomery County CoC 1,247 1,150 1,139 1,164 97 8.4% 11 1.0% -25 -2.1% 83 7.1% 10.66%200 ME-500 Maine Balance of State CoC 1,305 1,372 1,398 1,303 -67 -4.9% -26 -1.9% 95 7.3% 2 0.2% 53.40%201 ME-501 Bangor/Penobscot County Coc 470 531 499 562 -61 -11.5% 32 6.4% -63 -11.2% -92 -16.4% 19.23%202 ME-502 Portland CoC 669 729 741 773 -60 -8.2% -12 -1.6% -32 -4.1% -104 -13.5% 27.37%203 MI-500 Michigan Balance of State CoC 2,796 2,250 2,250 2,090 546 24.3% 0 0.0% 160 7.7% 706 33.8% 19.96%204 MI-501 Detroit CoC 3,694 18,062 18,062 14,827 -14,368 -79.5% 0 0.0% 3,235 21.8% -11,133 -75.1% 26.38%205 MI-502 Dearborn/Dearborn Heights/Westland/Wayne County CoC 428 865 865 743 -437 -50.5% 0 0.0% 122 16.4% -315 -42.4% 3.06%206 MI-503 St. Clair Shores/Warren/Macomb County 877 769 769 575 108 14.0% 0 0.0% 194 33.7% 302 52.5% 6.26%207 MI-504 Pontiac/Royal Oak/Oakland County 661 1,011 1,011 1,293 -350 -34.6% 0 0.0% -282 -21.8% -632 -48.9% 4.72%208 MI-505 Flint/Genesee County CoC 275 245 354 2,192 30 12.2% -109 -30.8% -1,838 -83.9% -1,917 -87.5% 1.96%209 MI-506 Grand Rapids/Wyoming/Kent County 868 794 912 869 74 9.3% -118 -12.9% 43 4.9% -1 -0.1% 6.20%210 MI-507 Portage/Kalamazoo City & County 985 862 614 412 123 14.3% 248 40.4% 202 49.0% 573 139.1% 7.03%211 MI-508 Lansing/East Lansing/Ingham County 416 408 408 415 8 2.0% 0 0.0% -7 -1.7% 1 0.2% 2.97%212 MI-509 Ann Arbor/Washtenaw County CoC 342 413 413 432 -71 -17.2% 0 0.0% -19 -4.4% -90 -20.8% 2.44%213 MI-510 Saginaw City & County CoC 305 361 361 285 -56 -15.5% 0 0.0% 76 26.7% 20 7.0% 2.18%214 MI-511 Lenawee County CoC 114 93 93 109 21 22.6% 0 0.0% -16 -14.7% 5 4.6% 0.81%215 MI-512 Grand Traverse/Antrim, Leelanau Counties 281 241 241 250 40 16.6% 0 0.0% -9 -3.6% 31 12.4% 2.01%216 MI-513 Marquette, Alger Counties CoC 68 37 37 87 31 83.8% 0 0.0% -50 -57.5% -19 -21.8% 0.49%217 MI-514 Battle Creek/Calhoun County CoC 238 274 205 147 -36 -13.1% 69 33.7% 58 39.5% 91 61.9% 1.70%218 MI-515 Monroe City & County CoC 140 142 142 105 -2 -1.4% 0 0.0% 37 35.2% 35 33.3% 1.00%219 MI-516 Norton Shores/Muskegon City & County 466 351 332 286 115 32.8% 19 5.7% 46 16.1% 180 62.9% 3.33%220 MI-517 Jackson City & County CoC 323 414 463 347 -91 -22.0% -49 -10.6% 116 33.4% -24 -6.9% 2.31%221 MI-518 Livingston County CoC 121 63 63 88 58 92.1% 0 0.0% -25 -28.4% 33 37.5% 0.86%222 MI-519 Holland/Ottawa County CoC 299 291 319 0 8 2.7% -28 -8.8% 319 - 299 - 2.13%223 MI-522 Alpena, Iosca, Presque Isle/NE Michigan CoC 157 105 105 0 52 49.5% 0 0.0% 105 - 157 - 1.12%224 MI-523 Eaton County CoC 151 197 197 130 -46 -23.4% 0 0.0% 67 51.5% 21 16.2% 1.08%225 MN-500 Minneapolis/Hennepin County CoC 3,281 3,369 2,984 3,415 -88 -2.6% 385 12.9% -431 -12.6% -134 -3.9% 42.51%

2009 2008 2007 2006
Total Change 08-09
% Change 08-09
Total Change 07-08
% Change 07-08
Total Change 06-07
% Change 06-07
Total Change 06-09
% Change 06-09
Continuum of Care Total Point-In-Time Homeless Counts, 2006-2009
#CoC Number CoC Name 1
% of 2009 Statewide
Total Count
Change 2006 to 2009Total PIT Counts
226 MN-501 Saint Paul/Ramsey County CoC 1,377 1,294 1,294 809 83 6.4% 0 0.0% 485 60.0% 568 70.2% 17.84%227 MN-502 Rochester/Southeast Minnesota CoC 417 446 446 468 -29 -6.5% 0 0.0% -22 -4.7% -51 -10.9% 5.40%228 MN-503 Dakota County CoC 631 548 363 446 83 15.1% 185 51.0% -83 -18.6% 185 41.5% 8.18%229 MN-504 Northeast Minnesota CoC 210 230 232 137 -20 -8.7% -2 -0.9% 95 69.3% 73 53.3% 2.72%230 MN-505 St. Cloud/Central Minnesota CoC 451 389 389 394 62 15.9% 0 0.0% -5 -1.3% 57 14.5% 5.84%231 MN-506 Northwest Minnesota CoC 261 230 266 110 31 13.5% -36 -13.5% 156 141.8% 151 137.3% 3.38%232 MN-508 Moorehead/West Central Minnesota CoC 272 242 242 236 30 12.4% 0 0.0% 6 2.5% 36 15.3% 3.52%233 MN-509 Duluth/Saint Louis County CoC 504 501 501 351 3 0.6% 0 0.0% 150 42.7% 153 43.6% 6.53%234 MN-510 Scott, Carver Counties CoC 209 252 152 119 -43 -17.1% 100 65.8% 33 27.7% 90 75.6% 2.71%235 MN-511 Southwest Minnesota CoC 105 143 169 47 -38 -26.6% -26 -15.4% 122 259.6% 58 123.4% 1.36%236 MO-500 St. Louis County CoC 643 458 336 406 185 40.4% 122 36.3% -70 -17.2% 237 58.4% 9.24%237 MO-501 St. Louis City CoC 1,306 1,386 1,386 1,038 -80 -5.8% 0 0.0% 348 33.5% 268 25.8% 18.77%238 MO-503 St. Charles, Lincoln, Warren Counties CoC 830 593 498 484 237 40.0% 95 19.1% 14 2.9% 346 71.5% 11.93%239 MO-600 Springfield/Greene, Christian, Webster Counties CoC 418 713 518 554 -295 -41.4% 195 37.6% -36 -6.5% -136 -24.5% 6.01%240 MO-602 Joplin/Jasper, Newton Counties CoC 322 380 306 379 -58 -15.3% 74 24.2% -73 -19.3% -57 -15.0% 4.63%241 MO-603 St. Joseph/Andrew, Buchanan, DeKalb Counties CoC 159 159 100 88 0 0.0% 59 59.0% 12 13.6% 71 80.7% 2.28%242 MO-604 Kansas City/Independence/ Lee's Summit/Jackson County CoC 1,587 2,094 1,599 3,793 -507 -24.2% 495 31.0% -2,194 -57.8% -2,206 -58.2% 22.81%243 MO-606 Missouri Balance of State CoC 1,694 1,904 1,396 1,062 -210 -11.0% 508 36.4% 334 31.5% 632 59.5% 24.34%244 MS-500 Jackson/Rankin, Madison Counties CoC 922 1,302 718 585 -380 -29.2% 584 81.3% 133 22.7% 337 57.6% 32.96%245 MS-501 Mississippi Balance of State CoC 1,242 385 385 2,003 857 222.6% 0 0.0% -1,618 -80.8% -761 -38.0% 44.40%246 MS-503 Gulf Port/Gulf Coast Regional CoC 633 274 274 593 359 131.0% 0 0.0% -319 -53.8% 40 6.7% 22.63%247 MT-500 Montana Statewide CoC 1,196 1,417 1,150 1,331 -221 -15.6% 267 23.2% -181 -13.6% -135 -10.1% 100.00%248 NC-500 Winston Salem/Forsyth County CoC 489 452 503 1,040 37 8.2% -51 -10.1% -537 -51.6% -551 -53.0% 3.79%249 NC-501 Asheville/Buncombe County CoC 518 509 635 498 9 1.8% -126 -19.8% 137 27.5% 20 4.0% 4.01%250 NC-502 Durham City & County CoC 536 590 539 502 -54 -9.2% 51 9.5% 37 7.4% 34 6.8% 4.15%251 NC-503 North Carolina Balance of State CoC 2,821 2,509 2,421 1,218 312 12.4% 88 3.6% 1,203 98.8% 1,603 131.6% 21.84%252 NC-504 Greensboro/High Point CoC 1,078 987 1,182 1,108 91 9.2% -195 -16.5% 74 6.7% -30 -2.7% 8.34%253 NC-505 Charlotte/Mecklenburg County CoC 2,594 1,988 1,976 2,591 606 30.5% 12 0.6% -615 -23.7% 3 0.1% 20.08%254 NC-506 Wilmington/Brunswick, New Hanover, Pender Counties CoC 630 496 628 673 134 27.0% -132 -21.0% -45 -6.7% -43 -6.4% 4.88%255 NC-507 Raleigh/Wake County CoC 1,152 1,144 1,043 981 8 0.7% 101 9.7% 62 6.3% 171 17.4% 8.92%256 NC-509 Gastonia/Cleveland, Gaston, Lincoln Counties CoC 580 920 652 792 -340 -37.0% 268 41.1% -140 -17.7% -212 -26.8% 4.49%257 NC-511 Fayetteville/Cumberland County CoC 965 1,074 757 841 -109 -10.1% 317 41.9% -84 -10.0% 124 14.7% 7.47%258 NC-513 Chapel Hill/Orange County CoC 156 195 208 237 -39 -20.0% -13 -6.3% -29 -12.2% -81 -34.2% 1.21%259 NC-516 Northwest North Carolina CoC 1,399 1,314 1,069 976 85 6.5% 245 22.9% 93 9.5% 423 43.3% 10.83%260 ND-500 North Dakota Statewide CoC 773 615 636 614 158 25.7% -21 -3.3% 22 3.6% 159 25.9% 100.00%261 NE-500 North Central Nebraska CoC 991 1,175 257 399 -184 -15.7% 918 357.2% -142 -35.6% 592 148.4% 26.65%262 NE-501 Omaha/Council Bluffs CoC 1,262 1,197 1,870 1,632 65 5.4% -673 -36.0% 238 14.6% -370 -22.7% 33.94%263 NE-502 Lincoln CoC 973 1,151 966 1,447 -178 -15.5% 185 19.2% -481 -33.2% -474 -32.8% 26.17%264 NE-503 Southwest Nebraska CoC 96 85 85 99 11 12.9% 0 0.0% -14 -14.1% -3 -3.0% 2.58%265 NE-504 Southeast Nebraska CoC 162 184 108 153 -22 -12.0% 76 70.4% -45 -29.4% 9 5.9% 4.36%266 NE-505 Panhandle of Nebraska CoC 116 121 169 279 -5 -4.1% -48 -28.4% -110 -39.4% -163 -58.4% 3.12%267 NE-506 Northeast Nebraska CoC 118 72 76 99 46 63.9% -4 -5.3% -23 -23.2% 19 19.2% 3.17%268 NH-500 New Hampshire Balance of State CoC 769 986 1,300 1,244 -217 -22.0% -314 -24.2% 56 4.5% -475 -38.2% 46.75%269 NH-501 Manchester CoC 508 576 504 1,255 -68 -11.8% 72 14.3% -751 -59.8% -747 -59.5% 30.88%270 NH-502 Nashua/Hillsborough County CoC 368 457 444 582 -89 -19.5% 13 2.9% -138 -23.7% -214 -36.8% 22.37%271 NJ-500 Atlantic City & County CoC 461 476 514 648 -15 -3.2% -38 -7.4% -134 -20.7% -187 -28.9% 3.50%272 NJ-501 Bergen County CoC 1,433 1,627 1,392 1,495 -194 -11.9% 235 16.9% -103 -6.9% -62 -4.1% 10.88%273 NJ-502 Burlington County CoC 979 896 896 980 83 9.3% 0 0.0% -84 -8.6% -1 -0.1% 7.43%274 NJ-503 Camden City & County CoC 579 718 853 996 -139 -19.4% -135 -15.8% -143 -14.4% -417 -41.9% 4.40%275 NJ-504 Newark/Essex County CoC 1,730 1,036 2,326 1,682 694 67.0% -1,290 -55.5% 644 38.3% 48 2.9% 13.14%276 NJ-505 Gloucester County CoC 206 190 167 228 16 8.4% 23 13.8% -61 -26.8% -22 -9.6% 1.56%277 NJ-506 Jersey City/Bayonne/Hudson County CoC 1,779 2,227 2,842 2,973 -448 -20.1% -615 -21.6% -131 -4.4% -1,194 -40.2% 13.51%278 NJ-507 New Brunswick/Middlesex County CoC 796 792 996 650 4 0.5% -204 -20.5% 346 53.2% 146 22.5% 6.04%279 NJ-508 Monmouth County CoC 676 763 830 1,176 -87 -11.4% -67 -8.1% -346 -29.4% -500 -42.5% 5.13%280 NJ-509 Morris County CoC 302 224 292 367 78 34.8% -68 -23.3% -75 -20.4% -65 -17.7% 2.29%281 NJ-510 Lakewood Township/Ocean County CoC 453 337 424 556 116 34.4% -87 -20.5% -132 -23.7% -103 -18.5% 3.44%

2009 2008 2007 2006
Total Change 08-09
% Change 08-09
Total Change 07-08
% Change 07-08
Total Change 06-07
% Change 06-07
Total Change 06-09
% Change 06-09
Continuum of Care Total Point-In-Time Homeless Counts, 2006-2009
#CoC Number CoC Name 1
% of 2009 Statewide
Total Count
Change 2006 to 2009Total PIT Counts
282 NJ-511 Paterson/Passaic County CoC 306 518 1,062 996 -212 -40.9% -544 -51.2% 66 6.6% -690 -69.3% 2.32%283 NJ-512 Salem County CoC 148 310 465 186 -162 -52.3% -155 -33.3% 279 150.0% -38 -20.4% 1.12%284 NJ-513 Somerset County CoC 298 302 366 485 -4 -1.3% -64 -17.5% -119 -24.5% -187 -38.6% 2.26%285 NJ-514 Trenton/Mercer County CoC 1,062 989 1,598 834 73 7.4% -609 -38.1% 764 91.6% 228 27.3% 8.06%286 NJ-515 Elizabeth/Union County CoC 1,116 1,188 1,188 1,564 -72 -6.1% 0 0.0% -376 -24.0% -448 -28.6% 8.47%287 NJ-516 Warren County CoC 402 417 222 231 -15 -3.6% 195 87.8% -9 -3.9% 171 74.0% 3.05%288 NJ-518 Ocean City/Cape May County CoC 224 300 250 266 -76 -25.3% 50 20.0% -16 -6.0% -42 -15.8% 1.70%289 NJ-519 Sussex County CoC 112 276 359 371 -164 -59.4% -83 -23.1% -12 -3.2% -259 -69.8% 0.85%290 NJ-520 Cumberland County CoC 107 246 163 150 -139 -56.5% 83 50.9% 13 8.7% -43 -28.7% 0.81%291 NM-500 Albuquerque CoC 2,002 1,276 1,276 3,649 726 56.9% 0 0.0% -2,373 -65.0% -1,647 -45.1% 57.61%292 NM-501 New Mexico Balance of State CoC 1,473 1,739 1,739 1,607 -266 -15.3% 0 0.0% 132 8.2% -134 -8.3% 42.39%293 NV-500 Las Vegas/Clark County CoC 13,338 11,417 11,417 12,198 1,921 16.8% 0 0.0% -781 -6.4% 1,140 9.3% 92.13%294 NV-501 Reno/Sparks/Washoe County CoC 700 863 863 460 -163 -18.9% 0 0.0% 403 87.6% 240 52.2% 4.83%295 NV-502 Nevada Balance of State CoC 440 330 246 332 110 33.3% 84 34.1% -86 -25.9% 108 32.5% 3.04%296 NY-500 Rochester/Irondequoit/Greece/Monroe County CoC 663 595 612 682 68 11.4% -17 -2.8% -70 -10.3% -19 -2.8% 1.09%297 NY-501 Elmira/Steuben, Allegany, Chemung, Schuyler Counties COC 184 177 175 186 7 4.0% 2 1.1% -11 -5.9% -2 -1.1% 0.30%298 NY-502 Auburn/Cayuga County CoC 39 45 55 117 -6 -13.3% -10 -18.2% -62 -53.0% -78 -66.7% 0.06%299 NY-503 Albany City & County CoC 639 538 619 407 101 18.8% -81 -13.1% 212 52.1% 232 57.0% 1.05%300 NY-504 Cattaraugus County CoC 74 69 142 649 5 7.2% -73 -51.4% -507 -78.1% -575 -88.6% 0.12%301 NY-505 Syracuse/Onondaga County CoC 791 686 740 749 105 15.3% -54 -7.3% -9 -1.2% 42 5.6% 1.30%302 NY-506 Fulton, Montgomery, Schoharie Counties CoC 24 - - - - - - - - - - - 0.04%303 NY-507 Schenectady City & County CoC 258 195 288 322 63 32.3% -93 -32.3% -34 -10.6% -64 -19.9% 0.42%304 NY-508 Buffalo/Erie County CoC 862 1,067 1,169 1,174 -205 -19.2% -102 -8.7% -5 -0.4% -312 -26.6% 1.41%305 NY-509 Oswego County CoC 44 - - - - - - - - - - - 0.07%306 NY-510 Tompkins County CoC 75 78 78 106 -3 -3.8% 0 0.0% -28 -26.4% -31 -29.2% 0.12%307 NY-511 Binghamton/Union Town/Broome County CoC 213 - - - - - - - - - - - 0.35%308 NY-512 Troy/Rensselaer County CoC 298 193 212 459 105 54.4% -19 -9.0% -247 -53.8% -161 -35.1% 0.49%309 NY-513 Wayne, Ontario, Seneca, Yates Counties CoC 81 88 98 42 -7 -8.0% -10 -10.2% 56 133.3% 39 92.9% 0.13%310 NY-514 Jamestown/Dunkirk/Chautauqua County CoC 128 65 75 0 63 96.9% -10 -13.3% 75 - 128 - 0.21%311 NY-515 Cortland County CoC - - - - - - - - - - - - .312 NY-516 Clinton County CoC 136 53 53 0 83 156.6% 0 0.0% 53 - 136 - 0.22%313 NY-517 Orleans County CoC 30 39 39 48 -9 -23.1% 0 0.0% -9 -18.8% -18 -37.5% 0.05%314 NY-518 Utica/Rome/Oneida County CoC 343 316 316 350 27 8.5% 0 0.0% -34 -9.7% -7 -2.0% 0.56%315 NY-519 Columbia/Greene County CoC 267 172 325 325 95 55.2% -153 -47.1% 0 0.0% -58 -17.8% 0.44%316 NY-520 Franklin County CoC 14 10 28 28 4 40.0% -18 -64.3% 0 0.0% -14 -50.0% 0.02%317 NY-522 Jefferson, Lewis, St. Lawrence Counties CoC 276 297 0 178 -21 -7.1% 0 0.0% -178 -100.0% 98 55.1% 0.45%318 NY-523 Glen Falls/Saratoga Springs/Saratoga County CoC 195 166 255 369 29 17.5% -89 -34.9% -114 -30.9% -174 -47.2% 0.32%319 NY-524 Niagara CoC 177 144 169 159 33 22.9% -25 -14.8% 10 6.3% 18 11.3% 0.29%320 NY-600 New York City CoC 49,343 50,261 50,372 55,507 -918 -1.8% -111 -0.2% -5,135 -9.3% -6,164 -11.1% 80.80%321 NY-601 Poughkeepsie/Dutchess County CoC 474 547 547 546 -73 -13.3% 0 0.0% 1 0.2% -72 -13.2% 0.78%322 NY-602 Newburgh/Middletown/Orange County CoC 450 311 414 385 139 44.7% -103 -24.9% 29 7.5% 65 16.9% 0.74%323 NY-603 Islip/Babylon/Huntington/Suffolk County CoC 1,942 1,728 1,728 2,728 214 12.4% 0 0.0% -1,000 -36.7% -786 -28.8% 3.18%324 NY-604 Yonkers/Mount Vernon/New Rochelle/Westchester County CoC 1,531 1,829 1,829 1,967 -298 -16.3% 0 0.0% -138 -7.0% -436 -22.2% 2.51%325 NY-605 Nassau County CoC 697 781 781 1,215 -84 -10.8% 0 0.0% -434 -35.7% -518 -42.6% 1.14%326 NY-606 Rockland County CoC 139 141 488 214 -2 -1.4% -347 -71.1% 274 128.0% -75 -35.0% 0.23%327 NY-607 Sullivan County CoC 369 139 343 257 230 165.5% -204 -59.5% 86 33.5% 112 43.6% 0.60%328 NY-608 Kingston/Ulster County CoC 311 395 359 402 -84 -21.3% 36 10.0% -43 -10.7% -91 -22.6% 0.51%329 OH-500 Cincinnati/Hamilton County CoC 1,140 1,116 1,046 1,344 24 2.2% 70 6.7% -298 -22.2% -204 -15.2% 8.98%330 OH-501 Toledo/Lucas County CoC 945 959 745 739 -14 -1.5% 214 28.7% 6 0.8% 206 27.9% 7.44%331 OH-502 Cleveland/Cuyahoga County CoC 2,236 2,242 2,185 2,269 -6 -0.3% 57 2.6% -84 -3.7% -33 -1.5% 17.61%332 OH-503 Columbus/Franklin County CoC 1,359 1,341 1,373 1,357 18 1.3% -32 -2.3% 16 1.2% 2 0.1% 10.70%333 OH-504 Youngstown/Mahoning County CoC 183 236 249 246 -53 -22.5% -13 -5.2% 3 1.2% -63 -25.6% 1.44%334 OH-505 Dayton/Kettering/Montgomery CoC 837 844 785 523 -7 -0.8% 59 7.5% 262 50.1% 314 60.0% 6.59%335 OH-506 Akron/Baberton/Summit County CoC 820 740 824 1,028 80 10.8% -84 -10.2% -204 -19.8% -208 -20.2% 6.46%336 OH-507 Ohio Balance of State CoC 4,770 4,525 3,521 7,172 245 5.4% 1,004 28.5% -3,651 -50.9% -2,402 -33.5% 37.56%337 OH-508 Canton/Massillon/Alliance/Stark County CoC 410 909 536 757 -499 -54.9% 373 69.6% -221 -29.2% -347 -45.8% 3.23%

2009 2008 2007 2006
Total Change 08-09
% Change 08-09
Total Change 07-08
% Change 07-08
Total Change 06-07
% Change 06-07
Total Change 06-09
% Change 06-09
Continuum of Care Total Point-In-Time Homeless Counts, 2006-2009
#CoC Number CoC Name 1
% of 2009 Statewide
Total Count
Change 2006 to 2009Total PIT Counts
338 OK-500 North Central Oklahoma CoC 316 241 212 206 75 31.1% 29 13.7% 6 2.9% 110 53.4% 6.53%339 OK-501 Tulsa City & County/Broken Arrow CoC 826 729 666 573 97 13.3% 63 9.5% 93 16.2% 253 44.2% 17.07%340 OK-502 Oklahoma City CoC 1,475 1,335 1,734 1,426 140 10.5% -399 -23.0% 308 21.6% 49 3.4% 30.49%341 OK-503 Oklahoma Balance of State CoC 340 157 231 234 183 116.6% -74 -32.0% -3 -1.3% 106 45.3% 7.03%342 OK-504 Norman / Cleveland County 585 578 594 419 7 1.2% -16 -2.7% 175 41.8% 166 39.6% 12.09%343 OK-505 Northeast Oklahoma CoC 635 370 305 317 265 71.6% 65 21.3% -12 -3.8% 318 100.3% 13.13%344 OK-506 Southewst Oklahoma CoC 272 168 250 96 104 61.9% -82 -32.8% 154 160.4% 176 183.3% 5.62%345 OK-507 Southeastern Oklahoma Regional CoC 389 268 229 178 121 45.1% 39 17.0% 51 28.7% 211 118.5% 8.04%346 OR-500 Eugene/Springfield/Lane County CoC 2,232 2,137 2,332 1,293 95 4.4% -195 -8.4% 1,039 80.4% 939 72.6% 12.90%347 OR-501 Portland/Gresham/Multnomah County CoC 4,085 3,918 3,918 5,104 167 4.3% 0 0.0% -1,186 -23.2% -1,019 -20.0% 23.60%348 OR-502 Medford/Ashland/Jackson County CoC 899 654 624 770 245 37.5% 30 4.8% -146 -19.0% 129 16.8% 5.19%349 OR-503 Central Oregon CoC 742 1,736 2,029 824 -994 -57.3% -293 -14.4% 1,205 146.2% -82 -10.0% 4.29%350 OR-504 Salem/Marion/Polk Counties CoC 2,366 1,997 1,997 1,491 369 18.5% 0 0.0% 506 33.9% 875 58.7% 13.67%351 OR-505 Oregon Balance of State CoC 4,411 7,863 4,434 3,260 -3,452 -43.9% 3,429 77.3% 1,174 36.0% 1,151 35.3% 25.48%352 OR-506 Hillsboro/Beaverton/Washington County CoC 748 772 680 661 -24 -3.1% 92 13.5% 19 2.9% 87 13.2% 4.32%353 OR-507 Clackamas County CoC 1,826 1,576 1,576 1,768 250 15.9% 0 0.0% -192 -10.9% 58 3.3% 10.55%354 PA-500 Philadelphia CoC 6,304 6,871 7,640 6,653 -567 -8.3% -769 -10.1% 987 14.8% -349 -5.2% 41.76%355 PA-501 Harrisburg/Dauphin County CoC 421 421 412 479 0 0.0% 9 2.2% -67 -14.0% -58 -12.1% 2.79%356 PA-502 Upper Darby/Chester/Haverford/Delaware County CoC 778 653 696 731 125 19.1% -43 -6.2% -35 -4.8% 47 6.4% 5.15%357 PA-503 Wilkes-Barre/Hazleton/Luzerne County CoC 202 171 188 161 31 18.1% -17 -9.0% 27 16.8% 41 25.5% 1.34%358 PA-504 Lower Marion/Norristown/Abington/Montgomery County CoC 469 479 526 629 -10 -2.1% -47 -8.9% -103 -16.4% -160 -25.4% 3.11%359 PA-505 Chester County CoC 351 314 387 288 37 11.8% -73 -18.9% 99 34.4% 63 21.9% 2.33%360 PA-506 Reading/Berks County CoC 385 496 739 423 -111 -22.4% -243 -32.9% 316 74.7% -38 -9.0% 2.55%361 PA-507 Altoona/Central Pennsylvania CoC 1,170 1,039 1,017 964 131 12.6% 22 2.2% 53 5.5% 206 21.4% 7.75%362 PA-508 Scranton/Lackawanna County CoC 280 260 222 297 20 7.7% 38 17.1% -75 -25.3% -17 -5.7% 1.85%363 PA-509 Allentown/Northeast Pennsylvania CoC 738 720 645 589 18 2.5% 75 11.6% 56 9.5% 149 25.3% 4.89%364 PA-510 Lancaster City & County CoC 666 707 589 561 -41 -5.8% 118 20.0% 28 5.0% 105 18.7% 4.41%365 PA-511 Bristol/Bensalem/Bucks County CoC 474 485 262 397 -11 -2.3% 223 85.1% -135 -34.0% 77 19.4% 3.14%366 PA-600 Pittsburgh/McKeesport/Penn Hills/Allegheny County CoC 1,418 1,308 1,380 1,297 110 8.4% -72 -5.2% 83 6.4% 121 9.3% 9.39%367 PA-601 Southwest Pennsylvania CoC 562 581 628 568 -19 -3.3% -47 -7.5% 60 10.6% -6 -1.1% 3.72%368 PA-602 Northwest Pennsylvania CoC 269 281 283 273 -12 -4.3% -2 -0.7% 10 3.7% -4 -1.5% 1.78%369 PA-603 Beaver County CoC 220 213 213 111 7 3.3% 0 0.0% 102 91.9% 109 98.2% 1.46%370 PA-605 Erie City & County CoC 389 379 393 396 10 2.6% -14 -3.6% -3 -0.8% -7 -1.8% 2.58%371 PR-502 Puerto Rico Balance of Commonwealth CoC 1,775 707 2,004 1,834 1,068 151.1% -1,297 -64.7% 170 9.3% -59 -3.2% 43.61%372 PR-503 South/Southeast Puerto Rico CoC 2,295 2,305 2,305 2,530 -10 -0.4% 0 0.0% -225 -8.9% -235 -9.3% 56.39%373 RI-500 Rhode Island Statewide CoC 1,607 1,196 1,372 1,440 411 34.4% -176 -12.8% -68 -4.7% 167 11.6% 100.00%374 SC-500 Charleston/Low Country CoC 416 539 539 2,714 -123 -22.8% 0 0.0% -2,175 -80.1% -2,298 -84.7% 9.30%375 SC-501 Greenville/Anderson/Spartanburg Upstate CoC 1,164 1,606 1,606 1,813 -442 -27.5% 0 0.0% -207 -11.4% -649 -35.8% 26.02%376 SC-502 Columbia/Midlands CoC 1,368 1,569 1,569 2,653 -201 -12.8% 0 0.0% -1,084 -40.9% -1,285 -48.4% 30.58%377 SC-503 Myrtle Beach/Sumter City & County CoC 1,316 1,770 1,770 1,937 -454 -25.6% 0 0.0% -167 -8.6% -621 -32.1% 29.42%378 SC-504 Florence City & County/Pee Dee CoC 209 176 176 497 33 18.8% 0 0.0% -321 -64.6% -288 -57.9% 4.67%379 SD-500 South Dakota Statewide CoC 731 579 579 1,029 152 26.3% 0 0.0% -450 -43.7% -298 -29.0% 100.00%380 TN-500 Chattanooga/Southeast Tennessee CoC 513 87 1,064 685 426 489.7% -977 -91.8% 379 55.3% -172 -25.1% 4.87%381 TN-501 Memphis/Shelby County CoC 1,613 1,566 1,814 1,776 47 3.0% -248 -13.7% 38 2.1% -163 -9.2% 15.32%382 TN-502 Knoxville/Knox County CoC 959 930 956 864 29 3.1% -26 -2.7% 92 10.6% 95 11.0% 9.11%383 TN-503 South Central Tennessee CoC 226 328 360 388 -102 -31.1% -32 -8.9% -28 -7.2% -162 -41.8% 2.15%384 TN-504 Nashville/Davidson County CoC 2,236 2,217 2,156 1,982 19 0.9% 61 2.8% 174 8.8% 254 12.8% 21.23%385 TN-506 Oak Ridge/Upper Cumberland CoC 1,229 704 704 1,126 525 74.6% 0 0.0% -422 -37.5% 103 9.1% 11.67%386 TN-507 Jackson/West Tennessee CoC 2,214 2,187 2,255 1,873 27 1.2% -68 -3.0% 382 20.4% 341 18.2% 21.02%387 TN-509 Appalachian Regional CoC 840 559 559 522 281 50.3% 0 0.0% 37 7.1% 318 60.9% 7.98%388 TN-510 Murfreesboro/Rutherford City CoC 204 223 438 344 -19 -8.5% -215 -49.1% 94 27.3% -140 -40.7% 1.94%389 TN-512 Morristown/Blount, Sevier, Campbell, Cocke Counties CoC 498 904 904 0 -406 -44.9% 0 0.0% 904 - 498 - 4.73%390 TX-500 San Antonio/Bexar County CoC 2,690 4,063 2,247 1,631 -1,373 -33.8% 1,816 80.8% 616 37.8% 1,059 64.9% 7.32%391 TX-501 Corpus Christi/Nueces County CoC 658 277 277 3,100 381 137.5% 0 0.0% -2,823 -91.1% -2,442 -78.8% 1.79%392 TX-503 Austin/Travis County CoC 2,641 3,451 5,281 3,025 -810 -23.5% -1,830 -34.7% 2,256 74.6% -384 -12.7% 7.18%393 TX-504 Dewitt, Lavaca, Victoria Counties CoC 156 487 487 317 -331 -68.0% 0 0.0% 170 53.6% -161 -50.8% 0.42%

2009 2008 2007 2006
Total Change 08-09
% Change 08-09
Total Change 07-08
% Change 07-08
Total Change 06-07
% Change 06-07
Total Change 06-09
% Change 06-09
Continuum of Care Total Point-In-Time Homeless Counts, 2006-2009
#CoC Number CoC Name 1
% of 2009 Statewide
Total Count
Change 2006 to 2009Total PIT Counts
394 TX-600 Dallas City & County/Irving CoC 3,701 3,558 3,408 3,360 143 4.0% 150 4.4% 48 1.4% 341 10.1% 10.07%395 TX-601 Fort Worth/Arlington/Tarrant County 2,181 2,676 2,876 3,164 -495 -18.5% -200 -7.0% -288 -9.1% -983 -31.1% 5.93%396 TX-603 El Paso City & County CoC 1,260 1,241 1,241 1,215 19 1.5% 0 0.0% 26 2.1% 45 3.7% 3.43%397 TX-604 Waco/McLennan County CoC 312 431 431 460 -119 -27.6% 0 0.0% -29 -6.3% -148 -32.2% 0.85%398 TX-607 Texas Balance of State CoC 10,839 10,636 10,636 12,926 203 1.9% 0 0.0% -2,290 -17.7% -2,087 -16.1% 29.49%399 TX-610 Denton City & County CoC 124 168 207 470 -44 -26.2% -39 -18.8% -263 -56.0% -346 -73.6% 0.34%400 TX-611 Amarillo CoC 566 540 431 1,167 26 4.8% 109 25.3% -736 -63.1% -601 -51.5% 1.54%401 TX-613 Longview/Marshall Area CoC 535 492 374 136 43 8.7% 118 31.6% 238 175.0% 399 293.4% 1.46%402 TX-624 Wichita Falls/Wise, Palo Pinto, Wichita, Archer Counties CoC 242 280 263 0 -38 -13.6% 17 6.5% 263 - 242 - 0.66%403 TX-700 Houston/Harris County CoC 7,576 10,363 10,363 0 -2,787 -26.9% 0 0.0% 10,363 - 7,576 - 20.61%404 TX-701 Bryan/College Station/Brazos Valley CoC 265 289 289 0 -24 -8.3% 0 0.0% 289 - 265 - 0.72%405 TX-702 Montgomery County CoC 463 157 0 0 306 194.9% 157 0.0% 0 - 463 - 1.26%406 TX-703 Beaumont/Port Arthur/South East Texas CoC 1,203 710 710 0 493 69.4% 0 0.0% 710 - 1,203 - 3.27%407 TX-704 Galveston/Gulf Coast CoC 1,349 371 267 0 978 263.6% 104 39.0% 267 - 1,349 - 3.67%408 UT-500 Salt Lake City & County CoC 1,811 2,296 2,079 2,405 -485 -21.1% 217 10.4% -326 -13.6% -594 -24.7% 47.72%409 UT-503 Utah Balance of State CoC 1,685 878 716 907 807 91.9% 162 22.6% -191 -21.1% 778 85.8% 44.40%410 UT-504 Provo/Mountainland CoC 299 260 216 369 39 15.0% 44 20.4% -153 -41.5% -70 -19.0% 7.88%411 VA-500 Richmond/Henrico, Chesterfield, Hanover Counties CoC 1,150 1,073 1,158 941 77 7.2% -85 -7.3% 217 23.1% 209 22.2% 12.99%412 VA-501 Norfolk CoC 577 502 540 600 75 14.9% -38 -7.0% -60 -10.0% -23 -3.8% 6.52%413 VA-502 Roanoke City & County/Salem CoC 597 504 566 381 93 18.5% -62 -11.0% 185 48.6% 216 56.7% 6.74%414 VA-503 Virginia Beach CoC 433 484 476 628 -51 -10.5% 8 1.7% -152 -24.2% -195 -31.1% 4.89%415 VA-504 Charlottesville CoC 199 239 265 257 -40 -16.7% -26 -9.8% 8 3.1% -58 -22.6% 2.25%416 VA-505 Newport News/Hampton/Virginia Peninsula CoC 569 526 908 879 43 8.2% -382 -42.1% 29 3.3% -310 -35.3% 6.43%417 VA-507 Portsmouth CoC 303 222 217 271 81 36.5% 5 2.3% -54 -19.9% 32 11.8% 3.42%418 VA-508 Lynchburg CoC 255 256 289 289 -1 -0.4% -33 -11.4% 0 0.0% -34 -11.8% 2.88%419 VA-509 Petersburg CoC 90 74 80 94 16 21.6% -6 -7.5% -14 -14.9% -4 -4.3% 1.02%420 VA-510 Staunton/Waynesboro/Augusta, Highland Counties CoC 100 109 95 0 -9 -8.3% 14 14.7% 95 - 100 - 1.13%421 VA-512 Chesapeake CoC 37 52 129 207 -15 -28.8% -77 -59.7% -78 -37.7% -170 -82.1% 0.42%422 VA-513 Winchester/Shenandoah, Frederick, Warren Counties CoC 97 177 265 853 -80 -45.2% -88 -33.2% -588 -68.9% -756 -88.6% 1.10%423 VA-514 Fredericksburg/Spotsylvania, Stafford Counties CoC 202 194 561 447 8 4.1% -367 -65.4% 114 25.5% -245 -54.8% 2.28%424 VA-517 Danville/Martinsville CoC 132 210 187 81 -78 -37.1% 23 12.3% 106 130.9% 51 63.0% 1.49%425 VA-518 Harrisburg/ Rockingham County CoC 132 68 117 92 64 94.1% -49 -41.9% 25 27.2% 40 43.5% 1.49%426 VA-519 Suffolk CoC 71 48 30 74 23 47.9% 18 60.0% -44 -59.5% -3 -4.1% 0.80%427 VA-521 Virginia Balance of State CoC 559 470 608 675 89 18.9% -138 -22.7% -67 -9.9% -116 -17.2% 6.31%428 VA-600 Arlington County CoC 511 410 462 360 101 24.6% -52 -11.3% 102 28.3% 151 41.9% 5.77%429 VA-601 Fairfax County CoC 1,730 1,835 1,593 1,565 -105 -5.7% 242 15.2% 28 1.8% 165 10.5% 19.54%430 VA-602 Loudoun County CoC 143 160 211 184 -17 -10.6% -51 -24.2% 27 14.7% -41 -22.3% 1.62%431 VA-603 Alexandria CoC 335 306 375 379 29 9.5% -69 -18.4% -4 -1.1% -44 -11.6% 3.78%432 VA-604 Prince William County CoC 630 550 614 498 80 14.5% -64 -10.4% 116 23.3% 132 26.5% 7.12%433 VI-500 Virgin Islands CoC 471 602 559 448 -131 -21.8% 43 7.7% 111 24.8% 23 5.1% 100.00%434 VT-500 Vermont Balance of State CoC 649 633 796 770 16 2.5% -163 -20.5% 26 3.4% -121 -15.7% 53.46%435 VT-501 Burlington/Chittenden County CoC 565 321 239 219 244 76.0% 82 34.3% 20 9.1% 346 158.0% 46.54%436 WA-500 Seattle/King County CoC 8,952 8,501 7,902 7,910 451 5.3% 599 7.6% -8 -0.1% 1,042 13.2% 39.29%437 WA-501 Washington Balance of State CoC 6,557 6,631 6,995 6,004 -74 -1.1% -364 -5.2% 991 16.5% 553 9.2% 28.78%438 WA-502 Spokane City & County CoC 1,229 1,370 1,083 1,535 -141 -10.3% 287 26.5% -452 -29.4% -306 -19.9% 5.39%439 WA-503 Tacoma/Lakewood/Pierce County CoC 2,083 1,743 1,596 1,191 340 19.5% 147 9.2% 405 34.0% 892 74.9% 9.14%440 WA-504 Everett/Snohomish County CoC 2,356 2,161 3,453 3,241 195 9.0% -1,292 -37.4% 212 6.5% -885 -27.3% 10.34%441 WA-507 Yakima City & County CoC 446 486 684 610 -40 -8.2% -198 -28.9% 74 12.1% -164 -26.9% 1.96%442 WA-508 Vancouver/Clark County CoC 1,159 1,062 1,392 1,391 97 9.1% -330 -23.7% 1 0.1% -232 -16.7% 5.09%443 WI-500 Wisconsin Balance of State CoC 3,992 3,105 3,105 3,264 887 28.6% 0 0.0% -159 -4.9% 728 22.3% 61.18%444 WI-501 Milwaukee City & County CoC 1,537 1,470 1,470 1,856 67 4.6% 0 0.0% -386 -20.8% -319 -17.2% 23.56%445 WI-502 Racine City & County CoC 354 259 256 305 95 36.7% 3 1.2% -49 -16.1% 49 16.1% 5.43%446 WI-503 Madison/Dane County CoC 642 615 817 1,084 27 4.4% -202 -24.7% -267 -24.6% -442 -40.8% 9.84%447 WV-500 Wheeling/Weirton Area CoC 87 92 118 115 -5 -5.4% -26 -22.0% 3 2.6% -28 -24.3% 5.22%448 WV-501 Huntington/Cabell, Wayne Counties 195 264 331 312 -69 -26.1% -67 -20.2% 19 6.1% -117 -37.5% 11.70%449 WV-503 Charleston/Kanawha, Putnam, Boone, Clay Counties CoC 382 363 325 402 19 5.2% 38 11.7% -77 -19.2% -20 -5.0% 22.92%

2009 2008 2007 2006
Total Change 08-09
% Change 08-09
Total Change 07-08
% Change 07-08
Total Change 06-07
% Change 06-07
Total Change 06-09
% Change 06-09
Continuum of Care Total Point-In-Time Homeless Counts, 2006-2009
#CoC Number CoC Name 1
% of 2009 Statewide
Total Count
Change 2006 to 2009Total PIT Counts
450 WV-508 West Virginia Balance of State CoC 1,003 1,297 1,635 478 -294 -22.7% -338 -20.7% 1,157 242.1% 525 109.8% 60.17%451 WY-500 Wyoming Statewide CoC 515 751 537 529 -236 -31.4% 214 8 1.5% -14 -2.6% 100.00%
TOTAL 643,067 664,414 671,888 759,101 -21,347 -3.2% -6,185 -0.9% -87,213 -11.5% -116,034 -15.3%
1 Only active 2009 CoCs are reported in this table. All inactive or closed CoCs have been included in the national totals for 2006, 2007 and 2008, but are not individually reported.

Appendix D:
Counts of Homeless Sheltered Persons Using HMIS Data

Appendix D: Counts of Homeless Sheltered Persons Using HMIS Data D-1
Appendix D Counts of Homeless Sheltered Persons Using HMIS Data
Appendix D-1: Estimate of Sheltered Homeless Individuals and Families during a One-Year Period, October 2008–September 2009
Household Type Number of Sheltered Persons All Sheltered Persons… 1,558,917
…in emergency shelters only 1,207,229
…in transitional housing only 284,616
…in both emergency shelters and transitional housing
67,072
Individuals… 1,034,659
…in emergency shelters only 840,394 …in transitional housing only 149,760 …in both emergency shelters and transitional housing
44,504
Persons in Families… 535,447
…in emergency shelters only 375,334 …in transitional housing only 134,069 …in both emergency shelters and transitional housing
26,044
Households with Children 170,129 Note: Counts may not add up to total because of rounding.
Source: Homeless Management Information System data, October 2008–September 2009.

D-2 Appendix D: Counts of Homeless Sheltered Persons Using HMIS Data
Appendix D-2: Sheltered Homeless Persons by Household Type, October
2008–September 2009 Household Type Number Number of Homeless Persons 1,558,917 Individuals 1,034,659
Single adult male households 722,030 Single adult female households 261,805 Unaccompanied youth and several-children households
22,722
Several-adult households 25,216 Unknown 2,885
Persons in Families 535,447
Adults in households with children 210,510 Children in households with adults 323,325 Unknown 1,613
Note: Counts may not add up to total because of rounding. Source: Homeless Management Information System data, October 2008–September 2009.
Appendix D-3: Seasonal Point-in-Time Count of Sheltered Homeless Persons by Household Type, October 2008–September 2009
Number of Sheltered Homeless Persons
All Sheltered Persons Individuals
Persons in Families
On a single night in
October 2008 322,380 168,461 153,919 January 2009 348,274 191,223 157,051 April 2009 332,603 177,200 155,403 July 2009 333,387 177,217 156,170
On an average night 331,568 176,784 154,784 Note: Counts may not add up to total because of rounding.
Source: Homeless Management Information System data, October 2008–September 2009.

Appendix D: Counts of Homeless Sheltered Persons Using HMIS Data D-3
Appendix D-4: Demographic Characteristics of Sheltered Homeless Persons by Household Type, October 2008–September 2009
Characteristics All Sheltered
Persons Individuals Persons in
Families Number of Homeless Persons 1,558,917 1,034,659 535,447 Gender of Adults 1,212,539 1,011,819 210,511
Female 439,320 275,616 167,454 Male 770,491 733,685 42,824 Unknown 2,728 2,518 233
Gender of Children 344,660 22,714 323,322
Female 170,795 12,330 159,167 Male 173,260 10,354 163,571 Unknown 605 30 584
Ethnicity
Non–Hispanic/non–Latino 1,224,858 844,909 388,952 Hispanic/Latino 295,902 162,504 135,233 Unknown 38,157 27,246 11,263
Race
White, non–Hispanic/non–Latino 553,942 442,652 115,173 White, Hispanic/Latino 168,396 101,072 68,162 Black or African American 562,964 333,211 233,882 Asian 10,434 6,414 4,134 American Indian or Alaska Native 47,267 27,490 19,713 Native Hawaiian or other Pacific Islander 9,519 3,096 6,357 Several races 102,393 61,980 41,408 Unknown 104,001 58,744 46,618
Age
Under 1 39,555 1,842 37,918 1 to 5 133,416 1,768 132,204 6 to 12 107,247 2,503 105,093 13 to 17 64,277 16,518 48,020 18 to 30 346,044 232,516 116,101 31 to 50 594,323 511,461 87,455 51 to 61 223,594 219,639 6,099 62 and older 43,338 43,033 765 Unknown 7,122 5,379 1,793
Persons by Household Size
1 person 996,705 1,005,500 0 2 people 154,978 25,455 130,251 3 people 158,594 2,480 156,711 4 people 122,953 610 122,855 5 or more people 122,969 182 123,306 Unknown 2,718 433 2,323

D-4 Appendix D: Counts of Homeless Sheltered Persons Using HMIS Data
Appendix D-4: Demographic Characteristics of Sheltered Homeless Persons by
Household Type, October 2008–September 2009
Characteristics All Sheltered
Persons Individuals Persons in
Families Veteran (adults only) 1,212,539 1,011,818 210,511
Yes 127,634 124,744 4,072 No 1,019,490 836,760 190,740 Unknown 65,415 50,314 15,699
Disabled (adults only) 1,212,538 1,011,820 210,510
Yes 409,962 385,470 27,078 No 674,473 513,466 166,630 Unknown 128,103 112,884 16,802
Note: Counts may not add up to total because of rounding.
Source: Homeless Management Information System data, October 2008–September 2009.

Appendix D: Counts of Homeless Sheltered Persons Using HMIS Data D-5
Appendix D-5: Demographic Characteristics of Sheltered Homeless Persons in
Emergency Shelters, October 2008–September 2009
Characteristics
Persons in Emergency
Shelters Individuals Persons in
Families Number of Homeless Persons 1,274,301 884,899 401,378 Gender of Adults 1,016,212 866,306 159,293
Female 346,192 224,533 125,162 Male 667,877 639,805 33,922 Unknown 2,143 1,968 209
Gender of Children 256,789 18,543 240,818
Female 125,884 9,609 117,539 Male 130,449 8,909 122,840 Unknown 456 25 439
Ethnicity
Non–Hispanic/non–Latino 998,899 717,476 290,691 Hispanic/Latino 246,661 146,605 102,459 Unknown 28,741 20,818 8,229
Race
White, non–Hispanic/non–Latino 448,557 375,464 76,969 White, Hispanic/Latino 137,295 91,528 46,791 Black or African American 454,454 277,186 181,802 Asian 7,983 5,043 3,005 American Indian or Alaska Native 42,237 25,132 17,393 Native Hawaiian or other Pacific Islander 5,656 2,314 3,379 Several races 82,025 53,778 29,068 Unknown 96,094 54,454 42,972
Age
Under 1 29,310 830 28,802 1 to 5 98,183 1,266 97,915 6 to 12 79,356 2,242 77,910 13 to 17 49,847 14,124 36,171 18 to 30 279,728 194,575 87,998 31 to 50 498,558 437,137 65,935 51 to 61 193,266 190,263 4,649 62 and older 40,310 40,018 632 Unknown 5,742 4,444 1,367
Persons by Household Size
1 person 852,278 859,881 0 2 people 117,861 21,960 97,165 3 people 117,894 2283 116,792 4 people 90,384 569 90,738

D-6 Appendix D: Counts of Homeless Sheltered Persons Using HMIS Data
Appendix D-5: Demographic Characteristics of Sheltered Homeless Persons in Emergency Shelters, October 2008–September 2009
Characteristics
Persons in Emergency
Shelters Individuals Persons in
Families 5 or more people 94,390 152 95,222 Unknown 1,493 54 1,462
Veteran (adults only) 1,016,212 866,306 159,293 Yes 105,108 102,941 3,077 No 857,195 722,071 143,036 Unknown 53,909 41,294 13,180
Disabled (adults only) 1,016,212 866,306 159,293
Yes 312,850 298,109 17,608 No 591,160 468,210 128,581 Unknown 112,202 99,987 13,104
Note: Counts may not add up to total because of rounding.
Source: Homeless Management Information System data, October 2008–September 2009.
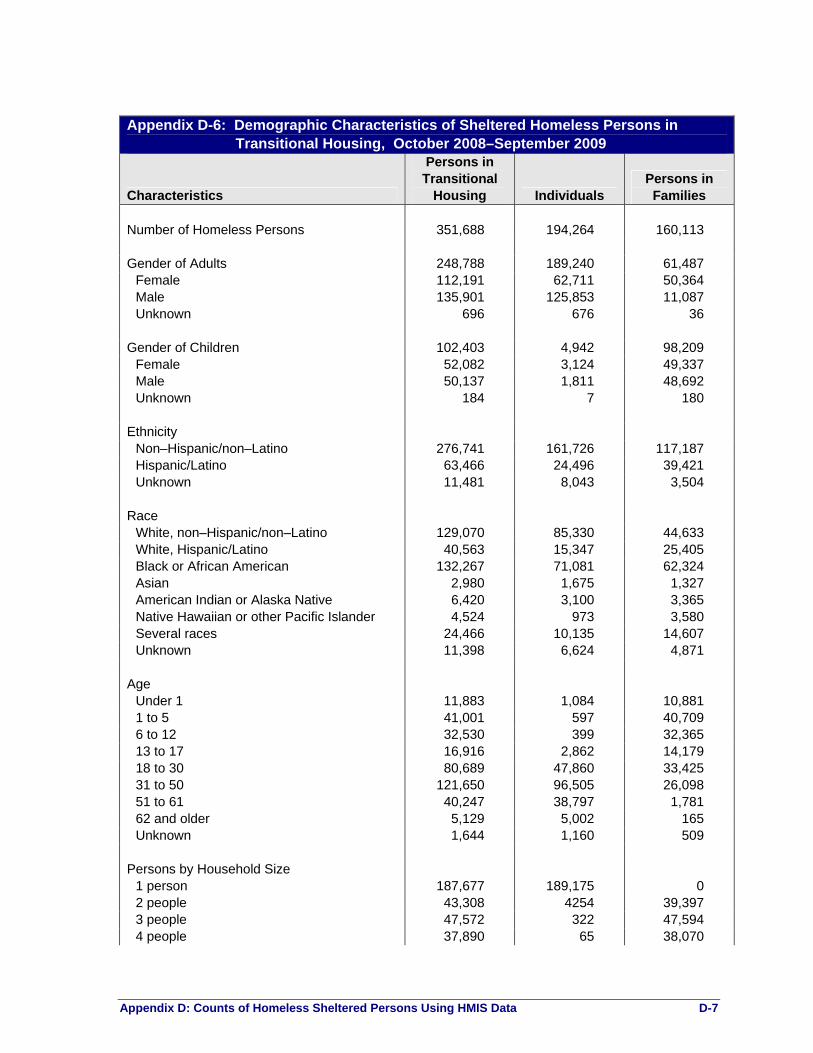
Appendix D: Counts of Homeless Sheltered Persons Using HMIS Data D-7
Appendix D-6: Demographic Characteristics of Sheltered Homeless Persons in
Transitional Housing, October 2008–September 2009
Characteristics
Persons in Transitional
Housing Individuals Persons in
Families Number of Homeless Persons 351,688 194,264 160,113 Gender of Adults 248,788 189,240 61,487
Female 112,191 62,711 50,364 Male 135,901 125,853 11,087 Unknown 696 676 36
Gender of Children 102,403 4,942 98,209
Female 52,082 3,124 49,337 Male 50,137 1,811 48,692 Unknown 184 7 180
Ethnicity
Non–Hispanic/non–Latino 276,741 161,726 117,187 Hispanic/Latino 63,466 24,496 39,421 Unknown 11,481 8,043 3,504
Race
White, non–Hispanic/non–Latino 129,070 85,330 44,633 White, Hispanic/Latino 40,563 15,347 25,405 Black or African American 132,267 71,081 62,324 Asian 2,980 1,675 1,327 American Indian or Alaska Native 6,420 3,100 3,365 Native Hawaiian or other Pacific Islander 4,524 973 3,580 Several races 24,466 10,135 14,607 Unknown 11,398 6,624 4,871
Age
Under 1 11,883 1,084 10,881 1 to 5 41,001 597 40,709 6 to 12 32,530 399 32,365 13 to 17 16,916 2,862 14,179 18 to 30 80,689 47,860 33,425 31 to 50 121,650 96,505 26,098 51 to 61 40,247 38,797 1,781 62 and older 5,129 5,002 165 Unknown 1,644 1,160 509
Persons by Household Size
1 person 187,677 189,175 0 2 people 43,308 4254 39,397 3 people 47,572 322 47,594 4 people 37,890 65 38,070

D-8 Appendix D: Counts of Homeless Sheltered Persons Using HMIS Data
Appendix D-6: Demographic Characteristics of Sheltered Homeless Persons in Transitional Housing, October 2008–September 2009
Characteristics
Persons in Transitional
Housing Individuals Persons in
Families 5 or more people 33,887 39 34,093 Unknown 1,354 409 958
Veteran (adults only) 248,789 189,240 61,486 Yes 28,388 27,399 1224 No 206,145 150,605 57,123 Unknown 14,256 11,236 3,139
Disabled (adults only) 248,789 189,240 61,487
Yes 115,684 105,374 11,195 No 111,201 66,496 45,537 Unknown 21,904 17,370 4,755
Note: Counts may not add up to total because of rounding.
Source: Homeless Management Information System data, October 2008–September 2009.

Appendix D: Counts of Homeless Sheltered Persons Using HMIS Data D-9
Appendix D-7: Demographic Characteristics of Sheltered Homeless Persons by Location, October 2008–September 2009
Characteristics Principal Cities Suburban and Rural
Areas Number of Homeless Persons 1,063,613 495,304 Gender of Adults 854,442 358,097
Female 294,131 145,189 Male 558,471 212,020 Unknown 1,840 888
Gender of Children 207,860 136,800
Female 102,974 67,821 Male 104,487 68,773 Unknown 399 206
Ethnicity
Non–Hispanic/non–Latino 811,759 413,099 Hispanic/Latino 228,953 66,949 Unknown 22,901 15,256
Race
White, non–Hispanic/non–Latino 326,917 227,026 White, Hispanic/Latino 128,221 40,175 Black or African American 405,904 157,059 Asian 6,564 3,870 American Indian or Alaska Native 35,339 11,928 Native Hawaiian or other Pacific Islander 5,286 4233 Several races 67,075 35,318 Unknown 88,307 15,694
Age
Under 1 24,825 14,730 1 to 5 82,389 51,028 6 to 12 64,440 42,808 13 to 17 36,057 28,219 18 to 30 235,464 110,580 31 to 50 416,010 178,313 51 to 61 164,800 58,794 62 and older 34,164 9,174 Unknown 5,464 1,658
Persons by Household Size
1 person 716,662 280,043 2 people 102,287 52,691 3 people 95,023 63,570 4 people 72,812 50,142

D-10 Appendix D: Counts of Homeless Sheltered Persons Using HMIS Data
Appendix D-7: Demographic Characteristics of Sheltered Homeless Persons by Location, October 2008–September 2009
Characteristics Principal Cities Suburban and Rural
Areas 5 or more people 74,891 48,079 Unknown 1,939 779
Veteran (adults only) Yes 854,443 358,096 No 91,369 36,265 Unknown 716,732 302,758
46,342 19,073 Disabled (adults only)
Yes 854,443 358,097 No 261,426 148,537 Unknown 86,807 41,297
Note: Counts may not add up to total because of rounding.
Source: Homeless Management Information System data, October 2008–September 2009.
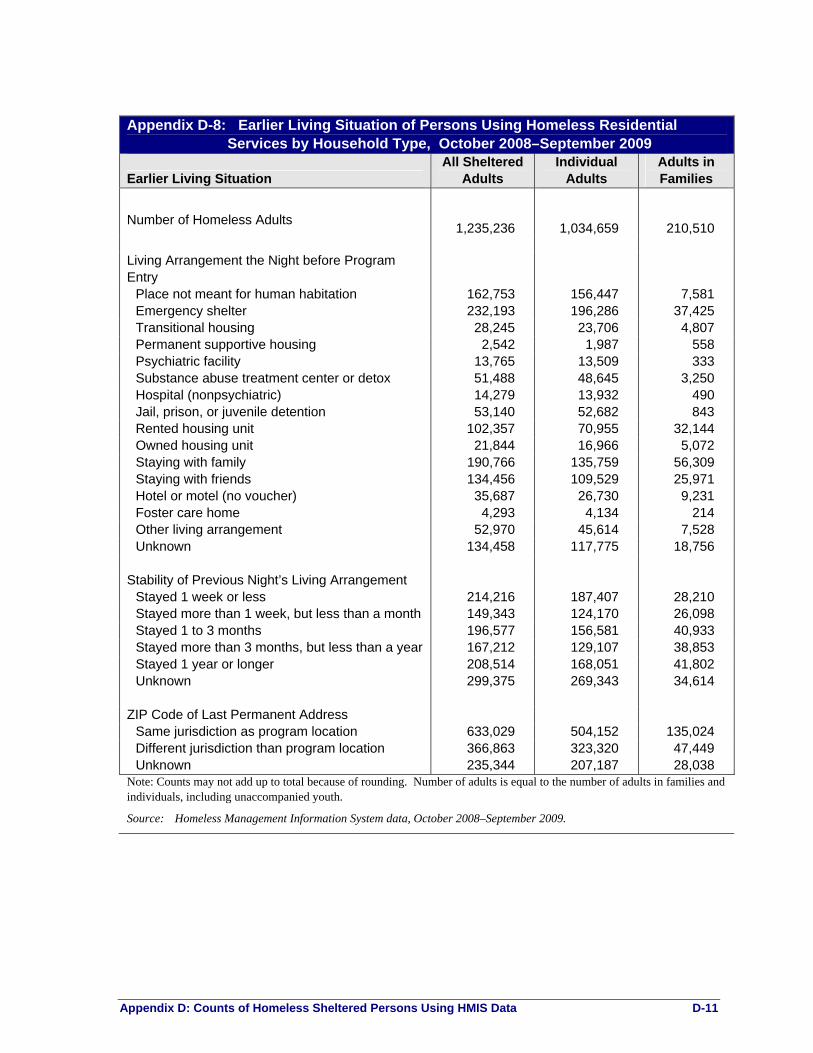
Appendix D: Counts of Homeless Sheltered Persons Using HMIS Data D-11
Appendix D-8: Earlier Living Situation of Persons Using Homeless Residential
Services by Household Type, October 2008–September 2009
Earlier Living Situation All Sheltered
Adults Individual
Adults Adults in Families
Number of Homeless Adults 1,235,236
1,034,659
210,510
Living Arrangement the Night before Program Entry
Place not meant for human habitation 162,753 156,447 7,581 Emergency shelter 232,193 196,286 37,425 Transitional housing 28,245 23,706 4,807 Permanent supportive housing 2,542 1,987 558 Psychiatric facility 13,765 13,509 333 Substance abuse treatment center or detox 51,488 48,645 3,250 Hospital (nonpsychiatric) 14,279 13,932 490 Jail, prison, or juvenile detention 53,140 52,682 843 Rented housing unit 102,357 70,955 32,144 Owned housing unit 21,844 16,966 5,072 Staying with family 190,766 135,759 56,309 Staying with friends 134,456 109,529 25,971 Hotel or motel (no voucher) 35,687 26,730 9,231 Foster care home 4,293 4,134 214 Other living arrangement 52,970 45,614 7,528 Unknown 134,458 117,775 18,756
Stability of Previous Night’s Living Arrangement
Stayed 1 week or less 214,216 187,407 28,210 Stayed more than 1 week, but less than a month 149,343 124,170 26,098 Stayed 1 to 3 months 196,577 156,581 40,933 Stayed more than 3 months, but less than a year 167,212 129,107 38,853 Stayed 1 year or longer 208,514 168,051 41,802 Unknown 299,375 269,343 34,614
ZIP Code of Last Permanent Address
Same jurisdiction as program location 633,029 504,152 135,024 Different jurisdiction than program location 366,863 323,320 47,449 Unknown 235,344 207,187 28,038
Note: Counts may not add up to total because of rounding. Number of adults is equal to the number of adults in families and individuals, including unaccompanied youth.
Source: Homeless Management Information System data, October 2008–September 2009.

D-12 Appendix D: Counts of Homeless Sheltered Persons Using HMIS Data
Appendix D-9: Earlier Living Situation of Persons Using Homeless Residential
Services in Emergency Shelters, October 2008–September 2009
Earlier Living Situation
Adults in Emergency
Shelters Individual
Adults Adults in Families
Number of Homeless Adults 1,034,622 884,898 159,293 Living Arrangement the Night before Program Entry
Place not meant for human habitation 148,629 144,256 5,595 Emergency shelter 171,575 156,298 16,737 Transitional housing 14,424 13,450 1,114 Permanent supportive housing 2,297 1,825 494 Psychiatric facility 10,012 9,790 307 Substance abuse treatment center or detox 24,726 24,095 870 Hospital (nonpsychiatric) 12,436 12,065 468 Jail, prison, or juvenile detention 41,208 41,040 571 Rented housing unit 95,665 68,544 28,104 Owned housing unit 19,965 15,760 4,431 Staying with family 169,945 122,773 48,750 Staying with friends 123,450 101,948 22,614 Hotel or motel (no voucher) 32,739 25,260 7,711 Foster care home 2,061 2,000 86 Other living arrangement 45,046 39,487 5,944 Unknown 120,444 106,307 15,497
Stability of Previous Night’s Living Arrangement
Stayed 1 week or less 196,068 174,038 23,717 Stayed more than 1 week, but less than a month 117,852 98,937 19,869 Stayed 1 to 3 months 145,487 120,749 25,967 Stayed more than 3 months, but less than a year 122,266 95,757 27,589 Stayed 1 year or longer 184,655 150,097 36,189 Unknown 268,293 245,321 25,962
ZIP Code of Last Permanent Address
Same jurisdiction as program location 512,411 416,464 101,296 Different jurisdiction than program location 324,524 288,978 38,188 Unknown 197,686 179,456 19,809
Note: Counts may not add up to total because of rounding. Number of adults is equal to the number of adults in families and individuals, including unaccompanied youth
Source: Homeless Management Information System data, October 2008–September 2009.

Appendix D: Counts of Homeless Sheltered Persons Using HMIS Data D-13
Appendix D-10: Earlier Living Situation of Persons Using Homeless Residential
Services in Transitional Housing, October 2008–September 2009
Earlier Living Situation
All Adults in Transitional
Housing Individual
Adults Adults in Families
Number of Homeless Adults 253,772 194,264 61,487 Living Arrangement the Night before Program Entry
Place not meant for human habitation 22,372 20,035 2,532 Emergency shelter 70,390 48,061 22,861 Transitional housing 15,242 11,370 4,004 Permanent supportive housing 342 257 91 Psychiatric facility 4,335 4,337 39 Substance abuse treatment center or detox 29,285 26,930 2,579 Hospital (nonpsychiatric) 2,447 2,403 64 Jail, prison, or juvenile detention 14,275 14,041 307 Rented housing unit 11,126 5,899 5,297 Owned housing unit 2,734 1,907 852 Staying with family 28,343 18,602 9,952 Staying with friends 16,642 12,256 4,532 Hotel or motel (no voucher) 4,227 2,287 1,971 Foster care home 2,397 2,273 134 Other living arrangement 9,845 8,005 1,935 Unknown 19,770 15,602 4,338
Stability of Previous Night’s Living Arrangement
Stayed 1 week or less 26,377 20,656 5,920 Stayed more than 1 week, but less than a month 38,658 31,407 7,603 Stayed 1 to 3 months 60,202 43,439 17,240 Stayed more than 3 months, but less than a year 52,997 40,343 13,074 Stayed 1 year or longer 33,331 26,293 7,283 Unknown 42,209 32,126 10,367
ZIP Code of Last Permanent Address
Same jurisdiction as program location 149,795 110,492 40,418 Different jurisdiction than program location 56,453 45,665 11,353 Unknown 47,525 38,107 9,716
Note: Counts may not add up to total because of rounding. Number of adults is equal to the number of adults in families and individuals, including unaccompanied youth.
Source: Homeless Management Information System data, October 2008–September 2009.

D-14 Appendix D: Counts of Homeless Sheltered Persons Using HMIS Data
Appendix D-11: Earlier Living Situation of Persons Using Homeless Residential Services
by Location, October 2008–September 2009
Earlier Living Situation Principal Cities Suburban and Rural
Areas Number of Homeless Adults 865,692 369,546 Living Arrangement the Night before Program Entry
Place not meant for human habitation 118,879 43,875 Emergency shelter 171,916 60,277 Transitional housing 19,872 8,373 Permanent supportive housing 1,967 575 Psychiatric facility 7,942 5,823 Substance abuse treatment center or detox 34,119 17,369 Hospital (nonpsychiatric) 9,203 5,076 Jail, prison, or juvenile detention 35,026 18,114 Rented housing unit 72,803 29,554 Owned housing unit 15,698 6,146 Staying with family 126,689 64,078 Staying with friends 81,590 52,866 Hotel or motel (no voucher) 19,405 16,282 Foster care home 2,928 1,365 Other living arrangement 39,624 13,346 Unknown 108,031 26,427
Stability of Previous Night’s Living Arrangement
Stayed 1 week or less 129,708 84,508 Stayed more than 1 week, but less than a month 92,516 56,827 Stayed 1 to 3 months 131,511 65,066 Stayed more than 3 months, but less than a year 109,521 57,691 Stayed 1 year or longer 144,629 63,885 Unknown 257,806 41,569
ZIP Code of Last Permanent Address
Same jurisdiction as program location 457,846 175,183 Different jurisdiction than program location 216,949 149,914 Unknown 190,896 44,448
Note: Counts may not add up to total because of rounding. Number of adults is equal to the number of adults in families and individuals, including unaccompanied youth.
Source: Homeless Management Information System data, October 2008–September 2009.

Appendix D: Counts of Homeless Sheltered Persons Using HMIS Data D-15
Appendix D-12: Length of Stay in Emergency Shelters by Household Type, October
2008–September 2009 Individuals
Length of Stay
Persons in Emergency
Shelters All Male Female Persons in
Families Number of Homeless Persons
1,273,001 884,849 648,714 234,142 400,111
Length of Stay 1,273,002 884,850 648,714 234,143 400,112
1 week or less 426,400 335,017 252,499 81,169 95,419 1 week to 1 month 338,374 247,304 179,294 67,727 93,993 1 to 2 months 186,183 125,246 88,238 36,889 62,596 2 to 3 months 101,572 58,910 42,931 15,932 43,604 3 to 4 months 66,750 36,885 26,779 10,084 30,514 4 to 5 months 40,267 23,546 17,235 6,287 17,151 5 to 6 months 29,342 15,179 11,076 4,088 14,475 6 to 7 months 21,659 10,847 8,118 2,695 11,051 7 to 8 months 14,322 7,236 5,366 1,867 7,252 8 to 9 months 10,001 5,135 3,917 1,207 4,991 9 to 10 months 8,399 3,988 2,777 1207 4,513 10 to 11 months 7,442 3,712 2,647 1062 3,819 11 months to 1 year 6,330 4,020 2,825 1,191 2,386 1 year 14,825 6,898 4,441 2,441 8,129 Unknown 1,136 927 571 297 219
Note: Counts may not add up to total because of rounding. Total homeless persons may not add up to the sum of the length-of-stay counts because length of stay was not collected for persons who could not be designated as adult or children.
Source: Homeless Management Information System data, October 2008–September 2009.

D-16 Appendix D: Counts of Homeless Sheltered Persons Using HMIS Data
Appendix D-13: Length of Stay in Transitional Housing by Household Type, October
2008–September 2009 Individuals
Length of Stay
Persons in Transitional
Housing All Male Female Persons in
Families Number of Homeless Persons
351,191 194,182 127,664 65,835 159,696
Length of Stay 351,195 194,178 127,666 65,833 159,695
1 week or less 17,646 12,643 8,076 4,547 5,151 1 week to 1 month 39,193 25,774 17,218 8,512 13,719 1 to 2 months 42,144 27,289 17,893 9,371 15,150 2 to 3 months 32,428 20,479 13,921 6,539 12,200 3 to 4 months 32,668 18,726 11,532 7,172 14,192 4 to 5 months 25,940 14,320 9,660 4,595 11,805 5 to 6 months 20,676 11,234 7,138 4,081 9,593 6 to 7 months 20,763 10,021 6,431 3,578 10,891 7 to 8 months 17,080 8,097 5,507 2,586 9,102 8 to 9 months 13,367 6,375 4,090 2,275 7,088 9 to 10 months 12,743 5,635 3,830 1,797 7,212 10 to 11 months 11,200 5,088 3,206 1,881 6,198 11 months to 1 year 11,858 5,789 3,750 2,035 6,149 1 year 52,420 22,067 15,272 6,779 30,799 Unknown 1,069 641 142 85 446
Note: Counts may not add up to total because of rounding. Total homeless persons may not add up to the sum of the length-of-stay counts because length of stay was not collected for persons who could not be designated as adult or children.
Source: Homeless Management Information System data, October 2008–September 2009.