the analysis of vehicle operating cost (voc) and the
TRANSCRIPT

The Analysis of Vehicle Operating Cost (VOC) and the
Preparation of Public Transport Information Systems
Based on Geographic Information Systems (GIS) in
Kupang City
Margareth E. Bolla1*, Judi K. Nasjono1, Marchninth A. Pedelati 1
1Faculty of Science and Technology, University of Nusa Cendana, Kupang, Indonesia
*Corresponding author. Email: [email protected]
ABSTRACT
Transportation is one of the most important elements in the economy aspect, because transportation is closely related to
community activities, especially in urban areas. The purpose of this study is to provide city transportation data, namely the
Vehicle Operating Costs (VOC) of 15 existing routes, and to create a web-based public transportation information system, which
can be easily accessed by the public. The VOC analysis and tariffs are based on the Regulation of Direktorat Jenderal
Perhubungan Darat Nomor: SK.687 / AJ.206 / DRJD / 2002, while the information system is developed using Quantum GIS
software Las Palmas 2.18.2 and sublime text 3.0. The results of the VOC analysis show the smallest operational costs are Rp.
884.41, - per passenger and the smallest fare is Rp. 972.85, - while the largest operational costs are Rp. 2,677.32 per passenger
and the largest fare is Rp. 2,945.05, - per passenger. The city transportation information system being composed consists of route
maps that are equipped with attributes of road names, road classes, road lengths, operational times, fleet colors and public
transportation photos, which can be accessed on the website angkutanumumkotakupang.com.
Keywords— Public Transportation, Vehicle Operating Cost (VOC), tariff, Geographic Information System
1. INTRODUCTION
The city transportation (bemo) in Kupang City, based on Kupang City Transportation Department data in 2017, has 366
(three hundred sixty-six) fleets, which are divided into 15
routes. The tariffs imposed for city transportation services are
flat / flat tariffs for public passengers is Rp. 3,000,- for each,
and for students is Rp. 2,000. The number of urban
transportation operating has not been supported by the
availability of adequate information to be accessed by the
public. One of the data that is not owned by the Transportation
Department is Vehicle Operational Cost (VOC) data for each
route, which is useful in determining future city transportation
tariff policies. From these conditions, it is necessary to
conduct the data collection and the analysis of the VOC,
followed by the creation of a web-GIS-based online
information system that is easily accessible to public.
2. THEORETICAL BASIS
2.1 Vehicle Operating Costs
The component of vehicle operating costs according to the
calculation method based on the Regulation of Direktorat
Jenderal Perhubungan Darat Nomor: SK.687 / AJ.206 / DRJD
/ 2002 on Pedoman Teknis Penyelenggaraan Angkutan
Penumpang Umum di wilayah Perkotaan dalam Trayek Tetap
dan Teratur [1].
Table I. Direct and Indirect Cost Components based on
Cost Grouping
Direct Cost Indirect Cost
1) Cost of
depreciation
2) Capital interest
3) Microbus crew
(driver and
conductor)
i. Salary/wage
ii.Operating work
allowance
iii.Social Benefit
4) Fuel Oil
5) Tires
6) Small Service
7) Large service
8) Overhaul
9) Oil addition
10) Parts and body
11) Wash the bus
1) Employee costs other than the
crew of the vehicle
a) Salary / wages
b) Overtime pay
c) Social benefits
i. Health care support
ii. Official clothes
iii. Accident insurance
2) Management costs
a) Depreciation of office
buildings
b) Depreciation of pools andWork shops
c) Depreciation of
inventory/office equipment
d) Depreciation of workshopfacilities
Advances in Engineering Research, volume 199
Proceedings of the 4th International Conference on Sustainable Innovation 2020–Technology,
Engineering and Agriculture (ICoSITEA 2020)
Copyright © 2021 The Authors. Published by Atlantis Press B.V.This is an open access article distributed under the CC BY-NC 4.0 license -http://creativecommons.org/licenses/by-nc/4.0/. 17
Direct Cost Indirect Cost
12) Terminal
Retribution
13) Vehicle Tax
14) Kir
15) Insurance
i. Vehicle insurance
ii. Bus crew
insurance
e) Office administration
costs
f) Office maintenance costs
g) Pool and workshop
maintenance costs
h) Electricity and water costs
i) Telephone and telegram
fees
j) Cost of official travel
other than The crew of the vehicle
k) Corporate tax
l) Route permission
m) Business license
n) Marketing costs
o) Other
2.2. Transportation Rates
According to the Direktorat Jenderal Perhubungan Darat
(2002) the tariff is the amount of fees charged to each
passenger of public transport vehicles in rupiah. Calculation
of public transport fares is the result of multiplying the basic
fare and the average distance (Km) of a trip (BEP rate) and
adding 10% to the company’s profit service [1].
2.3. Geographic Information System and Web-GIS
Geographical Information Systems (GIS) have the basic
ability to integrate various database operations such as
queries, analyze and display them in the form of mapping
based on their geographical location. A research on the use of
GIS in the field of road transportation has been carried out by
M.E Bolla (2018) that is to analyze traffic accident-prone
roads, as well as to develop a database that provides
comprehensive information of the roads. [3]. Web-GIS is a
combination of mapping graphic design, digital maps with
geographical analysis, computer programming, and a database
that are interconnected into one part of web design and web
mapping. In building GIS, software that can be used include
Quantum GIS (QGIS) and Sublime Text. QGIS is an open
source-based software, which has features for georeferencing,
creating thematic maps, calculating the extent of an area, and
other mapping processing related to spatial and non-spatial
data [4]. Sublime Text is an application editor for code and
text that can run on various operating system platforms using
Python API technology [5]. The display of QGIS Las Palmas
2.18.2 and Sublime Text 3.0 can be seen in Fig. 1 and Fig. 2.
Fig. 1. Display of QGIS Las Palmas 2.18.2
Fig. 2. Display of Sublime Text 3.0
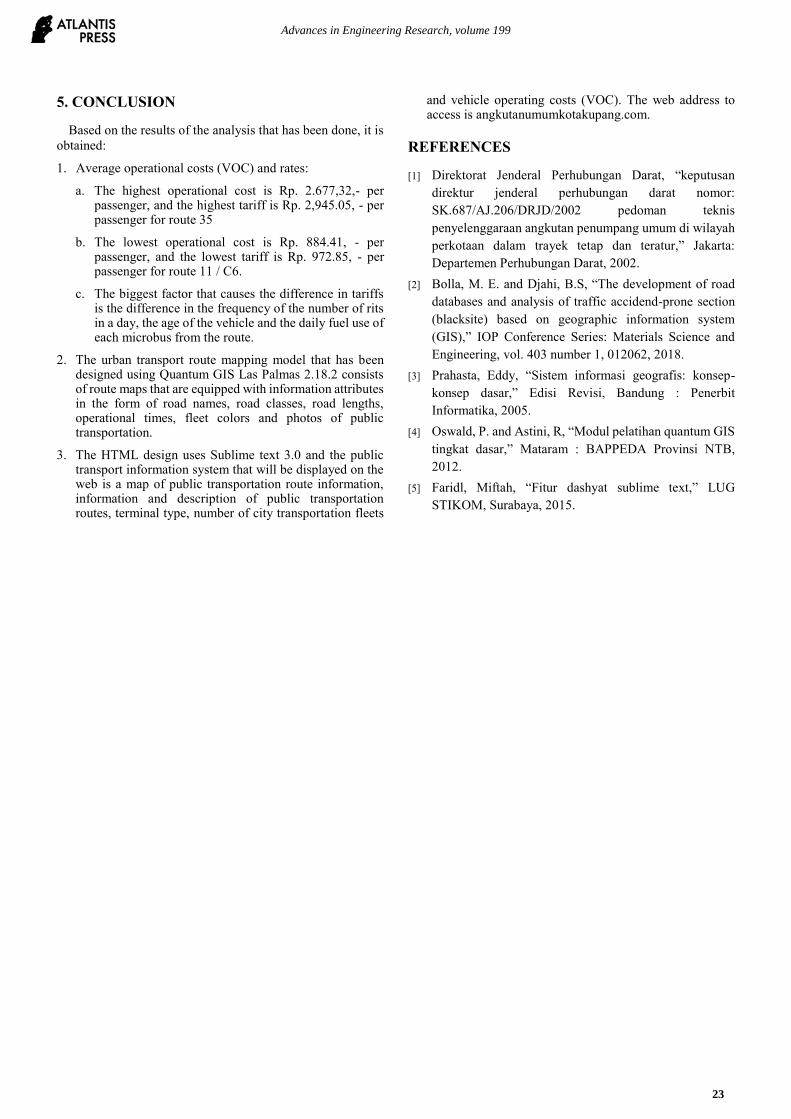
3. RESEARCH METHODS
Flowchart is a method of analytical technique used to
describe number of aspects on the information system in a
clear, concise and logical manner. The flow chart in this study
can be seen in Figure 3.
Advances in Engineering Research, volume 199
18

Fig. 3. Flowchart of the study
4. ANALYSIS AND DISCUSSION
The public transportation operated in Kupang City area
serves 15 (fifteen) routes symbolized by numbers, namely
routes 1, 2, 3, 5, 6, 7, 10, 11, 16, 17, 18, 20, 24, 27 and routes
35. These 15 routes serve transit among 3 terminals, those are
Kupang terminal, Belo terminal and Oebobo terminal.
4.1. Vehicle Operating Cost Analysis
Example of VOC analysis is on 1 (one) fleet with the route
code 1 and route code 16.
1. Vehicle characteristics
a. Type ST is for 150 FUTURA SUZUKI brand, as well
as for microbuses
b. The maximum passenger capacity based on the
fact in the field is 14 person (not included the driver
and conductor)
c. The capacity of engine oil, garden oil, and
transmission oil of these Microbuses are 4 liters, 1
liter and 1 liter respectively.
2. Production per microbus
a. Km/ route for route 1 is 23.3 Km and 17.4 Km is
for route 16 according to the actual route, but
because the two routes do route deviations then they
are analyzed based on field conditions that is 18
Km.
b. The frequency of the number of rits in a day are
12 times (24 trips) (interview results)
c. Mileage/ day = 18 x 12 = 216 Mileage/ day
d. Day of operation / month This microbus is fully operated in one month,
which is 30 days.
e. Mileage/ month = 216 x 30 = 6,480 Mileage/
month
f. Mileage/ year = 6,480 x 12 = 77,760 Mileage/ year
3. Microbus price calculation. From the survey results, the
following data are shown:
a. The year of vehicle production is 2000
b. The condition of the vehicle when purchased is a used vehicle
c. The year of vehicle purchase was in 2005
d. The price of the vehicle at the time of purchase was
Rp. 85.000.000,-
e. The interest rate used is 16.78% (based on the microbased base rate of PT. Bank Sinarmas Tbk, April 2018)
f. The economic value of the vehicle is assumed to
be 30 years
Thus, the value of vehicle depreciation for 2017 is:
= 12
30(85.000.000 − (20%𝑥85.000.000))
= Rp. 27.200.000,-
Advances in Engineering Research, volume 199
19
Therefore, book value in 2017 was
BV = 85.000.000 – 27.200.000 = Rp. 57.800.000,-
while the book value on 2000 was:
BV = I – ( 𝑡
𝑁(𝐼 − 𝑆))
= 85.000.000 – (5
30(85.000.000 − 17.000.000))
= Rp.96.333.333,33,-
4. Costs per microbus per km The items calculated are direct and indirect costs. Direct
costs are costs directly related to the production of services produced and the indirect cost component incurred by the operator is a route permit, while the other indirect component costs are not carried out by the operator. Here are the results of calculations for direct and indirect costs, as seen at Table II.
Table II. Recapitulation of Direct and Indirect Cost per
Microbus-Km
Direct Cost
Cost of depreciation Rp. 118,93/microbus-Km
Capital Interest Rp. 87,31/microbus-Km
Sallary and wage Microbus
crew (driver and conductor) Rp. 259,26/microbus-Km
Fuel oil Rp. 694,44/microbus-Km
Tires Rp. 21,09/microbus-Km
Small service Rp. 80,38microbus-Km
Large Service Rp. 11,97/microbus-Km
Overhaul Rp. 111,50/microbus-Km
Oil addition Rp. 6,68/microbus-Km
Parts and body Rp. 61,94/microbus-Km
Wash the bus Rp. 0/microbus-Km
Terminal retribution Rp. 23,15/microbus-Km
Vehicle tax Rp. 8,36/microbus-Km
KIR Rp. 2,06/microbus-Km
Insurance Vehicle Rp. 30,97/microbus-Km
SUM Rp. 1.518,04/microbus-
Km
Indirect Cost
Route permission Rp. 0,64/microbus-Km
5. Cost of per passenger-Km Cost of principal = 1.518,04 + 0,64
= Rp. 1.518,68/ microbus-Km
Thus, the basic cost per passenger-Km is:
Base cost per passenger-Km = 1.518,68
14
= Rp. 108,48/psg-Km
4.2. Analysis of Transportation Rates for Route
Code 1 and Route Code 16
Use Basic Tariff = 1.518,68/(70% x 14)
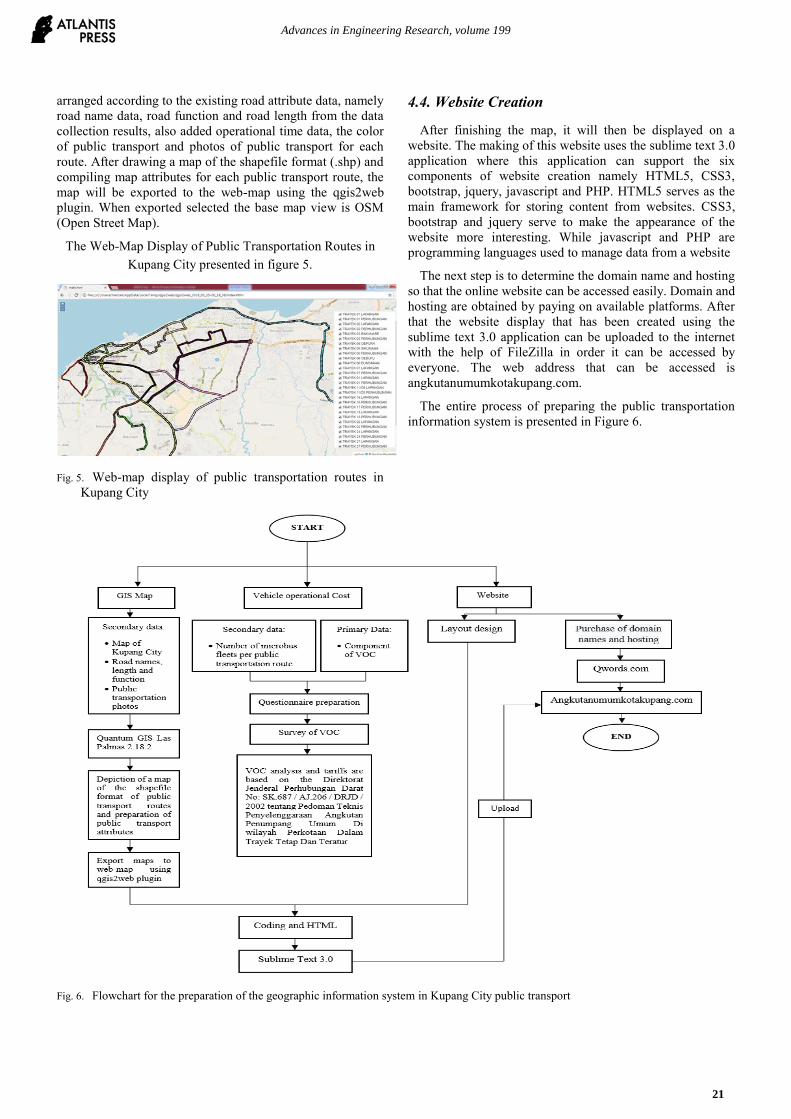
= Rp. 154,97/passenger-Km BEP rate = 154,97 x 9 Km = Rp. 1.394,71/ passenger Tariff = 1.394,71+ 10% BEP Rates = Rp. 1.534,18/ passenger Based on the survey results, it reveals that there are 5 fleets
serving routes 1 and 16, so from the results of the tariff analysis for each vehicle the VOC is obtained and the average tariff is as follows:
a) Average Vehicle Operating Costs Average VOC
= 1.394,71+1.638,25+1.557,07+1.702,62+1.847,99
5
= Rp. 1.628,13/Passenger
b) Average operating rates Average Tariff
= 1.534,18+1.802,08+1.712,78+1.872,88+2.032,79
5
= Rp. 1.790,94/passenger
The recapitulation of the tariff calculation is based on the
VOC analysis and the difference between the official rates is
presented in Figure 4.
Fig. 4. The recapitulation of the tariff calculation is based on the
VOC analysis and the difference between the official rates
4.3. Results of GIS-based Spatial Data Compilation
(Geographic Information System)
After data collection, SIG data is based on spatial data
collection. The compilation of GIS-based spatial data was
carried out to delineate maps of public transport routes in the
city of Kupang and the need to compile public transport data
information displayed in WebGIS. The shapefile format map
used is a vector data map, consisting of the Kupang city’s road
network (line), and public facility points that are passed
through (points) to assist in drawing maps. The depiction of a
map of the shapefile format of public transport routes, each
route is marked with a different color and its attributes are
Advances in Engineering Research, volume 199
20
arranged according to the existing road attribute data, namely
road name data, road function and road length from the data
collection results, also added operational time data, the color
of public transport and photos of public transport for each
route. After drawing a map of the shapefile format (.shp) and
compiling map attributes for each public transport route, the
map will be exported to the web-map using the qgis2web
plugin. When exported selected the base map view is OSM
(Open Street Map).
The Web-Map Display of Public Transportation Routes in
Kupang City presented in figure 5.
Fig. 5. Web-map display of public transportation routes in
Kupang City
4.4. Website Creation
After finishing the map, it will then be displayed on a
website. The making of this website uses the sublime text 3.0
application where this application can support the six
components of website creation namely HTML5, CSS3,
bootstrap, jquery, javascript and PHP. HTML5 serves as the
main framework for storing content from websites. CSS3,
bootstrap and jquery serve to make the appearance of the
website more interesting. While javascript and PHP are
programming languages used to manage data from a website
The next step is to determine the domain name and hosting
so that the online website can be accessed easily. Domain and
hosting are obtained by paying on available platforms. After
that the website display that has been created using the
sublime text 3.0 application can be uploaded to the internet
with the help of FileZilla in order it can be accessed by
everyone. The web address that can be accessed is
angkutanumumkotakupang.com.
The entire process of preparing the public transportation
information system is presented in Figure 6.
Fig. 6. Flowchart for the preparation of the geographic information system in Kupang City public transport
Advances in Engineering Research, volume 199
21

Following are the display of information on the web:
4.4.1. Display Home on the Web
This is the main page on WEB GIS Kupang Public
Transport. This page aims to display the introduction of the
Web itself. The display home can be seen in Figure 7.
Fig. 7. Display home on the web
4.4.2. Display of Abstract Pages
It displays abstracts which aims to describe the background
of making this website. The display of abstract pages can be
seen in Figure 8.
Fig. 8. Display of abstract pages
4.4.3 Map Display Page
A map of Kupang City along with the public transport route
layer is displayed. The map displays page as can be seen in
Figure 9.
Fig. 9. Map display page
4.4.4. Display of Route Description Pages
On these pages, lane routes will be displayed by each good
route officially issued by the Transportation Agency and
routes that experience irregularities in the field. The display of
route description pages can be seen in Figure 10.
Fig. 10. Display of route description pages
4.4.5. Fleet Page Views
It will contain information about the fleet that serves each
route. The display of fleet page views can be seen in Figure
11.
Fig. 11. Fleet page views
4.4.6. VOC Page Views
It contains information about vehicle operating cost rates.
The display of VOC page views can be seen in Figure 12.
Fig. 12. VOC Page Views
Advances in Engineering Research, volume 199
22
5. CONCLUSION
Based on the results of the analysis that has been done, it is
obtained:
1. Average operational costs (VOC) and rates:
a. The highest operational cost is Rp. 2.677,32,- per passenger, and the highest tariff is Rp. 2,945.05, - per passenger for route 35
b. The lowest operational cost is Rp. 884.41, - per passenger, and the lowest tariff is Rp. 972.85, - per passenger for route 11 / C6.
c. The biggest factor that causes the difference in tariffs is the difference in the frequency of the number of rits in a day, the age of the vehicle and the daily fuel use of each microbus from the route.
2. The urban transport route mapping model that has been designed using Quantum GIS Las Palmas 2.18.2 consists of route maps that are equipped with information attributes in the form of road names, road classes, road lengths, operational times, fleet colors and photos of public transportation.
3. The HTML design uses Sublime text 3.0 and the public transport information system that will be displayed on the web is a map of public transportation route information, information and description of public transportation routes, terminal type, number of city transportation fleets
and vehicle operating costs (VOC). The web address to access is angkutanumumkotakupang.com.
REFERENCES
[1] Direktorat Jenderal Perhubungan Darat, “keputusan
direktur jenderal perhubungan darat nomor:
SK.687/AJ.206/DRJD/2002 pedoman teknis
penyelenggaraan angkutan penumpang umum di wilayah
perkotaan dalam trayek tetap dan teratur,” Jakarta:
Departemen Perhubungan Darat, 2002.
[2] Bolla, M. E. and Djahi, B.S, “The development of road
databases and analysis of traffic accidend-prone section
(blacksite) based on geographic information system
(GIS),” IOP Conference Series: Materials Science and
Engineering, vol. 403 number 1, 012062, 2018.
[3] Prahasta, Eddy, “Sistem informasi geografis: konsep-
konsep dasar,” Edisi Revisi, Bandung : Penerbit
Informatika, 2005.
[4] Oswald, P. and Astini, R, “Modul pelatihan quantum GIS
tingkat dasar,” Mataram : BAPPEDA Provinsi NTB,
2012.
[5] Faridl, Miftah, “Fitur dashyat sublime text,” LUG
STIKOM, Surabaya, 2015.
Advances in Engineering Research, volume 199
23