the all-volunteer military: issues and performance july 2007
TRANSCRIPT

7/30/2019 The All-Volunteer Military: Issues and Performance July 2007
http://slidepdf.com/reader/full/the-all-volunteer-military-issues-and-performance-july-2007 1/49
JULY 2007
The All-VolunteerMilitary:
Issues and Performance
CONGRESS OF THE UNITED STATES
CONGRESSIONAL BUDGET OFFICE
A
S T U D Y
CBO

7/30/2019 The All-Volunteer Military: Issues and Performance July 2007
http://slidepdf.com/reader/full/the-all-volunteer-military-issues-and-performance-july-2007 2/49
Pub. No. 2960

7/30/2019 The All-Volunteer Military: Issues and Performance July 2007
http://slidepdf.com/reader/full/the-all-volunteer-military-issues-and-performance-july-2007 3/49
The Congress of the United States O Congressional Budget Office
CBO
The All-Volunteer Military:Issues and Performance
July 2007
A
S T U D Y

7/30/2019 The All-Volunteer Military: Issues and Performance July 2007
http://slidepdf.com/reader/full/the-all-volunteer-military-issues-and-performance-july-2007 4/49
Notes
In general, the years referred to in this study are federal fiscal years, unless otherwise
indicated. In the section on the history of conscription, however, the years referred to
are calendar years.
Numbers in the text and tables may not add up to totals because of rounding.
The cover photo shows marines preparing for a firing drill at Marine Corps Base Hawaii,Kaneohe Bay, in 2005. (Photo by Lance Corporal Roger L. Nelson.)
7/30/2019 The All-Volunteer Military: Issues and Performance July 2007
http://slidepdf.com/reader/full/the-all-volunteer-military-issues-and-performance-july-2007 5/49
Preface
The U.S. military is currently engaged in its largest and longest operations since the Viet-
nam War. The deployments associated with those operations have raised concerns about the
armed forces’ ability to recruit and retain the personnel they need to carry out those missions.
Some observers have also voiced concern that not all segments of U.S. society are fully partic-
ipating in the fighting. To increase the size of the military and to ensure that it broadly repre-
sents the populace, some people have suggested reinstating a military draft.
This Congressional Budget Office (CBO) study—prepared at the request of the Chairman of
the Defense Subcommittee of the House Committee on Appropriations—considers some of the arguments made for and against the draft before or since it was replaced by the all-
volunteer force (AVF) in 1973. The study also reviews some performance trends of the AVF
since its inception and discusses possible effects of returning to a draft. In keeping with CBO’s
mandate to provide objective, impartial analysis, this study makes no recommendations.
Heidi Golding and Adebayo Adedeji of CBO’s National Security Division wrote the report
under the supervision of J. Michael Gilmore and Matthew S. Goldberg. Cary Elliott (formerly
of CBO), Matthew Schmit, Victoria Liu, and Jason Wheelock contributed to the analysis.
Ralph Smith, Mark Hadley, Arlene Holen, Sarah Jennings, and Donald Marron of CBO
provided helpful comments, as did Robert L. Goldich and Paul F. Hogan. (The assistance of
those external reviewers implies no responsibility for the final product, which rests solely with
CBO.)
Christian Howlett edited the study; Loretta Lettner and Christine Bogusz proofread it. Cindy
Cleveland produced drafts of the manuscript and the tables. Maureen Costantino prepared
the report for publication and designed the cover. Lenny Skutnik printed the initial copies,
Linda Schimmel coordinated the print distribution, and Simone Thomas prepared the elec-
tronic version for CBO’s Web site (www.cbo.gov).
Peter R. Orszag Director
July 2007

7/30/2019 The All-Volunteer Military: Issues and Performance July 2007
http://slidepdf.com/reader/full/the-all-volunteer-military-issues-and-performance-july-2007 6/49

7/30/2019 The All-Volunteer Military: Issues and Performance July 2007
http://slidepdf.com/reader/full/the-all-volunteer-military-issues-and-performance-july-2007 7/49
Contents
Summary vii
Introduction 1
History of Conscription 2
How Many Were Drafted? 3
Who Was Drafted? 3
The Lifting of the Draft 5
Some Arguments For and Against the Draft and the
All-Volunteer Force6
Military Effectiveness 6
The Cost of the Armed Forces and Economic Efficiency 8
Fairness and Sociopolitical Considerations 9
Personnel in Today’s All-Volunteer Military 12
The Cost of the Armed Forces 12
Quality and Effectiveness of the Force 13
Force Composition and Equity 19
Some Implications of Reinstating the Draft 31
Size of the Draft and Effects on Personnel Structure 31
Budgetary Costs and Savings and Levels of Military Pay 34
Effective Time for Draftees to Be Available for Deployment 36
Equity Considerations 36
Tables
1. Scoring Categories for the Armed Forces Qualification Test 15
2. Racial and Ethnic Composition of Active-Duty Military Personnel and U.S. Civilians 21
3. Effects of Voluntary and Draft Accessions on FutureEnd Strength in the Active Army’s Enlisted Force 33

7/30/2019 The All-Volunteer Military: Issues and Performance July 2007
http://slidepdf.com/reader/full/the-all-volunteer-military-issues-and-performance-july-2007 8/49
VI THE ALL-VOLUNTEER MILITARY: ISSUES AND PERFORMANCE
Figures
1. End Strength of the Active-Duty Military Under theDraft and the All-Volunteer Force, 1940 to 2006 2
2. Annual Number of Draftees and the Military’sTotal Accession Requirements, 1940 to 2006 4
3. Percentage of Non-Prior-Service Recruits and Young Civilians with High School Diplomas,1973 to 2006 14
4. Distribution of AFQT Scores for Non-Prior-ServiceRecruits and Young Civilians Under the Draft and the All-Volunteer Force 16
5. Distribution of AFQT Scores for Non-Prior-ServiceRecruits in the All-Volunteer Force, by
Scoring Category, 1973 to 2006 17
6. Percentage of Non-Prior-Service Recruits ConsideredHigh Quality by the Military, 1973 to 2006 18
7. Percentage of Black Personnel in the ActiveEnlisted Force, by Service, 1973 to 2006 22
8. Percentage of Hispanic Personnel in the ActiveEnlisted Force, by Service, 1973 to 2006 23
9. Racial and Ethnic Representation in Military Occupational Specialties, Deployments, and
Fatalities Among Active-Duty Personnel 25
10. Racial and Ethnic Representation in Deployments andFatalities Among Reserve Personnel 26
11. Changes in the Geographic Representation of Recruits Since 1980 28
12. Distribution of Active-Duty Enlisted Personnel, by Family Income Prior to Military Service 30

7/30/2019 The All-Volunteer Military: Issues and Performance July 2007
http://slidepdf.com/reader/full/the-all-volunteer-military-issues-and-performance-july-2007 9/49
Summary
Since the terrorist attacks of September 11, 2001,military operations in Afghanistan and Iraq have requiredsubstantial increases in the number of U.S. service mem-bers deployed and the frequency with which units aresent overseas. Through December 2006, over 1 million
active-duty personnel and 400,000 reserve personnel hadbeen deployed to those theaters. To maintain the forcesnecessary to conduct those operations, the military mustbe able to recruit significant numbers of volunteers—infiscal year 2006, its target was almost 200,000 active-duty recruits. However, all three components of the Army (theactive Army, the Army National Guard, and the Army Reserve) have had trouble achieving their recruiting goalsin one or more recent years, although they were able tomeet or nearly meet their targets for 2006. Those deploy-ments and recruiting problems have raised the following concerns among decisionmakers, military analysts, and
other observers:
B That the armed forces will not have enough troopsavailable to accomplish their missions,
B That military personnel and their families are experi-encing significant hardships that the rest of the U.S.population is not sharing, or
B That less-affluent people are more likely than othergroups to serve in those operations.
Although the Department of Defense (DoD) has statedits commitment to maintaining the current all-volunteerforce (AVF), others have questioned the viability of sucha force in light of the current strains on the military.Some observers have called for reinstituting a military draft as a way to alleviate those strains and to spread thedemands of war more evenly throughout society.
To shed light on the current discussion, this study by theCongressional Budget Office (CBO) examines various
issues surrounding the choice between a draft system andan all-volunteer force. It describes the history of conscrip-tion in the United States and reviews some of the argu-ments made for and against the draft, either now or sincethe draft was last used, during the Vietnam War. The
analysis also looks at trends in the AVF since its inceptionin 1973—particularly the quality of recruits and the aver-age experience level and demographic composition of theforce—to see whether predictions about a volunteer mili-tary have proved true.1 The study concludes by discuss-ing the logistics of implementing a new draft system, thepotential effects on the structure of the armed forces, andother considerations.
Possible Pros and Cons of a Draft and Lessons from the All-Volunteer ForceMany of the arguments heard today for or against a draft were articulated earlier, especially in the Vietnam era. Insome people’s view, the most powerful arguments centeron the roles of the government and the armed forces andon the rights and responsibilities of U.S. citizens. One of the primary rationales for the draft can be put simply:Service in defense of the country is a fundamentalresponsibility of citizenship. Citizens enjoy protectionsprovided by the government; in turn, the governmentmay require them to contribute to those protections.That view was articulated by such figures as George Washington and justices of the Supreme Court of 1918.Others, however, including President Ronald Reagan andeconomist Milton Friedman, have stated that a draft is atodds with fundamental democratic or moral principles.Some observers have equated it with involuntary
1. This study focuses on the active component of the military, partly because if a draft was reinstated under current law, no one wouldbe drafted into the reserves (as was also the case during the Viet-nam War). Data describing the draft force before 1973 refer only to the active component.

7/30/2019 The All-Volunteer Military: Issues and Performance July 2007
http://slidepdf.com/reader/full/the-all-volunteer-military-issues-and-performance-july-2007 10/49
VIII THE ALL-VOLUNTEER MILITARY: ISSUES AND PERFORMANCE
servitude. Those differences of opinion cannot beresolved through empirical study of the issue.
Other arguments focus on the potential consequences of using a draft or an all-volunteer force to procure military personnel. Specifically, observers have expressed concernsabout the military effectiveness, costs, economic effi-ciency, and social-justice implications of the two choices.
Effectiveness of the Armed ForcesThe military’s success in completing its missions restspartly on its ability to get and keep intelligent, capableindividuals while maintaining required force levels.Research has consistently linked high scores on the Armed Forces Qualification Test (AFQT) and length of time in the service to better performance of military jobs.
Whether recruits have earned a high school diploma helps predict whether they will complete their initial termof enlistment and thus affects the average experience levelof the force.
Critics of the AVF have raised questions about the likeli-hood that the military could attract enough volunteers inpeacetime and wartime to meet its requirements andabout the quality of those volunteers. They have arguedthat many people do not want to join the military andthat the quality of those who did join would be lower(because they would have fewer skills valuable in thecivilian sector) than the quality available through a draft.Proponents of the AVF have countered that historically,many people have volunteered for military service during both peace and war. They argue that others were discour-aged from serving during the draft era because military compensation was set at below-market levels.
Since the all-volunteer force began, the military hassometimes had trouble recruiting and retaining sufficientvolunteers in peacetime, and their quality has varied.However, the AVF has attracted a greater proportion of
recruits with high school diplomas or with AFQT scoresat or above the median than in the youth population as a whole or than the services obtained through the draftduring the Vietnam War. In 2006, 91 percent of recruits were high school graduates, compared with 80 percent of U.S. residents ages 18 to 24. Moreover, 69 percent of recruits scored at or above the 50th percentile (relative tothe overall U.S. youth population) on the qualificationtest. Experience levels in the military have also risen dur-ing the years of the AVF, as initial enlistment periods have
grown longer, on average, and retention rates haveincreased.
Costs and Economic Efficiency
Supporters have argued that a draft force costs less thanan AVF because the military can pay lower wages when itneed not try to attract volunteers. The higher personnelcosts of an AVF, they contend, could crowd out necessary long-term defense spending on weapons, infrastructure,and other items.
Other observers have argued, however, that the full costof a draft force is higher than the budgetary costs. Ineffect, the draft imposed an in-kind tax on inductees inthat the compensation they received was lower than mar-ket wages and generally lower than what they would have
required to enlist voluntarily.2
Those costs—as well asany expenses incurred from people’s efforts to avoid thedraft—would have to be added to budgetary costs to cal-culate the full cost of military personnel under a draft sys-tem. According to proponents of the AVF, the full cost isgreater with a draft than with a volunteer force. AVF sup-porters have also argued that because military personnelappear less expensive in a draft force than their true cost,conscripts are substituted for other resources—and thusare overused.
There is evidence that budgetary costs have been higher
under the AVF than under the Vietnam-era draft system.For example, basic pay for less-experienced service mem-bers nearly doubled between 1971 (two years before the AVF began) and 1975 (two years after), adjusted forinflation. A report by the former General Accounting Office estimated that the move to an all-volunteer forceadded about $3 billion per year to the military’s costs in1974 dollars (more than $10 billion in 2006 dollars), orabout 11 percent of DoD’s spending on its manpowerbudget accounts in 1974.3 To CBO’s knowledge, nostudies have retrospectively examined the total economiccost of the draft. However, the extra $10 billion paid to
service members could also be considered a lower-boundestimate of the in-kind tax on draftees.
Representativeness of the Military Partly because combat entails a higher risk of injury anddeath than peacetime military service or most civilian
2. The same in-kind tax was imposed on people who volunteered fora particular branch of the service to avoid being drafted into a branch that was more likely to see ground combat.

7/30/2019 The All-Volunteer Military: Issues and Performance July 2007
http://slidepdf.com/reader/full/the-all-volunteer-military-issues-and-performance-july-2007 11/49
SUMMARY
employment does, the nation has grappled with the issueof who should fight its wars. Some people believe thatthe best way to assign that risk to members of society isthrough a draft system, which can compel citizens from
geographically, racially, and economically diverse back-grounds to serve in the military. Through the years, someproponents of the draft have stated that the AVF wouldcreate inequities because low-income people or racialminorities would be more likely to join the armed forcesthan other groups and thus would disproportionately bear the risks associated with military service. Supportersof the AVF have countered that the higher wages associ-ated with a volunteer force—as well as other factors, suchas patriotism and a sense of duty—would attract a broadset of volunteers. In that view, if concentrations of certaineconomic or racial groups did occur in the military, they
would result from the free choice of those individuals.
The current all-volunteer force is representative of society along many dimensions—although, partly because of theunique demands of military service, it is younger than thepopulation as a whole and has a smaller proportion of women. The typical recruit is about 18 years old, andnearly half of the active-duty force is between the ages of 17 and 24. By comparison, 17- to 24-year-olds make upless than one-fifth of civilians of prime working age. Women were barred from constituting more than 2 per-cent of the military until 1967 and continue to be
excluded from some occupations and assignments. They now make up 14 percent of the enlisted force, compared with 50 percent civilians ages 17 to 49.
Members of the armed forces are racially and ethnically diverse. Black service members represent the largestminority group in the military. Although their percentagehas varied during the years of the AVF, they composed13 percent of active-duty enlisted recruits in 2005 and19 percent of the entire active-duty enlisted force in2006, compared with 14 percent of the 17- to 49-year-
old U.S. population.4 Hispanics, by contrast, are lessthan proportionally represented in the military. In 2006,they constituted 11 percent of the enlisted force, versus14 percent of civilians ages 17 to 49.
To explore whether those groups bear a disproportionateshare of combat and fatalities, CBO investigated theracial and ethnic makeup of combat occupations in themilitary, of deployments in support of operations in Iraqand Afghanistan, and of fatalities associated with thoseoperations. CBO found that white service members havea higher representation in combat occupations (75 per-cent) than in the force as a whole (68 percent), whereasblack service members have a lower representation inthose occupations (13 percent) than in the overall force(19 percent).5 The racial and ethnic representation of
personnel deployed to Iraq and Afghanistan was similarto that of the overall enlisted force, as of December 2006.Data on fatalities indicate that minorities are not being killed in those operations at greater rates than their repre-sentation in the force. Rather, fatalities of white servicemembers have been higher than their representation inthe force (76 percent of deaths in those two theatersthrough December 2006).
The socioeconomic backgrounds of service members havebeen less well documented than other characteristicsbecause data on the household income of recruits before
they joined the military are sparse. CBO’s review of previ-ous studies and some new tabulations suggest that peoplefrom all income groups are represented in the armedforces.6 However, CBO’s analysis of data from 2000 indi-cate that youths from the very highest and lowest incomefamilies may be somewhat less likely to serve in theenlisted ranks than other groups are.
Implementation IssuesThe policies used to implement a draft or an all-volunteerforce largely determine whether either system will provide
3. General Accounting Office (now the Government Accountability Office), Additional Costs of the All-Volunteer Force , FPCD-78-11(February 1978). The way to measure the additional budgetary cost attributable to an AVF is subject to debate. At one extreme,some analysts might attribute any changes in personnel costs since1973 to the AVF because those costs would not have to be paidunder a system of conscription. At the other extreme, analystsmight argue that a draft system should pay market wages and thatthe cost of doing so should not be ascribed to the AVF. The Gen-eral Accounting Office’s study attributed the alignment of military pay with market wages to the inception of the AVF.
4. The percentage of black enlisted personnel has consistently beenhigher in the Army than in the other services. In 2006, black sol-diers made up 29 percent of the Army’s enlisted force.
5. Both the white and nonwhite proportions in the force may beunderstated by a few percentage points because the race of about6 percent of service members is unknown.
6. Those studies all focus on enlisted personnel. None of the studiesexamine the socioeconomic backgrounds of people who join theofficer corps, apparently because of data limitations.

7/30/2019 The All-Volunteer Military: Issues and Performance July 2007
http://slidepdf.com/reader/full/the-all-volunteer-military-issues-and-performance-july-2007 12/49
X THE ALL-VOLUNTEER MILITARY: ISSUES AND PERFORMANCE
well-qualified recruits who are representative of thenation’s youth. Those policies include medical, moral,and quality standards for new service members and com-pensation levels for the entire force. Under a draft system,
the rules guiding who is inducted and how (for example,through a random lottery or through local draft boardsand a system of exemptions) also influence the effective-ness and quality of the force.
A draft today could—and most likely would—look very different from that of the Vietnam era. Under the currentlaw governing selective service (the Military Selective Ser-vice Act of 1940, as amended), a new draft would be con-ducted by random lottery, a system that was not adopteduntil later in the Vietnam War. However, a draft wouldhave trouble producing a force with the same level of
experience as a volunteer force. People would probably bedrafted for a shorter period than the four- to six-year obli-gation typical in the AVF, and most draftees would belikely to leave after their initial obligation. The demo-graphics of a draft force, except for age, might be similarto those of the current force, depending on the rules usedto implement the draft.
To illustrate possible changes in the structure of thearmed forces, CBO calculated the accessions and contin-uation rates that would allow the active Army to achieveits desired size of 547,400 personnel by 2012 under
either an all-volunteer force or a mix of volunteers andconscripts.7 (That end-strength goal for 2012 was laidout in DoD’s 2008 Future Years Defense Program.)8 The Army had 73,400 accessions in 2005 and 80,000 in
2006. Continuation rates were 82.4 percent for the active Army as a whole in 2005 and 84.5 percent in 2006. If future continuation rates dropped to a mix of the 2005and 2006 levels, the Army would need between 86,000
and 90,000 volunteers each year to meet its end-strengthgoal. If, at the same time, annual accessions dropped toabout 74,000 (roughly the 2005 level), the Army wouldfall almost 50,000 people short of its end-strength objec-tive in 2012. It could meet that goal by drafting up to27,000 recruits per year to supplement the 74,000 volun-teers. However, that approach would require 14,000more annual accessions than under an AVF and wouldreduce the average experience level of the force. Furtherreductions in volunteers—and consequently a greaterreliance on draftees—would increase the total number of accessions required each year and decrease the average
length of service.
Depending on how a draft was implemented, it couldeither allow or require other changes in the way the mili-tary operates. One example is the length of deployments.If all of the Army’s combat occupations were at leastpartly filled with draftees serving two-year tours of duty (the obligation specified in the Military Selective Service Act), some of those inductees would be available only fordeployments of less than a year because their training time would exceed 12 months, CBO estimates. That would exacerbate problems for the Army, which recently
lengthened the typical deployment from 12 months to15 months. The Army would have to either permitshorter deployments or reduce the training time in thoseoccupations. Implementing a draft might allow for moreflexibility in compensation, however. Because the draft would be compulsory, DoD might be able to reduce itsbudgetary costs by paying less, at least to first-term per-sonnel. Finally, the percentage of women in the forcemight change under a draft. As currently written, theMilitary Selective Service Act excludes women frombeing drafted, although they could continue to volunteer.
If lawmakers wanted a new draft to cover women as wellas men, they would have to amend that law.
7. Accessions are recruits who sign contracts with the military andreport to basic training. Continuation rates measure the propor-tion of service members who remain in the military over a specificperiod regardless of the expiration of their contracts. For detailsof the methodology that CBO used, see Congressional BudgetOffice, Recruiting, Retention, and Future Levels of Military Person-nel (October 2006).
8. End strength is the number of personnel on active duty on the lastday of the fiscal year.

7/30/2019 The All-Volunteer Military: Issues and Performance July 2007
http://slidepdf.com/reader/full/the-all-volunteer-military-issues-and-performance-july-2007 13/49
The All-Volunteer Military:
Issues and Performance
Introduction With the ongoing operations in Iraq and Afghanistan, thenumber of U.S. military personnel deployed overseas has
risen substantially in recent years. More than 1 millionactive-duty personnel had been sent to those theatersthrough December 2006, with the bulk coming from the Army and Marine Corps. More than half of the current Army has deployed in support of those operations at leastonce, and 15 percent has deployed to those theaters twiceor more. Combat tours in the Army, which had typically lasted for one year for those missions, were recently extended to 15 months.1
In addition to active-duty troops, reserve personnel havebeen mobilized in large numbers—a total of 580,000
reservists had been mobilized through March 2007. Of those, more than 410,000 reservists had deployed tocombat operations through December 2006. Before thefirst Gulf War in the early 1990s, reservists spent an aver-age of one day per year on active duty in support of exer-cises and operations.2 In the years before the terroristattacks of September 11, 2001, that measure rose toabout 14 days; since 2003, it has grown to more than70 days per year, on average.
The services’ ability to maintain their force levels in com-bat operations depends partly on their success in attract-
ing volunteers. In fiscal year 2006, the active componentsof the military anticipated a need for almost 200,000recruits. Although the active Army was able to achieve itsrecruiting goal in 2006, and the Army National Guardand Reserve came within 3 percent of their combined
goal, all three components of the Army have had troublemeeting their recruiting targets in one or more recentyears.3 Several factors have apparently contributed to
those difficulties: the number of active Army and Army Reserve recruiters fell in 2003 and most of 2004, withonly a partial improvement in 2005; recruiting goals inthe active Army and National Guard were raised in 2005to the highest levels of the decade; potential recruits’ civil-ian opportunities improved as the unemployment rate fellfrom its most recent peak; and the operations in Afghani-stan and Iraq have increased service members’ risk of injury and death.
Recruiting problems contributed to a 3 percent decline inthe total number of Army personnel in 2005, despite the
continuing need for service members in theaters of com-bat. Army recruiting recovered in 2006 as the service’svarious components either met or approached theirnumerical goals, but partly because some aspects of mini-mum entry qualifications for recruits were lowered. (TheMarine Corps, by contrast, has met its recruiting targetsand kept its number of personnel at or above authorizedlevels every year in this decade.)
The prolonged combat in Iraq and Afghanistan, com-bined with difficulties in Army recruiting, has raised con-
cerns among decisionmakers, military analysts, and oth-ers that not enough troops will be available to accomplishthe military’s missions; that service members and theirfamilies are experiencing continued, significant hardshipsnot shared by the rest of the U.S. population; and thatless-affluent people are more likely to be serving in thoseoperations than other groups are.1. Combat tours in the Marine Corps for those missions usually last
for seven months.
2. That measure does not include days spent on active duty for train-ing exercises or drilling.
3. See Congressional Budget Office, Recruiting, Retention, and Future Levels of Military Personnel (October 2006).

7/30/2019 The All-Volunteer Military: Issues and Performance July 2007
http://slidepdf.com/reader/full/the-all-volunteer-military-issues-and-performance-july-2007 14/49
2 THE ALL-VOLUNTEER MILITARY: ISSUES AND PERFORMANCE
Figure 1.
End Strength of the Active-Duty Military Under the Draft and the All-Volunteer Force, 1940 to 2006
(Millions of personnel)
Source: Congressional Budget Office based on Department of Defense, Office of the Under Secretary of Defense (Comptroller), National
Defense Budget Estimates for FY 2007 (March 2006), available at www.dod.mil/comptroller/defbudget/fy2007/fy2007_greenbook.
pdf; and Department of Defense, Statistical Information Analysis Division, “Military Personnel Statistics,” available at http://
siadapp.dmdc.osd.mil/personnel/MILITARY/Miltop.htm.
Note: End strength is the number of personnel on active duty on the last day of the fiscal year.
a. Authority for the draft expired in 1947 but was reinstated the following year.
The military has stated its commitment to maintaining
the all-volunteer force (AVF), which was reinstated in1973. But some people have questioned the viability of a volunteer force in light of the problems facing the mili-tary. Others have called for bringing back a military draftas a way to ease the strains on the armed forces and tospread the demands of war more evenly throughoutsociety.
This study reviews the history of U.S. military drafts anddescribes the main arguments about the draft made today or since the Vietnam era. The analysis also looks at trendsin the quality, composition, and cost of the AVF since1973 to assess whether experience bears out the predic-tions made for a volunteer force. Finally, the study dis-cusses the logistics of reinstating a draft, the potentialimpact on the structure of the armed forces, and otherconsiderations.
History of ConscriptionFor most of its history, the United States has maintainedan all-volunteer military.4 At times, however—mainly
during conflicts that required large numbers of people to
fight—the nation has relied on a draft to provide soldiers.Men were conscripted during the Revolutionary War (forstate militias), the Civil War (on both the Union and
Confederate sides), World Wars I and II, the Korean War, and the Vietnam War.
Drafts have also existed in the United States during
peacetime. The first was enacted in late 1940 after Ger-
many invaded France and the Low Countries. The draftcontinued after World War II until the Korean War, with
1940 1944 1948 1952 1956 1960 1964 1968 1972 1976 1980 1984 1988 1992 1996 2000 2004
0
2
4
6
8
10
12
14
Draft Forcea All-Volunteer Force
4. The information in this section comes mainly from Richard V.L.Cooper, Military Manpower and the All-Volunteer Force, R-1450-
ARPA (Santa Monica, Calif.: RAND Corporation, 1977); GeorgeFlynn, The Draft, 1940 –1973 (Lawrence, Kansas: University Pressof Kansas, 1993); Gus Lee and Geoffrey Parker, Ending the Draft—The Story of the All Volunteer Force (Alexandria, Va.:Human Resources Research Organization, April 1977); Presi-dent’s Commission on an All-Volunteer Armed Force, Report of the President’s Commission on an All-Volunteer Armed Force, Chap-ter 13 (February 1970); and Bernard Rostker, I Want You! The Evolution of the All-Volunteer Force (Santa Monica, Calif.: RANDCorporation, 2006).
7/30/2019 The All-Volunteer Military: Issues and Performance July 2007
http://slidepdf.com/reader/full/the-all-volunteer-military-issues-and-performance-july-2007 15/49
THE ALL-VOLUNTEER MILITARY: ISSUES AND PERFORMANCE
a one-year interruption.5 The longest peacetime draft,
however, was the one between the Korean and Vietnam
Wars, when the threat from the Soviet Union prompted
the United States to raise the largest peacetime force in its
history. During that period, 1953 to 1964, total endstrength in the military averaged 2.8 million officers and
enlisted personnel (see Figure 1). That force was roughly
10 times the average size of the military in the 1920s and
1930s and about twice the size of the current force.6
How Many Were Drafted?Even when drafts existed, the U.S. military relied on a mix of conscripts and volunteers. Most men in the Civil
War, for example, volunteered for service. Of the 2 mil-
lion to 3 million men who were called to serve or did
serve in the Union Army, only about 50,000 were con-
scripts. In World War I, by contrast, about 30 percent of
U.S. service members were volunteers; the rest were
drafted. (Voluntary enlistments were halted in 1917 “so
as not to disrupt the orderly flow of individuals throughthe draft system.”)7 That draft, though large, was by no
means universal: The 2.8 million draftees in World War I
represented slightly more than 10 percent of the pool of men ages 18 to 45 who had registered for the draft. In
World War II, two-thirds of U.S. forces were draftees.
They totaled about 10.1 million of the 45 million men
registered.8 (In December 1942, voluntary enlistments
were largely stopped again.)
Numbers of draftees were much smaller in later conflicts. About 1.5 million men were drafted between June 1950
and July 1953 for the Korean War, and 1.9 million were
drafted between August 1964 and March 1973 for theVietnam War.9
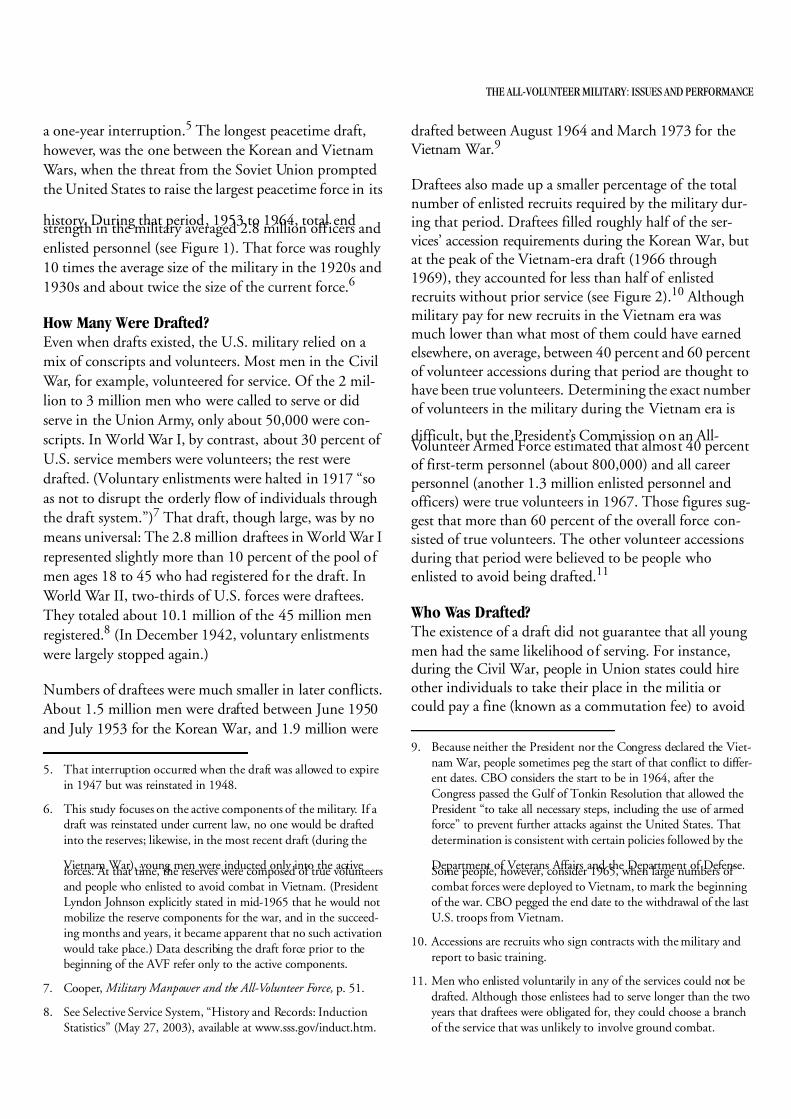
Draftees also made up a smaller percentage of the totalnumber of enlisted recruits required by the military dur-ing that period. Draftees filled roughly half of the ser-vices’ accession requirements during the Korean War, butat the peak of the Vietnam-era draft (1966 through1969), they accounted for less than half of enlistedrecruits without prior service (see Figure 2).10 Althoughmilitary pay for new recruits in the Vietnam era wasmuch lower than what most of them could have earnedelsewhere, on average, between 40 percent and 60 percentof volunteer accessions during that period are thought tohave been true volunteers. Determining the exact numberof volunteers in the military during the Vietnam era is
difficult, but the President’s Commission on an All-Volunteer Armed Force estimated that almost 40 percentof first-term personnel (about 800,000) and all careerpersonnel (another 1.3 million enlisted personnel andofficers) were true volunteers in 1967. Those figures sug-gest that more than 60 percent of the overall force con-sisted of true volunteers. The other volunteer accessionsduring that period were believed to be people whoenlisted to avoid being drafted.11
Who Was Drafted?The existence of a draft did not guarantee that all young men had the same likelihood of serving. For instance,during the Civil War, people in Union states could hireother individuals to take their place in the militia orcould pay a fine (known as a commutation fee) to avoid
5. That interruption occurred when the draft was allowed to expirein 1947 but was reinstated in 1948.
6. This study focuses on the active components of the military. If a draft was reinstated under current law, no one would be draftedinto the reserves; likewise, in the most recent draft (during the
Vietnam War), young men were inducted only into the activeforces. At that time, the reserves were composed of true volunteersand people who enlisted to avoid combat in Vietnam. (PresidentLyndon Johnson explicitly stated in mid-1965 that he would notmobilize the reserve components for the war, and in the succeed-ing months and years, it became apparent that no such activation
would take place.) Data describing the draft force prior to thebeginning of the AVF refer only to the active components.
7. Cooper, Military Manpower and the All-Volunteer Force, p. 51.
8. See Selective Service System, “History and Records: InductionStatistics” (May 27, 2003), available at www.sss.gov/induct.htm.
9. Because neither the President nor the Congress declared the Viet-nam War, people sometimes peg the start of that conflict to differ-ent dates. CBO considers the start to be in 1964, after theCongress passed the Gulf of Tonkin Resolution that allowed thePresident “to take all necessary steps, including the use of armedforce” to prevent further attacks against the United States. Thatdetermination is consistent with certain policies followed by the
Department of Veterans Affairs and the Department of Defense.Some people, however, consider 1965, when large numbers of combat forces were deployed to Vietnam, to mark the beginning of the war. CBO pegged the end date to the withdrawal of the lastU.S. troops from Vietnam.
10. Accessions are recruits who sign contracts with the military andreport to basic training.
11. Men who enlisted voluntarily in any of the services could not bedrafted. Although those enlistees had to serve longer than the twoyears that draftees were obligated for, they could choose a branchof the service that was unlikely to involve ground combat.

7/30/2019 The All-Volunteer Military: Issues and Performance July 2007
http://slidepdf.com/reader/full/the-all-volunteer-military-issues-and-performance-july-2007 16/49
4 THE ALL-VOLUNTEER MILITARY: ISSUES AND PERFORMANCE
Figure 2.
Annual Number of Draftees and the Military’s Total Accession Requirements,1940 to 2006
(Millions of personnel)
Source: Congressional Budget Office based on Selective Service System, “History and Records: Induction Statistics” (May 27, 2003), avail-
able at www.sss.gov/induct.htm; and Department of Defense, Office of the Under Secretary of Defense for Personnel and Readiness,
Population Representation in the Military Services: Fiscal Year 2005 (2007), Table D-1, available at www.humrro.org/poprep/
poprep05.
Note: The number of personnel drafted annually was smaller during World War I than during World War II: 0.5 million in 1917 and
2.3 million in 1918.
a. Authority for the draft expired in 1947 but was reinstated the following year.
b. The Department of Defense’s estimate of how many accessions (recruits who sign contracts with the military and report to basic training)
are necessary in a given year to maintain specific force levels. The requirements shown here are for enlisted recruits without prior service.
service. By the end of the Civil War, almost 120,000 of
the soldiers who had served in the Union Army were sub-stitutes for draftees. Another 87,000 people avoided ser-
vice by paying the commutation fee of $300 (an amount
equal to more than half of the average annual family income at the time). Perceptions of unfairness about that
system led to criticism, protests, and violence, culminat-
ing in four days of draft riots in New York City in 1863,
which required 10,000 troops to restore order.
Selection policies in World War I eliminated some of theperceived inequities of the Civil War era. The practices of
hiring substitutes and paying commutation fees were
abolished. Nevertheless, lower-income and minority menmay still have been drafted disproportionately. Upon reg-
istering for the draft, people were placed into one of five
categories on the basis of their industrial importance.
Those in Class I were considered the primary “reservoir
of manpower, the drain of which for military duty would
least disturb domestic and economic life of the nation,” whereas men classified in the other groups were “deferredas long as possible.”12 Black men were more likely than white men to be categorized as Class I and, given that sta-tus, had a higher probability of being drafted. Althoughblack men made up slightly less than 10 percent of regis-trants, they constituted more than 13 percent of draftees.
The draft lapsed after World War I and was not reinstateduntil shortly before the United States entered World War
II. At the time, the public was split on whether to resumethe draft. Some opponents argued that draftees weremore likely to be men who were jobless or poorly paid. Itis not clear that the prediction held true, however. Draftdeferments were more limited during World War II thanthey had been earlier. Occupational deferments were
1940 1944 1948 1952 1956 1960 1964 1968 1972 1976 1980 1984 1988 1992 1996 2000 2004
0.0
0.5
1.0
1.5
2.0
2.5
3.0
3.5
Draft Forcea All-Volunteer Force
Number of
Draftees
Accession
Requirementsb
0
12. President’s Commission on an All-Volunteer Armed Force, Studies Prepared for the President’s Commission on an All-Volunteer Armed Force, vol. 2 (November 1970), p. III-1–23.

7/30/2019 The All-Volunteer Military: Issues and Performance July 2007
http://slidepdf.com/reader/full/the-all-volunteer-military-issues-and-performance-july-2007 17/49
THE ALL-VOLUNTEER MILITARY: ISSUES AND PERFORMANCE
permitted only for government officials and people in jobs considered necessary for the public health or forindustrial needs. College students could defer their ser-vice only until the end of the academic year.
In the decades after World War II, annual draft induc-tions dropped from about 250,000 in 1954 to a low of about 80,000 in 1962. At the same time, the number of men who were potentially eligible for the draft increased.In the seven years from 1958 to 1964, the U.S. male pop-ulation between the ages of 19 and 25 grew by 50 percent(from 8 million to about 12 million). With a larger poolof potential draftees and smaller draft calls, the propor-tion of young men who were called to serve decreased.(As the population growth continued, some researchersprojected in 1970 that by 1974, the percentage of 26-
year-old men who had served or were serving in the mili-tary could drop as low as 34 percent, compared withabout 70 percent in 1958.)13
With the number of military personnel needed declining as a fraction of the eligible population, questions arose inthe early 1960s about who should serve or whether thedraft should be abolished. Disqualification for health rea-sons and for poor performance on entry tests continued,and the system of deferments was expanded. For exam-ple, in 1963, deferments were extended to fathers. By 1964, almost 30 percent of draft registrants received
occupational, educational, or other deferments, up from just 13 percent in 1958.14
As the Vietnam War escalated in the mid- and late 1960s,the number of young men who were drafted grew, andopposition to the war and the draft intensified. Concernsabout who was called to serve and about the fairness of deferments and exemptions increased. In a 1966 poll, forinstance, fewer than half of respondents said the draft washandled fairly in their community.15 Deferments wereavailable for those who could afford higher education. By 1970, about 10 percent of registrants (or 2.3 million
people) had educational deferments, more than 10 timesthe percentage in 1960. Because poor or minority menmay have had less access to higher education than theirpeers, they appeared more vulnerable to being drafted.
However, those men may have been less likely to meet theDepartment of Defense’s (DoD’s) entrance standards andthus less likely to be drafted.16
In 1966, President Lyndon Johnson formed the National Advisory Commission on Selective Service to considerthe functioning of the Selective Service System (whichadministered the draft) and alternative systems of national service in light of military requirements, fairness,and other factors. The commission issued a report thefollowing year rejecting an all-volunteer force, recom-mending that future drafts take place by lottery, and sug-
gesting other changes to the Selective Service System.17
In his campaign for the presidency in 1968, RichardNixon pledged to abolish the draft. After his election, theCongress and the President began modifying the draftsystem. In 1969, legislation was enacted to permit a draftlottery, and in December of that year, the first draft lot-tery was conducted—ending the system in which localdraft boards had solely determined, on basis of the draftlaw, who must report for possible induction in the mili-tary.18 In the early 1970s, occupational, agricultural,new-paternity, and new-student deferments were largely eliminated.
The Lifting of the Draft Besides altering the draft system, President Nixon char-tered the President’s Commission on an All-Volunteer Armed Force (also known as the Gates Commission forits chairman, former Secretary of Defense ThomasGates). The commission was charged with developing a comprehensive plan for eliminating conscription and
13. That 1970 estimate, presented in Studies Prepared for the President’s Commission on an All-Volunteer Armed Force, vol. 2, p. III-1–2,assumed a military with 2.7 million service members in 1974; theactual number of personnel that year was roughly 2.2 million.
14. Bureau of the Census, Historical Statistics of the United States,Colonial Times to 1970, Part 2 (September 1975), p. 28.
15. Nevertheless, 62 percent of respondents to a 1969 poll thoughtthe draft should be continued even if the war ended, and only 32 percent thought the military should be an all-volunteer force.
16. Report of the President’s Commission on an All-Volunteer Armed
Force, p. 147.17. National Advisory Commission on Selective Service, In Pursuit of
Equity: Who Serves When Not All Serve? (February 1967).
18. In the draft lottery, a container was filled with 366 birth dates,and the order in which each date was drawn determined the orderin which men were called to report for induction. The first datedrawn was September 14, so all registrants born on that date wereassigned a lottery number of 1. The lottery continued until allbirth dates were drawn. Men who had the lowest numbers (and
who were classified as available for military service) were orderedto report for possible induction.

7/30/2019 The All-Volunteer Military: Issues and Performance July 2007
http://slidepdf.com/reader/full/the-all-volunteer-military-issues-and-performance-july-2007 18/49
6 THE ALL-VOLUNTEER MILITARY: ISSUES AND PERFORMANCE
with studying the costs and savings of an all-volunteerforce. It was also ordered to examine options to increasethe supply of military personnel, including any changesin compensation that might be necessary if an AVF was
adopted. Although some commissioners reportedly favored the draft initially, in 1970 the commission pub-lished a report unanimously recommending that thenation return to an AVF, coupled with a standby draftthat could be put into effect when additional personnel were needed. The report stated:
However necessary conscription may have beenin World War II, it has revealed many disadvan-tages in the past generation. It has been a costly,inequitable, and divisive procedure for recruit-ing men for the armed forces. It has imposed
heavy burdens on a small minority of young men while easing slightly the tax burden on therest of us. . . . These costs of conscription wouldhave to be borne if they were a necessary pricefor defending our peace and security. They areintolerable when there is an alternative consis-tent with our basic national values.19
In December 1972, the Selective Service System held itsfinal lottery identifying inductees for the armed forces;on July 1, 1973, legal authority to draft people into the
military expired. The requirement that young men regis-ter with the Selective Service System was dropped in1975. However, that requirement was reinstated in 1980(after the Soviet invasion of Afghanistan) and remains ineffect today.20
Some Arguments For and Against theDraft and the All-Volunteer ForceThe question of whether a draft would be more desirablethan an all-volunteer force has reemerged as operations inIraq and Afghanistan continue to require substantial
numbers of military personnel. Among other arguments,supporters of conscription say that a draft would allow the military to call up large numbers of people quickly.For their part, supporters of the all-volunteer force
maintain that the quality of the military would deterio-rate under a draft.
The last time debate about the desirability of the draft
was prominent and protracted was during the Vietnam War. Some of the arguments made at that time are similarto ones heard today. This section summarizes the majorissues articulated by proponents or opponents of the draftthen or more recently.21 Those issues fall into three mainareas: the military’s ability to achieve its goals for size andquality, the overall cost of the armed forces, and fairnessand sociopolitical considerations. (The next section shedslight on some of those arguments by examining the char-acteristics of the AVF over the past three decades.)
Military Effectiveness
The armed services’ ability to function effectively depends on many factors. Some critical ones are whetherthe services can enlist enough personnel at the right timesand whether those personnel will be able to perform their jobs efficiently.
Achieving Force Levels in Peacetime and Wartime. Pro-ponents of the draft have claimed that in the event of another major national crisis, the all-volunteer force
19. Report of the President’s Commission on an All-Volunteer Armed Force, pp. 9–10.
20. Registration is mandatory not only for U.S. citizens but also fordual nationals of the United States and other countries and forsome noncitizens, such as legal permanent residents and refugees.
21. Many other assertions have been made about both systems of pro-
curing military personnel that CBO did not have room to includehere. These references provide further detail: National Advisory Commission on Selective Service, In Pursuit of Equity; RichardNixon, “The All-Volunteer Armed Force,” a radio address givenon October 17, 1968, reprinted in John Whiteclay Chambers II, Draftees or Volunteers (New York: Garland Publishing, 1975);Report of the President’s Commission on an All-Volunteer Armed Force; National Council to Repeal the Draft, “An All-Volunteer‘Professional’ Army?” in Chambers, Draftees or Volunteers; JosephCalifano, “Doubts About an All-Volunteer Force,” in Martin
Anderson, ed., The Military Draft (Stanford, Calif.: Hoover Insti-tution Press, 1982); John G. Kester, “The Reasons to Draft,” in
William Bowman, Roger Little, and G. Thomas Sicilia, eds., The All-Volunteer Force After a Decade (Washington, D.C.: Pergamon-
Brassey’s, 1986); The Newshour with Jim Lehrer, “Debating theDraft,” broadcast on April 8, 1999, available at www.pbs.org/newshour/bb/europe/jan-june99/service_4-8.html; CharlesMoskos and Paul Glastris, “Now Do You Believe We Need a Draft?” Washington Monthly (November 2001); Center for
American Progress, “The Draft: Inevitable, Avoidable, or Prefer-able?” C-SPAN broadcast on March 30, 2005, available at www.americanprogress.org/events/2005/3/b593305ct719947.html;and John T. Warner and Sebastian Negrusa, “The Economic Casefor All-Volunteer Forces,” in Curtis L. Gilroy and Cindy Will-iams, eds., Service to Country: Personnel Policy and the Transforma-tion of Western Militaries (Cambridge, Mass.: MIT Press, 2006).

7/30/2019 The All-Volunteer Military: Issues and Performance July 2007
http://slidepdf.com/reader/full/the-all-volunteer-military-issues-and-performance-july-2007 19/49
THE ALL-VOLUNTEER MILITARY: ISSUES AND PERFORMANCE
would not be able to meet a large, sudden need foradditional troops. More basically, draft supporters havequestioned whether young people will continue to jointhe military given the likelihood that they may be
required to deploy and fight.
22
(In a 2005 DoD survey of parents and other adults who influence young people’sdecisions, a majority said they were less likely to recom-mend military service because of the war in Iraq.) Inaddition, some people have expressed fears that the cur-rent system of using the reserves and a standby draft fornational emergencies is unlikely to supply adequately manned or equipped forces in a timely manner.23
Today, the size of the force depends on the military’s abil-ity to recruit and retain volunteers. Responding to argu-ments that personnel levels may become inadequate
under the AVF, supporters of the current system havenoted that a host of factors affect the services’ recruiting and retention efforts, including the missions that the mil-itary undertakes, the length of deployments, and com-pensation levels. In that view, adequate compensationshould allow the services to maintain the forces they need; the reliance on draftees during the Vietnam Warmay be partly attributable to wages that were kept artifi-cially low. The Gates Commission concluded that thenation could support the force size it needed with volun-teers if regular military compensation for personnel intheir first term was raised to levels roughly competitive with those individuals’ opportunities in the civilian sec-tor.24 In dismissing concerns about the services’ ability tomaintain an adequately sized force, proponents of the
AVF have also argued that people tend to volunteer whenforeign threats emerge
Finally, supporters of the all-volunteer force assert thatrelying on active-duty and reserve personnel can gettroops to a theater faster than a draft could. A draftee with no prior military service could require severalmonths to be trained, equipped, and declared ready todeploy to a theater.
Quality and Effectiveness of the Force. Many studies havelinked educational attainment (specifically, earning a highschool diploma), high test scores on military entranceexams, and more experience or seniority of service mem-bers with positive military outcomes. People with thosecharacteristics have higher productivity than other service
members or are more likely to remain in the military.
Some observers have argued, however, that individuals of relatively high ability, education, and social status do notnormally volunteer for military service because they typi-cally have good employment prospects in the civilianeconomy. Drafting those individuals would allow themilitary to benefit from their talents. By extension,that line of reasoning implies that the quality of an all-volunteer force will be lower than that of a draft forcebecause military service is presumably more attractive topeople with fewer civilian opportunities—the poor, the
less educated, and the less skilled. In that view, the per-ceived low quality of the force diminishes the prestige of the military and thereby makes attracting volunteers evenmore difficult, leading to further declines in the quality,and ultimately the readiness, of the force.
Proponents of the AVF have asserted that if the quality of volunteers proved to be too low, the military could targetits recruiting and compensation policies toward particularsegments of the population. For instance, adequate com-pensation, opportunities for career advancement, andother selective incentives could help the services recruit
and retain highly qualified individuals.25
Supporters of the AVF have also argued that the prestigeof military service is enhanced by relying solely on people who freely choose to serve. In addition, a volunteer forcehas the advantage of not including unwilling and inexpe-rienced draftees who may be prone to discipline problems
22. As attorney and former DoD official John G. Kester put it,“Nobody, not even economists, expects that money will attractmany recruits to enlist when they are confident that if they do, ina few weeks they will be shot at.” See Kester, “The Reasons toDraft,” p. 292.
23. If a draft was reinstated under the current rules, for instance, theSelective Service System would have 193 days (more than six months) after commencing operations before it had to deliver
registrants to DoD.
24. Regular military compensation consists of basic pay, cash allow-ances for housing and food, and the tax advantage that servicemembers receive because those allowances are not subject to fed-eral income taxes. Currently, DoD’s goal is to have regular military compensation for enlisted personnel at least equal the 70th per-centile of earnings for civilians of comparable age, education, andexperience. Enlistment or reenlistment bonuses are also offered forcertain occupations or skills as DoD deems necessary. For moreinformation about military pay, see Congressional Budget Office,Evaluating Military Compensation (June 2007).
25. DoD’s current personnel policies reflect those goals, as discussedbelow.

7/30/2019 The All-Volunteer Military: Issues and Performance July 2007
http://slidepdf.com/reader/full/the-all-volunteer-military-issues-and-performance-july-2007 20/49
8 THE ALL-VOLUNTEER MILITARY: ISSUES AND PERFORMANCE
(as occurred during the Vietnam era). Thus, a volunteermilitary should be more professional and more motivatedthan a force of draftees.
Another key argument is that turnover among enlistedpersonnel should be lower in a volunteer military thanunder a draft—resulting in longer careers and more-experienced personnel—for several reasons. First, initialenlistments in the present AVF are typically for four to six years, compared with the two-year tours that draftees would have to serve under current law (and that they served during the Vietnam War). Second, true volunteershave historically had much higher reenlistment rates thaneither draftees or people who volunteer to avoid being drafted. Third, the higher pay and morale in a volunteerforce should further reduce turnover. Overall, because
more-experienced personnel receive a greater amount of on-the-job training, members of the AVF should be moreproductive and effective than members of a draft force.
The Cost of the Armed Forces and Economic Efficiency One factor in determining the relative merits of a draftand an AVF is comparing the full cost of the military under each approach. Supporters of the draft have arguedthat an all-volunteer force would cost more than a draftforce because the military would have to pay significantly higher wages to attract and retain volunteers.26 That
higher cost could potentially constrain the size of thearmed forces, leaving them too small to fulfill their mis-sions, or could crowd out necessary long-term defensespending on such items as weapon systems, equipmentmaintenance, and infrastructure.
That cost argument was countered in the 1960s, wheneconomists claimed that the full cost to society of a draftforce was much larger than the budgetary costs reportedat the time.27 From an economist’s perspective, the draftentails additional costs because it imposes a “hidden” orin-kind tax on draftees and draft-induced volunteers:Those individuals are typically paid wages that are below prevailing market rates and below their “reservation
wages” (the earnings they would require to enlist volun-tarily). The tax equals the difference between their reser-vation wages and the amount actually paid for theirservice. The hidden tax borne by each draftee or draft-
induced volunteer is not included in DoD’s budgetary costs or counted in any government tally of spending orrevenues. But it would have to be added to budgetary costs to estimate the nation’s total defense spending undera draft.
The Gates Commission, economists, and other observershave argued that the full economic cost of an AVF is lessthan that of a draft force, for at least four reasons:
B The in-kind tax is eliminated with a volunteer force.People volunteer because they are offered compensa-
tion that is at least equal to the value of their serviceselsewhere in the economy. Moreover, those who vol-unteer have lower reservation wages than draftees,some of whom may strongly dislike military service.
B Other costs of the draft are eliminated as well—prima-rily the costs of avoiding the draft, which economistsview as an unproductive use of resources (a “dead weight loss”). If draft deferments and exemptions areavailable, they distort the personal and career plans of draft-age men. For instance, in the past, such menhave married and had families earlier than they would
have otherwise, or they have gone to college whenthey would not have otherwise.
B Turnover rates should be lower and reenlistment rateshigher under the AVF because the force is composedof willing recruits. As a result, the military should savemoney by having lower training costs and more-experienced and productive members.28
26. Although the Gates Commission recommended ending the draft,it recognized that the AVF might incur higher budgetary coststhan a draft force. It estimated that DoD’s annual spending onpersonnel would need to rise by a net $2 billion in 1970 dollars(roughly $9 billion in 2006 dollars)—or by about 8 percent—toattract enough volunteers to keep the size of the military at2.5 million personnel. See Report of the President’s Commissionon an All-Volunteer Armed Force, p. 8.
27. For a fuller discussion, see Anthony C. Fisher, “The Cost of theDraft and the Cost of Ending the Draft,” American Economic Review, vol. 59, no. 3 (June 1969), pp. 239–254; Walter Oi, “The
Economic Cost of the Draft,” American Economic Review, Papers and Proceedings of the Seventy-Ninth Annual Meeting of the Ameri-can Economic Association, vol. 57, no. 2 (May 1967), pp. 39–62;and W. Lee Hansen and Burton A. Weisbrod, “Economics of theMilitary Draft,” Quarterly Journal of Economics, vol. 81, no. 3(August 1967), pp. 395–421.
28. The higher pay and benefits given to a more senior force couldoffset those savings, however. Some of the higher costs wouldresult from the greater pay and benefits that service members withfamilies receive. Although few enlisted personnel are married
when they join the military, about half are married by the end of their first term.

7/30/2019 The All-Volunteer Military: Issues and Performance July 2007
http://slidepdf.com/reader/full/the-all-volunteer-military-issues-and-performance-july-2007 21/49
THE ALL-VOLUNTEER MILITARY: ISSUES AND PERFORMANCE
B The full cost of military personnel is less visible under
a draft, which reduces how efficiently the economy
functions (that is, whether available resources are put
to their most productive use). In a draft system, man-
power appears less expensive than its true cost, whichcauses conscripted labor to be substituted for other
resources—and thus to be overused. The allocation of
resources should be more efficient in a volunteer mili-
tary because spending on personnel must compete
with other uses of available defense budgets. The
higher budgetary costs for personnel in the AVF
should encourage substitutions of capital for labor,
allowing a smaller but equally efficient force.
During the Vietnam era, supporters of an all-volunteer
force acknowledged that, at times, conscription might beeither necessary or less expensive than an AVF, although
they expected those circumstances to be relatively
unusual.29 Since then, theoretical models have identified
the conditions under which the full costs to society of
using conscription to procure military personnel may be
lower than relying entirely on volunteers.30 Conscription
is more likely to be economically efficient if:
B The supply of labor to the military is highly inelastic
(in other words, large increases in wages would be nec-
essary to attract volunteers);
B Individuals engage in significant activities to avoid
federal taxation (so it would be costly to raise revenues
in order to pay the volunteer force);
B The number of personnel that the military needs
represents a large fraction of the eligible youth popula-
tion;31 and
B The draft is structured in a way that makes it difficultto avoid (so people would not be likely to expend sig-
nificant effort in evading the draft).
Because of a lack of data and other analytical difficulties,the Congressional Budget Office (CBO) has notattempted to calculate a break-even point at which the
full costs of a draft would be lower than those of an all-volunteer force. Nor has it found other studies that pro-vide that information. However, some analysts have
hypothesized that the military’s personnel requirements would have to be quite high, depending on the circum-
stances, before a draft was required. For example, during the mid-1980s, the active Army was able to attract and
retain enough volunteers to field 16 divisions, containing a total of about 780,000 personnel (albeit during a period
without major military conflicts). That force was morethan 50 percent larger, and had six more divisions, than
the current active Army.
Fairness and Sociopolitical ConsiderationsIn some people’s eyes, the most important rationales for a draft or a volunteer military do not center on questions of effectiveness or cost. Rather, they involve such issues as
the composition of the armed forces and the roles of thefederal government, the military, and citizens.
Representativeness of the Force. Volunteering to serve inthe armed forces during a conflict exposes people to a
higher risk of injury or death than the U.S. population ingeneral faces.32 Serving as a draftee has the additionaleffect of diverting young people from their expectedcareer and personal paths for two years. Consequently,the nation has long been concerned about who serves in
the military. That question is complicated by the fact that with roughly 30 million men and women between theages of 18 and 24 in the United States today, a smallpercentage of them are likely to be needed to fight.29. See Milton Friedman, “Why Not a Volunteer Army,” in Sol Tax,
ed., The Draft: A Handbook of Facts and Alternatives (Chicago:
University of Chicago Press, 1967), p. 202; and Report of the President’s Commission on an All-Volunteer Armed Force, p. 121.
30. For a comprehensive discussion, see John T. Warner and Beth J. Asch, “The Economics of Military Manpower,” in Keith Harley and Todd Sandler, eds., Handbook of Defense Economics, vol. 1(New York: Elsevier Science, 1995), pp. 373–380; and John T.
Warner and Beth J. Asch, “The Record and Prospects of the All-Volunteer Military in the United States,” Journal of Economic Perspectives, vol. 15, no. 2 (Spring 2001), pp. 169–192.
31. That condition would exacerbate the first two points by requiring larger movements along the supply curve of labor.
32. The mortality rate for troops serving in the Vietnam War was21.8 per 1,000 person-years. The rate for personnel in Iraqbetween March 2003 and March 2006 was 3.9 per 1,000 person-years (with the Marines experiencing the highest mortality rates).By comparison, the death rate for U.S. men ages 18 to 39 in 2003
was 1.5 per 1,000 person-years. For a more detailed analysis of death rates in Iraq, see Samuel Preston and Emily Buzzell, Mortal-ity of American Troops in Iraq, Working Paper 06-01 (Philadelphia:University of Pennsylvania Population Studies Center, August2006), available at http://repository.upenn.edu/psc_working_papers/1/.

7/30/2019 The All-Volunteer Military: Issues and Performance July 2007
http://slidepdf.com/reader/full/the-all-volunteer-military-issues-and-performance-july-2007 22/49
10 THE ALL-VOLUNTEER MILITARY: ISSUES AND PERFORMANCE
In the past, one way in which the United States deter-mined who would serve was through the system of draftdeferments and exemptions. However, that mechanismcan be seen as inequitable, as happened during the Viet-
nam War. At that time, some people charged that defer-ments shifted service predominantly to lower-incomeand black youth, who could not obtain deferments asreadily.33 Educational deferments, in particular, weresingled out for criticism.
Some observers, including the National Advisory Com-mission on Selective Service, have concluded that thesolution to the question of who should serve is to give allindividuals an equal risk of being inducted through thedraft. As noted above, in the late 1960s and early 1970s,the nation moved to a lottery system for determining who should be inducted—and tightened or eliminatedmany deferments—to distribute military service moreevenly throughout the male population. Although it hasbeen modified since then, a random lottery of young menis the method of conscription mandated by the selectiveservice legislation now in effect.
Other people dismiss altogether the notion that a draftcan be equitable. In their view, the very fact that someindividuals are forced to provide their service when othersare not can be considered unfair. Although the National
Advisory Commission on Selective Service recommendeda random draft lottery, it acknowledged, “Completeequity can never exist when only some men out of many must be involuntarily inducted for military service.”34 The subsequent Gates Commission concluded: “Whennot all our citizens can serve, and only a small minority are needed, a voluntary decision to serve is the bestanswer, morally and practically, to the question of whoshould serve.”35 The Gates Commission argued that thehidden tax on draftees was a regressive tax on servicemembers. By getting paid less than they would earn oth-
erwise, draftees were forced to bear a larger share of thecosts of national defense than individuals who were notdrafted, thus lowering the costs for everyone else.
On the other side, some supporters of the draft argue thatan all-volunteer force creates its own inequities. They maintain that the current AVF was designed to free themiddle and upper classes from even the risk of military
service and that lower-income groups or minorities bear a disproportionate share of service and combat. In thatview, the military is particularly appealing to groups whohave relatively poor civilian opportunities, because they are offered higher pay than they can receive elsewhere.Thus, those groups may be disproportionately drawn intothe armed forces, with its attendant dangers.
One response to that criticism is that if a socioeconomicgroup was disproportionately represented in the all-volunteer force, it would be because of individuals’ freechoice, not compulsion. Proponents maintain that service
members fare better in an AVF, in terms of wages, thanthey did under a draft system and that the AVF offerssome people more opportunities and better lives thantheir civilian options do. (Critics counter that enlisting does not constitute volunteerism when poverty is thealternative.) In addition, the higher monetary rewardsunder an AVF are likely to attract additional recruits,including people with relatively better civilian opportuni-ties, who would be less likely to volunteer under a mixeddraft/volunteer system. The result, supporters say, is thatthe AVF produces a diverse, higher-quality force that ismore motivated and effective. Finally, they argue that var-ious reasons other than pay—such as patriotism, a senseof duty, or the desire to learn a new skill or travel to new places—also continue to attract a broad cross section of society to the military.
The Rights and Duties of Citizenship. Supporters of thedraft maintain that service in defense of the country is a fundamental responsibility of citizenship. Opponents,however, say that the draft is at odds with the basicdemocratic principles of liberty, equality, and free choice.Others have claimed that requiring service undermines
citizens’ respect for the government and the morale of thetroops.
In various court cases, the Supreme Court has ruled thatthe government has the right to raise armies throughconscription.36 The Constitutional provisions that give
33. Flynn, The Draft, 1940–1973, pp. 193 and 207.
34. National Advisory Commission on Selective Service, In Pursuit of Equity, p. 37.
35. Report of the President’s Commission on an All-Volunteer Armed Force, p. 14.
36. See United States v. O’Brien, 391 U.S. 367 (1968); Lichter v.United States, 384 U.S. 742 (1948); and the Selective Draft Law Cases, 245 U.S. 366 (1918).

7/30/2019 The All-Volunteer Military: Issues and Performance July 2007
http://slidepdf.com/reader/full/the-all-volunteer-military-issues-and-performance-july-2007 23/49
THE ALL-VOLUNTEER MILITARY: ISSUES AND PERFORMANCE
the Congress powers to declare war, to raise and support
armies, and to make laws to execute those powers formed
the basis for the Court’s decision on that issue in 1918. It
stated, “The very conception of a just government and its
duty to the citizen includes the reciprocal obligation of the citizen to render military service in case of need and
the right to compel it.” In that line of reasoning, because
the government is protecting citizens’ rights and property,
it may require citizens to contribute to that protection.
Willingness to Engage Forces in Overseas Conflicts.
Some critics of an all-volunteer force—both during the
Vietnam War and today—argue that the United States is
more likely to engage in foreign conflicts if it has a volun-
teer military, for several reasons. First, the AVF provides a
standing pool of trained personnel ready to go to war, which the President could send into action with little
public discussion. Second, the country’s leaders might be
less reticent in using military force to resolve conflicts
(as opposed to taking diplomatic or other approaches)
because their relatives and friends would presumably be
less likely to serve than most people. Finally, because
middle- and higher-income individuals might no longer
face the risk of being sent to war, the general public
would be less concerned about committing troops to
combat than it might have been under a draft system. In
that view, protests against wars would probably be muted,and the public would not act as a brake on the decision to
take part in military conflicts.
Proponents of the AVF argue that other considerations—
such as the cost of military resources and the risk to
human lives—are likely to have more influence than the
method of procuring personnel on whether the nation
commits troops to an overseas conflict. If anything, sup-
porters of the AVF have asserted, maintaining peacetime
conscription could allow for greater use of the military
than an all-volunteer force would. The President couldincrease the size of draft calls with minimal public debate
and without Congressional approval. Thus, the President
could engage the country in military operations that
enjoyed little popular or Congressional support. With an
AVF, by contrast, difficulties recruiting and retaining vol-
unteers would act as a signal of public opinion and could
limit the government’s ability to take part in unpopular
wars.
Isolation of the Armed Forces. In the past, proponents of a draft argued that conscription could guard against thedevelopment of a separate military ethos—and keep thedesires and goals of the military and the general public
more closely aligned—by spreading the responsibility of serving in the military more or less evenly across most of society. In that view, an AVF that consisted of profes-sional personnel could develop its own independent cul-ture, allowing a division to grow between the military andcivilian society. Some people expressed concern that themilitary could become composed of individuals who wereinclined to use violence to solve problems and could eventhreaten civilian control.
Supporters of the all-volunteer force countered that draft-ees, who would have the lowest levels of authority, would
not prevent or affect the development of a military ethos.In that view, if the military became too isolated from therest of society, one solution would be to increase theinteraction between the two groups. Encouraging servicemembers to live and eat off-base, eliminating military schools, and shifting some military jobs to civilianscould better integrate military personnel into civiliancommunities.
The Benefits of Military Service to Individuals. Observershave postulated many other personal and societal benefits
from military service and conscription. Some peoplepoint to improved physical fitness, self-discipline, andtraining for youths; others, to ethnic, racial, and socialdiversity that allows personnel to experience and appreci-ate members of different classes, cultures, and educationlevels. Still others claim that military service instillsgreater patriotism and knowledge of foreign affairs.
A desire to extend the benefits of military service to moreyoung people, or to increase their readiness to serve in themilitary, has led to proposals for a system of compulsory or voluntary national service or universal military train-
ing in the United States. For instance, in 1966, PresidentDwight Eisenhower called for a program in which allyoung men would spend 49 weeks in military training.37 Anthropologist and social commentator Margaret Mead was one proponent of universal national service, in which
37. John O’Sullivan and Alan M. Meckler, eds., The Draft and Its Enemies (Champaign, Ill.: University of Illinois Press, 1974),pp. 214–219.

7/30/2019 The All-Volunteer Military: Issues and Performance July 2007
http://slidepdf.com/reader/full/the-all-volunteer-military-issues-and-performance-july-2007 24/49
12 THE ALL-VOLUNTEER MILITARY: ISSUES AND PERFORMANCE
both young men and women would be required to servetheir country in some way.38
A counterargument is that many of the skills and idealsthought to result from serving in the armed forces couldbe taught in other spheres of the community—such asthe school system—without resorting to compulsory military service.
Personnel in Today’s All-VolunteerMilitary To shed light on some of the arguments discussed above,CBO examined trends in budgetary costs, the quality of the force, and various demographic characteristics of mil-itary personnel from the Vietnam era to the present.
CBO also compared both new recruits and all servicemembers with the civilian population along variousdimensions.39
The Cost of the Armed Forces As both proponents and critics of the all-volunteer forcepredicted, the budgetary cost of personnel increased sig-nificantly in the early years of the AVF as pay was raisedto attract additional volunteers. Basic pay for new servicemembers (E-1s with four months of service) almostdoubled in real (inflation-adjusted) terms during thatperiod—rising from about $700 per month in fiscal year
1971 to $1,300 per month by 1975 (both in 2006 dol-lars).40 Those increases brought military pay in line with
the median pay of young men working in the civiliansector.41 Increases in pay were generally smaller for thecareer force (personnel serving their second or subsequentenlistment), presumably in part because, even before the
AVF, those service members received compensation pack-ages that were competitive with their alternatives in thecivilian sector. For some career personnel, basic pay grew by less than the rate of inflation.
In examining real expenditures from the military’s per-sonnel accounts, CBO found that total manpower spend-ing increased with the return of the AVF. Those expendi-tures averaged $97 billion a year in 1974 and 1975,compared with $68 billion a year in the pre-Vietnam Warera of 1959 to 1963.42 That rise does not reflect the fullincrease in the cost per service member, however, because
the early AVF was more than 15 percent smaller than theforce of the pre-Vietnam period.
Critics of an all-volunteer force were concerned that thebudgetary costs of personnel would become prohibitively high, crowding out spending on weapons and equip-ment. Personnel costs did grow as a percentage of thedefense budget with the onset of the AVF. Personnelaccounts totaled about 35 percent of the budget in theinitial years of the AVF, compared with 28 percent during the pre-Vietnam era. Only a portion of that increaseappears to be attributable to the all-volunteer force, how-ever. According to the former General Accounting Office(GAO), the move to an AVF added about $3 billion peryear in 1974 dollars to the military’s costs (more than
38. Tax, The Draft: A Handbook of Facts and Alternatives, pp. 99–109.One drawback of implementing such plans today would be thebudgetary cost. For example, if the roughly 4 million 18-year-oldsin the United States were required to perform one year of military or public service but were paid market wages for that service(equal to the pay of young full-time workers), the cost would totalapproximately $80 billion a year, CBO estimates. That amount isalmost three-quarters of the $108 billion that DoD spent from itsmilitary personnel accounts in 2006 for 1.4 million active-duty personnel.
39. The Department of Defense provides a report on populationrepresentation in the U.S. military to the Congress each year, inresponse to a standing requirement by the Senate Armed ServicesCommittee (Report 93-884, May 1974). This discussion is partly based on the most recent report: Department of Defense, Officeof the Under Secretary of Defense for Personnel and Readiness,Population Representation in the Military Services: Fiscal Year 2005 (2007), available at www.humrro.org/poprep/poprep05/.
Although that report was based on 2005 data, demographic char-acteristics (such as average age) usually change slowly and areprobably largely similar now to what they were in 2005.
40. Historical military pay tables are available from the Departmentof Defense, Defense Financing and Accounting Service, at www.dod.mil/dfas/militarypay/2006militarypaytables/militarypay priorrates.html.
41. Cooper, Military Manpower and the All-Volunteer Force, p. 42.
42. Those personnel costs, which are all given in 2006 dollars, includeDoD’s spending on direct pay and allowances, as funded through
the military personnel appropriation. They exclude spending onsome other personnel-related functions (such as nonsalary recruit-ing costs, which are funded through DoD’s operation and mainte-nance appropriation) as well as the cost of tax collections thatare forgone because some military pay and allowances are tax-exempt. Through 1984, personnel expenditures include actualcash payments to retired service members; after 1984, they include an accrual charge for expected future retirement pay-ments. See Department of Defense, Office of the Under Secretary of Defense (Comptroller), National Defense Budget Estimates for FY 2007 (March 2006), available at www.dod.mil/comptroller/defbudget/fy2007/fy2007_greenbook.pdf.

7/30/2019 The All-Volunteer Military: Issues and Performance July 2007
http://slidepdf.com/reader/full/the-all-volunteer-military-issues-and-performance-july-2007 25/49
THE ALL-VOLUNTEER MILITARY: ISSUES AND PERFORMANCE
$10 billion in 2006 dollars)—or about 11 percent of
DoD’s spending on its manpower budget accounts in
1974.43 Most of the remaining increase resulted from
higher cash payments to retired military personnel that
were unrelated to the AVF.
In all, military spending was about $26 billion higher (in
2006 dollars) in the early years of the all-volunteer force
than in the pre-Vietnam era. The military manpower
accounts increased by about $29 billion over that period;
DoD’s other budget accounts (totaling more than
$170 billion in 2006 dollars, on average) decreased by
about $3 billion.
To CBO’s knowledge, no studies have retrospectively
examined the total cost of the draft. However, GAO’s
estimate of the extra $10 billion (in 2006 dollars) paid to
service members under the AVF could also be considered
the lower-bound cost of the in-kind tax on draftees.
Quality and Effectiveness of the ForceMany research studies conducted in the past few decades
have concluded that recruits who have earned a high
school diploma have a greater likelihood of completing
their initial training and first term of service in theenlisted force than individuals with no diploma or an
alternative credential (such as a GED).44 Roughly 80 per-
cent of recruits with high school diplomas complete theirinitial obligation, versus 60 percent of recruits with alter-
native credentials and 50 percent of recruits who did not
finish high school. Service members’ completion rates are
important to DoD because people’s level of experience in
the military affects their productivity. Individuals with
more years of service have generally acquired moreknowledge and skills than those with fewer years.Research has shown that career military personnel are atleast 1.5 times more productive than first-term personnel
at certain tasks.45
As such, a force of a given size will havegreater capabilities the more years of service its personnelhave. In addition, a larger percentage of recruits who donot complete their obligation leads to higher costs forrecruiting and training their replacements.
Research has also shown that recruits with higher scoreson the military entrance exam—known as the ArmedForces Qualification Test (AFQT)—are more easily trained and perform better in a wide range of military occupations than personnel with lower scores do. DoDinitiated an extensive multiyear study in which research-ers watched service members perform their jobs, calcu-lated their effectiveness, and then linked their perfor-mance scores to their AFQT scores. Researchersconcluded that personnel with low AFQT scores (in the10th to 30th percentiles relative to a representative sam-ple of the U.S. youth population) scored about 20 per-cent lower on performance tests than did members withhigh AFQT scores (in the top 30 percentiles). Further-more, by their third year of service, those low-scoring service members had not reached the performance levelsthat recruits with high AFQT scores achieved in their
first year on the job.46
Skills used in wartime have also been shown to depend onthe quality of service members. For instance, researchershave found that performance in air combat simulationsby Army enlisted personnel who operate Patriot missilesystems rises sharply with AFQT scores.47 Another study has shown a similar, though smaller, relationship betweenhow well Army enlisted members of tank crews perform
43. General Accounting Office (now the Government Accountability Office), Additional Costs of the All-Volunteer Force, FPCD-78-11(February 1978). The additional budgetary costs attributable toan AVF can be difficult to measure. At one extreme, some analystsmight credit any changes in manpower costs since 1973 to the
AVF because those costs would not have to be paid under a systemof conscription. At the other extreme, analysts might claim that a draft system should pay market wages and that the cost of doing so should not be attributed to the AVF. The GAO study attrib-uted the alignment of military pay with market wages to theinception of the AVF. An alternative estimate from 1973 by
Joseph Califano, a special assistant to the Secretary of Defense, was much higher: almost $6 billion for 1974. See Califano,“Doubts About an All-Volunteer Force.”
44. In this section, “recruits” refers specifically to recruits who havenot served in the military before.
45. Studies describing the relationship between military experience,
quality, and productivity are summarized in Warner and Asch,“The Economics of Military Manpower.”
46. For an overview of the DoD study and others linking individuals’quality to performance, see David J. Armor and Paul R. Sackett,“Manpower Quality in the All Volunteer Force,” in Barbara A.Bicksler, Curtis L. Gilroy, and John T. Warner, eds., The All-Volunteer Force: Thirty Years of Service (Washington, D.C.:Brassey’s, 2004).
47. B. Orvis, M. Childress, and M. Polich, Effects of Personnel Quality on the Performance of Patriot Air Defense System Operators, R-3901-
A (Santa Monica, Calif.: RAND, 1992).

7/30/2019 The All-Volunteer Military: Issues and Performance July 2007
http://slidepdf.com/reader/full/the-all-volunteer-military-issues-and-performance-july-2007 26/49
14 THE ALL-VOLUNTEER MILITARY: ISSUES AND PERFORMANCE
on firing ranges and their AFQT scores.48 Relationshipsbetween AFQT scores, receipt of a high school diploma,and performance have also been found in other services.
Because training, completion rates of initial enlistmentterms, and job performance have significant implicationsfor the cost and effectiveness of the force, DoD placesconsiderable emphasis on the educational achievementand AFQT scores of potential recruits—attributes thatunderpin its definition of personnel quality. In DoD’sview, the combination of a high school diploma and a hightest score means that an individual has a high potential forsuccess in the military. The increasing technologicalsophistication of weapon systems and growing complexity of many military jobs (even in the combat arms) canrequire significant training for service members to master.
That situation makes more-experienced, more-capablepersonnel especially valuable to DoD (as they are to mostemployers).
For the most part, DoD has been able to attract individu-als with the educational and test-score credentials neces-sary to perform its missions. After 2004, however, thequalifications of some new personnel slipped, as the Army accepted a higher proportion of recruits wholacked high school diplomas, scored lower on the AFQT,or had to obtain special waivers to allow their enlistment(for example, because they had several misdemeanors ontheir record).49
Education Levels. The proportion of young people join-ing the military who have high school diplomas is muchhigher now than it was during the Vietnam era. Althoughdata on the education levels of enlisted personnel during the draft period are not as readily available as data for the
Figure 3.
Percentage of Non-Prior-ServiceRecruits and Young Civilians with
High School Diplomas, 1973 to 2006(Percent)
Source: Congressional Budget Office based on Department of
Defense, Office of the Under Secretary of Defense for
Personnel and Readiness, Population Representation in
the Military Services: Fiscal Year 2005 (2007), available at
www.humrro.org/poprep/poprep05; and Department of
Defense, Directorate for Accession Policy.
Note: Data for recruits include only those who have earned high
school diplomas. Data for civilians include people who hold
general equivalency diplomas (GEDs) as well as high school
graduates.
all-volunteer force, the RAND Corporation reported fig-
ures for the 1960s and early 1970s that are significantly
lower than current levels: From 1960 through the firsthalf of 1973, an average of about 70 percent of recruits
had at least a high school diploma, compared with
91 percent in 2006.50 In the first few years of the AVF,however, the proportion of recruits who were high school
graduates declined, falling to a low of 60 percent in 1974.Most of that drop is attributed to a decrease in the num-
ber of recruits with “some college” education (that is, who
had earned some college credits but no degree).
48. B. Scribner and others, “Are Smarter Tankers Better? AFQT andMilitary Productivity,” Armed Forces and Society, vol. 12 (1986),pp. 194–206.
49. From time to time, the services have implemented programs toidentify people who do not possess high school diplomas but havethe potential to succeed in the military. For instance, under itsGED Plus program, the Army introduced the Assessment of Indi-vidual Motivation (AIM) in 2000 as an enlistment screening tool.Under that program, individuals without high school diplomas
who might otherwise be ineligible for military service can enlist if they score sufficiently high on the AIM and meet other programrequirements. If such programs successfully identify nongraduates
who perform similarly to high school graduates, the impact of a decline in the percentage of recruits with high school diplomas onthe effectiveness of the force will be lessened.
50. See Cooper, Military Manpower and the All-Volunteer Force,p. 133. More precisely, the percentages of recruits with highschool diplomas reported in that study are 64 percent from 1960to 1964, 74 percent from 1965 to 1969, and 66 percent from1970 through the first six months of 1973.
1973 1977 1981 1985 1989 1993 1997 2001 2005
0
50
60
70
80
90
100
DoD's Current Goal
Civilians Ages 18 to 24
Military Recruits

7/30/2019 The All-Volunteer Military: Issues and Performance July 2007
http://slidepdf.com/reader/full/the-all-volunteer-military-issues-and-performance-july-2007 27/49
THE ALL-VOLUNTEER MILITARY: ISSUES AND PERFORMANCE
In the early and mid-1980s, larger numbers of better-qualified recruits were attracted to military service asDoD initiated policies designed to improve recruiting. Itincreased military pay relative to the earnings of civilian
high school graduates, expanded education benefits, andboosted recruiting resources. In the early 1990s, DoD seta goal that at least 90 percent of enlisted recruits withoutprior service should have a high school diploma. (By comparison, 80 percent of the civilian youth populationearned high school diplomas in 2006.) DoD has beenable to meet that goal every year since it was established(see Figure 3). In the late 1980s and early 1990s, as themilitary was reduced in size and the number of new per-sonnel who were needed fell significantly, the services were able to increase the proportion of recruits with highschool diplomas, peaking at almost 98 percent in 1992.
That number declined somewhat through the 1990s, inpart because of improved job opportunities in the civiliansector (as evidenced by lower civilian unemploymentrates for young people).
During the current decade, the share of recruits who arehigh school graduates has remained between 90 percentand 93 percent for the military as a whole, although it hasvaried by service. For example, the Navy has increased itsfigure in recent years as it once again shrinks its enlistedforce, whereas the Army has fallen below DoD’s 90 per-cent goal. The proportion of new Army recruits with
high school diplomas dropped to 87 percent in 2005and 81 percent in 2006—the lowest levels in at least 20years.51 The Army’s difficulties in meeting its numericalgoals for recruiting in those years may partly explain thedrop in education levels.
At the same time, the percentage of the U.S. population who attend college has risen, in part because the pay gapbetween workers with postsecondary education and highschool graduates continues to widen. Enlisted servicemembers are similar to the rest of society in that respect:
Table 1.
Scoring Categories for the Armed Forces Qualification Test
Source: Congressional Budget Office.
a. Individual scores on the Armed Forces Qualification Test (AFQT)
are measured in terms of the distribution of scores of a nation-
ally representative sample of young people. For example, some-
one whose test results fall in the 72nd percentile of that distri-
bution receives an AFQT score of 72 (and is in category II).
Many of them earn college degrees (and some acquireadvanced degrees) while serving in the military. CBOestimates that at least 6 percent of enlisted personnel havefour-year college degrees.52 In addition, DoD requiresindividuals to have a college degree when they are com-
missioned into the officer corps or soon thereafter. As a result, a vast majority of active-duty officers—96 percentin 2005—have college degrees. In all, at least 20 percentof the combined enlisted force and officer corps (exclud-ing warrant officers) holds four-year college degrees, com-pared with roughly 30 percent of the U.S. populationages 25 to 34.
Test Scores. Results on the Armed Forces QualificationTest (which assesses basic verbal and mathematical abil-ity) are another important dimension of the quality of new service members. Higher scores—which indicate
higher cognitive ability—are statistically correlated witha greater likelihood of success in the military.
AFQT scores are divided into five groups: categories Iand II represent scores in the 65th to 99th percentiles rel-ative to the youth population in general, categories IIIA
51. Data for 2005 and 2006 come from DoD’s Directorate for Accession Policy. For the Army, those statistics are consistently 5 to 7 percentage points higher than data from DoD’s PopulationRepresentation in the Military Services report. One reason may bethat the two sources account differently for recruits in special edu-cational attainment programs. For instance, some recruits withouthigh school diplomas (those who enter the GED Plus program)are excluded from the population of recruits (the denominator) incalculations by the Directorate for Accession Policy, but they may be counted as recruits without a high school diploma in the Popu-lation Representation report.
52. For more information about the education levels of enlisted per-sonnel, see Congressional Budget Office, Educational Attainment and Compensation of Enlisted Personnel (February 2004).
Category I 93-99
Category II 65-92
Category IIIA 50-64
Category IIIB 31-49
Category IV 10-30
Category V 1-9

7/30/2019 The All-Volunteer Military: Issues and Performance July 2007
http://slidepdf.com/reader/full/the-all-volunteer-military-issues-and-performance-july-2007 28/49
16 THE ALL-VOLUNTEER MILITARY: ISSUES AND PERFORMANCE
Figure 4.
Distribution of AFQT Scores forNon-Prior-Service Recruits and Young
Civilians Under the Draft and the All-Volunteer Force(Percent)
Source: Congressional Budget Office based on Richard V.L. Cooper,
Military Manpower and the All-Volunteer Force, R-1450-
ARPA (Santa Monica, Calif.: RAND Corporation, 1977),
Table 8-3; and Department of Defense, Directorate for
Accession Policy.
Notes: For a description of the scoring categories for the Armed
Forces Qualification Test (AFQT), see Table 1.
Data for recruits during the draft era and for civilians in 2005
include only men; data for recruits in 2006 include women as
well as men. As a result, the data are not strictly compara-
ble. (However, data for the draft era would not differ signifi-
cantly if they included women, as less than 2 percent of
recruits in that period were female.)
a. Numbers for the enlisted force include accessions for whom
the AFQT score was unknown to the Directorate for Accession
Policy. Numbers for civilian youths include those scoring in cate-
gory V (who are statutorily barred from serving in the military).
and IIIB cover the 31st to 64th percentiles, category IV represents the 10th to 30th percentiles, and category V includes the 1st to 9th percentiles (see Table 1 onpage 15). Categories I through IIIA represent the top half
of scores (those at or above the 50th percentile). Individ-uals scoring in category V have been statutorily barredfrom enlistment or induction in the military since 1948.
Data from 1960 through the first half of 1973 indicatethat new service members’ AFQT scores were generally lower during the draft era than they have been under theall-volunteer force.53 During the 1960–1973 period, 37percent of male recruits scored in the top two categories,compared with 43 percent of male and female recruits in2006 (see Figure 4).54 In addition, 19 percent of draft-era recruits were in category IV, versus less than 2 percent last
year.
The AFQT scores of recruits are also generally highertoday than they were in the early years of the AVF (seeFigure 5). For example, in 2006, 69 percent of recruitsscored at or above the 50th percentile relative to the over-all U.S. youth population, compared with less than60 percent in 1973. The proportion of recruits whoscored in the top two categories in 2006 was one of thehighest since the beginning of the AVF. Likewise, the per-centage of recruits in category IV has declined signifi-
cantly since 1973, except for an increase during the mid-and late 1970s. That increase (to a high of 33 percent in1980) resulted from two factors. First, pay for enlistedpersonnel fell by a total of about 13 percent in the late1970s relative to pay for comparable civilians, as increasesin compensation for federal employees (including thoseserving in the military) were limited in an effort to con-trol budget deficits.55 That decline made military serviceless attractive to high-aptitude recruits, who consequently
Category
I
Category
II
Category
III
Category
IV
Category
V or
Unknown
0
10
20
30
40
50
60
Draft-Era Enlisted Force (1960 to first half of 1973)
All-Volunteer Enlisted Force (2006)
18- to 23-Year-Old Civilians (2005)
a
53. Cooper, Military Manpower and the All-Volunteer Force, p. 132.
54. According to the scale used for the test, 35 percent of the civilianyouth population should have AFQT scores in categories I and II.However, it is possible for test takers in the civilian population indifferent years to have a distribution of scores slightly differentfrom that of the cohort for which the test was benchmarked. (The
AFQT currently in use was benchmarked to the civilian popula-tion in 1997.) For example, in 2005, 36 percent of 18- to 23-year-old male civilians had AFQT scores in categories I and II.
55. Warner and Asch, “The Record and Prospects of the All-VolunteerMilitary in the United States,” p. 183.

7/30/2019 The All-Volunteer Military: Issues and Performance July 2007
http://slidepdf.com/reader/full/the-all-volunteer-military-issues-and-performance-july-2007 29/49
THE ALL-VOLUNTEER MILITARY: ISSUES AND PERFORMANCE
Figure 5.
Distribution of AFQT Scores for Non-Prior-Service Recruits in the All-VolunteerForce, by Scoring Category, 1973 to 2006
(Percent)
Source: Congressional Budget Office based on data from Robert L. Goldich, Recruiting, Retention, and Quality in the All-Volunteer Force
(Congressional Research Service, June 8, 1981); Department of Defense, Office of the Under Secretary of Defense for Personnel and
Readiness, Population Representation in the Military Services: Fiscal Year 2005 (2007), available at www.humrro.org/poprep/
poprep05; and Department of Defense, Directorate for Accession Policy.
Notes: For a description of the scoring categories for the Armed Forces Qualification Test (AFQT), see Table 1. Category V is not included here
because people who score in that category are statutorily barred from serving in the military.
AFQT scores from 1976 to 1980 reflect corrections from the miscalibration that occurred in that period.
had better civilian options. Second, a miscalibration of scores on the Armed Services Vocational Aptitude Battery
(ASVAB) test, which forms the basis of the AFQT score,
caused recruits who entered the services between 1976
and 1980 to receive higher scores than their actual ability
would merit.56 That problem allowed at least 125,000
people to enter the military who would otherwise not
have been admitted—or more than 7 percent of acces-
sions during that period.
In response to the miscalibration, the Congress stipulatedin the 1981 National Defense Authorization Act that,beginning in 1983, no more than 20 percent of new recruits could have scores in category IV.57 Since the1990s, DoD’s policy has been more restrictive: At least60 percent of new recruits should come from categoriesI to IIIA, and no more than 4 percent should come fromcategory IV. (Early in the AVF, the services had set sepa-rate ceilings. The percentage of recruits allowed from cat-egory IV ranged from 10 percent in the Navy and AirForce to 20 percent in the Army.)58
In the mid- to late 1980s, the share of recruits in the top AFQT categories rose sharply and the percentage in the
1973 1976 1979 1982 1985 1988 1991 1994 1999 2002 2005
0
10
20
30
40
50
60
70
80
90
100
Category I
Category II
Category III
Category IV
56. The scoring was recalibrated in 1980, and the scores of those
recruits were adjusted accordingly (mostly to lower categories);Figure 5 displays the adjusted scores. That correction is reflectedin the drop in the percentage of scores in categories I to IIIbetween 1976 and 1980 and the corresponding increase in theshare of recruits assigned to category IV. For more details, see
Armor and Sackett, “Manpower Quality in the All VolunteerForce”; Rostker, I Want You! The Evolution of the All-Volunteer Force; and Robert L. Goldich, Recruiting, Retention, and Quality inthe All-Volunteer Force (Congressional Research Service, June 8,1981).
57. The law also specified that no more than 35 percent of recruits without prior service could be non-high-school graduates and thatthose nongraduates who did enter the service had to have AFQTscores of at least 30.
58. Cooper, Military Manpower and the All-Volunteer Force, p. 136.

7/30/2019 The All-Volunteer Military: Issues and Performance July 2007
http://slidepdf.com/reader/full/the-all-volunteer-military-issues-and-performance-july-2007 30/49
18 THE ALL-VOLUNTEER MILITARY: ISSUES AND PERFORMANCE
bottom category declined further, as programs such as theMontgomery GI bill were instituted that attracted young people with high aptitude. Similar to the pattern of recruits with high school diplomas, recruits with test
scores in categories I and II peaked in 1992 (at 45 per-cent), with fewer recruits scoring in those top categoriesthrough the rest of the 1990s. The proportion of thoserecruits increased after 2001, reaching the 1992 levelagain by 2004. At the lower end of the scale, the percent-age of recruits scoring in category IV dropped below 0.5 percent in 1992, 2003, and 2004 but then rose to1.8 percent in 2005 and 2006, the highest level since1990. That increase was driven by the Army’s taking almost 4 percent of its recruits (the policy ceiling) fromcategory IV in those years.
DoD defines individuals with high school diplomas and AFQT scores at or above the median as high-quality recruits. The military has to compete harder for suchrecruits because they have many options in the civiliansector, including attending college. In general, the all-volunteer force has been able to attract sufficient numbersof such individuals, particularly during times of highunemployment. The percentage of high-quality recruitsdipped in the late 1970s and the early 1980s (the periodof the ASVAB miscalibration), falling as low as 27 percent.However, that percentage rose sharply in the mid- to late
1980s, peaking at 73 percent in 1992 (see Figure 6). Itincreased again after 2001 but slipped in 2005 and 2006.
Data on the Army for 2005 and 2006 point to generaldeclines in the quality of new personnel. The percentage of high-quality recruits in the Army fell to 49 percent in2006—the lowest level in more than 20 years and thelowest among the services. (The Marine Corps had thesecond-lowest share of high-quality recruits in 2006 at62 percent.) In addition to the drops in AFQT scores andin the percentage of high school graduates, quality in the Army appears to have fallen in recent years as measured by
the proportion of recruits meeting other enlistment stan-dards. For instance, the Army typically does not allow peo-ple to enlist under some circumstances, such as if they havecertain medical conditions, several misdemeanor convic-tions, or felony arrests. However, they can petition forspecial consideration through DoD’s special exemptionsprogram, which provides waivers. The total number of waivers granted by the Army has risen steadily in recentyears, from 8,900 in 2004 to 10,200 in 2005 and 13,500in 2006 (or 11.5 percent, 13.9 percent, and 16.9 percent
Figure 6.
Percentage of Non-Prior-ServiceRecruits Considered High Quality by
the Military, 1973 to 2006(Percent)
Source: Congressional Budget Office based on Department of
Defense, Office of the Under Secretary of Defense for
Personnel and Readiness, Population Representation in
the Military Services: Fiscal Year 2005 (2007), Table D-1,
available at www.humrro.org/poprep/poprep05.
Note: In the military’s definition, high-quality recruits are high
school graduates who score at least the median on theArmed Forces Qualification Test.
of recruits from those years, respectively). One type of waiver—behavioral or moral waivers—is given for non-medical issues, such as certain preservice drug use, criminalcharges, or convictions. The annual number of those waiv-ers increased from 4,500 in 2004 to 5,500 in 2005 and8,100 in 2006 (or 5.8 percent, 7.5 percent, and 10.1 per-cent of recruits, respectively).59
Experience and Rank. Various factors, such as the person-
nel requirements and policies of the military and deci-sions by lawmakers, determine the experience level (yearsof service) and rank (pay grade) profile of the force. Aver-age years of service have generally increased since the startof the all-volunteer force. For instance, the average lengthof service of active enlisted personnel was about 6 years in
59. The number of waivers has fluctuated in the past. For example,the Army granted nearly 6,000 moral waivers in 1990, but by 1997, that number had dropped to 2,400.
1973 1977 1981 1985 1989 1993 1997 2001 2005
0
10
20
30
40
50
60
70
80

7/30/2019 The All-Volunteer Military: Issues and Performance July 2007
http://slidepdf.com/reader/full/the-all-volunteer-military-issues-and-performance-july-2007 31/49
THE ALL-VOLUNTEER MILITARY: ISSUES AND PERFORMANCE
1974; it rose to a peak of 7.5 years in 1996 beforedecreasing slightly, to 7 years, by 2005.
The combination of years of service and pay grade indi-cates that experience levels are higher now than they wereduring the Vietnam era. In 1967, two-thirds of activeenlisted personnel were in their first enlistment term(which varied from 2 years for draftees to 3 years for vol-unteers in the Army, 3.5 years in the Navy, and 4 years forregular enlistees in the Marine Corps and Air Force).60 Today, by comparison, roughly 46 percent of the activeenlisted force has fewer than 4 years of service (meaning that personnel are probably in their first term), 39 per-cent has between 5 and 15 years of service, and theremaining 15 percent of the force has at least 16 yearsof service.
The higher experience levels in the AVF compared withthe draft-era force are partly attributable to higher pay— which leads to less turnover—and longer initial enlist-ment terms. However, declines in the size of the military and in the number of new personnel required each yearhave also played a role. The military’s total end strengthdeclined from a high of 3.5 million personnel in 1968 to2.1 million in 1978; correspondingly, the number of non-prior-service recruits required annually droppedfrom 843,000 to 304,000 over that period.61 In the early 1990s, following the end of the Cold War, the size of themilitary was reduced again, and non-prior-service acces-sion requirements fell further (from 277,000 in 1989 to179,000 in 1996). During that period, average years of service in the enlisted force rose steadily, reaching a peak in 1996. Besides cutting accession levels in that downsiz-ing, DoD offered incentives for midcareer personnel(those with 7 to 15 years of service) to leave active duty.The most senior personnel were less affected by thoseincentives, which also caused average years of service toincrease. Later, as those senior personnel retired, the forcebecame less experienced, on average.
Average experience levels differ among the services. Cur-rently, the Marine Corps and the Army have the most- junior enlisted forces, averaging about 5 and 7 years of service, respectively. The Navy and the Air Force are more
experienced, with averages of 8 and more than 9 years of service, respectively.
In the officer corps, the average years of experience
increased from 9.8 in 1974 to a peak of about 11 in2000 and then remained close to that level through 2005.Because of the way in which DoD reduced the size of the officer corps in the early to mid-1990s (mostly by decreasing the number of new commissions), the averageyears of service for officers continued to increase throughthe 1990s while the average for enlisted personnel
declined slightly.
Years of service in the military are correlated with pay grade. As of September 2006, 52 percent of the activeenlisted force was in pay grades E-1 to E-4 (typically first-
term service members, who are equivalent to trainees andapprentices), 36 percent was in grades E-5 and E-6
(skilled journeymen), and 12 percent was in grades E-7to E-9 (supervisors).
Force Composition and Equity During the Vietnam-era debate about ending the draft,many observers feared that an all-volunteer force wouldbe disproportionately filled with low-income and minor-ity youth, who would bear the brunt of the risks of com-bat. However, a variety of data suggest that the current
AVF is broadly representative of U.S. society, although(because of the demands and history of military service)
younger and less female than the population at large.
Age. On the whole, the active-duty military is youngerthan the civilian population. By law, new active-duty recruits must be between 17 and 42 years old (in 2005,the typical enlisted recruit was 18).62 In addition, bothofficers and enlisted personnel rarely serve for more than
30 years on active duty. Moreover, the services managetheir forces through various policies to achieve the relative
youthfulness that military service historically required. Asa result, 47 percent of the active-duty enlisted force isbetween the ages of 17 and 24, compared with just19 percent of civilians of prime working age (17 to 49).
60. Report of the President’s Commission on an All-Volunteer Armed Force, p. 51.
61. End strength is the number of personnel on active duty on the lastday of the fiscal year.
62. The National Defense Authorization Act of 2006 (Public Law 109-163) raised the maximum age for enlistees from 35 to 42.The components of the individual services may have lower maxi-mum age limits if they wish. The components of the Army choseto increase their maximum age to 42; the other services have notdone so.

7/30/2019 The All-Volunteer Military: Issues and Performance July 2007
http://slidepdf.com/reader/full/the-all-volunteer-military-issues-and-performance-july-2007 32/49
20 THE ALL-VOLUNTEER MILITARY: ISSUES AND PERFORMANCE
Although active-duty officers are older than enlisted per-sonnel, on average, they too are younger than comparablecivilians (in this case, college graduates in the civilian workforce between the ages of 21 and 49).63 About
73 percent of the active officer corps is less than 40 yearsold, whereas 61 percent of comparable civilians are in thesame age group.
Enlisted reservists tend to be older than active-duty per-sonnel, but they too are younger than their civilian coun-terparts: 32 percent of reserve enlisted personnel are lessthan 25 years old, compared with 19 percent of civiliansof the prime-working-age labor force. Reserve officers, by contrast, are slightly older than comparable civilians: Just48 percent are under age 40, compared with 61 percentof college-educated civilian workers in the 21–49 age
range.
Gender. Although women make up half of civilians of prime working age, they constitute about 14 percent of active-duty enlisted personnel and 16 percent of activeofficers.64 Those numbers have increased steadily sincethe beginning of the all-volunteer force, when roughly 2 percent of military personnel were female.
The increase in the representation of women in the mili-tary can be partly attributed to policy changes by law-
makers and DoD officials. For example, in 1967, thestatutory ceiling that had limited the number of femalepersonnel to no more than 2 percent of the force waslifted.65 Restrictions on the service of women in particu-lar units or occupational skills were eased as well. By 1994, female personnel could serve on naval vessels andaircraft that were assigned to combat, and most military occupations and positions were opened to women.66 However, female service members continue to be barredfrom ground combat occupations (such as infantry andtank crew), from certain types of units (such as special-operations forces), and from Navy submarines.
Although women may not serve in units whose primary mission is to engage in direct ground combat, they fillvarious support roles—such as truck driver or military police—in theaters of combat. Some of the support units
to which women are assigned have engaged with or beenengaged by enemy forces. As of December 2006, approx-imately 10 percent of the 205,000 active U.S. servicemembers deployed in support of operations in Iraq and Afghanistan were women; through that date, about 60 women had been killed in those operations (3 percent of total fatalities).
Race and Ethnicity. To answer the question of who hasbeen fighting in the most recent operations, CBO exam-ined how the representation of racial and ethnic groups inthe armed forces compares with the composition of U.S.
society and the extent to which various racial and ethnicgroups have been represented among deployed personneland fatalities in Iraq and Afghanistan.
Representation in the Force. Predictions that the AVF would be composed mainly of minorities have not cometrue. Members of the U.S. military are racially diverse(see Table 2). As of September 2006, nonwhite servicemembers made up 26 percent of the active enlisted forceand 14 percent of the active officer corps. White servicemembers constituted 68 percent of the enlisted force and81 percent of officers.67 (In each case, the racial composi-
tion of an additional 6 percent of the force wasunknown.)68 Those rates vary by gender, with minoritiesbeing more heavily represented among women.69
63. In 2005, the average age of active-duty officers was 34, whereasthe average age of enlisted personnel was 27.
64. Women’s representation in the reserve components is slightly higher: They made up 17 percent of the reserve enlisted force and19 percent of the reserve officer corps in 2005.
65. That ceiling was contained in Public Law 90-130.
66. See the memorandum from Secretary of Defense William Perry, Application of the Definition of Direct Ground Combat and Assign-ment Rule (July 28, 1994).
67. In 2003, DoD changed its reporting of race and ethnicity. Beforethat year, service members were typically classified as either white,black, Hispanic, or other. The white, black, and other categoriesdid not include people of Hispanic background, who werecounted as a separate group. In 2003, DoD began reporting raceand ethnicity separately. It now typically categorizes service mem-bers’ race as white, black, or other and, separately, their ethnicity as Hispanic or non-Hispanic. Under those definitions, the whiteand black racial categories can include people of Hispanic origin.
The share of service members categorized as white increased by about 6 percent with the redefinition, but the share of enlistedpersonnel in the black category did not change significantly,because relatively few black personnel claim Hispanic origin.
68. Percentages are probably 1 to 2 points higher for nonwhite servicemembers and 3 to 4 points higher for white service members,depending on the composition of personnel whose race wasrecorded as unknown.
69. Racial representation in the reserve components is roughly similarto that in the active-duty force, although nonwhites make up a somewhat smaller percentage.

7/30/2019 The All-Volunteer Military: Issues and Performance July 2007
http://slidepdf.com/reader/full/the-all-volunteer-military-issues-and-performance-july-2007 33/49
THE ALL-VOLUNTEER MILITARY: ISSUES AND PERFORMANCE
Table 2.
Racial and Ethnic Composition of Active-Duty Military Personnel and
U.S. Civilians
Source: Congressional Budget Office based on Department of
Defense, Office of the Under Secretary of Defense for Per-
sonnel and Readiness, Population Representation in the
Military Services: Fiscal Year 2005 (2007), available at
www.humrro.org/poprep/poprep05; and Department of
Defense, Defense Manpower Data Center.
Note: n.a. = not applicable.
a. As of September 2006.
b. As of 2005.
c. Includes Asians, Native Americans, Pacific Islanders, and people
who identify themselves as multiracial, among others.
d. Hispanics may be of any race.
Black service members—the largest minority group in themilitary—were slightly underrepresented among recruitsto the active enlisted force in 2005. They made up13 percent of new recruits that year, versus 14 percent of the U.S. population of prime recruiting age (18 to 24).70 Because black personnel have been a larger share of recruits in the past and because they have relatively highretention rates, however, they account for a larger share of the active enlisted force as a whole: 19 percent, compared
with 14 percent of the civilian population of 17- to 49-year-olds. Black service members make up a smaller per-centage of the active officer corps: 9 percent. That figureis close to their 8 percent share of the population mostcomparable to military officers (college graduates ages 21to 49).
By contrast, people of Hispanic background (who can beof any race) are underrepresented in the military. They make up about 11 percent of the enlisted force and 5 per-cent of the officer corps, despite accounting for about14 percent of civilians ages 17 to 49.
Other racial groups—which include Asians, Native Americans, Pacific Islanders, and people who identify themselves as multiracial—together make up 7 percent of the active enlisted force and 5 percent of the officer corps.Those percentages are roughly comparable to their totalrepresentation among civilians of similar ages (6 percent).
Changes in Representation over Time. The current propor-tion of black personnel in the AVF is higher than thatexperienced during the Vietnam era under the mixed
draft/volunteer force. In 1969, 13 percent of enlisted Army personnel and 11 percent of total enlisted military personnel were black, according to the report of the Pres-ident’s Commission on an All-Volunteer Armed Force(compared with 12 percent of the young male populationat that time).71 Among service members whom the com-mission identified as true volunteers, black representation was higher: 18 percent of enlisted Army volunteers and13 percent of enlisted volunteers as a whole.
Overall, the proportion of black service members grew rapidly after the inception of the all-volunteer force. A
1997 RAND study attributed part of the increase to a risein the percentage of black youth who qualified for servicerelative to nonblack youth.72 More black men ages 18 to21 were scoring in categories I to III on the AFQT thanin earlier years, and more were completing high school.In addition, the study’s author argued that a change in Army testing procedures in 1973 eliminated a culturalbias present in earlier tests. Economic factors also con-tributed to the initial increase in black representation, ascivilian employment options for black youth worsened. According to the study, the unemployment rate for black youth rose by more than 10 percentage points in the mid-
1970s from the level of the late 1960s, while the unem-ployment rate for white youth was more than 5 percent-age points higher in the same period. The proportion of black personnel in the enlisted force as a whole rose to22 percent in the early 1980s and remained at about
70. 2005 was the most recent year for which data on the racial com-position of new recruits and comparably aged civilians were avail-able. The data for the racial composition of the entire force(shown in Table 2) are as of September 2006.
White 68 81 80
Black 19 9 14
All othersc
7 5 6
Unknown 6 6 n.a.
11 5 14
Race
Hispanic Ethnicityd
Enlisted Civilians
Percentage of
Ages 17 to 49b
Percentage of
Personnel Officers
Active-Duty Forcea
71. Report of the President’s Commission on an All-Volunteer Armed Force, pp. 143–144.
72. Cooper, Military Manpower and the All-Volunteer Force, pp. 213–219.

7/30/2019 The All-Volunteer Military: Issues and Performance July 2007
http://slidepdf.com/reader/full/the-all-volunteer-military-issues-and-performance-july-2007 34/49
22 THE ALL-VOLUNTEER MILITARY: ISSUES AND PERFORMANCE
Figure 7.
Percentage of Black Personnel in the Active Enlisted Force, by Service,1973 to 2006
(Percent)
Source: Congressional Budget Office based on data from Department of Defense, Office of the Under Secretary of Defense for Personnel and
Readiness, Population Representation in the Military Services (various years); and Department of Defense, Defense Manpower Data
Center.
a. The definitions of the military’s self-reported racial and ethnic categories changed in 2003. Before then, the “black” and “white” catego-
ries did not include people of Hispanic background. After the change, those racial categories included people of Hispanic origin (who can
be of any race). The percentages in the “black” category did not change significantly, however, because few black service members iden-
tify themselves as Hispanic.
21 percent to 23 percent through 2001, although it hasdeclined somewhat since then.
Black people’s representation in the enlisted force has var-
ied by service, with black soldiers consistently making upa larger proportion of the Army than of the other services(see Figure 7). On average, black service members
accounted for 29 percent of enlisted personnel in the Army between 1973 and 2006, versus 18 percent in theMarine Corps, 17 percent in the Air Force, and 16 per-cent in the Navy. (In recent years, however, the differencein participation rates between the Navy and Army haslargely disappeared.) The average for the enlisted force as
a whole over that 33-year period was 21 percent—largerthan the percentage in September 2006.
The pattern of increased participation by black personnelin the early AVF was more pronounced in the Army thanin the other services. Black representation in the Army
climbed from 18 percent in 1973 to a peak of 33 percent
in the early 1980s. It dipped temporarily in the mid-1980s before beginning a gradual decline, from 32 per-cent in 1990 to 29 percent in 2000. Although black sol-diers still make up more than one-fifth of the Army, theirrepresentation has experienced a large, steady drop since2001, partly because of a decline in black enlistment.73 According to the most recent data that CBO obtainedfrom DoD, the percentage of Army recruits without priorservice who are black dropped from 22 percent to 14 per-cent between 2001 and 2004. (For the active componentsof the four services as a whole, that percentage fell from
20 percent to 15 percent over the 2001–2004 period.)
Economic factors may be partly responsible for the lowershare of black recruits. Compared with levels in 2000,
1973 1976 1979 1982 1985 1988 1991 1994 1997 2000 2003 2006
0
5
10
15
20
25
30
35
Army
Navy
Total DoD
Air Force
Marine Corps
2003a
73. The proportion of the Marine Corps that is black has alsodeclined significantly, from 16 percent in 2001 to 11 percent in2006. Over that period, the Air Force experienced a smaller drop(from 18 to 17 percent), while the proportion in the Navy remained stable (at 21 percent).

7/30/2019 The All-Volunteer Military: Issues and Performance July 2007
http://slidepdf.com/reader/full/the-all-volunteer-military-issues-and-performance-july-2007 35/49
THE ALL-VOLUNTEER MILITARY: ISSUES AND PERFORMANCE
Figure 8.
Percentage of Hispanic Personnel in the Active Enlisted Force, by Service,1973 to 2006
(Percent)
Source: Congressional Budget Office based on data from Department of Defense, Office of the Under Secretary of Defense for Personnel and
Readiness, Population Representation in the Military Services (various years); and Department of Defense, Defense Manpower Data
Center.
Notes: People of Hispanic origin can be of any race.
Data on percentages of Hispanic personnel were not available for the Air Force before 1975 and not available for the Marine Corps and
Army (and hence for DoD as a whole) before 1976.
unemployment rates have increased more for white youththan for black youth in recent years, which may have ledmore white people to consider the military. Significantincreases in military pay and benefits (such as above-average raises in basic pay and allowances) took effect atroughly the same time. Together, those factors may havechanged the relative attractiveness of military service tosome racial groups.
The proportion of Hispanics in the active enlisted forcehas also risen during the AVF years (see Figure 8). The
Marine Corps had the highest proportion of Hispanicenlisted personnel starting in the late 1970s, with furtherincreases since then. Between 1976 and 2006, on average,Hispanic members made up 9 percent of enlisted person-nel in the Marine Corps, 6 percent in the Army andNavy, and 4 percent in the Air Force. By comparison,the Hispanic population as a whole grew from 11 million(5 percent of the U.S. population) to 43 million (14 per-cent) over the 1973–2005 period.74
Military Occupations, Deployment, and Fatalities. One of
the concerns expressed about instituting an all-volunteer
force was the possibility that certain minority groups
might bear more than their share of combat and casual-
ties because they would make up a larger proportion of
the military than of the U.S. population.75 To explore
that issue, CBO obtained data from DoD on racial repre-
sentation by military occupation, deployment status, and
number of fatalities among active and reserve personnel
deployed in support of Operation Enduring Freedom
(OEF) in Afghanistan and Operation Iraqi Freedom
(OIF). CBO compared those data with the racial and
1973 1976 1979 1982 1985 1988 1991 1994 1997 2000 2003 2006
0
2
4
6
8
10
12
14
16
Army
Navy
Total DoD
Air Force
Marine Corps
74. Data on people of Hispanic or Latino origin come from Bureau of the Census, Statistical Abstract of the United States (various years).
75. For more on that issue, see Rostker, I Want You! The Evolution of the All-Volunteer Force; and Charles C. Moskos and John Sibley Butler, All That We Can Be: Black Leadership and Racial Integra-tion the Army Way (New York: Basic Books, 1996).
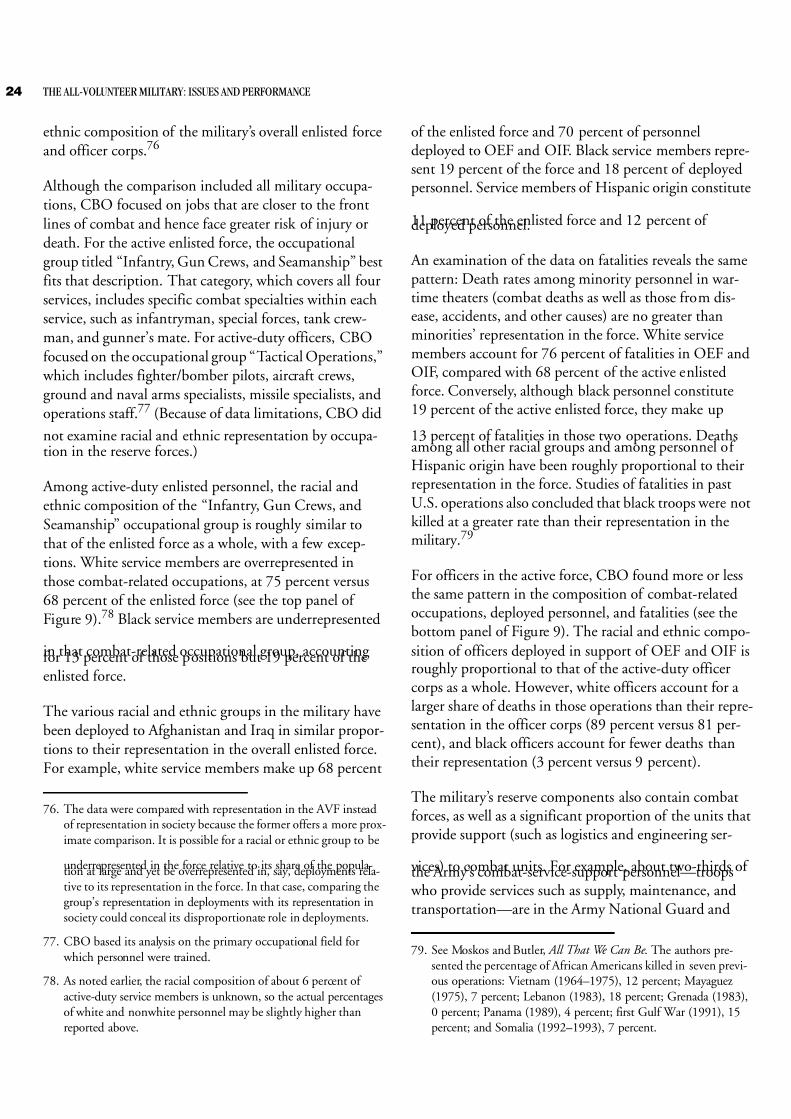
7/30/2019 The All-Volunteer Military: Issues and Performance July 2007
http://slidepdf.com/reader/full/the-all-volunteer-military-issues-and-performance-july-2007 36/49
24 THE ALL-VOLUNTEER MILITARY: ISSUES AND PERFORMANCE
ethnic composition of the military’s overall enlisted forceand officer corps.76
Although the comparison included all military occupa-tions, CBO focused on jobs that are closer to the frontlines of combat and hence face greater risk of injury ordeath. For the active enlisted force, the occupationalgroup titled “Infantry, Gun Crews, and Seamanship” bestfits that description. That category, which covers all fourservices, includes specific combat specialties within eachservice, such as infantryman, special forces, tank crew-man, and gunner’s mate. For active-duty officers, CBOfocused on the occupational group “Tactical Operations,” which includes fighter/bomber pilots, aircraft crews,ground and naval arms specialists, missile specialists, andoperations staff.77 (Because of data limitations, CBO did
not examine racial and ethnic representation by occupa-tion in the reserve forces.)
Among active-duty enlisted personnel, the racial andethnic composition of the “Infantry, Gun Crews, andSeamanship” occupational group is roughly similar tothat of the enlisted force as a whole, with a few excep-tions. White service members are overrepresented inthose combat-related occupations, at 75 percent versus68 percent of the enlisted force (see the top panel of Figure 9).78 Black service members are underrepresented
in that combat-related occupational group, accounting for 13 percent of those positions but 19 percent of theenlisted force.
The various racial and ethnic groups in the military havebeen deployed to Afghanistan and Iraq in similar propor-tions to their representation in the overall enlisted force.For example, white service members make up 68 percent
of the enlisted force and 70 percent of personneldeployed to OEF and OIF. Black service members repre-sent 19 percent of the force and 18 percent of deployedpersonnel. Service members of Hispanic origin constitute
11 percent of the enlisted force and 12 percent of deployed personnel.
An examination of the data on fatalities reveals the samepattern: Death rates among minority personnel in war-time theaters (combat deaths as well as those from dis-ease, accidents, and other causes) are no greater thanminorities’ representation in the force. White servicemembers account for 76 percent of fatalities in OEF andOIF, compared with 68 percent of the active enlistedforce. Conversely, although black personnel constitute19 percent of the active enlisted force, they make up
13 percent of fatalities in those two operations. Deathsamong all other racial groups and among personnel of Hispanic origin have been roughly proportional to theirrepresentation in the force. Studies of fatalities in pastU.S. operations also concluded that black troops were notkilled at a greater rate than their representation in themilitary.79
For officers in the active force, CBO found more or lessthe same pattern in the composition of combat-relatedoccupations, deployed personnel, and fatalities (see thebottom panel of Figure 9). The racial and ethnic compo-
sition of officers deployed in support of OEF and OIF isroughly proportional to that of the active-duty officercorps as a whole. However, white officers account for a larger share of deaths in those operations than their repre-sentation in the officer corps (89 percent versus 81 per-cent), and black officers account for fewer deaths thantheir representation (3 percent versus 9 percent).
The military’s reserve components also contain combatforces, as well as a significant proportion of the units thatprovide support (such as logistics and engineering ser-
vices) to combat units. For example, about two-thirds of the Army’s combat-service-support personnel—troops who provide services such as supply, maintenance, andtransportation—are in the Army National Guard and
76. The data were compared with representation in the AVF insteadof representation in society because the former offers a more prox-imate comparison. It is possible for a racial or ethnic group to be
underrepresented in the force relative to its share of the popula-tion at large and yet be overrepresented in, say, deployments rela-tive to its representation in the force. In that case, comparing thegroup’s representation in deployments with its representation insociety could conceal its disproportionate role in deployments.
77. CBO based its analysis on the primary occupational field for which personnel were trained.
78. As noted earlier, the racial composition of about 6 percent of active-duty service members is unknown, so the actual percentagesof white and nonwhite personnel may be slightly higher thanreported above.
79. See Moskos and Butler, All That We Can Be . The authors pre-sented the percentage of African Americans killed in seven previ-ous operations: Vietnam (1964–1975), 12 percent; Mayaguez(1975), 7 percent; Lebanon (1983), 18 percent; Grenada (1983),0 percent; Panama (1989), 4 percent; first Gulf War (1991), 15percent; and Somalia (1992–1993), 7 percent.

7/30/2019 The All-Volunteer Military: Issues and Performance July 2007
http://slidepdf.com/reader/full/the-all-volunteer-military-issues-and-performance-july-2007 37/49
THE ALL-VOLUNTEER MILITARY: ISSUES AND PERFORMANCE
Figure 9.
Racial and Ethnic Representation in Military Occupational Specialties,Deployments, and Fatalities Among Active-Duty Personnel
(Percent)
Source: Congressional Budget Office based on data from Department of Defense, Office of the Under Secretary of Defense for Personnel and
Readiness, Population Representation in the Military Services: Fiscal Year 2005 (2007), available at www.humrro.org/poprep/
poprep05; Department of Defense, Statistical Information Analysis Division; and Department of Defense, Defense Manpower Data
Center.
Notes: OEF = Operation Enduring Freedom; OIF = Operation Iraqi Freedom. Data on personnel deployments and fatalities for those opera-
tions are as of December 2006.
“Other Race” includes Asians, Native Americans, Pacific Islanders, and people who identify themselves as multiracial, among others.
People of Hispanic origin can be of any race.
The racial composition of about 6 percent of active enlisted personnel and officers is unknown. Depending on their actual racial com-
position, the percentages of white and nonwhite service members should be somewhat higher than shown here.
White Black Other Race
or Unknown
Hispanic
0
10
20
30
40
50
60
70
80
90
Percentage of Active Enlisted Force
Percentage in Infantry, Gun Crews, and Seamanship Specialties
Percentage of Personnel Deployed to OEF and OIF
Percentage of Fatalities from OEF and OIF
Active Enlisted Personnel
White Black Other Race
or Unknown
Hispanic
0
10
20
30
40
50
60
70
80
90
Percentage of Active Officer Corps
Percentage in Tactical Operations Specialties
Percentage of Personnel Deployed to OEF and OIF
Percentage of Fatalities from OEF and OIF
Active Officers

7/30/2019 The All-Volunteer Military: Issues and Performance July 2007
http://slidepdf.com/reader/full/the-all-volunteer-military-issues-and-performance-july-2007 38/49
26 THE ALL-VOLUNTEER MILITARY: ISSUES AND PERFORMANCE
Figure 10.
Racial and Ethnic Representation in Deployments and Fatalities Among Reserve Personnel
(Percent)
Source: Congressional Budget Office based on data from Department of Defense, Office of the Under Secretary of Defense for Personnel and
Readiness, Population Representation in the Military Services: Fiscal Year 2005 (2007), available at www.humrro.org/poprep/
poprep05; Department of Defense, Statistical Information Analysis Division; and Department of Defense, Defense Manpower Data
Center.
Notes: OEF = Operation Enduring Freedom; OIF = Operation Iraqi Freedom. Data on personnel deployments and fatalities for those opera-
tions are as of December 2006.“Other Race” includes Asians, Native Americans, Pacific Islanders, and people who identify themselves as multiracial, among others.
People of Hispanic origin can be of any race.
The racial composition of about 5 percent of reserve enlisted personnel and officers is unknown. Depending on their actual racial com-
position, the percentages of white and nonwhite service members should be somewhat higher than shown here.
Because of data limitations, CBO did not examine the occupational representation of the reserve forces.
White Black Other Race
or Unknown
Hispanic
0
10
20
30
40
50
60
70
80
90
Percentage of Reserve Enlisted Force
Percentage of Personnel Deployed to OEF and OIF
Percentage of Fatalities from OEF and OIF
Reserve Enlisted Personnel
White Black Other Race
or Unknown
Hispanic
0
10
20
30
40
50
60
70
80
90
Percentage of Reserve Officer Corps
Percentage of Personnel Deployed to OEF and OIF
Percentage of Fatalities from OEF and OIF
Reserve Officers

7/30/2019 The All-Volunteer Military: Issues and Performance July 2007
http://slidepdf.com/reader/full/the-all-volunteer-military-issues-and-performance-july-2007 39/49
THE ALL-VOLUNTEER MILITARY: ISSUES AND PERFORMANCE
Army Reserve. Since the onset of the war on terrorism,units in the reserve components have been called up anddeployed in large numbers.
The composition of reserve personnel deployed in sup-port of Operations Enduring Freedom and Iraqi Freedomis roughly similar to the makeup of the reserve forces, andminorities are not overrepresented among reservists’deaths in those operations (see Figure 10). In both theenlisted and officer ranks of the reserves, white personnelmake up a greater share of fatalities than they do of theforce (82 percent versus 75 percent for enlisted personnel,and 88 percent versus 82 percent for officers).80 The con-verse is true for enlisted reservists from minority groups.For example, black service members account for 10 per-cent of deaths among enlisted reservists in OEF and OIF
but 16 percent of the reserve force as a whole. For His-panic personnel, the figures are 5 percent versus 9 per-cent. Among the relatively small number of black reserveofficers, fatalities have been in line with representation inthe officer corps.
Geographic Representation. Young people in differentregions of the United States enlist in the military at differ-ent rates. The factors that affect geographic representa-tion among new recruits include how local civilian wagesand salaries compare with military pay, local rates of
unemployment and college enrollment, and other demo-graphic patterns. Changes in those factors in one regionrelative to another can also influence how geographicrepresentation shifts over time.
A region’s share of military recruits can also be affected by changes in the overall geographic distribution of the U.S.population, especially the population between the ages of 18 and 24. To control for that effect, CBO used represen-tation ratios ⎯ the percentage of all new recruits from a region relative to the percentage of all 18- to 24-year-olds
from that region ⎯
to examine differences in the geo-graphic representation of recruits among four parts of thecountry in 1980, 1990, 2000, and 2005 (the years for which data were available).81 A ratio of less than 1.0
indicates that an area is relatively underrepresented; a ratio greater than 1.0 indicates the opposite.
In each of the years in CBO’s analysis, the South suppliedmore recruits than its share of the youth population, asindicated by representation ratios over 1.0 (see Figure11). Moreover, that region’s importance to the military has grown over time. The West has also become moreimportant as a source of recruits. Whereas it was under-represented in earlier years, by 2005, the percentage of recruits from the West was roughly on a par with its shareof the youth population. The representation of theNortheast has declined since 1980; it was underrepre-sented among new recruits in 2005, with a ratio of lessthan 0.8. The representation of the Midwest region hasfluctuated, but that part of country was just about evenly
represented in 2005, with a representation ratio of almost1.0.82
Socioeconomic Status. One of the key concerns about anall-volunteer force has been that it would disproportion-ately consist of recruits from lower-income households, while young people from middle- and upper-incomehouseholds would opt out of military service altogether.Previous studies by various researchers and new analysisby CBO suggest that individuals from all income groupsare represented roughly proportionately in the enlistedranks of the AVF. However, CBO’s tabulations indicate
that young people from the very highest- and lowest-income families may be somewhat less likely than othersto join the military. (None of the studies examined thesocioeconomic backgrounds of people who join theofficer corps, apparently because of data limitations.)83
Studies Using Zip-Code-Based Data . Reliable informationon the socioeconomic status of recruits—as measured by their family’s income, wealth, or occupations—is scarce.The Department of Defense does not regularly collectinformation about recruits’ family background. And in
80. The racial composition of an additional 5 percent of reserveenlisted personnel and officers was unknown. Representation isprobably 3 to 4 percentage points higher than stated for whitereservists and 1 to 2 percentage points higher for nonwhite reserv-ists, depending on the composition of personnel whose race wasrecorded as unknown.
81. This analysis uses the Census Bureau’s definition of regions, asdescribed in Figure 11.
82. The Midwest region was referred to as the North Central regionuntil 1984, when that designation was changed.
83. Although no data are available that detail the distribution of income among officers before they joined the military, becausepeople are required to have college degrees to serve as officers,and because earning a college degree is correlated with parentalincome, officers may be less likely than enlisted personnel to comefrom lower-income households.

7/30/2019 The All-Volunteer Military: Issues and Performance July 2007
http://slidepdf.com/reader/full/the-all-volunteer-military-issues-and-performance-july-2007 40/49
28 THE ALL-VOLUNTEER MILITARY: ISSUES AND PERFORMANCE
Figure 11.
Changes in the GeographicRepresentation of Recruits Since 1980
(Representation ratio)
Source: Congressional Budget Office based on data from Depart-
ment of Defense, Office of the Under Secretary of Defense
for Personnel and Readiness, Population Representation in the Military Services (various years); and Department of
Commerce, Bureau of the Census.
Notes: The numbers shown here are representation ratios, which
account for geographic changes in the U.S. population over
time by measuring the percentage of all new recruits from a
region relative to the percentage of all 18- to 24-year-olds
from that region. A representation ratio greater than 1.0
means that a region is overrepresented, whereas a ratio less
than 1.0 implies that the region is underrepresented.
According to the Census Bureau's definition of regions,
“Midwest” (formerly “North Central”) consists of Ohio,
Indiana, Illinois, Michigan, Wisconsin, Minnesota, Iowa,
Missouri, North Dakota, South Dakota, Nebraska, and Kan-
sas. “Northeast” contains Maine, New Hampshire, Vermont,
Massachusetts, Rhode Island, Connecticut, New York, New
Jersey, and Pennsylvania. “South” covers Delaware, Mary-
land, the District of Columbia, Virginia, West Virginia, North
Carolina, South Carolina, Georgia, Florida, Kentucky, Tennes-
see, Alabama, Mississippi, Arkansas, Louisiana, Oklahoma,
and Texas. “West” consists of Montana, Idaho, Wyoming,
Colorado, New Mexico, Arizona, Utah, Nevada, Washington,
Oregon, California, Alaska, and Hawaii.
any case, recruits’ knowledge of their parents’ financial well-being may be incomplete or inaccurate.
As an alternative, several researchers have compared thecharacteristics of areas where recruits lived before joining the military with the home areas of their civilian counter-parts, using census data. The Census Bureau providesaggregated data on population, income, and broad demo-graphic characteristics in five-digit zip-code areas formost of the U.S. population. Lacking data on individuals,researchers have used the median incomes in recruits’home zip-code areas to measure their socioeconomicbackground and compared those median incomes with a civilian income distribution. That method gives a senseof whether recruits come from a representative mix of lower-, middle-, and higher-income areas.
To accurately reflect the family background of recruits,the median incomes in recruits’ home zip-code areas mustclosely approximate the median incomes of the recruits’families themselves. If recruits are drawn from the lower(or higher) end of the income distribution in their zip-code area, the results will overstate (or understate) theportion of recruits who come from higher-income fami-lies. It is easy to imagine a zip-code area consisting largely of older retired people on fixed incomes, in which theparents of military recruits are in the workforce and thushave above-average incomes. It is equally easy to imagine
a zip code in a wealthy suburb, in which the higher-income families send most of their children to college while the less-affluent youth consider military service.The greater the variation in income within a zip code, thelarger the errors that can result from relying solely onmedian values.
Compounding that problem, income comparisons arealso highly sensitive to the particular civilian comparisongroup that a researcher chooses. Because the vast majority of recruits enter the military directly from high school,having presumably lived with their parents or guardians,the most appropriate group for comparison is householdsheaded by parents or guardians of civilian youth. How-ever, income distributions for that subset of householdsare not readily available.
All the studies known to CBO use a similar methodology to determine the distribution of income of recruits’ homeareas; however, each study uses a different civilian popula-tion group for the income comparisons. For example, a
Midwest Northeast South West
0.0
0.2
0.4
0.6
0.8
1.0
1.2
1980 1990 2000 2005
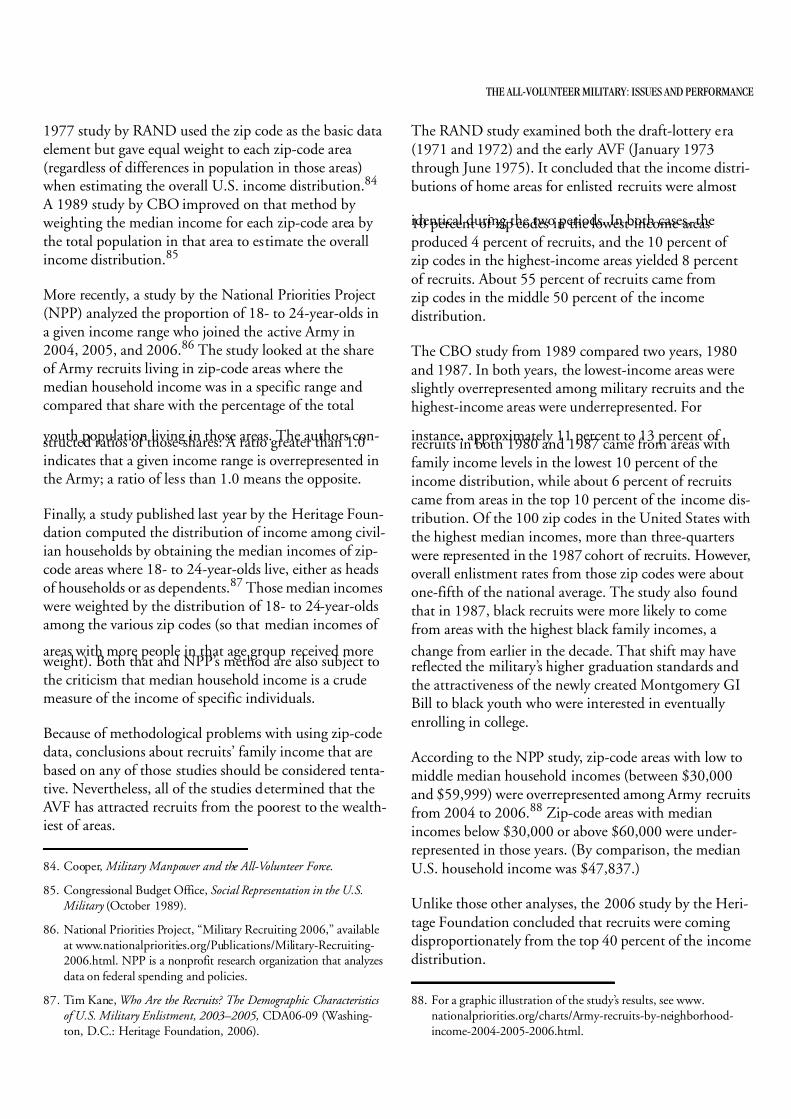
7/30/2019 The All-Volunteer Military: Issues and Performance July 2007
http://slidepdf.com/reader/full/the-all-volunteer-military-issues-and-performance-july-2007 41/49
THE ALL-VOLUNTEER MILITARY: ISSUES AND PERFORMANCE
1977 study by RAND used the zip code as the basic data element but gave equal weight to each zip-code area (regardless of differences in population in those areas) when estimating the overall U.S. income distribution.84 A 1989 study by CBO improved on that method by weighting the median income for each zip-code area by the total population in that area to estimate the overallincome distribution.85
More recently, a study by the National Priorities Project(NPP) analyzed the proportion of 18- to 24-year-olds ina given income range who joined the active Army in2004, 2005, and 2006.86 The study looked at the shareof Army recruits living in zip-code areas where themedian household income was in a specific range andcompared that share with the percentage of the total
youth population living in those areas. The authors con-structed ratios of those shares: A ratio greater than 1.0indicates that a given income range is overrepresented inthe Army; a ratio of less than 1.0 means the opposite.
Finally, a study published last year by the Heritage Foun-dation computed the distribution of income among civil-ian households by obtaining the median incomes of zip-code areas where 18- to 24-year-olds live, either as headsof households or as dependents.87 Those median incomes were weighted by the distribution of 18- to 24-year-oldsamong the various zip codes (so that median incomes of
areas with more people in that age group received more weight). Both that and NPP’s method are also subject tothe criticism that median household income is a crudemeasure of the income of specific individuals.
Because of methodological problems with using zip-codedata, conclusions about recruits’ family income that arebased on any of those studies should be considered tenta-tive. Nevertheless, all of the studies determined that the AVF has attracted recruits from the poorest to the wealth-iest of areas.
The RAND study examined both the draft-lottery era (1971 and 1972) and the early AVF (January 1973through June 1975). It concluded that the income distri-butions of home areas for enlisted recruits were almost
identical during the two periods. In both cases, the10 percent of zip codes in the lowest-income areasproduced 4 percent of recruits, and the 10 percent of zip codes in the highest-income areas yielded 8 percentof recruits. About 55 percent of recruits came fromzip codes in the middle 50 percent of the incomedistribution.
The CBO study from 1989 compared two years, 1980and 1987. In both years, the lowest-income areas wereslightly overrepresented among military recruits and thehighest-income areas were underrepresented. For
instance, approximately 11 percent to 13 percent of recruits in both 1980 and 1987 came from areas withfamily income levels in the lowest 10 percent of theincome distribution, while about 6 percent of recruitscame from areas in the top 10 percent of the income dis-tribution. Of the 100 zip codes in the United States withthe highest median incomes, more than three-quarters were represented in the 1987 cohort of recruits. However,overall enlistment rates from those zip codes were aboutone-fifth of the national average. The study also foundthat in 1987, black recruits were more likely to comefrom areas with the highest black family incomes, a
change from earlier in the decade. That shift may havereflected the military’s higher graduation standards andthe attractiveness of the newly created Montgomery GIBill to black youth who were interested in eventually enrolling in college.
According to the NPP study, zip-code areas with low tomiddle median household incomes (between $30,000and $59,999) were overrepresented among Army recruitsfrom 2004 to 2006.88 Zip-code areas with medianincomes below $30,000 or above $60,000 were under-represented in those years. (By comparison, the medianU.S. household income was $47,837.)
Unlike those other analyses, the 2006 study by the Heri-tage Foundation concluded that recruits were coming disproportionately from the top 40 percent of the incomedistribution.
84. Cooper, Military Manpower and the All-Volunteer Force .
85. Congressional Budget Office, Social Representation in the U.S. Military (October 1989).
86. National Priorities Project, “Military Recruiting 2006,” availableat www.nationalpriorities.org/Publications/Military-Recruiting-2006.html. NPP is a nonprofit research organization that analyzesdata on federal spending and policies.
87. Tim Kane, Who Are the Recruits? The Demographic Characteristics of U.S. Military Enlistment, 2003–2005, CDA06-09 (Washing-ton, D.C.: Heritage Foundation, 2006).
88. For a graphic illustration of the study’s results, see www.nationalpriorities.org/charts/Army-recruits-by-neighborhood-income-2004-2005-2006.html.

7/30/2019 The All-Volunteer Military: Issues and Performance July 2007
http://slidepdf.com/reader/full/the-all-volunteer-military-issues-and-performance-july-2007 42/49
30 THE ALL-VOLUNTEER MILITARY: ISSUES AND PERFORMANCE
Figure 12.
Distribution of Active-Duty Enlisted Personnel, by Family Income Prior toMilitary Service
(Percent)
Source: Congressional Budget Office based on data for 2000 from the National Longitudinal Survey of Youth conducted by the Department
of Labor’s Bureau of Labor Statistics.
Analysis Using Parent-Reported Data . To avoid some of theproblems of the approach based on zip codes, CBOrecently analyzed the family incomes of young people
using the National Longitudinal Survey of Youth(NLSY). The survey sample that CBO used includesmore than 5,000 teenagers who were first interviewed in1997 and have been reinterviewed each year since then.CBO identified the young people in that survey who were serving in the enlisted ranks of the active-duty mili-tary in 2000, between the ages of 17 and 21, and com-pared their family incomes before their military service with the family incomes of the rest of the young people inthe survey.89 Unlike in the previous studies, that sampledoes not represent new recruits in a particular year (inthis case, 2000) but rather young enlistees as of that year.
An advantage of that method is that it uses direct infor-mation about the socioeconomic background of therecruits as reported by their parents. Additionally, the
civilian comparison group consists of other households with teenage children residing in them, an appropriatecomparison. The disadvantage of using the NLSY is that
the sample of enlisted service members in the survey totaled just over 100 people, albeit weighted to reflect thetotal U.S. population. Because of the small sample size,these results should also be considered tentative.
CBO’s analysis suggests that youth are represented in themilitary at all socioeconomic levels. However, young peo-ple from the lowest-income and highest-income familiesare less likely to be represented in the enlisted force thantheir peers (see Figure 12). By contrast, young people whose family incomes are in the 10th to 25th percentiles,
the 25th to 50th percentiles, and the 75th to 90th per-centiles are slightly overrepresented in the military.
Those results are consistent with a DoD survey of recruitsconducted in 1999 that compared selected characteristicsof recruits’ family backgrounds with those of their civiliancounterparts.90 The employment status of their fathers
Lowest 10
Percent
10 to 25
Percent
25 to 50
Percent
50 to 75
Percent
75 to 90
Percent
Highest 10
Percent
0
5
10
15
20
25
30
Income Category (Based on families with recruit-age youths)
Families of Enlisted Personnel
Families with Recruit-Age Youths
89. The NLSY sample draws disproportionately from the lower end of the income distribution. CBO weighted the full sample to repre-sent U.S. households with children in residence. As a result, thecharacteristics of the military subset of that sample should be rep-resentative of young enlisted personnel in 2000. Because of theages of the young people included in the NLSY, CBO’s sample didnot contain any military officers.
90. Department of Defense, Population Representation in the Military Services, Fiscal Year 1999 (November 2000), available at www.dod.mil/prhome/poprep99/.

7/30/2019 The All-Volunteer Military: Issues and Performance July 2007
http://slidepdf.com/reader/full/the-all-volunteer-military-issues-and-performance-july-2007 43/49
THE ALL-VOLUNTEER MILITARY: ISSUES AND PERFORMANCE
was almost identical for recruits and recruit-age civilians:90 percent and 89 percent, respectively, were employed.The distribution of occupations for the two groups’fathers was broadly similar, though with some differences:fewer recruits had fathers who were employed in the typi-cally higher-paid executive, administrative, managerial, orprofessional occupations than the recruit-age civilianpopulation did (25 percent versus 34 percent).
CBO’s results are also broadly consistent with the NPPstudy’s findings that zip-code areas with householdincomes well below and well above the median income were underrepresented among recruits, whereas areas inthe low-to-middle range of household incomes were over-represented. (Neither of those studies is consistent withthe Heritage Foundation’s conclusion that recruits come
disproportionately from the top 40 percent of the incomedistribution.)
Some Implications of Reinstating the Draft Currently, young men are required to register for a possi-ble military draft with the Selective Service System within30 days of their 18th birthday. The system is charged with providing untrained personnel (or people with pro-fessional health care skills) to the Department of Defensefor military service if directed by the Congress and the
President in a national crisis. Although the SelectiveService System does not classify the readiness of regis-trants for military service, it employs part-time statedirectors and has thousands of trained, unpaid volunteersfor local review and appeal boards who would classify reg-istrants as required in a time of national emergency.
Should the nation decide to resume a draft under the cur-rent governing statute (the Military Selective Service Actof 1940, as amended), a defined sequence of events would occur before draftees began to enter military train-ing.91 The first step required would be for the Congressand President to enact a law authorizing a resumption of an active draft. A random lottery would then be held todetermine which registered men would be called up forpossible induction.92 (Multiple lotteries could be con-ducted over the course of the national emergency,depending on the number of draftees required.) Menbetween the ages of 18 and 26 would be liable for
induction, although current plans state that men whoturn 20 during the draft year would be called first, fol-lowed in age sequence by 21-year-olds through 25-year-olds, as needed.
After the lottery, registrants who had been called up would report to a military entrance-processing station fora physical, mental, and moral evaluation to determine whether they were fit for military service. Registrantscould then file a claim for exemption, postponement, ordeferment based on existing statutory regulations. Con-currently, Selective Service workers would report for duty,and local review and appeal boards would begin process-ing registrants’ claims. DoD requires the Selective ServiceSystem to begin delivering inductees within 193 days of starting operations.
Revisions to the Military Selective Service Act in the late1960s and early 1970s limited deferments from military training and service, particularly those based on attending college or graduate school. Under current law, undergrad-uate students who were selected for service would beallowed to complete their semester or, in some cases, theirfull year of school. Deferments for married men are notpermitted, although deferments for people who havedependents or are employed in certain occupations may be granted on a case-by-case basis.
Besides procedural considerations, a reinstatement of thedraft would raise various substantive issues related toforce size and personnel policies in the military. Thoseissues include the size of the draft and its effect on thepersonnel structure of the armed forces, the amount of time that would be needed for draftees to be availablefor deployment, possible budgetary effects, and equity considerations.
Size of the Draft and Effects on Personnel StructureThe U.S. military currently consists of 1.4 million per-sonnel in the active component and 840,000 personnel
in the National Guard and Reserve. Of those, about205,000 were deployed in support of Operations Endur-ing Freedom and Iraqi Freedom in December 2006.
91. Those steps are laid out at the Selective Service System’s Web site, www.sss.gov/seq.htm.
92. The Military Selective Service Act, 50 U.S.C. Appendix 451 etseq., describes the eligibility and procedures for induction under a draft as well as permissible exemptions and deferments. As cur-rently written, the law refers specifically to “male persons” in stat-ing who must register and who would be drafted. If lawmakers
wished to include women in the draft, the Selective Service Act would have to be amended.
7/30/2019 The All-Volunteer Military: Issues and Performance July 2007
http://slidepdf.com/reader/full/the-all-volunteer-military-issues-and-performance-july-2007 44/49
32 THE ALL-VOLUNTEER MILITARY: ISSUES AND PERFORMANCE
Some of the factors that would bring about a decision toreinstate the draft would probably also affect the size of the draft. For instance, if the draft was intended to aug-ment the current force in order to relieve stresses related
to the war on terrorism, it would be a particular size. Butif the draft was designed to completely replace the currentall-volunteer force with inductees, it would be much big-ger. Whatever the case, a draft would lead to changes inthe military’s accession requirements and in the experi-ence and seniority levels of the force.
To give a rough idea of possible changes, CBO examinedthe likely force structure of the active Army under variousscenarios, assuming that it either remained an all-volunteer force or used a draft to supplement or almost wholly replace volunteers. For that analysis, CBO first
estimated the accession levels and continuation rates forservice members at each level of experience that would berequired for the current all-volunteer Army to achieve itsend-strength goal for 2012 (as expressed in the latestFuture Years Defense Program).93 That goal is 547,400soldiers: 92,700 officers and 454,700 enlisted person-nel.94 Then, CBO considered what would happen to endstrength if voluntary accessions and continuation ratesfell and draftees were used to make up the gap. For thescenarios that envision a mixed draft/volunteer force,CBO assumed that draftees would be required to servefor two consecutive years, as stipulated in the Military
Selective Service Act. Volunteers would serve the sameinitial terms of active service that they do now, whichgenerally range from four to six years.
Personnel Requirements Under an All-Volunteer Force.Expanding the active Army from 419,350 enlisted per-sonnel at the end of 2006 to 454,700 by the end of 2012 with an all-volunteer force would require the service torecruit and retain significant numbers of personnel. Inthe past few years, the Army has boosted recruiting
resources, such as enlistment bonuses, as well as financialincentives to retain people already in the service (selectivereenlistment bonuses). The Army’s recruiting target for2007 is 80,000 enlisted personnel, the same as in the two
previous years. Although the Army fell short of that goalin 2005 (obtaining 73,400 accessions), it achieved thatlevel in 2006.95 The overall continuation rate for existing personnel in 2005, 82.4 percent, was below the averagerate experienced since 1990. But in 2006, the Army wasable to turn that situation around and post one of thehighest continuation rates of the previous 15 years,84.5 percent overall.
In its first scenario, CBO assumed that the Army wouldmaintain accessions and continuation rates at their 2006levels in coming years. In that case, the service wouldreach its end-strength goal by 2012 (see Table 3). How-ever, the combination of accession numbers and continu-ation rates at those levels has not been sustained at any time during the past 15 years.
In scenario 2, CBO assumed that continuation rates would drop to a mix of the 2005 and 2006 levels. Thatmight occur either because reenlistment incentives werescaled back, other DoD policies changed, or the retentionenvironment worsened. The Army would then need torecruit a larger number of personnel into the enlisted
force—between 86,000 and 90,000 a year—to meet its2012 target for end strength. However, the Army has notattracted that many recruits in any year since 1990.
In scenario 3, CBO assumed not only that continuationrates would drop to a mix of the 2005 and 2006 levelsbut also that voluntary enlistments would fall to 74,000 a year (roughly the number of recruits in 2005). In thatcase, the Army would fall short of its end-strength goal by almost 48,000 enlisted personnel in 2012.
Personnel Requirements Under a Mixed Force of Volun-
teers and Draftees. In its other three scenarios, CBOexplored the implications of using draftees to eliminatethe end-strength shortfall that would result if voluntary accessions fell or were restricted to less than last year’s
93. Continuation rates measure the proportion of service members who remain in the military over a specific period regardless of theexpiration of their contracts. For detailed information on themethodology that CBO used, see Congressional Budget Office,Recruiting, Retention, and Future Levels of Military Personnel .
94. If the size of U.S. forces in the Iraq theater fell to 15 brigades andremained at that level while the Army grew to 547,400 personnelby 2012, ground combat forces in the active components (includ-ing Marine Corps units) would have two units at their home sta-tions for every unit deployed—a rotation ratio that meets the
Army’s goals.
95. In 2007, the Army met its monthly recruiting goals for the firstseven months of the fiscal year but missed its targets for May and
June. See Josh White, “Army’s Recruiting Goal Lags for SecondMonth in a Row,” Washington Post, July 10, 2007, p. A7.

7/30/2019 The All-Volunteer Military: Issues and Performance July 2007
http://slidepdf.com/reader/full/the-all-volunteer-military-issues-and-performance-july-2007 45/49
THE ALL-VOLUNTEER MILITARY: ISSUES AND PERFORMANCE
Table 3.
Effects of Voluntary and Draft Accessions on Future End Strength in the Active Army’s Enlisted Force
Source: Congressional Budget Office.
Notes: Accessions are recruits who sign contracts with the military and report to basic training. Continuation rates measure the proportion of
service members who remain in the military over a specific period (usually one year) regardless of the expiration of their contracts.
End strength is the number of personnel on active duty on the last day of the fiscal year.
The active Army had 73,400 accessions in 2005 and 80,000 in 2006. Overall continuation rates in those years were 82.4 percent and
84.5 percent, respectively. End strength in 2006 was 505,400 enlisted personnel.
a. Scenarios 4, 5, and 6 assume that the draft would begin in 2008. In the initial years, annual numbers of draftees would be smaller than
the numbers shown here for 2012.
b. The 2008 Future Years Defense Program calls for the active Army to have a total of 547,400 enlisted personnel and officers by the end of
2012.
high level (either slightly or significantly) and if continua-
tion rates declined to a mix of the rates from 2005 and
2006. In these scenarios, CBO assumed that continua-
tion rates for draftees would be similar to those for volun-
teers in their first two years (although about 90 percent of
draftees leave the military when their two-year obligation
expires). Because of the procedural issues involved in
instituting a draft, CBO also assumed that the first batch
of inductees would not be drafted until 2008.
In scenario 4, CBO assumed that voluntary accessions
would plateau at the 2005 level of 74,000 recruits annu-ally, as in scenario 3. But instead of falling almost 48,000
people short of its desired end strength in 2012, the
Army would make up the difference through a draft. In
that case, about 14,000 inductees would be needed in
the first year, rising to about 27,000 a year by 2012 (see
Table 3). When the force was fully constituted, inductees
would make up just over one-quarter of annual accessions
and about 10 percent of enlisted personnel.
With a draft, more recruits would be needed to reach a
given end strength than is the case in an all-volunteerforce. Under current law, individuals would be inductedfor two years of service, substantially less than the initialobligations that are typical in today’s AVF (althoughmany service members leave the military before the endof their initial obligation because of medical problems,poor performance, or other reasons). Those shorter obli-gations mean that a draft system results in greater turn-over, which necessitates a larger number of accessions.
In scenario 4, an annual total of more than 100,000 vol-unteers and inductees (rather than 86,000 to 90,000 vol-unteers) would be needed by the fifth year of the draft(2012) and thereafter to reach and maintain the end-strength goal. Accession cohorts of that size would belikely to strain DoD’s existing entrance-processing andtraining infrastructure—whose capabilities are being fur-ther reduced by closings under the military’s base realign-ment and closure process. The number of personneldevoted to training recruits and inductees would haveto be boosted, and the costs of training would rise.
CBO's
Scenario
1 80,000 0 2006 level 547,400
2 86,000 to 90,000 0 Mix of 2005 and 2006 levels 547,400
3 74,000 0 Mix of 2005 and 2006 levels 499,500
4 74,000 27,000 Mix of 2005 and 2006 levels 547,400
5 40,000 94,000 Mix of 2005 and 2006 levels 547,400
6 5,000 165,000 Mix of 2005 and 2006 levels 547,400
All-Volunteer Force
Mixed Draft/Volunteer Force
in 2012b
Volunteers
End StrengthNumber of Annual Accessions by 2012
Drafteesa
Overall Continuation Rate

7/30/2019 The All-Volunteer Military: Issues and Performance July 2007
http://slidepdf.com/reader/full/the-all-volunteer-military-issues-and-performance-july-2007 46/49
34 THE ALL-VOLUNTEER MILITARY: ISSUES AND PERFORMANCE
Another implication of the draft is that the force wouldbecome more junior and less experienced than the cur-
rent AVF. Because inductees serve for a shorter time thanvolunteers, having larger numbers of draftees relative to
volunteers would necessarily result in a force with feweraverage years of service. In scenario 4, more than half of
the Army’s enlisted personnel (51 percent) would havefewer than three years of experience by 2012, compared with less than 45 percent of enlisted personnel in an all-
volunteer force. Usually, greater accumulated knowledge
and skills come with increased experience. As notedabove, research has shown that military personnel withmore than four years of service are 1.5 times more
productive in certain jobs than personnel in their firstterm.96 Another aspect of seniority is that certain military
positions require advanced pay grades, which generally can be filled only by more-experienced personnel.
Because most draftees leave after completing a two-yearobligation, a draft might affect the services’ ability toperform those functions efficiently.
In the fifth scenario, CBO assumed that only about
40,000 recruits would volunteer each year; the rest of the
force would be drafted. Under those conditions, the Army would need as many as 94,000 draftees a year—nearly the average size of the Vietnam-era drafts from
1960 to 1962—to meet its end-strength target for
2012.97 Total accessions (draftees and volunteers com-bined) would equal 134,000, about 50 percent morethan the number required for an AVF of the same end
strength. The concerns described above about the capac-ity of the Army’s entrance-processing and training infra-
structure would apply even more in this case. Additionalinvestments in infrastructure might be necessary to
accommodate accession cohorts of 134,000. Costs fortraining, and probably for base operating support, wouldincrease as well.
Moreover, in scenario 5, draftees would make up aboutone-third of enlisted personnel by 2012. At that point,57 percent of the enlisted force would have fewer than
three years of experience, compared with less than45 percent of an all-volunteer enlisted force. Althoughthat decreased seniority would reduce spending onmilitary pay per person, it would also diminish the
productivity of the force.
In its sixth and final scenario, CBO assumed thataccessions would be almost wholly draftees; only 5,000
recruits would be volunteers. Although that scenario would probably not be able to meet the Army’s require-ments for experienced personnel, CBO included it toillustrate the trade-off between all-volunteer recruits anddraftees. If continuation rates were the same as thoseassumed for the previous draft scenarios, the Army would
need almost 165,000 draftees each year to reach a forcesize of 547,400 personnel by 2012. That level of induct-ees is almost double the number of recruits needed for an
all-volunteer force of the same end strength. In addition,the average seniority of the force would decline substan-tially: Almost two-thirds of enlisted personnel wouldhave fewer than three years of experience.
Budgetary Costs and Savings and Levels of Military Pay Reinstating the draft might increase some costs associated with military personnel, but on net, the result could bebudgetary savings. With a less experienced force, spend-
ing on pay and benefits would be lower; those expendi-tures would decline further if the level of basic pay wascut. Spending on recruiting—such as advertising, num-bers of recruiters, enlistment bonuses, and education pro-
grams—might be reduced as well. Savings in those areas would be at least partly offset by higher expenditures fortraining (including instructors’ and students’ salaries) andpossibly for additional infrastructure.
Although including draftees in the force could yield bud-getary savings, that force would not be as effective as if
the same increase in end strength was achieved using only volunteers, because average seniority would fall. Produc-ing an equally effective draft force would require having
higher end strength than in an AVF, which would necessi-tate larger draft calls than those considered in the above
scenarios.
Because the parameters of a draft are highly uncertain,CBO did not try to estimate the precise budgetary sav-
ings associated with any particular implementation of the
96. Warner and Asch, “The Economics of Military Manpower.”
97. Because scenario 5 entails such a large shift between short-termdraftees and longer-term obligations, the experience profile of theforce would change significantly. Consequently, a steady state
would not be reached until 20 years after the draft began. By thattime, annual inductions would reach 112,000.

7/30/2019 The All-Volunteer Military: Issues and Performance July 2007
http://slidepdf.com/reader/full/the-all-volunteer-military-issues-and-performance-july-2007 47/49
THE ALL-VOLUNTEER MILITARY: ISSUES AND PERFORMANCE
draft.98 However, to indicate the maximum extent of possible savings, CBO has identified some of the mostimportant activities whose costs would change under a draft Army and the amounts spent on them in 2006.
Savings on Pay and Benefits. Because a draft Army wouldexperience higher turnover at the end of the first term of service, it would evolve into a force with lower averageseniority than the current volunteer force. Total spending on basic pay—and on other types of pay or benefits thatdepend on members’ length of service or rank—woulddecline. In addition, a smaller proportion of entering sol-diers would remain in the Army until retirement, so lessmoney would have to be accrued for military retirementpay and retiree health care.99 Moreover, some elements of military pay, such as the basic allowance for housing,
depend on family status. Because a less senior draft force would probably have a lower proportion of families thanan AVF, spending on those elements of compensation would also decline. Under the draft scenarios discussedabove, if the basic-pay table remained the same, declinesin the average experience level of the force could save theactive Army between $800 million and $1.1 billion a yearfrom its military personnel accounts (excluding savingsfrom reducing recruiting and retention incentives), CBOestimates. In all, the active Army spent about $30 billionfrom its personnel accounts for enlisted service membersin 2006, including supplemental funding.
Some people might argue that to reap greater budgetary savings from a draft, military compensation could bereduced. Although fewer individuals might volunteer forservice as military pay declined, the number of draftees
could be increased. As noted above, military pay forVietnam-era draftees was substantially below the amountthat most inductees could have earned in the private sec-tor. When the military moved from the draft to the AVFin the mid-1970s, basic pay for first-term personnel wasroughly doubled to attract volunteers. Today, DoD’s poli-cies continue to emphasize having military pay be compa-rable to the earnings of similarly qualified civilians.100 Instead, lawmakers could choose to hold basic pay fixedand allow its value to erode with inflation (to realize somesavings), or they could opt to explicitly cut basic pay (forlarger savings).
A cut in basic pay would most likely affect all fourbranches of the military, which have long shared the samebasic-pay table (going back to the most recent draft era).For 2007, the four services have budgeted a total of nearly $6 billion for basic pay for active-duty personnelin the three lowest pay grades (E-1 to E-3), whichroughly correspond to the first two years of service. Thatsum represents an upper bound on possible savings fromcutting basic pay for first-term personnel.101 (Becausevolunteers would continue to hold the more senior posi-tions in a mixed draft/volunteer force, few options mightbe available to reduce the pay of personnel with morethan two years of service.)
Savings on Recruiting. In 2006, the Army spent$353 million on enlistment bonuses, $583 million onrecruiting and advertising, and another $700 million on
98. The General Accounting Office (now the Government Account-ability Office) conducted several studies estimating the budgetary costs and savings of moving to a draft force in the 1980s. Asdetailed in one of those studies, The Military Draft: Potential Impacts and Other Issues (March 1988), returning to a draft couldgenerate either net savings or net costs depending on the assump-tions used in analyzing the issue.
99. DoD makes payments from its military personnel appropriationinto the Military Retirement Fund; those payments are calculated
to accrue into a sum sufficient to fund future military retirementpay. The accrual (or “normal”) rates could be reduced if fewer sol-diers were expected to complete 20-year careers and thus qualify for regular (nondisability) retirement. However, a technical prob-lem would arise because currently, the normal rates are the samefor the active components of all four services, whereas a draft
Army would experience the largest reduction in seniority. Simi-larly, DoD pays into the Medicare Eligible Retiree Health CareFund to finance future health care costs of military retirees andtheir family members who are also eligible for Medicare (generally those at least age 65). The health care accrual rates could also bereduced, but the same technical issues would arise.
100. DoD’s goal is that regular military compensation for enlistedpersonnel be at least equal to the 70th percentile of earnings forcivilians of comparable age, education, and experience. Accord-ing to DoD officials, the department has achieved that goal andis requesting a 3 percent increase in military basic pay in its
2008 budget to keep pace with private-sector wage growth. Seethe statement of David S.C. Chu, Under Secretary of Defensefor Personnel and Readiness, Thomas F. Hall, Assistant Secretary of Defense for Reserve Affairs, and Stephen L. Jones, PrincipalDeputy Assistant Secretary of Defense for Health Affairs, beforethe Subcommittee on Personnel of the Senate Armed ServicesCommittee, March 28, 2007.
101. Even if budgetary savings were realized, some people draftedinto the military would not have been willing to serve voluntar-ily at those reduced pay levels. Those draftees would effectively be paying the in-kind tax described earlier.

7/30/2019 The All-Volunteer Military: Issues and Performance July 2007
http://slidepdf.com/reader/full/the-all-volunteer-military-issues-and-performance-july-2007 48/49
36 THE ALL-VOLUNTEER MILITARY: ISSUES AND PERFORMANCE
pay and benefits for recruiters. Because it would probably still need some volunteers, the Army would be unlikely toeliminate enlistment bonuses or advertising under a draft.Nevertheless, those spending levels represent upper
bounds on the possible savings on recruiting.
102
As described above, the larger number of annual Army accessions necessary under a draft would require greaterspending on military entrance-processing stations. The Army spent $134 million on those stations in 2006.103 CBO’s draft scenarios involve up to a doubling of annual Army accessions. Annual costs for entrance processing would probably not double, however, because some por-tion of those costs are fixed and thus are unaffected by relatively small changes in the number of personnel whoenter the service.
Costs of Training. Higher Army accessions would alsoincrease both the variable and fixed costs of training per-sonnel. Costs that vary directly with the number of train-ees include the number of instructors required. Fixedcosts include the costs of training ranges and schools, which would not vary with small changes in the numberof trainees but would require expansion under a largechange. CBO estimates that reinstating a draft under thescenarios above could result in additional costs of $150 million to $650 million for initial and occupationaltraining and for construction and operation of barracks.
Effective Time for Draftees to Be Available forDeployment Aside from the larger number of accessions and less seniorforce implied by a draft, there are concerns about how long draftees would be available for deployment. On
entering the military, new recruits receive individual basictraining (boot camp) and occupational training beforebeing assigned to a unit. A unit nearing its deploymenttime also takes part in a series of collective training
events, ranging from small-team training to battalion-sizeunit training. For occupations in combat-related fields,such as infantry and air defense, individual basic andoccupational training lasts between 3.5 months and7 months.104 Unit training requires another 6 months,CBO estimates. Thus, allowing one month for transit(and assuming that training for recruits and units couldbe scheduled efficiently to minimize time spent waiting for training), CBO estimates that it would take 10.5months to 14 months after recruits entered the military before they would be fully trained and available fordeployment.
Those times would be identical for draftees and volun-teers.105 However, because draftees are assumed to servefor two years (as prescribed in current law), some induct-ees assigned to occupations that required the longer train-ing times would not be available for a full one-yeardeployment. That limitation would exacerbate problemsfor the Army, which recently increased the typical deploy-ment length from 12 months to 15 months. Personnel inthe AVF, by comparison, serve longer terms and can bedeployed for longer intervals—or multiple times during
a single enlistment contract—for most occupationalspecialties.
Equity ConsiderationsIn CBO’s draft scenarios, no more than 165,000 young people would be drafted annually. That number repre-sents only a small portion of the recruit-age population inthe United States—about 2 million young men turn 18each year, and the total (male and female) populationbetween the ages of 18 and 24 numbers roughly 30 mil-lion. Given that relatively few individuals would need to
be drafted, who should be inducted to ensure that thesystem was equitable?
102. CBO’s illustrative draft scenarios apply only to the Army. Whateffect such a draft would have on the recruiting success of theother services is difficult to estimate. On the one hand, any reduction in basic pay for first-term personnel would adversely affect recruiting by the Air Force, Marine Corps, and Navy. On
the other hand, as was the case during the Vietnam War, someyoung people would probably prefer to enlist in the other ser-vices rather than be drafted, in hopes of securing a military occupation that deployed less frequently or that avoided front-line combat units. CBO has not tried to estimate the net effectof an Army draft on recruiting by the other services or the extra resources that those services would need to spend (or could save)to counteract the cross-service effect.
103. The Army serves as the executive agent in charge of entranceprocessing for the other services, so part of its $134 million costis attributable to that role.
104. Durations of basic and occupational training for various enlisted Army occupations are available at http://usmilitary.about.com/od/enlistedjobs/Enlisted_Job_Descriptions_and_Qualification_Factors.htm or at www.goarmy.com (under the Careers & Jobstab).
105. That estimate excludes any time that volunteers may spend inthe delayed-entry pool before reporting for basic training.

7/30/2019 The All-Volunteer Military: Issues and Performance July 2007
http://slidepdf.com/reader/full/the-all-volunteer-military-issues-and-performance-july-2007 49/49
THE ALL-VOLUNTEER MILITARY: ISSUES AND PERFORMANCE
The random lottery required by current law would seemto yield a representative cross section of young men.However, the remaining system of exemptions or defer-ments would affect the representativeness of young peo-ple serving in the military. All of those aspects of currentdraft law would require legislation to change.
Presumably, lawmakers would want to avoid the publicdissatisfaction and mistrust that was evident during someof the nation’s previous experiences with conscription.However, if DoD had a ready supply of high-quality personnel available through the draft, it might wish totighten AFQT standards. Alternatively, the nation mightconsider certain civilian occupations or activities of such
importance for domestic health and security that peopleengaged in them could be exempt from military service.Such actions, however, would most likely affect the repre-sentativeness of draftees.
Another equity-related consideration is the role of women in the military. A draft that was instituted undercurrent law would cause the percentage of women in theservices to decline (assuming that women did not volun-teer at greater rates than in the recent past). Some observ-ers might argue for legislation that would broaden thedraft to include the registration and induction of women,despite existing restrictions that bar women from serving in units primarily engaged in ground combat.