the agricultural sit-uation in the soviet union
TRANSCRIPT
I I II I I I I J I _I_ _I_ I l
~?? ~ ~ ' ...._, / f .~ ~. ' '" - - ' ~ ~ ' ·-r-- -
\\\ ~ ~ ) /') ~~--
~~
~~~~ ~~ ...... I I I I I I I I I I I I
ERS-Foreign 358
THE AGRICULTURAL SIT-UATION IN THE
SOVIET UNION
Review of 1973 and Outlook for 1974
U.S. DEPARTMENT OF AGRICULTURE ECONOMIC RESEARCH SERVICE
Washington, D.C.
ABSTRACT
Soviet 1973 agricultural production increased sharply compared with the disappointing 1972level. Unusually good weather resulted in record or near-record crops. Livestock gains were modest but should increase more rapidly in 1974. Compared with 1973, crop production in 1974 is expected to be off somewhat unless weather again is unusually good. Soviet grain and oilseed import requirements are down sharply because of good 1973 crops.
KEYWORDS: Soviet Union, agricultural production, crops, livestock, agricultural inputs, agricultural trade, plans, prospects.
Washington, D.C. 20250
ii
March 1974
CONTENTS
Page
Summary................................................................. 1
Soviet Agricultural Production in 1973 . . . . . . . . . . . . . . . . . . . . . . . . . . . . . . . . . . . . 2 Grain................................................................... 2 Technical Crops . . . . . . ... . . . . . . . . . . . . . . . . . . . . . . . . . . . . . . . . . . . . . . . . . . . . . . . . 3
Sunflowers. . . . . . . . . . . . . . . . . . . . . . . . . . . . . . . . . . . . . . . . . . . . . . . . . . . . . . . . . . . . 3 Sugar Beets .............. ·. . . . . . . . . . . . . . . . . . . . . . . . . . . . . . . . . . . . . . . . . . . . . 4 Cotton .................. _.............................................. 6
Potatoes and Vegetables . . . . . . . . . . . . . . . . . . . . . . . . . . . . . . . . . . . . . . . . . . . . . . . . 6 Livestock . . . . . . . . . . . . . . . . . . . . . . . . . . . . . . . . . . . . . . . . . . . . . . . . . . . . . . . . . . . . . . . 6
Livestock Products . . . . . . . . . . . . . . . . . . . . . . . . . . . . . . . . . . . . . . . . . . . . . . . . . . . . 6 Livestock Numbers . . . . . . . . . . . . . . . . . . . . . . . . . . . . . . . . . . . . . . . . . . . . . . . . . . . 7 Feed Situation . . . . . . . . . . . . . . . . . . . . . . . . . . . . . . . . . . . . . . . . . . . . . . . . . . . . . . . . 7
Agricultural Policies and Inputs in 1973 ................................... 10 Investments ............................................................ 10 Land Improvement ..................................................... 10 Other Major Inputs . . . . . . . . . . . . . . . . . . . . . . . . . . . . . . . . . . . . . . . . . . . . . . . . . . . . . 10 lnterfarm Complexes and Projects . . . . . . . . . . . . . . . . . . . . . . . . . . . . . . . . . . . . . 11
Food Situation . . . . . . . . . . . . . . . . . . . . . . . . . . . . . . . . . . . . . . . . . . . . . . . . . . . . . . . . . . . . 14
Soviet Agricultural Trade ...................................... · · · · · · · · · .. 14 Grain ................................................................... 14 Oilseeds and Products. . . . . . . . . . . . . . . . . . . . . . .. . .. . . . . . . . . . . . . . . . . . . . . . . . . 16 Sugar ................................................................... 17 Cotton .................................................................. 17 U.S. AgricultUJ:al Trade with the USSR .................................. 17 Agricultural Trade Policy ............................................... 18
Outlook for 1974 ................................................... : ...... 20 Policies and Inputs . . . . . . . . . . . . . . . . . . . . . . . . . . . . . . . . . . . . . . . . . . . . . . . . . . . . . 20 Agricultural Production . . . . . . . . . . . . . . . . . . . . . . . . . . . . . . . . . . . . . . . . . . . . . . . . . 20
Crops ................................................................. 21 Livestock ............................................................. 22
Agricultural Trade . . . . . . . . . . . . . . . . . . . . . . . . . . . . . . . . . . . . . . . . . . . . . . . . . . . . . . 22
Statistical Tables . . . . . . . . . . . . . . . . . . . . . . . . . . . . . . . . . . . . . . . . . . . . . . . . . . . . . . . . . 23
iii
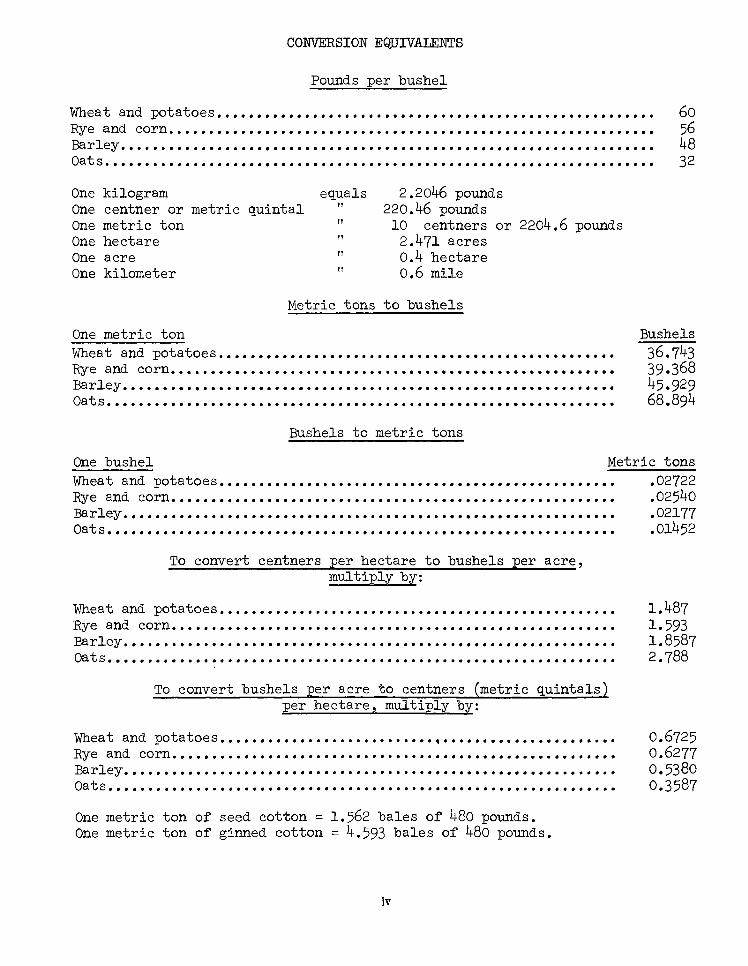
CONVERSION EQUIVALENTS
Pounds per bushel
'W'b.ea t and potatoes • •••••••••••••••••••••••••••• Rye and corn . ..........•....................... Barley •••• Oats ••••••
• • • • • • • • • • • • • • • • • • • • • • • • • • • • • • • • • • • • • • • • • • • • • • • • • • • • • • • a • • • • • • •
60 56 48 32 . . . . . . . . . . . . . . . . . . . . . . . . . . . . . ................ . .......... .
One kilogram equals 2.2046 pounds One centner or metric quintal " 220.46 pounds One metric ton " 10 centners or 2204.6 pounds One hectare 11 2.471 acres One acre 11 0.4 hectare One kilometer 11 0.6 mile
Metric tons to bushels
One metric ton Wheat and potatoes •••• . . . . . . . . . . . . . . . . . . . . . . . . . . . . . . . . . . . . . . . . . . . . . . Rye and corn . ...............•..•..............•...••..•••.....•..•.• Barley . ......•...•..........•.•............•..•...•.•.•.........•... Oats • •••••••••••••••••••••••••••••••••••••••••••••••••••••••••••••••
Bushels to metric tons
Bushels 36.743 39.368 45.929 68.894
One bushel Metric tons 'W'b.eat and potatoes ••••• .......................................... Rye and corn . ..................................•..•...•.........•..• Bar ley . ............................................................ . Oats . •••...•..........••••.••.•...............••••••.•••••..••...••.
To convert centners per hectare to bushels per acre, multiply by:
1il.b.eat and potatoes .....••.•.........................•..... Rye and corn • Barley ••• Oats •••••
. . . . . . . . . . . . . . . . . . . . . . . . . . . . . . . . . . . . . . . . . . . . . . ..................................................... . . ............................................... . To convert bushels per acre to centners (metric quintals)
per hectare, multiply by:
1il.b.ea t and potatoes . .•••..•..•..........•..... , .••....••... Rye and corn •••••• . . . . . . . . . . . . . . . . . . . . . . . . . . . . . . . . . . . . . . . . . . . . . . . Barley . ......................•...................•........... Oats .•.•............•....••••..•...........••..•...•..•..
One metric ton of seed cotton = 1.562 bales of 480 pounds. One metric ton of ginned cotton = 4.593 bales of 480 pounds.
iv
.02722
.02540
.02177
.01452
1.487 1.593 1.8587 2.788
0.6725 0.6277 0.5380 0.3587
THE AGRICULTURAL SITUATION IN THE SOVIET UNION
SUMMARY
In 1973, agricultural output in the Soviet Union increased 14 percent over the disappointing 1972 level, a greater jump than the planned 12.6-percent increase. Unusually good weather and soil moisture supplies, in sharp contrast to extremely adverse weather in 1972, permitted total crop production to increase by nearly a fourth. Growth in livestock production was relatively small because early in 1973, feed was still in short supply, despite large imports.
Soviet farm production in 1974 is planned to increase by 6.4 percent, which seems optimistic unless weather is again unusually favorable. Crop production will most likely fall somewhat short of the record 1973 performance, although livestock raising is benefiting from excellent 1973 feed supplies.
Gross 1973 grain production was 222.5 million tons, about 35 million tons more than the previous record, which was set in 1970, and 25 million tons more than planned for 1973.1 The wheat crop totaled 109.7 million tons, almost a tenth larger than the previous record-set in 1966. Feed grain output was about 86 million tons, over 40 percent larger than the 1970-72 average. However, because of heavy precipitation during harvesting, the amount of excess moisture and foreign matter reflected in the gross harvest figure is probably greater than normal. Also, the quality of much of the grain was relatively low.
The 197 4 grain crop is planned at 205 million tons, 8 percent less than the 1973 record harvest. Wheat is to account for 100 million tons. Given normal weather, a planned grain area of 126 million hectares, and a continuation of past yield trends, the grain production goal appears to be attainable.
There were 35.3 million hectares of winter grain seeded last fall, an area about equal to that planned. Winter damage to this grain was probably about average-that is, 15-20 percent of the planted area was affected. Thus, roughly 30 million hectares of winter grains are expected to be harvested in 1974.
Sunflowerseed production, at 7.34 million tons, and the cotton crop, at 7.66 million tons, set new records in
1Tonnage figures are metric.
1973, while the sugarbeet harvest, at 86.8 million tons, was second only to the record 1968 crop. Another record cotton crop is probably in prospect for 1974, and sugarbeet output should about equal the 1973 harvest. Sunflowerseed production is planned at almost 7.2 million tons, somewhat less than the 1973 output.
The 1973 potato and vegetable crops, at 107.7 million and 24.5 million tons, respectively, also set new records. Harvests in 1974 should be somewhat smaller, given normal weather.
Livestock production, except for meat, rose significantly in 1973. Meat production, at 13.5 million tons, was slightly below the 1972 level. But the 87.2 million tons of milk and 50.8 billion eggs produced in 1973 were 5 and 6 percent, respectively, above 1972 output. The amounts of meat and milk produced were still well short of the original 5-year plan goals for 1973, while eggs were well above the target. Plans for 1974 call for 14.4 million tons of meat, 90.8 million tons of milk, and 53.5 billion eggs. Final results will depend on 1974 pasture and crop conditions.
Soviet livestock and poultry numbers on January 1, 1974, were at record levels, except for hog inventories. Cattle numbers continued the steady but modest growth of recent years and sheep flocks recovered from setbacks in 1969 and 1972. Hog numbers did not fully recover from the decrease experienced in 1972. Livestock and poultry inventories should continue to expand in 1974 under the influence of good feed supplies from 1973.
The current Soviet food situation is much improved over what it was a year ago. Poor 1972 crops caused at least localized shortages of some foods. Faulty distribution may have been the main culprit. However, there were rumors, as yet unconfirmed, of rationing and increases in food prices. With the record 1973levels of output, supplies of most crop and livestock products either recovered from the 1972 shortfalls or reached new high levels.
The major agricultural policies in effect in 1973 basically represented a continuation of those adopted earlier. Capital investment in agriculture amounted to 25.8 billion rubles, 9 percent more than in 1972 and 2 percent more than planned for 1973. Emphasis
1
continued to be on improving the land and on supplying mineral fertilizers. A fifth of capital investments were for irrigation and drainage. Irrigation was completed on 980,000 hectares in 1973, and 900,000 hectares were drained. Similar increases are planned for 1974. Agriculture got 58 million tons of mineral fertilizers in 1973, a million tons more than planned, and is to receive almost 65 million tons in 1974. In addition, agriculture will be provided with large amounts of machinery, and large-scale livestock and poultry feeding complexes are being constructed. ·
Soviet agicultural trade is also expected to return to a more normal volume and pattern than in 1972173. The USSR became a larger net agricultural importer in 1972173 because of record amounts of grains and soybeans purchased abroad and because of significant decline in Soviet exports of agricultural products. The deficit in Soviet agricultural trade in
1972173 probably reached the equivalent of several billion dollars. Following the 1973 harvests, the Soviet need for grain and oilseed imports was sharply reduced and agricultural exports can be increased to more normal levels.
The return of Soviet agricultural trade to a more normal pattern is expected to sharply reduce U.S. agricultural exports to the USSR. An estimated 7 million tons of U.S. grain are scheduled to be shipped to the Soviet Union in 1973174. This grain apparently was purchased as a hedge against another poor harvest before the Soviets knew a record 1973 domestic crop was in prospect. Also, the improved . Soviet oilseed situation makes it unlikely that significant purchases of U.S. soybeans will be made. However, if the Soviet grain and oilseed crops in 197 4 should be adversely affected by weather, additional U.S. grain and soybean purchases by the USSR would be likely in the latter part of 197 4.
SOVIET AGRICULTURAL PRODUCTION IN 1973
In 1973, agricultural output in the Soviet Union reportedly increased 14 percent over the 1972level. This increase, one of the sharpest on record, was greater than the planned growth of 12.6 percent. Agricultural production was 9 percent above the previous record-set in 1971-and double the 1955 level. In the past two decades, increases of the size achieved in 1973 have occurred only twice: in 1964, when favorable weather facilitated recovery from a disastrous 1963 crop year, and in 1956, when good weather, together with the New Lands and Corn Programs, resulted in a high growth rate for agriculture.
Last year's sharp production increase was also largely the result of unusually favorable weather during the growing season, in sharp contrast to extremely adverse conditions the year before. Output in 1972 was almost 5 percent below the 1971 level, almost entirely because of a 9-percent decrease in crop production. Most of the 1973 increase in agricultural output, on the other hand, was due to record or near-record harvests of the major crops. Total crop production in 1973 is estimated to have been nearly a fourth larger than in 1972.
Weather during the 1973 growing season in the USSR was unusual because a shortage of moisture was not an important factor limiting crop yields or pasture growth in any major agricultural area. In most years, limited soil moisture impedes the developJ!lent of crops and pasture grasses over sizable areas of agricultural regions in either the European part or the Asiatic part of the USSR. During the 1973 growing season, however, precipitation was above normal in both these parts of the Soviet Union. The principal exception was an
2
April-June dry spell in the northeastern part of European USSR and in the Urals region. Precipitation in a number of important agricultural regions was sufficiently above normal so that, contrary to the usual experience, soil moisture actually increased as the season progressed. (Fletcher Pope, Jr.)
Grain
Gross 1973 grain production (including pulses) in the USSR was 222.5 million tons, nearly one-fifth larger than the previous record of 186.8 million tons harvested in 1970 (table 14). 2 Although additional inputs, expanded area, and improved technology contributed to the record grain crop last year, weather was the major factor. The 1973 harvest was 25 million tons more than the goal of 197.4 million tons and almost 55 million tons larger than the 1972 crop. These comparisons strongly suggest that the 1973 grain crop will probably not be exceeded for at least several years-unless, of course, the Soviet Union is again favored by unusually good weather in the major grain regions.
Despite the overall benefits of the good weather in 1973, there were certain negative effects. The quality of much of last year's grain crop was relatively low. Also, the amount of excess moisture and foreign matter reflected in the gross harvest figure is probably greater than normal. The relatively
2The Soviet gross grain production data as well as the grain yield data used in this report are in tenns of "bunker weight"-that is, grain as it comes from the combines and thus containing varying amounts of moisture and foreign matter. All tons are metric.
abundant soil moisture and probably the increased use of fertilizer caused rather extensive lodging of small grains, thus complicating harvesting operations. In addition, precipitation was extensive and frequent when the grain was being harvested. However, the lag between the cutting and threshing operations-or the amount of unthreshed grain lying in windrows-never became excessively large (that is, not significantly larger than the weekly rate at which the grain was being cut). Thus, it appears likely that the amount of grain left lying in windrows until the grain had seriously deteriorated in quality was not large a'nd probably was confined to certain areas from the central part of European USSR eastward through the Urals.
Heavier fertilization undoubtedly· contributed to the record grain harvest. The Soviets planned to use 26 million tons of mineral fertilizers on grain in 1973, roughly a fourth more than in 1972. Although the amount actually used on grain last year has not been revealed, planned production and deliveries to agriculture of mineral fertilizers were met. Furthermore, for the first time, increased fertilization was reported as a contributing factor to higher yields in the New Lands, which are mainly in the Asiatic part of the USSR.
Soviet grain area expanded 6 percent in 1973, also contributing to the record crop. Almost 127 million hectares were harvested-over 6 million more than the 1968-72 average. Area seeded to winter wheat and winter rye was about 20 percent below the planned area, primarily because of dry soil conditions in the fall of 1972. However, unusually mild weather during the 1972173 winter minimized damage to the grain. An early spring permitted not only the shortfall in winter grain area to be made up but also the planned overall expansion in grain area to be carried out. The spring wheat area was expanded somewhat to help offset the effect of the reduced winter wheat area on the harvest. However, the feed grain area benefited the most from the expansion in grain area. Feed grains (barley, oats, and com) occupied 45 million hectares in 1973, compared with an average of 36 million in 1968-72. For barley, the figures are 29 million and 22 million hectares, respectively.
Soviet 1973 gross grain yields were records, not only for grain as a whole but for each of the major grains. Overall grain yields, as well as wheat and com yields, were more than one-tenth above previous records, which were realized during the period 1969-71. However, barley yield was only moderately higher than in 1970 and oat yield, slightly lower. A projection of the 1957-71 trend in overall Soviet grain yields reveals that the 1973 yield was roughly 15 percent above trend, mainly because of above-trend wheat yields.
The USSR's wheat output in 1973 totaled 109.7 million tons, accounting for roughly half the total
grain output. The 1973 wheat harvest was one-fourth above the 1972 harvest and about a tenth larger than previous bumper wheat crops. 3 Winter wheat accounted for an estimated 44 percent of the total wheat crop, a proportion somewhat higher than normal despite the somewhat smaller area. Feed grain production (barley, oats, and com) was about 86 million tons, by far the largest ever-harvests in 1970-72 averaged 60 million tons. Gross com output was announced as 13.4 million tons. Rice output totaled 1.8 million tons.
The Soyiet Government purchased 90 million tons (accounting-weight basis)4 of grain from the farms in 1973 or 40 percent of the 222.5-million-ton (gross or bunker-weight basis) domestic crop (table 1). The 1973 grain purchases were 50 percent larger than the amount purchased from the relatively small 1972 crop and 15 million tons larger than the previous record purchases, which were made in 1966. Although the percentage of the 1973 grain crop purchased by the Government was somewhat larger than the 1968-72 average of 37 percent, 132 million tons (gross weight) of grain were left on the farms last year, compared with the previous record of 117 million tons in 1971.
The record 1973 harvest will significantly relieve the Soviet grain situation. If the goal of 197.4 million tons represented USSR grain requirements in 1973/74, as seems reasonable, then Soviet officials are free to decide on the disposition of some 20-25 million tons of grain from the 1973 crop. This grain could be used (1) to rebuild stocks, (2) to increase feed use of grain above that originally planned, and/ or (3) to expand exports. Although feed use and exports probably will benefit from this improvement in Soviet grain supplies, the rebuilding of grain stocks is expected to be given high priority. The huge 1972173 Soviet grain purchases suggest that carryover stocks at the beginning of the 1972 harvest were minimal. (Fletcher Pope, Jr.)
Technical Crops
Sunflowers
USSR sunflowerseed production, which had declined steadily since 1968, recovered in 1973, reaching a record 7.34 million tons (table 15). This was 10 percent above the record 1968 level and 45
3As a result of the new U.S.-USSR agreement on cooperation in agriculture, the Soviets are releasing more agricultural information, and releasing it earlier, than in the past.
4Data on Government grain purchases are in terms of accounting weight; that is, the weight of the grain as delivered by the farms to the Government is adjusted as necessary to arrive at the equivalent of grain with a standard moisture and foreign-matter content.
3
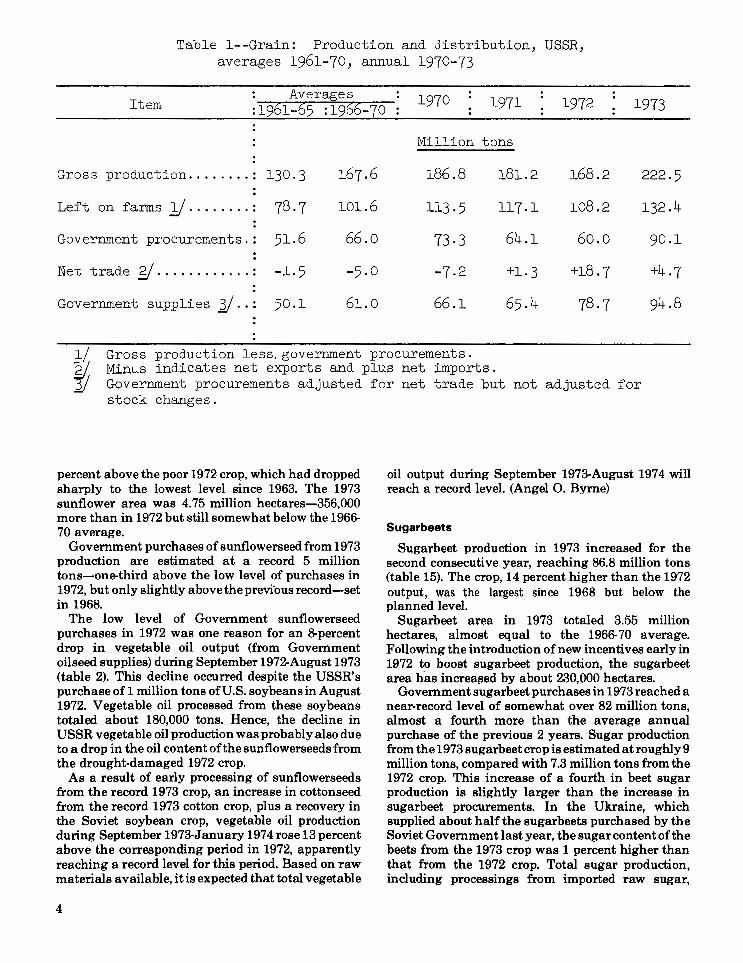
Table 1--Grain: Production and Jistribution, USSR, averages 1961-70, annual 1970-73
: Averages 1970 1971 1972 1973 Item :19bl-b5 :19bb-70
Million tons
Gross production ........ : 130.3 167.6 186.8 181.2 168.2 222.5 :
Left on farms~ ........ : 78.7 101.6 113.5 117.1 108.2 132.4
Government procurements.: 51.6 66.0 73·3 64.1 60.0 90.1 :
Net trade~·· .......... : -1.5 -5.0 -7.2 +1.3 +18.7 +4.7 :
Government supplies )./ .. : 50.1 61.0 66.1 65.4 78·7 94.8
Gross production less. government procurements. Minus indicates net exports and plus net imports. Government procurements adjusted for net trade but not adjusted for stock changes.
percent above the poor 1972 crop, which had dropped sharply to the lowest level since 1963. The 1973 sunflower area was 4. 75 million hectares-356,000 more than in 1972 but still somewhat below the 1966-70 average.
Government purchases of sunflowerseed from 1973 production are estimated at a record 5 million tons-one-third above the low level of purchases in 1972, but only slightly above the previ"ous record-set in 1968.
The low level of Government sunflowerseed purchases in 1972 was one reason for an 8-percent drop in vegetable oil output (from Government oilseed supplies) during September 1972-August 1973 (table 2). This decline occurred despite the USSR's purchase of 1 million tons of U.S. soybeans in August 1972. Vegetable oil processed from these soybeans totaled about 180,000 tons. Hence, the decline in USSR vegetable oil production was probably also due to a drop in the oil content of the sunflowerseeds from the drought-damaged 1972 crop.
As a result of early processing of sunflowerseeds from the record 1973 crop, an increase in cottonseed from the record 1973 cotton crop, plus a recovery in the Soviet soybean crop, vegetable oil production during September 1973-January 1974 rose 13 percent above the corresponding period in 1972, apparently reaching a record level for this period. Based on raw materials available, it is expected that total vegetable
4
oil output during September 1973-August 1974 will reach a record level. (Angel 0. Byrne)
Sugarbeets
Sugarbeet production in 1973 increased for the second consecutive year, reaching 86.8 million tons (table 15). The crop, 14 percent higher than the 1972 output, was the largest since 1968 but below the planned level.
Sugarbeet area in 1973 totaled 3.55 million hectares, almost equal to the 1966-70 average. Following the introduction of new incentives early in 1972 to boost sugarbeet production, the sugarbeet area has increa~ed by about 230,000 hectares.
Government sugarbeet purchases in 1973 reached a near-record level of somewhat over 82 million tons, almost a fourth more than the average annual purchase of the previous 2 years. Sugar production from the 1973 sugarbeet crop is estimated at roughly 9 million tons, compared with 7.3 million tons from the 1972 crop. This increase of a fourth in beet sugar production is slightly larger than the increase in sugarbeet procurements. In the Ukraine, which supplied about half the sugarbeets purchased by the Soviet Government last year, the sugar content of the beets from the 1973 crop was 1 percent higher than that from the 1972 crop. Total sugar production, including processings from imported raw sugar,
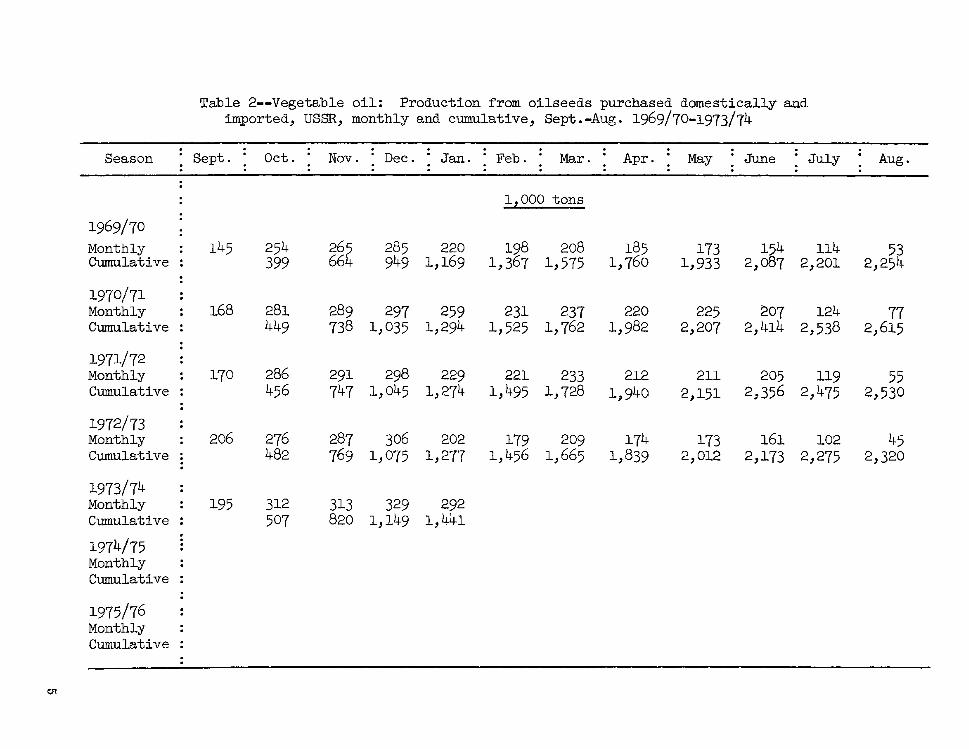
Table 2--Vegetable oil: Production from oilseeds purchased domestically and imported, USSR, monthly and cumulative, Sept.-Aug. 1969/70-1973/74
Season · Sept. : Oct. . Nov. : Dec. : Jan. : Feb. : Mar. : Apr. : May : June : July . Aug. -
l.z.OOO tons . 1969/70 Monthly : 145 254 26, 285 220 198 208 185 173 154 ll4 53 Cumulative : 399 66 949 1,169 1,367 1,575 1,760 1,933 2,087 2,201 2,254 . . 1970/71 Monthly . 168 281 289 297 259 231 237 220 225 207 124 77 . Cumulative : 449 738 1,035 1,294 1,525 1, 762 1,982 2,207 2,414 2,538 2,615
: 1971/72 Monthly : 170 286 291 298 229 221 233 212 211 205 ll9 55 Cumulative : 456 747 1,045 1,274 1,495 1,728 1,940 2,151 2,356 2,475 2,530
: 1972/73 Monthly : 206 276 287 306 202 179 209 174 173 l6l 102 45 Cumulative : 482 769 1,075 1,277 1,456 1,665 1,839 2,012 2,173 2,275 2,320 . 1973/74 Monthly : 195 312 313 329 292 Cumulative : 507 820 1,149 1,441 . 1974/75 Monthly Cumulative
1975/76 Monthly Cumulative
-01
reached 10.7 million tons in calendar year 1973, compared with 8.9 million tons in 1972. (Angel 0. Byrne)
Cotton
In 1973, the USSR produced its fourth record cotton crop in succession. Output totaled 7.66 million tons (unginned), 5 percent higher than in 1972 (table 15). This record was achieved despite rain and low air and soil temperatures during part of the growing season, and despite rain, low temperatures, and earlier than usual frost during the harvest period in some cotton areas of Soviet Central Asia. The 1973 cotton crop will yield about 2.6 million tons of lint, up from 2.5 million tons of lint from the 1972 crop. Cottonseed from the 1973 crop will total about 5 million tons, compared with 4. 7 million from the 1972 crop.
The 1973 cotton area, at 2.7 million hectares, was about the same as the area planted in 1972. During 1973, however, the Soviets began development of two new cotton areas in Southern Uzbekistan, the major cotton producing republic in the USSR. The new irrigation area in the Karshi Valley is planned to reach 85,000 hectares by 1975, yielding 100,000 tons of cotton; 215,000 hectares by 1980, yielding 400,000 tons; and in the final stage (probably sometime in the last half of the 1980's) 900,000 hectares, yielding 1.3 million tons.' The new irrigation area in the Dzhizak Valley is planned to reach 58,000 hectares in the next few years, and eventually a total of 180,000 hectares. Upon completion-again probably sometime in the 1980's-the area is planned to produce 250,000 tons of cotton annually.
Soviet cotton production in recent years has been running well ahead of planned goals. In 1973, for example, cotton production exceeded the 6.8-millionton goal by 13 percent. Realization of the planned total cotton area of more than 3 million hectares by 1975, while maintaining the reported average yield of 26.7 centners per hectare for 1971-73, could raise cotton production to slightly over 8 million tons by the end of the current 5-year plan period. (Angel 0. Byrne)
Potatoes and Vegetables
Potato production in 1973 reached a record 107.7 million tons, 38 percent higher than the sharply reduced 1972 output and 5 percent above the previous record of 102.2 million tons in 1968 (table 15).
Vegetable output also was a record, following a 4-percent decline in 1972. The record crop of24.5 million tons was 23 percent above the 1972 output and 16 percent higher than the previous record of 21.2 million tons in 1970. (Angel 0. Byrne)
6
Livestock
Except for pork, livestock production in the Soviet Union was up in 1973, largely because of the exceptional improvement in the feed supply situation. For all major livestock products, output was above the levels indicated in the revised annual plan-announced early in 1973-but below the original1973 targets (except for eggs) established in the Ninth Five-Year Plan (1971-75). Actual 1973 performance compared with the original and revised targets is shown in table 3.
Livestock Products
Total meat production in 1973 remained slightly below the 1972 level, but output of milk and eggs increased sharply. Compared with the revised goals for 1973 meat and egg output was well ~hove the targets and milk production, moderately above the target.
Production of beef, poultry, and mutton apparently made gains in 1973. (Official data are not available on the production of meat by type.) However, pork production remained below that of the previous 2 years, primarily because of a decline in hog numbers in 1972 (including a small drop in sow inventories), and reduced slaughtering connected with efforts to rebuild depleted herds.
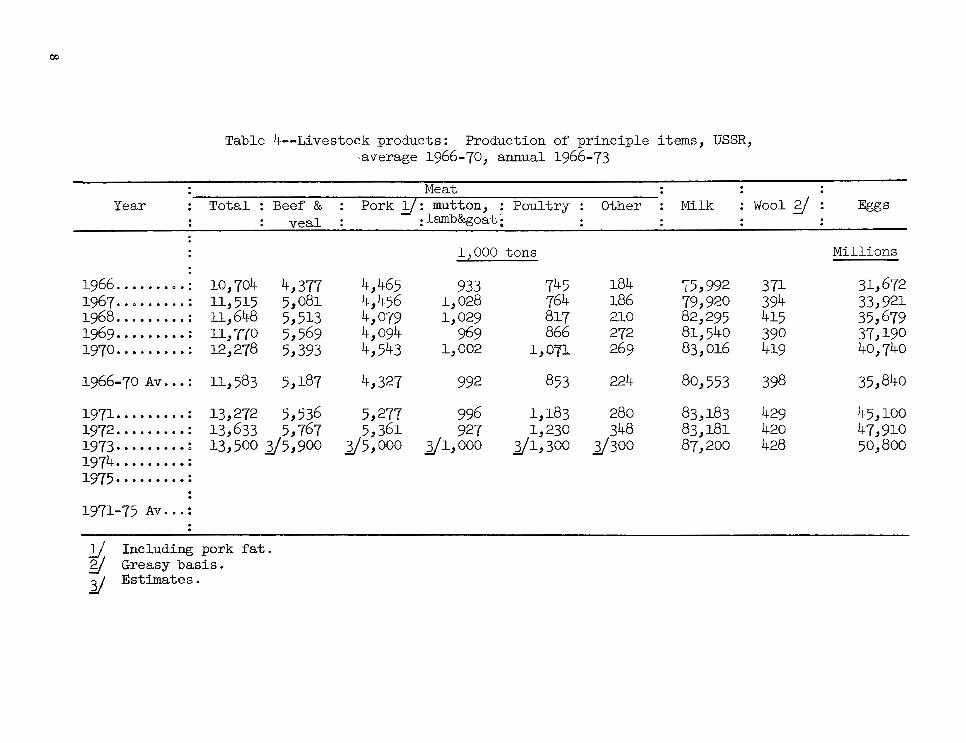
The sharp uptrend since the mid-1960's in poultry meat and egg production continued in 1973. Milk production, after having stagnated since 1968, made an impressive gain. Wool output nearly regained the previous record level. Comparative data on all major livestock products are shown in table 4.
Industrial processing of Government-held meat, which accounts for most off-farm slaughter and about three-fifths of total production, declined about 5 percent in 1973. Meat from on-farm livestock slaughterings increased, however, reversing the downtrend of the previous 3 years. Compared with 1972, the principal slumps in industrial processing in 1973 occurred in the first and third quarters. The unfavorable third quarter comparison, however, is mainly attributable to excess drought-induced slaughter in 1972.
In 1973, Government purchases of milk increased 10 percent and egg purchases, 14 percent. Results in all quarters were better than in 1972, but the greatest gains occurred during the second half of the year. Most of the increase in Government milk holdings was allocated to butter manufacture, which jumped 15 percent to 1,245,000 tons (excluding about 100,000 tons of farm production). The sharp increase in domestic butter production probably provided selfsufficiency at a slightly higher level of butter consumption, thus forestalling any immediate need
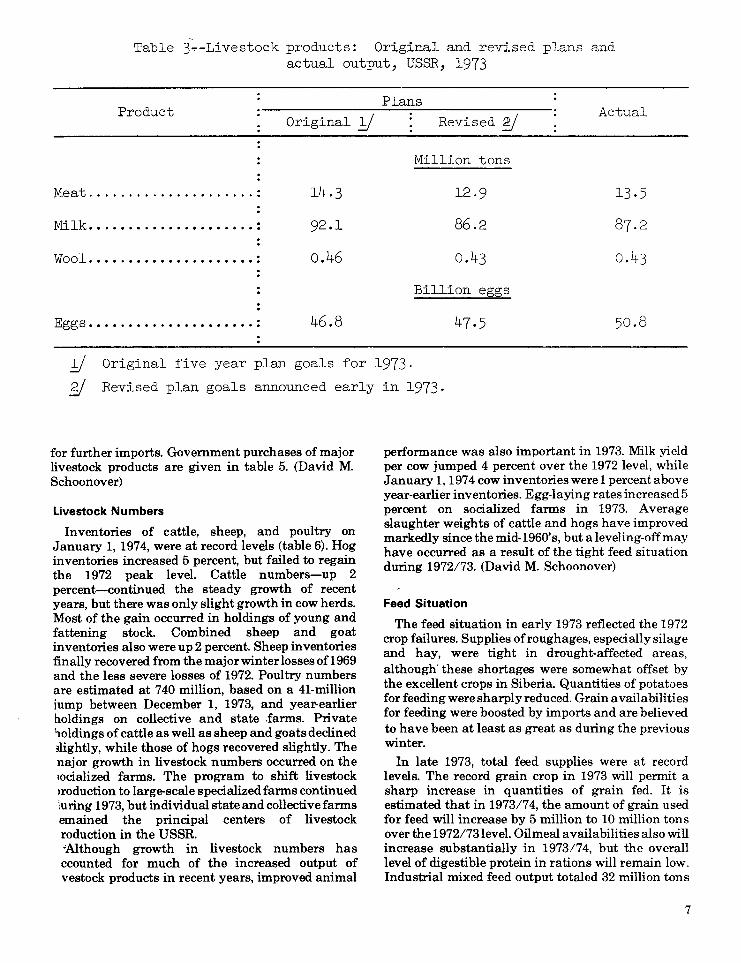
Table 3~-Livestock products: Original and revised plans and actual output, USSR, 1973
Product Original y
Meat ..................... :
Milk . .................... : 92.1
Wool . .................... : 0.46
Eggs . ..•...•..•....•...•. : 46.8
Plans
Revised '?)
Million tons
12.9
86.2
0.43
Billion eggs
47·5
Actual
13.5
0.43
50.8
y Original five year plan goals for 1973.
~ Revised plan goals announced early in 1973.
for further imports. Government purchases of major livestock products are given in table 5. (David M. Schoonover)
Livestock Numbers
Inventories of cattle, sheep, and poultry on January 1, 1974, were at record levels (table 6). Hog inventories increased 5 percent, but failed to regain the 1972 peak level. Cattle numbers-up 2 percent-continued the steady growth of recent years, but there was only slight growth in cow herds. Most of the gain occurred in holdings of young and fattening stock. Combined sheep and goat inventories also were up 2 percent. Sheep inventories finally recovered from the major winter losses of 1969 and the less severe losses of 1972. Poultry numbers are estimated at 740 million, based on a 41-million jump between December 1, 1973, and year-earlier holdings on collective and state .farms. Private 1.oldings of cattle as well as sheep and goats declined ~lightly, while those of hogs recovered slightly. The najor growth in livestock numbers occurred on the 1ocialized farms. The program to shift livestock 1roduction to large-scale specialized farms continued luring 1973, but individual state and collective farms emained the principal centers of livestock roduction in the USSR. "Although growth in livestock numbers has ccounted for much of the increased output of vestock products in recent years, improved animal
performance was also important in 1973. Milk yield per cow jumped 4 percent over the 1972 level, while January 1, 1974 cow inventories were 1 percent above year-earlier inventories. Egg-laying rates increased 5 percent on socialized farms in 1973. Average slaughter weights of cattle and hogs have improved markedly since the mid-1960's, but a leveling-off may have occurred as a result of the tight feed situation during 1972/73. (David M. Schoonover)
Feed Situation
The feed situation in early 1973 reflected the 1972 crop failures. Supplies ofroughages, especially silage and hay, were tight in drought-affected areas, although' these shortages were somewhat offset by the excellent crops in Siberia. Quantities of potatoes for feeding were sharply reduced. Grain a vail abilities for feeding were boosted by imports and are believed to have been at least as great as during the previous winter.
In late 1973, total feed supplies were at record levels. The record grain crop in 1973 will permit a sharp increase in quantities of grain fed. It is estimated that in 1973174, the amount of grain used for feed will increase by 5 million to 10 million tons over the 1972173level. Oil meal availabilities also will increase substantially in 1973174, but the overall level of digestible protein in rations will remain low. Industrial mixed feed output totaled 32 million tons
7
00
Table 4--Livestock products: Production of principle items, USSR, ·average 1966-70, annual 1966-73
Meat Year . Total : Beef & : Pork i/: mutton, : Poultry : Other : Milk : Wool ?} : .
:lamb&goat: veal :
~000 tons :
1966 ..•.... 0 • : 10,704 4,377 4,465 933 745 184 (5,992 371 1967 .. 0 •••••• : 11,515 5,081 4,456 1,028 764 186 79,920 394 1968 . ........ : 11,648 5,513 4,0~(9 1,029 817 210 82,295 415 1969 . ........ : 11,770 5,569 4,094 969 866 272 81,540 390 1970 . ........ : 12,278 5,393 4,543 1;002 1,071 269 83,016 419
1966-70 Av ... : 11,583 5,187 4,327 992 853 224 80,553 398
1971 . ........ : 13,272 5,536 5,277 996 1,183 280 83,183 429 1972 . ........ : 13,633 5,767 5,361 927 1,230 348 83,181 420 1973 . ........ : 13,500 1/5,900 1/5,000 ]}1,000 ]}1,300 1/300 87,200 428 1974 . ........ : 1975 . ........ :
1971-75 Av ... :
y Including pork fat. y Greasy basis.
11 Estimates.
Eggs
Millions
31,672 33,921 35,679 37,190 40,740
35,840
45,100 47,910 50,800
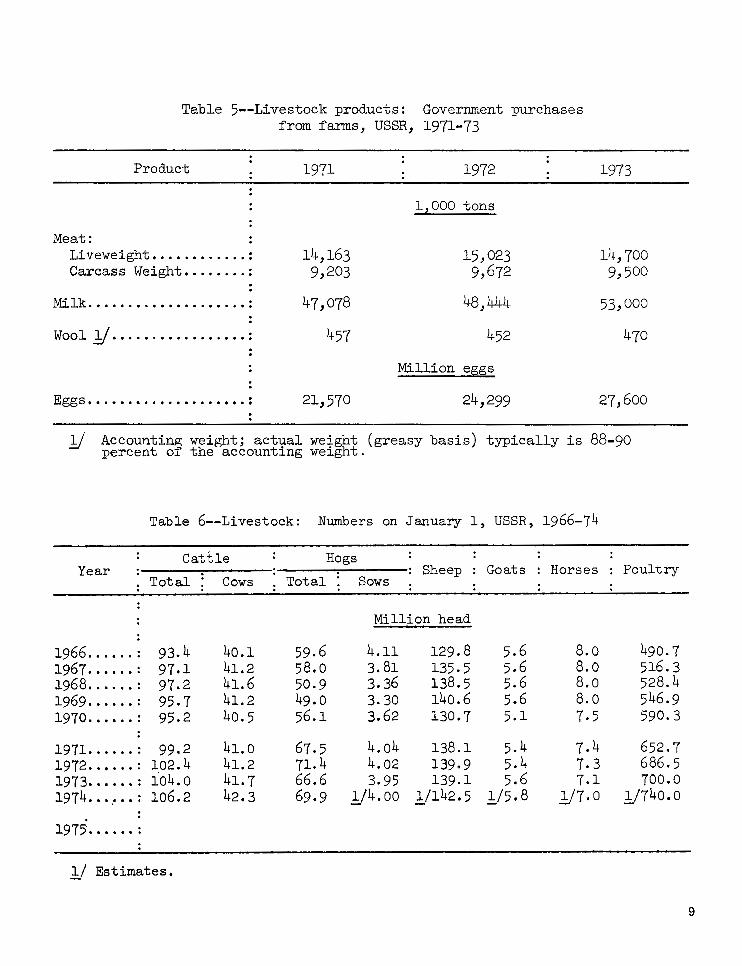
Table 5--Livestock products: Government purchases from farms, USSR, 1971-73
Product
Meat: Li veweight ............ : Carcass Weight ........ :
Milk . ................... : .
Wool y ................. :
1971
14,163 9,203
47,078
457
1972
1,000 tons
15,023 9,672
48,444
452
Million eggs
1973
14,700 9,500
53,000
Eggs • ••••.••.•.•••••.••. : 21,570 24,299 27,600
1/ Accounting weight; act~al we~ght (greasy basis) typically is 88-90 percent of the account~ng we~ght.
Table 6--Livestock: Numbers on January l, USSR, 1966-74
Cattle Hogs Year Sheep Goats Horses Poultry
Total Cows Total Sows
Million head
1966 ...•.. : 93.4 40.1 59.6 4.11 129.8 5.6 8.0 490.7 1967 ...... : 97.1 41.2 58.0 3.81 135.5 5.6 8.0 516.3 1968 ..•... : 97.2 41.6 50.9 3.36 138.5 5.6 8.0 528.4 1969 ...... : 95-7 41.2 49.0 3.30 140.6 5.6 8.0 546.9 1970 •..... : 95.2 40.5 56.1 3.62 130.7 5.1 7-5 590.3
1971. ..... : 99.2 41.0 67.5 4.o4 138.1 5.4 7.4 652.7 1972 ...... : 102.4 41.2 71.4 4.02 139.9 5.4 7.3 686.5 1973 ...•.. : io4.o 41.7 66.6 3.95 139.1 5.6 7.1 700.0 1974 .... • .. : 106.2 42.3 69.9 lJ4. 00 ,!/142. 5 ,!/5.8 ,!/7. 0 l/740. 0
1975 ...... :
1/ Estimates.
9
in 1973, compared with 28 million tons in 1972. Collective and state farms increased their winter reserves of forage crops by the following quantities compared with 1972: haylage-14 million tons, silage-50 million tons, feed roots-6 million tons, and alfalfa meal-746,000 tons. Total 1972 production of haylage was 36 million tons and that of
corn silage and green chop, 206 million tons. Farm supplies of hay, staw, and concentrates also reportedly were higher than in 1972. Haymaking was hampered by rainy weather in 1973. On the other hand, pasture conditions in 1973 were excellent as a result of the generally wet summer. (David M. Schoonover)
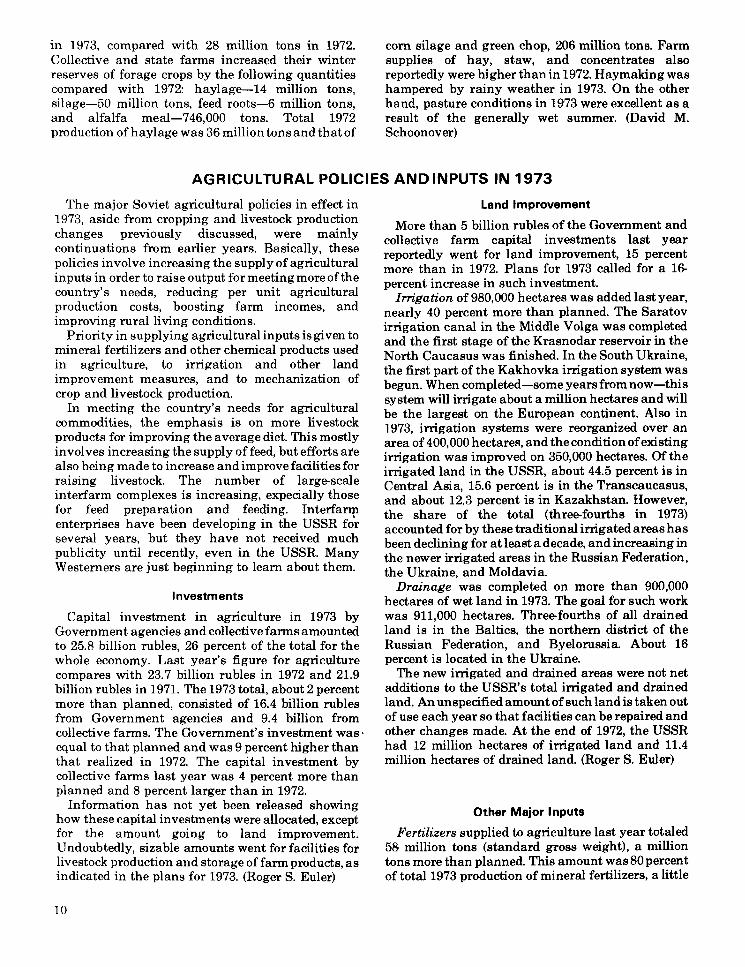
AGRICULTURAL POLICIES AND INPUTS IN 1973
The major Soviet agricultural policies in effect in 1973, aside from cropping and livestock production changes previously discussed, were mainly continuations from earlier years. Basically, these policies involve increasing the supply of agricultural inputs in order to raise output for meeting more of the country's needs, reducing per unit agricultural production costs, boosting farm incomes, and improving rural living conditions.
Priority in supplying agricultural inputs is given to mineral fertilizers and other chemical products used in agriculture, to irri~ration and other land improvement measures, and to mechanization of crop and livestock production.
In meeting the country's needs for agricultural commodities, the emphasis is on more livestock products for improving the average diet. This mostly involves increasing the supply of feed, but efforts are also being made to increase and improve facilities for raising livestock. The number of large-scale interfarm complexes is increasing, expecially those for feed preparation and feeding. Interfarm enterprises have been developing in the USSR fo~ several years, but they have not received much publicity until recently, even in the USSR. Many Westerners are just beginning to learn about them.
Investments
Capital investment in agriculture in 1973 by Government agencies and collective farms amounted to 25.8 billion rubles, 26 percent of the total for the whole economy. Last year's figure for agriculture compares with 23.7 billion rubles in 1972 and 21.9 billion rubles in 1971. The 1973 total, about 2 percent more than planned, consisted of 16.4 billion rubles from Government agencies and 9.4 billion from collective farms. The Government's investment was· equal to that planned and was 9 percent higher than that realized in 1972. The capital investment by collective farms last year was 4 percent more than planned and 8 percent larger than in 1972.
Information has not yet been released showing how these capital investments were allocated, except for the amount going to land improvement. Undoubtedly, sizable amounts went for facilities for livestock production and storage of farm products, as indicated in the plans for 1973. (Roger S. Euler)
10
Land Improvement
More than 5 billion rubles of the Government and collective farm capital investments last year reportedly went for land improvement, 15 percent more than in 1972. Plans for 1973 called for a 16-percent increase in such investment.
Irrigation of 980,000 hectares was added last year, nearly 40 percent more than planned. The Saratov irrigation canal in the Middle Volga was completed and the first stage of the Krasnodar reservoir in the North Caucasus was finished. In the South Ukraine, the first part of the Kakhovka irrigation system was begun. When completed-some years from now-this system will irrigate about a million hectares and will be the largest on the European continent. Also in 1973, irrigation systems were reorganized over an area of 400,000 hectares, and the condition of existing irrigation was improved on 350,000 hectares. Of the irrigated land in the USSR, about 44.5 percent is in Central Asia, 15.6 percent is in the Transcaucasus, and about 12.3 percent is in Kazakhstan. However, the share of the total (three-fourths in 1973) accounted for by these traditional irrigated areas has been declining for at least a decade, and increasing in the newer irrigated areas in the Russian Federation, the Ukraine, and Moldavia.
Drainage was completed on more than 900,000 hectares of wet land in 1973. The goal for such work was 911,000 hectares. Three-fourths of all drained land is in the Baltics, the northern district of the Russian Federation, and Byelorussia About 16 percent is located in the Ukraine.
The new irrigated and drained areas were not net additions to the USSR's total irrigated and drained land. An unspecified amount of such land is taken out of use each year so that facilities can be repaired and other changes made. At the end of 1972, the USSR had 12 million hectares of irrigated land and 11.4 million hectares of drained land. (Roger S. Euler)
Other Major Inputs
Fertilizers supplied to agriculture last year totaled 58 million tons (standard gross weight), a million tons more than planned. This amount was80percent of total1973 production of mineral fertilizers, a little
higher than in 1972. During 1970-72, fertilizer deliveries to agriculture totaled 162 million tons, about equal to the amount planned. Last year's total was 26 percent larger than the amount supplied in 1970, indicating the current importance being attached to this key input. Production and delivery to agriculture of mineral fertilizers, in pure nutrient terms, are shown in table 7. Manufacturing capacity for producing an additional 8.9 million tons of fertilizer annually was added last year.
Machinery deliveries to agriculture were generally up in 1973, but some of the known plans were not fulfilled. A total of 322,000 tractors were supplied, about 3 percent more than in 1972, but 2 percent below plan. Factory capacity for building an additional 27,100 tractors annually was completed. Trucks and special automotive vehicles delivered to agriculture in 1973 numbered 225,000, an increase of 20 percent and slightly more than the goal. Only 82,000 grain combines were supplied, 10,800 fewer than in 1972 and 12,000 less than scheduled. Only 46 percent were the newest and higher capacity models, instead of the 66 percent planned, which indicates there were production problems. Forage choppers totaled 61,000, up 5.600 from the previous year and a little above the target. Some data on deliveries and inventories of tractors, trucks, and combines are shown in table 8.
Although planned totals were not revealed, the 1973 numbers supplied to agriculture were larger than those in 1972 for cultivators, seeders, swathers, mineral fertilizer spreaders, tractor rakes, pickup balers, irrigation sprinklers, sugarbeets diggers, potato diggers, and corn pickers. For manure spreaders, deliveries equaled the previous year's number. Deliveries were down for tractor plows, mowers, loaders, milking machines, discs, grain cleaners, and cotton pickers. (Roger S. Euler)
lnterfarm Complexes and Projects
Joint farm activities of various kinds were mentioned by the Soviet press more often in 1973 than previously. While the available information is not specific enough to separate the interfarm enterprises from regular farm enterprises, it seems clear that the number and scope of interfarm activities increased again last year and are important in some areas, but unimportant or nonexistent in others. It also appears that one of the most common joint ventures is for livestock raising and feeding, but other activities mentioned include feed preparation, manufacture of building materials, construction, fertilizer production, land improvement, forestry, and growing and processing fruits and vegetables.
The Soviet press statements indicated that joint
farm activities were significant and successful in Moldavia; in Tambov, Penza, Belgorod, Lipetsk, and Voronezh Oblasts and Krasnodar Kray in the Russian Federation; and in "many'' unnamed oblasts in Byelorussia and the Ukraine. Press comment also showed that such development in Moldavia has been all or nearly all in the collective farm sector, where joint effort accounts for all erosion control systems, nearly all of the capital construction, over two-thirds of the market production of meat and eggs, and some growing and processing of fruits and vegetables. Intercollective farm feeding of hogs and cattle began in 1960-61 at sugar refineries, where the farms used sugar beet pulp and other byproducts, and later developed to include related mixed feed plants. In Tambov Oblast, interfarm cooperation in livestock production is said to be especially well developed. In late 1973, joint ventures involved 104 state farms and 290 ofthe296 collective farms in the area.
In 1973, Government and collective farm investment permitted construction of large-scale poultry housing for 28 million birds and additional facilities for 5 million cattle, about 5 million hogs, and 6 million sheep. However, probably only a fraction of the livestock facilities were for interfarm complexes and projects. It was also reported that seven, widely located "government" complexes for raising and fattening livestock were completed last year. Three of the complexes each have an annual capacity for 108,000 hogs. One complex, identified as a state farm, has a 52,000-hog capacity. The other three complexes were identified as having annual capacities for 36,000 hogs, 21,000 hogs, and 10,000 young cattle. Other new complexes were referred to but not described. Some of these possibly were interfarm complexes. Also announced was expansion of poultry farm capacity to accommodate 12 million more laying hens and 30 million more birds for meat production per year. This very likely refers to specialized state farms in the Ptitseprom system.
The Government's intentions for the eventual form and function of these interfarm relationships are still unclear. A few recent reports have indicated that these joint ventures, financed by the farms involved and by state loans, may be developed to eventually replace the traditional structure of state and collective farms. However, other information shows that participating farms have retained their individual identities and will continue to do so in the future. What does appear certain is that interfarm complexes and projects of different kinds show variations from one area to another, that they will continue to grow in places, and that farms involved may be all of one kind or a mixture of state and collective farms. (Roger S. Euler)
11
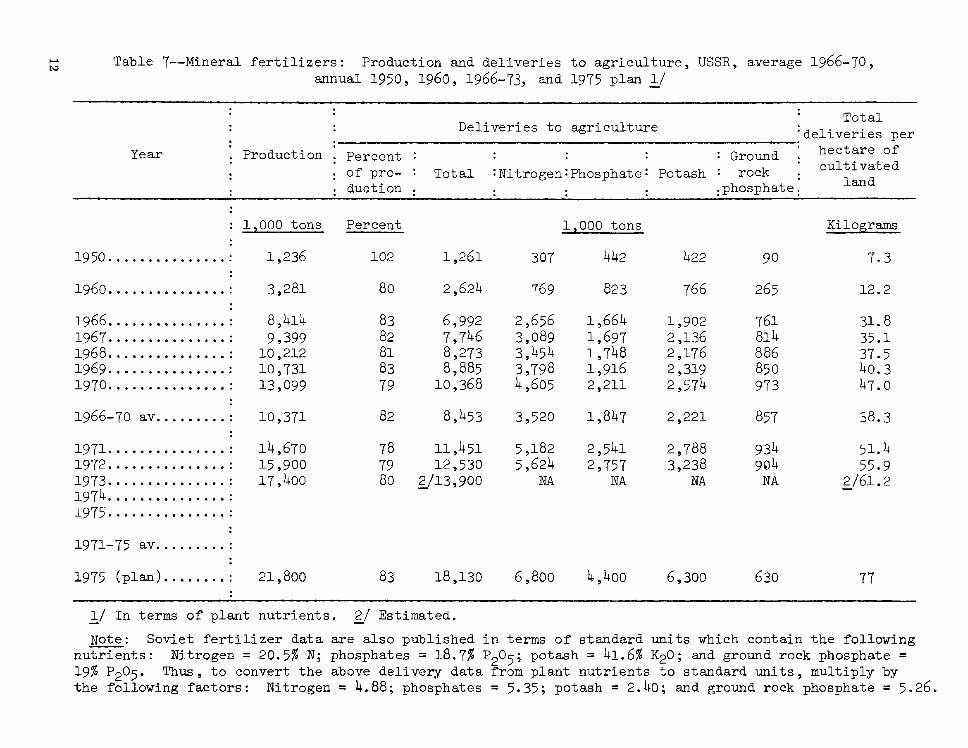
~ Table 7--Mineral fertilizers: Production and deliveries to agriculture, USSR, average 1966-70, annual 1950, 1960, 1966-73, and 1975 plan!/
Total Deliveries to agriculture :deliveries per
Year . Production . Percent : : : : : Ground hectare of :
of pro- : Total =Nitrogen=Phosphate: Potash : rock cultivated : land duction : : : : :phosphate:
1,000 tons Percent 1 2 000 tons Kilograms
19 50 ............... : 1,236 102 1,261 307 442 422 90 7.3
1960 . .............. : 3,281 80 2,624 769 823 766 265 12.2
1966 ............... : 8,414 83 6,992 2,656 1,664 1,902 761 31.8 1967 ............... : 9,399 82 7,746 3,089 1,697 2,136 814 35.1 196 81 I 1 1 1 1 1 1 1 1 1 1 1 I I : 10,212 81 8,273 3,454 1,748 2,176 886 37.5 1969 I I I I I I I I I I I 1 I I I : 10 '731 83 8,885 3,798 1,916 2,319 850 40.3 1970 . .............. : 13,099 79 10,368 4,605 2,211 2,574 973 47.0
1966-70 av ......... : 10,371 82 8,453 3,520 1,847 2,221 857 S8.3
1971 ............... : 14,670 78 11,451 5,182 2,541 2,788 934 51.4 1972 ............... : 15,900 79 12,530 5,624 2,757 3,238 9~4 55.9 1973 .....•......... : 17,400 80 £./13,900 NA NA NA NA £_/61.2 1974 ............... : 1975 ............... :
1971-75 av ......... : :
1975 (plan) •....•.. : 21,800 83 18,130 6,800 4,4oo 6,300 630 77
!/ In terms of plant nutrients. £_/ Estimated.
Note: Soviet fertilizer data are also published in terms of standard units which contain the following nutrients: Nitrogen= 20.5% N; phosphates = 18.7% P2o5 ; potash= 41.6% K20; and ground rock phosphate = 19% P205. Thus, to convert the above delivery data from plant nutrients to standard units, multiply by the following factors: Nitrogen= 4.88; phosphates = 5.35; potash= 2.40; and ground rock phosphate= 5.26.
Table 8--Tractors , trucks, and grain combines: Inventories USSR, averages 1956-75' annual 1966-73
Tractors Year Inven-
tories
1956-60 av ...... : 994
1961-65 av ...... : 1,329 :
1966 .......... : 1,660 1967 .•....•... : 1,739 1968 .......... : 1,821 1969 .......... : 1,908 1970 . ......... : 1,977
1966-70 av .••••• : 1,821
1971 .....•...• : 2,046 1972 . ......... : 2,112 1973 . ......... : NA 1974 .......... : 1975 . ......... :
. 1971-75 av ..•... : :
1975 (Plan) ..••• : 2,520
1971-75 av. (Plan) .•.•..... :
NA = not available. ];;./ End of year.
De-)iveries: . .
149
218
276 287 290 304 309
293
313 313 322
340
2/ Including tank trucks. 3/ Excluding specialized vehicles.
Trucks 2/
Inven- De-tories :liveries 3/:
: -:
Thousands
700 96
865 71
1,017 106 1,054 108 1,097 114 1,153 126 1,206 126
1,105 116
1,243 137 1,280 153
NA NA
1,650
.!±_/185
~/ Excludes an estimated 35,000 specialized vehicles.
1/ and deliveries,
Grain combines
Inven- De-tories :liv~ries
470 76
509 77
531 86 553 96 581 97 605 92 623 97
578 94
639 99 656 93
NA 82
109
13
FOOD SITUATION
During the first half of 1973, the USSR's food situation continued to reflect the effects of the poor 1972 agricultural year. Rumors and reports of food shortages, rationing, higher food prices, and lower food quality continued to persist through the early part of 1973, both in the Western press and apparently among the Soviet citizenry. To quell the rising publicity, top Soviet officials denied the reports. One form of "rationing" did occur, however, in that the Soviet Government become more stringent with allotments of food to domestic selling organizations. In the latter part of 1973, however, with prospects of a good agricultural year, the food situation appeared somewhat more normal. Most major industrial centers apparently had relatively satisfactory supplies of vegetables, fruits, bakery goods, and dairy products. However, meat supplies probably still remained below par, as compared with availabilities in the rural areas.
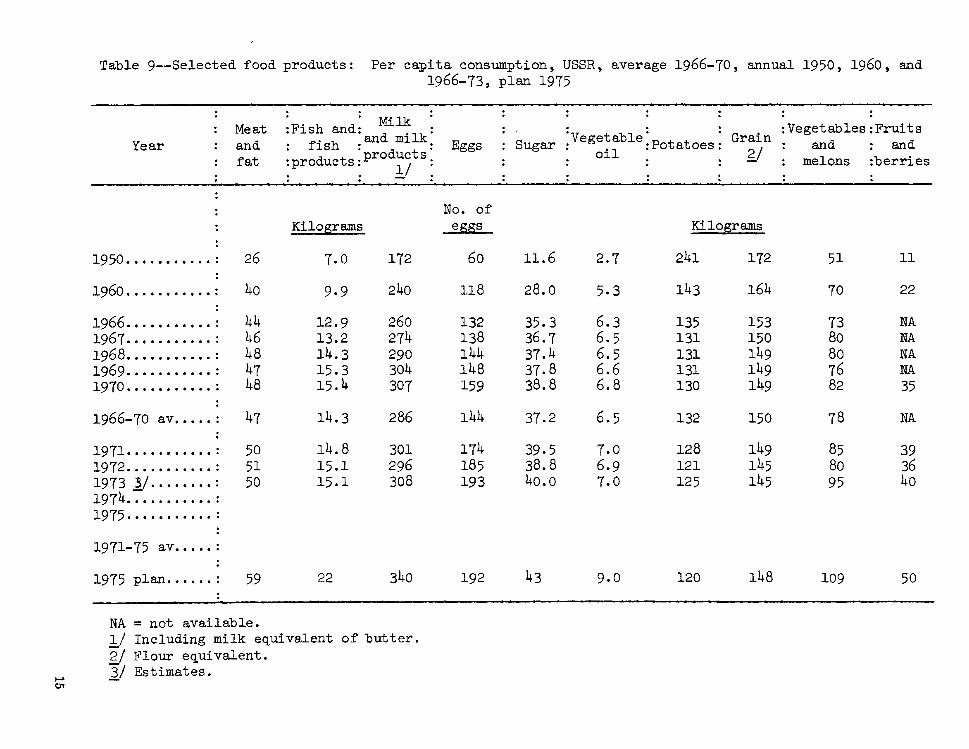
Per capita co~umption in 1973 of most major food items is estimated to have remained at about the same level as in 1972 (table 9). Consumption of vegetable oil and sugar probably began picking up in the latter half of 1973. Deficiencies in the availability of vegetable oil and sugar during the first half of the year were further reflections of low outputs from the disappointing 1972 sunflowerseed and sugarbeet crops. Processings from large imports of oil seeds and sugar during 1973 did, however, help offset these deficiencies.
Per capita consumption of potatoes has declined gradually since 1965 because of the Soviet emphasis on higher protein food consumption. In 1972, potato consumption fell to its lowest level, primarily because of the serious shortfalls in potato production in 1971
and 1972. The 1972 shortfall wasreflectedstronglyin the lower availability of potatoes during the early part of 1973.
Consumption of milk, milk products, and eggs probably increased significantly in 1973. Consumption of milk and milk products, which fell2 percent in 1972 to the lowest level since 1968, probably reached a record level in 1973. Egg consumption, which has increased sharply since 1970, is believed to have continued on an upward trend in 1973, also reaching a record level.
Vegetable and fruit consumption, which fell in 1972, probably made the largest gains in 1973, as compared with consumption of other foods, and probably reached record levels.
The sharp increases in overall agricultural output during 1973 shouldimprovethefood situation in 1974 and increase per capita consumption of most foods. However, based on estimated 1973 per capita consumption, considerable improvements and increases still will be needed for the Soviets to fulfill their original 1975 per capita consumption goals-except for potatoes, cereal products, and eggs. Per capita consumption of meat and meat products must increase an average of 9 percent in both 1974 and 1975 to reach the 1975 goal of 59 kilograms per capita-which at this juncture does not appear likely. Similarily, consumption of milk and milk products must increase an average of5 percent in both years to meet the 1975 goal, sugar consumption an average of 4 percent, and vegetable consumption an averageof7 percent. On the other hand, it is very probable that the 1975 goal for per capita consumption of eggs was reached and possibly surpassed in 1973. (Angel 0. Byrne)
SOVIET AGRICULTURAL TRADE In 1972 and 1973, agricultural products probably
accounted for roughly a fourth of total Soviet imports and for about a tenth of total exports. Farm imports, particularly grains, in calendar years 1972 and 1973 were sharply above previous totals because of the poor 1972 agricultural year. Farm exports decreased significantly in 1972 and probably continued at a low level through most of 1973.
During 1967-71, agricultural commodities made up 19-22 percent of total Soviet imports and 12-15 percent of total exports. Farm imports as a share of total imports do not show a significant trend for 1967-71. But the importance of agricultural products in total exports trended downward during the period, decreasing from some 15-17 percent in 1966-68 to about 10-12 percent in 1970-72.
Recent increases in Soviet agricultural imports and decreases in farm exports have enhanced at least temporarily the role of the USSR as a net importer of
14
agricultural products. Net agricultural imports in 1972 may have been on the order of $2 billion and in 1973, perhaps about double that amount. According to da.ta published in the FAO Trade Yearbook 1972, net Soviet imports of food and agricultural products during 1966-71 averaged about $600 million, ranging from about $250 million in 1968 to a little over $1 billion in 1970.5 (Fletcher Pope, Jr.)
Grain
Much of the recent increase in Soviet net agricultural imports is attributable to large grain purchases. The Soviets bought about 9 million tons of grain abroad in calendar year 1971 and roughly 28 million tons in calendar year 1972 .• Probably in view
5F AO used the former official Soviet exchange rate of .9 ruble equals $1.00 in converting official Soviet trade data in rubles into U.S. dollars.
...... CJt
Table 9--Selected food products: Per capita consumption, USSR, average 1966-70, annual 1950, 1960, and 1966-73, plan 1975
Year Meat and fat
1950 •.•.•••.••• : 26
1960 ........... : 4o
1966 •.•.•••.... : 44 1967 ....••.•... : 46 1968 •..••...... : 48 1969 ...•.•••... : 47 1970 . .......... : 48
1966-70 av •••.• : 47
1971 . .......... : 50 1972 ••••..•.... : 51 1973 3/ .••..... : 50 1974.-:-. ........ : 1975 ........... :
1971-75 av .•.•. :
1975 plan •.•••. : 59
NA = not available.
:Fish and: Milk : fish .and milk :products:products: . 1/ :
Kilograms
7.0
9.9
12.9 13.2 14.3 15.3 15.4
14.3
14.8 15.1 15.1
22
172
240
260 274 290 304 307
286
301 296 308
340
1/ Including milk equivalent of butter. gj Flour equivalent. ]_/ Estimates .
Eggs
No. of ~
60
118
132 138 144 148 159
144
174 185 193
192
Sugar ;vegetable~p t : Grain :Vegetables:Fruits 01• 1 . o atoes: . and £/ · : and
11.6
28.0
35.3 36.7 37.4 37.8 38.8
37.2
39.5 38.8 4o.o
43
2.7
5.3
6.3 6.5 6.5 6.6 6.8
6.5
7.0 6.9 7.0
9.0
Kilograms
241
143
135 131 131 131 130
132
128 121 125
120
172
164
153 150 149 149 149
150
149 145 145
148
melons
51
70
73 80 80 76 82
78
85 80 95
109
:berries
11
22
NA NA NA NA 35
NA
39 36 40
50
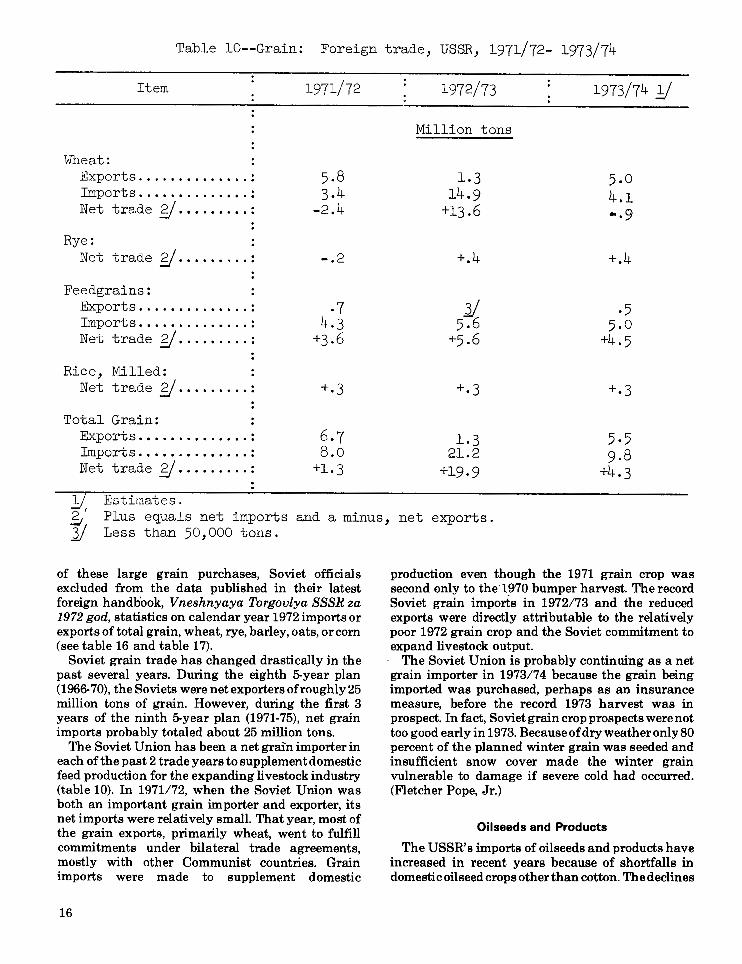
Table 10--Grain: Foreign trade, USSR, 1971/72- 1973/74
Item
Wheat: Exports ........•...•. : Imports .............. : Net trade gj ......... :
Rye: Net trade
Feedgrains: Exports ....•••....... : Imports .............. : Net trade gj ......... :
Rice, Milled: : Net trade g/ ......... :
Total Grain: Exports .•..•..••..... : Imports . ............. : Net trade gj ......... :
l Estimates.
1971/72
5·8 3.4
-2.4
-.2
6.7 8.0
+1.3
1972/73
Million tons
1.3 14.9
+13.6
+.4
1.3 21.2
+19.9
1973/74 y
5.0 4.1 -.9
+.4
~31' Plus equals net imports and a minus, net exports. 21 Less than 50,000 tons.
of these large grain purchases, Soviet officials excluded from the data published in their latest foreign handbook, Vneshnyaya Torgovlya SSSR za 1972 god, statistics on calendar year 1972 imports or exports of total grain, wheat, rye, barley, oats, or corn (see table 16 and table 17).
Soviet grain trade has changed drastically in the past several years. During the eighth 5-year plan (1966-70), the Soviets were net exporters of roughly 25 million tons of grain. However, during the first 3 years of the ninth 5-year plan (1971·75), net grain imports probably totaled about 25 million tons.
The Soviet Union has been a net grain importer in each of the past 2 trade years to supplement domestic feed production for the expanding livestock industry (table 10). In 1971172, when the Soviet Union was both an important grain importer and exporter, its net imports were relatively small. That year, most of the grain exports, primarily wheat, went to fulfill commitments under bilateral trade agreements, mostly with other Communist countries. Grain imports were made to supplement domestic
16
production even though the 1971 grain crop was second only to the'1970 bumper harvest. The record Soviet grain imports in 1972/73 and the reduced exports were directly attributable to the relatively poor 1972 grain crop and the Soviet commitment to expand livestock output. · The Soviet Union is probably continuing as a net grain importer in 1973174 because the grain being imported was purchased, perhaps as an insurance measure, before the record 1973 harvest was in prospect. In fact, Soviet grain crop prospects were not too good early in 1973. Because of dry weather only 80 percent of the planned winter grain was seeded and insufficient snow cover made the winter grain vulnerable to damage if severe cold had occurred. (Fletcher Pope, Jr.)
Oilseeds and Products
The USSR's imports of oilseeds and products have increased in recent years because of shortfalls in domestic oilseed crops other than cotton. The declines
in sunflowerseed production were particularly severe. Soviet oilseed imports shot up to almost 380,000 tons in calendar year 1972 from an average of about50,000 tons in 1966-71 (table 16), largely because of deliveries from the million tons of U.S. soybeans purchased that year. Oilseed imports in 1973, which would include the balance of those purchases probably totaled roughly 650,000 tons. Edible vegetable oil imports averaged 63,000 tons in 1970-72, compared with an average of 35,000 tons in 1966-69.
Soviet exports of oilseeds and products have decreased in recent years because of the poor crops, with oilseed and cake and meal exports more drastically affected than vegetable oil exports. Oilcake and meal exports in recent years have been only about 15 percent of exports in the late 1960's and oilseed exports only about a third as much (table 17). On the other hand, vegetable oil exports in 1970-72 averaged about 400,000 tons, compared with roughly 700,000 in the late 1960's. The very poor 1972 oilseed crops probably caused a further curtailment of Soviet oilseed and product exports in calendar 1973. (Angel 0. Byrne)
Sugar
The Soviet Union is both a major importer and exporter of sugar. Since 1965, raw sugar imports have generally been between 1.5 million and 2.5 million tons, while in most years, exports of refined sugar have been slightly more than a million tons. However, in calendar 1972, sugar exports fell to 50,000 tons.
Soviet sugar imports, raw value; during calendar 1972 totaled almost 2 million tons, almost a third higher than in the previous year. The large increase was attributed to below average crops in 1971 and 1972, lower raw sugar availability from Cuba (thus necessitating large purchases on the world market), and the need to rebuild heavily drawn-down stocks.
From latest available data, Soviet sugar imports, raw value, during January-June 1973 totaled 2.1 million tons, including 1.2 million from the improved 1972173 Cuban crop. Total sugar imports from Cuba during calendar 1973 were estimated at 1.5 million tons (36 percent above the low imports in 1972 and close to 50 percent below peak imports in 1970). Thus, total calendar year 1973 Soviet sugar imports, raw value, both from the world market and traditional suppliers, probably reached about 2.5 million tons. (Angel 0. Byrne)
Cotton
The Soviet Union is an important cotton exporter as well as a cotton importer. Cotton exports go mainly to other Communist countries, particularly those in Eastern Europe, while the cotton imports originate primarily in the Middle Eastern countries, including Egypt, the Sudan, and Syria. Soviet exports of cotton fiber have been trending upward in recent years and
totaled about 650,000 tons in 1972, while imports have averaged about 150,000 tons with no clear trend evident.
Availability of cotton lint from the 1972 and 1973 crops totaled close to a half-million tons more per year than estimated domestic utilization in 1973 and projected utilization in 1974 (table 11). Supplies available for domestic use-which had trended upward for several years, reaching a peak in 1971-dropped 7 percent in 1972 because ofheavy net exports. Based on the excess oflint cotton production in 1973 over estimated 1973 domestic utilization, the USSR could have been a net exporter of more than 450,000 tons of lint cotton in 1973 if no change in carryover stocks was made.
In calendar year 1972, Soviet lint cotton exports rose almost a fifth to a record level, as compared with only a 6-percent increase in 1971. Lint cotton exports in 1971 did not equal the 1968volumedespiteanother bumper cotton crop in 1971. However, net exports of lint cotton increased almost a fifth in 1971 and rose by a record 60 percent in 1972. Decreases in lint cotton imports in 1971, and particularly in 1972, have contributed to the net export position of the USSR. A continuation of recent trends in exports and imports would have resulted in a further increase in net exports of lint cotton by the USSR in 1973. (Angel 0. Byrne)
U.S. Agricultural Trade with the USSR
Grains have been by far the major component in U.S. agricultural exports to the Soviet Union in recent years. Grains accounted for 94 percent of the $157 million worth of U.S. agricultural commodities exported to the USSR in U.S. fiscal year 1972 and for 84 percent of the $955 million worth shipped in fiscal 1973 (table 12). Grain declined in relative importance in the fiscal 1973 exports because of large shipments-$134 million worth-of soybeans to the USSR.
U.S. agricultural exports to the Soviet Union during July-December 1973 totaled $331 million, slightly more than the $316 million for the corresponding period in 1972. Grain is expected to continue to be of primary importance in our fiscal 1974 agricultural exports to the USSR because it is quite unlikely that the Soviets will purchase any additional soybeans for delivery by June 30, 1974. U.S. agricultural exports to the Soviet Union, other than the recent grain and soybeans purchases, have generally ranged between $10 million and $20 million and consisted mainly of cattle hides.
The United States has supplied about 60 percent of the grain imported by the Soviet Union in recent years. Other major suppliers have been Canada, Australia, and France. In fiscal 1972, grain shipments to the USSR consisted entirely of feed grains-about 3 million tons. In fiscal 1973, wheat accounted for over two-thirds of the 13.4 million tons
17
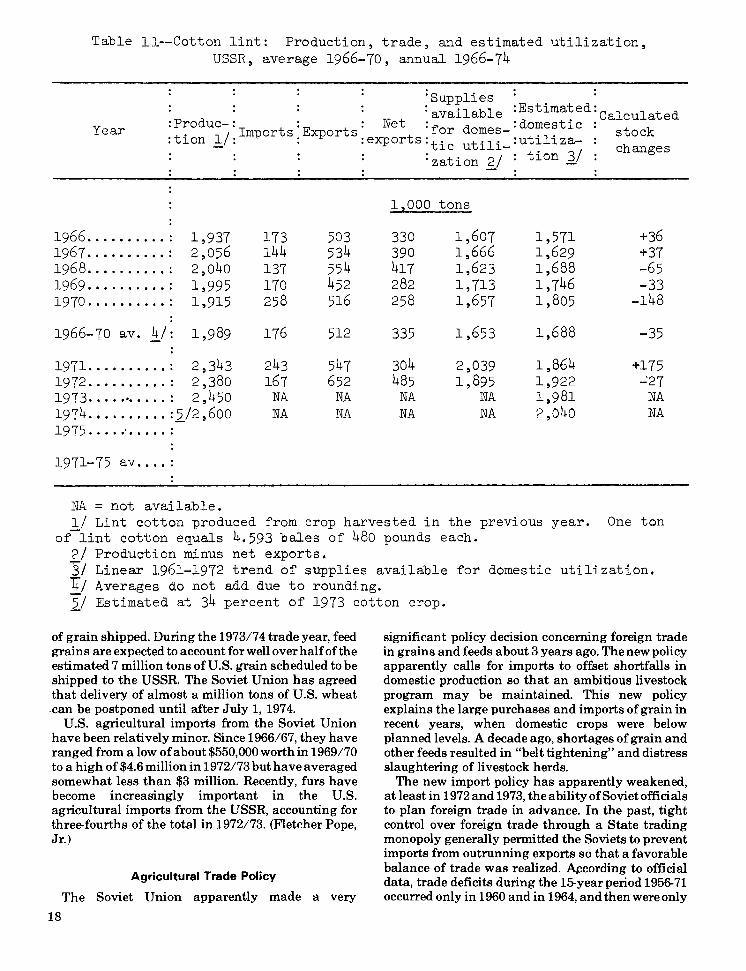
Table 11--Cotton lint: Production, trade, and estimated utilization, USSR, average 1966-10, annual 1966-74
:Supplies . :available :Estlma~ed:Calculated
:Produc-: t :E : Net :fo domes :domestlc I Impor s xports r - . . stock
:tion! : : :exports:tic utili-:utlllza- changes Year
:zation ~/ : tion ll
12000 tons
1966 .......... : 1,937 173 503 330 1,607 1,571 +36 196 7 .........• : 2,056 144 534 390 1,666 1,629 +37 196 8 .......... : 2,040 137 554 417 1,623 1,688 -65 1969 .......... : 1,995 170 452 282 1,713 1,746 -33 1970 .......... : 1,915 258 516 258 1,657 1,805 -148
1966-70 av. ~/: 1,989 176 512 335 1,653 1,688 -35
1971 .......... : 2,343 243 547 304 2,039 1,864 +175 1972 ........•. : 2,380 167 652 485 1,895 1,922 -'27 1973 ..•.•..•... : 2,450 NA NA NA NA 1,981 NA 1974 .........• :2/2,600 NA NA NA NA 2,040 NA 19 75 .... •' •.... :
1971-75 av •.•• :
NA = not available. 1/ Lint cotton produced from crop harvested in the previous year. One ton
of-lint cotton eguals 4.593 bales of 480 pounds each. 2/ Production minus net exports, 3/ Linear 1961-1972 trend of supplies available for domestic utilization. 4; Averages do not add due to rounding. 21 Estimated at 34 percent of 1973 cotton crop.
of grain shipped. During the 197317 4 trade year, feed grains are expected to account for well over half of the estimated 7 million tons of U.S. grain scheduled to be shipped to the USSR. The Soviet Union has agreed that delivery of almost a million tons of U.S. wheat .can be postponed until after July 1, 1974.
U.S. agricultural imports from the Soviet Union have been relatively minor. Since 1966/67, they have ranged from a low ofabout$550,000worthin 1969170 to a high of $4.6 million in 1972173 but have averaged somewhat less than $3 million. Recently, furs have become increasingly important in the U.S. agricultural imports from the USSR, accounting for three-fourths of the total in 1972173. (Fletcher Pope, Jr.)
Agricultural Trade Policy
The Soviet Union apparently made a very
18
significant policy decision concerning foreign trade in grains and feeds a bout 3 years ago. The new policy apparently calls for imports to offset shortfalls in domestic production so that an ambitious livestock program may be maintained. This new policy explains the large purchases and imports of grain in recent years, when domestic crops were below planned levels. A decade ago, shortages of grain and other feeds resulted in "belt tightening" and distress slaughtering of livestock herds.
The new import policy has apparently weakened, at least in 1972 and 1973, theabilityofSovietofficials to plan foreign trade in advance. In the past, tight control over foreign trade through a State trading monopoly generally permitted the Soviets to prevent imports from outrunning exports so that a favorable balance of trade was realized. ~cording to official data, trade deficits during the 15-year period 1956-71 occurred only in 1960 and in 1964, and then were only
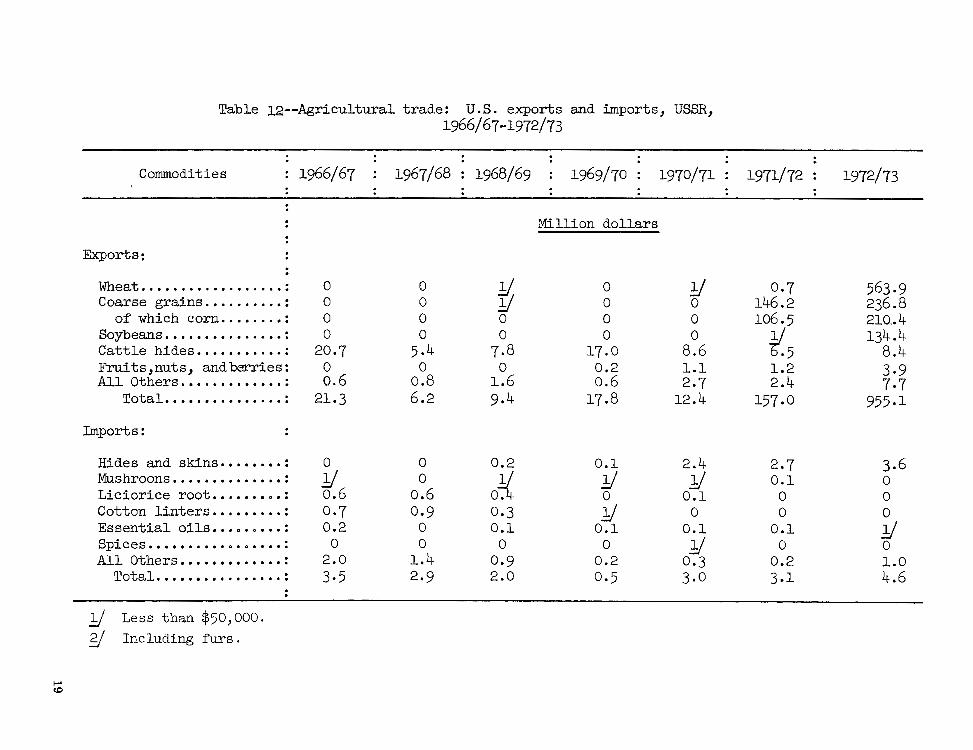
Table 12--Agricultural trade: U.S. exports and imports, USSR, 1966/67-1972/73
: : Commodities : 1966/67 : 1967/68 : 1968/69 : 1969/70 : 1970/71 : 1971/72 : 1972/73
: : : :
Million dollars . . Exports: . .
VJlleat . .•••.•...•......• : 0 0 y 0 y 0.7 563.9 Coarse grains .....••.•• : 0 0 y 0 0 146.2 236.8
of which corn •..•.•.. : 0 0 0 0 0 106.5 210 .• 4 Soybea:n.s ••••••••••••••• : 0 0 0 0 0
¥.5 134.4
Cattle hides ......•.••. : 20.7 5.4 7·8 17.0 8.6 8.4 Fruits,nuts, andbe.rries: 0 0 0 0.2 Ll 1.2 3.9 All Others .••.•...••••• : o.6 0.8 L6 0.6 2.7 2.4 1·1
Total . .............. : 21.3 6.2 9.4 17.8 12.4 157.0 955.1
Imports:
Hides and skins •.•••.•• : 0 0 0.2 O.l 2.4 2.7 3.6 Mushroons .............. : y 0 0~ y y O.l 0 Liciorice root ••••••••• : 0.6 0.6 0 O.l 0 0 Cotton linters .•••••••• : 0.7 0.9 0.3 y 0 0 0 Essential oils •••••••.. : 0.2 0 O.l O.l O.l O.l y Spices . ......... o • o •••• : 0 0 0 0 y 0 0 All Others •••.••••••••• : 2.0 L4 0.9 0.2 0.3 0.2 LO
Total . ............... : 3·5 2.9 2.0 0.5 3.0 3.1 4.6 . . y Less than $50,000. y Including furs.
~ c.c
on the order of 100 million rubles each year. Trade surpluses, on the other hand, ranged from about 900 million to 1.2 billion rubles annually from 1966 to 1971.6
However, in 1972, there was a trade deficit of about 600 million rubles. This abrupt change suggests that the large 1972 imports were not planned in advance. The huge grain purchases in July and August 1972, at least, probably were not included in the foreign trade plan. Soviet trade was in deficit in each quarter of 1972, with the largest deficit occurring in the fourth quarter. This strongly suggests that the trade deficit in 1973 probably was much larger than in 1972.
In addition, the Soviets generally have a favorable trade balance with other Communist countries and with the developing countries-which have accounted, respectively, for a bout 65 and 13 percent of trade turnover in recent years-but not with the developed countries. Consequently, surpluses have been accumulated on bilateral accounts, but deficits have occurred in convertible currencies. For example:
in 1971, total exports exceeded total imports by 1.2 billion rubles; with the developed countries, there was
trade deficit of almost 120 million rubles; while with other Communist countries and the developing countries, the Soviets had trade surpluses of about 750 million and 550 million rubles, respectively.
The durability or permanence of the new more liberal Soviet import policy is of great interest to exporters of grain and other feedstuffs. The Soviet Government's commitment to provide the citizenry with better diets through significantly larger supplies of livestock products per capita probably will require a continuation of the new policy. However,
unfavorable hard currency trade balances and increasing indebtedness are negative factors or restraints which will continuously be weighed in
foreign trade decisions. To date at least, the positive factor apparently has outweighed the negative factors and promises to do so in the foreseeable future. (Fletcher Pope, Jr.)
OUTLOOK FOR 1974 Policies and Inputs
The key agricultural policies of 1973 apparently will continue in 1974 with little or no change, aside from the degree of emphasis, and no significant revisions are in sight. Soviet officials seem to feel that current policies are gradually bringing the desired results, and that for the current year more of the same is in order. Soviet raw material and energy supplies appear large enough to provide the planned fertilizer and other inputs for this year's agricultural production.
Government and collective farm investment in agriculture in 1974 is scheduled to be 27.9 billion rubles, 8 percent more than in 1973 and 27 percent of all capital investment. The Government's part is supposed to be 18.4 billion rubles, 12 percent greater than that realized last year, while the collective farms' share is planned to rise only 1 percent to 9.5 billion rubles.
Land improvement this year by Government investment alone is scheduled to use 6.9 billion rubles, a third more than in 1973. Providing irrigation to 862,000 more hectares ofland, including 258,000 hectares of pasture, will be a major objective of this investment. Much of the newly irrigated land will be in Central Asia, Transcaucasus, Russian Federation, and the Ukraine. Expansion of irrigated vegetable production near large population and industrial centers is to receive priority attention. New drainage of 941,000 hectares is also scheduled for 1974.
6Currently, at the official Soviet rate, 1 ruble equals almost 1.3 U.S. dollars. However, when traded on West European exchanges, the ruble is discounted considerably.
20
Other agricultural-input goals for this year include supplying farms with 64.6 million tons of fertilizer, 6.6 million tons above the 1973 amount. The largest part of this increase is for areas with relatively adequate precipitation to make possible the largest gains in yields of grains and feed crops. Raw material supplies and plant capacity seem adequate for providing this planned fertilizer.
Machinery delivered to agriculture is to increase from 1973 numbers by the following percentages-tractors, 9 percent; trucks, 11 percent; and other agricultural machinery, more than 12 percent. Tractors supplied will include more of the largest and newest kinds, and all of the grain combines are to be the newest and highest capacity models. Fuel for operating the increased number of agricultural machines appears assured.
Other 1974 inputs planned include the completion of new large-scale poultry units for more than 30 million birds, and additional large feeding complexes for 63,000 beef cattle and more than a million hogs. At least some of these complexes probably are for the increasingly emphasized interfarm enterprises. (Roger S. Euler)
Agricultural Production
Agricultural output in 1974 is planned to increase by 6.4 percent over the 1973 level. However, Soviet 1974 crop production is expected to fall somewhat short of the record 1973 performance, unless weather should again be much better than normal during the growing season. Thus, any increase in 1974 Soviet agricultural production will probably be attributable to livestock raising. It seems doubtful that the increase in the value of livestock production will be
large enough to offset some decrease in the value of crop production and still raise the value of 1974 agricultural output by 6.4 percent.
Crops
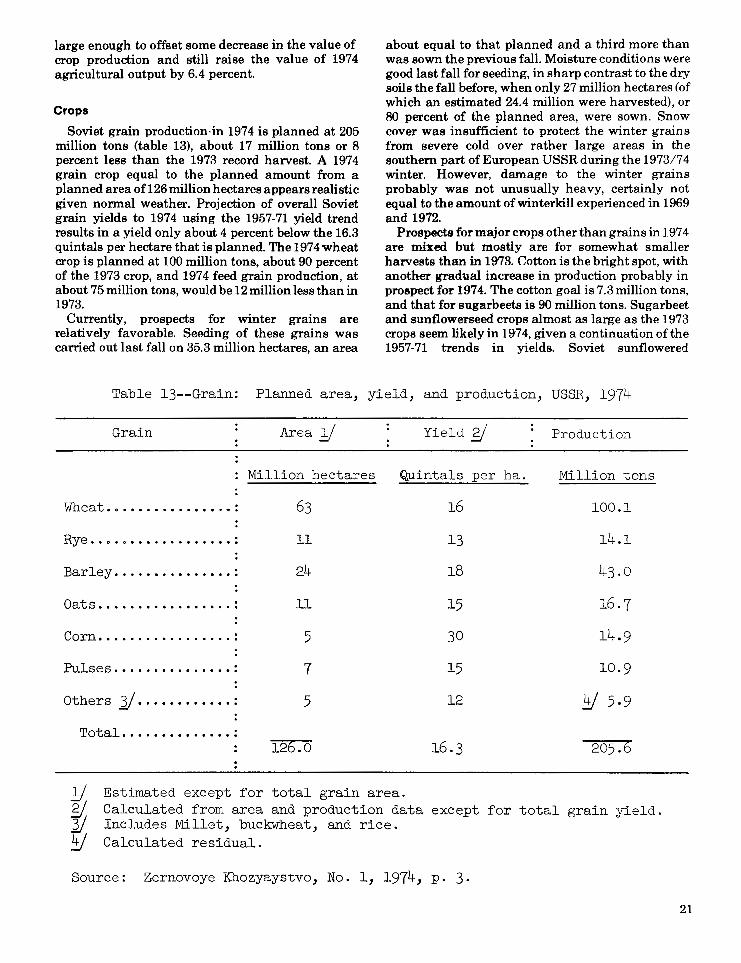
Soviet grain production-in 1974 is planned at 205 million tons (table 13), about 17 million tons or 8 percent less than the 1973 record harvest. A 1974 grain crop equal to the planned amount from a planned area of 126 million hectares appears realistic given normal weather. Projection of overall Soviet grain yields to 1974 using the 1957-71 yield trend results in a yield only about 4 percent below the 16.3 quintals per hectare that is planned. The 197 4 wheat crop is planned at 100 million tons, about 90 percent of the 1973 crop, and 1974 feed grain production, at about 75 million tons, would be 12 million less than in 1973.
Currently, prospects for winter grains are relatively favorable. Seeding of these grains was carried out last fall on 35.3 million hectares, an area
about equal to that planned and a third more than was sown the previous fall. Moisture conditions were good last fall for seeding, in sharp contrast to the dry soils the fall before, when only 27 million hectares (of which an estimated 24.4 million were harvested), or 80 percent of the planned area, were sown. Snow cover was insufficient to protect the winter grains from severe cold over rather large areas in the southern part of European USSR during the 1973174 winter. However, damage to the winter grains probably was not unusually heavy, certainly not equal to the amount of winter kill experienced in 1969 and 1972.
Prospects for major crops other than grains in 197 4 are mixed but mostly are for somewhat smaller harvests than in 1973. Cotton is the bright spot, with another gradual increase in production probably in prostrect for 1974. The cotton goal is 7.3 million tons, and that for sugarbeets is 90 million tons. Sugar beet and sunflowerseed crops almost as large as the 1973 crops seem likely in 1974, given a continuation of the 1957-71 trends in yields. Soviet sunflowered
Table 13--Grain: Planned area, yield, and production, USSR, 1974
Grain Area}) Yield~ Production
Million hectares Quintals per ha. Million tons
Wlleat. o ............... : 63 16 100.1
Rye •. o • o ••••••••••••• : ll 13 14.1
Barley .....•..•...•.. : 24 18 43.0
Oats ................. : ll 15 16.7
Corn . ................ : 5 30 14.9
Pulses .•.....•.•....• : 7 15 10.9 :
Others 1} . ........... : 5 12 y 5·9
Total . ............. : 126.0 16.3 205.6
l} Estimated except for total grain area. g/, Calculated from area and production data except for total grain yield. ]/ Includes Millet, buckwheat, and rice. ~ Calculated residual.
Source: Zernovoye Khozyaystvo, No. l, 1974, p. 3·
21
production in 1974 is planned at almost 7.2 million tons, 2 percent less than the 1973 harvest. With respect to potatoes and vegetables, past yield trends suggest that 1974 crops will be about 5 percent smaller than the 1973 crops. (Fletcher Pope, Jr.)
livestock
The outlook for livestock production in 1974 is very good. Plans call for the production of14.4 million tons of meat, 90.8 million tons of milk, and 53.5 billion eggs. These goals represent increases of 7 percent, 4 percent, and 5 percent, respectively, over 1973 production. The rebuilt livestock herds and bumper feed availabilities at the beginning of 197 4 augur well for attainment of the meat target and provide a good foundation for dairy herd performance. Final results, however, will depend on 1974 summer pasture conditions and feed crop ou ttum. The 197 4 targets for meat and milk are both 5 percent below the original5· year plan goals for 1974. Increasing commercialization of poultry meat and egg production is expected to enable continuation in 1974 of production uptrends in this sector. (David M. Schoonover)
Agricultural Trade
Soviet agricultural trade in 1974 should retum to a more normal pattem than existed in 1972 and 1973 in view of the record 1973 agricultural performance and an assumption of normal weather this year. The volume of agricultural imports in relation to agricultural exports will probably be sharply reduced from the 1973 level.
Agricultural imports during 1974 will probably be sharply curtailed, primarily because large grain imports will not likely be required. Also, improved domestic supplies should permit Soviet agricultural exports, including grain, to recover from the low
22
levels of the past 2 years. In fact, the Soviet Union could regain its traditional role of a net grain exporter in 197 4. However, if weather should be below normal and the grain crop substantially smaller than targeted, the USSR again could be a major importer during the second half of the year.
Soviet trade in oilseeds and products during 1974 is also expected to pick up in volume. A substantial increase in sunflowerseed oil exports is foreseen, considering the record Govemment purchases from the 1973 sunflowerseed crop. In view of the relatively good oilseed ·situation from the 1973 crop year, it currently seems unlikely that the Soviets will make any substantial purchases of U.S. soybeans during 1974 unless prices should decrease sharply. However, even with lower prices, the Soviets might be more inclined to purchase soybean oil cake and meal rather than beans since their oilseed crushing capacity will be more fully utilized than normal in processing domestic oilseeds.
Because of the improved 1973 Soviet sugar beet crop and increased availability of raw sugar from the relatively good 1973174 Cuban crop, the Soviet sugar situation has improved considerably. Thus, little or no buying on the world market is foreseen at this time. One indication of the improvement in Soviet sugar supplies was reflected in November 1973, when the USSR agreed to supply Finland with 130,000 tons of raw sugar (probably diverted from Cuba) in 197 4-the first sizable shipment of any kind of sugar to Finland in the past 2 years.
The outstanding 1973 cotton crop placed the USSR in a position to expand net exports of this commodity again in 1974. Based on our estimate of the lint cotton derived frbm the 1973 crop in relation to the recent trend in domestic utilization, Soviet net exports of lint cotton in 197 4 could be more than 500,000 tons, again assuming no change in carryover stocks. (Fletcher Pope, Jr. and Angel 0. Byrne)
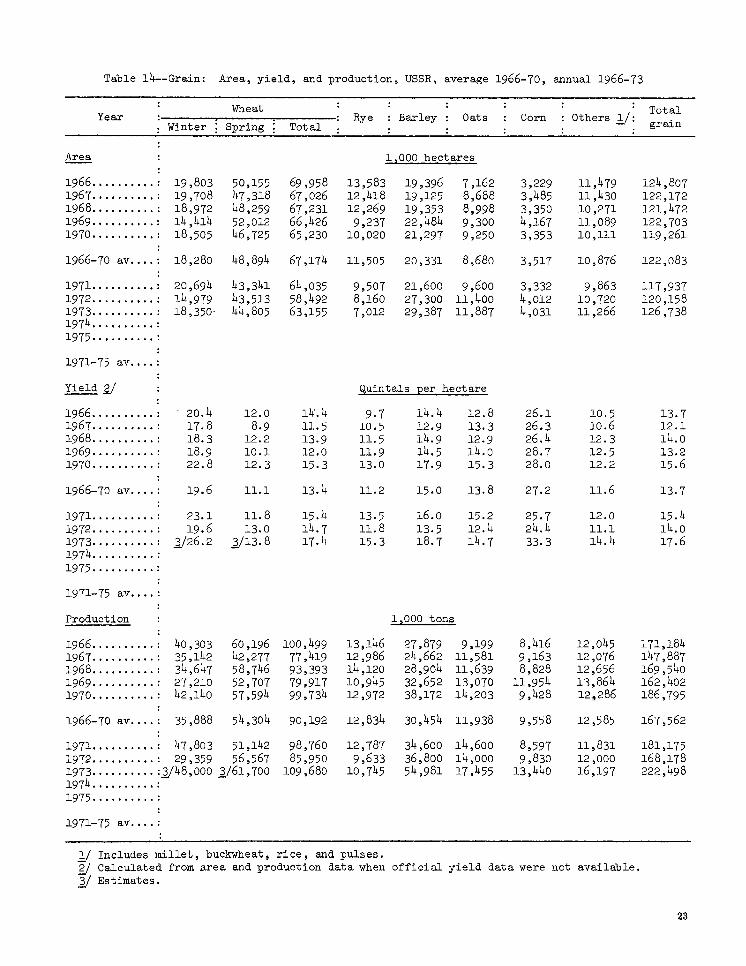
Table 14--Grain: Area, yield, and production, USSR, average 1966-70, annual 1966-73
Wheat Total Year Rye : Barley : Oats Corn Others l-_/: Winter Spring Total grain
Area 1 2 000 hectares :
1966 ••........ : 19,803 50,155 69 ,958 13,583 19,396 7,162 3,229 11,479 124,807 1967 ...•...... : 19,708 47,318 67,026 12,418 19,125 8,688 3,485 11,430 122,172 1968 ....••.... : 18,972 48,259 67,231 12,269 19,353 8,998 3,350 10,271 121,472 1969 .•.•.•.... : 14,414 52,012 66,426 9,237 22,484 9,300 4,167 11,089 122,703 1970 .......... : 18,505 46,725 65,230 10,020 21,297 9,250 3,353 10,111 119,261
: 1966-70 av .... : 18,280 48,894 67,174 11,505 20,331 8,680 3,517 10,876 122,083
1971 .•.......• : 20,694 43,341 64,035 9,507 21,600 9,600 3,332 9,863 117,937 1972 .•.....•.. : 14,979 43,513 58,492 8,160 27,300 11,400 4,012 10,720 120,158 1973 .......... : 18,350· 1974 .......... :
44,805 63,155 7,012 29,387 11,887 4,031 11,266 126,738
1975· ••....... :
1971-75 av .... :
Yield£/ Quintals Eer hectare :
1966 •......... : 20.4 12.0 14'.4 9·7 14.4 12.8 26.1 10.5 13.7 1967 .......... : 17.8 8.9 11.5 10.5 12.9 13.3 26.3 10.6 12.1 1968 .......... : 18.3 12.2 13.9 11.5 14.9 12.9 26.4 12.3 14.0 1969 .......... : 18.9 10.1 12.0 11.9 14.5 14.0 28.7 12.5 13.2 1970 .......... : 22.8 12.3 15.3 13.0 17.9 15.3 28.0 12.2 15.6
: 1966-70 av .... : 19.6 11.1 13.4 11.2 15.0 13.8 27.2 11.6 13.7
1971 .......... : 23.1 11.8 15.4 13.5 16.0 15.2 25.7 12.0 15.4 1972 .......... : 19.6 13.0 14.7 11.8 13.5 12.4 24.4 11.1 14.0 1973 .....•.... : J./26.2 J./13. 8 17.4 15.3 18.7 14.7 33.3 14.4 17.6 1974 .......... : 1975 .......... :
1971-75 av •.•. :
Production 1 2000 tons
1966 .......... : 40,303 60,196 100,499 13,146 27,879 9,199 8,416 12,045 171,184 1967 ....•..... : 35,142 42,277 77,419 12,986 24,662 11,581 9,163 12,076 147,887 1968 ...•...... : 34,647 58,746 93,393 14,120 28,904 11,639 8,828 12,656 169,540 1969 .......... : 27,210 52,707 79,917 10,945 32,652 13,070 11,954 13,864 162,402 1970 .......... : 42,140 57,594 99,734 12,972 38,172 14,203 9,428 12.286 186,795
1966-70 av ..•. : 35,888 54,304 90,192 12,834 30,454 11,938 9,558 12,585 167,562
1971 .......... : 47,803 51,142 98,760 12,787 34,600 14,600 8,597 11,831 181,175 1972 .......... : 29,359 56,567 85,950 9,633 36,800 14,000 9,830 12,000 168,178 1973 .......... :J./48,000 J./61,700 109,680 10,745 54,981 17,455 13,440 16,197 222,498 1974 .......... : 1975 .......... :
1971-75 av .... :
1/ Includes millet, buckwheat, rice, and pulses. 2/ Calculated from area and production data when official yield data were not available. ]/ Estimates.
23
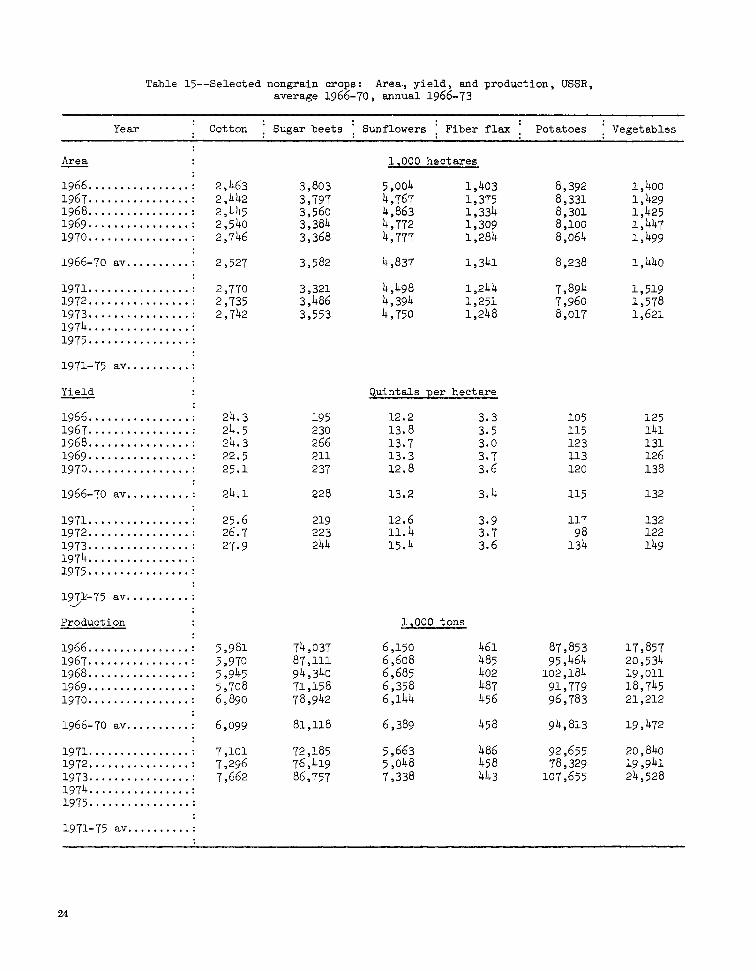
Table 15--Selected nongrain crops: Area., yield, and production, USSR, average 1966-70, annual 1966-73
Year
1966 ............•.•. : 1967 ................ : 1968 .•.............. : 1969 ..............•. : 1970 .............•.. :
1966-70 av ...•.•.... :
1971 ................ : 1972 ...............• : 1973 ..........•..•.. : 1974 ............•... : 1975 ..•............. :
1971-75 av .......... :
Cotton
2,463 2,442 2,445 2,540 2,746
2,527
2,770 2,735 2,742
Sugar beets Sunflowers ; Fiber flax
3,803 3,797 3,560 3,384 3,368
3,582
3,321 3,486 3,553
1,000 hectares
5,004 4,767 4,863 4,772 4, 777
4,837
4,498 4,394 4,750
1,403 1,375 1,334 1,309 1,284
1,341
1,244 1,251 1,248
~ Quintals per hectare
1966 ...•.....•.....• : 1967 ......•...•..... : 1968 .....•.......•.. : 1969 ..........•..... : 1970 ...•.....•.....• :
1966-70 av ••...•.... :
1971 ...•............ : 1972 ...............• : 1973 ................ : 1974 .•.............. : 1975 •............... :
l~l-75 av .......... ~
Production
1966 ..••...........• : 1967 ...••........... : 1968 •.............•. : 1969 ................ : 1970 ........•....••. :
1966-70 av .......... :
1971 •.•............. : 1972 ................ : 1973 ................ : 1974 ................ : 1975 ....•........... :
1971-75 av ...•...... :
24
24.3 24.5 24.3 22.5 25.1
24.1
25.6 26.7 27.9
5,981 5,970 5,945 5,708 6,890
6,099
7,101 7,296 7,662
195 230 266 211 237
228
219 223 244
74,037 87,111 94,340 71,158 78,942
81,118
72,185 76,419 86,757
12.2 13.8 13.7 13.3 12.8
13.2
12.6 11.4 15.4
1,000 tons
6,150 6,608 6,685 6,358 6,144
6,389
5,663 5,048 7,338
3.3 3.5 3.0 3.7 3.6
3.4
3.9 3.7 3.6
461 485 402 487 456
458
486 458 443
Potatoes
8,392 8,331 8,301 8,100 8,064
8,238
7,894 7,960 8,017
105 115 123 113 120
115
117 98
134
87,853 95,464
102,184 91,779 96 '783
94,813
92,655 78,329
107,655
Vegetables
1,400 1,429 1,425 1,447 1,499
1,440
1,519 1,578 1,621
125 141 131 126 138
132
132 122 149
17,857 20,534 19,011 18,745 21,212
19,472
20,840 19,941 24,528
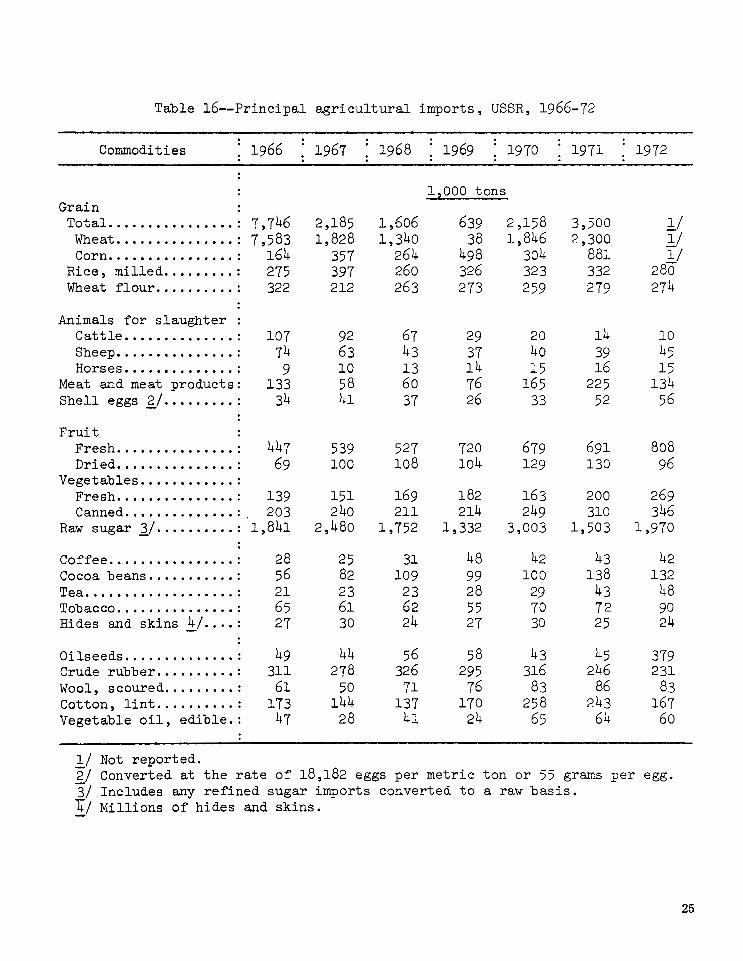
Table 16--Principal agricultural imports, USSR, 1966-72
Commodities 1966 1967 1968 :
1969 :
1970 1971 1972
1 2000 tons Grain
Total . ............... : 7,746 2,185 1,606 639 2,158 3,500 1/ Wheat . ............•. : 7,583 1,828 1,340 38 1,846 2,300 II Corn . ............... : 164 357 264 498 304 881 1/
Rice, milled •.•...•.• : 275 397 260 326 323 332 280 Wheat flour .•........ : 322 212 263 273 259 279 274
Animals for slaughter : Cattle .............. : 107 92 67 29 20 14 10 Sheep ............... : 74 63 43 37 40 39 45 Horses . ............. : 9 10 13 14 15 16 15
Meat and meat products: 133 58 60 76 165 225 134 Shell eggs£/ ......... : 34 41 37 26 33 52 56
Fruit Fresh . .............. : 447 539 527 720 679 691 808 Dried . .............. : 69 100 108 104 129 130 96
Vegetables .•....•....• : Fresh ............... : 139 151 169 182 163 200 269 Canned . ............. : 203 240 211 214 249 310 346
Raw sugar J/ .......... : 1,841 2,480 1,752 1,332 3,003 1,503 1,970
Coffee . ............... : 28 25 31 48 42 43 42 Cocoa beans ........•.. : 56 82 109 99 100 138 132 Tea . ....••........ · ... : 21 23 23 28 29 43 48 Tobacco ............... : 65 61 62 55 70 72 90 Hides and skins ~/ .... : 27 30 24 27 30 25 24
Oilseeds . ............. : 49 44 56 58 43 45 379 Crude rubber .....•.... : 311 278 326 295 316 246 231 Wool, scoured . ........ : 61 50 71 76 83 86 83 Cotton, lint . ......... : 173 144 137 170 258 243 167 Vegetable oil, edible.: 47 28 41 24 65 64 60
1/ Not reported. g) Converted at the rate of 18,182 eggs per metric ton or 55 grams per egg. 3/ Includes any refined sugar imports ~/ Millions of hides and skins.
converted to a raw basis.
25
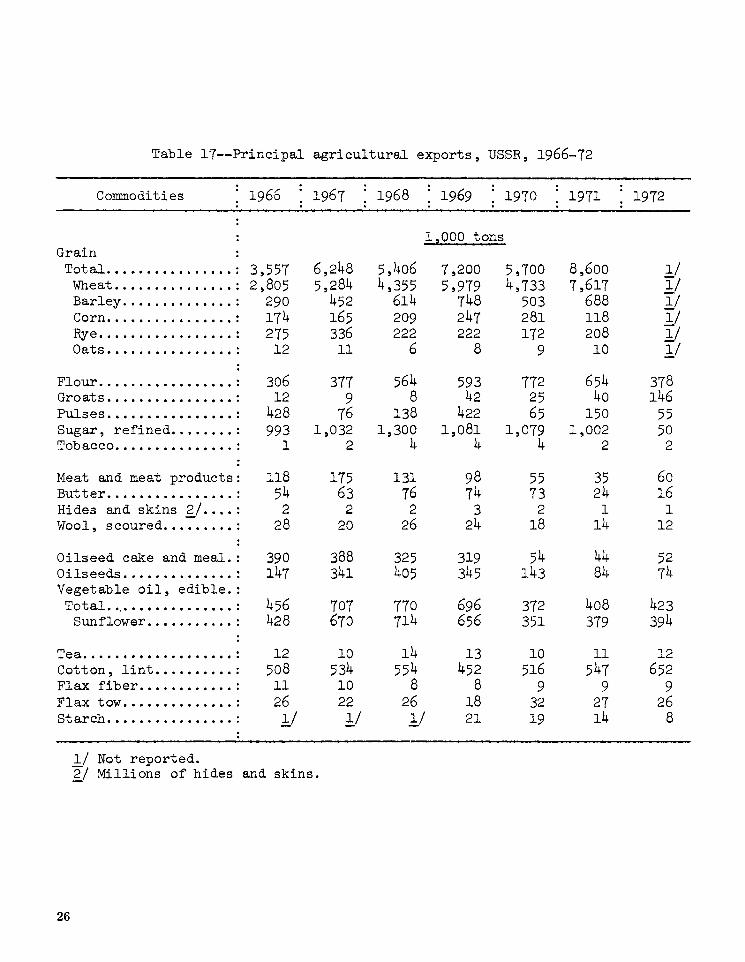
Table 17--Principal agricultural exports, USSR, 1966-72
Commodities 1966 1967 1968 :
1969 :
1970 1971 1972 . .
1 1000 tons Grain Total . ............... : 3,557 6,248 5,406 7,200 5,700 8,600 1/
Wlleat • ••.•••••.•.•.• : 2,805 5,284 4,355 5,979 4,733 7,617 1/ Barley .............. : 290 452 614 748 503 688 1/ Corn . ............... : 174 165 209 247 281 118 l/ Ry"e • ••• • •• • • •••••••• : 275 336 222 222 172 208 I; Oats . ............•.• : 12 11 6 8 9 10 ~/
Flour . ................ : 306 377 564 593 772 654 378 Groats . ............... : 12 9 8 42 25 40 146 P'Ulses . •••.••••••..••• : 428 76 138 422 65 150 55 Sugar, refined ........ : 993 1,032 1,300 1,081 1,079 1,002 50 Tobacco . .............. : 1 2 4 4 4 2 2
Meat and meat products: 118 175 131 98 55 35 60 Butter . ............... : 54 63 76 74 73 24 16 Hides and skins ?:./ .•. , : 2 2 2 3 2 1 1 Wool, scoured ..... , .. ,: 28 20 26 24 18 14 12
Oilseed cake and meal. : 390 388 325 319 54 44 52 Oilseeds . ............. : 147 341 405 345 143 84 74 Vegetable oil, edible.: Total . ................ : 456 707 770 696 372 4o8 423
Sunflower ...•...•... : 428 670 714 656 351 379 394
Tea . ....••.••...•..•.• : 12 10 14 13 10 11 12 Cotton, lint ...•••.... : 508 534 554 452 516 547 652 Flax fiber ............ : 11 10 8 8 9 9 9 Flax tow . ............. : 26 22 26 18 32 27 26 Starch . ............... : 1:..1 1/ 1/ 21 19 14 8
1/ Not reported. 2/ Millions of hides and skins.
26


UNITED STATES DEPARTMENT OF AGRICULTURE WASHINGTON, D.C. 20250
OFFICIAL BUSINESS PENALTY FOR PRIVATE USE, $300
POSTAGE AND FEES PAID U.S. DEPARTMENT OF
AGRICULTURE AGR 101
FIRST CLASS U.S. MAIL