the adoption and impact of management intensive rotational grazing
TRANSCRIPT

AJAA P17-02
The Adoption and Impact of Management Intensive Rotational Grazing (MIRG) on Connecticut Dairy Farms
Jeremy Foltz and Gillis Lang*
Address for Correspondence: Jeremy Foltz
Dept. of Ag. And Applied Economics University of Wisconsin-Madison
427 Lorch St. Madison WI 53706
Email: [email protected] Abstract:
Management intensive rotational grazing has garnered a great deal of interest in recent years as a method for returning profitability to Northeastern dairy farms. This work uses a random sample of Connecticut dairy farmers to estimate a binary choice adoption model and then cost, productivity, and profit functions that control for the adoption choice. MIRG adopters are shown to be more educated and have less rented agricultural land (a proxy for lack of access to land within a short distance of the barn). MIRG adoption had no significant effects on costs and productivity, nor did it lower profits, per cow. Evidence was found, however, to suggest that full adopters of the technology had more profitable farms than partial adopters. These results also show the importance of controlling for the different characteristics of adopters when evaluating the returns to animal grazing.
* The authors are Assistant Professor University of Wisconsin and Graduate Student, University of Connecticut. They would like to thank participants at the Northeast Agricultural and Resource Economics Association meetings in Bar Harbor Maine for comments and Maria Gonzalez and Margaret Hines for help with the data.

1
Introduction:
A centuries old technique, the management of cow grazing, has garnered a great deal
of interest in recent years as a method for returning profitability to Northeastern dairy farms.
Management intensive rotational grazing (MIRG) incorporates recent advances in the
understanding of plant and animal production into an old technology, the management of
cow grazing. While most new technologies seek to increase productivity as a means of
increasing profits, this one seeks to lower costs per unit of output. Research has shown that
MIRG can decrease milk production costs, though generally at the expense of milk
production, suggesting that the overall profitability is uncertain.
To date, research on MIRG has concentrated on the productivity and profitability
while ignoring the adoption decision farmers make. In addition, many of the current studies
have used selected non-representative samples of farmers and have not been able to
determine the overall profitability of a farm using MIRG for a full sample of the dairy farm
population. This work seeks to go beyond this earlier work by using a random sample of
Connecticut dairy farmers to investigate who adopts MIRG and who receives higher farm
profits from it. The work estimates a probit binary choice adoption model and then cost,
productivity, and profit functions that use predicted values from the adoption choice model
to control for the possibility that adoption and cost, productivity, and profit are jointly
determined. In other words, adoption decisions may be endogenous to other farm outcomes:
the characteristics that influence farmers’ decisions to adopt MIRG may also influence cost,
productivity, and profit outcomes. In addition, this work estimates the economic returns to
different rates of grazing rotations.

2
A summary of the current literature on grazing sets the context for this work. The
econometric estimation methodology is discussed and data description provided. Finally,
estimation results of an adoption equation, and cost, production, and profitability equations
as well as policy conclusions are presented.
Literature on MIRG:
A growing body of literature has investigated the role modern rotational grazing
techniques can play as an alternative to confinement feeding systems. A number of recent
simulation studies have demonstrated that from a technical standpoint grazing can be at least
as profitable, if not more so, than conventional confinement systems. For example, Elbehri
and Ford (1995) did a Monte-Carlo simulation of a Pennsylvania Holstein dairy farm and
find lower costs and increased profits from intensive grazing relative to a confinement
system. Frank et al. (1996) simulated a whole-farm economic model for different grazing
scenarios on typical southwest Wisconsin dairy farms and showed increased profits with
grazing.
Other recent studies have used a case study methodology to get a detailed picture of
the potential profitability on actual farms. For example, Pillsbury and Burns (1989) looked
at Voisin grazing management adoption and daily rotational grazing in a longitudinal study
of one Vermont farm and showed lower costs with daily rotation compared to confined
feeding and increased benefits with daily rotation compared to extensive grazing. Emmick
and Toomer (1991) compared costs before and after intensive pasture adoption on 15 farms
in New York to find a reduction of production costs of $153 per cow. Bower-Spence (1995)
compared profits from confinement and intensive grazing operation on a single

3
Pennsylvania farm that switched from one to the other and finds increased profits for
grazing.
With an increase in the number of farms using MIRG in many upper-Midwest and
Northeastern states, a number of studies report the results of on-farm surveys of farmers
adopting grazing. Ford and Hanson (1994) summarized two Pennsylvania studies showing
the characteristics of dairy grazier practices that lower feed costs and generate higher profits
for grazing farms compared to non-grazers. Jackson-Smith et al. (1996) used two
representative surveys to characterize grazing management practices and to analyze
economic performance of MIRG users. They showed lower costs for grazers compared to
confinement operations, but did not report profitability estimations. The Hanson et al.
(1998a) sample of northeastern Pennsylvanian farms showed decreased profits under
grazing. Hanson et al. (1998b) combined New York and Pennsylvania dairy farm samples
for an empirical analysis that showed lower profit and increased production for extensive
grazing and higher profit and increased production for moderately intensive grazing than
that for farms that did not graze. Winsten et al. (2000) found decreased productivity, costs,
and profits for either extensive or intensive (>75% forage from daily rotation) grazers
compared to confinement systems in a sample of Northeastern (PA and VT) dairy farms.
However, once other factors had been controlled for, they found that profitability on grazing
farms was not significantly different from confinement operations.
This study follows the spirit of the on-farm survey studies. While most of these
studies have collected data from a large number of farmers, it is unclear in all but those by
Jackson-Smith et al., whether the sample is truly representative of all farmers or just a select
few. In addition, while all of these studies have investigated costs and profitability, they do

4
not control for the adoption choices being jointly determined with costs, productivity, and
profits. Both the select sample and ignoring that adoption is potentially endogenous to other
outcomes will bias the results. In particular, farmers who are most likely to graze should
also be those for whom grazing is most likely to increase total farm profits. When
comparing profits, one might then overstate the returns to grazing by ignoring this joint
determination, or endogeneity. The next section details the econometric procedure used to
account for the joint determination of grazing choices.
Methodology:
Using survey data from Connecticut, a model similar to Stefanides and Tauer’s 1999
rBST model is used to estimate the effect of MIRG on profits of Connecticut dairy farms.
This methodology involves a two step process of estimating the probability that a farmer is a
grazier and then using that probability in an estimate of the cost, production, and profit
functions. This methodology differs from that used in most of the previous studies on
MIRG listed above in that estimates of costs, production, and profits are a function of the
farmer's adoption decision. Modeling the joint determination of adoption allows us to
control for the fact that the sample of MIRG users is not representative of all farms.
Since the joint determination of adoption is the same for costs, productivity, and
profits, we illustrate it only for profits. Assume that profit (Y) is a linear function of
explanatory variables (X) and a MIRG dummy variable (R), so the linear regression equation
is:
Y = β’X + δR + e , (1)

5
where e is a normal random disturbance and R is a 0 or 1 dummy variable for the use of
MIRG (R=1 if MIRG is adopted, R=0 otherwise). Note that a farmer's decision to adopt is
dependent on many of the same characteristics of farm and farm operator that would also
influence profits. Thus, R should be treated as an endogenous, jointly determined variable.
An index function (probit) model will be used to estimate the adoption equation:
R* = γ’Z + u (2)
where R* is an unobservable index variable, γ’Z is called the index function and Z represents
explanatory variables, and u is an error term which u ~ N(0,1). In this case, the observable
dummy variable is:
R = 1 if R* > 0 (adopt MIRG),
R = 0 if R* ≤ 0 (not adopt MIRG).
From equation (1) and (2), the expected profit, Y, can be obtained from:
(3A) E[Y] = E[YR=1] * prob(R=1) + E[YR=0] * prob(R=0)
(3B) = β’X + δΦ(γ’Z )
where Φ is cumulative standard normal function. Thus, Φ(γ’Z ) serves as the instrumental
variable for R in equation (1) to avoid the biases of estimators. Using this framework, the
parameters of both the adoption decision and the profit equation are obtained.
In order for Φ(γ’Z ) to serve as a valid instrument, we need an exclusion criterion to
identify the parameters: some variables that describe the decision to be a grazier that do not
influence either costs, productivity, or profits (Greene, 1997, p. 295). The fragmentation of
agricultural land in Connecticut and the inability to move cows along roads gives us such a
criterion. Only farms with suitable pasture within cow walking distance of their barns can
engage in grazing to a serious extent. But this distance between the land base and the barn

6
should have no bearing on the costs, productivity, or profits of farms in general. Thus a
reasonable variable to include in Z but exclude from X would be one that proxies this
distance from the barn to the land base.1
This work uses this framework to estimate cost, production, and profitability
functions with a jointly determined adoption decision. First the adoption equation is
estimated, then the predicted probability of adopting is added as a variable in successive
estimations of production, cost, and profit equations. 2 3 In addition, a profitability equation
is estimated parameterizing the grazing decision by using the length of grazing rotation as a
variable. This last equation is intended to provide some evidence on the profitability of
different intensities of rotational grazing.
The Data:
In 1999, the University of Connecticut conducted a survey of dairy farmers in the
state. The survey’s objectives were to assess the competitiveness of Connecticut dairy
farms and the adoption of new technologies including MIRG. All 245 Connecticut dairy
farms received a survey, and 124 returned useable information on their dairy farms,
representing a 51% response rate.4 Connecticut dairy farms are relatively small-scale
businesses, with more than 60% of farms having less than 100 milk cows. The farmers are
1 Note that in the increasingly suburban environment of Connecticut the key determinant of getting cows to a pasture is not how far they can walk or how long it takes, but the amount of traffic along the roads that the cows would inevitably have to cross. 2 Due to significant heteroskedasticity of the error terms, the production, cost, and profit equations were estimated using standard errors corrected with the Huber-White procedure (Greene, 1997, p. 505). 3 Note that, as suggested by a reviewer, one could estimate the production, cost, and profit equations as a system of equations using for example the seemingly unrelated regression (SUR) framework. Such a framework would be appropriate if the equations had correlated error terms, but estimates of a SUR model with our data showed an insignificant correlation. The Bruesch-Pagan χ2 test (with 3 degrees of freedom) test of independence of the residuals among the regressed equations = 0.661 with Pr = 0.8822, so we fail to reject the null hypothesis that the residuals of the equations are independent.

7
on average well educated, productive farmers, with a rolling herd average of 19,800 lbs per
cow.
In order to have a definition of being a grazier that is consistent with both practice
and the literature, we use one developed by Jackson-Smith et al. A farm is designated as
using management intensive rotational grazing if they:
1) rely on pasture for at least part of the forage ration of any milking cows
2) usually move grazing cows to a new paddock at least once a week, and
3) make pasture the primary source of total feed for milking cows during the
grazing season.
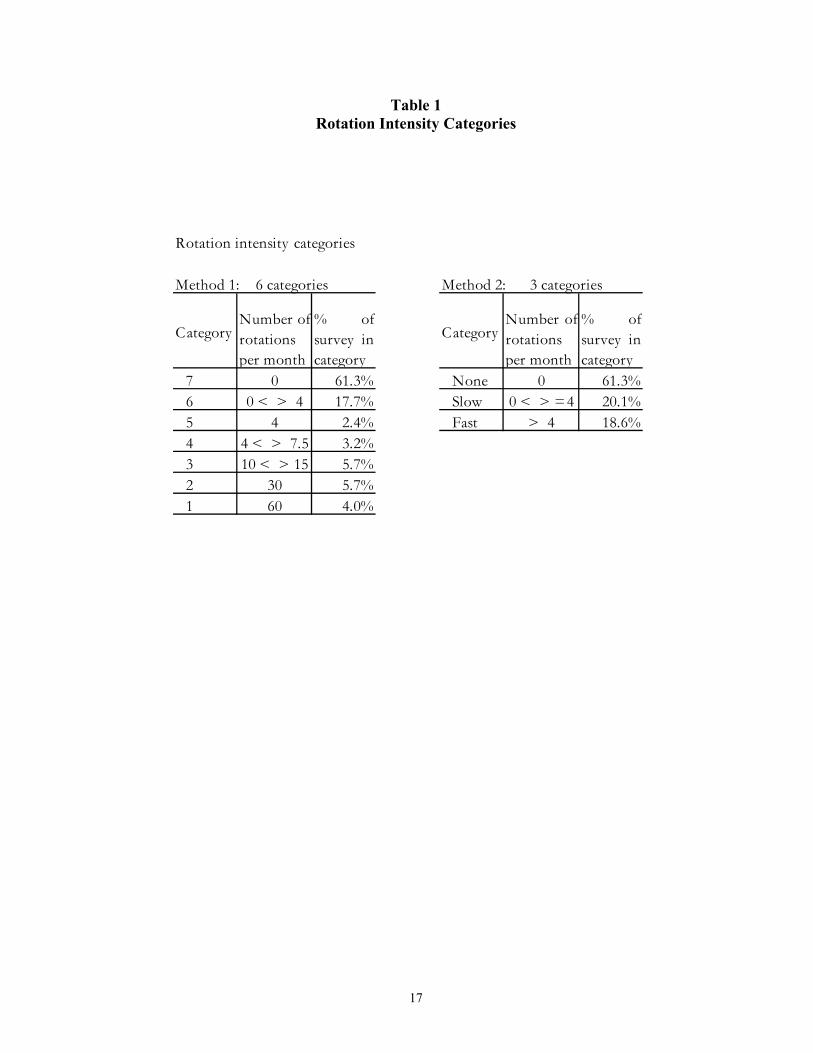
Using this definition 18% of the sampled farmers were classified as being graziers. A
further 20% graze their milking cows to some extent, see Table 1.
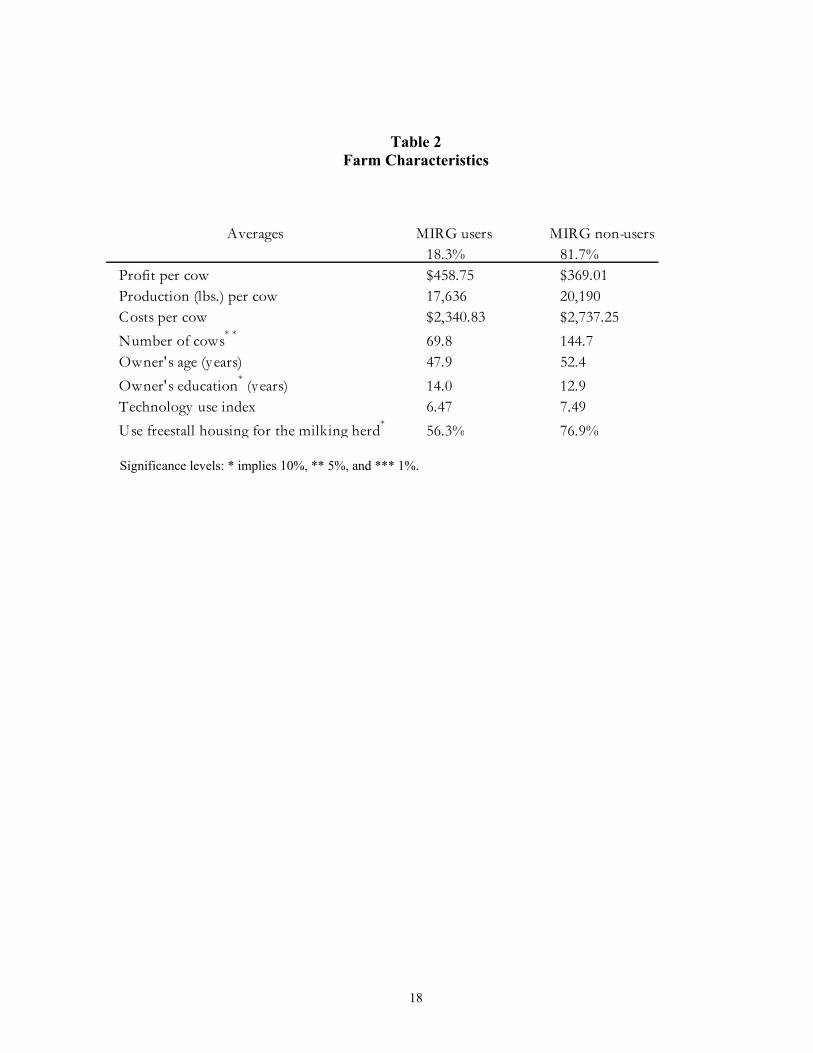
The general characteristics and technology differences between MIRG users and
non-users are shown in Table 2. Between MIRG adopters and non-adopters, it shows that
MIRG users have higher profits on lower productivity and lower costs. These differences
are not significantly different at commonly used statistical significance levels (e.g., 1%,
5%, or 10%). Only the number of cows on the farm is statistically different at a five
percent level, with MIRG users having on average half the number of cows per farm as non
grazers. MIRG users appear to be better educated, with an average level of 2 years of
college as compared to one year for non-grazers, although one needs to run the regressions
shown below in order to determine whether this is merely an artifact of MIRG users also
being younger. MIRG users also are less likely to have freestall housing, although the
4 An estimate of the sample inclusion probability using a list of all Connecticut dairy farmers and their size, productivity, and location, found no significant parameters.

8
levels of use of productivity increasing technologies are not statistically different between
MIRG users and non-grazers.
Estimations:
Following equation (2) and the literature review, the MIRG adoption equation is
hypothesized to have the following form:
(4) pr(MIRG) = B0 + B1 Owned Land + B2 Rented Land + B3 Owner Age + B4 Owner
Education + B5 # of Hires + B6 Years Farmed.
As with the adoption of other dairy technologies described in the literature (e.g. Stefanides
and Tauer; Foltz and Chang) MIRG adoption is expected to be decreasing in age and
increasing in education. The adoption equation uses the acres of owned land, rented land,
and how long the family has farmed the land as proxies for how easily a farmer could start
grazing. We expect that farms with more owned land, who have farmed the same land for
more years, would have more land near their barns and thus would be more likely to graze.
We expect the opposite effect with rental land. Since the literature reports many grazers
adopting the practice to make use of family labor, adoption probabilities are expected to be
decreasing in the number of hired workers.
The production per cow estimation is shown below as equation (5):
(5) Production/cow = C0 + C1 Farm Size (cows) + C2 Owner Age + C3 Owner Education +
C4 Technology Index + C5 pr(MIRG).
It has variables measuring farm size (the number of cows including dry cows) to control for
returns to scale, two proxies for management ability (owner’s age and years of formal
education, which are weighted by percent ownership in the case of multiple owners), and a

9
general technology measure (the number of the eleven key productivity increasing
technologies used on the farm). For the estimations in this study, milk production is
defined as average milk production per cow. A last variable, R* from equation (1),
measures the MIRG adoption probability. The literature review in the previous section
provides conflicting evidence on whether grazing will increase or decrease production per
cow. We hypothesize that production per cow will increase in farm size, management
ability proxies, and in technology use.
Typically farm costs and profits are estimated as a function of output prices,
production levels, and fixed factors (e.g., Chambers). Differences in milk prices within the
Connecticut market where a single buyer, Agrimark, purchases most of the milk will
primarily be between time periods rather than between farms. In a single year of cross-
section data farmers will face very similar input and output prices, and the primary
differences between costs and profits across farms can be described as functions of fixed
factors, technology adoption, and production choices. The profit and cost equations also
include a variable that captures the percent of farm revenues accounted for by milk sales, in
order to control for differences between farms which may have other profitable/costly
activities and a possible correlation between those activities and being a grazier.
Costs are calculated as total farm expenses per cow including all operating costs
and depreciation costs claimed on farmers’ taxes while profits are defined on a per cow
basis as 1998 total farm receipts (including milk, livestock, crop sales, and all other farm
receipts) minus total farm expenses. Note that the cost and profit measures ignore potential
changes in inventory, but an analysis of the data on herd size changes on these farms shows
no significant relationship between cow inventory changes and the 1998 cost and profit

10
data, suggesting inventory changes do not cause an omitted variable bias to our results.
The cost equation estimation is similar to the production equation with the addition of two
variables: production per cow and percent of non-milk sales. It has the following form:
(6) Cost/cow = D0 + D1Production/cow + D2 Farm Size (cows) + D3 Owner Age +
D4Owner Education + D5 Technology Index + D6 pr(MIRG) + D7Pct Non-
Milk Revenue.
Following the results reported in the literature (e.g. Stefanides and Tauer; Foltz and Chang)
costs are expected to increase in production, age, the percent of non-milk revenues and the
technology index; and decrease in education and farm size. The literature on grazing
suggests that MIRG should lower costs.
The profit equation shown below in equation (7) will have the same form and
variables as the cost equation:
(7) Profit/cow = E0 + E1Production/cow + E2 Farm Size (cows) + E3 Owner Age +
E4Owner Education + E5 Technology Index + E6 pr(MIRG) + E7Pct Non-
Milk Revenue.
Since the average size of Connecticut dairy farms has been increasing for the last decade,
we hypothesize that there are increasing returns to scale, so we expect the farm size
coefficient (B2) in the profit equation to be positive. Profits are expected to be increasing in
management ability and in use of more production increasing technology. The literature
provides little guidance on the hypothesized sign for the coefficients on both the percent
non-milk revenue and on MIRG.
In addition, because potentially the degree of adoption of MIRG influences farm
outcomes, the number of monthly rotations is included in the analysis. Preliminary

11
estimations suggested that the degree of adoption did not significantly influence
productivity or cost so only a profit model is presented.5 A profitability of rotation model is
estimated with the following form:
(8) Profit/cow = F0 + F1 Production/cow + F2 Farm Size (cows) + F3Owner Age +
F4Owner Education + F5 Technology Index + F6 Monthly Rotation +
F7(Monthly Rotation)2 + F8 Pct Non-Milk Revenue.
Following the results of Hanson et. al. (1998), we expect a quadratic relationship between
profits and rotation intensity (the most profitable will be either no rotations or high
rotations).
Results:
The adoption equation shown in Table 3 demonstrates a number of the hypothesized
effects. Farmers with more rented land were less likely to adopt MIRG, probably because
of the implied distance from barn to the land. Also farmers with higher education levels
were significantly more likely to graze their animals suggesting that education levels were
quite important in the management part of rotational grazing.
The production equation, shown in Table 4, has an R2 of 0.32. Since the coefficient
on farm size is not significant, we find no indications of returns to scale in the dairy
industry. The technology index has a positive parameter that is significantly different than
zero, which may be masking some of the scale effects since larger farms are more likely to
adopt new technologies. Surprisingly, given the big, though statistically insignificant
differences in average productivity, being a MIRG user has no significant influence on
5 Results of the productivity and cost estimations using monthly rotation and monthly rotation squared are available from the authors.

12
productivity. The results suggest very little penalty for being a MIRG user in terms of
productivity, when one has controlled for other factors.
Table 5 shows the cost per cow estimates, which produces an R2 of 0.32 and
significant and positive coefficients on production and percent of non-milk revenues. The
coefficient on engaging in MIRG is insignificant, though surprisingly positive. One must
conclude, as found by Winsten et al., that in the northeast there is not a significant lowering
of cost per cow by using MIRG, when one controls for other factors.
Given the insignificant effects of MIRG on both costs and milk per cow
productivity, one would expect the same result for profits. Table 6 shows the profit function
estimates, which estimate with an R2 of 0.18. They show that more profitable farms are
those with more non-milk revenues and have younger owners. They also show that greater
technology use, despite the increases in productivity it yields, produces significantly lower
profits. The results on MIRG show no significant effects of being a grazer on overall farm
profits.
In order to better specify the effects of grazing on profits, Table 7 reports the
relationship between profits and the intensity of rotation as measured by the number of
times per month the cows change pastures. Though they are not significant, the results look
similar to those using the predict probability, pr(MIRG), with lower profits for MIRG users.
There is a suggestion from the quadratic term in these results that farms engaging in grazing
but rotating their pasture slowly, have lower profits than either those who do not use
rotational grazing at all or those who rotate their cows faster between pastures. These
results differ from Hanson et.al. (1998) in that while management intensive rotational
grazing is not found to significantly influence milk production, the quadratic form of the

13
influence of increased grazing rotation on total farm profits is significant. This result has
important policy implications for extension agents working with potential grazers. The
results suggest that profitability from grazing can be found for those who have a rapid
rotation of their cows, but that farmers who dabble in grazing may not be improving their
bottom line.
Conclusion:
This work has estimated econometric models to show the adoption probabilities and
effects on costs, productivity, and profits of Connecticut dairy farms using management
intensive rotational grazing. MIRG adopters are shown to have more education and less
rented agricultural land (a proxy for lack of access to land within a short distance of the
barn). MIRG adoption had no significant effects on costs, productivity, or profits. Evidence
was found, however, to suggest that full adopters of the technology had more profitable
farms than partial adopters. This finding supports the Hanson et al. (1998) conclusion that
farms that employ more intensive rotational grazing practices can have higher returns than
forms that use extensive grazing. Equally importantly, non-grazing technology adoption
raised costs and production while lowering profits significantly for all types of farms.
Given the difficulty in finding land that is easily accessible to barns in Connecticut,
there would seem to be little room for expansion of rotational grazing. The significant
negative relationship between rented land as a component of total farmland, a proxy for ease
of cow movement, on MIRG adoption suggests such a limit to grazing expansion.
14
The results do suggest that MIRG technology may be a viable option for some
Connecticut dairy farmers, and that it is most profitable with full adoption.. This suggests
that extension efforts on grazing might be best directed toward increasing the profitability of
those who are currently grazing their animals. With the small average size of grazing farms
in Connecticut, an extension effort on increasing MIRG profitability may be one of the
better methods to reach the smallest dairy farms and help keep them in business.

15
References:
Bower-Spence, K. 1995. “Where are the Savings in Grazing? This Grazier's Before-and-
After Records Pinpoint Lower Costs for Feed, Equipment and Labor.” Pennsylvania Farmer. June. p. 8-9.
Chambers, Robert. 1988. Applied Production Analysis. Cambridge: Cambridge University
Press. Chang, H. 2000. “The Empirical Impact of Adopting Recombinant Bovine Somatotropin
(rbST) on Connecticut Dairy Farms.” MS Thesis. Department of Agricultural and Resource Economics. College of Agriculture and Natural Resources. University of Connecticut.
Elbehri, A. and S.A. Ford. 1995. “Economic Analysis of Major Forage Systems in
Pennsylvania: The Role of Intensive Grazing.” Journal of Production Agriculture. 8(4): 449-507.
Emmick, D.L. and L.F. Toomer. 1991. “The Economic Impact of Intensive Grazing
Management on 15 Dairy Farms in New York.” American Forage and Grassland Conference. American Forage and Grassland Council. p. 19-30.
Fales, S.L., L. Muller, S. Ford, M. O’Sullivan, R. Hoover, L. Holden, L. Lanyon, and D.
Buckmaster. 1995. “Stocking rate affects production and profitability in a rotationally grazed pasture system.” Journal of Production Agriculture. 8(1): 88-96.
Foltz, Jeremy D. and Hsui-Hui Chang. 2002. “The Adoption of rBST on Connecticut Dairy
Farms.” American Journal of Agricultural Economics. 84(4): 1021-1032. Ford, S. 1996. “Grazing looks better as dairy profits tighten.” Cooperative Extension.
College of Agricultural Sciences. Pennsylvania State University. Farm Economics. July/August.
Ford, S. and G. Hanson. 1994. “Intensive Rotational Grazing for Pennsylvania Dairy
Farms.” Cooperative Extension. College of Agricultural Sciences. Pennsylvania State University. Farm Economics. July/August.
Frank, G. and J. Vanderlin. 2000. “Milk Production Costs in 1999 on Selected Wisconsin
Dairy Farms.” Working paper. University of Wisconsin-Madison Center for Dairy Profitability. University of Wisconsin-Madison/Extension.
Frank, G., R. Klemme, B. RajBhandary, and L. Tranel. 1996. “Economics of alternative
dairy grazing scenarios.” 21st Annual Forage Conference. p. 69-87.

16
Frank, G., R. Klemme, B. RajBhandary, and L. Tranel. 1995. “Economics of alternative
dairy grazing scenarios.” Working papers 28(3). Department of Agricultural Economics. College of Agricultural and Life Sciences. University of Wisconsin- Madison.
Greene, W.H. 1997. Econometric Analysis. Prentice Hall: New Jersey. Hanson, G.D., L.C. Cunningham, S.A. Ford, and L.D. Muller. 1998a. “Increasing Intensity
of Pasture Use with Dairy Cattle: An Economic Analysis.” Journal of Production Agriculture. 11(2): 145-179.
Hanson, G.D., L. Cunningham, M. Morehart, and R.L. Parsons. 1998b. “Profitability of
Moderate Intensive Grazing of Dairy Cows in the Northeast.” Journal of Dairy Science. 81: 821-829.
Jackson-Smith, D., B. Barham, M. Nevius, and R. Klemme. 1996. Grazing in Dairyland:
The Use and Performance of Management Intensive and Rotational Grazing Among Wisconsin Dairy Farms, Technical Report #5. Agricultural Technology Institute and Family Farm Institute. University of Wisconsin-Madison.
Kaiser, H.M. and M.J. Morehart. 1994. “A Regional Comparison of Farm Costs and Returns
Among Top Dairy Producers.” Staff paper P94-11. Department of Agricultural and Applied Economics. College of Agriculture. University of Minnesota
Pillsbury, B.P. and P.J. Burns.1989. Economics of Adopting Voisin Grazing Management
on a Vermont Dairy Farm. United States Department of Agriculture, Soil Conservation Service, Winooski, VT.
Stefanides, Z and L.W. Tauer. 1999. “The Empirical Impact of Bovine Somatotropin on a
Group of New York Dairy Farms.” American Journal of Agricultural Economics. 81: 95-102.
Vallentine, J.F. 1990. Grazing Management. Salt Lake City UT: Brigham Young University
Press. Winsten, J.R., R.L.Parsons and G.D. Hanson. 2000. “A Profitability Analysis of Dairy
Feeding Systems in the Northeast.” Agricultural and Resource Economics Review. 29(2): 220-228.
17
Table 1 Rotation Intensity Categories
Rotation intensity categories
Method 1: 6 categories Method 2: 3 categories
CategoryNumber ofrotations per month
% ofsurvey incategory
CategoryNumber ofrotations per month
% ofsurvey incategory
7 0 61.3% None 0 61.3%6 0 < > 4 17.7% Slow 0 < > =4 20.1%5 4 2.4% Fast > 4 18.6%4 4 < > 7.5 3.2%3 10 < > 15 5.7%2 30 5.7%1 60 4.0%
18
Table 2 Farm Characteristics
Significance levels: * implies 10%, ** 5%, and *** 1%.
Averages MIRG users MIRG non-users18.3% 81.7%
Profit per cow $458.75 $369.01Production (lbs.) per cow 17,636 20,190Costs per cow $2,340.83 $2,737.25Number of cows* * 69.8 144.7Owner's age (years) 47.9 52.4Owner's education* (years) 14.0 12.9Technology use index 6.47 7.49Use freestall housing for the milking herd* 56.3% 76.9%

19
Table 3 Adoption Probability Probit Model log likelihood = -44.443077 Observations = 121 Pr(MIRG) Variable Coefficient standard error Owned land -0.000843 0.0013721 Rented land** -0.0030913 0.0015337 Age -0.0116459 0.0152558 Education** 0.2033975 0.0842516 Number of hires -0.0131597 0.0785434 Years farmed 0.0018728 0.0021344 Constant** -2.819935 1.414532 Significance levels: * implies 10%, ** 5%, and *** 1%. Percent predicted correctly: 85% Table 4 Production Equation R2 = 0.32 Observations = 101 Production/cow (1,000 lbs.): Variable Coefficient standard error Farm Size (cows) 0.0058659 0.0055775 Age 0.0437567 0.0347566 Education 0.1427541 0.1603475 Technology Index*** 0.6237582 0.1576792 Pr(MIRG) 0.8214412 3.168248 Constant*** 9.995329 2.854259 Significance levels: * implies 10%, ** 5%, and *** 1%.

20
Table 5 Cost Equation R2 = 0.32 Observations = 81 Cost/cow ($): Variable Coefficient standard error Production per cow*** 90.20284 31.35843 Farm Size (cows) -0.6813033 1.554239 Age 2.032988 9.406923 Education -10.98245 52.08137 Technology Index 68.03312 49.76473 Pr(MIRG) 619.965 917.7132 % Non-milk revenue* 3110.095 1880.595 Constant 38.23531 522.9367 Significance levels: * implies 10%, ** 5%, and *** 1%. Table 6 Profit Equation R2 = 0.18 Observations = 81 Profit/cow ($): Variable Coefficient standard error Production per cow 13.72707 15.02282 Farm Size (cows) 0.1960464 0.415381 Age** -7.790699 3.759303 Education 14.12211 21.97333 Technology Index** -66.32693 25.5455 Pr(MIRG) 71.87377 504.004 % Non-milk revenue** 585.4505 254.1119 Constant** 756.917 327.7958 Significance levels: * implies 10%, ** 5%, and *** 1%.

21
Table 7 Profit Equation R2 = 0.20 Observations = 81 Profit/cow ($): Variable Coefficient standard error Production per cow 11.92145 15.26732 Farm Size (cows) 0.051359 0.04004051 Age -6.611251 3.933221 Education 19.48925 18.1842 Technology Index*** -71.23166 24.96188 Monthly Rotation -13.89002 8.499295 (Monthly Rotation)2 ** 0.3122173 .1507565 % Non-milk revenue** 606.8594 269.5364 Constant** 735.262 379.4357 Significance levels: * implies 10%, ** 5%, and *** 1%.