the adequacy of speculation in agricultural futures ... · i the adequacy of speculation in...
TRANSCRIPT
The Adequacy of Speculation in Agricultural FuturesMarkets: Too Much of a Good Thing?
by
Dwight R. Sanders, Scott H. Irwin, and Robert P. Merrin
Suggested citation format:
Sanders, D.R., S.H. Irwin, and R.P. Merrin. “The Adequacy of Speculation in Agricultural Futures Markets: Too Much of a Good Thing?" Marketing and Outlook Research Report 2008-02, Department of Agricultural and Consumer Economics, University of Illinois at Urbana-Champaign, June 2008. [http://www.farmdoc.uiuc.edu/marketing/reports]

The Adequacy of Speculation in Agricultural Futures Markets: Too Much of a Good Thing?
by
Dwight R. Sanders, Scott H. Irwin, and Robert P. Merrin*
June 2008
Marketing and Outlook Research Report 2008-02
* Dwight R. Sanders is an Associate Professor of Agribusiness Economics at Southern Illinois University, Carbondale, Illinois. Scott H. Irwin is the Laurence J. Norton Chair of Agricultural and Consumer Economics at the University of Illinois, Urbana, Illinois. Robert P. Merrin is a Ph.D. student in the Department of Finance at Universiteit Maastricht, Netherlands. A version of this report was presented at the 2008 NCCC-134 Conference on Applied Commodity Price Analysis, Forecasting, and Market Risk Management. The authors appreciate the comments and suggestions provided by the Conference participants.
i
The Adequacy of Speculation in Agricultural Futures Markets:
Too Much of a Good Thing?
Abstract The objective of this report is to re-visit the “adequacy of speculation” debate in agricultural futures markets. The Commodity Futures Trading Commission makes available the positions held by index funds and other large traders in their Commitment of Traders reports. The results suggest that after an initial surge from early 2004 through mid-2005, index fund positions have stabilized as a percent of total open interest. Traditional speculative measures do not show any material changes or shifts over the sample period. In most markets, the increase in long speculative positions was equaled or surpassed by an increase in short hedging. So, even after adjusting speculative indices for index fund positions, values are within the historical ranges reported in prior research. One implication is that long-only index funds may be beneficial in markets traditionally dominated by short hedging. Attempts to curb speculation through regulatory means should be weighed carefully against the potential benefits provided by this class of speculators. Key Words: Commitment’s of Traders, index funds, commodity futures markets
ii
The Adequacy of Speculation in Agricultural Futures Markets:
Too Much of a Good Thing?
Table of Contents
Introduction..................................................................................................................................... 1 Data ................................................................................................................................................. 2
Traditional COT Report............................................................................................................... 2 Commodity Index Traders (CIT) Report..................................................................................... 4 Bank Participation (BP) Report................................................................................................... 4
Summary Statistics and Trends....................................................................................................... 5 Changes in Market Activity......................................................................................................... 5 Index Trader Activity Based on CIT Data................................................................................... 6 Traders and Position Size Based on CIT Data ............................................................................ 7 Index Trader Activity Based on Bank Participation (BP) Data................................................... 8
Speculative Index.......................................................................................................................... 10 Policy Implications ....................................................................................................................... 14 Summary and Conclusions ........................................................................................................... 17 References..................................................................................................................................... 19 Tables and Figures……………………………………………………………………………….23
The Adequacy of Speculation in Agricultural Futures Markets: Too Much of a Good Thing?
Introduction In a series of classic papers, Working (1953, 1954, 1960, and 1962) argued that agricultural futures markets are primarily hedging markets and that speculation tends to follow hedging volume. However, the nature and structure of futures markets has changed dramatically since the pioneering research of Working. The days of the dentist-speculator from Dubuque dabbling in the soybean futures market are long gone. Fueled by academic evidence showing that commodity futures portfolios can generate returns comparable to equities (e.g., Gorton and Rouwenhorst, 2006), the investment industry has developed products that allow individuals and institutions to “invest” in commodities through over-the-counter swaps and structured notes that are linked to popular commodity indices, such as the Goldman Sachs Commodity Index (Acworth, 2005). Domanski and Heath (2007) term this the “financialisation” of commodity markets.
The rapid rise of this new class of speculators has led many to argue that today’s speculative trade in agricultural futures markets is the proverbial tail wagging the dog. In other words, speculation is viewed as driving the increase in overall market participation, a reversal of the traditional view that speculation follows hedging volume. Some also claim that these new speculators, especially long-only commodity index funds, create “price distortions” and potentially disrupt traditional cash-futures convergence patterns (Morrison, 2006; Henriques, 2008). Several previous studies have investigated the role of speculation in agricultural futures markets. The conventional method of monitoring speculative positions in futures markets is through the Commodity Futures Trading Commission’s (CFTC) Commitments of Traders (COT) reports. Based on this data, Working (1960) developed a speculative index to measure the adequacy of speculative positions to “balance” the hedging positions held by commercial traders. The index reflects Working’s view that the level of speculation is meaningful only when it is considered relative to the level of hedging in the market. Working (1960), Nathan Associates (1967), Labys and Granger (1970), Peck (1980, 1981), and Leuthold (1983) use the speculative index to examine whether speculative activity in grain and livestock futures markets is adequate. Generally, these academic studies concluded that speculation in agricultural futures markets is not excessive. For example, Peck (1980) found that “…wheat, corn, and soybean markets are characterized by very low relative levels of speculation” (p. 1040) and Leuthold (1983) found no “…evidence to indicate that the levels of speculation in livestock have led to increased price variability as often alleged in the popular press” (p. 133). It is interesting to note that a common concern expressed in these studies was the inadequacy of speculation on agricultural futures markets relative to hedging pressure.
Given the allegations about the size and impact of speculators in agricultural futures markets
that have once again arisen within industry (Sjerven, 2008), government (CHSGA, 2008), and the academy (AFPC, 2008), additional research efforts are needed to better understand the role and potential impact of speculators in general and long-only index funds in particular. The objective of this report is to re-visit the “adequacy of speculation” debate in agricultural futures markets, bringing new data to the task. Specifically, COT data—including positions held by long-only index

2
funds as reported in the Commodity Index Trader (CIT) report—will be closely examined to better characterize the nature of speculation in grain and livestock futures markets. A separate CFTC report—Banker Participation in Futures Markets— will also be used to provide a unique look at the increase in long-only index activity. The first section of the report will provide an overview of the relative trading activity of commercial, non-commercial, and non-reporting traders. Particular attention will be given to recent trends indicative of a shift in speculative activity, perhaps associated with the growth in long-only commodity funds. The second section will use Working’s speculative index to examine the adequacy of speculation relative to hedging demands in agricultural futures markets. Trends in index values since the mid-1990s will be examined to determine whether speculation has actually risen relative to hedging demands. To provide further historical perspective, index levels also will be compared to levels reported in previous studies of agricultural futures markets, some extending back as far as the late 1940s. The final section of the report explores the policy implications of the analysis. Throughout the report, the focus is on summarizing the data and highlighting recent trends to provide a more objective assessment of speculative activity. Data
Traditional COT Report
The traditional COT report provides a breakdown of each Tuesday’s open interest for markets in which 20 or more traders hold positions equal to or above the reporting levels established by the CFTC.1 Two versions of the report are released. The Futures-Only Commitments of Traders report includes futures market open interest only. The Futures-and-Options-Combined Commitments of Traders report aggregates futures market open interest and “delta-weighted” options market open interest. Open interest for a given market is aggregated across all contract expiration months in both versions of the report. The weekly reports are released every Friday at 3:30 p.m. Eastern Standard Time.
Reports also are available in both a short and long format. The short report shows open interest separately by reportable and non-reportable positions. For reportable positions, additional data are provided for commercial and non-commercial holdings, spreading, changes from the previous report, percentage of open interest by category, and number of traders. The long report, in addition to the information in the short report, also groups the data by crop year, where appropriate, and shows the concentration of positions held by the largest four and eight traders. Using the information in the short report, non-commercial open interest is divided into long, short, and spreading; whereas, commercial and non-reporting open interest is simply divided into long or short. The following relation explains how the market’s total open interest (TOI) is disaggregated:
(1) )(2][][)](2[ReportingNonReporting
TOINRSNRLCSCLNCSPNCSNCL =++++++−
1 See Hieronymus (1971), McDonald and Freund (1983), and Fenton and Martinaitas (2005) for extensive discussions of the history and evolution of the COT Report. CFTC (2008) contains a detailed explanation of current COT reports.
3
where, NCL, NCS, and NCSP are non-commercial long, short, and spreading positions, respectively. CL (CS) represents commercial long (short) positions, and NRL (NRS) are long (short) positions held by non-reporting traders. Reporting and non-reporting positions must sum to the market’s total open interest (TOI), and the number of longs must equal the number of short positions. A frequent complaint about the traditional COT data is that the trader designations may be somewhat inaccurate (e.g., Peck, 1982; Ederington and Lee, 2002). For speculators, there may be an incentive to self-classify their activity as commercial hedging to circumvent speculative position limits. In contrast, there is little incentive for traders to desire the non-commercial designation. So, it is often thought that the non-commercial category is a relatively pure subset of reporting speculators (Sanders, Boris, and Manfredo, 2004). The available evidence about the composition of non-reporting traders is dated (Working, 1960; Larson, 1961; Rutledge, 1977-78; Peck, 1982), so little is known about this group other than their position size is less than reporting levels. While there may be some incentive for reporting traders to desire the commercial designation, the CFTC implements a fairly rigorous process—including statements of cash positions in the underlying commodity—to ensure that commercial traders have an underlying risk associated with their futures positions. However, in recent years industry participants began to suspect that these data were “contaminated” because the underlying risk for many reporting commercials were not positions in the actual physical commodity (CFTC, 2006a,b). Rather, the reporting commercials were banks and other swap dealers hedging risk associated with over-the-counter (OTC) derivative positions. For example, a commercial bank may take the opposite side of a long commodity swap position desired by a customer.2 The commercial bank, not wanting the market risk, will then buy commodity futures contracts to mitigate their market exposure associated with the swap position. Technically, the bank’s position is a bona fide hedge against an underlying risk in the swap market. Yet, the bank clearly is not a commercial hedger in the traditional sense. Indeed, the third party or bank customer who initiated the position may be hedging or speculating; their motives are not necessarily known even to the swap dealer. However, the OTC swap positions that can be easily identified are those “…seeking exposure to a broad index of commodity prices as an asset class in an unleveraged and passively-managed manner” (CFTC, 2008a). In this instance, the bank customer is essentially long a commodity index such as the Goldman Sachs Commodity Index (GSCI) via a swap with the bank. The bank then mitigates their long GSCI exposure by hedging each commodity component (e.g., crude oil, corn, and live cattle) in the respective individual
2 According to Hull (2000, p. 121), “A swap is an agreement between two companies to exchange cash flows in the future. The agreement defines the dates when the cash flows are to be paid and way that they are to be calculated. Usually the calculation of the cash flows involves the future values of one or more market variables.” A cash forward contract is a simple example of a swap in commodities markets. Suppose a farmer enters into a forward contract with a grain merchant today to deliver 10,000 bushels of soybeans on October 1, 2008 at $12 per bushel. Since the grain merchant can sell the grain as soon as it is delivered by the farmer, the forward contract is equivalent to a “swap” agreement where the grain merchant will pay a cash flow of $120,000 on October 1, 2008, and in return, will receive a cash flow of 10,000 x S, where S is the spot price of soybeans on October 1, 2008. Hull notes that swap agreements typically have cash flows on more than one date, whereas the forward contract “swap” has cash flows on a single date.
4
futures markets. Because the banks and swap dealers can easily identify swaps associated with commodity indices, it allows the CFTC to further segregate the reporting trader categories to include “index traders.”
Commodity Index Traders (CIT) Report Starting in 2007—in response to complaints by traditional traders about the rapid increase in long-only index money flowing into the markets—the CFTC released supplemental reports which break out the positions of index traders for 12 agricultural markets. According to the CFTC, the index trader positions reflect both pension funds that would have previously been classified as non-commercials as well as swap dealers who would have previously been classified as commercials hedging OTC transactions involving commodity indices. The CFTC readily admits that this classification procedure has flaws and that “…some traders assigned to the Index Traders category are engaged in other futures activity that could not be disaggregated….Likewise, the Index Traders category will not include some traders who are engaged in index trading, but for whom it does not represent a substantial part of their overall trading activity” (CFTC, 2008a). Regardless, the data are an improvement over the more heavily aggregated traditional COT classifications, and they should provide some new insights as to trader activity.
The CIT data are released in conjunction with the traditional COT report showing combined futures and options positions. The index trader positions are simply removed from their prior categories and presented as a new category of reporting traders. The CIT data include the long and short positions held by commercials (less index traders), non-commercials (less index traders), index traders, and non-reporting traders.
Bank Participation (BP) Report Well before there were concerns about long-only index funds, the U.S. Federal Reserve Board desired to monitor the participation of commercial banks in futures markets (Huhman, 2006). In response, the CFTC compiled the Bank Participation in Futures Markets report (BP). The BP report contains the positions held by commercial banks in futures markets where there are at least five banks with open positions. A Bank Participation in Options Markets report is also compiled, but it does not adjust positions to a delta-equivalent basis, reducing its usefulness. The BP reports are released monthly on a reporting date that is aligned with the COT reports. However, the BP reports are independent and they are not technically part of the COT reports. The BP report started to sporadically show positions in the grain markets by mid-2003, indicating that at least five commercial banks were participating in the grain futures markets during some months in that year. By late 2004, there are consistent data available for the primary grain markets representing on-going participation by at least five commercial banks each month. Consistent participation by commercial banks in the livestock futures markets began in mid-to-late-2005.

5
Importantly, positions shown in the BP report are a pure subset of the traditional COT commercial category. Moreover, it is generally thought that the commercial bank positions are mostly hedges against OTC swaps on commodity indices (Huhman, 2006). In which case, there should be a strong correspondence between BP data and the CIT data. Because the BP data actually have a longer available history than the CIT data, the BP data will be used to supplement the analysis of index trader positions for certain markets. Summary Statistics and Trends In this section summary statistics and trends are presented for various measures of market participation and activity. Data for the traditional COT trader positions are available for each week from March 21, 1995 through April 15, 2008 (683 observations). CIT data are only available for the period covering January 3, 2006 through April 15, 2008 (120 observations). Both reports reflect combined futures and options positions, where options are adjusted to the delta-equivalent futures position. The reports show traders’ holdings as of Tuesday’s market close. Wherever possible, the entire data set from 1995 forward is used. However, in some instances, the focus is on the period for which the CIT data are available—January 2006 through April 2008. Monthly BP data are collected for January 2006 through April 2008. Markets included in the analysis are as follows: corn, soybeans, soybean oil, CBOT wheat, KCBOT wheat, cotton, live cattle, feeder cattle, and lean hogs.3
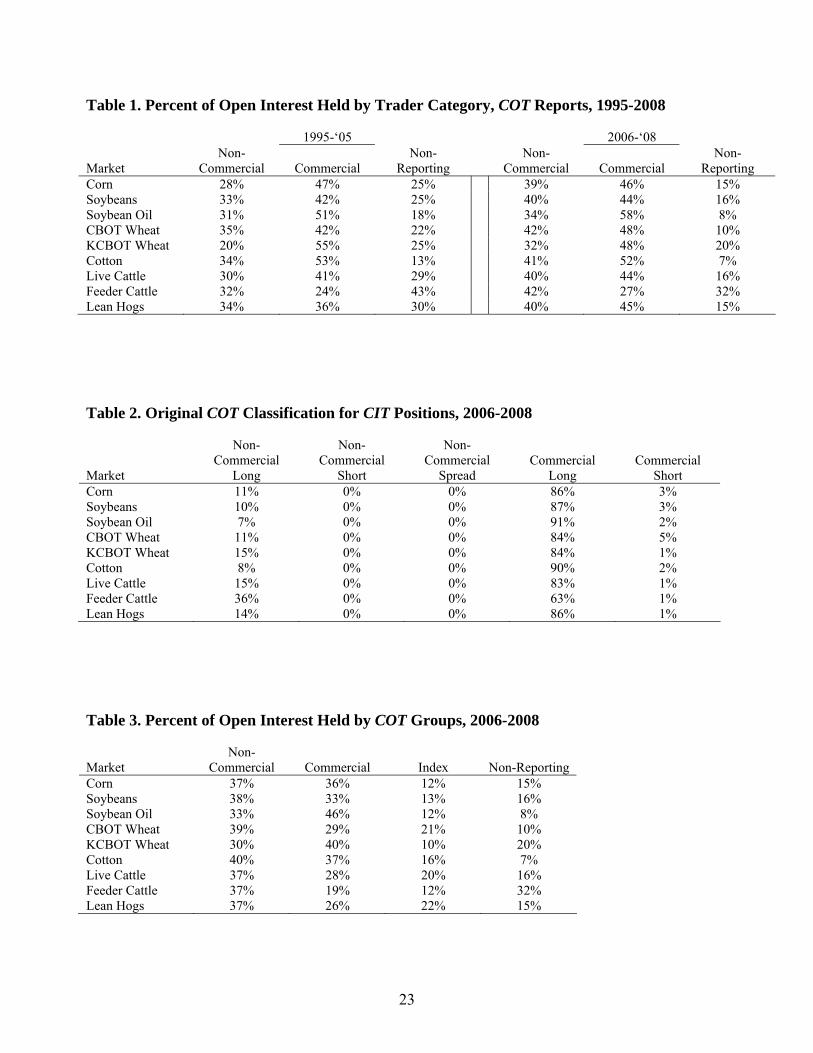
Changes in Market Activity Agricultural futures markets experienced rapid growth starting in late 2004. The open interest for many agricultural futures markets doubled or even tripled from late 2004 through 2006. For example, Figure 1 shows that open interest for CBOT wheat futures increased 275% from June 2004 to June 2006. As illustrated in Figure 2, other markets, such as soybeans, have continued to see rapid growth in open interest into 2008. The increase in open interest may be attributed to electronic trading and easier market access, an inflationary environment for many commodity markets, and, potentially, an increase in the use of commodity futures as an investment tool and inflation hedge. Using the data from the traditional COT report, the positions of the trader groups—as measured by their percent of total open interest—are examined for the 1995-2005 and 2006-2008 periods. As shown in Table 1, uniformly across all markets, the relative size of non-reporting traders has declined. For example, non-reporting traders in CBOT wheat comprised, on average, 22% of the open interest from 1995-2005, but only 10% of the open interest from 2006-2008. On the flipside, non-commercials increased their share of open interest in every market, and the commercials’ share of the open interest increased in all but three markets (KCBOT wheat, soybeans, and cotton). The specific trends by COT category for CBOT wheat are shown in Figure 3. Clearly, the agricultural futures markets have changed since 2004. First, the total level of open interest has increased markedly. Second, the relative role of smaller (non-reporting) traders
3 CBOT denotes Chicago Board of Trade (now CME Group, Inc.), KCBOT denotes Kansas City Board of Trade, and MGEX denotes Minneapolis Grain Exchange.
6
has diminished, while there has been a relative increase in market positions held by reporting traders—especially in the commercial category. In the next section, we use the CIT data to gain further insights into the market composition.
Index Trader Activity Based on CIT Data The sample period from January 2006 through April 2008 is available for analyzing the CIT data. The CIT data are first compared to the original COT classifications to determine from which traditional COT category the index positions are extracted. The results are shown in Table 2. As expected, index trader positions are primarily aggregated within the commercial long positions. Across markets, roughly 85% of the index trader positions were previously contained in the long commercial category of the traditional COT reports. The other 15% is primarily from the long non-commercial category. This suggests that the majority of long-only commodity index positions are initially established in the OTC markets, then the underlying position is transmitted to the futures market by the swap dealers (including both commercial and investment banks) hedging OTC exposure. One of the primary concerns expressed by the industry is the magnitude of the commodity index activity. In a recent Barron’s article, one analyst quipped that “index funds account for 40% of all bullish bets on commodities…the index funds hold about $211 billion worth of bets on the buy side of U.S. markets” (Epstein, 2008). Presumably, the sheer size of the index fund positions may allow them to distort prices or price relationships across markets. A detailed view of position size as a percent of total open interest is provided in Table 3. Over the sample period, index traders do make up a surprisingly large portion of certain markets. In particular, index traders are over 20% of the open interest in live cattle, lean hogs and CBOT wheat. In all other markets, index trader positions tend to be between 10% and 15%. While this is not an insignificant share of the open interest, in no market is the index share larger than either the non-commercial or commercial categories. Rather, the index share of open interest tends to be closer to that of the non-reporting traders. Importantly, the data show that the percent of total open interest attributable to index traders has been relatively stable over the sample period. This is demonstrated for CBOT wheat in Figure 4, where the index traders’ share of the market has fluctuated in a fairly narrow range between 17% and 26%. As shown in Figure 5, the same is true for both corn and soybeans, where the index funds percent of open interest has not exceeded 15% since 2006. Similarly, Figure 6 indicates that index fund positions as a percent of total open interest in livestock futures markets have been relatively stable over the sample period. The exception seems to be live cattle which trended higher in mid-2007 and then stabilized around 23%. An additional criticism of index funds is their disproportionate presence on the long side of the market, stemming from the fact they are “long-only.” To examine this idea more closely, we first examine the percent net long position held by each trader category in the CIT data. The percent net long position is simply defined by trader category as the net position (long positions minus the short positions) divided by the total positions held (Sanders, Manfredo, and Boris, 2004). For
7
example, a long position of 1,000 and a short position of 2,000 would yield a percent net long of -33% ((1,000-2000)/3000), indicating that the net position held by that trader category is 33% short. The percent net long for each trader group is calculated over the sample period and presented in Table 4. As expected, index traders are 90% to 98% net long in each market. Likewise, the commercial category is 20% to 65% net short reflecting the traditional short hedging of producers, first handlers, and warehouses. Interestingly, for two of the markets with high levels of index participation—CBOT wheat and lean hogs—index funds are the only category that held a net long position over the sample period. To more closely examine each side of the market, the relative size of the long and short side of the markets is presented in Table 5 for each trader category. Since index funds are almost exclusively long, their percent of the market roughly doubles when only considering the long side of the market as opposed to total positions (long + short positions). For example, index funds are 21% of the total positions in CBOT wheat, but they are 40% of the long positions in CBOT wheat. Across markets, index funds range from 20% (KCBOT wheat) to 44% (lean hogs) of the long positions in the market. In both CBOT wheat and lean hogs, index funds held a larger portion of long positions than any other trader group. With the exception of feeder cattle, the short-side of the market is mostly dominated by commercial hedgers. The CIT data clearly show that index funds are a large portion of the open interest in some agricultural commodity markets. In lean hogs and CBOT wheat, the index funds tend to be the largest category on the long-side of the market. While this attests to the sheer size of their market participation, it alone does not necessarily imply that the positions are excessive or detrimental to the market.
Traders and Position Size Based on CIT Data The CIT data (as well as the COT data) include information on the number of reporting traders in each category. From this, we can determine the number of reporting index traders in each market as well as the average trader’s position size relative to the other trader categories. Table 6 shows the average number of reporting traders over the sample period from January, 2006 to April, 2008. The total number of reporting traders for the market is shown as well as the number in each trader category. A reporting trader can appear in more than one category; therefore, the sum of each category need not equal the total reporting traders in that market.
From the data in Table 6, it is immediately apparent that there are relatively few reporting index traders. The corn, CBOT wheat, and soybean futures markets have 24 long index traders with reportable positions, while the KCBOT wheat futures market has 15 reporting long index traders. There are a few index traders with short positions, but these most likely reflect some of the positions held by long index traders that the CFTC could not disaggregate. Across most of the markets, there does not seem to be any glaring disparities between the number of reporting commercial and non-commercial traders.
8
Table 7 shows the average reporting trader’s position size by category over the sample period. The average position size is simply calculated as the positions held by that category divided by the number of reporting traders in that category. Because a trader may appear in more than one category, the calculated average position size is likely lower than the actual. Not surprisingly, given the fairly large percent of open positions held by index traders (Table 3) and the relatively few number of reporting index traders (Table 6), the average index trader’s position size is large. For example, in the corn futures market, the average long index trader has a position of 16,805 contracts which is more than 10 times the size of the average long position held by either commercials or non-commercials. This finding is consistent: long index traders have the largest average position size. For comparison, Table 7 also shows the reporting levels and speculative limits for each market. Clearly, the average position size of all reporting trader categories is larger than the required reporting level. However, the average position size held by non-commercials generally falls far short of the speculative limits. This suggests that among non-commercial reporting traders there is likely a wide variation in position sizes, where some non-commercial positions must approach the speculative limits. Commercial traders who are bona fide hedgers are not subject to the positions limits. Yet, in no market does the average position size held within the commercial category exceed the speculative limit. However, the index traders—who are largely categorized as commercial hedgers in the original COT data—come much closer to the speculative limits on average. In fact, the average long index trader in CBOT wheat holds 2,097 contracts in excess of the speculative limit of 6,500. While this is legal, it does provide some indirect evidence that speculators or investors are able to use OTC instruments and commercial hedge exemptions to surpass speculative position limits.
Based on the information in Tables 6 and 7, it is clear that index traders number relatively few; but, they hold very large long positions. The average position size for an index trader can be more than 10 times the size of the average position held by other trader groups. Since index funds are long-only and not known for rapid-fire trading, it is not clear that this presents a problem. Although, it does support the notion that when the index funds “roll” positions to a new contract month it is a much anticipated event (e.g., the “Goldman roll”) and associated with considerable trading volume.
Index Trader Activity Based on Bank Participation (BP) Data
In a monthly report separate from the COT and CIT reports, the CFTC reveals the participation of commercial banks in the commodity futures markets. There must be at least five commercial banks participating in the market on the “as of” date for that market to be included in the Bank Participation in Futures Markets (BP) report. Most agricultural futures markets begin to show up sporadically in the monthly BP reports in 2003 and then more consistently from 2005 forward. It is generally thought that the bank participation reflects hedging OTC commodity index swaps. So, to facilitate comparison to the CIT data, the BP summary statistics are initially calculated over the same sub-sample from January 2006 through April 2008.
9
As shown in Table 8, the average number of banks participating in the agricultural commodity markets ranges from the minimum reporting level of 5 in feeder cattle to 14 in CBOT wheat. However, much like the CIT, the banks have a surprisingly large portion of open interest, holding 9% of the futures-only open interest in CBOT wheat. Likewise, the banks individually hold very large long positions. For instance, the average commercial bank’s long position in CBOT wheat was 4,970 contracts, second in size only to the 8,597 average for all CIT traders (see Table 7). To further compare the BP traders to the CIT. We calculate the net position (long positions –short positions) for both the BP and CIT data. As shown in Figure 7 for the corn futures market, the net positions of these groups are closely related. This is generally true across all markets (not shown). So, it would appear that the BP traders are a representative sample or subset of the CIT data. In the final column in Table 8, we calculate the percent of the CIT positions that would be held by the commercial banks included in the BP data. The percent of CIT positions that are likely commercial banks range from a low of 18% (feeder cattle) to a high of 35% (CBOT wheat). Because the BP data are futures-only and the CIT data are combined futures and options, the position sizes and percent of CIT open interest reported in Table 8 represent a lower bound on the estimates. The relationship between the BP data and the CIT data is important because it indicates whether it is reasonable to use the BP data as a proxy for index trader activity in the period prior to 2006. Three markets—CBOT wheat, corn, and soybeans—have at least some BP data available for 2003. Any missing observations in 2003 and early 2004 are replaced by the positions reported in the prior month. Then, the banks’ percent of futures-only open interest is calculated for each market and plotted from 2003-2008. If the BP positions are a representative sample of the overall CIT category, then the general trends in the BP data can provide evidence in regards to the growth pattern of overall index fund activity. The percent of futures-only open interest held by the commercial banks is plotted in Figure 8. It is immediately clear that the most rapid increase in index participation appears to have occurred prior to the start of the CIT data history (prior to 2006). In the case of wheat, BP positions grew from 2% at the end of 2003 to almost 12% of the total futures open interest by May of 2005. For all three of these markets, the rapid increase in bank positions—and presumably all index positions—occurred during the 18 month period from early 2004 to mid-2005. Over that time period, BP positions in corn futures climbed from less than 1% of futures-only open interest to over 6%. The BP data suggest that index activity showed the greatest growth (as a percent of the market) from early 2004 through mid-2005. It seems that this time period, if any, would be most prone to a market impact by index traders. In fact, as shown in Figure 9 for soybeans, the peak in the absolute position size comes well after the peak in the percent of open interest. This tendency is confirmed by looking at the actual CIT data over 2006-2008. As shown in Figure 10, the absolute index position in soybeans increased steadily through 2007, while the percent of open interest was fairly stable at around 13%. Likewise, as Figure 11 reveals for lean hogs, the absolute position size held by index funds increased from 40,000 contracts to over 60,000 from late 2007 into early 2008.

10
While there was some increase in the percent of open interest held by index traders, it did not exceed the 25% level seen in early 2006. This may indicate that the market is doing a better job of adjusting to index trader buying. As a result, index traders’ percent of total open interest is relatively stable even though their absolute position size continues to increase. The BP positions are highly correlated with those of the CIT positions; thus, the BP positions provide a useful proxy for index trader activity prior to 2006. The BP data suggest that index activity—as reflected by commercial banks—started in the grain futures markets in 2003 and grew rapidly from early 2004 to mid-2005. In most markets, the percent of open interest attributable to index traders’ peaked in early-2006, even though absolute position sizes continued to increase. These data suggest that the futures market may have went through a period of adjustment as this new type of trader entered the marketplace. Speculative Index As noted in the introduction, Working (1953, 1954, 1960, and 1962) argued that futures markets are primarily hedging markets and that speculation tends to follow hedging volume. Therefore, speculation can only be considered ‘excessive’ or ‘inadequate’ relative to the level of hedging activity in the market. Peck (1979-80, p. 339) provides a succinct re-statement of the arguments found in Working’s papers,
“Taken together, these analyses reaffirm the fundamental importance of hedging to futures markets and dependence of total activity upon hedging needs. The results also lend support to the Working definition of an appropriate measure of hedger demands upon a market. Net hedging is not the most useful view of the demands commercial users make on a market. Speculation is needed to offset both long hedging and short hedging. Only coincidentally are long and short hedgers sufficiently alike in date and amount to be offsetting, although increased balance increases the probability of such correspondence and differences in seasonal needs between long and short hedgers decreases this probability. The appropriate measure of minimum required speculation must at least begin with total hedging demand.”
Working (1960) developed a mathematical index of speculation based on this view of the functioning of futures markets. His speculative index has been used in several studies to examine grain and livestock futures markets for adequate speculative activity (Working, 1960; Nathan Associates, 1967; Labys and Granger, 1970; Peck 1980, 1981; Leuthold 1983). Nearly all prior research is concerned about a lack of sufficient speculative activity to support hedging demands in the marketplace. While this notion seems at odds with the current market environment, Working’s T still provides an objective measure of speculative activity. Working’s speculative “T” index is easily calculated using the traditional COT trader categories: (2a) T = 1+ SS / (HL + HS) if (HS ≥ HL) or (2b) T = 1 + SL / (HL + HS) if (HL > HS)

11
where open interest held by speculators (non-commercials) and hedgers (commercials) is denoted as follows, SS = Speculation, Short SL = Speculation, Long HL = Hedging, Long HS = Hedging, Short Peck (1980, p. 1037) notes that the speculative index, “…reflects the extent by which the level of speculation exceeds the minimum necessary to absorb long and short hedging, recognizing that long and short hedging positions could not always be expected to offset each other even in markets where these positions were of comparable magnitudes.” Working is careful to point out that what may be “technically an ‘excess’ of speculation is economically necessary” for a well-functioning market (1960, p. 197).
As a highly simplified example of the calculation and interpretation of Working’s speculative T index, consider the intuitive case where HL=0; then, T= SL/HS = 1+ (SS/HS).4 It follows, if long speculation (SL) just equals short hedging (HS), then T equals its minimum value of 1.00, where the level of speculation is just sufficient to off-set hedging needs. Now, consider if HL=0, HS=100, SL=110, and SS=10, then T equals 1.10 or there is 10% speculation in excess of that necessary to meet short hedging needs. As noted by several authors (e.g., Leuthold, 1983), Working’s T suffers from the problem of how to classify the non-reporting traders. Non-reporting traders can be classified as speculators, creating an upper bound on the speculative index. Or, they can be classified as hedgers, creating a lower bound on the index. With either of these approaches however, the index will be impacted through time if the proportion of non-reporting traders in a market changes. As shown in Table 1 and Figure 3, diminishing levels of non-reporting trader positions is clearly a problem over our sample period. So, we follow the advice of Rutledge (1977-78) and initially allocate the non-reporting traders’ positions to the commercial, non-commercial, and index trader categories in the same proportion as that which is observed for reporting traders. The values for Working’s T are presented in Table 9 for a number of sub-periods using the traditional COT data. The speculative indices reported do not seem extraordinarily high in any sub-period from 1995 through 2008 using the traditional COT data. Corn futures average 1.08 which suggests that there is only 8% more speculation than the minimum needed to offset short and long hedging needs. The highest speculative index within the grains is CBOT wheat at 1.15, and for livestock it is 1.38 recorded for feeder cattle. Average index values across the nine markets range from 1.12 to 1.14 for the different sub-periods, implying that speculation is barely large enough to meet total hedging demands. In addition, there is no discernable trend in the indexes across the different sub-periods. This is demonstrated in more detail in Figure 12 using the traditional COT trader classifications for CBOT wheat.
4 Note that SS + HS = SL + HL must hold in a zero sum futures market if all positions are categorized as speculative or hedging. If HL = 0, the identity reduces to SS + HS = SL. Dividing through by HS and re-arranging yields T = SL/HS = 1 + (SS/HS).

12
In the last column of Table 9, Working’s T is re-calculated for the 2006-2008 sample period by re-classifying index traders as speculators using CIT data.5 Because commercial hedgers are predominantly net short in each market, they require long speculators to “carry” their hedging. So, by re-categorizing the long-only index funds into the non-commercial category, Working’s T essentially is shifted upward in each market. Even with this adjustment, the average speculative index for the nine markets only increases from 1.14 to 1.27. The largest increase, from 1.38 to 1.67, occurs in feeder cattle. Further perspective is provided by comparing Working’s speculative index in recent periods with those reported by other researchers for earlier periods. Table 10 presents the historical estimates from four previous studies (Working, 1960; Labys and Granger, 1970; Peck, 1980; Leuthold, 1983) along with the upper and lower bounds for the CIT adjusted data from 2006-2008.6 The upper (lower) range results from assuming that non-reporting traders are speculators (hedgers).7 Non-reporting traders are a proportionately smaller part of the market than they have been historically (see Table 1), resulting in a smaller range of “T” values than recorded in previous work. Therefore, the calculation of Working’s T in recent years is not particularly sensitive to the speculator or hedger classification imposed on non-reporting traders. The exception is feeder cattle, where non-reporting traders still represent over 30% of the total open interest. Comparing the historical estimates in Table 10 with our results using the traditional COT data in Table 9, one is struck by the relatively low levels of speculation throughout 1995-2008. The average values for the speculative indices range from 1.12 to 1.14 across the different sub-periods, about equal to or smaller than the averages from the historical estimates spanning the late 1940s to the late 1970s, with the exception of Leuthold’s upper bound estimates in livestock futures markets. As noted earlier, a common concern expressed in previous studies was that speculation on futures markets was not large enough to accommodate hedging pressure. The results for 1995-2008 are wholly consistent with this historical concern regarding agricultural futures markets. Peck’s (1980) conclusions are especially relevant in this regard. For example, she was concerned about the inadequacy of speculation in CBOT wheat from 1972-1977 after finding a speculative index ranging from 1.094 to 1.323. Peck viewed this level of speculation as inadequate when compared to an index of 1.355 to 1.891 from 1947-1971, a period that “would hardly be characterized as speculative” (p. 1041). Likewise, Peck reports KCBOT wheat had a speculative index ranging from 1.009 to 1.045 which was “manifestly inadequate” (p. 1043). Across the sub-periods over
5 While it was noted in the previous section that bank participation data is a useful proxy for index trader positions previous to 2006, it is not used here for three reasons. First, bank participation data is available only for futures positions, whereas CIT data are reported for combined futures and options positions. Second, we do not want to introduce further measurement errors into the position data before 2006. Third, the basic findings reported in this section would be unchanged by using the bank participation data to adjust data previous to 2006. 6 The 1967 Nathan Associates study reported speculative indexes in graphical form rather than tabular form, and hence, results from this study are not included in Table 10. The data sample for Peck’s 1981 study is a sub-sample of the data from her 1980 study. 7 Note that CIT adjusted speculative indexes for 2006-2008 in Table 8 allocate non-reporting traders’ positions to the commercial, non-commercial, and index trader categories in the same proportion as that which is observed for reporting traders. Consequently, the estimates in Table 8 fall between the reported ranges in Table 9.

13
1995-2008, CBOT wheat had an average speculative index of 1.14 and KCBOT wheat averaged 1.07. The final column of Table 10 shows upper and lower bounds for Working’s T over 2006-2008 using the CIT adjusted data. Again, there is little evidence that current index levels are deviating from historical norms, even after accounting for index trader positions. For instance, the range reported for live cattle futures (1.13-1.60) is generally lower than those reported by Peck (1.568-2.173) and Leuthold (1.05-2.34). Interestingly, the values reported for cotton (1.27) and soybean oil (1.14) by Working for the 1954-1958 period are generally at the upper end of the recent range reported for 2006-2008. There is no pervasive evidence that current speculative levels, even after accounting for index trader positions, are in excess of those recorded historically for agricultural futures markets. It is somewhat surprising and counter-intuitive that Working’s T has remained at or below historical levels, given the large increase in both non-commercial positions and long-only index participation in the markets. As demonstrated by Working (1960) and carefully explained by Peck (1981), the subtleties of Working’s speculative index require close study and the index can be impacted by shifts in any trader category. Consider a base case of equation (2a) where HL=0, HS=100, SL=150, and SS=50, then T = 1 + (50/100) = 1.50, indicating that there is 50% more speculation than technically necessary to satisfy commercial hedging needs. Now, consider two alternative cases. First, assume that there is a large increase in long speculation that is accompanied by an equal increase in short hedging positions, such that HL = 0, HS = 200, SL = 250, and SS =50, then T = 1 + (50/200) = 1.25. That is, the speculative index actually declines because all of the increase in speculation was met by hedging, and the “excess” speculative positions are now actually a smaller proportion of the total hedging demand. In the second alternative case, assume that the increase in long speculation is met by other short speculators, such that HL=0, HS = 100, SL = 250, and SS=150, then T = 1 + (150/100) = 2.50. Here, the “T” index increases quite dramatically because speculators traded with speculators and there is no commercial hedging need for this additional speculation. While there are many other scenarios under which Working’s T can increase or decrease, these two cases are illustrative of what would commonly be considered necessary and excessive speculation, respectively. In Table 11, the hedging and speculative positions used to calculate Working’s T are presented for the first three months of 2006 and 2008 using the CIT adjusted data. With a few exceptions, the data in Table 11 suggest that the first alternative case above is fairly descriptive of the changes experienced in the commodity markets over this interval. In the corn market, there was a large increase in long speculative (SL) positions (+233,768), however, this is not enough to absorb the 525,471 contract increase in short hedging; thus, Working’s T declines. A similar story holds for soybeans, soybean oil, and cotton. Feeder cattle provide an excellent example of the second alternative case provided above. In this market, HS and HL decline by very similar amounts, while there are also parallel increases in SL and SS positions—that is, speculators are trading with each other. As a result, Working’s T increases fairly dramatically from 1.374 to 1.917. Live cattle show a similar increase in speculative trade, but the increase in Working’s T (0.200) is of a smaller magnitude than seen in feeder cattle (0.543). In the other markets, there is some combination of these two impacts that result in fairly minor shifts in Working’s T index.
14
Given the relatively small shifts in Working’s T documented in this research, it is apparent that the much publicized increase in long-only speculative positions is largely accompanied by a comparable increase in short hedging. This is clearly illustrated in Figure 13 for soybeans, where Working’s T initially declines and then stabilizes as long speculation just offsets short hedging by commercials. While the increase in long-only speculation has received the most publicity, the increase in the size of short hedging positions is equally interesting. For example, the average short hedging position during the first quarter of 2008 in corn is slightly less than 6 billion bushels and in soybeans a little over 2 billion bushels. Of course, what is not clear is the validity of Working’s classical paradigm: speculation follows hedging. Did long speculation increase to meet short hedging needs as assumed by Working? Or, is the tail wagging the dog? Unlike traditional speculators in Working’s day—who were regarded as scalpers, day traders, or position traders and who were responsive to hedging needs in the market—long-only index funds appear to be more mechanical and less responsive to hedging demands. While this does not alter the calculation of the speculative index, it does bring into question Working’s maintained assumption about the nature of speculation in today’s markets. It is also possible that the commercial category still contains “contamination” both from hedgers who are really speculating and swap dealers who are hedging OTC swaps not used for commodity index investments. The degree of this contamination is unknown plus it is unclear whether it would lead to over- or under-estimation of long or short positions. So, the potential directional impact on Working’s T is difficult to discern. In sum, agricultural futures markets do not have a historically high level of speculative activity based on Working’s speculative T index. Working and others strongly maintained that futures markets were hedging markets, where speculators enter the market in response to hedging pressures. For example, Peck (1979-80, p. 329) unequivocally states, “Taken together, the historical evidence is clear: futures markets reflect commercial needs.” The rise of long-only index funds in agricultural futures markets opens this basic tenant to debate and may bring into question the appropriateness of traditional measures of speculative market balance. Policy Implications The impact of speculators—especially index funds—on commodity prices is currently being hotly debated in the popular press and political circles (e.g., Masters, 2008). It is commonly asserted that speculative positions create a “bubble,” where market prices far exceed fundamental values. Proposals have recently surfaced in the U.S. Congress to sharply increase futures margins in an effort to curb this damaging speculation (CHSGA, 2008). Indeed, recent political wrangling has spurred the CFTC to announce new initiatives for monitoring speculative traders in agricultural futures markets (CFTC, 2008b). When observing this debate, one is struck by the paucity of hard evidence typically used to justify positions, mostly negative, on the impact of speculation.
Several recent academic studies actually provide evidence relevant to the current debate about the price impacts of speculation in agricultural futures markets. Bryant, Bessler, and Haigh (2006), Gorton, Hayashi, and Rouwenhorst (2007), and Sanders, Irwin, and Merrin (2007) rigorously test whether there is a causal relationship between COT position data and the movement

15
of agricultural futures prices, finding very little evidence of a relationship. Only Wang (2001, 2003) finds some linkages between large trader positions and market returns.8 While none of these studies directly assess the price impact of long-only index funds, the weight of the evidence suggests such an impact is unlikely.
There are additional reasons to be skeptical about the assertion that speculation has led to bubbles in agricultural futures prices over the last two years. First, the research presented in this report shows that the level of speculation in agricultural futures markets—as measured by Working’s T—is not outside of historical norms. If speculation is driving prices above fundamental values, it is not obvious in the level of speculation relative to hedging. Second, recent price increases do not neatly fit a bubble explanation. As shown in Figure 14, price increases are concentrated in the grain and oilseed markets. Yet, the highest concentration of long-only speculative positions is often in the livestock futures markets (Table 3), which generally did not participate in the price increases and for which index funds are rarely mentioned as problematic. It is difficult to rationalize why speculation by index funds would only impact particular agricultural futures markets. Third, very high prices have been observed for commodities without futures markets (e.g., durum wheat and edible beans) and in agricultural futures markets that are not included in popular commodity indices (e.g., rice and fluid milk). 9 To assert that the commodity markets are being driven higher by a speculative bubble ignores historically low world grain inventories and other market fundamentals that are broadly driving commodity prices higher. Fourth, as Hamilton (2008) points out, if speculators create a bubble in futures prices for storable commodities, this also creates an incentive to store commodities because prices in the future exceed levels normally required to compensate inventory holders for storage. We should therefore observe an increase in inventories when a bubble is present. In fact, inventories for grains and oilseeds have fallen sharply over the last two years.
Finally, for any trader group to push prices away from fundamental value requires that the unpredictability of their market opinions serve as an effective deterrent to arbitrage (De Long et al., 1990). This notion seems unlikely given the ease with which other large non-commercial traders should be able to trade against index fund positions. Index funds do not attempt to hide their current position or their next move. Generally, funds that track a popular commodity index (e.g., GSCI) publish their mechanical procedures for rolling to new contract months. Moreover, they usually indicate desired market weightings when the index is re-balanced. So, the only uncertainty in their trading patterns may stem from the overall in-flow or out-flow of monies associated with the underlying investment vehicle (e.g., mutual fund). It seems unlikely that more traditional
8 These studies focus on the relationship between trader positions and the direction and magnitude of futures price changes. A related but different set of studies examine the relationship between trader positions and the volatility of futures prices (e.g., Streeter and Tomek, 1992; Goodwin and Schnepf, 2000). Changes in trader positions may be related to the volatility of futures prices but not the direction of futures price changes. 9Over the period from January 3, 2006 through April 15, 2008, durum wheat prices increased from $3.18 to $12.99 per bushel (http://www.mgex.com/history/historical_new.cfm); nearby futures prices for rough rice increased from $8.27 per hundred pounds to $22.17; nearby class III fluid milk futures increased from $12.65 per hundredweight to $17.29 (http://www.cmegroup.com/CmeWeb/ ftp.wrap/bulletin); and the monthly average price received by farmers for dry edible bean prices increased from $19.30 per hundred pounds to $34.40 from January 2006 to April 2008 (http://usda.mannlib.cornell.edu/MannUsda/viewDocumentInfo.do?documentID=1002).

16
speculators would allow index funds to push prices away from fundamental values. Moreover, the finite horizon of futures contracts plus the general ease of creating “substitute portfolios” in futures and options markets further diminishes the likelihood that speculative arbitrage is limited (Shleifer and Summers, 1990).
When considering current policy debates about speculation in agricultural futures markets, it is also important to consider lessons from comparable episodes in the past. We submit that 1972-1975 is the last time period with comparable levels of structural change in commodity markets. U.S. and international commodity markets experienced a period of rapid price increases from 1972-1975, setting new all-time highs across a broad range of markets. In hindsight, economists generally consider this a period marked by rapid structural shifts such as oil embargoes, Russian grain imports, and the collapse of the Bretton Woods fixed exchange rate system (Cooper and Lawrence, 1975). It is particularly interesting to note that commodity price increases over 1972-1975 were often blamed on speculative behavior associated with the “tremendous expansion of trading in futures in a wide range of commodities” (Cooper and Lawrence, 1975, p. 702). In fact, Labys and Thomas (1975, p. 287) motivate their research with words that could have been written in 2008 instead of 1975:
“This paper analyses the instability of primary commodity prices during the recent period of economic upheaval, and determines the extent to which this instability was amplified by the substantial increase in futures speculation which also occurred. Of particular interest is the degree to which this speculation rose and fell with the switch of speculative funds away from traditional asset placements and towards commodity futures contracts.”
Perhaps not surprisingly, Labys and Thomas found only a weak relationship between speculative activity and price instability. Still, public pressure to curb speculation resulted in a number of regulatory proposals and the upward adjustment of margin requirements (Rainbolt, 1977; Tomek, 1985; Fishe and Goldberg, 1986). The only consistent impact of higher margin requirements in the past seems to be a decline in futures trading volume. The evidence that higher futures margins lowered price variability is mixed, and there is no evidence that higher futures margins actually lowered price levels (Fishe and Goldberg, 1986; Peck and Budge, 1987; Haradouvelis and Kim, 1996). So, while higher margins may have reduced speculation—through lower open interest and reduced volume of trade—it seems to do little to cure the “problems” of high prices or price variability.
Like the 1972-1975 period, the 2006-2008 period has experienced a rapid increase in commodity price levels. Demand growth from developing nations, the diversion of row crops to biofuel production, and U.S. monetary policy are some of the economic fundamentals thought to underlie recent commodity price increases (Trostle, 2008). The complex interplay between these factors and how they impact price expectations is often difficult to grasp in real-time. So, much like the mid-1970’s, the scapegoat for commodity price increases seems to have become the speculator. The present research suggests that current levels of speculation—given hedging needs—are at historically normal levels. Indeed, Working’s T in many agricultural futures markets is at levels associated with “inadequate” speculation in the past. If this is the case, then policy decisions aimed
17
at curbing speculation may well be counter-productive in terms of price levels and market volatility. In particular, these policy initiatives could severely compromise the ability of futures markets to accommodate hedgers and facilitate the transfer of risk. Summary and Conclusions In a series of classic papers, Working (1953, 1954, 1960, and 1962) argued that agricultural futures markets are primarily hedging markets and that speculation tends to follow hedging volume. However, the rapid growth of new types of speculators has led many to argue that today’s speculative trade in agricultural futures markets is the proverbial tail wagging the dog. Some also claim that these new speculators, especially long-only commodity index funds, create “price distortions” and potentially disrupt traditional cash-futures convergence patterns (Morrison, 2006; Henriques, 2008).
The objective of this report is to re-visit the “adequacy of speculation” debate in agricultural futures markets, bringing new data to the task. Specifically, this research examines the size and activity of trader categories in the traditional Commodity Futures Trading Commission (CFTC) Commitments of Traders (COT) reports, the Commodity Index Trader (CIT) reports, and the Bank Participation (BP) reports. Data for the traditional COT trader positions are available for each week from March 21, 1995 through April 15, 2008 (683 observations). CIT data are only available for the period covering January 3, 2006 through April 15, 2008 (120 observations). Monthly BP data are collected for January 2006 through April 2008. Markets included in the analysis are: corn, soybeans, soybean oil, CBOT wheat, KCBOT wheat, cotton, live cattle, feeder cattle, and lean hogs.
The data are first closely examined for potential shifts or changes in trader activity. In
regards to the relative size of the index funds, they usually comprise 10% to 20% of the total open positions within most markets. However, because they are almost exclusively long, they tend to make up 20% to 40% of the long-side of the market. In some markets (i.e., lean hogs, CBOT wheat), index funds are the predominant long position holder. The agricultural markets averaged fewer than 25 reporting long index traders over the 2006-2008 sample period. However, the long index traders have average positions that are more than 10 times the size of the typical non-commercial trader. For CBOT wheat, the average index position size exceeds the speculative limit. Several notable trends or shifts in market participation are observed in the data. First, agricultural commodity futures markets have experienced a rapid increase in open interest that started in late 2004 and continues into 2008 for many markets. Second, from early 2005 to mid-2006 there was a dramatic increase in index funds’ percent of total open interest (as shown by the BP data). For most markets, the index funds’ percent of open interest peaked in 2006 and has since stabilized, even though absolute position size continues to grow. Third, traditional speculative measures do not show any material changes or shifts over the sample period. In most markets, the increase in long speculative positions was equaled or surpassed by an increase in short hedging. So, even after adjusting speculative indices for index fund positions, values are within the historical ranges reported in prior research. While the analysis in this report does not test for directly for price impacts, it does provide some pertinent evidence in this regard. First, if there is a market impact from index fund activity, it
18
seems likely that it would have occurred during the period of most rapid growth: 2004-2005. Second, the stabilization of the index funds’ percent of total open interest may suggest that other traders have adjusted their strategies to better cope with this relatively new market participant. Third, Working’s speculative index suggests that long-only index funds may in fact be beneficial in markets dominated by short hedging pressure. That is, they improve the adequacy of speculation by helping the market to “carry” unbalanced short hedging. However, the traditional notion that hedging begets speculating may need to be re-visited. The relatively normal level of speculation over the sample period raises some doubt as to whether index funds are behind recent commodity price increases. Much like in the last major episode of structural change in commodity markets in 1972-1975, some are blaming speculators for the recent increase in commodity prices. Proposals are once again surfacing to increase margins in an effort to curb “harmful” speculation in futures markets. Such policy decisions aimed at curbing speculation may well be counter-productive in terms of price levels or market volatility. In particular, these policy initiatives could severely compromise the ability of futures markets to accommodate hedgers and facilitate the transfer of risk. There is certainly a need for additional research on several fronts. Early research on futures markets stressed that an understanding of the size and motivation of various market participants was a crucial first step in understanding other, more advanced, market performance issues. Hence, the activity of all trader groups, especially index traders, should be investigated using more disaggregated data (e.g., daily by contract maturity). The price impact of trader groups also needs to be carefully examined. Finally, there is a need to re-examine the fundamental question of whether agricultural futures markets are still hedging markets, as defined by Working.
19
References Acworth, W. “Going Long on Commodities.” Futures Industry, May/June 2005, pp. 24-28. Agricultural and Food Policy Center (AFPC). “The Effects of Ethanol on Texas Food and Feed.”
AFPC Research Report 08-1, April 2008. (http://www.afpc.tamu.edu/pubs/2/515/RR-08-01.pdf)
Bryant, H., D.A. Bessler, and M.S. Haigh. “Causality in Futures Markets.” Journal of Futures
Markets. 26(2006):1039-1057. Commodity Futures Trading Commission (CFTC). “Comprehensive Review of the Commitments
of Traders Reporting Program.” Federal Register, 71, FR 35627, June 21, 2006a. Commodity Futures Trading Commission (CFTC). “Commodity Futures Trading Commission
Actions in Response to the “Comprehensive Review of the Commitments of Traders Reporting Program.” December 5, 2006b. (http://cftc.gov/stellent/groups/public/@commitmentsoftraders/documents/file/noticeonsupplementalcotrept.pdf)
Commodity Futures Trading Commission (CFTC). “About the Commitments of Traders.”
http://www.cftc.gov/marketreports/commitmentsoftraders/cot_about.html, accessed on May 15, 2008a.
Commodity Futures Trading Commission (CFTC). “CFTC Announces Agricultural Market
Initiatives.” http://cftc.gov/newsroom/generalpressreleases/2008/pr5504-08.html, accessed on June 4, 2008b.
Committee on Homeland Security and Government Affairs (CHSGA), U.S. Senate. “Lieberman,
Collins Say Commodities Market Speculation Contributes to High Cost of Food, Oil.” May 20, 2008, http://hsgac.senate.gov/public/index.cfm?Fuseaction=PressReleases.Detail&PressRelease_id=5b4235c6-a484-4a0a-9753-288ae81b2a54&Month=5&Year=2008&Affiliation=C, accessed on May 27, 2008.
Cooper, R.N., and R.Z. Lawrence. “The 1972-75 Commodity Boom.” Brookings Papers on
Economic Activity 3(1975):671-723. De Long, J. B., A. Shleifer, L. H. Summers, and R. J. Waldmann. “Noise Trader Risk in Financial
Markets.” Journal of Political Economy 98(1990):703-738. Domanski, D., and A. Heath. “Financial Investors and Commodity Markets.” Bank for International
Settlements Quarterly Review, March 2007, pp. 53-67.
20
Hamilton, J.D. “Understanding Crude Oil Prices.” Working Paper, Department of Economics, University of California-San Diego, June 2008. [http://dss.ucsd.edu/~jhamilto/understand_oil.pdf]
Nathan Associates, Inc. “Margins, Speculation, and Prices in Grain Futures Markets.” Special
Report, Economic Research Service, U.S. Department of Agriculture, 1967. Ederington, L., and J.H. Lee. “Who Trades Futures and How: Evidence from the Heating Oil
Market.” Journal of Business 75(2002):353-373. Epstein, G. “Commodities: Who’s Behind the Boom?” Barron’s, March 31, 2008.
(http://setup1.barrons.com/article/SB120674485506173053.html). Fenton, J., and G. Martinaitas. “Large Trader Reporting: The Great Equalizer.” Futures Industry,
July/August 2005, pp. 34-39. Fishe, R.P.H., and L.G. Goldberg. “The Effects of Margins on Trading in Futures Markets.” Journal
of Futures Markets 6(1986):261-271. Gorton, G.B., F. Hayashi, and K.G. Rouwenhorst. “The Fundamentals of Commodity Futures
Returns.” National Bureau of Economic Research (NBER) Working Paper No. 13249, July 2007.
Goodwin, B.K., and R. Schnepf. “Determinants of Endogenous Price Risk in Corn and Wheat
Futures Markets.” Journal of Futures Markets 20(2000):753-744. Gorton, G., and K.G. Rouwenhorst. “Facts and Fantasies about Commodity Futures.” Financial
Analysts Journal 62(2006):47-68. Hardouvelis, G.A., and D. Kim. “Price Volatility and Futures Margins.” Journal of Futures Markets
16(1996):81-111. Henriques, D.B. “Odd Crop Prices Defy Economics.” New York Times, March 28, 2008, pp. C1. Hieronymus, T.A. Economics of Futures Trading for Commercial and Personal Profit. New York,
NY: Commodity Research Bureau, 1971. Huhman, J. “Personal Communication.” Commodity Futures Trading Commission, Division of
Market Oversight, October 2006. Hull, J.C. Options, Futures, and Other Derivatives, 4th Edition. Upper Saddle River, NJ: Prentice
Hall, 2000. Labys, W.C., and C.W.J. Granger. Speculation, Hedging and Commodity Price Forecasts.
Lexington, MA: Heath Lexington Books, 1970.
21
Labys, W.C., and H.C. Thomas. “Speculation, Hedging and Commodity Price Behavior: An International Comparison.” Applied Economics 7(1975):287-301.
Larson, A.B. “Estimation of Hedging and Speculative Positions in Futures Markets.” Food
Research Institute Studies 2(1961):203-212. Leuthold, R.M. “Commercial Use and Speculative Measures of the Livestock Commodity Futures
Markets.” Journal of Futures Markets 3(1983):113-135. Masters, M.W. “Testimony before the Committee on Homeland Security and Government Affairs,
U.S. Senate.” May 20, 2008, http://hsgac.senate.gov/public/_files/052008Masters.pdf, accessed on May 27, 2008.
McDonald, W.E., and S.K. Freund. “The CFTC’s Large Trader Reporting System: History and
Development.” Business Lawyer 38(1983):917-953. Morrison, K. “US Wheat Futures at Nine-Year Peak.” Financial Times, September 29, 2006,
http://www.ft.com, accessed on October 19, 2006. Peck, A.E. “Reflections of Hedging on Futures Markets.” Food Research Institute Studies 17(1979-
80):327-349. Peck, A.E. “The Role of Economic Analysis in Futures Market Regulation.” American Journal of
Agricultural Economics 62(1980):1037-1043. Peck, A.E. “The Adequacy of Speculation on the Wheat, Corn, and Soybean Futures Markets.” in
Research in Domestic and International Agribusiness Management, R. A. Goldberg, ed., Greenwich, CN: JAI Press, Inc., Vol. 2, 1981, pp. 17-29.
Peck, A.E. “Estimation of Hedging and Speculative Positions in Futures Markets Revisited.” Food
Research Institute Studies 18(1982):181-195. Peck, A.E., and C. Budge. “The Effects of Extraordinary Speculative Margins in the 1947-48 Grain
Futures Markets.” Food Research Institute Studies 20(1987):165-180. Rainbolt, J.V. “Regulating the Grain Gambler and His Successors.” Hofstra Law Review
6(1977):1-25. Rutledge, D.J.S. “Estimation of Hedging and Speculative Positions in Futures Markets: An
Alternative Approach.” Food Research Institute Studies 16(1977-78):205-211. Sanders, D.R., K. Boris, and M. Manfredo. “Hedgers, Funds, and Small Speculators in the Energy
Futures Markets: An Analysis of the CFTC’s Commitments of Traders Reports.” Energy Economics 26(2004):425-445.
22
Sanders, D.R., S.H. Irwin, and R. Merrin. “Smart Money? The Forecasting Ability of CFTC Large Traders.” Proceedings of the NCCC-134 Conference on Applied Commodity Price Analysis, Forecasting, and Market Risk Management, 2007 (NCCC-134 Publication: http://www.farmdoc.uiuc.edu/nccc134/conf_2007/pdf/ confp01-07.pdf).
Shleifer, A., and L.H. Summers. “The Noise Trader Approach to Finance.” Journal of Economic
Perspectives 4(1990):19-33. Sjerven, J. “Futures Markets Users Struggle: Commodities Attract Increased Speculative Interest to
the Dismay of Many Commercial Users.” Foodbusinessnews.net, May 13, 2008, http://www.foodbusinessnews.net/feature_stories.asp?ArticleID=93497, accessed May 27, 2008.
Streeter, D. H., and W. G. Tomek. "Variability in Soybean Futures Prices: An Integrated
Framework." Journal of Futures Markets 12(1992):705-728. Tomek, W. G. “Margins on Futures Contracts: Their Economic Roles and Regulation.” in Futures
Markets: Regulatory Issues, A. E. Peck ed. Washington, D.C., American Enterprise Institute for Public Policy Research, 1985, pp. 143-209.
Trostle, R. “Global Agricultural Supply and Demand: Factors Contributing to the Recent Increase in
Food Commodity Prices.” Outlook Report No. WRS-0801, Economic Research Service, U.S. Department of Agriculture, May 2008. (http://www.ers.usda.gov/Publications/WRS0801/WRS0801.pdf)
Wang, C. “Investor Sentiment and Return Predictability in Agricultural Futures Markets.” Journal
of Futures Markets 21(2001):929-952. Wang, C. “The Behavior and Performance of Major Types of Futures Traders.” Journal of Futures
Markets 23(2003):1-31. Working, H. “Futures Trading and Hedging.” American Economic Review 43(1953):314-343. Working, H. “Whose Markets? Evidence on Some Aspects of Futures Trading.” Journal of
Marketing 29(1954):1-11. Working, H. “Speculation on Hedging Markets.” Food Research Institute Studies 1(1960):185-220. Working, H. “New Concepts Concerning Futures Markets and Prices.” American Economic Review
62(1962):432-459.
23
Table 1. Percent of Open Interest Held by Trader Category, COT Reports, 1995-2008 1995-‘05 2006-‘08 Market
Non-Commercial
Commercial
Non-Reporting
Non-Commercial
Commercial
Non-Reporting
Corn 28% 47% 25% 39% 46% 15% Soybeans 33% 42% 25% 40% 44% 16% Soybean Oil 31% 51% 18% 34% 58% 8% CBOT Wheat 35% 42% 22% 42% 48% 10% KCBOT Wheat 20% 55% 25% 32% 48% 20% Cotton 34% 53% 13% 41% 52% 7% Live Cattle 30% 41% 29% 40% 44% 16% Feeder Cattle 32% 24% 43% 42% 27% 32% Lean Hogs 34% 36% 30% 40% 45% 15%
Table 2. Original COT Classification for CIT Positions, 2006-2008 Non-
Commercial Non-
Commercial Non-
Commercial Commercial Commercial Market Long Short Spread Long Short Corn 11% 0% 0% 86% 3% Soybeans 10% 0% 0% 87% 3% Soybean Oil 7% 0% 0% 91% 2% CBOT Wheat 11% 0% 0% 84% 5% KCBOT Wheat 15% 0% 0% 84% 1% Cotton 8% 0% 0% 90% 2% Live Cattle 15% 0% 0% 83% 1% Feeder Cattle 36% 0% 0% 63% 1% Lean Hogs 14% 0% 0% 86% 1%
Table 3. Percent of Open Interest Held by COT Groups, 2006-2008 Market
Non-Commercial
Commercial
Index
Non-Reporting
Corn 37% 36% 12% 15% Soybeans 38% 33% 13% 16% Soybean Oil 33% 46% 12% 8% CBOT Wheat 39% 29% 21% 10% KCBOT Wheat 30% 40% 10% 20% Cotton 40% 37% 16% 7% Live Cattle 37% 28% 20% 16% Feeder Cattle 37% 19% 12% 32% Lean Hogs 37% 26% 22% 15%

24
Table 4. Percent Net Long by COT Trader Groups, 2006-2008 Market
Non-Commercial
Commercial
Index
Non-Reporting
Corn 48% -37% 94% -19% Soybeans 28% -35% 94% -18% Soybean Oil 46% -42% 95% 22% CBOT Wheat -6% -54% 90% -25% KCBOT Wheat 66% -47% 98% -11% Cotton 15% -47% 96% 28% Live Cattle 21% -57% 97% -39% Feeder Cattle 33% -20% 98% -45% Lean Hogs -7% -65% 98% -24% Table 5. Percent of Long and Short Positions by COT Trader Group, 2006-2008. Panel A: Long Positions Market
Non-Commercial
Commercial
Index
Non-Reporting
Corn 42% 23% 23% 12% Soybeans 41% 21% 25% 13% Soybean Oil 39% 27% 24% 10% CBOT Wheat 39% 14% 40% 8% KCBOT Wheat 41% 21% 20% 18% Cotton 40% 20% 31% 9% Live Cattle 40% 12% 39% 10% Feeder Cattle 44% 16% 23% 17% Lean Hogs 36% 9% 44% 12% Panel B: Short Positions Market
Non-Commercial
Commercial
Index
Non-Reporting
Corn 33% 49% 1% 18% Soybeans 36% 45% 1% 19% Soybean Oil 27% 66% 1% 7% CBOT Wheat 40% 45% 2% 13% KCBOT Wheat 19% 58% 0% 22% Cotton 39% 55% 1% 5% Live Cattle 34% 44% 0% 22% Feeder Cattle 31% 23% 0% 46% Lean Hogs 38% 42% 0% 19%

25
Table 6. Average Number of Reporting Traders, COT Trader Category, 2006-2008 Non-Commercial Commercial Index Index Market Total Long Short Spread Long Short Long Short Corn 758 203 133 234 275 331 24 10 Soybeans 463 138 111 166 113 152 24 7 Soybean Oil 197 64 38 55 49 57 16 3 CBOT Wheat 370 102 118 142 65 101 24 9 KCBOT Wheat 182 57 24 37 50 72 15 2 Cotton 297 112 78 87 63 62 21 4 Live Cattle 328 79 68 87 80 137 23 3 Feeder Cattle 146 35 29 29 35 51 16 1 Lean Hogs 213 57 68 80 24 43 21 2 Table 7. Average Position Size (contracts), COT Trader Category, 2006-2008
Non-Commercial Commercial Index Index
Reportable
Spec. Market Long Short Spread Long Short Long Short Position Limita Corn 1,218 644 2,062 1,422 2,542 16,805 1,176 250 22,000 Soybeans 616 398 955 1,081 1,743 6,123 691 150 10,000 Soybean Oil 861 483 1123 1,647 3,527 4,550 688 200 6,500 CBOT Wheat 573 553 981 1,091 2,297 8,597 1,092 150 6,500 KCBOT Wheat 723 349 549 626 1,223 1,948 180 150 6,500 Cotton 382 393 891 921 2,652 4,104 361 100 5,000 Live Cattle 566 434 722 408 864 4,569 462 100 5,150 Feeder Cattle 267 152 203 153 153 473 62 50 1,000 Lean Hogs 401 394 565 754 1,885 3,853 212 100 4,100 aLimits for futures plus delta-adjusted options positions, all contract months combined. Table 8. Bank Participation Data, 2006-2008 Bank % of Futures Position Size Position Size % of CIT Market Count Open Interest Long Short Open Interest Corn 13 5% 10,057 551 31% Soybeans 10 4% 3,555 259 25% Soybean Oil 7 4% 2,634 192 27% CBOT Wheat 14 9% 4,970 425 35% KCBOT Wheat 7 3% 1,147 22 26% Cotton 10 6% 2,093 56 25% Live Cattle 7 5% 3,333 245 25% Feeder Cattle 5 2% 231 29 18% Lean Hogs 7 5% 2,795 20 22%
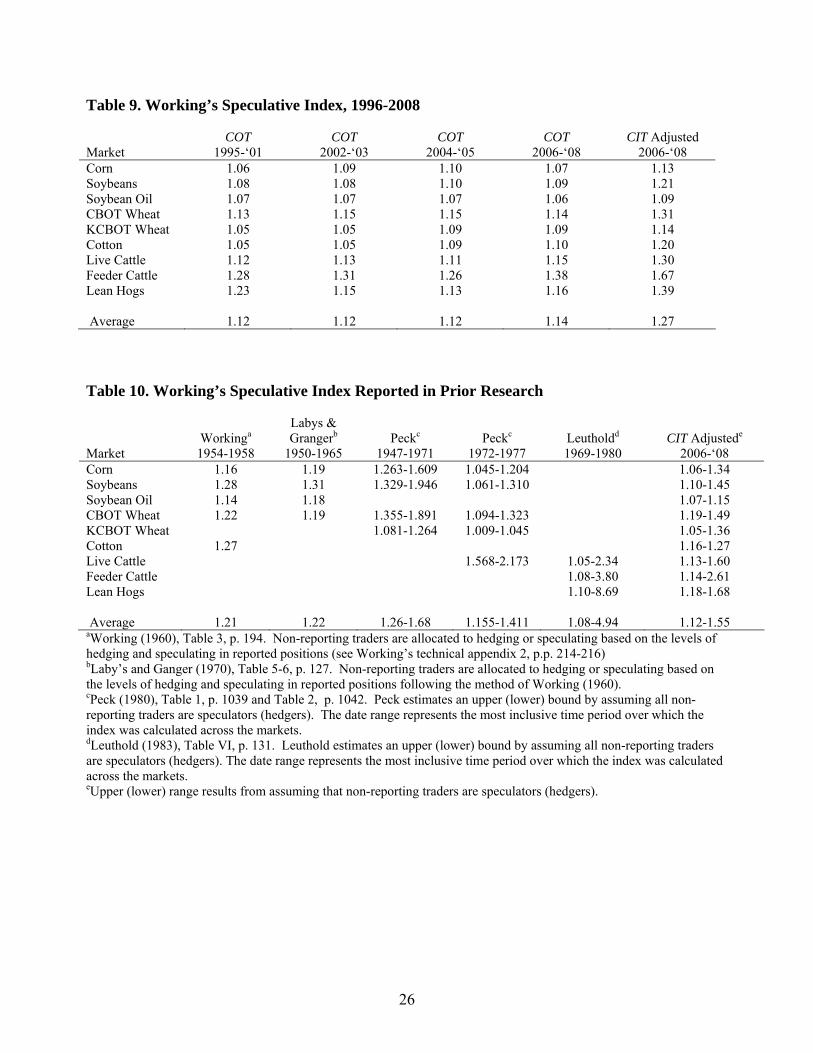
26
Table 9. Working’s Speculative Index, 1996-2008 Market
COT 1995-‘01
COT 2002-‘03
COT 2004-‘05
COT 2006-‘08
CIT Adjusted 2006-‘08
Corn 1.06 1.09 1.10 1.07 1.13 Soybeans 1.08 1.08 1.10 1.09 1.21 Soybean Oil 1.07 1.07 1.07 1.06 1.09 CBOT Wheat 1.13 1.15 1.15 1.14 1.31 KCBOT Wheat 1.05 1.05 1.09 1.09 1.14 Cotton 1.05 1.05 1.09 1.10 1.20 Live Cattle 1.12 1.13 1.11 1.15 1.30 Feeder Cattle 1.28 1.31 1.26 1.38 1.67 Lean Hogs 1.23 1.15 1.13 1.16 1.39 Average 1.12 1.12 1.12 1.14 1.27 Table 10. Working’s Speculative Index Reported in Prior Research Market
Workinga 1954-1958
Labys & Grangerb
1950-1965
Peckc
1947-1971
Peckc
1972-1977
Leutholdd 1969-1980
CIT Adjustede
2006-‘08 Corn 1.16 1.19 1.263-1.609 1.045-1.204 1.06-1.34 Soybeans 1.28 1.31 1.329-1.946 1.061-1.310 1.10-1.45 Soybean Oil 1.14 1.18 1.07-1.15 CBOT Wheat 1.22 1.19 1.355-1.891 1.094-1.323 1.19-1.49 KCBOT Wheat 1.081-1.264 1.009-1.045 1.05-1.36 Cotton 1.27 1.16-1.27 Live Cattle 1.568-2.173 1.05-2.34 1.13-1.60 Feeder Cattle 1.08-3.80 1.14-2.61 Lean Hogs 1.10-8.69 1.18-1.68 Average 1.21 1.22 1.26-1.68 1.155-1.411 1.08-4.94 1.12-1.55 aWorking (1960), Table 3, p. 194. Non-reporting traders are allocated to hedging or speculating based on the levels of hedging and speculating in reported positions (see Working’s technical appendix 2, p.p. 214-216) bLaby’s and Ganger (1970), Table 5-6, p. 127. Non-reporting traders are allocated to hedging or speculating based on the levels of hedging and speculating in reported positions following the method of Working (1960). cPeck (1980), Table 1, p. 1039 and Table 2, p. 1042. Peck estimates an upper (lower) bound by assuming all non-reporting traders are speculators (hedgers). The date range represents the most inclusive time period over which the index was calculated across the markets. dLeuthold (1983), Table VI, p. 131. Leuthold estimates an upper (lower) bound by assuming all non-reporting traders are speculators (hedgers). The date range represents the most inclusive time period over which the index was calculated across the markets. eUpper (lower) range results from assuming that non-reporting traders are speculators (hedgers).
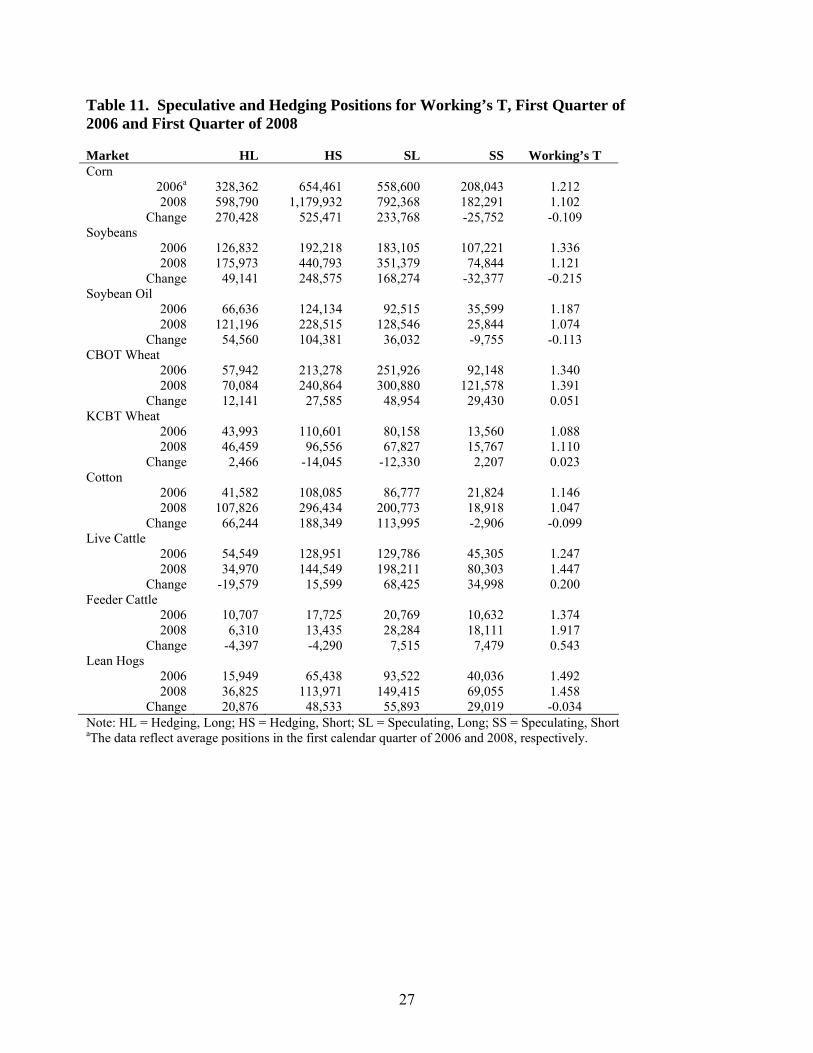
27
Table 11. Speculative and Hedging Positions for Working’s T, First Quarter of 2006 and First Quarter of 2008 Market HL HS SL SS Working’s T Corn
2006a 328,362 654,461 558,600 208,043 1.212 2008 598,790 1,179,932 792,368 182,291 1.102
Change 270,428 525,471 233,768 -25,752 -0.109 Soybeans
2006 126,832 192,218 183,105 107,221 1.336 2008 175,973 440,793 351,379 74,844 1.121
Change 49,141 248,575 168,274 -32,377 -0.215 Soybean Oil
2006 66,636 124,134 92,515 35,599 1.187 2008 121,196 228,515 128,546 25,844 1.074
Change 54,560 104,381 36,032 -9,755 -0.113 CBOT Wheat
2006 57,942 213,278 251,926 92,148 1.340 2008 70,084 240,864 300,880 121,578 1.391
Change 12,141 27,585 48,954 29,430 0.051 KCBT Wheat
2006 43,993 110,601 80,158 13,560 1.088 2008 46,459 96,556 67,827 15,767 1.110
Change 2,466 -14,045 -12,330 2,207 0.023 Cotton
2006 41,582 108,085 86,777 21,824 1.146 2008 107,826 296,434 200,773 18,918 1.047
Change 66,244 188,349 113,995 -2,906 -0.099 Live Cattle
2006 54,549 128,951 129,786 45,305 1.247 2008 34,970 144,549 198,211 80,303 1.447
Change -19,579 15,599 68,425 34,998 0.200 Feeder Cattle
2006 10,707 17,725 20,769 10,632 1.374 2008 6,310 13,435 28,284 18,111 1.917
Change -4,397 -4,290 7,515 7,479 0.543 Lean Hogs
2006 15,949 65,438 93,522 40,036 1.492 2008 36,825 113,971 149,415 69,055 1.458
Change 20,876 48,533 55,893 29,019 -0.034 Note: HL = Hedging, Long; HS = Hedging, Short; SL = Speculating, Long; SS = Speculating, Short aThe data reflect average positions in the first calendar quarter of 2006 and 2008, respectively.
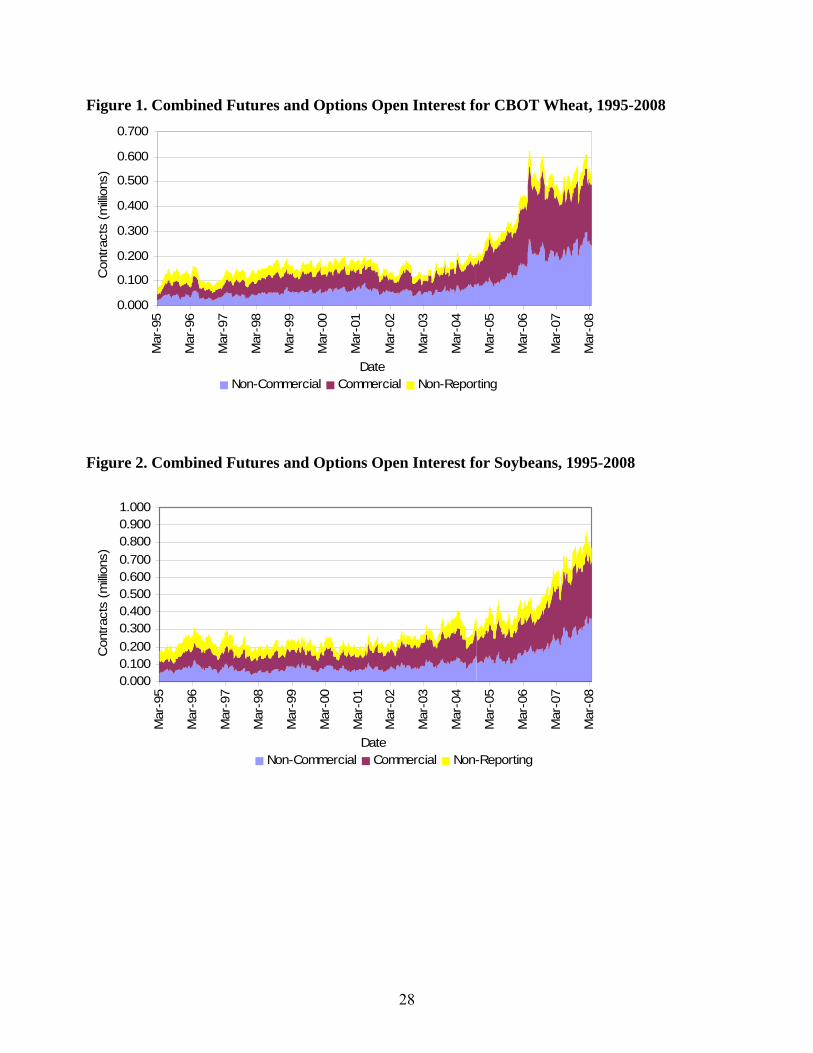
28
Figure 1. Combined Futures and Options Open Interest for CBOT Wheat, 1995-2008
0.000
0.100
0.200
0.300
0.400
0.500
0.600
0.700
Mar
-95
Mar
-96
Mar
-97
Mar
-98
Mar
-99
Mar
-00
Mar
-01
Mar
-02
Mar
-03
Mar
-04
Mar
-05
Mar
-06
Mar
-07
Mar
-08
Date
Con
tract
s (m
illion
s)
Non-Commercial Commercial Non-Reporting
Figure 2. Combined Futures and Options Open Interest for Soybeans, 1995-2008
0.0000.1000.2000.3000.4000.5000.6000.7000.8000.9001.000
Mar
-95
Mar
-96
Mar
-97
Mar
-98
Mar
-99
Mar
-00
Mar
-01
Mar
-02
Mar
-03
Mar
-04
Mar
-05
Mar
-06
Mar
-07
Mar
-08
Date
Con
tract
s (m
illion
s)
Non-Commercial Commercial Non-Reporting
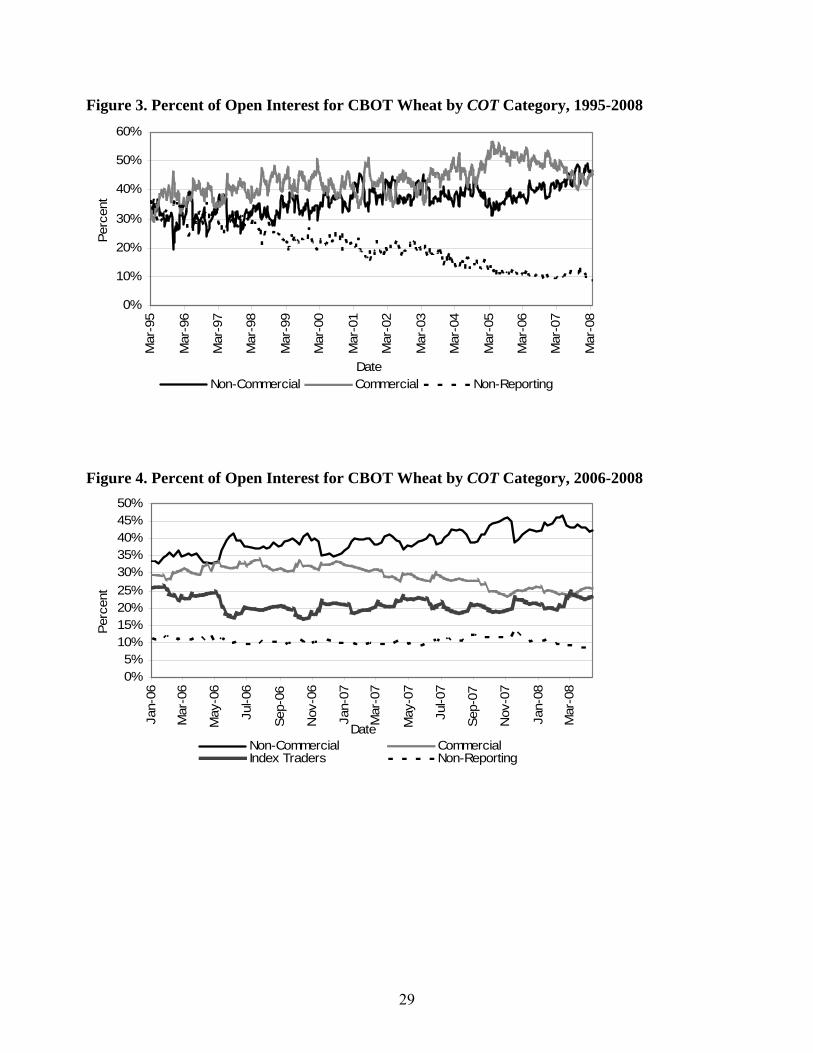
29
Figure 3. Percent of Open Interest for CBOT Wheat by COT Category, 1995-2008
0%
10%
20%
30%
40%
50%
60%M
ar-9
5
Mar
-96
Mar
-97
Mar
-98
Mar
-99
Mar
-00
Mar
-01
Mar
-02
Mar
-03
Mar
-04
Mar
-05
Mar
-06
Mar
-07
Mar
-08
Date
Perc
ent
Non-Commercial Commercial Non-Reporting
Figure 4. Percent of Open Interest for CBOT Wheat by COT Category, 2006-2008
0%5%
10%15%20%25%30%35%40%45%50%
Jan-
06
Mar
-06
May
-06
Jul-0
6
Sep-
06
Nov
-06
Jan-
07
Mar
-07
May
-07
Jul-0
7
Sep-
07
Nov
-07
Jan-
08
Mar
-08
Date
Perc
ent
Non-Commercial CommercialIndex Traders Non-Reporting
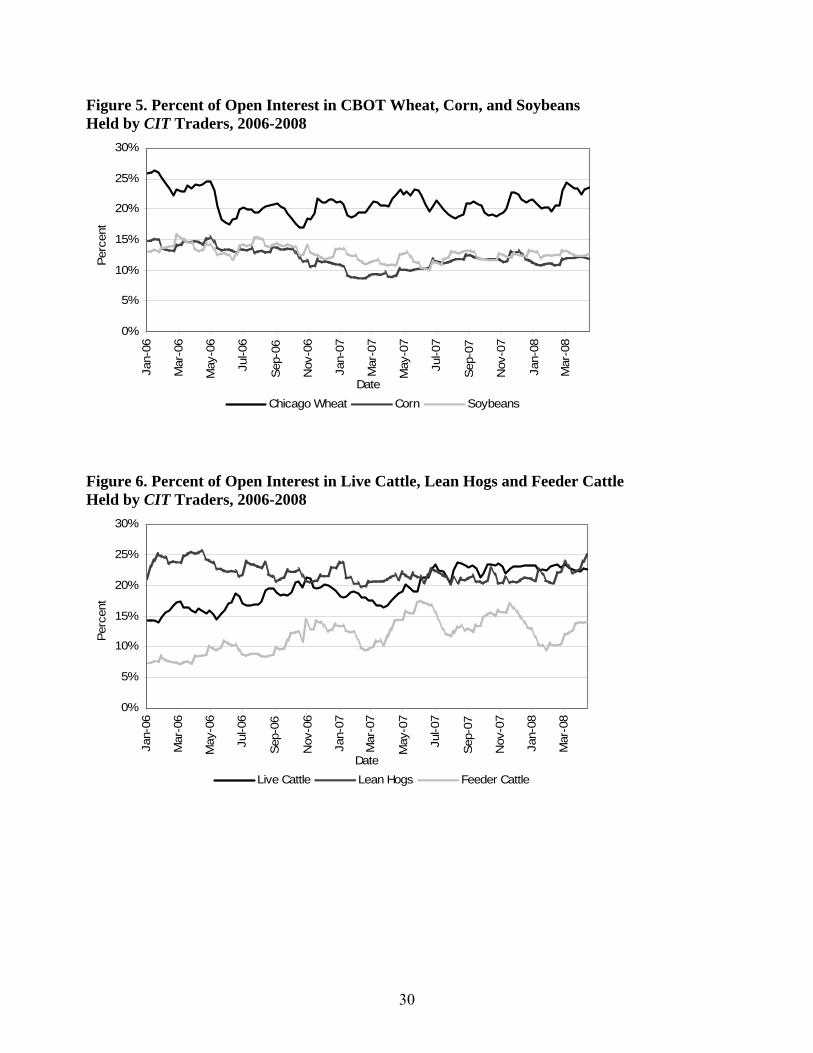
30
Figure 5. Percent of Open Interest in CBOT Wheat, Corn, and Soybeans Held by CIT Traders, 2006-2008
0%
5%
10%
15%
20%
25%
30%Ja
n-06
Mar
-06
May
-06
Jul-0
6
Sep-
06
Nov
-06
Jan-
07
Mar
-07
May
-07
Jul-0
7
Sep-
07
Nov
-07
Jan-
08
Mar
-08
Date
Perc
ent
Chicago Wheat Corn Soybeans
Figure 6. Percent of Open Interest in Live Cattle, Lean Hogs and Feeder Cattle Held by CIT Traders, 2006-2008
0%
5%
10%
15%
20%
25%
30%
Jan-
06
Mar
-06
May
-06
Jul-0
6
Sep-
06
Nov
-06
Jan-
07
Mar
-07
May
-07
Jul-0
7
Sep-
07
Nov
-07
Jan-
08
Mar
-08
Date
Perc
ent
Live Cattle Lean Hogs Feeder Cattle
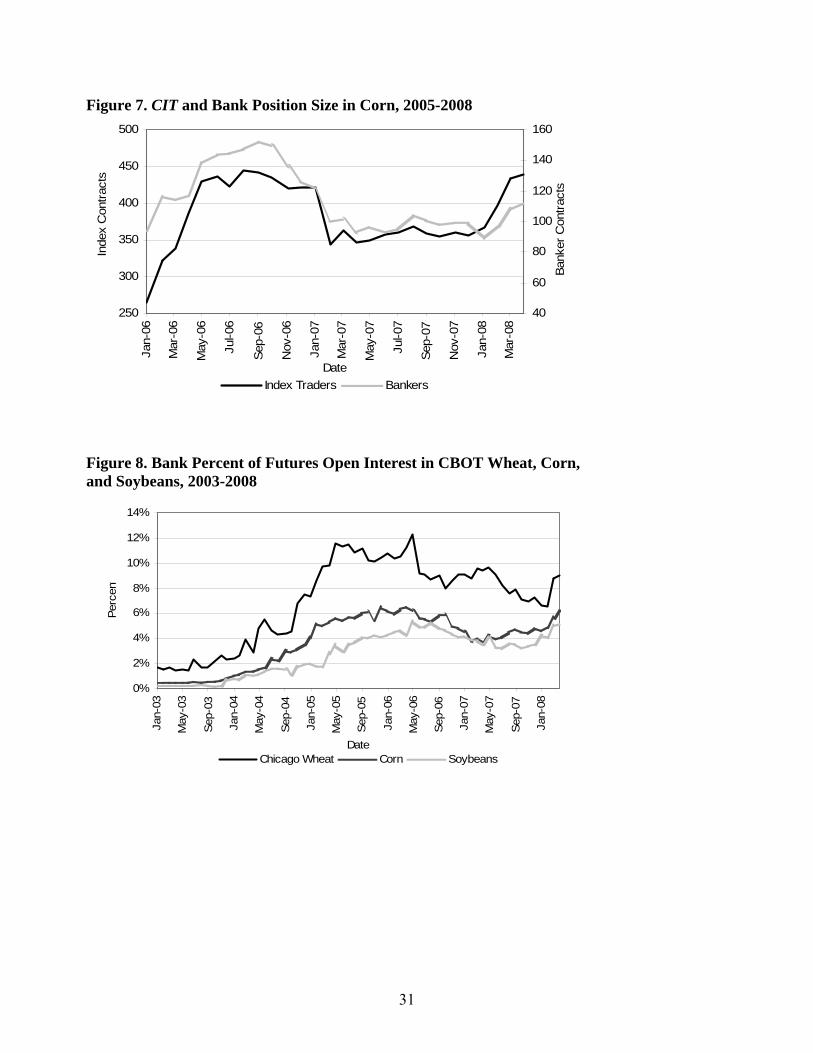
31
Figure 7. CIT and Bank Position Size in Corn, 2005-2008
250
300
350
400
450
500Ja
n-06
Mar
-06
May
-06
Jul-0
6
Sep-
06
Nov
-06
Jan-
07
Mar
-07
May
-07
Jul-0
7
Sep-
07
Nov
-07
Jan-
08
Mar
-08
Date
Inde
x C
ontra
cts
40
60
80
100
120
140
160
Bank
er C
ontra
cts
Index Traders Bankers
Figure 8. Bank Percent of Futures Open Interest in CBOT Wheat, Corn, and Soybeans, 2003-2008
0%
2%
4%
6%
8%
10%
12%
14%
Jan-
03
May
-03
Sep-
03
Jan-
04
May
-04
Sep-
04
Jan-
05
May
-05
Sep-
05
Jan-
06
May
-06
Sep-
06
Jan-
07
May
-07
Sep-
07
Jan-
08
Date
Perc
ent
Chicago Wheat Corn Soybeans
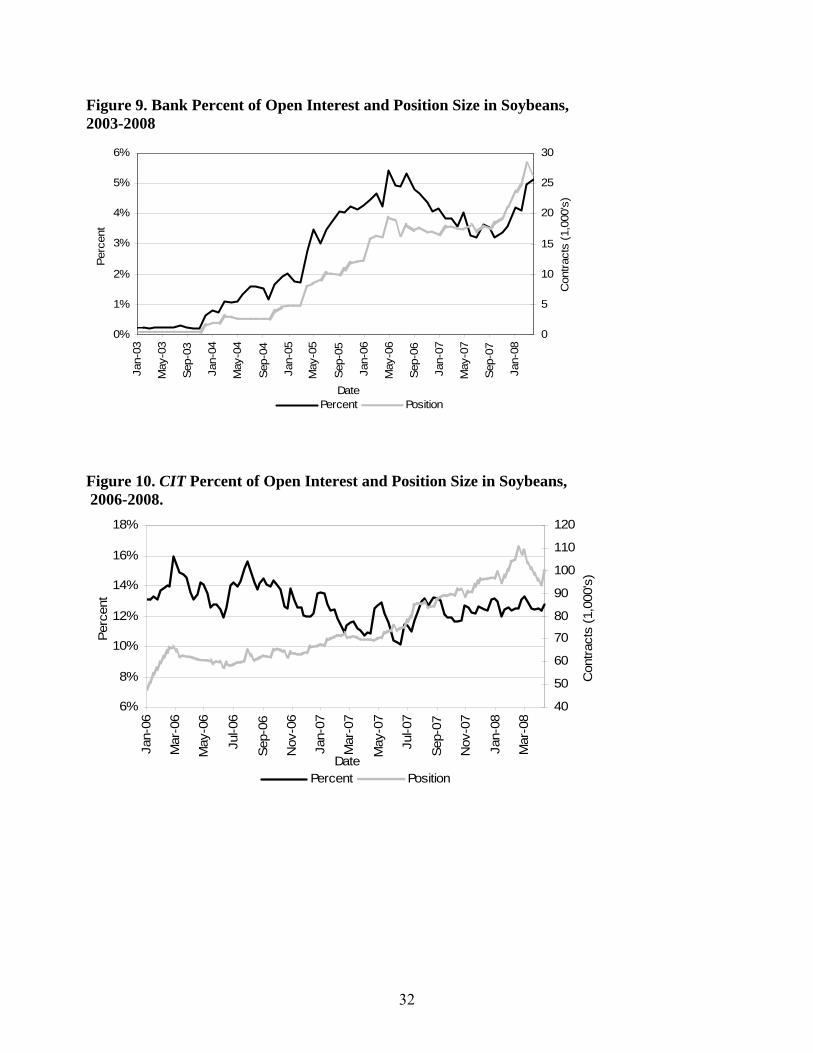
32
Figure 9. Bank Percent of Open Interest and Position Size in Soybeans, 2003-2008
0%
1%
2%
3%
4%
5%
6%Ja
n-03
May
-03
Sep-
03
Jan-
04
May
-04
Sep-
04
Jan-
05
May
-05
Sep-
05
Jan-
06
May
-06
Sep-
06
Jan-
07
May
-07
Sep-
07
Jan-
08
Date
Perc
ent
0
5
10
15
20
25
30
Con
tract
s (1
,000
's)
Percent Position
Figure 10. CIT Percent of Open Interest and Position Size in Soybeans, 2006-2008.
6%
8%
10%
12%
14%
16%
18%
Jan-
06
Mar
-06
May
-06
Jul-0
6
Sep-
06
Nov
-06
Jan-
07
Mar
-07
May
-07
Jul-0
7
Sep-
07
Nov
-07
Jan-
08
Mar
-08
Date
Perc
ent
40
50
60
70
80
90
100
110
120
Con
tract
s (1
,000
's)
Percent Position
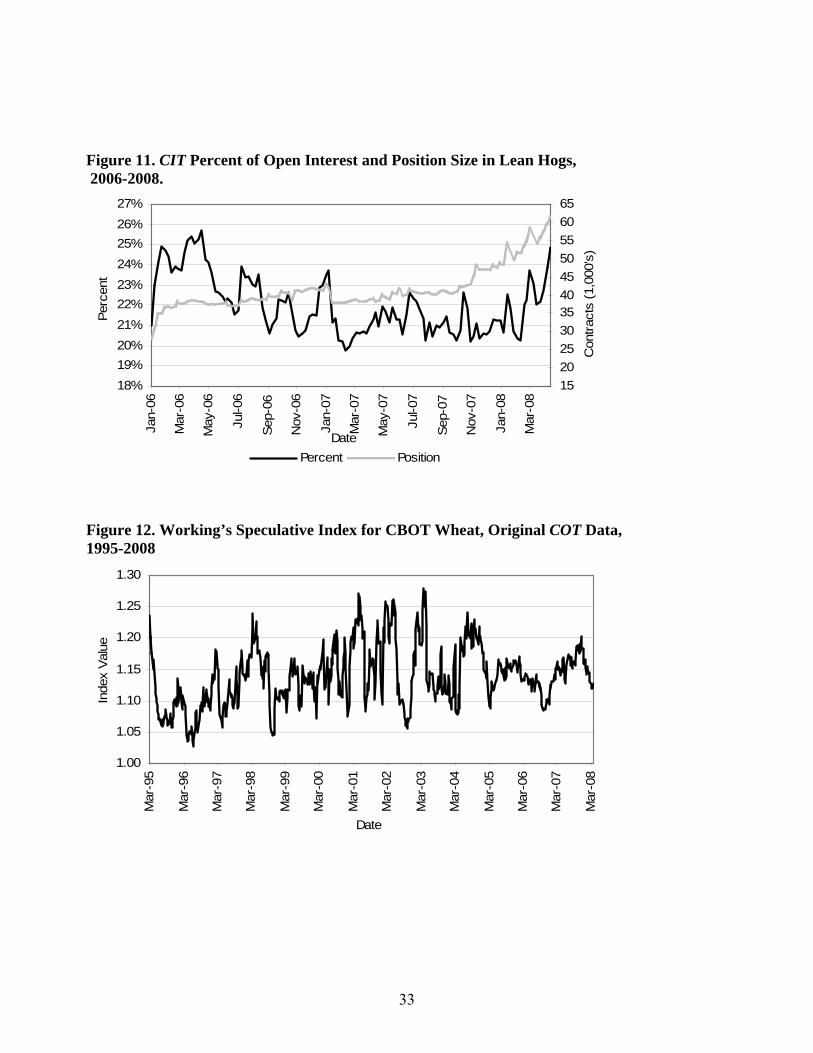
33
Figure 11. CIT Percent of Open Interest and Position Size in Lean Hogs, 2006-2008.
18%19%20%21%22%23%24%25%26%27%
Jan-
06
Mar
-06
May
-06
Jul-0
6
Sep-
06
Nov
-06
Jan-
07
Mar
-07
May
-07
Jul-0
7
Sep-
07
Nov
-07
Jan-
08
Mar
-08
Date
Perc
ent
1520253035404550556065
Con
tract
s (1
,000
's)
Percent Position
Figure 12. Working’s Speculative Index for CBOT Wheat, Original COT Data, 1995-2008
1.00
1.05
1.10
1.15
1.20
1.25
1.30
Mar
-95
Mar
-96
Mar
-97
Mar
-98
Mar
-99
Mar
-00
Mar
-01
Mar
-02
Mar
-03
Mar
-04
Mar
-05
Mar
-06
Mar
-07
Mar
-08
Date
Inde
x Va
lue

34
Figure 13. Short Hedging, Long Speculation, and Working’s T Based on CIT Adjusted Positions in Soybeans, 2006-2008.
0.000
0.100
0.200
0.300
0.400
0.500
0.600Ja
n-06
Mar
-06
May
-06
Jul-0
6
Sep-
06
Nov
-06
Jan-
07
Mar
-07
May
-07
Jul-0
7
Sep-
07
Nov
-07
Jan-
08
Mar
-08
Date
Con
tract
s (m
illion
s)
1.00
1.10
1.20
1.30
1.40
1.50
1.60
Inde
x
HS SL "T" Index
Figure 14. Percent Change (return) in Agricultural Futures Prices, 2006-2008.
-80%
-60%
-40%
-20%
0%
20%
40%
60%
80%
100%
Cor
n
Soyb
eans
Soyb
ean
Oil
CBO
T W
heat
KCBT
Whe
at
Cot
ton
Live
Cat
tle
Feed
er C
attle
Lean
Hog
s
Ret
urn
(%)
Note: The returns are the cumulative Tuesday-to-Tuesday log-relative price changes for the nearby futures contracts for the weeks ending January 3, 2006 to April 15, 2008. Price changes and returns are adjusted for contract roll over.