the added value of biomarker analysis to the genesis of
TRANSCRIPT

SOIL, 2, 299–310, 2016www.soil-journal.net/2/299/2016/doi:10.5194/soil-2-299-2016© Author(s) 2016. CC Attribution 3.0 License.
SOIL
The added value of biomarker analysis to the genesis ofplaggic Anthrosols; the identification of stable fillings
used for the production of plaggic manure
Jan M. van Mourik, Thomas V. Wagner, J. Geert de Boer, and Boris JansenInstitute for Biodiversity and Ecosystem Dynamics, University of Amsterdam, Science Park 904,
1098 XH Amsterdam, the Netherlands
Correspondence to: Jan M. van Mourik ([email protected])
Received: 13 November 2015 – Published in SOIL Discuss.: 15 January 2016Revised: 17 May 2016 – Accepted: 26 May 2016 – Published: 4 July 2016
Abstract. Plaggic Anthrosols are the result of historical forms of land management in cultural landscapes onchemically poor sandy substrates. Application of plaggic manure was responsible for the development of theplaggic horizons of these agricultural soils. Pollen diagrams reflect aspects of the environmental developmentbut the interpretation of the pollen spectra is complicated due to the mix of the aeolian pollen influx of cropspecies and species in the surroundings, and of pollen occurring in the used stable fillings. Pollen diagrams andradiocarbon dates of plaggic Anthrosols suggested a development period of more than a millennium. Callunais present in almost all the pollen spectra, indicating the presence of heath in the landscape during the wholeperiod of soil development. Optically stimulated luminescence dating of the plaggic horizon made clear that thedeposition of plaggic covers started in the 16th century and accelerated in the 18th century. The stable fillings,used for the production of plaggic manure and responsible for the rise of the soil surface, cannot be identifiedwith pollen diagrams alone. Biomarker analyses provide more evidence about the sources of stable fillings. Theoldest biomarker spectra of the plaggic horizons of three typical plaggic Anthrosols examined in this study weredominated by biomarkers of forest species such as Quercus and Betula while the spectra of middle part of theplaggic horizons were dominated by biomarkers of stem tissue of crop species such as Secale and Avena. Onlythe youngest spectra of the plaggic horizons were dominated by biomarkers of Calluna. This indicates that theuse of heath sods as stable filling was most likely introduced very late in the development of the Anthrosols.Before the 19th century the mineral component in plaggic manure cannot be explained by the use of heath sods.We conclude that other sources of materials, containing mineral grains must have been responsible for the raiseof the plaggic horizon.
1 Introduction
Plaggic Anthrosols occur in cultural landscapes, developedon cover sands. These chemical poor Late-glacial aeoliansand deposits dominate the surface geology of an exten-sive area in northwestern Europe. Plaggic Anthrosols are thecharacteristic soils that developed on ancient arable fields,fertilized with plaggic stable manure. Plaggic Anthrosolshave a complex genesis and are valuable records of environ-mental and agricultural history (van Mourik et al., 2011).
In previous paleopedological studies of such soil recordsin The Netherlands (van Mourik et al., 2011, 2012a, b), infor-mation was unlocked by application of pollen analysis, radio-carbon (14C) and optically stimulated luminescence (OSL)dating. Radiocarbon dates of soil organic carbon, extractedfrom humic horizons from plaggic Anthrosols, suggested thestart of sedentary agriculture between 3000 and 2000 BP butare not indicative for the age of the plaggic sediments due tothe complexity of soil organic carbon in plaggic sediments(Mook and Streurman, 1983; van Mourik et al., 1995). Itwas assumed that farmers used organic sods as stable fill-
Published by Copernicus Publications on behalf of the European Geosciences Union.

300 J. M. van Mourik et al.: The added value of biomarker analysis to the genesis of plaggic Anthrosols
ing, firstly dug on forest soils and later on heaths for the pro-duction of stable manure to fertilize the fields. The mineralfraction of the sods was supposed to be responsible for thedevelopment of the plaggic horizon and the raise of the landsurface. OSL dating applied on quartz grains extracted fromplaggic sediments provides more reliable ages of the plaggicsediments. The OSL dates suggested that the rise of the plag-gic horizons started in the 16th century and accelerated in the18th century (Bokhorst et al., 2005). This is rather well in linewith historical data, as presented by Spek (2004, p. 965).
The use of ectorganic matter from forest soils in the Dutchcover sand area must have been strongly reduced in the11–13th century, due to commercial forest clear cuttingsas recorded in archived documents (Vera, 2011). This de-forestation resulted in a regional extension of sand driftingand the managers of the heaths had to protect their valuableecotopes against this “historical environmental catastrophe”(Vera, 2011).
Heaths were already present in the Late Paleolithic land-scape (Doorenbosch, 2013) and played a ceremonial role inthe society of our ancestors. People already had the knowl-edge to manage the heath as sustainable grazing areas forcattle (Doorenbosch, 2013).
The use of heath for sheep grazing and other purposes ashoney and oil production could continue until the middle ofthe 18th century (Vera, 2011). In the southeastern Nether-lands sustainable use of the heaths was promoted by manymanagement rules and laws (van Mourik, 1987; Vera, 2011).Over the course of the 18th century, the population growthresulted in an increasing food demand. In the course of the18th century, the deep stable economy was introduced andthe booming demand for manure resulted in intensificationof manure production. Farmers started with the use of heathsods as (additional) stable filling (Spek, 2004). This causedheath degradation and initiated the second extension of sanddrifting. The use of sods finished at the end of the 19thcentury after the introduction of chemical fertilizers (Spek,2004).
Through the combination of OSL and 14C dating, histor-ical records and the conventional paleoecological proxy offossil pollen analysis we have a good impression of the pale-oecological environment and the age of such deposits. How-ever, it remains problematic to reconstruct the combinationof crop residues and various materials used by farmers as sta-ble filling to produce the stable manure, together responsiblefor the rise of the surface of Anthrosols. This is also hinder-ing a detailed interpretation of the agricultural practices andshifts therein related to the plaggic agriculture system, andspecifically the timing of the onset of the intensive heath soddriven deep stable agriculture with which plaggic Anthrosolsare most commonly associated. To address this issue, in thepresent study we expanded our paleoecological toolset withan adapted application of the recently developed biomarkerapproach (Jansen et al., 2010). This biomarker approach con-sists of a combination of analytical chemical analysis and
modeling with the VERHIB model to unravel concentrationpatterns of higher chain length (C20–C36) n-alkanes of higherplant origin preserved in a soil or sedimentary archive intothe groups of species responsible for their production (Jansenet al., 2010). The approach was originally developed to un-ravel past local vegetation composition. Upon successful ap-plication in a tropical ecosystem setting (Jansen et al., 2013),its applicability in paleopedology was explored (van Mourikand Jansen, 2013). This pilot application concerned a poly-cyclic soil sequence in driftsand deposits. It showed that thecomparison of pollen and biomarker spectra allowed us toindicate the plant species responsible for carbon sequestra-tion in the humic horizons (van Mourik and Jansen, 2013).An important conclusion was that biomarker analysis showedpromise not only in the reconstruction of past local vegeta-tion composition of a specific site, but also in studies wherethe emphasis lies not on the vegetation per se, but rather onreconstructing various sources of soil organic matter input(van Mourik and Jansen, 2013).
The goal of the present study was to further explore theapplicability of biomarker analysis as part of a multi-proxyreconstruction aimed at unraveling the sources of stable fill-ings used for the production of plaggic manure in the contextof the historic development of the plaggic agriculture ecosys-tem. For this, we applied biomarker analysis on three previ-ous investigated plaggic Anthrosol.
2 Materials and methods
2.1 Profile selection
The distribution area of plaggic Anthrosols in northwesternEurope is indicated in Fig. 1. Pape (1972) published the firstmap of the distribution of plaggic agriculture in northwest-ern Europe. Bastiaens and van Mourik (1995) found tracesof intensification and extension of this area in Vlaanderen(Belgium) while van Mourik (1999b) also reported plaggicAnthrosols in Schleswig (Germany). Beside this area with“real” plaggic Anthrosols, Spek (2004, p. 724) summarizedinformation about the occurrence of soils with some evidenceof application of plaggic manure in the Atlantic coastal zonesof Norway, Denmark, France, Galicia, Scotland and Ireland(soil classification according to ISRIC-FAO, 2006).
For this pilot study we selected three previously investi-gated plaggic Anthrosols in the Netherlands with an undis-turbed plaggic horizon: Valenakker, Nabbegat and Posteles(Fig. 2). Pollen diagrams, 14C and OSL dates of these profileswere available and previously published separately in variousarticles. Here we combined these, and re-sampled the plaggichorizons of the profiles for biomarker analysis and new fos-sil pollen analysis to allow for comparison. Vertical samplingresolution was the following: Valenakker 20 cm, Nabbegatand Posteles 10 cm.
Valenakker (van Mourik et al., 2012b) is situated south-west of the city Weert (middle Limburg) on the sport fields of
SOIL, 2, 299–310, 2016 www.soil-journal.net/2/299/2016/

J. M. van Mourik et al.: The added value of biomarker analysis to the genesis of plaggic Anthrosols 301
Figure 1. The location of sampled profiles Valenakker, Nabbegatand Posteles in the distribution area of plaggic agriculture.
Figure 2. The plaggic Anthrosols Valenakker, Nabbegat and Poste-les. The location of the OSL samples are indicated in the whitecircles (depth in cm); the locations of the profiles are indicated inFig. 1.
a former college. As a result, during the 20th century the soilhas never been ploughed or subjected to land consolidation.This profile has never been affected by roots of Zea mays,introduced in The Netherlands in the middle of the 20th cen-tury (van Mourik and Horsten, 1995).
Nabbegat (van Mourik et al., 2012a) is situated onthe Maashorst (eastern North-Brabant). The plaggic de-posits were buried by drift sand around AD 1800. Conse-quently, the plaggic deposits have perfectly been protectedagainst damage by land consolidation or pollution afterwards(van Mourik et al., 2012a). The site is now vegetated by oakand birch trees. Roots of these trees may have caused inputof organic matter by decomposed roots in the upper part ofthe plaggic horizon (Fig. 3).
Posteles (van Mourik et al., 2011) is situated in Twente(eastern Overijssel). The landowner informed us that dur-
Figure 3. Cross-section of a (living) tree root in the thin sectionof the 2 Aan of Nabbegat (70–80 cm). Characteristic is the doublefringing of the root tissue. Such roots were only found in the upperpart of the 2Aan of Nabbegat. Roots of crop species were not foundin the thin sections of the three profiles; they decompose rather fastcompared with tree roots.
ing the last three generations this land was never subjectedto deep ploughing or land consolidation but since 1960 Zeamays was regularly sowed. In contrast to Valenakker andNabbegat we can expect biomarkers of this deep rooting cul-tivated plant.
2.2 Pollen analysis
Pollen diagrams of plaggic Anthrosols provide paleoecolog-ical information about plant species, present on site and inthe region during the formation of the plaggic horizon. Pre-vious research showed that pollen grains, infiltrated in soilsand incorporated in plaggic deposits, are well preserved inthe anaerobic and acid microenvironment of excremental ag-gregates (van Mourik, 1999a, 2001) (Figs. 4, 5).
Samples for pollen extraction were collected in 10 mLtubes in profile pits. For a correct matching of pollen andbiomarker spectra of the plaggic deposits, the same sampleswere treated for both pollen and biomarker extraction andanalysis. The pollen extractions were carried out using thetufa extraction method (Moore et al., 1991, p. 50). For theidentification of pollen grains, the pollen key of Moore etal. (1991, p. 83–166) was applied. Pollen scores were basedon the total pollen sum of arboreal and non-arboreal plantspecies. For the estimation of the pollen concentrations ofthe various soil horizons, the exotic marker grain method wasapplied (Moore et al., 1991, p. 53).
2.3 14C and OSL dating
The determination of the age of plaggic deposits is sub-jected to various complications (Spek, 2004). Pollen strati-
www.soil-journal.net/2/299/2016/ SOIL, 2, 299–310, 2016

302 J. M. van Mourik et al.: The added value of biomarker analysis to the genesis of plaggic Anthrosols
Figure 4. Distribution pattern of organic aggregates in a thin sec-tion of the Aan of Valenakker (40–50 cm). In the fabric of the ag-gregates are charcoal particles visible.
fication is disturbed by bioturbation and ploughing. Besides,the pollen content is a mix of the regular pollen influx andpollen in stable fillings, used for the production of stablemanure (van Mourik et al., 2011). The ages of humic hori-zons of buried Podzols cannot be correctly determined by14C dating due to the complex composition of soil organiccarbon (van Mourik et al., 1995). During a period of activesoil formation, hard decomposable organic carbon can ac-cumulate in the Ah horizon, especially in the humin frac-tion but also in the humic acid fraction. The accumulation ofcharcoal fragments in the organic aggregates is especially re-sponsible for the overestimation of the 14C ages (Fig. 4). Dur-ing the Early Holocene small amounts of charcoal fragmentswere released after (natural) forest fires, but the amount in-creased drastically in the iron time due to the charcoal pro-duction for the melting of iron from placic horizons and ironstone (Beukenkamp and Sevink, 2005). The age of the hu-mic acid fraction was considered the best estimate of the mo-ment of fossilization of the Ah horizon after burying by drift-sand. The difference between humin and humic acids ageswas interpreted as a measure for the period of soil activityand humin accumulation. Later, OSL dating confirmed thatradiocarbon dates, not only of the humin fraction but alsoof the humic acids, overestimate the true ages (Bokhorst etal., 2005).
Conventional radiocarbon dating of humin and humicacids showed in presented diagrams, extracted from plaggicdeposits, was performed in the CIO (Centre for Isotope Re-search of the University of Groningen).
OSL dates provide reliable information about the momentof fossilization of plaggic material under the rising furrowbecause the quartz grain were perfectly bleached during ac-tive ploughing (Bokhorst et al., 2005). OSL dating of quartzgrains, extracted from plaggic deposits, was performed in theNCL (Netherland Centre for Luminesce Dating, WageningenUniversity).
Figure 5. Pollen grains, visible in a welded aggregate of thesame thin sections. Pollen grains in thin sections are observable asopaque, empty spheroidal objects. The palynological characteristicsas sculpture and aperture are not visible without the chemical treat-ments during pollen extraction.
2.4 Biomarker analysis
2.4.1 The application of the VERHIB model
A detailed description of the biomarker approach using theVERHIB method is presented in our previous publications(Jansen et al., 2010, 2013; van Mourik and Jansen, 2013).Briefly, the basis of the method lies in the unraveling ofthe preserved concentration patterns of C20–C36 n-alkanes,which are exclusive to the epicuticular wax layers on leavesand roots of higher plants (Kolattukudy et al., 1976). Whilesuch an application in itself is not new (e.g. Pancost etal., 2002; Hughen et al., 2004) the novelty of our approachlies in the application of the VERHIB model that we specifi-cally developed to unravel the mixed n-alkane signal encoun-tered in soil or sedimentary archives (Jansen et al., 2010).The VERHIB model consists of a linear regression modelthat describes how a certain input of plant-derived com-pounds such as n-alkanes over time in a certain archive at acertain location, results in accumulation of these compounds.An inversion of the forward model is used to reconstructthe accumulation encountered with depth into its most likelyvegetation origin (Jansen et al., 2010). An important aspectof biomarker analysis using VERHIB is that it is an indirectreconstruction. While the biomarker patterns, in the presentstudy the n-alkanes, are directly measured, the reconstruc-tion into the most likely combination of vegetation biomassinput responsible for the observed pattern is inferred by themodel. For this, several parameters must be inputted into themodel (Jansen et al., 2010), the most important of which isthe selection of the expected plant species that have been re-sponsible for the input of biomass in the archive in question,and subsequent inclusion of their n-alkane signature in theVERHIB reference base. In the present study, the selectionof species to include was based on the (expected) crop his-
SOIL, 2, 299–310, 2016 www.soil-journal.net/2/299/2016/

J. M. van Mourik et al.: The added value of biomarker analysis to the genesis of plaggic Anthrosols 303
tory of the sites under study, as well as the anticipated originof the stable fillings used as manure. An important matterof debate when using n-alkane patterns to reconstruct pastvegetation input is the genotypic plasticity of the n-alkanepatterns, in particular in relation to prevailing environmentalfactors such as climate (e.g. Shepherd and Griffiths, 2006). Ina previous study focusing on vegetation of relevance for re-constructions in ecosystems in North-Western Europe whereplaggic agriculture occurred, we found that while genotypicplasticity related to climatic factors may influence the sig-nal, such influence does not eradicate the different vegeta-tion origins (Kirkels et al., 2013). To limit external influencesas much as possible, the vegetation selected for inclusion inthe VERHIB reference base was sampled in close vicinityto the three study sites as much as possible. The first groupof selected plant species concerned the main sources of sta-ble fillings, used for the manure production: fermented litterfrom deciduous forest soils (Quercus robur, Betula pendula),grass sods from brook valleys (Molinia caerulea) and heathsods (Calluna vulgaris).
The second group concerned crop species. Close to theeducational Field Study Centre Orvelte (Drenthe) is a tradi-tional plaggic field where they continued with the cultivationof traditional crop species. There we sampled Fagopyrum es-culentum, Spergula arvensis, Avena sativa, Secale cereal andSpergula arvensis. The modern crop species Zea mays cornwas sampled on the Posteles.
The concentration patterns of the n-alkanes with carbonnumbers 20–36 in the selected vegetation samples and in thesoil samples were subsequently used as input for the VER-HIB model (see Sect. 2.3.2 for a description of the extractionand analysis of the biomarkers).
A second parameter that must be considered in the applica-tion of VERHIB is input of leaf and root material. VERHIBconsiders the species-specific n-alkane patterns in plant rootsseparately from the patterns in plant leaves, and uses this todeal with the input of young root material at depth (Jansen etal., 2010). A first selection criterion here concerns whether ornot leaf and root material can be expected to have entered thesoil at all. For the deciduous forest soil material potentiallyused as stable fillings (Quercus robur, Betula pendula), ex-clusively leaf-derived biomass input is expected as the treesdid not grow on-site. In contrast, for the crop species ZeaMays and Spergula Arvensis only root material is expected tohave entered the soil in appreciable amounts as the leaf ma-terial is mostly removed during harvest. For the other speciesconsidered, both leaf and root material must be taken into ac-count. A selection of root- and/or leaf-derived n-alkane pat-terns to be considered in the VERHIB reference base wasmade in accordance with the previous considerations. Withrespect to the ratio of input of leaf vs. root biomass as re-quired by the model, no exact information is available for thesoil profile under study. Therefore, for those species whereboth leaf and root material is considered to have possiblyentered the soil, in line with the exploratory nature of the
present study, we applied an assumed leaf/root biomass in-put ratio of 1.0 and assumed that while input of leaf materialalways occurred at the top of the soil profile, root input alsooccurred with depth. Since our pilot study in polycyclic drift-sand deposits showed that VERHIB was unable to filter outroot input sufficiently (van Mourik and Jansen, 2013), wheninterpreting the occurrence of a certain species with depth inthe profiles under study as modeled by VERHIB, the pos-sibility of young root input being responsible for the signalwas explicitly taken into account.
Figure 6 shows a flow diagram that illustrates the func-tioning of the VERHIB modeling as well as the selection ofparameters and reference base species as described above.
2.4.2 Extraction and analysis of the biomarkers
Approximately 0.1 g of each of the freeze-dried and groundvegetation and soil samples was extracted by accelerated sol-vent extraction (ASE) using a Dionex 200 ASE extractor. Theextraction temperature was 75 ◦C and the extraction pres-sure 17× 106 Pa, employing a heating phase of 5 min and astatic extraction time of 20 min. Dichloromethane/methanol(DCM / MeOH) (93 : 7 v/v) was used as the extractant(Jansen et al., 2006). The extracts were subsequently frac-tionated into three fractions containing the n-alkanes, the es-ters and the combination of alcohols and fatty acids respec-tively. For this, a silica column consisting of extracted cot-ton wool and silica gel was used, followed by elution withhexane, hexane / DCM (4 : 1) and DCM / Methanol (9 : 1)respectively. Separation of the n-alkanes took place by on-column injection of 1.0 µL of the first fraction on a 30 mRtx-5Sil MS column (Restek) with an internal diameter of0.25 mm and film thickness of 0.1 µm, using He as a car-rier gas. Temperature programming was 50 ◦C (hold 2 min);40 ◦Cmin−1 to 80 ◦C (hold 2 min); 20 ◦Cmin−1 to 130 ◦C;4 ◦Cmin−1 to 350 ◦C (hold 10 min). Subsequent MS detec-tion in full scan mode used a mass-to-charge ratio (m/z)of 50–650 with a cycle time of 0.65 s and followed elec-tron impact ionization (70 eV). The n-alkanes were identifiedfrom the total ion current (TIC) signal by their mass spectra(dominant fragment ion represented by m/z= 57) and reten-tion times and quantified using a deuterated internal standard(d42-n-C20 alkane (Jansen et al., 2010) as well as a conven-tional external n-alkane standard.
Figure 7 presents the n-alkane biomarker distribution inthe leaves and/or roots of the species, inserted in the ref-erence base. The results show the odd-over-even chain-length predominance typical of higher plants (Kolattukudyet al., 1976). The observed variation in patterns and concen-trations is in line with the variation found in other species inprevious work (e.g. Jansen et al., 2006).
www.soil-journal.net/2/299/2016/ SOIL, 2, 299–310, 2016

304 J. M. van Mourik et al.: The added value of biomarker analysis to the genesis of plaggic Anthrosols
Figure 6. Flow diagram of the methodology of biomarker analysis.
Figure 7. The n-alkane biomarker distribution in leaves and/or roots of species sampled, for the reference base of this pilot study.
3 The vertical distribution of biomarkers and pollenin the analyzed profiles
3.1 Profile Valenakker
Profile Valenakker is a plaggic Anthrosol (Aan), overlying aploughed umbric Podzol (2ABp, 2Bs). The pollen diagram(Fig. 8) and the absolute dates (Table 1) reflect a soil devel-opment of ≈ 1400 years.
The post sedimentary pollen spectra in the 2BS showpercentages of tree species as Corylus and Quercus of theMiddle sub-Atlantic. The presence of Poaceae, Cyperaceae,
Rumex and Ranunculaceae reflects a period of pasture. Thehigh scores of Cerealia in ploughed 2ABp and even the 2Bindicate a form of sedentary agriculture before the start ofplaggic agriculture. 14C dating indicate a carbon age of thebase (60 cm) of the Aan horizon of ≈AD 600. The OSL ageof the lower part of the plaggic horizon is 800–900 yearsyounger, ≈AD 1560.
Micromorphological observations (Figs. 4, 5) of the plag-gic deposits show the complexity of soil organic matter.There are various sources of organic carbon as plant roots,tissue of table fillings and sods. Also the composition of
SOIL, 2, 299–310, 2016 www.soil-journal.net/2/299/2016/
J. M. van Mourik et al.: The added value of biomarker analysis to the genesis of plaggic Anthrosols 305
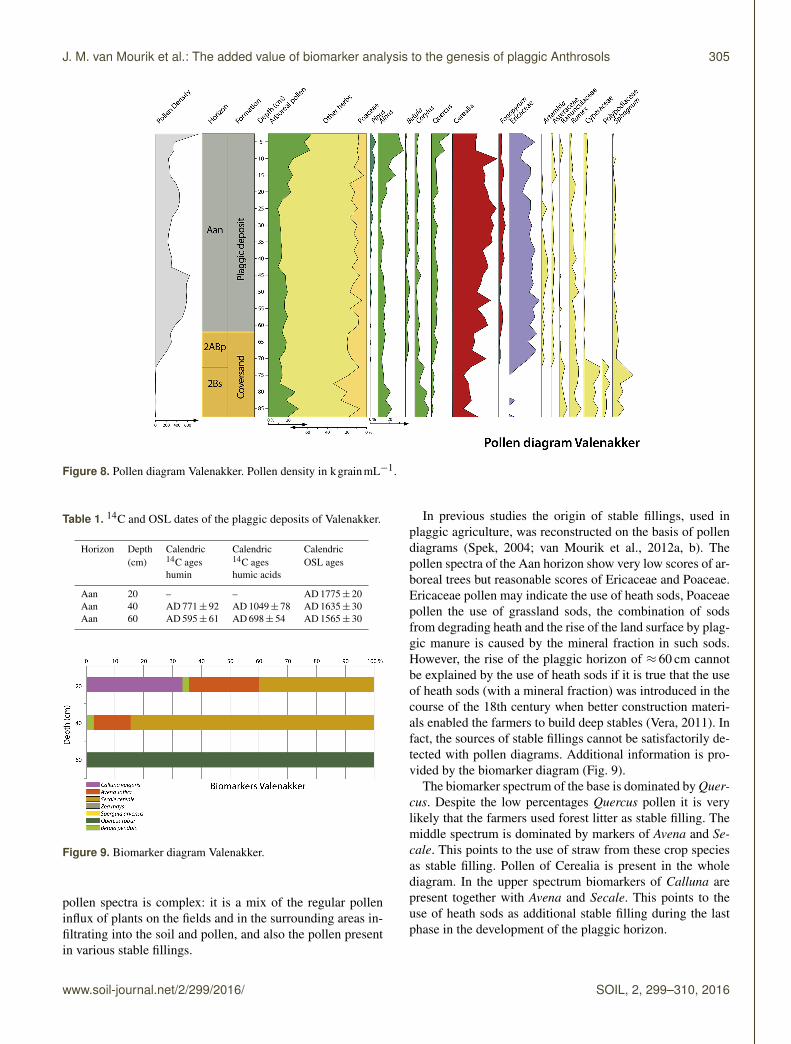
Figure 8. Pollen diagram Valenakker. Pollen density in kgrainmL−1.
Table 1. 14C and OSL dates of the plaggic deposits of Valenakker.
Horizon Depth Calendric Calendric Calendric(cm) 14C ages 14C ages OSL ages
humin humic acids
Aan 20 – – AD 1775± 20Aan 40 AD 771± 92 AD 1049± 78 AD 1635± 30Aan 60 AD 595± 61 AD 698± 54 AD 1565± 30
Figure 9. Biomarker diagram Valenakker.
pollen spectra is complex: it is a mix of the regular polleninflux of plants on the fields and in the surrounding areas in-filtrating into the soil and pollen, and also the pollen presentin various stable fillings.
In previous studies the origin of stable fillings, used inplaggic agriculture, was reconstructed on the basis of pollendiagrams (Spek, 2004; van Mourik et al., 2012a, b). Thepollen spectra of the Aan horizon show very low scores of ar-boreal trees but reasonable scores of Ericaceae and Poaceae.Ericaceae pollen may indicate the use of heath sods, Poaceaepollen the use of grassland sods, the combination of sodsfrom degrading heath and the rise of the land surface by plag-gic manure is caused by the mineral fraction in such sods.However, the rise of the plaggic horizon of ≈ 60 cm cannotbe explained by the use of heath sods if it is true that the useof heath sods (with a mineral fraction) was introduced in thecourse of the 18th century when better construction materi-als enabled the farmers to build deep stables (Vera, 2011). Infact, the sources of stable fillings cannot be satisfactorily de-tected with pollen diagrams. Additional information is pro-vided by the biomarker diagram (Fig. 9).
The biomarker spectrum of the base is dominated by Quer-cus. Despite the low percentages Quercus pollen it is verylikely that the farmers used forest litter as stable filling. Themiddle spectrum is dominated by markers of Avena and Se-cale. This points to the use of straw from these crop speciesas stable filling. Pollen of Cerealia is present in the wholediagram. In the upper spectrum biomarkers of Calluna arepresent together with Avena and Secale. This points to theuse of heath sods as additional stable filling during the lastphase in the development of the plaggic horizon.
www.soil-journal.net/2/299/2016/ SOIL, 2, 299–310, 2016
306 J. M. van Mourik et al.: The added value of biomarker analysis to the genesis of plaggic Anthrosols
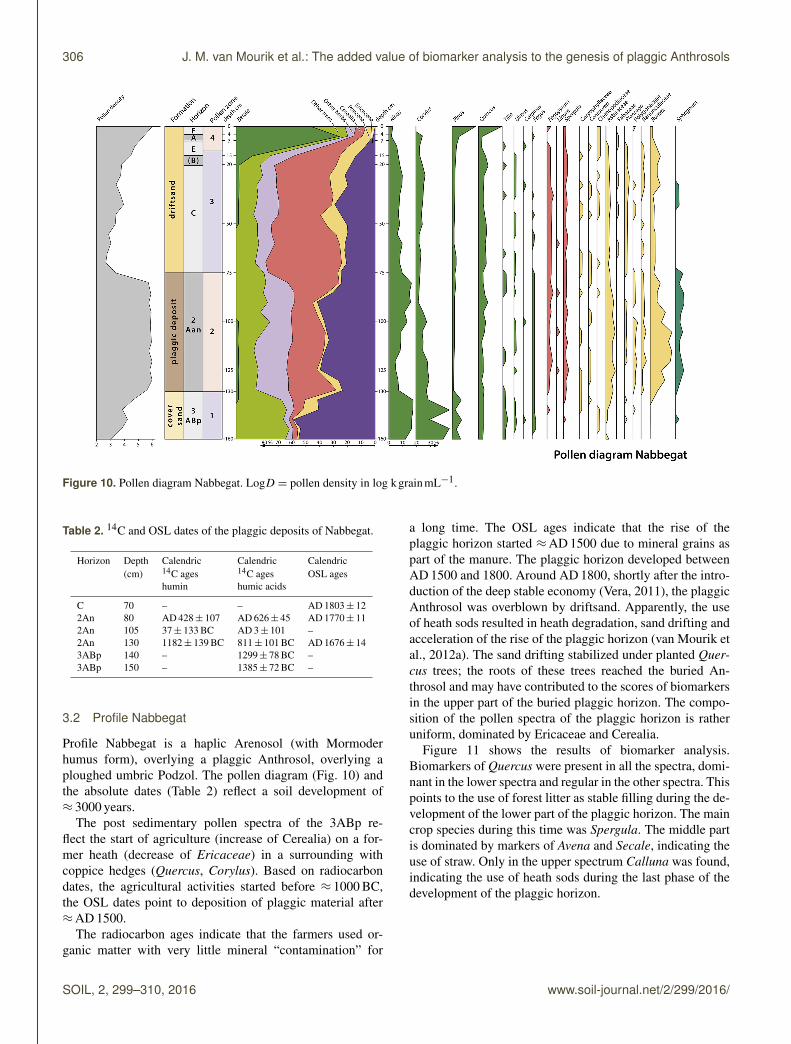
Figure 10. Pollen diagram Nabbegat. LogD = pollen density in log kgrainmL−1.
Table 2. 14C and OSL dates of the plaggic deposits of Nabbegat.
Horizon Depth Calendric Calendric Calendric(cm) 14C ages 14C ages OSL ages
humin humic acids
C 70 – – AD 1803± 122An 80 AD 428± 107 AD 626± 45 AD 1770± 112An 105 37± 133 BC AD 3± 101 –2An 130 1182± 139 BC 811± 101 BC AD 1676± 143ABp 140 – 1299± 78 BC –3ABp 150 – 1385± 72 BC –
3.2 Profile Nabbegat
Profile Nabbegat is a haplic Arenosol (with Mormoderhumus form), overlying a plaggic Anthrosol, overlying aploughed umbric Podzol. The pollen diagram (Fig. 10) andthe absolute dates (Table 2) reflect a soil development of≈ 3000 years.
The post sedimentary pollen spectra of the 3ABp re-flect the start of agriculture (increase of Cerealia) on a for-mer heath (decrease of Ericaceae) in a surrounding withcoppice hedges (Quercus, Corylus). Based on radiocarbondates, the agricultural activities started before ≈ 1000 BC,the OSL dates point to deposition of plaggic material after≈AD 1500.
The radiocarbon ages indicate that the farmers used or-ganic matter with very little mineral “contamination” for
a long time. The OSL ages indicate that the rise of theplaggic horizon started ≈AD 1500 due to mineral grains aspart of the manure. The plaggic horizon developed betweenAD 1500 and 1800. Around AD 1800, shortly after the intro-duction of the deep stable economy (Vera, 2011), the plaggicAnthrosol was overblown by driftsand. Apparently, the useof heath sods resulted in heath degradation, sand drifting andacceleration of the rise of the plaggic horizon (van Mourik etal., 2012a). The sand drifting stabilized under planted Quer-cus trees; the roots of these trees reached the buried An-throsol and may have contributed to the scores of biomarkersin the upper part of the buried plaggic horizon. The compo-sition of the pollen spectra of the plaggic horizon is ratheruniform, dominated by Ericaceae and Cerealia.
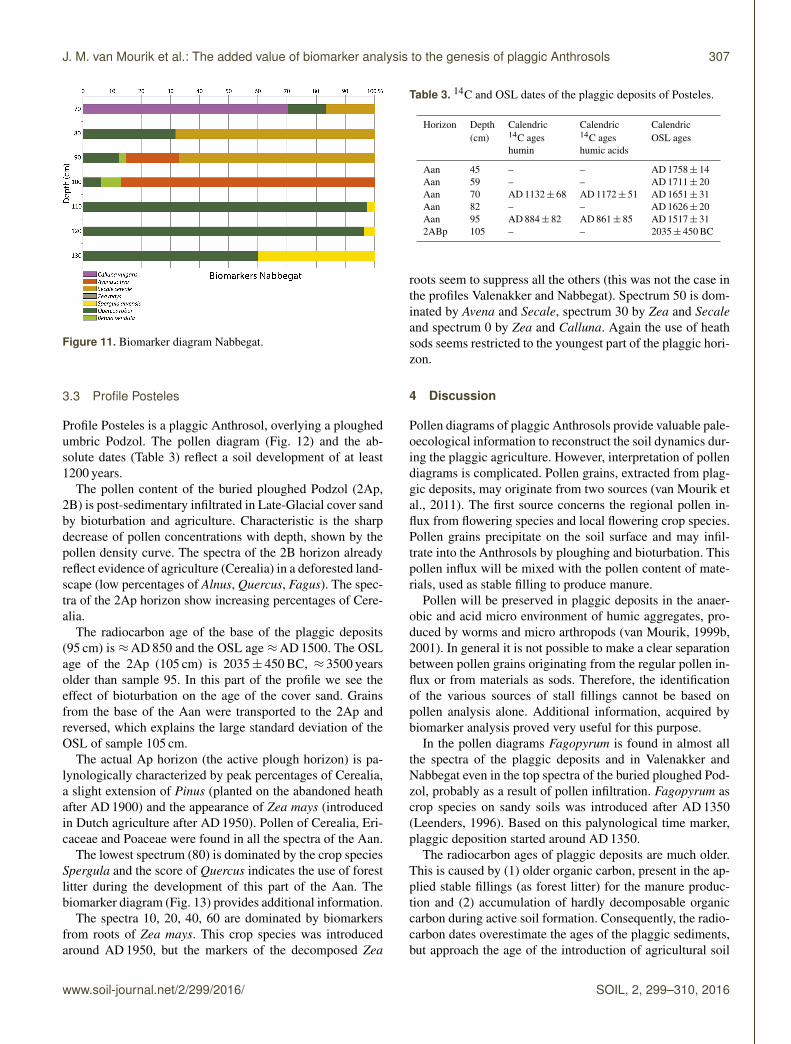
Figure 11 shows the results of biomarker analysis.Biomarkers of Quercus were present in all the spectra, domi-nant in the lower spectra and regular in the other spectra. Thispoints to the use of forest litter as stable filling during the de-velopment of the lower part of the plaggic horizon. The maincrop species during this time was Spergula. The middle partis dominated by markers of Avena and Secale, indicating theuse of straw. Only in the upper spectrum Calluna was found,indicating the use of heath sods during the last phase of thedevelopment of the plaggic horizon.
SOIL, 2, 299–310, 2016 www.soil-journal.net/2/299/2016/
J. M. van Mourik et al.: The added value of biomarker analysis to the genesis of plaggic Anthrosols 307
Figure 11. Biomarker diagram Nabbegat.
3.3 Profile Posteles
Profile Posteles is a plaggic Anthrosol, overlying a ploughedumbric Podzol. The pollen diagram (Fig. 12) and the ab-solute dates (Table 3) reflect a soil development of at least1200 years.
The pollen content of the buried ploughed Podzol (2Ap,2B) is post-sedimentary infiltrated in Late-Glacial cover sandby bioturbation and agriculture. Characteristic is the sharpdecrease of pollen concentrations with depth, shown by thepollen density curve. The spectra of the 2B horizon alreadyreflect evidence of agriculture (Cerealia) in a deforested land-scape (low percentages of Alnus, Quercus, Fagus). The spec-tra of the 2Ap horizon show increasing percentages of Cere-alia.
The radiocarbon age of the base of the plaggic deposits(95 cm) is ≈AD 850 and the OSL age ≈AD 1500. The OSLage of the 2Ap (105 cm) is 2035± 450 BC, ≈ 3500 yearsolder than sample 95. In this part of the profile we see theeffect of bioturbation on the age of the cover sand. Grainsfrom the base of the Aan were transported to the 2Ap andreversed, which explains the large standard deviation of theOSL of sample 105 cm.
The actual Ap horizon (the active plough horizon) is pa-lynologically characterized by peak percentages of Cerealia,a slight extension of Pinus (planted on the abandoned heathafter AD 1900) and the appearance of Zea mays (introducedin Dutch agriculture after AD 1950). Pollen of Cerealia, Eri-caceae and Poaceae were found in all the spectra of the Aan.
The lowest spectrum (80) is dominated by the crop speciesSpergula and the score of Quercus indicates the use of forestlitter during the development of this part of the Aan. Thebiomarker diagram (Fig. 13) provides additional information.
The spectra 10, 20, 40, 60 are dominated by biomarkersfrom roots of Zea mays. This crop species was introducedaround AD 1950, but the markers of the decomposed Zea
Table 3. 14C and OSL dates of the plaggic deposits of Posteles.
Horizon Depth Calendric Calendric Calendric(cm) 14C ages 14C ages OSL ages
humin humic acids
Aan 45 – – AD 1758± 14Aan 59 – – AD 1711± 20Aan 70 AD 1132± 68 AD 1172± 51 AD 1651± 31Aan 82 – – AD 1626± 20Aan 95 AD 884± 82 AD 861± 85 AD 1517± 312ABp 105 – – 2035± 450 BC
roots seem to suppress all the others (this was not the case inthe profiles Valenakker and Nabbegat). Spectrum 50 is dom-inated by Avena and Secale, spectrum 30 by Zea and Secaleand spectrum 0 by Zea and Calluna. Again the use of heathsods seems restricted to the youngest part of the plaggic hori-zon.
4 Discussion
Pollen diagrams of plaggic Anthrosols provide valuable pale-oecological information to reconstruct the soil dynamics dur-ing the plaggic agriculture. However, interpretation of pollendiagrams is complicated. Pollen grains, extracted from plag-gic deposits, may originate from two sources (van Mourik etal., 2011). The first source concerns the regional pollen in-flux from flowering species and local flowering crop species.Pollen grains precipitate on the soil surface and may infil-trate into the Anthrosols by ploughing and bioturbation. Thispollen influx will be mixed with the pollen content of mate-rials, used as stable filling to produce manure.
Pollen will be preserved in plaggic deposits in the anaer-obic and acid micro environment of humic aggregates, pro-duced by worms and micro arthropods (van Mourik, 1999b,2001). In general it is not possible to make a clear separationbetween pollen grains originating from the regular pollen in-flux or from materials as sods. Therefore, the identificationof the various sources of stall fillings cannot be based onpollen analysis alone. Additional information, acquired bybiomarker analysis proved very useful for this purpose.
In the pollen diagrams Fagopyrum is found in almost allthe spectra of the plaggic deposits and in Valenakker andNabbegat even in the top spectra of the buried ploughed Pod-zol, probably as a result of pollen infiltration. Fagopyrum ascrop species on sandy soils was introduced after AD 1350(Leenders, 1996). Based on this palynological time marker,plaggic deposition started around AD 1350.
The radiocarbon ages of plaggic deposits are much older.This is caused by (1) older organic carbon, present in the ap-plied stable fillings (as forest litter) for the manure produc-tion and (2) accumulation of hardly decomposable organiccarbon during active soil formation. Consequently, the radio-carbon dates overestimate the ages of the plaggic sediments,but approach the age of the introduction of agricultural soil
www.soil-journal.net/2/299/2016/ SOIL, 2, 299–310, 2016

308 J. M. van Mourik et al.: The added value of biomarker analysis to the genesis of plaggic Anthrosols
Figure 12. Pollen diagram Posteles; pollen density in kgrainmL−1.
management (van Mourik et al., 1995, 2011, 2012a, b). Ma-nuring of infertile soils already came in use in the BronzeAge and also the Celtic fields are an example of a prehistori-cal agricultural system based on manure management (Spek,2004).
The mineral component of stable manure, applied on thefields, was responsible for the thickening of the plaggic hori-zon. Ploughing of the furrow will bleach the OSL signal ofthe mineral grains until the moment that the grains are nolonger part of the active soil furrow. For that reason, OSL dat-ing of the plaggic horizon provides reliable ages of the plag-gic deposits (Bockhorst et al., 2005). The OSL dates of theprofiles Valenakker, Nabbegat and Posteles indicate a start ofthe thickening ≈AD 1550.
It was not possible to determine the sources of stable fill-ings palynologically. Possible stable fillings were forest lit-ter, sods from moist grass lands and heat sods. But in almostall spectra of the pollen diagrams Ericaceae, Poaceae and ar-boreal pollen occur. Biomarkers extracted from plaggic de-posits originate from two sources. The first source concernsbiomarkers from decomposed roots of crop species, the sec-ond source of organic material as straw and sods, used asstable filling for manure production.
In the three diagrams we find Quercus as the dominantmarker in the lowest part of the Aan horizon, indicating theuse of forest litter. In Nabbegat, Quercus markers can alsooriginate from roots of the planted Quercus forest after thestabilization of the sand drifting. This is not the case on Vale-nakker and Posteles. The middle part of the Aan horizon isdominated by markers of Avena and Secale, indicating theuse of straw as stable filling.
Figure 13. Biomarker diagram Posteles.
Only in the top of the Aan horizon markers of Callunaare present, indicating the use of heath sods as stable filling.Based on the results of the biomarker analysis we can con-clude that heaths sods were used as stable filling only in the18th and 19th century. This fits with the observations aboutthe use of heaths in historical archives (Vera, 2011).
So the question rises about heath management before theintroduction of the deep stable economy. Some researcherspoint to careful heath management before the 19th century.In interviews with farmers born before 1950, Burny (1999)collected essential information about historical heaths man-agement in the Belgian Kempen. A historical study of landuse in the Campina also indicated careful maintenance and
SOIL, 2, 299–310, 2016 www.soil-journal.net/2/299/2016/

J. M. van Mourik et al.: The added value of biomarker analysis to the genesis of plaggic Anthrosols 309
sustainable use of valuable common fields (de Keyzer, 2014).Before the 19th century, heath sods were never dug on the dryCalluna heath, only on the moist Erica heath. These organicsods were not used as stable filling but as fuel for the furnace.Burning of Calluna heaths was the most important manage-ment action to rejuvenate the heath. Juvenile heath is foodfor cows. Sods digging was a bad action due to the resistanceand incoherence of these dry sods and also the long recoveryperiod. Mowing of older Calluna shrubs took place. Twigswere used for roofs, burning and brooms (Burny, 1999). Be-cause of the very low nutrient contribution to the manure ofmowed Calluna, the farmers preferred the use of twigs ofbroom (Genista). When in the course of the 18th century theauthority relationships changed and the population growthand the demand for food increased, farmers started to inten-sify their production (Vera, 2011). They needed more manureand started with the deep stable economy and the use of Cal-luna heath sods.
An important factor may be the presence of pollen andbiomarkers in sheep droppings. According to Simpson etal. (1999) biomarkers survive the congestion process and stayin the manure. But what do sheep consume? Grazing sheepare very selective in collecting food (Oom et al., 2008; Smitsand Noordijk, 2013). They prefer grasses (Molinia, Festucaand Corynephorous). Only in years when there is insuffi-cient grass available at the end of the summer do they eatshoots of Calluna, which at that time was nourishing withhigh concentrations Ca, Mg and K but no P. Only in pollenspectra from sheep droppings, collected during the summerseason, Calluna pollen is present. During the flowering sea-son of Calluna, the animals consume pollen, precipitated onthe grasses. That explains the presence of Calluna pollen andthe absence of Calluna biomarkers in the lower parts of theplaggic horizons.
If it is true that Calluna heath sods were dug only in the18th and 19th century, how can we explain the mineral com-ponent in the plaggic manure, responsible for the rise of theland surface before that time?
According to Smits and Noordijk (2013) there are severalsources of minerals. Firstly, a small amount of mineral grainswill be incorporated in the manure during emptying out ofthe manure of the stable. Secondly, farmers had the knowl-edge that the addition of sand could improve the fertility ofthe soil. Not the leached and acid sand from heath sods butnot leached sand, dug on sheep walks and in blown out de-pressions in nearby drift sand landscapes.
5 Conclusions
– The vertical zoning of biomarkers and pollen in plag-gic horizons are different. Palynologically, the plaggichorizon is a homogenous, the biomarker diagrams showdifferentiation.
– We can identify various stable fillings used based on thevertical distribution of biomarkers.
– The biomarker spectra of the base layer of the plaggichorizon are dominated by biomarkers of deciduous treeslitter (dominated by Quercus), indicating the use of or-ganic matter from the forest floor.
– The biomarker spectra of the middle part of the plaggicdeposits are dominated by crop species (Avena, Secale),indicating the use of straw from these species as stablefilling during a relatively long time.
– Only the top spectra of the plaggic horizons are domi-nated by Calluna, indicating that heath sods were usedas stable filling only during the last phase in the devel-opment of the plaggic horizon.
– Profile Posteles shows the impact of the contributionof biomarkers of roots of Zea mays, introduced aroundAD 1950, suppressing the other species.
– The negligible percentages of Calluna in biomarkerspectra of plaggic deposits with the exception of the top,suggest an overestimating of the use of heath sods inthe traditional interpretation of the genesis of plaggichorizons, the dominance of crop species in biomarkerspectra of plaggic deposits suggests underestimating ofthe use of straw as source material for the production oforganic stable manure to fertilize ancient arable fields.
Acknowledgements. We would like to thank Jap Smits (StateForestry) for his information about historical heath managementand agriculture. We are grateful to Annemarie Philip (IBED, Uni-versity of Amsterdam) for the preparation of the pollen slides, Hansvan der Plicht (CIO, University Groningen) for production of theradiocarbon dates and Jakob Wallinga (NCL, Wageningen Univer-sity) for the realization of the OSL dates. The digital illustrationswere produced by Jan van Arkel (IBED, University of Amsterdam).
We thank Jakob Wallinga and an anonymous reviewer for theirconstructive remarks.
Edited by: S. Kluiving
References
Bastiaens, J. and van Mourik, J. M.: Bodemsporen van beddenbouwin het zuidelijk deel van het plaggenlandbouw areaal, HistorischGeografisch Tijdschrift, 1995, 81–90, 1995.
Beukenkamp, P. C. and Sevink, J.: Natuur en landschap, in: DeHoge Veluwe, natuur en kunst, Stichting nationaal park De HogeVeluwe en Wanders Uitgeverij, Zwolle, 40–96, 2005.
Bokhorst, M. P., Duller, G. A. T., and van Mourik, J. M.: Opti-cally Stimulated Luminescence Dating of a fimic anthrosol inthe Southern Netherlands, J. Archaeol. Sci., 32, 547–553, 2005.
www.soil-journal.net/2/299/2016/ SOIL, 2, 299–310, 2016

310 J. M. van Mourik et al.: The added value of biomarker analysis to the genesis of plaggic Anthrosols
Burny, J.: Bijdrage tot de historische ecologie van de LimburgseKempen (1910–1950), Natuurhistorisch Genootschap in Lim-burg XLII(1), Maastricht, 1999.
de Keyzer, M.: The common denominator; the survival of the com-mons in the late medieval Campine area, University Antwerpen,Department of History, Belgium, 2014.
Doorenbosch, M.: Ancestral heaths; reconstructing the barrow land-scape in the central and southern Netherlands, Sidestone Press,Leiden, 2013.
Hughen, K. A., Eglinton, T. I., Xu, L., and Makou, M.: Abrupt trop-ical vegetation response to rapid climate changes, Science, 304,1955–1959, 2004.
ISRIC-FAO: World Reference Base for Soil Recourses 2006, WorldSoil Resources Reports 103, FAO, Rome, 2006.
Jansen, B., Nierop, K. G. J., Hageman, J. A., Cleef, A. M., andVerstraten, J. M.: The straight-chain lipid biomarker composi-tion of plant species responsible for the dominant biomass pro-duction along two altitudinal transects in the Ecuadorian Andes,Org. Geochem., 37, 1514–1536, 2006.
Jansen, B., Van Loon, E. E., Hooghiemstra, H., and Verstraten,J. M.: Improved reconstruction of palaeo-environments throughunravelling of preserved vegetation biomarker patterns, Palaeo-geogr. Palaeocl., 285, 119–130, 2010.
Jansen, B., de Boer, E. J., Cleef, A. M., Hooghiemstra, H., Moscol-Olivera, M., Tonneijck, F. H., and Verstraten, J. M.: Reconstruc-tion of Late Holocene forest dynamics in northern Ecuador frombiomarkers and pollen in soil cores, Palaeogeogr. Palaeocl., 386,606–619, 2013.
Kirkels, F. M. S. A., Jansen, B., and Kalbitz, K.: Consistency ofplant-specific n-alkane patterns in plaggen ecosystems: A review,The Holocene, 23, 1355–1368, 2013.
Kolattukudy, P. E., Croteau, R., and Buckner, J. S.: Biochemistry ofplant waxes, in: Chemistry and biochemistry of natural waxes,edited by: Kolattukudy, P. E., Elsevier, Amsterdam, 1976.
Leenders, K. A. H. W.: De boekweitcultuur in historisch perspec-tief, Geografisch Tijdschrift, 21, 213–227, 1996.
Mook, W. G. and Streurman, H. J.: Physical and chemical aspects ofradiocarbon dating, First Symposium on 14C and Archaeology,Groningen, PACT, 8, 31–55, 1983.
Moore, P. D., Webb, J. A., and Collinson, M. E.: Pollen analyses,Blackwell Scientific Publications, Oxford, 1991.
Oom, S. P., Sibbald, A. M., Hester, A. J., Miller, D. R., and Legg,C. J.: Impacts of sheep grazing a complex vegetation mosaic:Relating behavior to vegetation change, Agr. Ecosyst. Environ.,124, 219–228, 2008.
Pancost, R. D., Baas, M., van Geel, B., and Damsté, J. S. S.:Biomarkers as proxies for plant inputs to peats: an example froma sub-boreal ombrotrophic bog, Org. Geochem., 33, 675–690,2002.
Pape, J. C.: Oude bouwlandgronden in Nederland, Boor en Spade,18, 85–115, 1972.
Shepherd, T. and Griffiths, D. W.: The effects of stress on plantcuticular waxes, New Phytol., 171, 469–499, 2006.
Simpson, I. A., van Bergen, P. F., Perret, V., Elhmmali, M. M.,David, J., Roberts, D. J., and Richard, R. P.: Lipid biomarkers ofmanuring practice in relict anthropogenic soils, The Holocene, 9,223–229, 1999.
Smits, J. and Noordijk, J.: Heidebeheer: Moderne Methoden in eenEeuwenoud Landschap, KNNV uitgeverij, 2013.
Spek, T.: Het Drentse esdorpenlandschap. Een historisch-geografische studie, Matrijs, Utrecht, 2, part VI, 725–967, 2004.
van Mourik, J. M.: Het stuifzand van Heeswijk-Dinther, Ge-ografisch Tijdschrift, XXI, 327–337, 1987.
van Mourik, J. M.: The use of micromorphology in soil pollen anal-ysis, Catena, 35, 239–257, 1999a.
van Mourik, J. M.: Spuren von Plaggenlandbau im Gebiet derSchleswiger Landenge, Offa, 47, 169–176, 1999b.
van Mourik, J. M.: Pollen and spores, preservation in ecological set-tings, in: Palaeobiology II, edited by: Briggs, E. G. and Crowther,P. R., Blackwell Science, 315–318, 2001.
van Mourik, J. M. and Horsten, F.: De paleogeografie van de Vale-nakker, Weerter Jaarboek, 10, 105–118, 1995.
van Mourik, J. M. and Jansen, B.: The added value of biomarkeranalysis in palaeopedology; reconstruction of the vegetation dur-ing stable periods in a polycyclic driftsand sequence in SE-Netherlands, Quatern. Int., 306, 14–23, 2013.
van Mourik, J. M., Wartenbergh, P. E., Mook, W. J., and Streurman,H. J.: Radiocarbon dating of palaeosols in eolian sands, Med-edelingen Rijks Geologische Dienst, 52, 425–439, 1995.
van Mourik, J. M., Slotboom, R. T., and Wallinga, J.: Chronologyof plaggic deposits; palynology, radiocarbon and optically stim-ulated luminescence dating of the Posteles (NE-Netherlands),Catena, 84, 54–60, 2011.
van Mourik, J. M., Seijmonsbergen, A. C., Slotboom, R. T., andWallinga, J.: The impact of human land use on soils andlandforms in cultural landscapes on aeolian sandy substrates(Maashorst, SE Netherlands), Quatern. Int., 265, 74–89, 2012a.
van Mourik, J. M., Seijmonsbergen, A. C., and Jansen, B.:Geochronology of Soils and Landforms in Cultural Landscapeson Aeolian Sandy Substrates, Based on Radiocarbon and Opti-cally Stimulated Luminescence Dating (Weert, SE-Netherlands),InTech, Radiometric Dating, 75–114, 2012b.
Vera, H.: . . . Dat men het goed van den ongeboornen niet magverkoopen, Gemene gronden in de Meierij van Den Bosch tussenhertog en hertgang 1000–2000, Uitgeverij BOXpress, Oisterwijk,Netherlands, 2011 (with English summary).
SOIL, 2, 299–310, 2016 www.soil-journal.net/2/299/2016/