the acoustics of performance spaces (theatres and stadiums ... · the acoustics of performance...
TRANSCRIPT

Seediscussions,stats,andauthorprofilesforthispublicationat:http://www.researchgate.net/publication/235974821
Theacousticsofperformancespaces(theatresandstadiums):acasestudy
CONFERENCEPAPER·APRIL2012
DOWNLOADS
244
VIEWS
136
4AUTHORS:
MagdalenaBöck
gfaitechGmbH
8PUBLICATIONS4CITATIONS
SEEPROFILE
FabioBisegna
SapienzaUniversityofRome
46PUBLICATIONS160CITATIONS
SEEPROFILE
GunnarHeilmann
gfaitechGmbH
28PUBLICATIONS59CITATIONS
SEEPROFILE
MojtabaNavvab
UniversityofMichigan
90PUBLICATIONS183CITATIONS
SEEPROFILE
Availablefrom:MagdalenaBöck
Retrievedon:20August2015

The acoustics of performance spaces (theatres andstadiums): a case study
M. Boecka, F. Bisegnab, G. Heilmanna and M. Navvabc
agfai tech GmbH, Volmerstraße 3, 12489 Berlin-Adlershof, GermanybDept. DIAEE, Faculty of Engineering, SAPIENZA University of Rome, Via Eudossiana, 18,
00184 Rome, ItalycTaubman College of Architecture and Urban Planning, The University of Michigan, 2000
Bonisteel Boulevard, Ann Arbor, MI 48109-2069, [email protected]

Beamforming is an excellent approach to acquire the acoustic signature of rooms and buildings, superimposing acoustic images on 3D models to create informative 3D acoustic maps. These measurements give information on various factors such as sound propagation, reflective and absorptive surfaces, leakages, sound bridges, reverberation time and many more. While simulations serve to merely predict the acoustic behavior of performance spaces, measurements at the real site allow for verification of these simulations by acquiring the true acoustic signature of these spaces. Such on-site measurements have been carried out at the Michigan Stadium, US as well as the Coliseum and the Ancient Ostia in Rome, Italy. This practical paper aims to present measurements carried out on theatres and stadiums and the results thereof showing the applicability of beamforming systems to this end.
1 Introduction Acoustics play a large role when we look at
ancient as well as modern performance spaces. The audience expects a listening experience of highest quality, no matter if the performance watched is a sporting event or of musical kind.
To achieve the required acoustic performance for any given space designers have to take into consideration an array of factors such as: size of the space, building materials used, desired sound levels, intended purpose of the space, absorption, reflection, reverberation time, distance of the listeners to the source, power of the source.
To evaluate long existing or newly built spaces, several approaches are available. The three-dimensional beamforming method is certainly the most comprehensive way to review acoustic performance. The use of microphone arrays (Acoustic Cameras) in acoustic measurement technology has increased over the years and todays advanced computing capacities allow the transition from two-dimensional acoustic maps to complex three-dimensional acoustic models.
Figure 1: 3D-microphone array with 120 spherically distributed microphones for three-dimensional
acoustic analysis.
This paper shows the possibilities offered by using three-dimensional microphone arrays for purposes of acoustic performance evaluation in praxis.
2 Acoustic Camera 2.1 2D & 3D noise localization
Delay-and-Sum-Beamforming systems produce acoustic maps making them a tool that enables users to quickly localize sound sources. Detailed information on this beamforming method can be found in reference [1].
Conventional beamforming systems, among them the Acoustic Camera, calculate the run times between microphone array and measurement object, assuming a rectangular virtual image plane. If this image plane is subdivided into rows and columns, a finite amount of rectangular display details (pixels) is the result. The centers of these pixels are used to calculate the delays. But if sound sources that are placed on a three-dimensional object surface are localized and mapped onto a two-dimensional image plane two errors occur: The first is that the focus of the beamformer is incorrect for most pixels. This is due to the fact that dependent on array geometry, subsurface structure, frequencies of the sound source and distance between array and object the calculated level of sound pressure differs from the level calculated with correct focus. Secondly, by mapping the (incorrect) calculated sound sources on a two dimensional plane distortion of the mapping will occur and sound sources will be localized incorrectly. In most beamforming applications these effects are negligible, but for mapping of large objects like buildings these effects are noticeable.
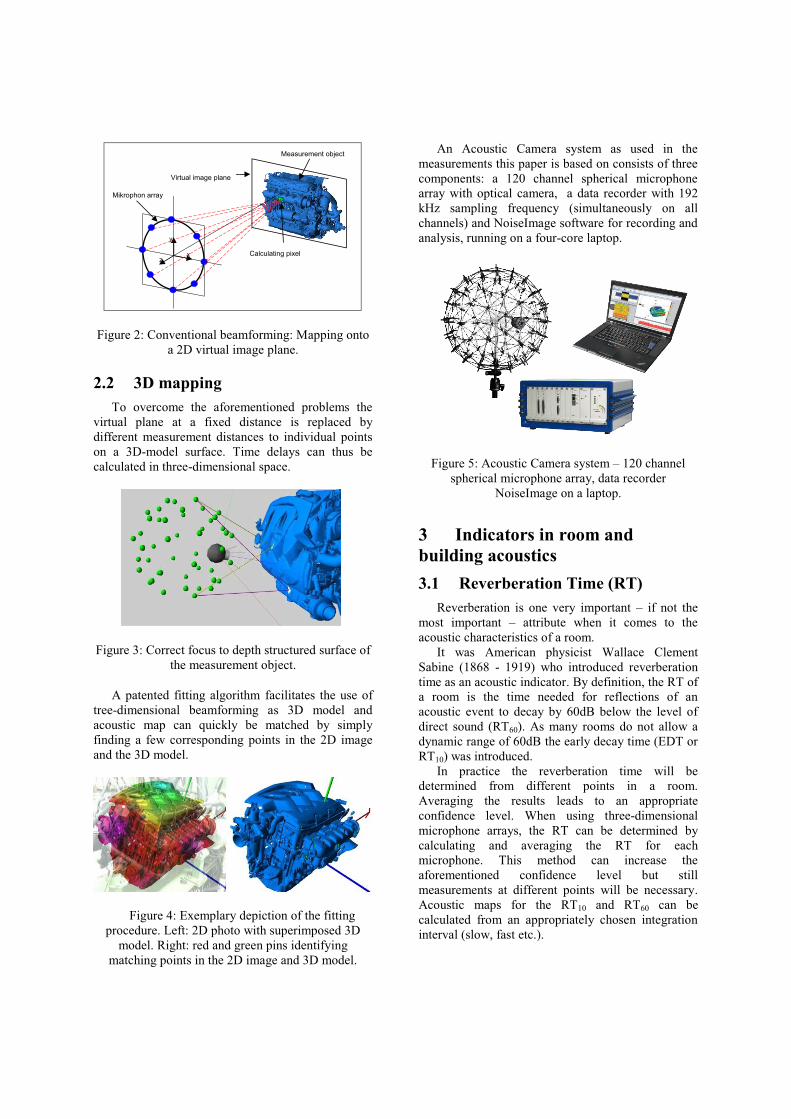
Figure 2: Conventional beamforming: Mapping onto a 2D virtual image plane.
2.2 3D mapping To overcome the aforementioned problems the
virtual plane at a fixed distance is replaced by different measurement distances to individual points on a 3D-model surface. Time delays can thus be calculated in three-dimensional space.
Figure 3: Correct focus to depth structured surface of the measurement object.
A patented fitting algorithm facilitates the use of tree-dimensional beamforming as 3D model and acoustic map can quickly be matched by simply finding a few corresponding points in the 2D image and the 3D model.
Figure 4: Exemplary depiction of the fitting procedure. Left: 2D photo with superimposed 3D
model. Right: red and green pins identifying matching points in the 2D image and 3D model.
An Acoustic Camera system as used in the measurements this paper is based on consists of three components: a 120 channel spherical microphone array with optical camera, a data recorder with 192 kHz sampling frequency (simultaneously on all channels) and NoiseImage software for recording and analysis, running on a four-core laptop.
Figure 5: Acoustic Camera system 120 channel spherical microphone array, data recorder
NoiseImage on a laptop.
3 Indicators in room and building acoustics 3.1 Reverberation Time (RT)
Reverberation is one very important if not the most important attribute when it comes to the acoustic characteristics of a room.
It was American physicist Wallace Clement Sabine (1868 - 1919) who introduced reverberation time as an acoustic indicator. By definition, the RT of a room is the time needed for reflections of an acoustic event to decay by 60dB below the level of direct sound (RT60). As many rooms do not allow a dynamic range of 60dB the early decay time (EDT or RT10) was introduced.
In practice the reverberation time will be determined from different points in a room. Averaging the results leads to an appropriate confidence level. When using three-dimensional microphone arrays, the RT can be determined by calculating and averaging the RT for each microphone. This method can increase the aforementioned confidence level but still measurements at different points will be necessary. Acoustic maps for the RT10 and RT60 can be calculated from an appropriately chosen integration interval (slow, fast etc.).
Measurement object
z
Mikrophon array
y
x
Virtual image plane
Calculating pixel

Figure 6 3D acoustic photo (sound pressure) of a sound studio RT10 (left) and RT60 (right)
3.2 Absorption, Reflection, Diffusion Sound propagation in a closed environment is
influenced by absorption, reflection and diffusion from surfaces depending on their material characteristics. Furthermore, the the wavelength of the sound critically influence these effects. Model-based measurement techniques and methods of computer simulation are available to predict the propagation of sound and the influences of reflections and absorptions for the conceptual design of rooms or halls. The simulation results are complemented by measurement results in the actual environment to find and eliminate possible model errors. That is the way to efficiently enhance room acoustics.
4 Practical application Resulting from participation in interesting
research projects and due to numerous service measurements, gfai tech GmbH has acquired considerable knowledge and expertise in the field of room and building acoustics. The following section will show measurements of ancient as well as modern-day performance spaces carried out using a 120 channel spherical microphone array. As each application was carried out for different reasons the extensive range of application possibilities for acoustic mapping in performance spaces becomes apparent.
4.1 Modern-day performance spaces A close (academic) relationship with the
University of Michigan allowed for a series of measurements in different single and multiple use performance spaces at university facilities in Ann Arbour. The tasks involved evaluation of the efficiency of acoustic treatments in a class room as well as a feasibility study of localizing noise sources within big architectural structures.
The measurements investigating the efficiency of wall treatment with acoustic panels (figure 7) proved satisfying for both, university and panel producer. Analysis with the Acoustic Camera showed that there were hardly any unwanted reflections in the room. This measurement triggered a series of measurements throughout the university to identify rooms in need of such acoustic panels.
Figure 7: Acoustic Camera set-up and acoustic wall panels
Figure 8: Acoustic Photo 3D, left and right side of the room, overall frequency range
A further measurement session with two different noise scenarios was carried out at the Crisler Dome at Michigan University. Two vents were positioned in the two corners of the basketball field. The analysis showed that this noise reaches unexpectedly far into the crowd (seating space). As a possible solution, the vents could be relocated or turned in order to lower the noise directed at the crowd.
Figure 9: Acoustic Photo 3D, two vents, overall frequency range.

The second measurement was that of a crowd animated to cheer. The spectrogram below the acoustic photo depicts the main source on the left and the result shows clearly where people have been the loudest.
Figure 10: Acoustic Photo 3D, cheering crowd, overall frequency range, spectrogram of major noise
source.
The third session saw several measurements in the Michigan Stadium.
The first analysis is showing a sound system test inside an empty stadium. Displaying the data set at different frequencies enables showing how the sound reflects on the opposite sides.
The task of the last session - which was the most challenging one due to its size - was a full stadium at half time of a football game. That meant capturing the noise of 109.432 visitors of an American football game Michigan vs. Minnesota. The expected results were verified: The student section is clearly the number one hot spot in the entire stadium. By introducing a 1 kHz high pass filter, more areas can be distinguished and defined. And the system even allows to listen to single spectators as they cheer for their team.
The discussed measurements were the basis for an evaluation of the effectiveness of planned and ongoing rebuilding of this stadium. Further measurements followed in order to see if an increase of the on-field noise level had been reached as planned. After conducting these measurements it was possible to not only verify that the desired acoustic properties were achieved but to also prove usefulness of the Acoustic Camera for such measurement tasks in room and building acoustics.
Figure 11: Acoustic Photo 3D, overall frequency range (top) and 1 kHz highpass filter (bottom).
4.2 Ancient Theatres An international collaboration by members of the
International Team for Acoustics in Archeology & Cultural Heritage (ITACA) namely Mojtaba Navvab (University of Michigan) and Fabio Bisegna (University of Rome) allowed access to a number of ancient performance spaces in Rome, Italy.
Figure 12: Acoustic Camera set-up in Rome Coliseum.
The acoustic properties of ancient Roman and Greek performance sites are a constant focus of studies, aiming to allow for accurate reconstruction of such ancient theatres while adjusting them to present performance site requirements on one hand and learning more about the acoustic properties of these

unique ancient monuments in general on th eother hand. Through computer simulation it is possible to perform parametric studies on materials used in these ancient spaces and re-create the room acoustics of the times within a virtual environment. requirements for such spaces can interfere with the desire to preserve historic acoustic properties. Historical preservation and introduction of new technologies need to be carefully planned to go hand in hand.
Measured and simulated results showed how scattering and diffraction from seats and architectural elements, which is important in outdoor theatres, affects the quality and condition of sound. These results can serve as guidelines for the restoration of the Rome Coliseum to guarantee preservation of the architectural acoustics of this historic monument.
At the Rome Coliseum, measurements were carried out in different locations throughout the structure. In these days the Coliseum is often used for public performances so the main area of interest was the wooden stage (former fighting arena) that sits atop the dungeons. Different sound sources like actual crowd noise, popping large balloons and producing sweep noise were used to evaluate the acoustic properties of the theatre.
Figure 13: Sound intensity overlay, spectators screaming as part of a request for crowd noise.
5 Conclusion Three-dimensional beamforming has been
successfully employed for acoustic measurements of both modern-day and ancient performance spaces by using the Acoustic Camera. The Acoustic Camera can be used as a tool to assess current room and building acoustics as well as to verify simulated or projected acoustic properties thus enabling acoustic optimization.
Measurements at the University of Michigan proved that the Acoustic Camera can supply relevant information to optimize the acoustic properties of performance sites. Although it has to be seen how the planned restoration for the Coliseum will be carried out it is safe to say that also in this case the Acoustic
Camera provided considerable information about existing acoustic properties.
It has been proven that Acoustic Camera data can be used to achieve acoustic performance excellence.
Acknowledgements Access to the Coliseum was made possible by the
permission of the Ministry of Cultural Heritage, with special thanks to the Superintendent Anna Maria Moretti and the Ministry official representative Rossella Rea. Special thanks to Dr. Prof. Franco Gugliermetti, Fabio Bisegna PhD, Laura Monti, Andrea Carraro, Jonida Bundo, Dept. DIAEE, SAPIENZA University of Rome and Mojtaba Navvab PhD of Taubman College of Architecture and Urban Planning at the University of Michigan.
References [1]
[2]
[3] -
[4]
[5] -
[6]
[7]
[8]