the accounting framework and the · pdf file2 the accounting framework and the estimates the...
TRANSCRIPT
This PDF is a selection from an out-of-print volume from the NationalBureau of Economic Research
Volume Title: The Formation and Stocks of Total Capital
Volume Author/Editor: John W. Kendrick
Volume Publisher: NBER
Volume ISBN: 0-87014-271-2
Volume URL: http://www.nber.org/books/kend76-1
Publication Date: 1976
Chapter Title: The Accounting Framework and the Estimates
Chapter Author: John W. Kendrick
Chapter URL: http://www.nber.org/chapters/c3805
Chapter pages in book: (p. 22 - 64)

2The Accounting Framework and theEstimates
The estimates of total capital formation and stocks in the United States,by sector, presented in this study were made within an economicaccounting framework. Using a systematic framework of economicaccounts ensures consistency with the national income and product andsector income and outlay estimates, and facilitates analyses of invest-ment and stocks in relation to income and product and to the compo-nents of the accounts on a similarly consistent basis. Although it doesnot eliminate errors from the estimates, it reduces the likelihood oferrors because of the double-entry nature of accounts.
Our expansion of the concepts of saving, investment, and wealthbeyond those underlying the official U.S. national income accountsnecessitated our modifying the latter to a considerable extent. Thesemodifications will be described in the first section of this chapter withreference to the set of accounts presented in the tables. The sourcesand methods underlying the capital formation and stock estimatesand price deflators relative to the Appendix B tables are summarizedin the second section.
The Accounting Framework
Our economic accounts involve three major modifications of the U.S.Department of Commerce system. First, the broad concept of invest-ment developed in Chapter 1 requires the expansion of the nationalsaving-investment account and its deconsolidation by major sector.That is, since we include nonbusiness tangible capital formation aswell as the intangible investments of all sectors, investment is no22

THE ACCOUNTING FRAMEWORK AND THE ESTIMATES 23
longer confined largely to the tangible capital formation of the businesssector. Accordingly, capital accoUnts are set up for each sector, and theincome-outlay account of each sector is limited to the current outlays,including rental values of capital used by the nonbusiness sectors butexcluding the formation of capital, which is shifted to the capitalaccounts. By including intangible and human investments in the capitalaccounts we depart from the paradigm of business accounting.Research and development financed by business is typically chargedoff as a current expense. So are the human investments, as for trainingand health. In part, this is done because—to the extent these areembodied in workers and accrue to their benefit—they do not "belong"to the firm and are removed whenever the workers decide to changejobs. But from the broader socioeconomic viewpoint, it is clear that alloutlays that expand monetary or nonmarket income over severalaccounting periods should be capitalized.
Second, the scope of the income and product accounts has to bebroadened to include not only rental values of nonbusiness capital, butalso the imputed portions of capital formation which are charged tocurrent expense or are otherwise not included in the official estimates.
Finally, the capital stock estimates of the Commerce Department,which do not yet cover all sectors and all types of capital, have beenexpanded for our purposes to include all wealth, tangible and intangi-ble, human and nonhuman, resulting from the total investments of allsectors. In order to implement financial analysis, the capital accountscould also be expanded to include flows of funds, and the wealthstatements enlarged into complete balance sheets. We do show a com-bined national balance sheet below in order to demonstrate its relation-ship to the wealth estimates. But since our emphasis is on "real" ratherthan financial analysis, we confine the capital accounts and wealthstatements to productive capital outlays and stock. But the financialflows and levels could easily be added to the capital accounts andbalance sheets, respectively, for those who wish to do so.
Our system is close to the United Nations revised standard systemof national accounts, except that we include, and they exclude, intangi-ble capital formation and stocks. And, with the same exception, it iscloser to the Federal Reserve Board's flow-of-funds accounts than it isto the Commerce Department system, although the Federal ReserveBoard does not yet include public capital formation in the capitalaccount for the governments sector.1
1. For discussions of various systems of economic accounts, see Richard andNancy Ruggles, The Design of Economic Accounts, New York, NB ER, 1970; and JohnW. Kendrick, Economic Accounts and Their Uses, New York, McGraw-Hill Book Co.,1972.
24 FORMATION AND STOCKS OF TOTAL CAPITAL
The main features of the seven basic sets of accounts are reviewedbelow, with detailed notes on the derivation of the various entries inthe tables provided in Appendix A. Contra-entries to each line in theaccounts are indicated in the tables by the table and line numbers inparentheses.
THE PRODUCTION ACCOUNT
Before looking at the sector accounts, it is useful to examine theexpanded national income and product account (Table 2-1) in order toget an overview of the adjustments made to the conventional accounts.With respect to GNP, it will be noted that the domestic investmentcomponents are much larger than in the official accounts—43.1 per centagainst 15.7 per cent in 1929, and 50.6 per cent against 16.2 per cent in1966. In large part, the greater absolute and relative size of grossinvestment was due to reclassifications of items from current consump-tion to investment. In the case of gross tangible nonhuman investment(line 31), the Commerce Department still includes only business andinstitutional investment, plus new residential construction for owner-occupancy, whereas we also include the tangible investments by thenonbusiness sectors (households and governments) in new structures,durable equipment, additions to inventories, and natural resourcedevelopment. Gross tangible human investment (line 37), the cost ofrearing children to working age, is also a deduction from the CommerceDepartment's personal consumption expenditure estimates.
Gross intangible investment (line 38) consists of outlays for educa-tion and training, health and safety, labor mobility, and research anddevelopment (lines 39—42). All of these are human investment exceptR&D, which is largely directed toward new and improved products andprocesses. We therefore classify R&D as nonhuman intangible invest-ment, although it also acts to improve the productivity of human invest-ment and capital by adding to knowledge and know-how. To the extentthat R&D and certain other investments are charged to current expenseby business, our investment estimates require an upward adjustment tothe official GNP estimates (see Table 2-la).
Net exports (line 43) are the same as in the official accounts,comprising net foreign investment and unilateral transfer payments.
Both personal and government consumption (lines 29 and 30)begin with the official estimates, less the categories reclassified asinvestment, plus imputed rental values of the services provided by thetangible nonhuman capital stocks owned by each of the two nonbusi-ness sectors. The adjusted consumption estimates are below the official

THE ACCOUNTING FRAMEWORK AND THE ESTIMATES 25
U.S. estimates to the extent that the imputed rentals are less than thetangible capital outlays of each sector, and because of the deduction ofthe intangible capital outlays. But GNP and gross national income areenlarged by the imputed rental values which are not now includedexcept for owner-occupied residences. As shown in the reconciliationtable (2-la), the aggregate estimates are also larger to the extent offoregone earnings of students and of the frictionally unemployed,which are counted as part of intangible investments in education and inlabor mobility, respectively.
As a result of the various additions, our adjusted GNP estimates are23.5 per cent higher than the official estimates for 1929, and 34.3 percent higher for 1969. (See Table 2-la and Chart 2-1.) Note, however, thatthe adjustments were made purely for the sake of consistency with theexpanded investment and capital estimates. In another project we haveimputed values for all nonmarket production (indicated by parentheti-cal stub entries in the sector accounts). Other investigators have madefurther adjustments in an attempt to provide a still closer approximationto NEW (net economic welfare), as Samuelson has dubbed it in thelatest edition of his textbook.2 That was not our objective in making theadjustments shown in Table 2-la, although these items make a modestcontribution to broader welfare-oriented measures.
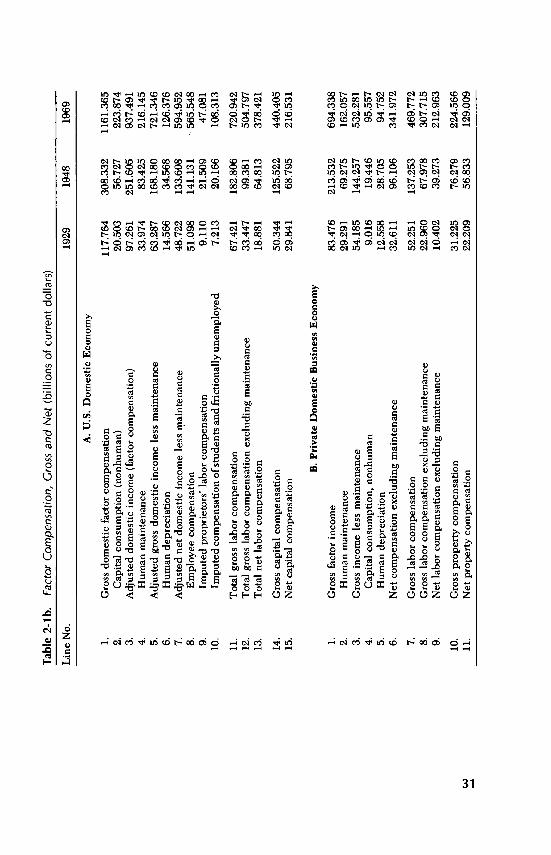
Turning to the debit side of the production account, which com-prises factor costs (national income) and other charges against product,adjustments were made for the additions to product just noted. Thus,labor compensation is increased by the imputed value of nonmarketservices involved in eduation and mobility (line 7), and net rentalincome includes the net rental value of household tangible wealth (line10) and of public sector wealth (line 12). We have also imputed thelabor value of proprietors' work (line 6) on the basis of the averagewage-salary of employees in the various industries, in order to isolatethe profit portion of proprietors' net income to be included with corpo-rate profits (line 11). This is necessary in order to estimate returns onhuman and nonhuman capital separately, as shown in Table 2-lb. Netinterest was modified by deducting from the official estimates con-sumer interest on brokerage loans and the excess of interest paid by thefederal government over and above the net rental value of that sector'sreal wealth. (See Appendix A for a more detailed discussion.)
It should be noted that we have not imputed a rental income for thehuman capital stock, tangible and intangible, since our view is that thelabor compensation estimates already represent the return on total
2. See William Nordhaus and James Tobin, "Is Growth Obsolete?," EconomicGrowth, Fiftieth Anniversary Colloquium V, New York, NBER, 1972.

Tab
le 2
-1.
Nat
iona
l Inc
ome
and
Pro
duct
Acc
ount
(bi
llion
s of
cur
rent
dol
lars
)
Lin
e N
o.19
2919
4819
66
DE
BIT
S
1.L
abor
com
pens
atio
n67
.42
182.
8154
7.58
2.W
age
and
sala
ry d
isbu
rsem
ents
(II
A-1
3)50
.44
135.
3439
4.50
3.W
age
accr
uals
less
dis
burs
emen
ts (
IIB
-73)
0.00
0.04
0.00
4.E
mpl
oyer
con
trib
utio
ns f
or s
ocia
l ins
uran
ce (
IVA
-19)
0.10
3.04
20.2
95.
Oth
er la
bor
inco
me
(IIA
-14)
0.56
2.71
20.7
16.
Impu
ted
labo
r co
mpe
nsat
ion
of p
ropi
etor
s (I
IA-1
5)9.
1121
.51
38.8
67.
Add
ition
al la
bor
com
pens
atio
n im
puta
tions
(II
A-1
6)7.
2120
.17
73.2
2
8.N
et r
enta
l inc
ome
of p
erso
ns a
nd in
stitu
tions
6.96
9.80
28.1
3
9.Fr
om a
uxili
ary
busi
ness
act
iviti
es (
lilA
-b)
3.08
5.36
8.72
10.
From
ow
ner-
used
cap
ital (
IIA
-22)
3.88
4.44
19.4
1
11.
Prof
its o
f bu
sine
ss e
nter
pris
es (
lilA
-li)
16.3
051
.95
116.
52
12.
Net
ren
tal i
ncom
e of
gov
ernm
ent (
IVA
-20)
0.78
1.95
6.17
13.
Net
inte
rest
6.61
6.07
45.7
9
14.
Pers
onal
inte
rest
inco
me
(IIA
-28)
7.22
7.88
43.6
415
.L
ess:
Unp
rodu
ctiv
e in
tere
st p
aid
by c
onsu
mer
s (h
A-l
i)0.
950.
030.
1916
.G
over
nmen
t int
eres
t inc
ome
(IV
A-2
1)0.
521.
364.
1517
.L
ess:
Unp
rodu
ctiv
e in
tere
st p
aid
by g
over
nmen
t (IV
A-1
1)0.
183.
141.
81
NA
TIO
NA
L I
NC
OM
E98
.07
252.
5874
4.19

18.
Les
s: H
uman
cap
ital c
onsu
mpt
ion
(IIA
-33)
14.5
734
.57
101.
15
NE
T N
AT
ION
AL
IN
CO
ME
83.5
021
8.01
643.
04
19.
Cap
ital c
onsu
mpt
ion
allo
wan
ces
35.0
791
.30
272.
57
20.
Pers
onal
(II
B-5
7)24
.33
54.5
316
9.44
21.
Non
hum
an9.
7719
.97
68.2
922
.H
uman
14.5
734
.57
101.
1523
.B
usin
ess
(III
B-3
8)9.
0219
.45
71.2
624
.G
over
nmen
t (IV
B-4
1)1.
7217
.32
31.8
7
GR
OSS
NA
TIO
NA
L I
NC
OM
E11
8.57
309.
3191
5.61
25.
Cur
rent
bus
ines
s tr
ansf
er p
aym
ents
(II
A-3
0)0.
590.
702.
99
26.
Indi
rect
tax
and
nont
ax c
harg
es (
IVA
-16)
7.34
20.5
167
.60
27.
Les
s: S
ubsi
dies
less
cur
rent
sur
plus
of
gove
rnm
ent
—0.
140.
862.
62en
terp
rise
s (I
VA
-12)
28.
Stat
istic
al d
iscr
epan
cy (
VI-
18)
0.70
—1.
99—
1.01
CH
AR
GE
S A
GA
INST
GR
OSS
NA
TIO
NA
L12
7.34
327.
6798
2.57
PRO
DU
CT
(con
tinue
d)

Tab
le 2
-1.
Nat
iona
l Inc
ome
and
Pro
duct
Acc
ount
of c
urre
nt d
olla
rs)
(con
dude
d)
Lin
e N
o.19
2919
4819
66
CR
ED
ITS
29.
Pers
onal
con
sum
ptio
n (I
IA-2
)64
.84
146.
0438
1.57
30.
Gov
ernm
ent c
onsu
mpt
ion
(IV
A-1
)6.
4335
.30
98.4
8
31.
Gro
ss ta
ngib
le n
onhu
man
inve
stm
ent (
VT
-i)
29.4
776
.63
244.
3632
.St
ruct
ures
11.4
827
.80
78.2
733
.Pr
ivat
e re
side
ntia
l3.
9514
.44
25.0
434
.O
ther
7.53
13.3
653
.23
35.
Dur
able
goo
ds15
.46
43.8
014
4.02
36.
Cha
nge
in in
vent
orie
s2.
535.
0322
.07
37.
Gro
ss ta
ngib
le h
uman
inve
stm
ent (
VI-
2)9.
7718
.28
54.6
2
38.
Gro
ss in
tang
ible
inve
stm
ent (
VI-
3)15
.69
44.9
819
8.26
39.
Edu
catio
n an
d tr
aini
ng11
.00
30.7
813
6.60
40.
Hea
lth1.
905.
2221
.47
41.
Mob
ility
2.53
6.61
17.4
142
.R
esea
rch
and
deve
lopm
ent
0.25
2.37
22.7
7
43.
Net
exp
orts
of
good
s an
d se
rvic
es1.
156.
445.
2844
.E
xpor
ts (
VA
-i)
7.03
16.7
943
.36
45.
Les
s: I
mpo
rts
(VA
-2)
5.89
10.3
538
.08
GR
OSS
NA
TIO
NA
L P
RO
DU
CT
127.
3432
7.67
982.
57
NO
TE
: Det
ail m
ay n
ot a
dd to
tota
ls d
ue to
rou
ndin
g.

Tab
le 2
-la.
Rec
onci
liatio
n of
Adj
uste
d G
NP
and
Com
mer
ce D
epar
tmen
t CN
P, 1
929,
194
8, a
nd 1
969
(bill
ions
of c
urre
nt d
olla
rs)
Lin
e N
o.19
2919
4819
69
1.G
NP,
Com
mer
ce c
once
pt10
3,09
525
7.56
292
9.09
5
Plus
Hou
seho
lds
and
inst
itutio
ns:
2.Im
pute
d st
uden
t com
pens
atio
n (l
ess
unem
ploy
men
t adj
ustm
ent)
5.14
115
.660
92.2
653.
Impu
ted
com
pens
atio
n of
fri
ctio
nally
une
mpl
oyed
2.07
24.
506
16.0
48(l
ess
subs
idie
s)4.
Impu
ted
rent
als
(exc
l. m
aint
enan
ce a
nd in
sura
nce)
on
10.4
0520
.499
100.
057
HH
dur
able
s an
d in
vent
orie
s5.
Impu
ted
rent
als
(exc
l. m
aint
enan
ce)
on in
stitu
tiona
l0.
337
0.54
45.
711
plan
t and
equ
ipm
ent a
nd la
nd, o
ver
OB
E d
epre
ciat
ion
and
inte
rest
pai
d
Bus
ines
s:6.
Tan
gibl
e in
vest
men
t con
vent
iona
lly c
harg
ed to
cur
rent
acc
ount
0.28
20.
899
2.34
07.
Inta
ngib
le in
vest
men
t con
vent
iona
lly c
harg
ed to
cur
rent
2.18
76.
953
35.3
87ac
coun
t
Gen
eral
gov
ernm
ent:
8.Im
pute
d re
ntal
s (e
xci.
mai
nten
ance
) on
land
, dur
able
s, a
nd3.
825
21.0
4866
.967
inve
ntor
ies
9.E
qual
s: G
NP,
adj
uste
d12
7.34
432
7.67
11,
247.
870
10.
Rat
io: A
djus
ted
to C
omm
erce
GN
P1.
235
1.27
21.
343

30 THE FORMATION AND STOCKS OF TOTAL CAPITAL
Chart 2-1. Relation of Adjusted to Official GNP Estimates, 1966
Billion dollars1,000
600
500
Equals:
Net exports
Investment, intangible
Investment, tangible
400
300
200
100
0
human capital employed.asymmetrIcal, however, in
Consumption, government
Consumption, personal
sumption allowances, while labor income is gross of human capitalconsumption. Accordingly, in line 18 we deduct human capital con-sumption allowances to arrive at "net national income" estimateswhich are symmetrical in that respect. The allowances represent thatportion of gross income which, from a theoretical social accountingviewpoint, must be invested in human capital in order to maintain itsproductive capacity intact.
Plus:
Business investment chargedto current expense
Imputed nonmarketlabor services
Imputed rentals
900
800
700
Tangible — — — —IntangibleFrictional unemployed
Student compensation
Government
Institution
Household
Government
Net exports
G .P. D. I.
Consumption
G N P Adjusted(USOC) G N P
The official national income estimatesthat property income is net of capital con-
are
Tab
le 2
-lb.
Fac
tor
Com
pens
atio
n, G
ross
and
Net
(bi
llion
s of
cur
rent
dol
lars
)
Line
No.
1929
1948
1969
A. U
.S. D
omes
tic E
cono
my
1,G
ross
dom
estic
fac
tor
com
pens
atio
n11
7.76
430
8.33
211
61.3
652.
Cap
ital c
onsu
mpt
ion
(non
hum
an)
20.5
0356
.727
223.
874
3.A
djus
ted
dom
estic
inco
me
(fac
tor
com
pens
atio
n)97
.261
251.
605
937.
491
4.H
uman
mai
nten
ance
33.9
7483
.425
216.
145
5.A
djus
ted
gros
s do
mes
tic in
com
e le
ss m
aint
enan
ce63
,287
168.
180
721.
346
6.H
uman
dep
reci
atio
n14
.566
34.5
6812
6.37
67.
Adj
uste
d ne
t dom
estic
inco
me
less
mai
nten
ance
48.7
2213
3.60
859
4.95
28.
Em
ploy
ee c
ompe
nsat
ion
51.0
9814
1.13
156
5.54
89.
Impu
ted
prop
riet
ors'
labo
r co
mpe
nsat
ion
9.11
021
.509
47.0
8110
.Im
pute
d co
mpe
nsat
ion
of s
tude
nts
and
fric
tiona
lly u
nem
ploy
ed7.
213
20. 1
6610
8.31
3
11.
Tot
al g
ross
labo
r co
mpe
nsat
ion
67.4
2118
2.80
672
0.94
212
.T
otal
gro
ss la
bor
com
pens
atio
n ex
clud
ing
mai
nten
ance
33.4
4799
.381
504.
797
13.
Tot
al n
et la
bor
com
pens
atio
n18
,881
64.8
1337
8.42
1
14.
Gro
ss c
apita
l com
pens
atio
n50
.344
125.
522
440.
405
15.
Net
cap
ital c
ompe
nsat
ion
29.8
4168
.795
216.
531
B. P
riva
te D
omes
tic B
usin
ess
Eco
nom
y
1.G
ross
fac
tor
inco
me
83.4
7621
3.53
269
4.33
82.
Hum
an m
aint
enan
ce29
.291
69.2
7516
2.05
73.
Gro
ss in
com
e le
ss m
aint
enan
ce54
.185
144.
257
532.
281
4.C
apita
l con
sum
ptio
n, n
onhu
man
9.01
619
.446
95.5
575.
Hum
an d
epre
ciat
ion
12.5
5828
.705
94.7
526.
Net
com
pens
atio
n ex
clud
ing
mai
nten
ance
32.6
1196
. 106
341.
972
7.G
ross
labo
r co
mpe
nsat
ion
52.2
5113
7.25
346
9.77
28.
Gro
ss la
bor
com
pens
atio
n ex
clud
ing
mai
nten
ance
22.9
6067
.978
307.
715
9.N
et la
bor
com
pens
atio
n ex
clud
ing
mai
nten
ance
10.4
0239
.273
212.
963
10.
Gro
ss p
rope
rty
com
pens
atio
n31
.225
76.2
7922
4.56
611
.N
et p
rope
rty
com
pens
atio
n22
.209
56.8
3312
9.00
9

32 THE FORMATION AND STOCKS OF TOTAL CAPITAL
It could be argued that even our net national income estimates areasymmetrical, since property income is considered net of maintenanceexpenditures while labor income is not. Most, but not all, economistsbelieve that, since the portion of current consumption representingmaintenance affords satisfaction, no deduction should be made if awelfare criterion is observed. We have followed this line in Table 2-1,recognizing a possible inconsistency with our treatment of humancapital consumption, although it can be argued that the current utilityportion of human investment is negligible in relation to the flow ofincome, psychic as well as monetary, deriving from human capitalcreation over future accounting periods. We do estimate maintenanceoutlays, as shown in Table 2-ib, as a basis for estimating rates of returnon human and nonhuman capital in a consistent manner, as discussedin the final section of this volume.
Once deducted, human capital consumption can be neatly com-bined with nonhuman capital consumption (line 19) and added to netnational income to obtain gross national income. Then the usual recon-ciliation items, chiefly indirect business taxes less subsidies, can beadded to arrive at total charges against GNP at market prices.
THE SECTOR ACCOUNTS, CURRENT AND CAPITAL
The basic design of sector accounts is well known. (See Tables 2-2through 2-5.) On the credit side, "primary" income flows from currentproduction plus transfer payments received (including tax revenues)are entered. To the official U.S. estimates we have added, in theappropriate sector accounts, the rental values of capital goods owned bythe household and government sectors, the imputed values of nonmar-ket time spent by persons on investment-in-self, and the several lesseritems discussed earlier. Note that we follow the Commerce Depart-ment in crediting total proprietors' profits to the personal sector, sincethere is no basis for estimating the proportion retained for investmentin unincorporated firms. Also, human capital consumption is deductedfrom personal income to arrive at "net personal income," so that per-sonal saving will be net of human as well as of nonhuman depreciationallowances.
In the business sector account (which the Commerce Departmentdoes not explicitly develop), we credit profits (before taxes) after thevarious valuation adjustments. Our foreign sector account is the same asthat of the Commerce Department.
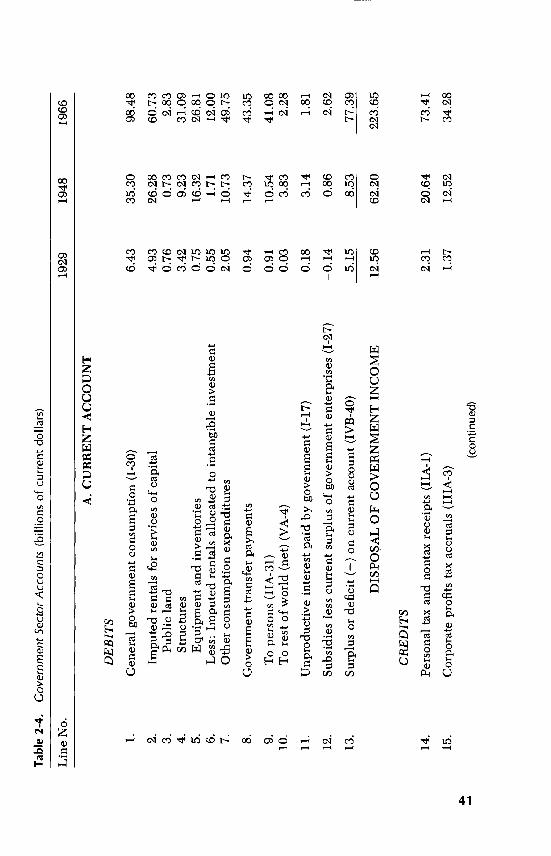
On the debit side of the current accounts, both personal andgovernment consumption estimates are adjusted as described earlier; to

THE ACCOUNTING FRAMEWORK AND THE ESTIMATES 33
these are added transfer payments (including tax and nontax paymentsin the case of the personal sector) and "unproductive interest" pay-ments. In using the term "government consumption" we follow U.N.usage, and include noninvestment purchases presumably designed toproduce services for collective consumption. In the business sector, thedebits are for dividends, entrepreneurial withdrawals, and corporate taxliabilities. In all sectors, net saving is the balancing item obtained as theresidual after subtracting the various debits just described from the netsector incomes.
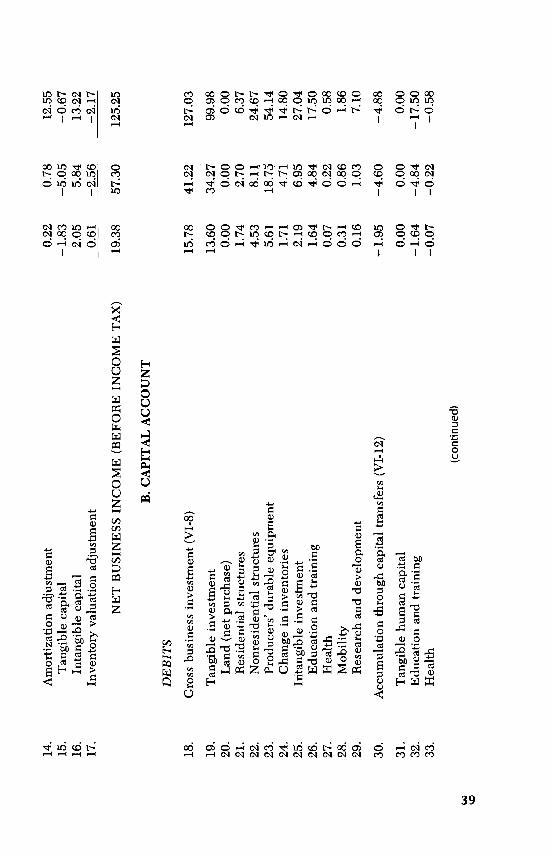
in the sector capital accounts, net saving becomes the initial credititem as a source of funds. Since the capital accounts are gross, in orderto explain the sources of funds to finance gross investment, capitalconsumption allowances—tangible and intangible—are credited to thesector accounts from the gross production account.
The final category of credits, intersectoral net capital transfers,requires some explanation. Whereas initial new investment is entered'according to the sector that finances it, we wish to show capital accumu-lation and stocks by the sector that controls and reaps the primarybenefit from the capital. Thus, we posit that the personal sector controlsall human capital, so the intangible human investments financed bybusiness and governments are transferred to the personal sector. Trans-fers are not necessary for rearing costs, which are both incurred by andaccrue to the benefit of households. We also posit that applied R&Daccrues to the benefit of the business sector, so nonbusiness R&D istransferred to business. Net capital transfers from abroad represent thechange in net human stock, calculated by age groups and adjusted foraccumulated depreciation, resulting from net immigration (immigrationless emigration). To simplify the estimation procedure, we assume thatimmigrants represent the same amounts of capital, in dollars, as personsof the same age groups already in the United States.
In this treatment, we have adopted the approach of the revisedSNA, although the capital transfers provided for there are intended tobe primarily financial. As a result of the productive capital transfers,sector stock estimates relate to the capital controlled, and it is on thisbasis that depreciation is estimated.
On the debit side of the domestic sector capital accounts, there arethree chief groupings of entries. First comes the productive tangibleand intangible investment financed, by type. Next, the capital accumu-lation from net capital transfers is detailed by type rather than by sectorof origin (as on the credit side). The third category, "net financialinvestment," is the balancing item in the capital accounts as the differ-ence between total credits and the sum of the other debits. If the capitalaccount were elaborated to show financial transactions, it would repre-

Tab
le 2
-2.
Per
sona
l Sec
tor
Acc
ount
s (b
illio
ns o
f cur
rent
dol
lars
)
Lirt
eNo.
1929
1948
1966
A. C
UR
RE
NT
AC
CO
UN
T (
Cas
h B
asis
)
DE
BIT
S1.
Pers
onal
tax
and
nont
ax p
aym
ents
(IV
A-1
4)2.
3120
.64
73.4
1
2.Pe
rson
al c
onsu
mpt
ion
(1-2
9)64
.84
146.
0438
1.57
3.Im
pute
d re
ntal
s fo
r se
rvic
es o
f ca
pita
l18
.47
35.3
013
8.41
4.O
wne
r-oc
cupi
ed r
esid
ence
s6.
4110
.80
46.2
85.
Inst
itutio
nal p
lant
0.41
0.75
5.50
6.C
onsu
mer
dur
able
goo
ds a
nd in
vent
orie
s11
.38
23.5
485
.65
7.In
stitu
tiona
l equ
ipm
ent
0.26
0.20
0.99
8.L
ess:
Im
pute
d re
ntal
s al
loca
ted
to in
tang
ible
and
hum
an in
vest
men
t2.
845.
4322
.75
(Con
sum
ptio
n pr
ovid
ed b
y bu
sine
ss to
em
ploy
ees)
(Cur
rent
con
sum
ptio
n tr
ansf
ers
from
bus
ines
s to
gene
ral p
ublic
)
9.O
ther
con
sum
ptio
n ex
pend
iture
s49
.22
116.
1826
5.91
10.
Pers
onal
tran
sfer
pay
men
ts to
res
t of
wor
ld (
net)
(V
A-3
)0.
340.
700.
56
11.
Unp
rodu
ctiv
e in
tere
st p
aid
by c
onsu
mer
s (1
-15)
0.95
0.03
0.19
12.
Net
per
sona
l sav
ings
(II
B-5
6)11
.12
30.0
711
1.22
DIS
POSA
L O
F N
ET
PE
RSO
NA
L I
NC
OM
E79
.56
197.
4856
6.95
CR
ED
iTS
13.
Wag
es a
nd s
alar
y di
sbur
sem
ents
(1-
2)50
.44
135.
3439
4.50
14.
Oth
er la
bor
inco
me
(1-5
)0.
562.
7120
.71

15.
Impu
ted
labo
r co
mpe
nsat
ion
of p
ropr
ieto
rs (
1-6)
16.
Add
ition
al la
bor
com
pens
atio
n im
puta
tions
(1-
7)
17.
Stud
ents
18.
Fric
tiona
lly u
nem
ploy
ed(H
ouse
hold
mem
bers
)(V
olun
teer
s)(E
mpl
oyee
s fo
r bu
sine
ss p
rovi
ded
cons
umpt
ion)
19.
With
draw
als
of p
ropr
ieto
rs' p
rofi
ts (
IIIA
-2)
20.
Net
ren
tal i
ncom
e
21.
From
aux
iliar
y bu
sine
ss a
ctiv
ities
(lil
A-i
)22
.Fr
om o
wne
r-us
ed c
apita
l (1-
10)
23.
Res
iden
ces
24.
Inst
itutio
nal p
lant
25.
Con
sum
er d
urab
le g
oods
and
inve
ntor
ies
26.
Inst
itutio
nal e
quip
men
t
27.
Div
iden
ds (
IIIA
-4)
28.
Pers
onal
inte
rest
inco
me
(1-1
4)
29.
Cur
rent
tran
sfer
s to
per
sons
30.
From
bus
ines
s (1
-25)
(Cas
h)(C
onsu
mpt
ion
prov
ided
to g
ener
al p
ublic
131
.Fr
om g
over
nmen
t (IV
A-9
)
32.
Les
s: P
erso
nal c
ontr
ibut
ions
for
soc
ial i
nsur
ance
(IV
A-1
8)
PER
SON
AL
IN
CO
ME
(con
tinue
d)
9.11
21.5
138
.86
7.21
20.1
773
.22
5.14
15.6
660
.89
2.07
4.51
12.3
4
5.47
18.5
421
.92
6.96
9.80
28.1
3
3.08
5.36
8.72
3.88
4.44
19.4
12.
130.
988.
330.
110.
272.
821.
613.
188.
060.
020.
020.
20
5.80
7.04
20.8
0
7.22
7.88
43.6
4
1.50
11.2
444
.06
0.59
0.70
2.99
0.91
10.5
441
.08
0.14
2.18
17.7
4
94.1
323
2.05
668.
10U
i

Tab
le 2
-2.
Per
sona
! Sec
tor
Acc
ount
s (b
illio
ns o
f cur
rent
dol
lars
) (c
ompl
eted
)
Line
No.
1929
1948
1966
33.
Les
s: H
uman
cap
ital c
onsu
mpt
ion
(1-1
8)14
.57
34.5
710
1.15
NE
T P
ER
SON
AL
IN
CO
ME
79.5
619
7.48
566.
95
B. C
API
TA
L A
CC
OU
NT
(A
ccru
al B
asis
)
DE
BiT
S
34.
Gro
ss p
erso
nal i
nves
tmen
t (V
I-7)
33.2
681
.20
260.
38
35.
Tan
gibl
e no
nhum
an in
vest
men
t12
.95
34.1
499
.41
36.
Lan
d (n
et p
urch
ase)
0.01
—0.
17—
1.63
37.
Res
iden
tial s
truc
ture
s2.
2111
.74
18.6
738
.In
stitu
tiona
l pla
nt0.
430.
713.
8239
.C
onsu
mer
dur
able
goo
ds9.
2122
.68
70.7
540
.In
stitu
tiona
l equ
ipm
ent
0.27
0.20
0.80
41.
Cha
nge
in h
ouse
hold
inve
ntor
ies
0.82
—1.
027.
0042
.T
angi
ble
hum
an in
vest
men
t9.
7718
.28
54.6
243
.In
tang
ible
inve
stm
ent
10.5
428
.78
106.
3544
.E
duca
tion
and
trai
ning
6.85
19.3
775
.29
45.
Hea
lth1.
473.
8215
.37
46.
Mob
ility
2.20
5.55
14.8
347
.R
esea
rch
and
deve
lopm
ent
0.02
0.04
0.86
48.
Acc
umul
atio
n th
roug
h ca
pita
l tra
nsfe
rs (
VI-
il)5.
8515
.10
75.2
2
49.
Tan
gibl
e no
nhum
an c
apita
l0.
000.
000.
0050
.T
angi
ble
hum
an c
apita
l0.
470.
511.
6851
.E
duca
tion
and
trai
ning
4.59
12.1
064
.84
52.
Hea
lth0.
461.
446.
38

53.
Mob
ility
0.33
1.06
2.58
54.
Res
earc
h an
d de
velo
pmen
t—
0.00
—0.
01—
0.25
55.
Net
fin
anci
al in
vest
men
t (V
I-15
)2.
193.
4420
.28
GR
OSS
AC
CU
MU
LA
TIO
N41
.30
99.7
435
5.88
CR
ED
iTS
56.
Net
per
sona
l sav
ing
(IIA
-12)
11.1
230
.07
111.
22
57.
Pers
onal
cap
ital c
onsu
mpt
ion
allo
wan
ces
(1-2
0)24
.33
54.5
316
9.44
58.
Tan
gibl
e no
nhum
an c
apita
l9.
7719
.97
68.2
959
.R
esid
entia
l str
uctu
res
1.51
4.10
11.7
460
.In
stitu
tiona
l pla
nt0.
170.
331.
6961
.C
onsu
mer
dur
able
goo
ds7.
8715
.39
54.2
062
.In
stitu
tiona
l equ
ipm
ent
0.21
0.15
0.65
63.
Tan
gibl
e hu
man
cap
ital
5.10
9.84
17.4
264
.In
tang
ible
cap
ital
9.46
24.7
383
.73
65.
Edu
catio
n an
d tr
aini
ng5.
2815
.55
54.6
766
.H
ealth
1.21
3.16
13.2
667
.M
obili
ty2.
986.
0215
.80
68.
Net
cap
ital t
rans
fers
5.85
15.1
075
.22
69.
Cap
ital t
rans
fers
fro
m b
usin
ess
(III
B-4
8)2.
025.
9219
.94
70.
Cap
ital t
rans
fers
fro
m g
over
nmen
t (IV
B-4
6)2.
907.
9450
.05
71.
Cap
ital t
rans
fers
fro
m r
est o
f w
orld
(V
B-8
)0.
931.
255.
4872
.L
ess:
Cap
ital t
rans
fers
to b
usin
ess
(III
B-4
5)0.
000.
010.
25
73.
Wag
e ac
crua
ls le
ss d
isbu
rsem
ents
(1-
3)0.
040.
00
FIN
AN
CE
OF
GR
OSS
AC
CU
MU
LA
TIO
N41
.30
99.7
435
5.88

Tab
le 2
-3.
Bus
ines
s S
ecto
r A
ccou
nts
(bill
ions
of c
urre
nt d
olla
rs)
Lin
e N
o.19
2919
4819
66
A. C
UR
RE
NT
AC
CO
UN
T
DE
BIT
S
1.W
ithdr
awal
s of
net
ren
tal i
ncom
e fr
om a
uxili
ary
busi
ness
3.08
5.36
8.72
activ
ities
(II
A-2
1)
2.W
ithdr
awal
s of
pro
prie
tors
' pro
fits
(II
A-1
9)5.
4718
.54
21.9
2
3.C
orpo
rate
pro
fits
tax
liabi
lity
(IV
A-1
5)1.
3712
.52
34.2
8
4.D
ivid
ends
(II
A-2
7)5.
807.
0420
.80
5.N
et b
usin
ess
savi
ng (
IIIB
-37)
3.66
13.8
639
.52
6.U
ninc
orpo
rate
d bu
sine
ss n
onw
ithdr
awn
prof
its b
efor
eN
AN
AN
Aad
just
men
t7.
Cor
pora
te u
ndis
trib
uted
pro
fits
bef
ore
adju
stm
ent
2.82
15.6
329
.15
8.A
mor
tizat
ion
adju
stm
ent
0.22
0.78
12.5
59.
Inve
ntor
y va
luat
ion
adju
stm
ent
0A31
2.56
2.17
DIS
POSA
L O
F N
ET
BU
SIN
ESS
IN
CO
ME
19.3
857
.30
125.
25
CR
ED
ITS
10.
Net
ren
tal f
rom
aux
iliar
y bu
sine
ss a
ctiv
ities
(1-
9)3.
085.
368.
72
11.
Prof
its o
f bu
sine
ss e
nter
pris
es (
I-li)
16.3
051
.95
116.
52
12.
Uni
ncor
pora
ted
busi
ness
pro
fits
bef
ore
adju
stm
ent
5.47
18.5
421
.92
13.
Cor
pora
te p
rofi
ts b
efor
e ad
just
men
t9.
9935
.19
84.2
2
DE
BIT
S
18.
Gro
ss b
usin
ess
inve
stm
ent (
VI-
8)
Tan
gibl
e in
vest
men
tL
and
(net
pur
chas
e)R
esid
entia
l str
uctu
res
Non
resi
dent
ial s
truc
ture
sPr
oduc
ers'
dur
able
equ
ipm
ent
Cha
nge
in in
vent
orie
sIn
tang
ible
inve
stm
ent
Edu
catio
n an
d tr
aini
ngH
ealth
Mob
ility
Res
earc
h an
d de
velo
pmen
t
30.
Acc
umul
atio
n th
roug
h ca
pita
l tra
nsfe
rs (
VI-
12)
31.
Tan
gibl
e hu
man
cap
ital
32.
Edu
catio
n an
d tr
aini
ng33
,H
ealth
2.19
6.95
1.64
4.84
0.07
0.22
0.31
0.86
0.16
1.03
—1.
95—
4.60
—4.
88
0.00
0.00
0.00
—1.
64—
4.84
—17
.50
—0.
07—
0.22
—0.
58
14.
Am
ortiz
atio
n ad
just
men
t15
.T
angi
ble
capi
tal
16.
Inta
ngib
le c
apita
l17
.In
vent
ory
valu
atio
n ad
just
men
t
NE
T B
USI
NE
SS I
NC
OM
E (
BE
FOR
E I
NC
OM
E T
AX
)
B. C
API
TA
L A
CC
OU
NT
0.22
0.78
—1.
83—
5.05
2.05
5.84
0.61
—2.
56
12.5
5—
0.67
13.2
2—
2.17
19.
20.
21.
22.
23.
24.
25.
26.
27.
28.
29.
19.3
857
.30
125.
25
15.7
841
.22
127.
03
13.6
034
.27
0.00
0.00
1.74
2.70
4.53
8.11
5.61
1.71
4.71
99.9
80.
006.
3724
.67
54.1
414
.80
27.0
417
.50
0.58
1.86
7.10
(con
tinue
d)

CT
able
2-3
.B
usin
ess
Sec
tor
Acc
ount
s (b
illio
ns o
f cur
rent
dol
lars
) (c
ompl
eted
)
Lin
e N
o.19
2919
4819
66
34.
Mob
ility
—0.
31—
0.86
—1.
86
35.
Res
earc
h an
d de
velo
pmen
t0.
071.
3215
.07
36.
Net
fin
anci
al in
vest
men
t (V
I-16
)—
3.11
—7.
92—
16.2
4
GR
OSS
AC
CU
MU
LA
TIO
N10
.72
28.7
010
5.91
CR
ED
ITS
37.
Net
bus
ines
s sa
ving
(II
IA-5
)3.
6613
.86
39.5
2
38.
Bus
ines
s ca
pita
l con
sum
ptio
n al
low
ance
s (1
-23)
9.02
19.4
571
.26
39.
Tan
gibl
e ca
pita
l8.
8818
.33
57.4
440
.R
esid
entia
l str
uctu
res
1.11
1.59
3.89
41.
Non
resi
dent
ial s
truc
ture
s3.
055.
2114
.76
42.
Prod
ucer
s' d
urab
le e
quip
men
t4.
7211
.53
38.7
943
.In
tang
ible
cap
ital,
rese
arch
and
dev
elop
men
t0.
141.
1213
.82
44.
Net
cap
ital t
rans
fers
—1.
95—
4.60
—4.
88
45.
Cap
ital t
rans
fers
fro
m p
erso
ns a
nd in
stitu
tions
(II
B-7
2)0.
000.
010.
2546
.C
apita
l tra
nsfe
rs f
rom
gov
ernm
ent (
IVB
-47)
0.07
1.31
14.8
147
.C
apita
l tra
nsfe
rs f
rom
res
t of
wor
ld (
VB
-9)
0.00
0.00
0.00
48.
Les
s: C
apita
l tra
nsfe
rs to
per
sons
(II
B-6
9)—
2.02
—5.
92—
19.9
4
FIN
AN
CE
OF
GR
OSS
AC
CU
MU
LA
TIO
N10
.72
28.7
010
5.91
Tab
le 2
-4.
Gov
ernm
ent S
ecto
r A
ccou
nts
(bill
ions
of c
urre
nt d
olla
rs)
Lin
e N
o.19
2919
4819
66
A. C
UR
RE
NT
AC
CO
UN
T
DE
BiT
S
1.G
ener
al g
over
nmen
t con
sum
ptio
n (1
-30)
6.43
35.3
098
.48
2.Im
pute
d re
ntal
s fo
r se
rvic
es o
f ca
pita
l4.
9326
.28
60.7
33.
Publ
ic la
nd0.
760.
732.
834.
Stru
ctur
es3.
429.
2331
.09
5.E
quip
men
t and
inve
ntor
ies
0.75
16.3
226
.81
6.L
ess:
Im
pute
d re
ntal
s al
loca
ted
to in
tang
ible
inve
stm
ent
0.55
1.71
12.0
07.
Oth
er c
onsu
mpt
ion
expe
nditu
res
2.05
10.7
349
.75
8.G
over
nmen
t tra
nsfe
r pa
ymen
ts0.
9414
.37
43.3
5
9.T
o pe
rson
s (H
A-3
1)0.
9110
.54
41.0
810
.T
o re
st o
f w
orld
(ne
t) (
VA
-4)
0.03
3.83
2.28
11.
Unp
rodu
ctiv
e in
tere
st p
aid
by g
over
nmen
t (1-
17)
0.18
3.14
1.81
12.
Subs
idie
s le
ss c
urre
nt s
urpl
us o
f go
vern
men
t ent
erpr
ises
(1-
27)
—0.
140.
862.
62
13.
Surp
lus
or d
efic
it (—
)on
curr
ent a
ccou
nt (
IVB
-40)
5.15
8.53
77.3
9
DIS
POSA
L O
F G
OV
ER
NM
EN
T I
NC
OM
E12
.56
62.2
022
3.65
CR
ED
ITS
14.
Pers
onal
tax
and
nont
ax r
ecei
pts
(hA
-i)
2.31
20.6
473
.41
15.
Cor
pora
te p
rofi
ts ta
x ac
crua
ls (
IIIA
-3)
1.37
12.5
234
.28
(con
tinue
d)

Tab
le 2
-4.
Gov
ernm
ent S
ecto
r A
ccou
nts
(bill
ions
of c
urre
nt d
olla
rs)
(com
plet
ed)
Lin
e N
o.19
2919
4819
66
16.
Indi
rect
tax
and
nont
ax c
harg
es (
1-26
)7.
3420
.51
67.6
0
17.
Con
trib
utio
ns f
or s
ocia
l ins
uran
ce0.
245.
2238
.04
18.
Pers
onal
(II
A-3
2)0.
142.
1817
.74
19.
Em
ploy
er (
1-4)
0.10
3.04
20.2
9
20.
Net
ren
tal i
ncom
e of
gov
ernm
ent (
1-12
)0.
781.
956.
17
21.
Gov
ernm
ent i
nter
est i
ncom
e (1
-16)
0.52
1.36
4.15
GO
VE
RN
ME
NT
IN
CO
ME
12.5
662
.20
223.
65
B. C
API
TA
L A
CC
OU
NT
DE
BIT
S
22.
Gro
ss g
over
nmen
t inv
estm
ent (
VI-
9)5.
8917
.47
109.
83
23.
Tan
gibl
e in
vest
men
t2.
928.
2344
.97
24.
Lan
d (n
et p
urch
ase)
—0.
010.
171.
6325
.St
ruct
ures
2.57
4.55
24.7
426
.E
quip
men
t0.
362.
1718
.33
27.
Cha
nge
in in
vent
orie
s0.
001.
340.
2728
.In
tang
ible
inve
stm
ent
2.96
9.24
64.8
629
.E
duca
tion
and
trai
ning
2.51
6.56
43.8
130
.H
ealth
0.36
1.18
5.52

31.
Mob
ility
0.02
0.20
0.71
.32
.R
esea
rch
and
deve
lopm
ent
0.07
1.31
14.8
1
33.
Acc
umul
atio
n th
roug
h ca
pita
l tra
nsfe
rs (
VI-
13)
—2.
96—
9.24
—64
.86
34.
Tan
gibl
e no
nhum
an c
apita
l0.
000.
000.
0035
.E
duca
tion
and
trai
ning
—2.
51—
6.56
—43
.81
36.
Hea
lth—
0.36
—1.
18—
5.52
37.
Mob
ility
—0.
02—
0.20
—0.
7138
.R
esea
rch
and
deve
lopm
ent
—0.
07—
1.31
—14
.81
39.
Net
fin
anci
al in
vest
men
t (V
I-17
)0.
988.
38—
0.57
GR
OSS
AC
CU
MU
LA
TIO
N3.
9116
.61
44.4
0
CR
ED
ITS
40.
Surp
lus
or d
efic
iton
curr
ent a
ccou
nt (
IVA
-13)
5.15
8.53
77.3
9
41.
Gov
ernm
ent c
apita
l con
sum
ptio
n al
low
ance
s (1
-24)
1.72
17.3
231
.87
42.
Stru
ctur
es1.
204.
7713
.76
43.
Equ
ipm
ent
0.52
12.5
518
.11
44.
Net
cap
ital t
rans
fers
—2.
96—
9.24
—64
.86
45.
Cap
ital t
rans
fers
fro
m r
est o
f w
orld
(yB
-b)
0.00
0.00
0.00
46.
Les
s: C
apita
l tra
nsfe
rs to
per
sons
(II
B-7
0)2.
907.
9450
.05
47.
Les
s: C
apita
l tra
nsfe
rs to
bus
ines
s (I
IIB
-46)
0.07
1.31
14.8
1
FIN
AN
CE
OF
GR
OSS
AC
CU
MU
LA
TIO
N3.
9116
.61
44.4
0

Tab
le 2
-5.
For
eign
Sec
tor
Acc
ount
s (b
illio
ns o
f cur
rent
dol
lars
)
Lin
e N
o.19
2919
4819
66
A. C
UR
RE
NT
AC
CO
UN
T
DE
BIT
S
1.E
xpor
ts o
f go
ods
and
serv
ices
(1-
44)
7.03
16.7
9-
43.3
6
RE
CE
IPT
S FR
OM
FO
RE
IGN
ER
S7.
0316
.79
43.3
6
CR
ED
ITS
2.Im
port
s of
goo
ds a
nd s
ervi
ces
(1-4
5)5,
8910
.35
38.0
8
3.Pe
rson
al tr
ansf
er p
aym
ents
to r
est o
f w
orld
(ne
t) (
hA-b
)0.
340.
700.
56
4.U
.S. G
over
nmen
t tra
nsfe
r pa
ymen
ts to
res
t of
wor
ld (
net)
(IV
A-l
O)
0.03
3.83
2.28
5.Su
rplu
s of
nat
ion
on c
urre
nt f
orei
gn a
ccou
nt (
VB
-6)
CU
RR
EN
T D
ISB
UR
SEM
EN
TS
AN
D S
UR
PLU
S O
N7.
0316
.79
43.3
6FO
RE
IGN
AC
CO
UN
T
B. C
API
TA
L A
CC
OU
NT
DE
BIT
S
6.Su
rplu
s of
nat
ion
on c
urre
nt f
orei
gn a
ccou
nt (
VA
-5)
0.77
1.92
2.45
7.N
et c
apita
l tra
nsfe
rs f
rom
res
t of
wor
ld0.
931.
255.
48
8.T
o pe
rson
s (I
IB-7
1)0.
931.
255.
489,
TO
bus
ines
s (I
IIB
-47)
0.00
0.00
0.00
10.
To
gove
rnm
ent (
IVB
-45)
SO
UR
CE
OF
AC
CU
MU
LA
TIO
N1.
703.
177.
92
CR
ED
ITS
11.
Acc
umul
atio
n th
roug
h ne
t cap
ital t
rans
fers
fro
m r
est o
f w
orld
(V
I-4)
0.93
1.25
5.48
12.
Net
for
eign
inve
stm
ent (
V1-
5)07
71.
922.
45
AC
CU
MU
LA
TIO
N O
N F
OR
EIG
N A
CC
OU
NT
1.70
3.17
7.92

Tab
le 2
-6.
Con
solid
ated
Cap
ital F
orm
atio
n A
ccou
nt (
billi
ons
of c
urre
nt d
olla
rs)
Lin
e N
o.19
2919
4819
66
DE
BIT
S
1.G
ross
tang
ible
non
hum
an in
vest
men
t (1-
31)
29.4
776
.63
244.
36
2.G
ross
tang
ible
hum
an in
vest
men
t (1-
37)
9.77
18.2
854
.62
3.G
ross
inta
ngib
le in
vest
men
t (1-
38)
15.6
944
.98
198.
26
4.A
ccum
ulat
ion
thro
ugh
net c
apita
l tra
nsfe
rs f
rom
of w
orld
(yB
-h)
rest
0.93
1.25
5.48
5.N
et f
orei
gn in
vest
men
t (V
B-1
2)0.
771.
922.
45
GR
OSS
AC
CU
MU
LA
TIO
N56
.63
143.
0550
5.16
CR
ED
ITS
6.G
ross
dom
estic
inve
stm
ent
54.9
313
9.89
497.
24
7. 8. 9.
By
pers
ons
and
inst
itutio
ns (
IIB
-34)
By
busi
ness
(II
IB-1
8)B
y go
vern
men
t (IV
B-2
2)
33.2
615
.78
5.89
81.2
041
.22
17.4
7
260.
3812
7.03
109.
83
10.
Acc
umul
atio
n th
roug
h ca
pita
l tra
nsfe
rs0.
931.
255.
48
11.
12.
13.
By
pers
ons
(IIB
-48)
By
busi
ness
(II
IB-3
0)B
y go
vern
men
t (IV
B-3
3)
5.85
—1.
95—
2.96
15.1
0—
4.60
—9.
24
75.2
2—
4.88
64.8
6
14.
Net
fin
anci
al in
vest
men
t.
0.07
3.90
3.46
15.
16.
17.
By
pers
ons
and
inst
itutio
ns (
IIB
-55)
By
busi
ness
(II
IB-3
6)B
y go
vern
men
t (IV
B-3
9)
2.19
—3.
110.
98
3.44
7.92
•8.3
8
20.2
816
.24
—0.
57
18.
Stat
istic
al d
iscr
epan
cy (
1-28
)0.
701.
99—
1.01
SOU
RC
E O
F G
RO
SS A
CC
UM
UL
AT
ION
56.6
314
3.05
505.
16
cji
Tab
le 2
-7.
Dis
posa
ble
Rec
eipt
s an
d E
xpen
ditu
res,
by
Sec
tor
(bill
ions
of c
urre
nt d
olla
rs)
Lin
e N
o.19
2919
4819
66
1.N
et p
erso
nal i
ncom
e (h
A-C
redi
ts to
tal)
79.5
619
7.48
566.
952.
Plus
: Per
sona
l cap
ital c
onsu
mpt
ion
(IIB
-57)
24.3
354
.53
169.
443.
Wag
e ac
crua
ls o
ver
disb
urse
men
ts (
IIB
-73)
0.00
0.04
0.00
4.E
qual
s: G
ross
per
sona
l inc
ome
accr
uals
103.
8925
2.05
736.
395.
Les
s: P
erso
nal t
ax a
nd n
onta
x pa
ymen
ts (
hA-i
)2.
3120
.64
73.4
16.
Pers
onal
tran
sfer
pay
men
ts to
res
t of
wor
ld0.
340.
700.
56(n
et)
(hA
-b)
7.U
npro
duct
ive
inte
rest
pai
d by
con
sum
ers
(hA
-il)
0.95
0.03
0.19
8.E
qual
s: D
ispo
sabl
e pe
rson
al in
com
e*10
0.29
230.
6866
2.23
9.D
ispo
sal:
Tan
gibl
e no
nhum
an in
vest
men
t (II
B-3
5)12
.95
34.1
499
.41
10.
Tan
gibl
e hu
man
inve
stm
ent (
IIB
-42)
9.77
18.2
854
.62
11.
Inta
ngib
le in
vest
men
t (11
13-4
3)10
.54
28.7
810
6.35
12.
Pers
onal
con
sum
ptio
n (I
IA-2
)64
.84
146.
0438
1.57
13.
Net
fin
anci
al in
vest
men
t (II
B-5
5)2.
193.
4420
.28
14.
Net
bus
ines
s in
com
e be
fore
inco
me
tax
(lilA
-Cre
dits
tota
l)19
.38
57.3
012
5.25
15.
Plus
: Bus
ines
s ca
pita
l con
sum
ptio
n (I
IIB
-38)
9.02
19.4
571
.26
16.
Exc
ess
wag
e ac
crua
ls o
ver
disb
urse
men
ts (
1-3)
0.00
0.04
0.00
17.
Equ
als:
Gro
ss b
usin
ess
inco
me
28.4
076
.79
196.
5118
.L
ess:
With
draw
als
of a
uxili
ary
busi
ness
inco
me
(lilA
-i)
3.08
5.36
8.72
19.
With
draw
als
of p
ropr
ieto
rs' p
rofi
ts (
IIIA
-2)
5.47
18.5
421
.92
20.
Cor
pora
te p
rofi
ts ta
x lia
bilit
y (I
IIA
-3)
1.37
12.5
234
.28
21.
Div
iden
ds (
IIIA
-4)
5.80
7.04
20.8
022
.W
age
liabi
lity
over
dis
burs
emen
ts (
1-3)
0.00
0.04
0.00
23.
Equ
als:
Gro
ss r
etai
ned
earn
ings
12.6
833
.29
110.
79
24.
Dis
posa
l: T
angi
ble
inve
stm
ent (
IIIB
-19)
13.6
034
.27
99.9
825
.In
tang
ible
inve
stm
ent (
IIIB
-25)
2.19
6.95
27.0
426
.N
et f
inan
cial
inve
stm
ent (
IIIB
-36)
—3.
11—
7.92
—16
.24
27.
Gov
ernm
ent i
ncom
e (I
VA
-Cre
dits
tota
l)12
.56
62.2
022
3.65
28.
Plus
: Gov
ernm
ent c
apita
l con
sum
ptio
n (I
VB
-41)
1.72
17.3
231
.87
29.
Equ
als:
Gro
ss g
over
nmen
t rec
eipt
s or
acc
rnal
s14
.28
79.5
225
5.52
30.
Les
s: G
over
nmen
t tra
nsfe
r pa
ymen
ts (
IVA
-8)
0.94
14.3
743
.35
31.
Unp
rodu
ctiv
e in
tere
st p
aid
by g
over
nmen
t (IV
A-i
l)0.
183.
141.
8132
.Su
bsid
ies
less
cur
rent
sur
plus
of
gove
rnm
ent
ente
rpri
ses
(IV
A-1
2)—
0.14
0.86
2.62
33.
Equ
als:
Dis
posa
ble
gove
rnm
ent i
ncom
ea13
.30
61.1
520
7.74
34.
Dis
posa
l: T
angi
ble
inte
rest
(IV
A-2
3)2.
928.
2344
.97
35.
Inta
ngib
le in
vest
men
t (IV
B-2
8)2.
969.
2464
.86
36.
Gen
eral
gov
ernm
ent c
onsu
mpt
ion(
I V
A-i
)6.
4335
.30
98.4
837
.N
et f
inan
cial
inve
stm
ent (
IVB
-39)
0.98
8.38
—0.
57
38.
Net
for
eign
tran
sfer
s (V
A-3
+ 4
)0.
384.
532.
8339
.L
ess:
Net
exp
orts
(1-
43)
1.15
6.44
5.28
40.
Equ
als:
Net
for
eign
cla
ims
—0.
77—
1.91
—2.
45
41.
Tot
al c
urre
nt in
com
e (l
ines
8 +
23
+ 3
3 +
38)
126.
6532
9.65
983.
5942
.PI
us: S
tatis
tical
dis
crep
ancy
(1-
28)
0.70
—1.
99—
1.01
43.
Equ
als:
Adj
uste
d G
NP
127.
3432
7.67
982.
57
aCro
ss o
f ca
pita
l con
sum
ptio
n an
d ca
pita
l tra
nsfe
rs, b
ut n
et o
f cu
rren
t tra
nsfe
rs to
oth
er s
ecto
rs.

48 THE FORMATION AND STOCKS OF TOTAL CAPITAL
sent the difference between net acquisition of assets (lending) and netincurrence of liabilities (borrowing), each of which could be detailedby type of financial instrument. But our interest here is not in the flowof funds.
In the foreign sector capital account (Table 2-5), note that we addthe net capital transfers from the rest of the world (line 7), by recipientsector, to the surplus of the nation on current account (line 6).
The consolidated capital formation account (Table 2-6) contains thecontra-entries to the various investments and capital transfers of thesectors, and summarizes national investment, by sector and major type.Note that the capital transfers among the domestic sectors plus netcapital transfers from abroad sum to zero. So do net financial investmentof the domestic sectors plus net foreign investment, after allowance forthe statistical discrepancy. Or, to state it alternatively, the sum of netfinancial investment for the domestic sectors (line 14) equals net for-eign investment (line 5) less the statistical discrepancy (line 18).
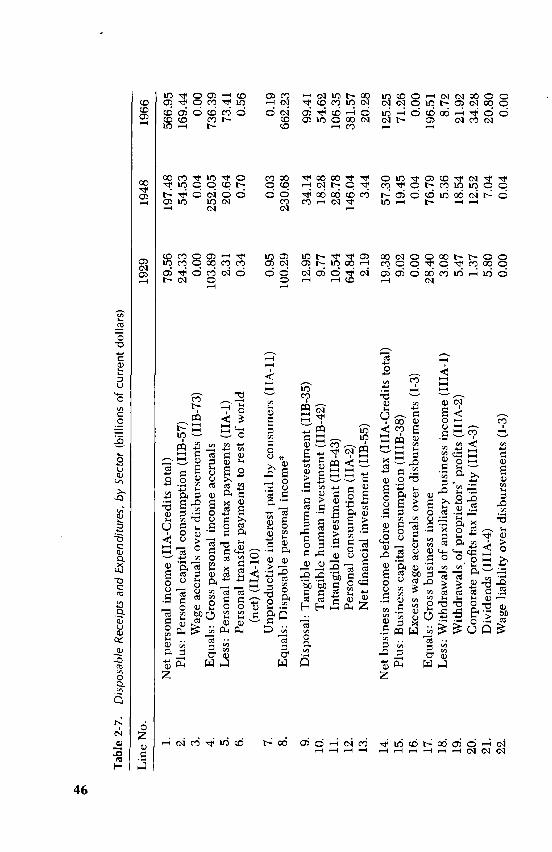
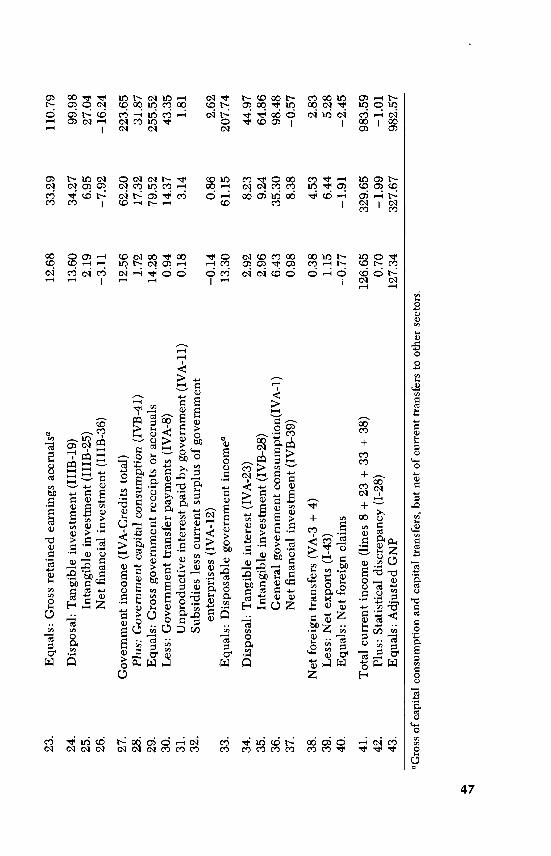
Another useful summary is provided in Table 2-7, showing dispos-able income and its disposition, by sector. The disposable income foreach sector is derived as its gross income less transfers to other sectors,and it sums to GNP less statistical discrepancy. Disposable income isallocated by each sector to consumption, productive tangible and intan-gible investments, and net financial investment. Although savingequals investment for the nation, they are unequal for each sector to theextent of net financial investment. The sector disposable income series,and the channels of disposition, are necessary for an analysis of con-sumption, saving, and investment functions.
BALANCE SHEETS AND WEALTH STATEMENTS
The combined national balance sheets show the condition ofthe economy at the end of a period as a result of saving and borrowing,investing and lending, and (if stated in current prices) revaluations ofassets since the beginning of the period. In the balance sheet, produc-tive wealth, hitherto confined to tangibles, is added to the financialassets to obtain total assets, which are conventionally shown on the left-hand side. On the opposite side are liabilities (including stock andother equity if these are also carried on the asset side, as is usual innational and sector balance sheets).
Table 2-8 below presents a combined national balance sheet forthe United States for the end of the year 1968. The financial assets andliabilities are taken from Goldsmith, who based them largely on Fed-

Tab
le 2
-8.
Com
bine
d B
alan
ce S
heet
of t
he U
nite
d S
tate
s, 1
968,
Incl
udin
g H
uman
Cap
ital (
bi I
lions
of c
urre
nt d
olla
rs)
Fin
anci
alas
sets
4,34
9L
iabi
litie
s—to
tal
2,79
1
Mon
etar
y re
serv
es22
Mon
etar
y re
serv
es5
Cur
renc
y an
d de
man
d de
posi
ts20
9C
urre
ncy
and
dem
and
depo
sits
211
Shor
t-te
rm c
laim
s1,
136
Shor
t-te
rm d
ebt
1,06
1L
ong-
term
cla
ims
1,34
3L
ong-
term
deb
t1,
337
Cor
pora
te s
hare
s1,
107
Oth
er17
7E
quity
in u
ninc
orpo
rate
d bu
sine
ss39
2M
isce
llane
ous
asse
ts14
0
Prod
uctiv
e as
set
s—to
tal
6,29
6E
quity
—N
onco
rpor
ate
busi
ness
1,48
9
Non
hum
an c
apita
l2,
952
and
corp
orat
e sh
ares
Tan
gibl
e2,
783
Lan
d62
3St
ruct
ures
1,25
0N
et w
orth
6,36
5E
quip
men
t57
0In
vent
orie
s34
0In
tang
ible
169
Hum
an c
apita
l3,
344
Tan
gibl
e1,
063
Inta
ngib
le2,
281
TO
TA
L A
SSE
TS
10,6
45T
OT
AL
LIA
BIL
ITIE
S A
ND
NE
T W
OR
TH
10,6
45
Add
endu
m: N
et f
orei
gn a
sset
s69
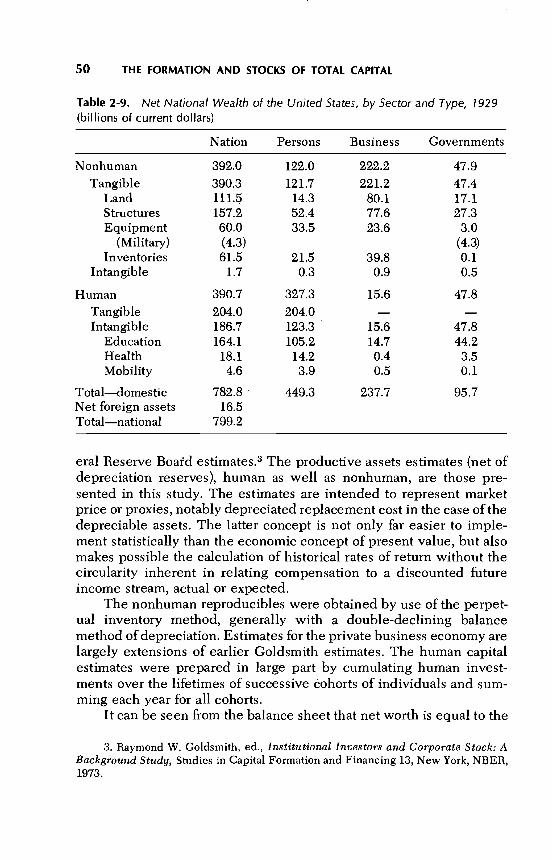
50 THE FORMATION AND STOCKS OF TOTAL CAPITAL
Table 2-9. Net National Wealth of the United States, by Sector and Type, 1929(billions of current dollars)
Nation Persons Business Governments
Nonhuman 392.0 122.0 222.2 47.9Tangible 390.3 121.7 221.2 47.4
Land 111.5 14.3 80.1 17.1Structures 157.2 52.4 77.6 27.3Equipment 60.0 33.5 23.6 3.0
(Military) (4.3) (4.3)Inventories 61.5 21.5 39.8 0.1
Intangible 1.7 0.3 0.9 0.5
Human 390.7 327.3 15.6 47.8Tangible 204.0 204.0 — —Intangible 186.7 123.3 • 15.6 47.8
Education 164.1 105.2 14.7 44.2Health 18.1 14.2 0.4 3.5Mobility 4.6 3.9 0.5 0.1
Total—domestic 782.8 449.3 237.7 95.7Net foreign assets 16.5Total—national 799.2
era! Reserve estimates.3 The productive assets estimates (net ofdepreciation reserves), human as well as nonhuman, are those pre-sented in this study. The estimates are intended to represent marketprice or proxies, notably depreciated replacement cost in the case of thedepreciable assets. The latter concept is not only far easier to imple-ment statistically than the economic concept of present value, but alsomakes possible the calculation of historical rates of return without thecircularity inherent in relating compensation to a discounted futureincome stream, actual or expected.
The nonhuman reproducibles were obtained by use of the perpet-ual inventory method, generally with a double-declining balancemethod of depreciation. Estimates for the private business economy arelargely extensions of earlier Goldsmith estimates. The human capitalestimates were prepared in large part by cumulating human invest-ments over the lifetimes of successive éohorts of individuals and sum-ming each year for all cohorts.
It can be seen from the balance sheet that net worth is equal to the
3. Raymond W. Goldsmith, ed., Institutional Investors and Corporate Stock: ABackground Study, Studies in Capital Formation and Financing 13, New York, NBER,1973.

THE ACCOUNTING FRAMEWORK AND THE ESTIMATES 51
Table 2-10. Net National Wealth of the United States, by Sector and Type, 1948(billions of current dollars)
Nation Persons Business Governments
Nonhuman 892.5 298.7 378.1 215.8
Tangible 879.2 297.7 372.8 208.8Land 197.9 44.7 123.6 29.6Structures 365.2 134.7 110.8 119.7Equipment 175.6 65.5 53.6 56.5
(Military) (65.6) (65.6)Inventories 140.6 52.7 84.9 3.0
Intangible 13.3 1.0 5.3 7.0
Human 908.8 715.9 37.3 155.6Tangible 396.9 396.9 —Intangible 511.9 319.0 37.3 155.6
Education 457.8 278.1 35.2 144.5Health 43.5 32.0 1.0 10.5Mobility 10.6 8.9 1.2 0.5
Total—domestic 1,801.4 1,014.6 415.4 371.4Net foreign assets 37.6Total—national 1,838.9
Table 2-11. Net National Wealth of the United States, by Sector and Type, 1969(billions of current dollars)
Nation Persons Business Governments
Nonhuman 3,220.5 1,103.0 1,306.5 811.1Tangible 3,035.6 1,091.5 1,252.1 692.0
Land 686.8 174.3 393.7 118.8Structures 1,376.1 515.9 423.0 436.3Equipment 617.4 284.0 230.7 10.2.7
(Military) (146.8) (146.8)Inventories 355.3 117.3 203.8 34.2
Intangible 184.9 11.5 54.4 119.1
Human 3,699.9 2,695.9 169.5 834.5Tangible 1,146.9 1,146.9 — —Intangible 2,553.0 1,549.0 169.5 834.5
Education 2,267.3 1,334.1 162.4 770.9Health 241.7 175.0 5.0 61.7Mobility 43.9 40.0 2.0 1.9
Total—domestic 6,920.4 3,798.9 1,476.0 1,645.6Net foreign assets 69.2Total—national 6,989.6
52 THE FORMATION AND STOCKS OF TOTAL CAPITAL
value of the productive assets plus net foreign claims. This is, in effect,the result of consolidating sector balance sheets, with domestic assetsand liabilities canceling out. Since our interest here is in wealth, theAppendix B tables show domestic productive wealth, by sector andtype, with net foreign claims added for those who prefer to work withthe national wealth aggregate. Changes in the statements of wealth aredirectly related to net investments in our capital accounts, plus revalua-tions.
Tables 2-9 through 2-11 show that inclusion of human capital morethan doubles the national wealth of the United States as conventionallymeasured. The proportion of human to total wealth did not increasesignificantly between 1929 and 1969, however. In fact, nonhumancapital increased significantly in relation to tangible human wealth. Butthe intangible human wealth increased much faster. In Chapter 5 wesuggest that the growth of intangible capital generally in relation totangible factors is a primary explanation of the increase in total tangiblefactor productivity.
Summary of Methodology and Sources
The behavior of time series and their interpretation depend not only onthe underlying concepts, but also on the methodology used in theirestimation and the reliability of the basic data sources. This summary ofsources and methods is provided for the general reader who is notinterested in perusing the detailed description contained in the appen-dixes (particularly since much of it is on microfiche) but wants to graspthe general approach. The data sources are referred to here only ingeneral terms; for specific references the appendixes must be con-sulted.
Our summary starts with the current dollar gross investment series,tangible and intangible. Next we look the price indexes used for (1)deflating the various categories of investment to obtain the real invest-ment estimates on the basis of which the associated real stocks areestimated, and (2) reflating real reproducible stocks to current prices.Finally, the methodology for estimating the real stocks, by category, isset forth.
CAPITAL FORMATION
TANGIBLE NONHUMAN INVESTMENT. This category coversexpenditures for new construction, equipment, and inventory accumu-
THE ACCOUNTING FRAMEWORK AND THE ESTIMATES 53
lation. In the U.S. national income accounts, only gross private domes-tic investment by businesses and institutions is identified as such. Weinclude the comparable outlays for households and governments.
Personal sector residential construction consists of BEA's farmresidential construction and our estimates of that portion of expendi-tures on nonfarm residential construction destined for owner-occu-pancy. Institutional plant and equipment outlays as well as expendi-tures on consumer durable goods come from BEA. Inventory stocks andthe net change are estimated roughly on the basis of methods devel-oped by Lenore Epstein.
Business sector figures on residential and nonresidential construc-tion, outlays on producers' durable equipment, and the change inbusiness inventories are based on BEA, but outlays pertaining to othersectors are deducted. The old BEA estimates of producers' durableequipment conventionally charged to current expense are resurrectedand extended.
For government sector outlays on new construction, BEA esti-mates are used for federal, state, and local governments, includingmilitary as well as civilian construction. Estimates of government out-lays on civilian and military equipment and inventories are basedprimarily on the work of Raymond Goldsmith.
Since we assume the national land stock constant over time, overallinvestment is zero. This assumption is somewhat arbitrary, but changesdo take place in farmland, mineral land, and siteland, and a residualcategory of vacant and nonclassified land was introduced to offset thesechanges. Estimates of intersectoral land transfers are based on informa-tion from BEA. Net foreign investment estimates are taken directlyfrom BEA.
TANGIBLE HuMAN INVESTMENT. This category embraces theportion of personal consumption expenditures allocated to rearing chil-dren to working age, that is, age fourteen, corresponding to the officialU.S. labor force definition at the time the estimates were made (subse-quently changed to age sixteen). All rearing costs are consideredfinanced by the personal sector.
Estimates of average annual costs per child are by age groupings,based on surveys of family consumption patterns. Basically, BEA per-sonal consumption expenditures by category are used, but some itemsare left out, either because they are not attributable to rearing childrenor because they are included elsewhere, such as expenditures oneducation. Population is divided into age groups, and the correspond-ing proportions of personal consumption expenditures are assigned toeach group.
For the estimates of personal consumption expenditures prior to

54 THE FORMATION AND STOCKS OF TOTAL CAPITAL
1929 we relied upon Dewhurst, Kuznets, and Galiman. Rearing costsfor the period 1830 to 1929 were estimated on the assumption that the1929 ratios of per capita rearing costs for each age group to per capitaconsumption expenditures were true for the 1830—1928 period.
The opportunity costs of parents' time devoted to rearing were notincluded, since in this study we have not undertaken imputations forunpaid work, with the exception of schoolwork.
INTANGIBLE NONHUMAN INVESTMENT (R&D). Research anddevelopment outlays result in the production of new knowledge and itscommercial application in the development of new or improved con-sumer and producers' goods and methods of production. While basicresearch, about 10 per cent of total R&D, is not directed toward practi-cal application, it progressively enlarges the pooi of scientific knowl-edge continually drawn upon (and contributed to) by those engaged inapplied research, invention, and engineering development. It seemsfair to count basic research as well as development activities as invest-ment, with the cost of the "useless" research being borne by that whicheventually has an economic payoff.
Measured R&D includes only the formal activities of the varioussectors; some infonnal activity, such as that of the "lone wolf" inventor,is not included. As informal inventive activity has become relativelyless important with the spread of the industrial laboratory, the estimatestend to have some upward bias as a measure of total R&D. This isaccentuated by a tendency for more complete reporting of such costswith R&D gaining in prestige. In real terms, however, this possibleupward bias is offset by the upward bias of the price deflators, whichare based on input prices due to the difficulty of defining and measur-ing R&D outputs.
National Science Foundation estimates of R&D outlays are usedfor the period from 1953 onward, broken down into basic research andapplied research and development. (It was not possible to subdividethe latter category.) The National Science Foundation estimates areavailable by sector of finance according to the sectoring used in thisstudy, except that the relatively funds provided by state andlocal governments are merged with those of private nonprofitinstitutions and had to .b.e disentangled from fragmentary data. TheR&D estimates were also distributed by broad product fields as a basisfor developing the stock estimates.
The NSF estimates were carried back from 1953 to 1921 in aConference Board study for selected years by Nestor Terleckyj.
INTANGIBLE INVESTMENT. The education and trainingseries cover expenditures on formal, informal, and special education, aswell as costs of employee training.
THE ACCOUNTING FRAMEWORK AND THE ESTIMATES 55
Formal education costs for the personal sector consist of BEA'spersonal consumption expenditures on private education and research,plus our estimates of the net rental for this sector's educational plantand equipment. Students' expenditures on supplies and rentals ofbooks and equipment are estimated as a percentage of imputed studentcompensation (opportunity costs). The latter forms an important part ofeducational costs in the personal sector, and is estimated by level ofeducation, adjusted downward for unemployment (BLS rates). Govern-ment sector-financed formal education expendltures. are basically BEAfigures on federal, state, and local purchases for education and forveterans' education and training. Gross public educational structureand equipment rentals are added, with public educational capitalderived from public construction figures and educational capital out-lays estimated by HEW.
Informal educational outlays by the government sector are esti-mated from BEA data as the total purchases for state and local librariesand recreation, the Library of Congress, and the Smithsonian Institu-tion. Personal sector informal education consists of parts of consumercosts for radio, TV, records, books, periodicals, libraries, museums, etcetera. For most of these items the proportions ascribed to informaleducation are derived from estimates developed by Fritz Machlup. Forbook rentals similar assumptions are made, while for libraries andmuseums net rentals as well as direct costs are based on BEA figures.Business and institutional expenditures on public education are esti-mated as percentages of media advertising expenditures, based onMachlup's proportional allocations to intellectual and practical topics ofmedia time and space.
Special (religious) education expenditures are derived from BEAtotals in the religious activity expenditures personal sector. The alloca-tion to religious education uses a ratio based on numbers of students inSunday schools times expenditures per pupil, with a portion of imputedinterest on plant and equipment of religious organizations added. Mili-tary education and training is estimated from government expenditureseries.
Employee training is estimated separately for each sector. Severalcost components are included. The cost of initial nonproductive time isestimated by converting nonproductive hours of employees and super-visors to standard hours. The occupational standard hours are weightedby occupational distributions of employment, and training time isderived as a proportion of annual hours worked, applied to annualcompensation of new hires. Training hours are based on PersonnelJournal data, and occupational distributions of workers and averageannual hours worked, on BLS data. Government new hire rates are

56 THE FORMATION AND STOCKS OF TOTAL CAPITAL
from the U.S. Civil Service Commission, private sector rates, from BLS,and employee compensation, from BEA. Besides initial training timelost there is additional time lost, estimated as a percentage of theformer. Nonwage production costs are also taken into account. Formaltraining costs for the business sector are the numbers of trainees bytype of training, based on a U.S. Department of Labor survey, times costper employee, based on a sample survey. The direct costs of formaltraining of federal government employees are estimated from CivilService Commission data, and state and local costs, as a percentage offederal costs.
One-half of the expenditures on medical, health, and safety objec-tives is considered as investment, the other half as maintenance thatdoes not increase future productive capacity. The personal sector'sexpenditures on health and medical care are based mainly on BEAestimates of this category of personal consumption expenditures, withimputed rental values of ophthalmic products and orthopedic appliancesadded. An imputed net interest on nonprofit hospital structures andequipment is derived by applying interest rates to stock estimates.Business sector outlays for in-plant medical care are derived from HEWestimates, and safety costs are based on Brookings Institution estimatesof expenditures for safety programs. Covernment sector expenditureson health, sanitation, and medical care consist of the BEA estimates oftotal federal, state, and local outlays on goods and services for healthand hospitals, sanitation, and veterans' hospital and medical care. Hos-pital construction and equipment outlays are deducted, but gross rent-als on public hospital structures and equipment are added. The latterconsist of depreciation and net interest (a percentage of total net inter-est on structures).
Mobility costs include job search and hiring, frictional unemploy-ment, and migration costs. Job search costs are incurred by persons andare included in BEA's personal consumption expenditures (we usedpart of the group of expenditures which includes employment agencyfees). The business sector also has costs linked to job changes. A costestimate per new hire was multiplied by the number of new hiresderived from BLS data. Hiring costs are estimated along the same linesfor the government sector, using government new hire rates. To thissector's outlays for mobility are added the administrative costs of theU.S. Employment Service, based on Department of Labor and U.S.Government Budget data. These costs are allocated half to hiring andhalf to unemployment costs. Of the assumed employment costs, how-ever, only part is retained in the frictional unemployment group, sincefrictional unemployment is assumed to be 3 per cent of the labor force.For the personal sector, frictional unemployment costs are the product

THE ACCOUNTING FRAMEWORK AND THE ESTIMATES 57
of the number of frictionally unemployed and average annual wagesand salaries. Although the opportunity cost of the unemployed may beless than the average pay of those employed, no adjustment isattempted. In recent years a deduction has been made for severancepay. The latter is included in business sector frictional unemploymentcosts along with separation costs incurred by firms because of layoffs.
Another important component of mobility costs is the outlay linkedto work-oriented travel and moving of household items. We workedwith a cost-per-mile estimate for each of these categories, applied to anestimated average mileage of work-oriented travel and moving forinterstate and intrastate migration. Numbers of migrants are based onCensus Bureau data, adjusted for work-oriented migration. For movingcosts, numbers of families moving are derived. One-half of the esti-mated moving and travel costs is charged to the personal sector, theother half, to the business and government sectors in proportion to thenumber of persons employed by each. Besides internal migration, anestimate is made of the federal government's investment in interna-tional migration, i.e., the administrative costs of the Immigration andNaturalization Service.
PRICE DEFLATORS
NONHUMAN TANGIBLES. For most categories of personal sectorinvestment we use BEA deflators, supplemented by detailed consumerprice indexes for selected components. For the business sector, alldeflators are from BEA, and for the government sector, from BEA plusseveral other sources. Land deflators are based on prices of various landcategories as compiled by Manvel and Goldsmith for the nonfarmsector, and the U.S. Department of Agriculture for farm lands.
HUMAN TANGIBLES. Rearing cost estimates were made directly inconstant dollars: most of the categories were either available in constantdollars from BEA. or deflators could be constructed from the underlyingI3LS consumer price indexes. However, to reflate constant dollar stockfigures an implicit deflator for total rearing costs was calculated.
HUMAN INTANGIBLES. Personal sector formal education costsin constant dollars are estimated directly, by the same method as thatused for the current dollar estimates. Associated costs are deflatedby a composite index including transportation and supply costs. Forconstant dollar foregone earnings of students, average compensation isheld at the 1958 level. Organized education and training outlays for thegovernment sector are deflated by BEA's implicit price deflator for stateand local purchases of goods and services. The same deflator is used for

58 THE FORMATION AND STOCKS OF TOTAL CAPITAL
this sector's informal education Direct outlays on librar-ies and museums are deflated by a BEA deflator for religious andwelfare outlays. The deflator for institutional and business public edu-cation costs is based on the cost of the various media per personreached, Religious education expenditures are deflated by the BEAdeflator for religious and welfare activity. Military education costs aredeflated by the BEA deflator for federal government purchases of goodsand services.
Finally, for training costs all compensation is converted into 1958dollars by an index of average compensation adjusted for qualitychange. Nonwage training costs are deflated, for the personal andbusiness sectors, by BEA's private fixed nonresidential investmentprice deflator, and for the government sector, by the price deflator forgovernment purchases of goods and services. The latter is also used todeflate the government sector's formal training costs. For businesssector training costs we used a composite index including the compen-sation deflator and the nonresidential private fixed investment deflator.
Turning to medical care costs, deflators for both personal andbusiness sectors come from the American Medical Association. Govern-ment sector expenditures on health, sanitation, and medical care aredeflated by BEA's price index for government purchases of goods andservices. Hospital depreciation and net interest in real terms arederived by applying base period ratios to constant dollar stock esti-mates. -
In the area of mobility costs, job search costs in the personal sectorare estimated via the implicit BEA price deflator corresponding to thepersonal consumption expenditures category used to get the costs. Forbusiness sector hiring costs a composite index is applied based onBEA's average industry labor compensation adjusted for qualitychanges. The same index is used for frictional unemployment costsother than governmental. For government sector hiring costs, frictionalunemployment costs and immigration costs are deflated by the priceindex of government purchases of goods and services. For moving coststhe BLS transportation services.price index is used, and for travel costsa composite price index for costs of owner-operated and other transpor-tation charges is developed.
CAPITAL STOCKS
TANGIBLE NONHUMAN STOCKS. The estimates of tangible non-human capital were prepared via the perpetual inventory method. Bothcurrent and constant dollar stock figures for the business sector are
THE ACCOUNTING FRAMEWORK AND THE ESTIMATES 59
those published by the BEA, adjusted to our sector definitions. Of thevariants estimated by BEA for private structures and equipment, wechose those based on Treasury Bulletin F service lives less 15 per cent,and the Winfrey S-3 retirement curve. This curve is based on studies ofthe age distribution of retirements for various types of producers'durable goods in the 1930s. It seemed more accurate to apply a mortal-ity curve than to assume retirement of assets at the end of their averagelife. The Bulletin F minus 15 per cent lives were adopted becausestructures and equipment since War II have had a somewhatshorter life than before. Real nonfarm structures were adjusted for thewell-known upward bias of construction cost deflators by using BEA's"constant cost 2" variant, which results in a higher growth of fixedcapital.
Net stocks in all sectors are calculated by using double-decliningbalance depreciation, which is believed to give a more accurate repre-sentation of the decline in values of fixed assets as they age than thestraight-line method.4 A switch was made to straight-line depreciationin all stock calculations when it exceeded that obtained by the declin-ing balance method.
The depreciable stock estimates for the personal and governmentsectors were calculated from investment estimates. Gross investmentswere retired at the end of their average lives and depreciated withinthese periods, by type. The price indexes used for deflating grossinvestment were generally adopted also for reflating real stocks.
Farm and nonfarm gross stocks of residential structures were accu-mulated in constant dollars, using 70-year average lives and 25-yearflat-top retirement patterns centered on average life. Net stocks for thiscategory, as well as for institutional plant and equipment and consumerdurable goods, were derived by using double-declining balance depre-ciation. For household inventories we relied on methodology devel-oped by Epstein.
Government sector real capital stocks, federal as well as state andlocal, are based on Goldsmith's estimates.
The value of total U.S. land in constant dollars has been keptunchanged apart from additions to territory. For most land categorieswe relied on Goldsmith. Sitelland for all sectors is estimated as aconstant proportion of the corresponding real stocks of structures.
Net foreign assets for recent years are from BEA, but are carriedbackward following estimates by Goldsmith. Monetary metals areincluded with net foreign assets. The gold component is compiled from
4. See, for example, George Terborgh, Realistic Depreciation Policy, Chicago,Machinery and Allied Products Institute, 1954.

60 THE FORMATION AND STOCKS OF TOTAL CAPITAL
Federal Reserve Board figures, the silver component, from Treasurydata.
TANGIBLE STOCKS. To estimate the stock of tangiblehuman capital we cumulated the average constant dollar rearing costsper child up to age fourteen and multiplied the cumulative cost by thenumber of persons in each cohort up to age ninety-five plus. Retire-ments are thus automatically accounted for. Summing the total realcosts for all cohorts each year yielded the annual real gross tangiblehuman capital estimates.
Depreciation is calculated by the declining-balance formula, forthe sake of consistency of the net investment and stock estimates withthe nonhuman categories. Real gross and net human stocks can berevalued to current prices by the implicit deflator for rearing costs.Stock calculations required getting investment estimates as far back asthe 1830s.
INTANGIBLE NONHUMAN STOCKS. Capital stock calculations forbasic research are kept fairly simple: annual constant dollar expendi-tures are cumulated without regard to length of time needed for com-pletion (since each step taken adds to new knowledge) and withoutregard to obsolescence or retirement (in view of the cumulative natureof the advance of knowledge). To the extent that these assumptions areexaggerations the portion of applied research that might be treated asbasic research is considered as a tradeoff.
Stocks of applied research and development are estimated by theperpetual inventory method. To this end, R&D is divided into processand product innovations. The latter, in turn, are disaggregated intonondurable and durable, producers' and consumer, defense and nonde-fense goods.
Since information on process-product innovation breakdowns,time lags between R&D and commercial application, and lifespan ofinnovations was unavailable to us, a small survey was made of compa-nies conducting research. Some of these were engaged in business-oriented research and others in government contract work, so that theresults could be applied to all R&D expenditures.
As to product versus process innovations, the results of our surveywere averaged by major product field and weighted by R&D productfield expenditures. Durable goods had a high product-process innova-tion ratio; for nondurable goods the ratio was lower. For governmentsector defense goods the business durable goods ratios were used;other government R&D expenditures, as well as personal sector R&D,were allocated half to process and half to product innovations.
The next problem was that of retiring R&D from stock. It wassubdivided into projects in process and completed projects, the latter
THE ACCOUNTING FRAMEWORK AND THE ESTIMATES 61
being retired. Here again the survey gave some information as to thepercentage of expenditures attributable to projects of different durationand the distribution of the expenditures within projects. These datawere applied for all years to durable and nondurable goods R&Dexpenditures. The survey also gave some indication of the time lagbetween the end of R&D and the application of the innovation, whichenabled us to estimate the amount of R&D ready to enter stock eachyear. Constant percentages were used to derive these magnitudesthroughout the whole period, except for durable goods, where percent-ages varied between prewar and postwar years. Average lifespans ofproduct and process innovations were derived from the same survey.
Separate stock estimates were made for producers' and consumerdurable goods innovations based on BEA input-output data, usingestimated lifespans for various categories of durable goods. Flat-topretirement patterns were constructed, centered at the average lifeexpectancy.
To obtain net stocks and depreciation for applied research anddevelopment the double-declining balance switched depreciationmethod was used: at the point where straight-line depreciation of thenet stock balance gives a larger annual depreciation we switch tostaight-line for the remaining net stock balances.
INTANGIBLE HUMAN STOCKS. For education, general training,and health expenditures, the stock accumulation and depreciationmethods used are analogous. We first estimated the average annual realexpenditures per head by single age groups up to age ninety-five, thenaccumulated per capita lifetime expenditures for each cohort for eachyear covered in the stock calculation, then multiplied this by thenumber of persons in each age group each year and summed across agegroups. This means we had to push the investment estimates backninety-five years prior to 1929, the first year for which stock estimatesexist. Our procedure automatically provides for the retirement ofinvestment in persons who die during the year: expenditures are onlyaccumulated into gross stock for survivors. Basic population figures bysingle years of age are from the Bureau of the Census.
For formal education, whether financed by the personal or govern-ment sector, constant dollar direct costs are broken down into elemen-tary, secondary, higher, and other education, and allocated to agegroups within these educational levels. This allocation is based onproportions by age in the enrollment series for each level. Informaleducation follows the same general procedure. For the portion financedby the personal and business sectors, it is assumed that all ages benefitequally. Government sector costs are allocated equally to persons ofage five and over, and special education investment is traced only to

62 THE FORMATION AND STOCKS OF TOTAL CAPITAL
ages five to seventeen. Military training costs are split between specifictraining and general training, the former cumulated over the period ofactive plus reserve duty, the latter spread over the total male popula-tion, with different ages receiving different weights. Employee trainingis broken down into the same subcategories, with specific training costsincluded in stock for the average duration of job tenure, and generaltraining costs allocated to age groups according to the estimated agedistribution of employment (developed from labor force participationrates, with a deduction for unemployment).
While all of the medical and health investment financed by thepersonal and government sectors is allocated by age groups, businesssector investment is only partly treated that way. Fifty per cent of theinvestment outlays of this sector are considered "general" investmentand are accumulated as stock, as in the case of other human categories.The other half is assumed to be "specific" investment, yielding benefitsonly as long as an employee stays with the original firm. This invest-ment is considered part of stock for the average duration of job tenureonly.
Medical, health, and safety outlays had to be allocated among agegroups as a basis for cumulative real per capita outlays from which grossstocks were calculated. Personal and government expenditures are on aper capita basis and are distributed over various age groups accordingto data from Vital and Health Statistics. Business sector general healthand safety expenditures are divided by the population (ages fourteen toseventy).
As to mobility stocks, lives are different for each cost category.Since these costs are estimated only for a fraction of persons in a group,life is estimated as the reciprocal of the percentage of people in thegroup. Thus, if in a given year mobility costs are incurred for 20 percent of the employed, the life of these costs is assumed to be five years.Changes in the yearly percentages are taken into account. Hiring costlives are the reciprocal of new hires rates; frictional unemployment costlives are based on layoff rates; and moving and travel costs use theratios of work-oriented migrants to the labor force.
Net capital stocks embodied in humans are derived by depreciat-ing investment units from maturation ages (or the ages at which outlaysare made if later) through age seventy-five. This is done for eachinvestment unit and each age. Per capita accumulations are the nextstep, multiplied by corresponding population figures. The net stocks forthose persons who die before age seventy-five are dropped out at thetime of death.
Double-declining balance switched (to straight line) depreciation isused, constructed so as to approximate depreciation factors published

THE ACCOUNTING FRAMEWORK AND TUE ESTIMATES 63
by the Internal Revenue Service. Depreciation of rearing and medicalcosts is started at age eighteen, education and training, at age twenty-eight. This later age for education and training is derived from lifetimeearnings curves: our depreciation reflects the decline in the lifetimeearning capacity of the human capital. Discounted future earningscurves were obtained from a U.S. Census Bureau study which assumedan annual 3 per cent productivity increase and discount rates of 8 to 10per cent per year.5 It indicated appreciation in value of individualsthrough the late twenties, and a pattern of decline thereafter thatseemed to be approximated by our declining-balance switched (tostraight line) depreciation methods.
The real gross and net capital stock estimates, by type, are reflatedto current prices with the same price indexes that are used to deflatecurrent dollar investments, by type. The annual depreciation charges,in constant and current prices, are subtracted from the correspondinggross investment series to obtain net investment estimates.
STOCK VARIANTS. It is assumed that all of the nonhuman capitalis productively employed. But clearly much human capital is embodiedin persons not employed. To estimate employed human capital stockswe applied ratios of employment to population by age group to the totalstock estimates, by type and by age groups. Sector proportions ofpersons engaged were then applied to the productive stocks to obtainsector breakdowns. This treatment does not make allowance for thehuman capital devoted to unpaid economic activity (other than school-work), and the real product estimates are likewise unadjusted for thenonmarket outputs of unpaid labor.6
For organized education the basic method for calculatingemployed stock is the same, except that cost differentials are used. Thedifferentials adjust for differences, by age group, in the stock of organ-ized education embodied in employed persons relative to the totalpopulation. -
All employee training, military education and training, and busi-ness medical stocks are considered employed during estimated averagejob tenures; that is, for the time span that specific investment is retainedin stock. After average job tenure, only general investment is carried instock. Stocks resulting from mobility costs, job search and hiring costs,and moving and travel costs are considered totally employed.
5. Herman P. Miller and Richard A. Hornseth, Technical Paper 16, Bureau of theCensus, 1967.
6. The author is currently engaged in a study involving the expansion of imputa-tions for nonmarket economic activity in the national income accounts, but the resultswere not ready for inclusion in this volume.

64 THE FORMATION AND STOCKS OF TOTAL CAPITAL
Besides employed stocks we also estimate stocks utilized by theprivate domestic business economy by applying a utilization rate tohuman stock employed by the private domestic economy. Utilizationfactors are calculated as the ratio of average weekly hours worked tohours awake, assumed to be 112 per week (7 times 16 per day). The realnonhuman capital stocks are adjusted only for cyclical variations inrates of capacity utilization, relative to selected high-level years takenas 100. Information is not available to determine whether there hasbeen a significant trend in composite utilization rates of nonhumancapital.