the 54rd annual report - mahindra rise - the official ... report cy… · 4 2007 apr launched...
TRANSCRIPT

The 54rd Annual Report
(Jan 1, 2015 – Dec 31, 2015)
Ssangyong Motor Company

History of Ssangyong Motors
1954 Jan Ha Dong-Hwan Motor Workshop was established
1975 May Initial Public Offering
1976 Sep Started to produce a variety of special purpose vehicles
1977 Feb The company name changed to Donga Motor Co., Ltd.
1979 Dec Completed construction of the Pyungtaek Plant
1984 Dec Acquired Geohwa Co., Ltd., and participate Jeep production
1985 Aug Geohwa’s Pusan Plant moved to the Pyungtaek site
1986 Nov Ssangyong Group took over Donga Motor Co., Ltd.
1988 Mar The company name changed to Ssangyong Motor. Co., Ltd.
1988 Jul Acquired English automaker Panther Car Co.
1988 Dec Launched a station wagon type Vehicle “Korando Family”
1991 Feb Entered into the technical partnership with Mercedes Benz AG for developing light commercial
vehicles and diesel engine.
1992 Jun Established “Central R&D Center”
1992 Oct Entered into technical partnership with Mercedes Benz AG for developing gasoline engine
1993 Jan Signed joint capital investment (5%) with Mercedes Benz AG.
1993 Feb Entered into technical partnership with Mercedes Benz AG for luxury passenger vehicle.
1993 Jul Launched a wagon type 4WD vehicle “MUSSO”
1993 Nov Entered into the technical partnership with Mercedes Benz AG for developing large size diesel
engines.
1994 Apr Opened “the After-Sales Service Technical Center” in Daejeon”
1994 Jun Established “Changwon Engine Plant”
1994 Aug Started to produce “Korando New Family” vehicle
1995 Jun Established “Parts Logistics Center” in Choenan, Korea
1995 Jul Launched a Light Commercial Vehicle “Istana”
1996 Jul Launched Box style 4WD, “Korando”

3
1997 Oct Launched luxury sedan “The Chairman”
1998 Jan Merged into Daewoo Group
1998 Jun Launched “New Musso”
1998 Nov Launched 1999 model year of “Chairman”
1999 Jun Launched 7-seater model “New Musso”
1999 Dec Underwent corporate restructuring program
2000 Jan Established independent sales network
2000 Mar Released “Chairman [CM500] and [CM400] series”
2000 Apr Separated from Daewoo Group
Released 2000 model year of “Korando”
2000 Jun Launched 2001 model year of “Musso”
2001 Feb Launched “Musso”, “Korando”, “Istana” New lineup
2001 Dec Signed a contract for Normalization of Management
2002 Sep Launched first SUT in Korea “Musso Sports”
2003 Jan Sign contract for CKD Business with Shanghai Huizhong Automobile Manufacturing Company
(SHAC), China
2003 Sep Launched “New Chairman”
2003 Dec Launched “New Rexton”
2004 May Launched “Rodius”
2004 Sep Completed construction of Changwon 2nd Plant
2004 Oct SAIC Motor Corporation Ltd. signed a contract for transfer of creditors’ security holdings.
2005 Jan Became a subsidiary company of SAIC Motor Corporation Ltd.
2005 Feb Started to provide Telematics service “Everway”
2005 Jun Launched “Kyron”
2005 Oct Launched “Actyon”
2006 Mar Launched “Rexton II”
2006 Apr Launched “Actyon Sports”
2006 Dec Major shareholder has been changed from SAIC Motor Corporation Ltd. to Shanghai Automotive
Company Ltd.

4
2007 Apr Launched “New Kyron”
2007 Jul Launched “New Rodius”
2007 Oct Launched “Rexton II Euro”
2007 Dec Launched 2008 Year Model of “New Kyron”, “Actyon” and “Actyon Sport”
2008 Jan Launched “Chairman H”
2008 Feb Launched “Chairman W”
2008 Jul Established EU Representative office in Spain
Launched 2009 model year of Rexton II, New Kyron, Actyon, Actyon Sports
Completed the extension work of the “After-Sales Service Technical Center” in Daejeon
Actyon won “Energy Winner Award”
2008 Sep Launched 2009 model year of “Chairman W 3.2”
2008 Nov Awarded “Safest Warehouse of the Netherlands 2008” in the Netherland
2009 Jan Launched “Chairman H VIP”
Applied for Company Rehabilitation Procedure
2009 Feb Started Company Rehabilitation Procedure
2009 Dec Company Rehabilitation plan was approved
2010 Jan Launched 2010 model year of “Rexton”, “Kyron” and “Actyon Sports”
2010 Aug Launched “Rexton RX4”
2010 Nov Ssangyong and Mahindra signed definitive agreement on investment
– takeover price KRW522.5 billion (Subscription of new stocks – KRW427.1 billion, takeover of
corporate bond – KRW95.4 billion)
2011 Feb Mahindra & Mahindra took over Ssangyong Motor Company
Launched “Korando C”
2011 Mar Completed Company Rehabilitation Procedure
2011 May Launched “Rexton Out-Door Edition Model”
2011 May Launched “Chairman H New Classic”
2011 Jul Launched “New Chairman W”
2012 Jan Launched “Korando Sports”

5
2012 Mar Launched “Rexton Euro V”
Launched “Korando C CHIC M/T”
2012 Apr Launched 2013 Model year of “Chairman H” and “Chairman W”
2012 May Launched “Rexton W (3rd
generation)”
2012 Jul Launched “Rodius Euro”
2012 Aug Launched “Korando Sports Mania (4WD 6 speed M/T)”
2013 Feb Launched “Korando Turismo”
2013 Apr Launched “Chairman W Summit”
2013 May Launched 2014 model year of “Korando Sports”
2013 Jun Launched “Korando Turismo Chateau”
2013 Aug Launched “New Korando C”
2013 Dec Korando brand won “Grand prize in marketing innovation”
2014 Jan New Korando C won “Korea Green-Car Award”
2014 Apr Launched new BI of Korando Brand (LUV KORANDO)
2014 Jul Launched Korando Sports 2015
2014 Dec Grand Prize in Korea marketing brand
2015 Jan Launched 2015 SUV (Korando C, Korando Sports, Korando Turismo, Rexton W)
2015 Jan Launched Tivoli gasoline model
2015 Jan Tivoli won “Korea Green-Car Award”
2015 Apr Tivoli won “ Human engineering design grand prix”
2015 Jul Tivoli diesel won “ Energy Winner”
2015 Jul Launched” KorandoC2.2, Tivoli diesel”
2015 Sep Launched” Korando Turismo, Rexton W2.2”
2015. Dec Tivoli won “ Safe Car of this year”

6
[54th Annual Shareholders’ Meeting]
Opening Remarks
Honorable Shareholders,
I would like to express my deepest appreciation to you for taking the time out of your busy schedule
to attend Ssangyong Motor’s 54th Annual General Shareholders’ Meeting.
In 2015, due to the success of Tivoli, Ssangyong Motor accomplished meaningful achievements such
as an increase in our sales and a profitable quarter among others.
With Tivoli’s popularity, the Company’s domestic sales posted a new record in twelve years last year
showing the highest growth rate in the auto industry and grew for six consecutive years since 2010.
Furthermore, Tivoli became the No. 1 SUV brand in the B-segment and the Company’s biggest
volume model since the Company’s foundation, breaking Rexton’s sales record.
With Tivoli, the Company built the basis for sustained growth, which enables us to share our vision
and increase confidence in Ssangyong Motor.
Another significant milestone was achieved when the Company resolved the issue of rehiring the
dismissed workers, which was an obstacle to the Company’s growth during the past six years,
through a labor-labor-management dialogue so that it can focus more on a turnaround of the
Company.
Above all, by solving the issue, we were able to remove the negative views on the Company and
improve our credit standing, which will serve as a basis for a leap forward into the future.
Honorable Shareholders,
This year, Ssangyong Motor will grow with the launch of the Tivoli Air in the growing SUV market.

7
Tivoli Air, which is another Tivoli made suitable for the Millennial Generation that places an
importance on uniqueness and personal lifestyles, will be creating a new market for the small to
mid-sized SUVs, leading growth in the market.
In particular, Tivoli Air will be an optimal model to meet the demand for leisure SUV vehicles in the
small SUV segment, which is on a growing trend worldwide, and it will be sold under the brand
name XLV in overseas markets.
With Tivoli and the newly-launched Tivoli Air, Ssangyong Motor will achieve global sales of
approximately over 150,000 units, which is a 7% year-on-year increase.
As Tivoli played a pivotal role in helping the Company grow, the new Tivoli Air will also play a key
role in expanding our global sales.
The brand Tivoli will become a representative brand of Ssangyong Motor by selling more than
100,000 units a year. It will contribute to the turnaround of the Company and help the Company
achieve its mid- to long-term plan.
To turn this year into a meaningful year in our preparations for a new future, Ssangyong Motor will
lay the groundwork for a turnaround, establish a system to flexibly address the global automotive
market requirements, focus on system improvement for production efficiency and quality
management based on a cooperative relation with our labor union.
Most importantly, to achieve a turnaround this year, we will focus on increasing our profitability,
efficiently manage our costs, and strengthen our internal competencies to prepare for the
uncertainties in our business environment.
Furthermore, we will continue to maintain and strengthen the productive and cooperative labor-
management relations, which has been a basis for normalizing our business operations during the
past six years.
Honorable Shareholders,
With Tivoli, Ssangyong was able to prove itself as a strong SUV automaker.
8
We will continue to actively reflect the market needs in the development of our new product and
lead the trend to build up our reputation as a strong SUV player.
Following Tivoli, there will be new products with global competitiveness such as the successor
model for the Rexton W and a new luxury pick-up truck, which we will introduce in line with our
plan to increase our product competitiveness.
We will focus our resources in the development of new products as it is an investment into the
Company’s growth engine for the future.
Such efforts will bring us closer to realizing our vision and help the Company become a true global
SUV specialized company.
In this regard, I would like to ask you for your support as Ssangyong Motor takes a vigorous step into
the future.
I wish all our shareholders and their families good health and happiness.
Thank you.
President & CEO
Johng Sik Choi

9
Table of Contents
Ⅰ. Annual Report
1. Corporate Overview --------------------------------------------------------------- 8
2. Sales Performance ----------------------------------------------------------------- 10
3. Parent Company, Subsidiary Company and Company Combination ---- 13
4. Business Performance and Financial Condition for the Past 3 Years --- 14
5. Issues to be Addressed ------------------------------------------------------------ 15
6. Board & Audit Committee Composition ---------------------------------------- 16
7. Major Shareholder Status -------------------------------------------------------- 16
8. Investment in SYMC and SYMC’s Subsidiary Companies ------------------- 17
9. Major Creditors ----------------------------------------------------------------------- 17
10. Important Issues Occurred after Settlement of Accounts ----------------- 17
11. Important Sales Issues -------------------------------------------------------------- 18

10
Ⅰ. Annual Report
1. Corporate Overview
1) The objective of the company
(1) Manufacture and sale of various automobiles and parts thereof
(2) Manufacture and sale of various heavy equipment and parts thereof
(3) Repair of various automobiles and heavy equipment
(4) Agency of automobile inspection (5) Manufacture of fire-fighting equipment (6) Export and import and agency thereof (7) Wholesale of automobile parts (8) Issue of offer sheets for sale of goods (9) Manufacture and production of various
engines and related parts (10) Agency of automobile registration (11) Sales and consignment sale of good
imported or exported
(12) Sale and lease of real estate, equipment and facilities
(13) Management of automobiles (used car sale; car scrapping agency; automobile lease)
(14) Manufacture and sale of various molds (15) E-commerce and internet-related business (16) Various types of valued-added
telecommunication business and specially-designated telecommunication business including an automobile information business, and sale and lease business of related equipment
(17) Other businesses incidental to any of the foregoing
2) Core business
Manufacturing and sales of various automobiles and parts

11
3) Plant and other premises
Name Major Business Location
Pyeongtaek plant (Main Office) Manufacture of vehicles 455-12, Dongsak-ro, Pyeongtaek-si, Gyeonggi-do
Changwon plant Manufacture of engines 10, Gongdan-ro 474beon-gil, Seongsan-gu, Changwon-si, Gyeongsangnam-do
Seoul Service Center and 12 other sites
Maintenance and part sales
243, Gurodong-ro, Guro-gu, Seoul
4) Employees data
Gender Office workers Factory workers Others Total Remarks
Male 1,492 3,162 7 4,661 -
Female 82 5 28 115 -
Total 1,574 3,167 35 4,776 -
5) Matters related to shares
① Type and number of issued shares
(Unit: Share, thousand KRW) Sort of stock The number of stocks Amount % of common stock Remarks
Common Stock 137,220,096 686,100,480 100% -
② Changes in capital
(Unit: Share, thousand KRW)
Date Sort of stock
Increase / Decrease After Change
Remarks Shares Amount Shares
Amount of Capital
2009.12.28 Common (88,825,632) (444,128,160) 31,978,988 159,894,940 Reduction of capital

12
2009.12.29 Common 76,431,443 382,157,215 108,410,431 542,052,155 Debt-equity swap
2010.01.18 Common (72,289,875) (361,449,375) 36,120,556 180,602,780 Reduction of capital
2010.07.21 Common 417,045 2,085,225 36,537,601 182,688,005 Debt-equity swap
2011.01.04 Common 5,193 25,965 36,542,794 182,713,970 Debt-equity swap
2011.02.09 Common 85,419,047 427,095,235 121,961,841 609,809,205 Paid-in capital increase
(to the 3rd
party)
2012.05.19 Common 644,550 3,222,750 122,606,391 613,031,955 Paid-in capital increase
(to the 3rd
party)
2012.08.15 Common 68,250 341,250 122,674,641 613,373,205 Paid-in capital increase
(to the 3rd
party)
2013.05.23 Common 14,545,455 72,727,275 137,220,096 686,100,480 Paid-in capital increase
(to the 3rd
party)
③ General affairs on shares
Closing date December 31st
Period of closing shareholders’ registry January 1
st - January 10
th Base date December 31st
Public notice SYMC’s Website (http://www. smotor.com) or Kukmin IlBo
Type of share certificates
Eight types : One (1), Five (5), Ten (10), Fifty (50), One Hundred (100),
Five Hundred (500), One Thousand (1,000), and Ten Thousand (10,000)
Agent Name Korea Securities Depository
Location 23, Yeouinaru-ro 4-gil, Yeongdeungpo-gu, Seoul, Korea
6) Corporate bond
(Unit: thousand KRW)
Type of bond Date of issue Issue
amount Interest
rate
Outstanding
amount
Repayment date
Payment guaranteed
by
- - - - - - -

13
2. Sales Performance
1) Overall outlook
① Domestic market
Sales volume of the domestic automotive market in 2015 recorded 1,598,393 units of sales, showing 8.6% rise YoY. Despite slow economy and aggressive marketing strategies of imported cars, the domestic makers’ constant efforts for product development and the government’s economic policies played key roles in market expansion.
PC : Increasing demand for RV and imported cars, and the aged models in all sized vehicles, the PC market showed little performance. Despite all the efforts of the domestic makers to overcome these difficulties, the PC market decreased by 3.0% YoY.
RV : RV market in 2015 enjoyed sales boom. New model launches of the domestic makers as well as growing interest for leisure activities went on to market expansion and showed 33.1% of sales increase YoY.
SUV: Increased by 33.9% YoY thanks to the successful launch of Tivoli and the introduction of new models of domestic makers.
CDV: Increased by 29.6% YoY thanks to the continuous popularity of All New Carnival and Korando Turismo.
SYMC : SYMC sales increased by 44.4% YoY (highest in the industry) thanks to the successful launch of Tivoli Gasoline/Diesel models and consistent sales power of Korando Sports.
(Unit: Vehicle - CBU only)
Classification 2015 2014 2013 Tivoli 45,021 - -
Rexton W 6,087 7,132 7,608
Korando C 15,677 21,840 19,317
Korando Sports 25,905 28,292 23,435
Chairman H 1 1,117 1,329
Chairman W 1,290 1,580 1,886
Korando Turismo 5,683 9,075 10,395
Total 99,664 69,036 63,970

14
② Overseas market
Global automotive market showed a slow growth except Europe and the US. Economic downturn
got worsened especially in Brazil and Russia, and China, which used to lead the market, was also
down in terms of growth rate.
Despite this difficult economic time, SYMC achieved considerable performance by launching
Tivoli, the market-leading small SUV. Tivoli was ranked ‘The Best Car of the Year’ in several
European markets and its excellent marketability and competitiveness is widely recognized by
our consumers.
SYMC sold 44,877 units, excluding CKD, in 2015. Sales volumes is expected to keep increasing, as
Tivoli diesel, which launched in the 2nd half of 2015, was well received and successful in Europe.
In 2016, we will boost our sales in overseas market by launching Tivoli long version.
(Unit: Vehicle - CBU only) Classification 2015 2014 2013
Rexton W 4,360 6,225 7,291
Korando C 9,421 37,863 37,437
Tivoli 18,672 - -
Korando Sports 8,399 9,427 11,966
Actyon 388 2,683 1,481
Kyron - 8,880 15,335
Chairman W 15 38 74
Korando Turismo 3,622 5,731 5,156
Total 44,877 70,847 78,740

15
2) Production performance (Unit: Vehicle)
Category 54th 53
rd Remarks
Passenger car 1,359 2,458 Chairman W, Chairman H
RV 144,274 137,801 Korando C, Korando Sports, Rexton W, Korando
Turismo ,Kyron, Actyon,Tivoli
Total 145,633 140,259
3) Sales performance
(Unit: Mil. KRW, Vehicle)
Category 54th 53rd
Remarks Volume Amount Volume Amount
Passenger car 1,306 67,794 2,735 118,211 Chairman H, Chairman W
RV (Including CKD) 143,458 2,954,214 138,312 2,842,865
Korando C, Korando Sports, Korando Turismo, Rexton W, Kyron, Actyon
Others (Parts) 363,548 353,820
Total 144,764 3,385,556 141,047 3,314,896
4) Major asset increase and their financing status
(Unit: Mil. KRW)
Investment areas Amount Financing details
Land
Building, Structures 7,645
Vehicle Transport Equipment 528
Machines 66,688
Tools 143,809
Equipment etc. 5,035
Total 223,705

16
3. Parent company, subsidiary company and company combinations
1) Parent company status
Parent company name Mahindra & Mahindra Ltd.
Parent company address Gateway Building, Apollo Bunder, Mumbai 400 001, India
Capital stock INR 2,960,600,000
Major business areas
Vehicle manufacturing and related business
Number of shares in SYMC
99,964,502 shares % shareholding 72.85%
Major business with parent company
Revenue (part sales, etc.) : 1,694 mil. KRW Revenue(CKD sales) : 379mil. KRW Expenses (PTU etc.) : 1,945 mil. KRW Revenue(with 100% subsidiary of Mahindra & Mahindra Ltd.) : 5,211mil. KRW
※ The above capital stock is as of Sep 30, 2015. 2) Subsidiary company status
(Unit: Share)
Subsidiary company Relationship with SYMC
Company name Location Capital Core business
areas Number of
shares owned % of shares
owned
Business relations with
SYMC
Ssangyong(Shangha
i) Automotive Co.,
Ltd. China
30,000,000 (CNY)
Sale of vehicles and
vehicle parts
No stock issued
100% -
Ssangyong
European Parts
Center BV
Netherla
nds 700,000
(EUR) Sale of
vehicle parts 7,000 100%
Import & sale
of
vehicle parts
SY Auto Capital Co.,
Ltd. Korea
20,000,000,
000(WON)
Sales Finance
company of vehicle
2,040,000 51% Sales Finance
company of vehicle

17
3) Concurrent posts in parent or subsidiary companies
Directors Concurrent office
Name Position in
SYMC Company
Position in concurrent
office
Responsible area
Remarks
Choi, Johng Sik
President Ssangyong(Shanghai) Automotive Co., Ltd.
Representative Director
- -
Chung, Yong Won
Managing Director
Ssangyong(Shanghai) Automotive Co., Ltd.
Director - -
Lee, Jong Dae
Assistant Managing Director
Ssangyong European Parts Center BV
Director - -
Vasudev
Tumbe Vice President
SY Auto Capital Co.,
Ltd. Director
Song,
Young Han
Executive
Director
SY Auto Capital Co.,
Ltd. Director
4. Business performance and financial condition for the past 3 years
1) Business Performance – 54th, 53rd, 52nd
(Unit: Mil. KRW)
Title of account 54
th 53
rd 52
nd
(Jan 1, 2015 –
Dec 31, 2015) (Jan 1, 2014 –
Dec 31, 2014) (Jan 1, 2013 –
Dec 31, 2013)
Ⅰ. Sales 3,385,556 3,314,896 3,475,186 Ⅱ. Cost of sales 2,868,338 2,867,899 2,980,410 Ⅲ. Gross profit 517,218 446,997 494,776 Ⅳ. Selling and administrative expenses 550,411 524,842 505,389 Ⅴ. Operating profit (Loss) (33,193) (77,845) (10,613) Ⅵ. Non operating income 31,830 47,614 45,925 Ⅶ. Non operating expenses 29,825 54,096 61,686 Ⅷ. Financial income 17,731 50,717 42,212 Ⅸ. Financial expenses 45,202 17,026 19,616

18
Ⅹ. PBT (58,659) (50,636) (3,778) XI. Corporate tax - - 0 XII. Net income (loss) (58,659) (50,636) (3,778) ※ Above financial statements are drawn up based on K-IFRS(Separate).

19
2) Financial Condition - - 54th, 53rd, 52nd
(Unit: Mil. KRW)
Title of Account 54
th 53
rd 52
nd
(as of Dec 31, 2015) (as of Dec 31, 2014) (as of Dec 31, 2013)
Ⅰ. Current assets 605,694 594,352 906,981 Ⅱ. Non - Current assets 1,441,896 1,379,493 1,216,832
Total assets 2,047,590 1,973,845 2,123,813 Ⅰ. Current liabilities 878,408 821,307 947,558 Ⅱ. Non - current liabilities 443,373 369,442 286,211
Total liabilities 1,321,781 1,190,749 1,233,769 Ⅰ. Capital stock 686,100 686,100 686,100 Ⅱ. Other capital surplus 131,678 129,383 129,384 Ⅲ. Other capital adjustment 227 (14,167) 26,834 Ⅳ. Retained earnings(Deficit) (92,196) (18,220) 47,726
Total equity 725,809 783,096 890,044 Total liabilities and equity 2,047,590 1,973,845 2,123,813
※ Above financial statements are drawn up based on K-IFRS(Separate).
5. Issues to be addressed
N/A
20
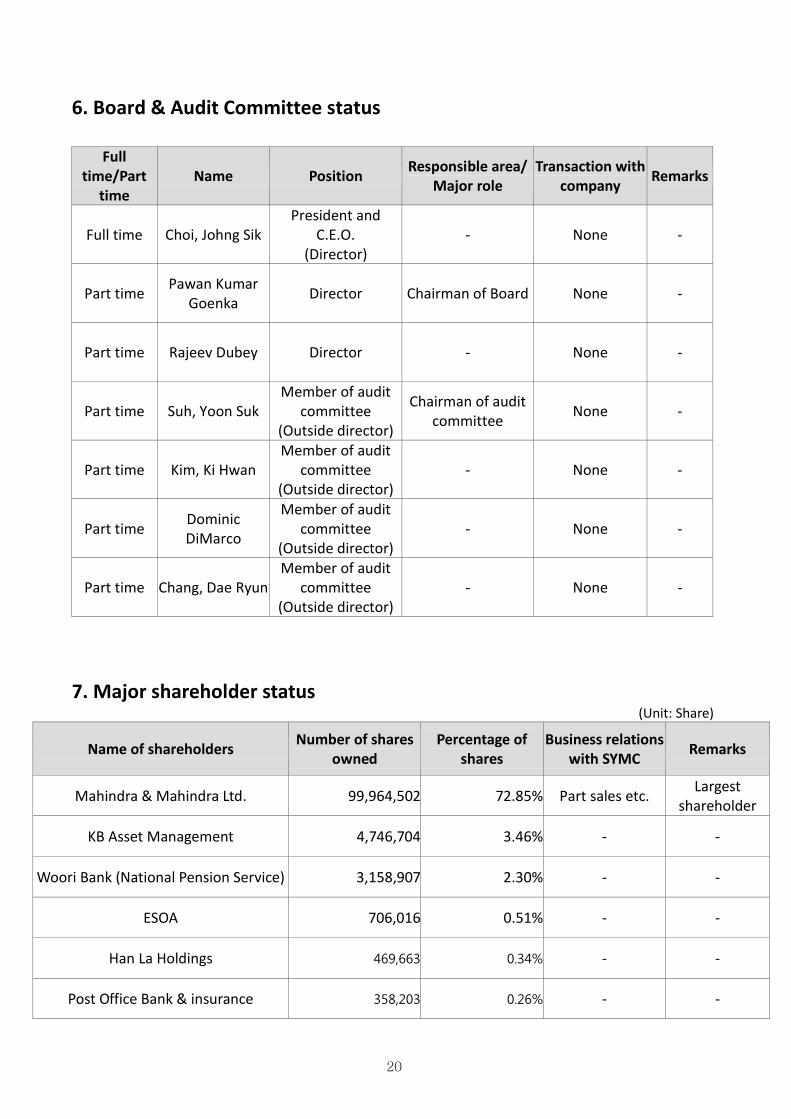
6. Board & Audit Committee status
Full time/Part
time Name Position Responsible area/
Major role Transaction with
company Remarks
Full time Choi, Johng Sik President and
C.E.O. (Director)
- None -
Part time Pawan Kumar Goenka Director Chairman of Board None -
Part time Rajeev Dubey Director - None -
Part time Suh, Yoon Suk Member of audit
committee (Outside director)
Chairman of audit committee None -
Part time Kim, Ki Hwan Member of audit
committee (Outside director)
- None -
Part time Dominic DiMarco
Member of audit committee
(Outside director) - None -
Part time Chang, Dae Ryun Member of audit
committee (Outside director)
- None -
7. Major shareholder status (Unit: Share)
Name of shareholders Number of shares
owned Percentage of
shares Business relations
with SYMC Remarks
Mahindra & Mahindra Ltd. 99,964,502 72.85% Part sales etc. Largest
shareholder
KB Asset Management 4,746,704 3.46% - -
Woori Bank (National Pension Service) 3,158,907 2.30% - -
ESOA 706,016 0.51% - -
Han La Holdings 469,663 0.34% - -
Post Office Bank & insurance 358,203 0.26% - -

21
8. Investment in other companies by SYMC and its subsidiaries (solely or collectively)
(Unit: Share)
Name of other company* Investment
company
Investment in other companies Other companies’
investment in SYMC
Number of shares owned
Percentage of shares owned
(%)
Number of shares owned
Percentage of shares
(%)
Ssangyong (Shanghai) Automotive Co., Ltd.
SYMC - 100% - -
Ssangyong European Parts Center BV
SYMC 7,000 100% - -
SY Auto Capital Co., Ltd. SYMC
& KB Capital 2,040,000 51%
SY Auto
Capital Co.,
Ltd.
SYMC & KB
Capital * The companies where SYMC has more than 10% of total shares.
9. Major creditors (Unit: Mil. KRW, Share)
Creditor name Credit amount Number of
shares owned Percentage of shares owned
Remarks
Woori Bank 55,000 0 0.00% -
Bank of America Merrill Lynch 37,814 0 0.00% -
Korea Development Bank 30,000 0 0.00% -
Deutsche Bank 20,166 0 0.00% -
J.P.Morgan Chase Bank 20,044 0 0.00% -
Standard Chartered Bank 15,106 0 0.00% -
Korea Exchange Bank 12,595 0 0.00% -
10. Important issues after closing date N/A

22
11. Other important matters related to Business
1) Business Performance – Consolidated Income Statement (54th, 53rd, 52nd)
(Unit: Mil.KRW)
Income statement 54
th 53
rd 52
nd
(Jan 1, 2015 – Dec 31, 2015)
(Jan 1, 2014 – Dec 31, 2014)
(Jan 1, 2013 – Dec 31, 2013)
Ⅰ. Sales 3,390,065 3,326,589 3,484,871
Ⅱ. Cost of sales 2,868,750 2,869,466 2,981,953
Ⅲ. Gross profit 521,315 457,123 502,918
Ⅴ. Selling and administrative expenses 557,127 534,061 511,866
Ⅳ. Operating profit (Loss) (35,812) (76,938) (8,948)
Ⅴ. Non-operating income 31,871 47,254 46,018
Ⅶ. Non-operating expense 29,825 54,098 60,932
Ⅷ. Financial income 17,403 50,130 41,549
Ⅸ. Financial expense 45,215 17,042 19,737
X. Joint enterprise profit(loss) (332)
XI. PBT (61,910) (50,693) (2,050)
XII. Corporate tax 32 226 348
XIII. Net income (loss) (61,942) (50,919) (2,398)
※ Above financial statements are drawn up based on the K-IFRS(Consolidated).

23
2) Financial condition - Consolidated Statements of Financial Condition (54th, 53rd, 52nd)
(Unit: Mil. KRW)
Statement of financial position 54
th 53
rd 52
nd
(As of Dec 31, 2015) (As of Dec 31, 2014) (As of Dec 31, 2013)
Assets
Ⅰ. Current assets 613,893 603,229 906,394
Ⅱ. Non-current assets 1,425,305 1,365,203 1,211,231
Total assets 2,039,198 1,968,432 2,117,625
Liabilities - - -
Ⅰ. Current liabilities 878,770 821,606 947,216
Ⅱ. Non-current liabilities 443,373 369,442 286,211
Total liabilities 1,322,143 1,191,048 1,233,427
Shareholders’ equity - - -
Ⅰ. Capital stock 686,100 686,100 686,100
Ⅱ. Other capital surplus 131,678 129,383 129,383
III. Other capital adjustments 1,571 (13,064) 27,521
Ⅳ. Retained earnings (102,294) (25,035) 41,194
Total Shareholders’ equity 717,055 777,384 884,198 Total liabilities and shareholders’
equity 2,039,198 1,968,432 2,117,625
※ Above financial statements are drawn up based on the K-IFRS(Consolidated).

24
The Audit Committee’s Report
As members of the Audit Committee of Ssangyong Motor Company, we have audited accounting and business of the 54th business year starting from January 1, 2015 to December 31, 2015. Hereby we report the result of the audit as follows. 1. Outline of the Audit Methods
(1) Financial Audits For financial audits, we looked through finance-related books and documents, reviewed financial statements, consolidated financial statements and attached specifications. Upon necessary, we conducted an investigation using comparison, inspection, observation and inquiry and other proper auditing procedures.
(2) Audits on Business For audits on business, we attended the BOD meetings and other important meetings. We were briefed on sales by BOD when it is required. We looked into documents regarding important business matters and closely examined the contents of documents. We conducted audits using proper auditing method.
2. Issues Related to Filling in separate Statement of Financial Position, consolidated Statement of Financial Position, separate Statement of Comprehensive Income, consolidated Statement of Comprehensive Income In the separate Statement of Financial Position, consolidated Statement of Financial Position, separate Statement of Comprehensive Income, consolidated Statement of Comprehensive Income, the company’s asset and status of profits and losses are being filled in properly, according to the law and articles of incorporation.
3. Issues Related to Statement of appropriation of deficit
The Statement of appropriation of deficit is being filled in properly given the company’s property status and other situations, according to the law and articles of incorporation.
4. Issues related to Annual Report
Annual report demonstrates company’s situations accurately according to the law and the articles of incorporation.
Feb 16, 2016 Ssangyong Motor Company
Chairman of the Audit Committee Suh, Yoon Suk Member of the Audit Committee Kim, Ki Hwan Member of the Audit Committee DiMarco, Dominic Member of the Audit Committee Chang, Dae-Ryun

25
Independent Auditors’ Report (Consolidated)
To the Shareholders and Board of Directors of
Ssangyong Motor Company:
Report on the Consolidated Financial Statements
We have audited the accompanying consolidated financial statements of Ssangyong Motor Company (the “Company”)
and its subsidiaries, which comprise the consolidated statements of financial position as of December 31, 2015 and
December 31, 2014, respectively, and the consolidated statements of comprehensive income, consolidated statements
of changes in stockholders’ equity and consolidated statements of cash flows, all expressed in Korean won, for the
years ended, and a summary of significant accounting policies and other explanatory information.
Management’s Responsibility for the Consolidated Financial Statements
Management is responsible for the preparation and fair presentation of these consolidated financial statements in
accordance with Korean International Financial Reporting Standards (“K-IFRS”) and for such internal control as
management determines is necessary to enable the preparation of consolidated financial statements that are free
from material misstatement, whether due to fraud or error.
Auditors’ Responsibility
Our responsibility is to express an audit opinion on these financial statements based on our audit. We conducted our
audit in accordance with Korean Standards on Auditing (“KSAs”). Those standards require that we comply with ethical
requirements and plan and perform the audit to obtain reasonable assurance about whether the consolidated financial
statements are free from material misstatement.
An audit involves performing procedures to obtain audit evidence about the amounts and disclosures in the
consolidated financial statements. The procedures selected depend on the auditor’s judgment, including the
assessment of the risks of material misstatement of the consolidated financial statements, whether due to fraud or
error. In making those risk assessments, the auditor considers internal control relevant to the entity’s preparation and
fair presentation of the consolidated financial statements in order to design audit procedures that are appropriate in
the circumstances, but not for the purpose of expressing an opinion on the effectiveness of the entity’s internal control.
An audit also includes evaluating the appropriateness of accounting policies used and the reasonableness of
accounting estimates made by management, as well as evaluating the overall presentation of the consolidated
financial statements.
We believe that the audit evidence we have obtained is sufficient and appropriate to provide a basis for our audit
opinion.
Opinion
In our opinion, the consolidated financial statements present fairly, in all material respects, the financial position of the
Company and its subsidiaries as of December 31, 2015, and December 31, 2014, respectively, and its financial
performance and its cash flows for the years then ended in accordance with K-IFRS.
Others
We conducted our audit of consolidated financial statements of the Company and its subsidiaries as of December 31,
2015 in accordance with the former KSAs, known as auditing standards generally accepted in Korea.

26
Our audit also comprehended the translation of Korean Won amounts into Indian rupee amounts and, in our opinion,
such translation has been made in conformity with the basis in Note 2. Such Indian rupee amounts are presented
solely for the convenience of readers.
March 8, 2016 Jong-Ho Ham
Deloitte Anjin LLC 10, Gukjegeumyung-ro, Yeongdeungpo-gu, Seoul

27
Independent Auditors’ Report (Separate)
To the Shareholders and Board of Directors of
Ssangyong Motor Company:
Report on the Financial Statements
We have audited the accompanying separate financial statements of Ssangyong Motor Company (the
“Company”), which comprise the separate statements of financial position as of December 31, 2015 and
December 31, 2014, respectively, and the separate statements of comprehensive income, separate
statements of changes in stockholders’ equity and separate statements of cash flows, for the years ended,
and a summary of significant accounting policies and other explanatory information.
Management’s Responsibility for the Separate Financial Statements
Management is responsible for the preparation and fair presentation of these separate financial statements
in accordance with Korean International Financial Reporting Standards (“K-IFRS”) and for such internal
control as management determines is necessary to enable the preparation of separate financial statements
that are free from material misstatement, whether due to fraud or error.
Auditors’ Responsibility
Our responsibility is to express an audit opinion on these financial statements based on our audit. We
conducted our audit in accordance with Korean Standards on Auditing (“KSAs”). Those standards require
that we comply with ethical requirements and plan and perform the audit to obtain reasonable assurance
about whether the financial statements are free from material misstatement.
An audit involves performing procedures to obtain audit evidence about the amounts and disclosures in the
financial statements. The procedures selected depend on the auditor’s judgment, including the assessment
of the risks of material misstatement of the financial statements, whether due to fraud or error. In making
those risk assessments, the auditor considers internal control relevant to the entity’s preparation and fair
presentation of the financial statements in order to design audit procedures that are appropriate in the
circumstances, but not for the purpose of expressing an opinion on the effectiveness of the entity’s internal
control. An audit also includes evaluating the appropriateness of accounting policies used and the
reasonableness of accounting estimates made by management, as well as evaluating the overall
presentation of the financial statements.
We believe that the audit evidence we have obtained is sufficient and appropriate to provide a basis for our
audit opinion.
Opinion
In our opinion, the separate financial statements present fairly, in all material respects, the financial
position of the Company as of December 31, 2015, and December 31, 2014, respectively and its financial
performance and its cash flows for the years then ended in accordance with K-IFRS.
Others
We conducted our audit of separate financial statements of the Company as of December 31, 2015 in
accordance with the former KSAs, known as auditing standards generally accepted in Korea.

28
Our audit also comprehended the translation of Korean Won amounts into Indian rupee amounts and, in our opinion, such translation has been made in conformity with the basis in Note 2. Such Indian rupee amounts are presented solely for the convenience of readers
March 8, 2016 Jong-Ho Ham
Deloitte Anjin LLC 10, Gukjegeumyung-ro, Yeongdeungpo-gu, Seoul

29
Consolidated Financial Statements 1) Consolidated statements of financial position
54th term (as of 2015.12.31)
53rd term (as of 2014.12.31) (Unit : KRW)
Title of Account 54th 53rd
Assets
I. Current assets 613,893,131,704 603,229,368,132
1. Cash and cash equivalents 197,881,903,860 156,765,307,119
2. Trade receivables 150,989,625,643 155,825,156,587
3. Non-trade receivables 6,452,810,073 18,120,159,877
4. Other current receivables 2,620,029,945 2,814,337,349
5. Derivatives assets 1,707,694,762 1,232,650,000
6. Inventories 247,673,244,137 260,679,203,767
7. Other current assets 6,567,823,284 7,792,553,433
II. Non-current assets 1,425,304,581,581 1,365,202,620,643
1. Non-current financial instruments 6,000,000 6,000,000
2. Other non-current receivables 39,728,011,612 39,605,249,842
3. Non-current available for sale financial assets 560,000,000 560,000,000
4. Property, plant and equipment 1,187,844,822,582 1,173,736,394,354
5. Intangible assets 186,944,584,522 150,915,433,683
6. Deferred income tax assets 19,069,401
7. Join enterprise investment 9,868,177,766
8. Other non-current assets 352,985,099 360,473,363
Total assets 2,039,197,713,285 1,968,431,988,775
Liabilities
I. Current Liabilities 878,769,617,825 821,606,065,098
1. Trade payables 432,432,182,499 367,063,797,398
2. Non-trade payables 172,897,876,291 228,492,719,464
3. Short-term borrowings 153,224,546,132 99,540,013,094
4. Derivatives Liability 24,073,997 14,974,250,000
5. Current debentures
6. Other current payables 32,484,210,527 29,715,325,346
7. Provision for product warranties 56,861,221,537 57,556,475,174

30
Title of Account 54th 53rd
8. Other long-term employees benefit obligation 1,960,778,250 1,770,266,505
9. Other current liabilities 28,884,728,592 22,493,218,117
II. Non-current liabilities 443,372,917,928 369,441,957,752
1. Long term borrowings 37,500,000,000 25,000,000,000
2. Other non-current payables 12,612,613,877 3,534,692,633
3. Retirement benefit obligation 292,005,725,485 246,748,389,222
4. Other long-term employees benefit obligation 14,321,821,345 13,849,311,781
5. Provision for long-term product warranties 86,932,757,221 80,309,564,116
6. Other long-term accounts payable
7. Other long-term liabilities
Total liabilities 1,322,142,535,753 1,191,048,022,850
Shareholders' equity
Owner of the company 717,055,177,532 777,383,965,925
I. Capital stock 686,100,480,000 686,100,480,000
II. Other capital surplus 131,678,359,632 129,383,402,292
III. Other capital adjustments 1,570,930,453 (13,065,230,964)
IV. Accumulated deficit (Retained earnings) (102,294,592,553) (25,034,685,403)
Non-controlling interests
Total shareholders' equity 717,055,177,532 777,383,965,925
Total liabilities and shareholders' equity 2,039,197,713,285 1,968,431,988,775

31
2) Consolidated statements of comprehensive loss
54th term (2015.01.01 - 2015.12.31)
53rd term (2014.01.01 - 2014.12.31)
(Unit : KRW)
Title of Account 54th 53rd
I. Sales 3,390,065,197,470 3,326,589,426,392
1. Goods 3,014,054,040,132 2,945,297,418,909
2. Merchandise 350,581,563,776 356,608,144,654
3. Other sales 25,953,387,219 25,246,697,122
4. Sales discounts (523,793,657) (562,834,293)
II. Cost of sales 2,868,750,169,376 2,869,465,937,057
1. Goods 2,652,038,473,285 2,649,953,258,256
2. Merchandise 193,322,215,415 200,489,275,582
3. Other costs of sales 23,389,480,676 19,023,403,219
III. Gross profit 521,315,028,094 457,123,489,335
IV. Selling and administrative expenses 557,126,822,189 534,061,074,320
1. Selling expenses 382,646,861,772 365,100,750,310
2. Administrative expenses 174,479,960,417 168,960,324,010
V. Operating income(loss) (35,811,794,095) (76,937,584,985)
VI. non-operating income 31,870,877,893 47,254,116,350
VII. non-operating expenses 29,824,782,882 54,097,741,585
VIII. Financial income 17,402,501,531 50,130,408,191
IX. Financial expense 45,215,209,014 17,041,653,171
X. Join venture investment loss 331,822,234
XI. PBT (61,910,228,801) (50,692,455,200)
XII. Corporate tax 31,945,075 226,136,601
XIII. Net income (loss) (61,942,173,876) (50,918,591,801)
Owner of the company (61,942,173,876) (50,918,591,801)
Non-controlling interests
XIV. Other comprehensive income(loss) (681,571,857) (55,895,306,664)
1. Not to be reclassified as profit or loss in future (15,317,733,274) (15,310,234,614)
1) DBO gains/losses (15,317,733,274) (15,310,234,614)
2. To be reclassified as profit or loss in future 14,636,161,417 (40,585,072,050)
1) Gain on valuation of derivatives 14,394,640,000 (41,000,980,000)

32
Title of Account 54th 53rd
2) Gain on overseas operations translation credit 241,521,417 415,907,950
XV. Total comprehensive income (loss) (62,623,745,733) (106,813,898,465)
Owner of the company (62,623,745,733) (106,813,898,465)
Non-controlling interests
XVI. Loss per share
1. Basic and diluted loss per share (452) (371)

33
3) Consolidated statements of changes in shareholders' equity
54th term (2015.01.01 - 2015.12.31)
53rd term (2014.01.01 - 2014.12.31) (Unit : KRW)
Title of Account Capital stock
Other Capital Surplus
Other Capital adjustments
(Deficit) Retained earnings
Non-controlling interests
Total Paid-in capital in excess of par
Gain on capital reduction
Debt to be swapped for
equity Treasury stock
Gain from sales of treasury
stock others
Balance at Jan 1, 2014 686,100,480,000 11,452,712,819 120,351,580,276 931,508,409 (108,530,000) (3,243,869,212) 27,519,841,086 41,194,141,012 884,197,864,390
Net loss (50,918,591,801) (50,918,591,801)
Actuary of defined benefit (15,310,234,614) (15,310,234,614)
Acquisition of treasury stock (1,081,290,000) (1,081,290,000)
Gain on valuation of derivatives (41,000,980,000) (41,000,980,000)
Overseas operations translation credit 415,907,950 415,907,950
Others (2,162,579,212) 3,243,869,212 1,081,290,000
Balance at Dec 31, 2014 686,100,480,000 11,452,712,819 118,189,001,064 931,508,409 (1,189,820,000) (13,065,230,964) (25,034,685,403) 777,383,965,925
Balance at Jan 1, 2015 686,100,480,000 11,452,712,819 118,189,001,064 931,508,409 (1,189,820,000) (13,065,230,964) (25,034,685,403) 777,383,965,925
Net loss (61,942,173,876)
Actuary of defined benefit (15,317,733,274)
Acquisition of treasury stock 1,189,820,000
Gain on valuation of derivatives
Overseas operations translation credit 14,636,161,417
Gain from sales of treasury stock 1,105,137,340
Others
Balance at Dec 31, 2015 686,100,480,000 11,452,712,819 118,189,001,064 931,508,409 1,105,137,340 1,570,930,453 (102,294,592,553) 717,055,177,532

34
4) Consolidated statements of cash flows
54th term (2015.01.01 - 2015.12.31)
53rd term (2014.01.01 - 2014.12.31) (Unit : KRW)
Title of Account 54th 53rd
I. Net cash provided by operating activities 201,547,228,533 68,153,165,582
1. Cash flows from operating activities 201,798,160,082 65,817,326,043
(1)Net loss (61,942,173,876) (50,918,591,801)
(2)Adjustments 217,574,021,485 182,927,510,685
(3)Changes in net working capital 46,166,312,473 (66,191,592,841)
2. Interests received 3,281,173,895 6,170,137,812
3. Interests paid (3,532,372,711) (3,631,001,100)
4. Dividend income received 11,000,000 11,000,000
5. Corporate income tax (10,732,733) (214,297,173)
II. Net cash provided by investing activities (227,994,580,002) (257,545,793,903)
1. Cash inflows from investing activities 8,668,107,056 1,983,997,144
(1) Decrease in other receivables 7,836,121,065
(2) Disposal of property, plant and equipment 718,827,344 1,394,112,144
(3) Disposal of intangible assets 587,760,000
(4) Disposal of subsidiary company stocks
(5) Decrease in other assets 113,158,647 2,125,000
2. Cash outflows from investing activities (236,662,687,058) (259,529,791,047)
(1) Increase in other receivables 8,493,404,205 3,151,174,246
(2) Acquisition of property, plant and equipment 151,095,940,246 183,675,339,056
(3) Acquisition of intangible assets 66,873,342,607 72,703,277,745
(4) Acquisition of sub & joint venture stocks 10,200,000,000
III. Net cash provided by financing activities 67,528,400,147 (21,359,571,782)
1. Cash inflows from financing activities 72,528,400,147 74,045,193,218
(1)Increase in borrowings 70,163,042,023 73,998,948,993
(2)Capital increase with consideration 70,400,784 46,244,225
(3)Government grant 2,294,957,340
2. Cash outflows from financing activities (5,000,000,000) (95,404,765,000)
(1)Redemption of borrowings 5,000,000,000 95,404,765,000
(2)Stock issuance cost
IV. Effect of exchange rate changes on cash and cash equivalents
35,548,064 726,675,112
V. Net increase in cash and cash equivalents 41,116,596,741 (210,025,524,991)
VI. Cash and cash equivalents at the beginning of the period 156,765,307,119 366,790,832,110

35
Title of Account 54th 53rd
VII. Cash and cash equivalents at the end of the period 197,881,903,860 156,765,307,119

36
Separate Financial Statements
1) Statements of financial position
54th term (as of 2015.12.31)
53rd term (as of 2014.12.31) (Unit : KRW)
Title of Account 54th 53rd
Assets
I. Current assets 605,693,863,337 594,352,735,900
1. Cash and cash equivalents 192,773,290,414 149,091,232,392
2. Trade receivables 151,755,651,700 157,682,037,979
3. Non-trade receivables 6,716,048,126 18,341,033,142
4. Other current receivables 2,572,505,080 2,766,808,468
5. Derivatives assets 1,707,694,762 1,232,650,000
6. Inventories 243,631,535,824 257,522,706,161
7. Other current assets 6,537,137,431 7,716,267,758
II. Non-current assets 1,441,896,619,827 1,379,492,936,412
1. Non-current financial instruments 6,000,000 6,000,000
2. Other non-current receivables 50,222,268,256 48,163,338,590
3. Non-current available for sale financial assets 560,000,000 560,000,000
4. Property, plant and equipment 1,187,781,725,798 1,173,658,634,624
5. Intangible assets 186,944,584,522 150,915,433,683
6. Investments in subsidiaries 16,029,056,152 5,829,056,152
7. Other non-current assets 352,985,099 360,473,363
Total assets 2,047,590,483,164 1,973,845,672,312
Liabilities
I. Current Liabilities 878,408,363,253 821,307,196,754
1. Trade payables 432,415,648,781 367,047,418,392
2. Non-trade payables 172,582,354,735 228,240,408,721
3. Short-term borrowings 153,224,546,132 99,540,013,094
4. Derivative liability 24,073,997 14,974,250,000
5. Current debentures
6. Other current payables 32,484,210,527 29,715,325,346
7. Provision for product warranties 56,861,221,537 57,556,475,174
8. Current other long-term employees benefit obligation 1,960,778,250 1,770,266,505

37
Title of Account 54th 53rd
9. Other current liabilities 28,855,529,294 22,463,039,522
II. Non-current liabilities 443,372,917,928 369,441,957,752
1. Long term borrowings 37,500,000,000 25,000,000,000
2. Other non-current payables 12,612,613,877 3,534,692,633
3. Other long-term liabilities
4. Retirement benefit obligation 292,005,725,485 246,748,389,222
5. Other long-term employees benefit obligation 14,321,821,345 13,849,311,781
6. Provision for long-term product warranties 86,932,757,221 80,309,564,116
Total liabilities 1,321,781,281,181 1,190,749,154,506
Shareholders' equity
I. Capital stock 686,100,480,000 686,100,480,000
II. Other capital surplus 131,678,359,632 129,383,402,292
III. Other capital adjustments 227,340,000 (14,167,300,000)
IV. Retained earnings (accumulated deficit) (92,196,977,649) (18,220,064,486)
Total shareholders' equity 725,809,201,983 783,096,517,806
Total liabilities and shareholders' equity 2,047,590,483,164 1,973,845,672,312

38
2) Statements of comprehensive loss
54th term (2015.01.01 - 2015.12.31)
53rd term (2014.01.01 - 2014.12.31)
(Unit : KRW)
Title of Account 54th 53rd
I. Sales 3,385,555,598,276 3,314,895,562,083
1. Goods 3,014,054,040,132 2,945,297,418,909
2. Merchandise 348,189,336,648 352,218,450,532
3. Other sales 23,836,015,153 17,942,526,935
4. Sales discounts (523,793,657) (562,834,293)
II. Cost of sales 2,868,337,736,419 2,867,898,569,834
1. Goods 2,652,038,473,285 2,649,953,258,256
2. Merchandise 194,951,192,602 200,114,890,464
3. Other costs of sales 21,348,070,532 17,830,421,114
III. Gross profit 517,217,861,857 446,996,992,249
IV. Selling and administrative expenses 550,410,785,278 524,842,381,824
1. Selling expenses 379,860,810,431 360,149,049,850
2. Administrative expenses 170,549,974,847 164,693,331,974
V. Operating profit(loss) (33,192,923,421) (77,845,389,575)
VI. Non-operating income 31,829,987,950 47,614,037,731
VII. Non-operating expenses 29,824,657,210 54,096,404,357
VIII. Financial income 17,730,731,850 50,717,416,510
IX. Financial expenses 45,202,319,058 17,025,453,511
X. PBT (58,659,179,889) (50,635,793,202)
XI. Corporate tax
XII. Net income (loss) (58,659,179,889) (50,635,793,202)
XIII. Other comprehensive income(loss) (923,093,274) (56,311,214,614)
1. Not to be reclassified as profit or loss in future (15,317,733,274) (15,310,234,614)
1) DBO gains/losses (15,317,733,274) (15,310,234,614)
2. To be reclassified as profit or loss in future 14,394,640,000 (41,000,980,000)
1) Gain on valuation of derivatives 14,394,640,000 (41,000,980,000)
XIV. Total comprehensive income (loss) (59,582,273,163) (106,947,007,816)
XV. Loss per share
1. Basic and diluted loss per share (428) (369)

39
4) Statements of changes in shareholders' equity
54th term (2015.01.01 - 2015.12.31) 53rd term (2014.01.01 - 2014.12.31)
(Unit : KRW)
Title of Account Capital stock
Other Capital Surplus
Other Capital adjustments
(Deficit) Retained earnings
Total Paid-in capital in
excess of par Gain on capital
reduction
Debt to be swapped for
equity Treasury stock
Gain from sales of treasury
stock
other capital surplus
Balance at Jan 1, 2014 686,100,480,000 11,452,712,819 120,351,580,276 931,508,409 (108,530,000) (3,243,869,212) 26,833,680,000 47,725,963,330 890,043,525,622
Net loss
(50,635,793,202) (50,635,793,202)
Actuary of defined benefit
(1,081,290,000)
(15,310,234,614) (16,391,524,614)
Gain on valuation of derivatives
(41,000,980,000)
(41,000,980,000)
Others
(2,162,579,212
3,243,869,212
1,081,290,000
Balance at Dec 31, 2014 686,100,480,000 11,452,712,819 118,189,001,064 931,508,409 (1,189,820,000) (14,167,300,000) (18,220,064,486) 783,096,517,806
Balance at Jan 1, 2015 686,100,480,000 11,452,712,819 118,189,001,064 931,508,409 (1,189,820,000) (14,167,300,000) (18,220,064,486) 783,096,517,806
Net loss
(58,659,179,889) (58,659,179,889)
Actuary of defined benefit
(15,317,733,274) (15,317,733,274)
Dispose of treasury stock
1,189,820,000
1,189,820,000
Gain on valuation of derivatives
14,394,640,000
14,394,640,000
Gain of treasury stock
1,105,137,340
1,105,137,340
Balance at Dec 31, 2014 686,100,480,000 11,452,712,819 118,189,001,064 931,508,409 1,105,137,340 227,340,000 (92,196,977,649) 725,809,201,983
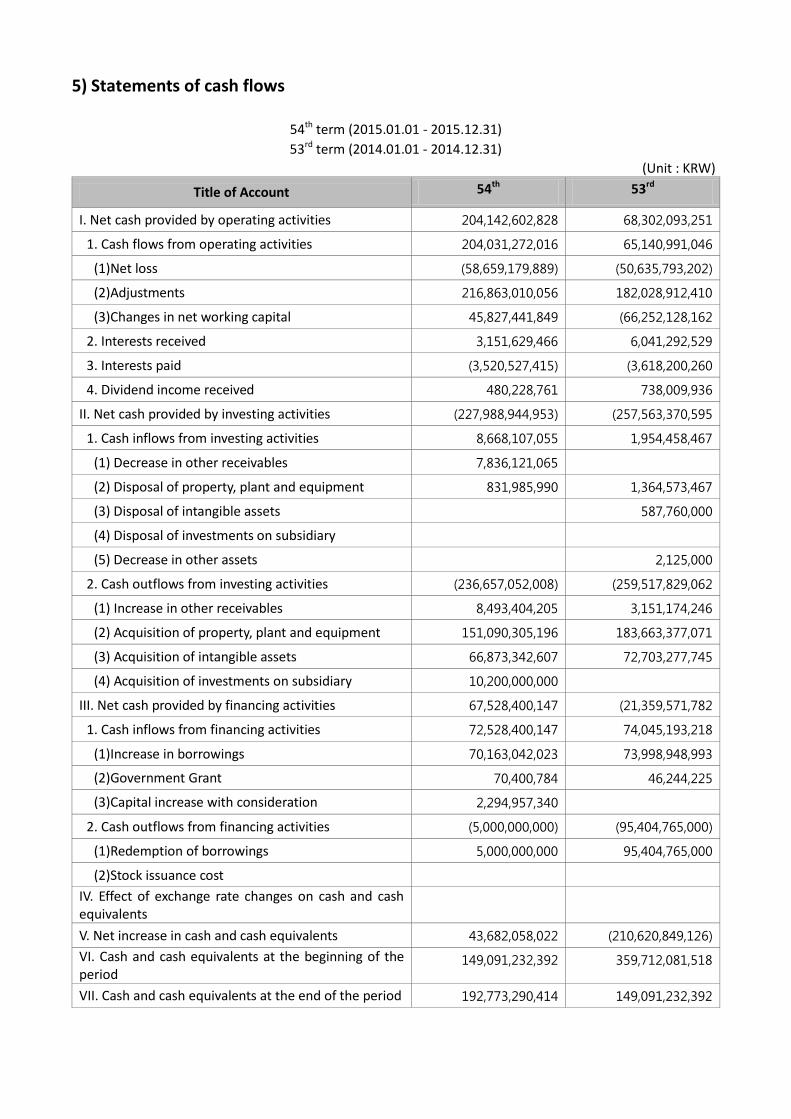
5) Statements of cash flows
54th term (2015.01.01 - 2015.12.31)
53rd term (2014.01.01 - 2014.12.31)
(Unit : KRW)
Title of Account 54th 53rd
I. Net cash provided by operating activities 204,142,602,828 68,302,093,251
1. Cash flows from operating activities 204,031,272,016 65,140,991,046
(1)Net loss (58,659,179,889) (50,635,793,202)
(2)Adjustments 216,863,010,056 182,028,912,410
(3)Changes in net working capital 45,827,441,849 (66,252,128,162
2. Interests received 3,151,629,466 6,041,292,529
3. Interests paid (3,520,527,415) (3,618,200,260
4. Dividend income received 480,228,761 738,009,936
II. Net cash provided by investing activities (227,988,944,953) (257,563,370,595
1. Cash inflows from investing activities 8,668,107,055 1,954,458,467
(1) Decrease in other receivables 7,836,121,065
(2) Disposal of property, plant and equipment 831,985,990 1,364,573,467
(3) Disposal of intangible assets 587,760,000
(4) Disposal of investments on subsidiary
(5) Decrease in other assets 2,125,000
2. Cash outflows from investing activities (236,657,052,008) (259,517,829,062
(1) Increase in other receivables 8,493,404,205 3,151,174,246
(2) Acquisition of property, plant and equipment 151,090,305,196 183,663,377,071
(3) Acquisition of intangible assets 66,873,342,607 72,703,277,745
(4) Acquisition of investments on subsidiary 10,200,000,000
III. Net cash provided by financing activities 67,528,400,147 (21,359,571,782
1. Cash inflows from financing activities 72,528,400,147 74,045,193,218
(1)Increase in borrowings 70,163,042,023 73,998,948,993
(2)Government Grant 70,400,784 46,244,225
(3)Capital increase with consideration 2,294,957,340
2. Cash outflows from financing activities (5,000,000,000) (95,404,765,000)
(1)Redemption of borrowings 5,000,000,000 95,404,765,000
(2)Stock issuance cost
IV. Effect of exchange rate changes on cash and cash equivalents
V. Net increase in cash and cash equivalents 43,682,058,022 (210,620,849,126)
VI. Cash and cash equivalents at the beginning of the period
149,091,232,392 359,712,081,518
VII. Cash and cash equivalents at the end of the period 192,773,290,414 149,091,232,392

41
5) Statement of appropriation of deficit
54th term (2015.01.01 - 2015.12.31)
53rd term (2014.01.01 - 2014.12.31) Expected appropriation date: Mar. 23, 2016 Finalized disposition date: Mar.24, 2015
(Unit : KRW)
Title of Account 54th 53rd
I. Unappropriated earned surplus (92,196,977,649) (18,220,064,486)
1. Unappropriated earned surplus carried forward from the prior year (Unappropriated deficit) (18,220,064,486) 47,725,963,330
2. Net loss (58,659,179,889) (50,635,793,202)
3. DBO gains/losses (15,317,733,274) (15,310,234,614)
II. Appropriation of retained earning
III. Unappropriated earned surplus to be carried forward to the next year (92,196,977,649) (18,220,064,486)