the 2&ngr;2 band of water: analysis of new fts measurements
TRANSCRIPT

JOURNAL OF MOLECULAR SPECTROSCOPY 184, 330–349 (1997)ARTICLE NO. MS977332
The 2n2 Band of Water: Analysis of New FTS Measurementsand High-Ka Transitions and Energy Levels1
S. N. Mikhailenko,* Vl. G. Tyuterev,* K. A. Keppler,† B. P. Winnewisser,‡ M. Winnewisser,‡G. Mellau,‡ S. Klee,‡ and K. Narahari Rao§
*Institute of Atmospheric Optics, Russian Academy of Sciences, Tomsk, Russia and LPMA Faculte des Sciences, Universite de Reims, Reims, France;†Department of Physics, Ohio Northern University, Ada, Ohio; ‡Justus-Liebig-Universitaet Giessen, Giessen, Germany;
and §Department of Physics, The Ohio State University, Columbus, Ohio
Received February 13, 1997; in revised form April 18, 1997
The spectrum of water has been recorded at high resolution in the range 2500–4560 cm01 . The spectrum was recordedat room temperature with a Fourier transform spectrometer using fully evacuated transfer optics and a White-type multi-reflection cell which made large pressure 1 pathlength products possible. Among 3385 lines assigned to transitions tothe first triad of interacting states of H2
16O (bands 2n2 , n1 , and n3) , 940 vibration–rotation transitions have beenassigned to the 2n2 band, approximately 300 of them for the first time. According to our assignments some of thesetransitions, especially high-Ka transitions, show significant deviations from data available in various compilations andin previously published reports. Improved values of vibration–rotation energies of the (020) state up to J Å 17 and Ka
Å 11 were determined. The anomalously strong centrifugal distortion of the (020) rotational levels and their resonanceinteractions with the (100) and (001) levels have been accounted for using the generating function model (1992, Vl. G.Tyuterev, J. Mol. Spectrosc. 151, 97–130; 1995, Vl. G. Tyuterev, V. I. Starikov, S. A. Tashkun, and S. N. Mikhailenko, J.Mol. Spectrosc. 170, 38–58), which allows a good agreement with observed data. The RMS standard deviation of theleast-squares fit of vibration–rotational levels of the (020) state was 2.2 1 1003 cm01 . q 1997 Academic Press
INTRODUCTION range 2500–4560 cm01 , 3385 lines have been assigned totransitions to the first triad of interacting states of H2
16O (bandsThe infrared spectral range is important in the accurate 2n2 , n1 , and n3).
modeling of radiative transfer phenomena, not only in the In this paper we focus on the 2n2 band, which is doublyEarth’s atmosphere but also in other atmospheres as well. interesting for such a study. First, some high-Ka transitionsThis explains the interest in experimental and theoretical and associated upper state energy levels, according to ourstudies of water vapor spectra in the 2–4 mm region in the assignment, show significant deviations from data availablepast (1–10) . in various compilations and in previously published reports.
High-resolution measurements of water bands in the region This will be shown in the last section of this paper. Second,2700–4500 cm01 and the detailed analysis of them performed the experimental information on the high-Ka rotational levelsby Flaud and Camy-Peyret and co-workers (3, 6–9) and by of the bending states is particularly important in order toPugh and Rao (4, 5) in the early 1970s have became spectro- understand the effects of anomalously strong bending–rota-metric standards and a basis for several line parameter compila- tional interactions in H2O (6, 17–28) and to validate relevanttions for water (11–14) including HITRAN (12) and GEISA theoretical models.(13). The improvement of sensitivity and spectral resolutionsince that time has stimulated extensive new FTS measure-
EXPERIMENTAL ASPECTSments including those recently reported by Toth (15) and alsomeasurements by Keppler et al., some results of which have
The infrared spectrum of water was recorded at pressure-been briefly reported elsewhere (16). Here the analysis of part
broadening-limited resolution using the combination of a 4-of these infrared measurements using the Fourier transform
m base length White-type multipass absorption cell (29, 30)spectrometer at the Justus Liebig University in Giessen is pre-
and a Fourier transform infrared (FTIR) spectrometer, thesented. Among a total of over 10 000 lines recorded in the
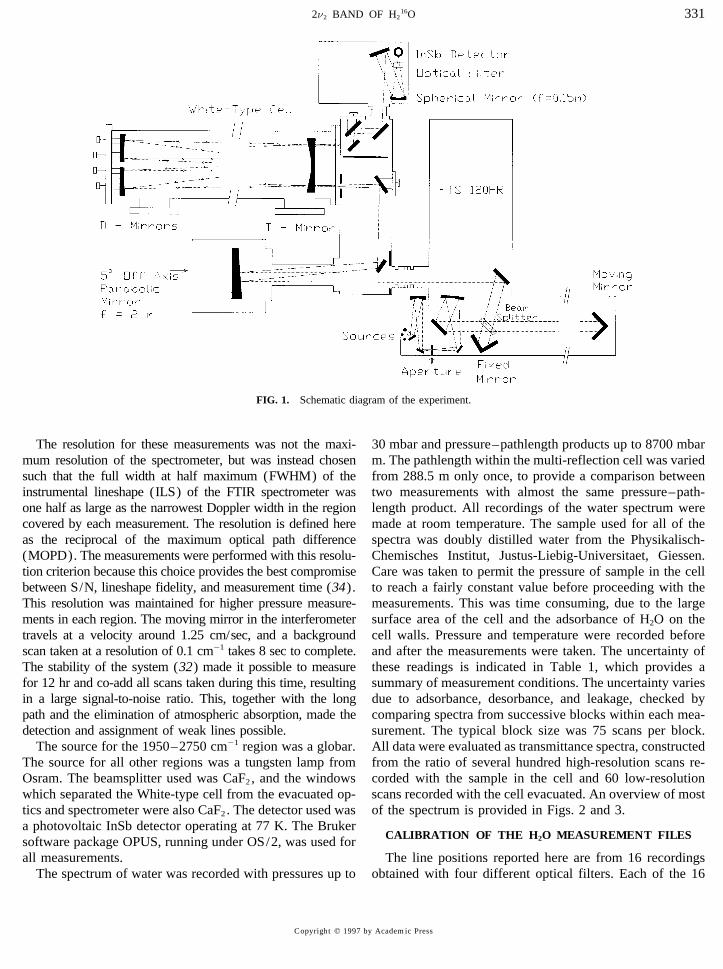
Bruker IFS 120 HR (31) . The experimental setup is shownin Fig. 1. The transfer optics were enclosed in a newly con-
1 Reported in part at HighRus-93 11-th Symposium on High-Resolutionstructed vacuum system in a further development (32) ofMolecular Spectroscopy, Moscow, June–July 1993 and at the 14th Confer-the system used in earlier D2O measurements performed byence on High Resolution Spectroscopy, Prague, Czech Republic, paper J45,
September 1996. Ormsby (33) .
3300022-2852/97 $25.00Copyright q 1997 by Academic PressAll rights of reproduction in any form reserved.
AID JMS 7332 / 6t1e$$$161 08-19-97 14:10:58 mspas
2n2 BAND OF H216O 331
FIG. 1. Schematic diagram of the experiment.
The resolution for these measurements was not the maxi- 30 mbar and pressure–pathlength products up to 8700 mbarm. The pathlength within the multi-reflection cell was variedmum resolution of the spectrometer, but was instead chosen
such that the full width at half maximum (FWHM) of the from 288.5 m only once, to provide a comparison betweentwo measurements with almost the same pressure–path-instrumental lineshape (ILS) of the FTIR spectrometer was
one half as large as the narrowest Doppler width in the region length product. All recordings of the water spectrum weremade at room temperature. The sample used for all of thecovered by each measurement. The resolution is defined here
as the reciprocal of the maximum optical path difference spectra was doubly distilled water from the Physikalisch-Chemisches Institut, Justus-Liebig-Universitaet, Giessen.(MOPD). The measurements were performed with this resolu-
tion criterion because this choice provides the best compromise Care was taken to permit the pressure of sample in the cellto reach a fairly constant value before proceeding with thebetween S/N, lineshape fidelity, and measurement time (34).
This resolution was maintained for higher pressure measure- measurements. This was time consuming, due to the largesurface area of the cell and the adsorbance of H2O on thements in each region. The moving mirror in the interferometer
travels at a velocity around 1.25 cm/sec, and a background cell walls. Pressure and temperature were recorded beforeand after the measurements were taken. The uncertainty ofscan taken at a resolution of 0.1 cm01 takes 8 sec to complete.
The stability of the system (32) made it possible to measure these readings is indicated in Table 1, which provides asummary of measurement conditions. The uncertainty variesfor 12 hr and co-add all scans taken during this time, resulting
in a large signal-to-noise ratio. This, together with the long due to adsorbance, desorbance, and leakage, checked bycomparing spectra from successive blocks within each mea-path and the elimination of atmospheric absorption, made the
detection and assignment of weak lines possible. surement. The typical block size was 75 scans per block.All data were evaluated as transmittance spectra, constructedThe source for the 1950–2750 cm01 region was a globar.
The source for all other regions was a tungsten lamp from from the ratio of several hundred high-resolution scans re-corded with the sample in the cell and 60 low-resolutionOsram. The beamsplitter used was CaF2, and the windows
which separated the White-type cell from the evacuated op- scans recorded with the cell evacuated. An overview of mostof the spectrum is provided in Figs. 2 and 3.tics and spectrometer were also CaF2. The detector used was
a photovoltaic InSb detector operating at 77 K. The BrukerCALIBRATION OF THE H2O MEASUREMENT FILESsoftware package OPUS, running under OS/2, was used for
all measurements. The line positions reported here are from 16 recordingsobtained with four different optical filters. Each of the 16The spectrum of water was recorded with pressures up to
Copyright q 1997 by Academic Press
AID JMS 7332 / 6t1e$$$162 08-19-97 14:10:58 mspas
MIKHAILENKO ET AL.332
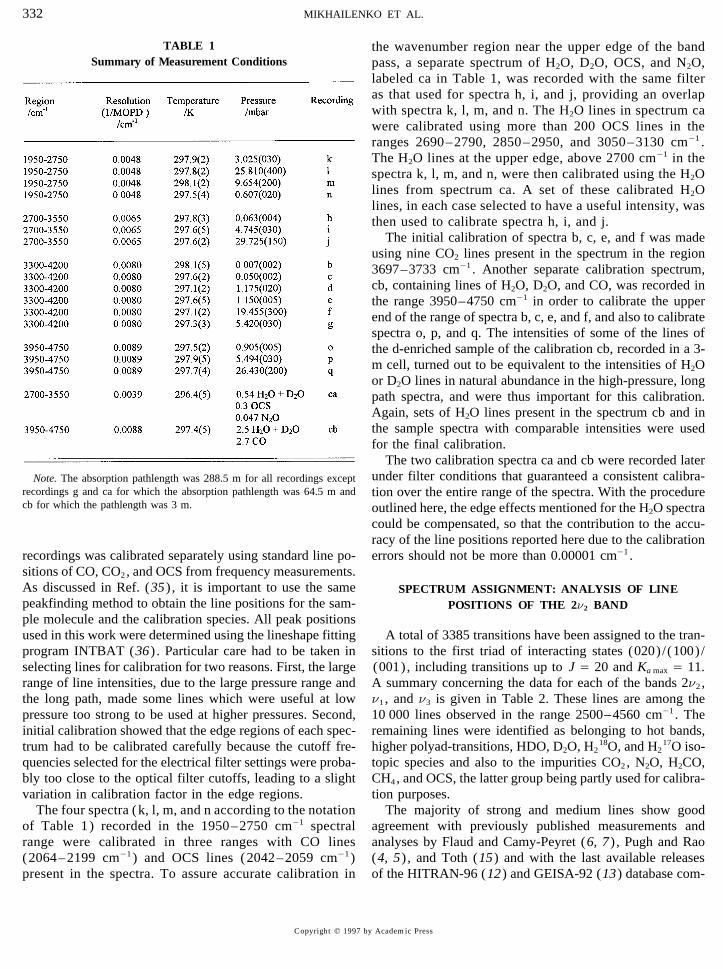
TABLE 1 the wavenumber region near the upper edge of the bandSummary of Measurement Conditions pass, a separate spectrum of H2O, D2O, OCS, and N2O,
labeled ca in Table 1, was recorded with the same filteras that used for spectra h, i, and j, providing an overlapwith spectra k, l, m, and n. The H2O lines in spectrum cawere calibrated using more than 200 OCS lines in theranges 2690–2790, 2850–2950, and 3050–3130 cm01 .The H2O lines at the upper edge, above 2700 cm01 in thespectra k, l, m, and n, were then calibrated using the H2Olines from spectrum ca. A set of these calibrated H2Olines, in each case selected to have a useful intensity, wasthen used to calibrate spectra h, i, and j.
The initial calibration of spectra b, c, e, and f was madeusing nine CO2 lines present in the spectrum in the region3697–3733 cm01 . Another separate calibration spectrum,cb, containing lines of H2O, D2O, and CO, was recorded inthe range 3950–4750 cm01 in order to calibrate the upperend of the range of spectra b, c, e, and f, and also to calibratespectra o, p, and q. The intensities of some of the lines ofthe d-enriched sample of the calibration cb, recorded in a 3-m cell, turned out to be equivalent to the intensities of H2Oor D2O lines in natural abundance in the high-pressure, longpath spectra, and were thus important for this calibration.Again, sets of H2O lines present in the spectrum cb and inthe sample spectra with comparable intensities were usedfor the final calibration.
The two calibration spectra ca and cb were recorded laterunder filter conditions that guaranteed a consistent calibra-Note. The absorption pathlength was 288.5 m for all recordings except
recordings g and ca for which the absorption pathlength was 64.5 m and tion over the entire range of the spectra. With the procedurecb for which the pathlength was 3 m. outlined here, the edge effects mentioned for the H2O spectra
could be compensated, so that the contribution to the accu-racy of the line positions reported here due to the calibrationerrors should not be more than 0.00001 cm01 .recordings was calibrated separately using standard line po-
sitions of CO, CO2, and OCS from frequency measurements.As discussed in Ref. (35) , it is important to use the same SPECTRUM ASSIGNMENT: ANALYSIS OF LINEpeakfinding method to obtain the line positions for the sam- POSITIONS OF THE 2n2 BANDple molecule and the calibration species. All peak positionsused in this work were determined using the lineshape fitting A total of 3385 transitions have been assigned to the tran-
sitions to the first triad of interacting states (020)/(100)/program INTBAT (36) . Particular care had to be taken inselecting lines for calibration for two reasons. First, the large (001), including transitions up to J Å 20 and Ka max Å 11.
A summary concerning the data for each of the bands 2n2 ,range of line intensities, due to the large pressure range andthe long path, made some lines which were useful at low n1 , and n3 is given in Table 2. These lines are among the
10 000 lines observed in the range 2500–4560 cm01 . Thepressure too strong to be used at higher pressures. Second,initial calibration showed that the edge regions of each spec- remaining lines were identified as belonging to hot bands,
higher polyad-transitions, HDO, D2O, H218O, and H2
17O iso-trum had to be calibrated carefully because the cutoff fre-quencies selected for the electrical filter settings were proba- topic species and also to the impurities CO2, N2O, H2CO,
CH4, and OCS, the latter group being partly used for calibra-bly too close to the optical filter cutoffs, leading to a slightvariation in calibration factor in the edge regions. tion purposes.
The majority of strong and medium lines show goodThe four spectra (k, l, m, and n according to the notationof Table 1) recorded in the 1950–2750 cm01 spectral agreement with previously published measurements and
analyses by Flaud and Camy-Peyret (6, 7) , Pugh and Raorange were calibrated in three ranges with CO lines(2064–2199 cm01 ) and OCS lines (2042–2059 cm01 ) (4, 5) , and Toth (15) and with the last available releases
of the HITRAN-96 (12) and GEISA-92 (13) database com-present in the spectra. To assure accurate calibration in
Copyright q 1997 by Academic Press
AID JMS 7332 / 6t1e$$$162 08-19-97 14:10:58 mspas

2n2 BAND OF H216O 333
FIG. 2. Infrared spectrum of H2O in natural abundance (2500–3500 cm01) . The recording from which the spectrum was obtained is indicated inthe upper right-hand corner (see Table 1).
pilations. This was not always the case, however. We were function model (20–23) taking into account resonance inter-actions as described in the next section. The assignment ofable to observe and assign numerous weak and medium
intensity transitions for the first time. Furthermore, in some upper state energy levels has been performed using step-by-step iterative extrapolations. Finally, in most cases, exceptregions, deviations from published line positions, especially
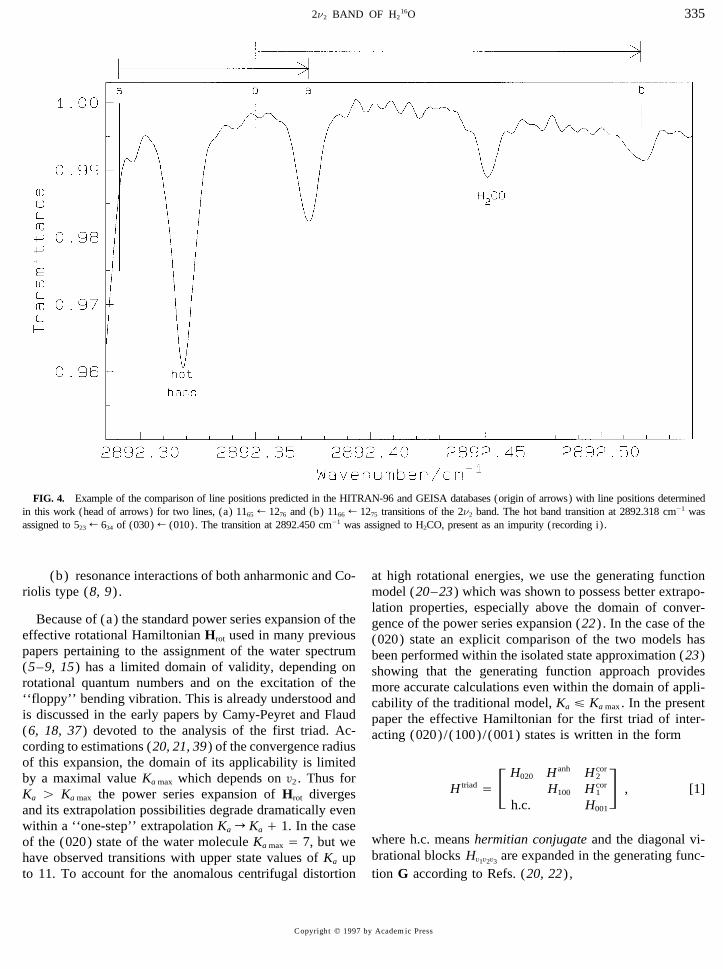
for weak transitions, amount to as much as 2 cm01 . Examples for a few very weak lines, the assignment could be confirmedfrom combination differences involving two or more ob-of such deviations are given in Fig. 4.
For reasons explained in the Introduction we focus on line served transitions. Observed line positions, together withtheir rotational assignments, are given in Table 3.positions of the 2n2 band in the present paper. We were able
to observe and assign 940 vibration–rotational transitions Spectral line parameters have been determined by fittingtransmittance data points to a Voigt profile convoluted withof the 2n2 band, as compared to the 642 transitions recently
reported by Toth (15) . Low-J transitions could be readily the FTS instrumental function using the program INTBAT(36) . The standard errors of the line positions obtained fromassigned using available database compilations (12, 13) , and
associated line positions are in excellent agreement with the this procedure are presented in the second column of Table3. The value D given in the third column represents therecent Toth measurements (15) . An assignment of higher
J , Ka transitions requires extrapolations based on theoretical deviation between the observed position and the transitionwavenumber calculated from the refined upper energy levels.calculations. Because the standard polynomial model of the
effective Hamiltonian in the case of water-type nonrigid mol- Though we do not analyze self-pressure shifts in detail inthis paper, the pressure values indicated in the last columnecules has poor convergence and extrapolation properties, as
was discussed in (18, 20–26) , we have used the generating of Table 3, together with the D value of the third column,
Copyright q 1997 by Academic Press
AID JMS 7332 / 6t1e$$$162 08-19-97 14:10:58 mspas
MIKHAILENKO ET AL.334
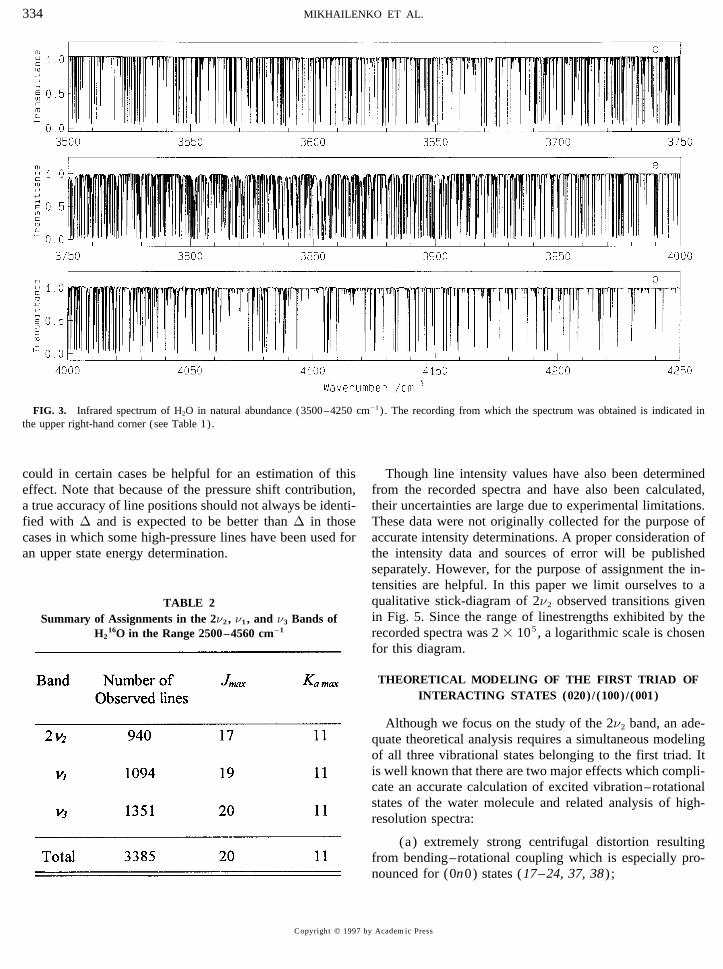
FIG. 3. Infrared spectrum of H2O in natural abundance (3500–4250 cm01) . The recording from which the spectrum was obtained is indicated inthe upper right-hand corner (see Table 1).
could in certain cases be helpful for an estimation of this Though line intensity values have also been determinedfrom the recorded spectra and have also been calculated,effect. Note that because of the pressure shift contribution,
a true accuracy of line positions should not always be identi- their uncertainties are large due to experimental limitations.These data were not originally collected for the purpose offied with D and is expected to be better than D in those
cases in which some high-pressure lines have been used for accurate intensity determinations. A proper consideration ofthe intensity data and sources of error will be publishedan upper state energy determination.separately. However, for the purpose of assignment the in-tensities are helpful. In this paper we limit ourselves to aqualitative stick-diagram of 2n2 observed transitions givenTABLE 2in Fig. 5. Since the range of linestrengths exhibited by theSummary of Assignments in the 2n2 , n1 , and n3 Bands ofrecorded spectra was 2 1 105, a logarithmic scale is chosenH2
16O in the Range 2500–4560 cm01
for this diagram.
THEORETICAL MODELING OF THE FIRST TRIAD OFINTERACTING STATES (020)/(100)/(001)
Although we focus on the study of the 2n2 band, an ade-quate theoretical analysis requires a simultaneous modelingof all three vibrational states belonging to the first triad. Itis well known that there are two major effects which compli-cate an accurate calculation of excited vibration–rotationalstates of the water molecule and related analysis of high-resolution spectra:
(a) extremely strong centrifugal distortion resultingfrom bending–rotational coupling which is especially pro-nounced for (0n0) states (17–24, 37, 38) ;
Copyright q 1997 by Academic Press
AID JMS 7332 / 6t1e$$$162 08-19-97 14:10:58 mspas
2n2 BAND OF H216O 335
FIG. 4. Example of the comparison of line positions predicted in the HITRAN-96 and GEISA databases (origin of arrows) with line positions determinedin this work (head of arrows) for two lines, (a) 1165 R 1276 and (b) 1166 R 1275 transitions of the 2n2 band. The hot band transition at 2892.318 cm01 wasassigned to 523 R 634 of (030) R (010). The transition at 2892.450 cm01 was assigned to H2CO, present as an impurity (recording i).
(b) resonance interactions of both anharmonic and Co- at high rotational energies, we use the generating functionmodel (20–23) which was shown to possess better extrapo-riolis type (8, 9) .lation properties, especially above the domain of conver-
Because of (a) the standard power series expansion of the gence of the power series expansion (22) . In the case of theeffective rotational Hamiltonian Hrot used in many previous (020) state an explicit comparison of the two models haspapers pertaining to the assignment of the water spectrum been performed within the isolated state approximation (23)(5–9, 15) has a limited domain of validity, depending on showing that the generating function approach providesrotational quantum numbers and on the excitation of the more accurate calculations even within the domain of appli-‘‘floppy’’ bending vibration. This is already understood and cability of the traditional model, Ka £ Ka max . In the presentis discussed in the early papers by Camy-Peyret and Flaud paper the effective Hamiltonian for the first triad of inter-(6, 18, 37) devoted to the analysis of the first triad. Ac- acting (020)/(100)/(001) states is written in the formcording to estimations (20, 21, 39) of the convergence radiusof this expansion, the domain of its applicability is limitedby a maximal value Ka max which depends on £2 . Thus for
H triad Å F H020 H anh H cor2
H100 H cor1
h.c. H001
G , [1]Ka ú Ka max the power series expansion of Hrot divergesand its extrapolation possibilities degrade dramatically evenwithin a ‘‘one-step’’ extrapolation Ka r Ka / 1. In the case
where h.c. means hermitian conjugate and the diagonal vi-of the (020) state of the water molecule Ka max Å 7, but webrational blocks H
£1£2£3are expanded in the generating func-have observed transitions with upper state values of Ka up
to 11. To account for the anomalous centrifugal distortion tion G according to Refs. (20, 22) ,
Copyright q 1997 by Academic Press
AID JMS 7332 / 6t1e$$$163 08-19-97 14:10:58 mspas
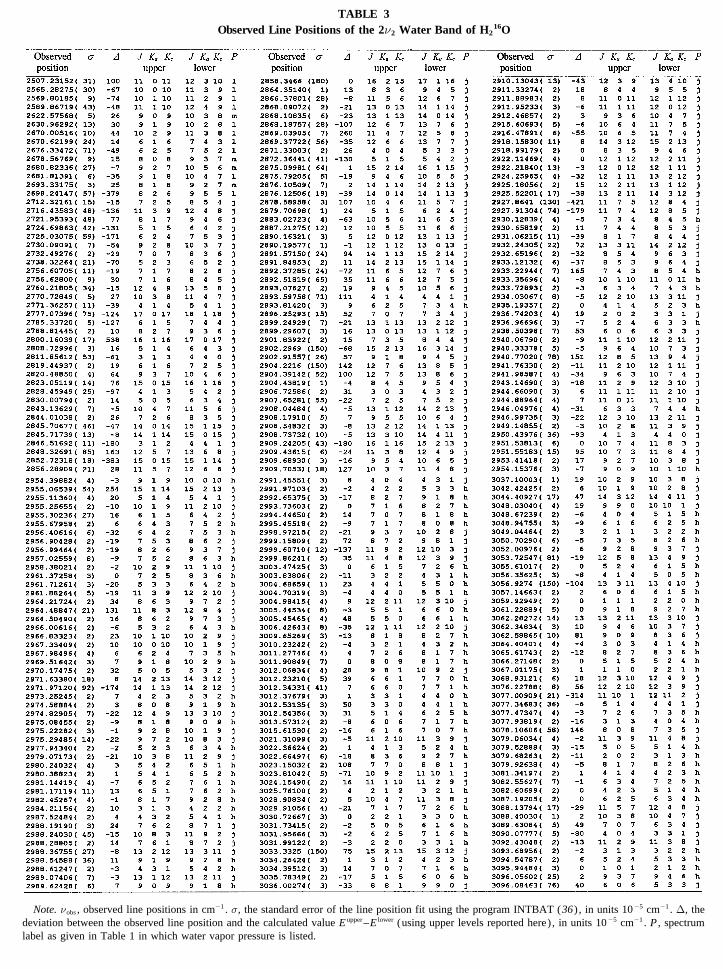
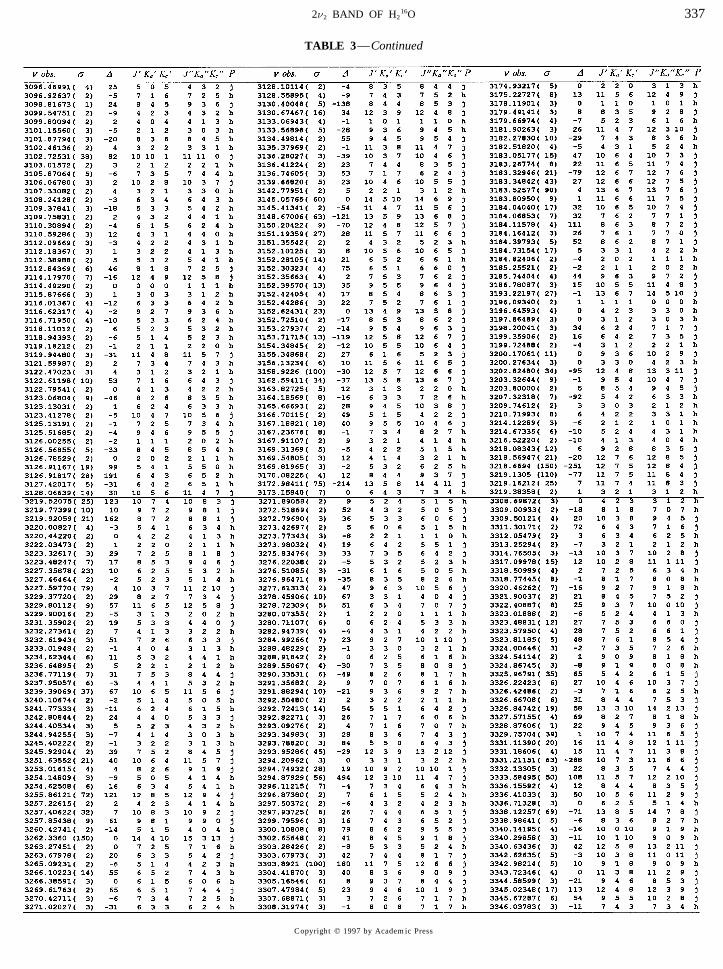
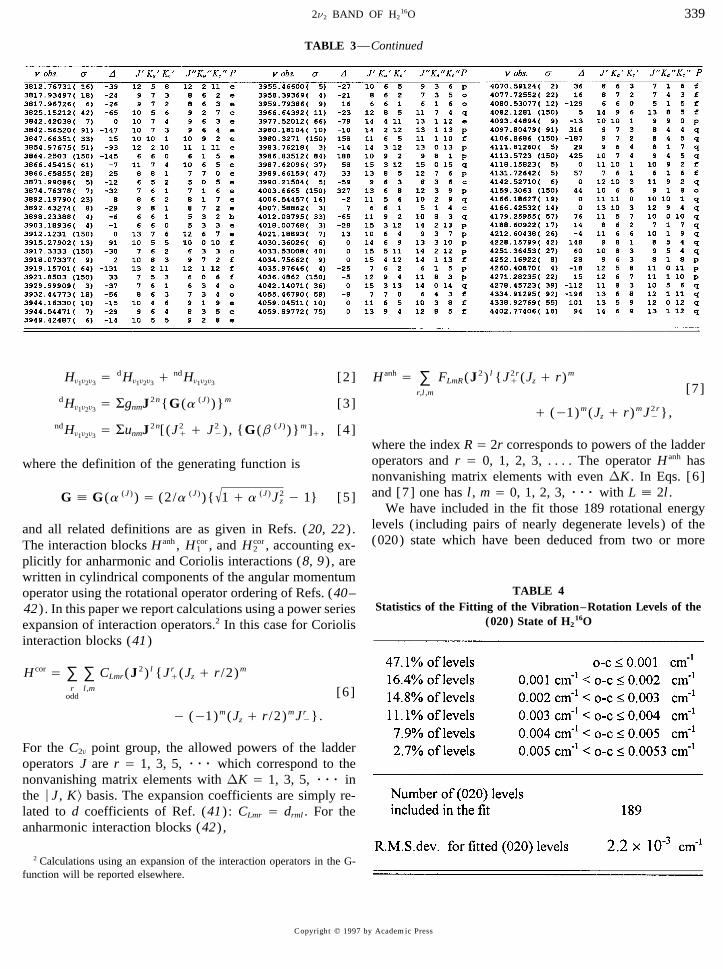
TABLE 3Observed Line Positions of the 2n2 Water Band of H2
16O
Note. nobs , observed line positions in cm01 . s, the standard error of the line position fit using the program INTBAT (36) , in units 1005 cm01 . D, thedeviation between the observed line position and the calculated value E upper–E lower (using upper levels reported here) , in units 1005 cm01 . P , spectrumlabel as given in Table 1 in which water vapor pressure is listed.
AID JMS 7332 / 6t1e$$7332 08-19-97 14:10:58 mspas
2n2 BAND OF H216O 337
TABLE 3—Continued
Copyright q 1997 by Academic Press
AID JMS 7332 / 6t1e$$7332 08-19-97 14:10:58 mspas
MIKHAILENKO ET AL.338
TABLE 3—Continued
Copyright q 1997 by Academic Press
AID JMS 7332 / 6t1e$$7332 08-19-97 14:10:58 mspas
2n2 BAND OF H216O 339
TABLE 3—Continued
H£1£2£3
Å dH£1£2£3
/ ndH£1£2£3
[2] H anh Å ∑r,l ,m
FLmR(J 2) l {J 2r/ (Jz / r)m
dH£1£2£3
Å SgnmJ 2n{G(a (J ) )}m [3] / (01)m(Jz / r)mJ 2r0 },
[7]
ndH£1£2£3
Å SunmJ 2n[(J 2/ / J 2
0) , {G(b (J ) )}m]/ , [4]where the index R Å 2r corresponds to powers of the ladderoperators and r Å 0, 1, 2, 3, . . . . The operator H anh haswhere the definition of the generating function isnonvanishing matrix elements with even DK . In Eqs. [6]and [7] one has l , m Å 0, 1, 2, 3, rrr with L å 2l .G å G(a (J ) ) Å (2/a (J ) ){
√1 / a (J )J 2
z 0 1} [5]We have included in the fit those 189 rotational energy
levels ( including pairs of nearly degenerate levels) of theand all related definitions are as given in Refs. (20, 22) .(020) state which have been deduced from two or moreThe interaction blocks H anh , H cor
1 , and H cor2 , accounting ex-
plicitly for anharmonic and Coriolis interactions (8, 9) , arewritten in cylindrical components of the angular momentum
TABLE 4operator using the rotational operator ordering of Refs. (40–Statistics of the Fitting of the Vibration–Rotation Levels of the42) . In this paper we report calculations using a power series
(020) State of H216Oexpansion of interaction operators.2 In this case for Coriolis
interaction blocks (41)
H cor Å ∑r
odd
∑l ,m
CLmr(J 2) l {Jr/(Jz / r /2)m
0 (01)m(Jz / r /2)mJr0}.
[6]
For the C2£ point group, the allowed powers of the ladderoperators J are r Å 1, 3, 5, rrr which correspond to thenonvanishing matrix elements with DK Å 1, 3, 5, rrr inthe ÉJ , K … basis. The expansion coefficients are simply re-lated to d coefficients of Ref. (41) : CLmr Å drml . For theanharmonic interaction blocks (42) ,
2 Calculations using an expansion of the interaction operators in the G-function will be reported elsewhere.
Copyright q 1997 by Academic Press
AID JMS 7332 / 6t1e$$$163 08-19-97 14:10:58 mspas
MIKHAILENKO ET AL.340
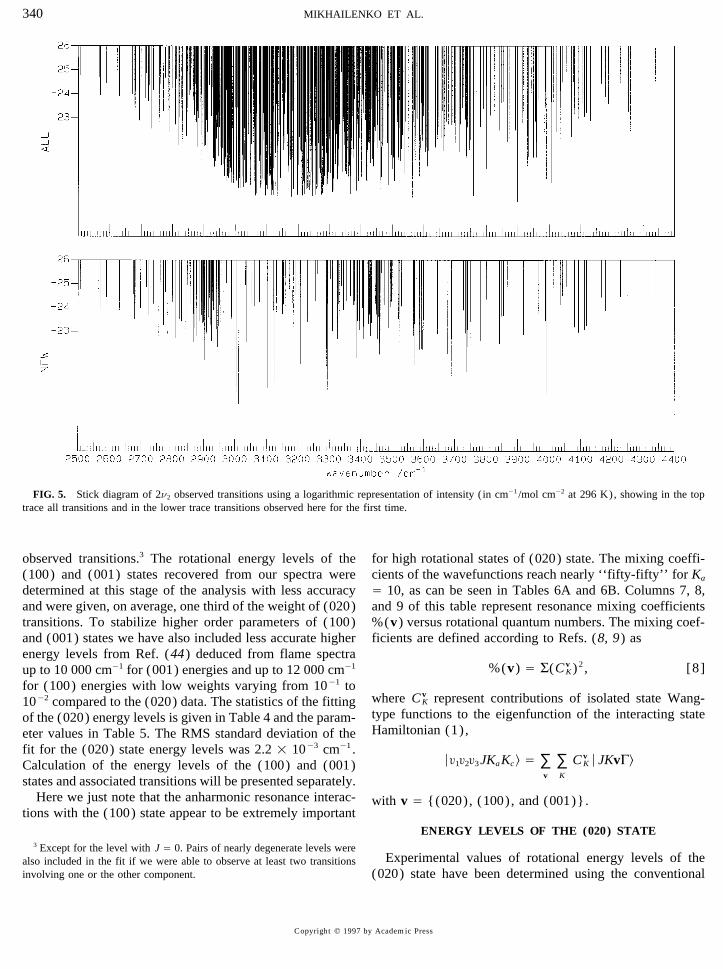
FIG. 5. Stick diagram of 2n2 observed transitions using a logarithmic representation of intensity (in cm01 /mol cm02 at 296 K), showing in the toptrace all transitions and in the lower trace transitions observed here for the first time.
observed transitions.3 The rotational energy levels of the for high rotational states of (020) state. The mixing coeffi-cients of the wavefunctions reach nearly ‘‘fifty-fifty’’ for Ka(100) and (001) states recovered from our spectra were
determined at this stage of the analysis with less accuracy Å 10, as can be seen in Tables 6A and 6B. Columns 7, 8,and 9 of this table represent resonance mixing coefficientsand were given, on average, one third of the weight of (020)
transitions. To stabilize higher order parameters of (100) %(v) versus rotational quantum numbers. The mixing coef-ficients are defined according to Refs. (8, 9) asand (001) states we have also included less accurate higher
energy levels from Ref. (44) deduced from flame spectra%(v) Å S(C v
K)2 , [8]up to 10 000 cm01 for (001) energies and up to 12 000 cm01
for (100) energies with low weights varying from 1001 towhere C v
K represent contributions of isolated state Wang-1002 compared to the (020) data. The statistics of the fittingtype functions to the eigenfunction of the interacting stateof the (020) energy levels is given in Table 4 and the param-Hamiltonian (1) ,eter values in Table 5. The RMS standard deviation of the
fit for the (020) state energy levels was 2.2 1 1003 cm01 .É£1£2£3JKaKc … Å ∑
v
∑K
C vKÉJKvG…Calculation of the energy levels of the (100) and (001)
states and associated transitions will be presented separately.Here we just note that the anharmonic resonance interac- with v Å {(020), (100), and (001)}.
tions with the (100) state appear to be extremely importantENERGY LEVELS OF THE (020) STATE
3 Except for the level with J Å 0. Pairs of nearly degenerate levels wereExperimental values of rotational energy levels of thealso included in the fit if we were able to observe at least two transitions
involving one or the other component. (020) state have been determined using the conventional
Copyright q 1997 by Academic Press
AID JMS 7332 / 6t1e$$$163 08-19-97 14:10:58 mspas

TABLE 5Fitted Values of Hamiltonian Parameters for the First Triad
of Interacting States of H216O
Note. Total number of vibration–rotational levels of (020)/(100)/(001) states included in the fit was 900. All values of parameters and their standarderrors are given in cm01 . Asterisks indicate parameter values held fixed in the least-squares fit.
08-19-97 14:10:58 mspas
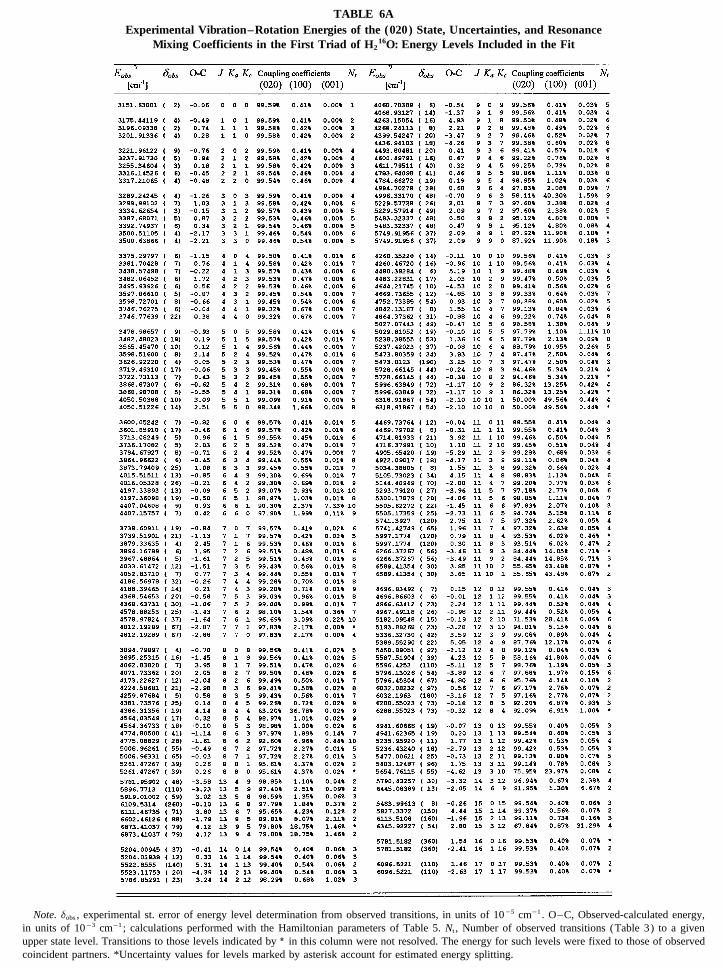
TABLE 6AExperimental Vibration–Rotation Energies of the (020) State, Uncertainties, and Resonance
Mixing Coefficients in the First Triad of H216O: Energy Levels Included in the Fit
Note. dobs , experimental st. error of energy level determination from observed transitions, in units of 1005 cm01 . O–C, Observed-calculated energy,in units of 1003 cm01 ; calculations performed with the Hamiltonian parameters of Table 5. Nt , Number of observed transitions (Table 3) to a givenupper state level. Transitions to those levels indicated by ∗ in this column were not resolved. The energy for such levels were fixed to those of observedcoincident partners. *Uncertainty values for levels marked by asterisk account for estimated energy splitting.
08-19-97 14:10:58 mspas
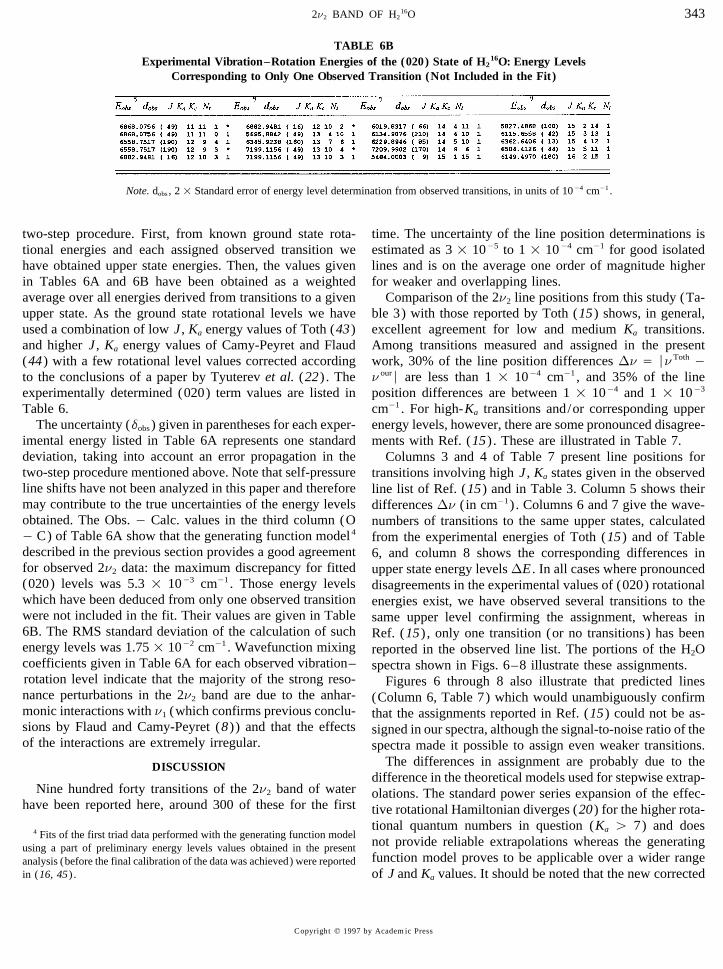
2n2 BAND OF H216O 343
TABLE 6BExperimental Vibration–Rotation Energies of the (020) State of H2
16O: Energy LevelsCorresponding to Only One Observed Transition (Not Included in the Fit)
Note. dobs , 2 1 Standard error of energy level determination from observed transitions, in units of 1004 cm01 .
two-step procedure. First, from known ground state rota- time. The uncertainty of the line position determinations isestimated as 3 1 1005 to 1 1 1004 cm01 for good isolatedtional energies and each assigned observed transition we
have obtained upper state energies. Then, the values given lines and is on the average one order of magnitude higherfor weaker and overlapping lines.in Tables 6A and 6B have been obtained as a weighted
average over all energies derived from transitions to a given Comparison of the 2n2 line positions from this study (Ta-ble 3) with those reported by Toth (15) shows, in general,upper state. As the ground state rotational levels we have
used a combination of low J , Ka energy values of Toth (43) excellent agreement for low and medium Ka transitions.Among transitions measured and assigned in the presentand higher J , Ka energy values of Camy-Peyret and Flaud
(44) with a few rotational level values corrected according work, 30% of the line position differences Dn Å ÉnToth 0n our
É are less than 1 1 1004 cm01 , and 35% of the lineto the conclusions of a paper by Tyuterev et al. (22) . Theexperimentally determined (020) term values are listed in position differences are between 1 1 1004 and 1 1 1003
cm01 . For high-Ka transitions and/or corresponding upperTable 6.The uncertainty (dobs ) given in parentheses for each exper- energy levels, however, there are some pronounced disagree-
imental energy listed in Table 6A represents one standard ments with Ref. (15) . These are illustrated in Table 7.deviation, taking into account an error propagation in the Columns 3 and 4 of Table 7 present line positions fortwo-step procedure mentioned above. Note that self-pressure transitions involving high J , Ka states given in the observedline shifts have not been analyzed in this paper and therefore line list of Ref. (15) and in Table 3. Column 5 shows theirmay contribute to the true uncertainties of the energy levels differences Dn ( in cm01) . Columns 6 and 7 give the wave-obtained. The Obs. 0 Calc. values in the third column (O numbers of transitions to the same upper states, calculated0 C) of Table 6A show that the generating function model4 from the experimental energies of Toth (15) and of Tabledescribed in the previous section provides a good agreement 6, and column 8 shows the corresponding differences infor observed 2n2 data: the maximum discrepancy for fitted upper state energy levels DE . In all cases where pronounced(020) levels was 5.3 1 1003 cm01 . Those energy levels disagreements in the experimental values of (020) rotationalwhich have been deduced from only one observed transition energies exist, we have observed several transitions to thewere not included in the fit. Their values are given in Table same upper level confirming the assignment, whereas in6B. The RMS standard deviation of the calculation of such Ref. (15) , only one transition (or no transitions) has beenenergy levels was 1.75 1 1002 cm01 . Wavefunction mixing reported in the observed line list. The portions of the H2Ocoefficients given in Table 6A for each observed vibration– spectra shown in Figs. 6–8 illustrate these assignments.rotation level indicate that the majority of the strong reso- Figures 6 through 8 also illustrate that predicted linesnance perturbations in the 2n2 band are due to the anhar- (Column 6, Table 7) which would unambiguously confirmmonic interactions with n1 (which confirms previous conclu- that the assignments reported in Ref. (15) could not be as-sions by Flaud and Camy-Peyret (8)) and that the effects signed in our spectra, although the signal-to-noise ratio of theof the interactions are extremely irregular. spectra made it possible to assign even weaker transitions.
The differences in assignment are probably due to theDISCUSSIONdifference in the theoretical models used for stepwise extrap-
Nine hundred forty transitions of the 2n2 band of water olations. The standard power series expansion of the effec-have been reported here, around 300 of these for the first tive rotational Hamiltonian diverges (20) for the higher rota-
tional quantum numbers in question (Ka ú 7) and does4 Fits of the first triad data performed with the generating function model
not provide reliable extrapolations whereas the generatingusing a part of preliminary energy levels values obtained in the presentfunction model proves to be applicable over a wider rangeanalysis (before the final calibration of the data was achieved) were reported
in (16, 45) . of J and Ka values. It should be noted that the new corrected
Copyright q 1997 by Academic Press
AID JMS 7332 / 6t1e$$$163 08-19-97 14:10:58 mspas
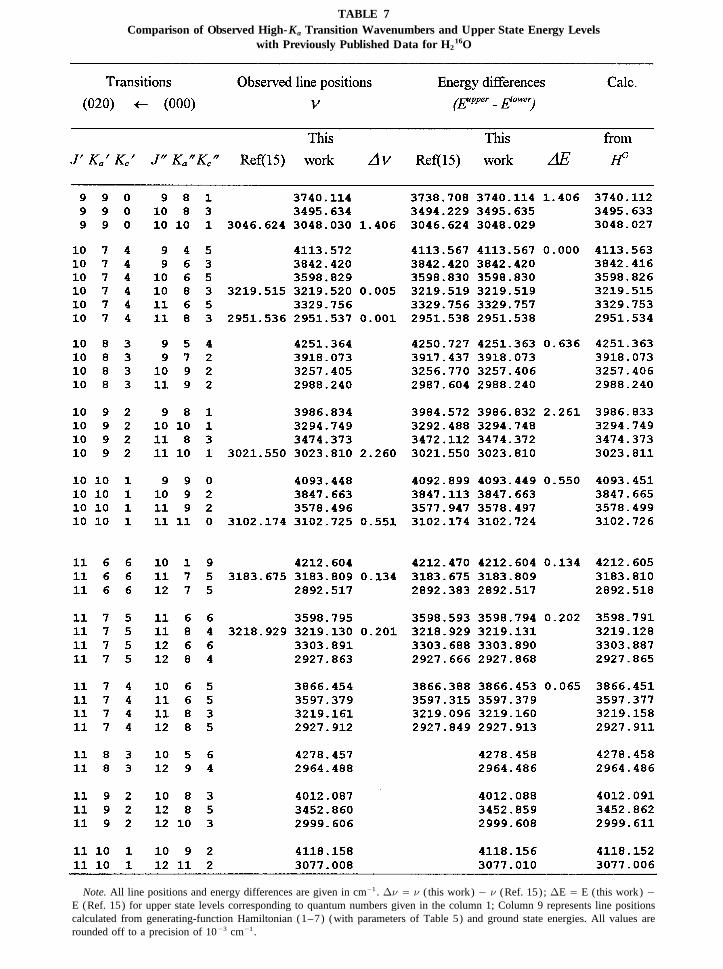
TABLE 7Comparison of Observed High-Ka Transition Wavenumbers and Upper State Energy Levels
with Previously Published Data for H216O
Note. All line positions and energy differences are given in cm01 . Dn Å n ( this work) 0 n (Ref. 15); DE Å E (this work) 0E (Ref. 15) for upper state levels corresponding to quantum numbers given in the column 1; Column 9 represents line positionscalculated from generating-function Hamiltonian (1–7) (with parameters of Table 5) and ground state energies. All values arerounded off to a precision of 1003 cm01 .
AID JMS 7332 / 6t1e$$7332 08-19-97 14:10:58 mspas

2n2 BAND OF H216O 345
TABLE 7—Continued
the DAAD. This work was supported in part by the Deutsche Forschungs-energy level values reported here for high J and Ka shouldgemeinshaft and the Fonds der Chemischen Industrie, with additional fund-be important in the determination from experimental data ofing provided by NATO for travel between the USA and Germany and
the bending behavior of the molecular potential function computing facilities partially funded by NASA. S.N.M. acknowledges sup-(see for example (46–48)) . port from the ISF and RFFI foundations. The authors are grateful to Markus
Mengel for assistance and valuable advice.In conclusion, the present study has used data with a largepressure–pathlength product obtained with a FTIR spectrom-eter at pressure-broadening-limited resolution to significantly REFERENCESextend the range of reliable experimental and calculated tran-sitions and energy levels for the (020) state of H2O.
1. W. S. Benedict and E. K. Plyler, J. Res. Natl. Bur. Std. 46, 256 (1951).2. P. E. Fraley and K. Narahari Rao, J. Mol. Spectrosc. 29, 348–364ACKNOWLEDGMENTS
(1969).3. J.-M. Flaud, C. Camy-Peyret, and A. Valentin, J. Physique 33, 741Vl.G.T. thanks the Alexander von Humboldt Stiftung for support. K.A.K.
gratefully acknowledges the assistance of the Fulbright Kommission and (1972).
Copyright q 1997 by Academic Press
AID JMS 7332 / 6t1e$$$164 08-19-97 14:10:58 mspas
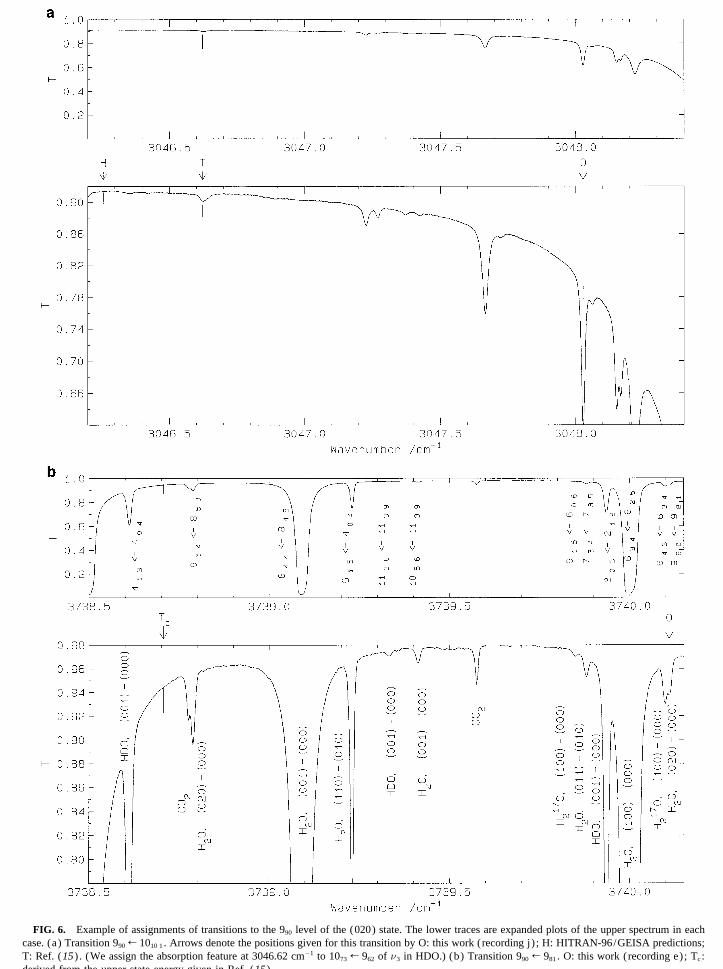
FIG. 6. Example of assignments of transitions to the 990 level of the (020) state. The lower traces are expanded plots of the upper spectrum in eachcase. (a) Transition 990 R 1010 1 . Arrows denote the positions given for this transition by O: this work (recording j) ; H: HITRAN-96/GEISA predictions;T: Ref. (15) . (We assign the absorption feature at 3046.62 cm01 to 1073 R 962 of n3 in HDO.) (b) Transition 990 R 981 . O: this work (recording e); Tc:derived from the upper state energy given in Ref. (15) .
08-19-97 14:10:58 mspas
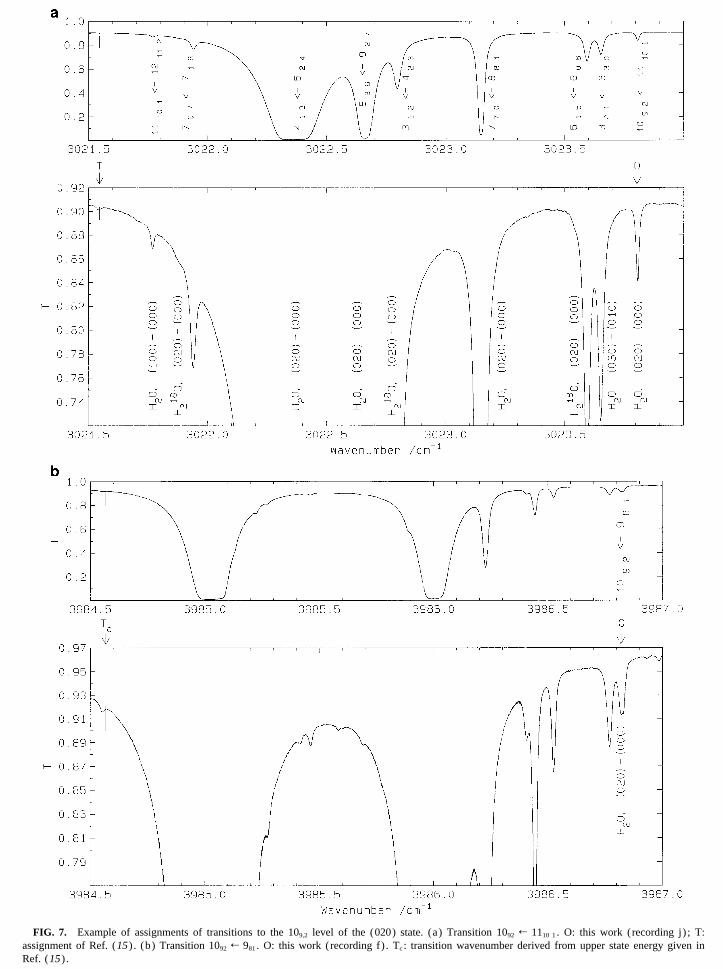
FIG. 7. Example of assignments of transitions to the 109,2 level of the (020) state. (a) Transition 1092 R 1110 1 . O: this work (recording j) ; T:assignment of Ref. (15) . (b) Transition 1092 R 981 . O: this work (recording f) . Tc: transition wavenumber derived from upper state energy given inRef. (15) .
08-19-97 14:10:58 mspas

MIKHAILENKO ET AL.348
FIG. 8. Example of assignments of the transition 1010 1 R 990 of the 2n2 band. O: this work (recording e). Tc: transition wavenumber derived fromthe upper state energy given in Ref. (15) .
4. L. A. Pugh and K. Narahari Rao, J. Mol. Spectrosc. 47, 403–408 14. G. Guelachvili and K. N. Rao, ‘‘Handbook of Infrared Standards II.’’Academic Press, San Diego, 1993.(1973).
5. L. A. Pugh, Ph.D. Dissertation, The Ohio State University (1972). 15. R. A. Toth, J. Opt. Soc. Am. B. 10(9) , 1526–1544 (1993).16. K. A. Keppler, B. P. Winnewisser, M. Winnewisser, K. Narahari Rao,6. J.-M. Flaud and C. Camy-Peyret, Mol. Phys. 26, 811–823 (1973).
S. N. Mikhailenko, V. I. Starikov, and Vl. G. Tyuterev, in ‘‘High-7. C. Camy-Peyret, J.-M. Flaud, G. Guelachvili, and C. Amiot, Mol. Phys.Resolution Molecular Spectroscopy,’’ SPIE 2205, pp. 264–268, 1993.26, 825–855 (1973).
17. J. T. Hougen, P. R. Bunker, and J. W. C. Johns, J. Mol. Spectrosc. 34,8. J.-M. Flaud and C. Camy-Peyret, J. Mol. Spectrosc. 51, 142–150136–172 (1970).(1974).
18. C. Camy-Peyret and J. M. Flaud, Mol. Phys. 32, 523–537 (1976).9. J.-M. Flaud and C. Camy-Peyret, J. Mol. Spectrosc. 55, 278–310(1975). 19. A. R. Hoy and P. R. Bunker, J. Mol. Spectrosc. 52, 439–456 (1974).
20. Vl. G. Tyuterev, J. Mol. Spectrosc. 151, 97–129 (1992); 154, 23310. R. A. Toth, Quant. Spectrosc. Radiat. Transfer 13, 1127–1142 (1973).(1992).11. J.-M. Flaud, C. Camy-Peyret, and R. A. Toth, ‘‘Water Vapor Line
Parameters from Microwave to Medium Infrared.’’ Pergamon, London, 21. Vl. G. Tyuterev, V. I. Starikov, and V. I. Tolmachev, in ‘‘MicrowaveSpectroscopy and Applications,’’ pp. 156–184. Spectroscopy Council,1981.USSR Acad. Sci. Publications, Moscow, 1985. [ in Russian]; Vl. G.12. L. S. Rothman, R. R. Gamache, R. H. Tipping, C. P. Rinsland, M. A. H.Tyuterev, V. I. Starikov, and V. I. Tolmachev, Dokl. Acad. Nauk SSSRSmith, D. Chris Benner, V. Malathy Devi, J.-M. Flaud, C. Camy-Fiz 297, 345–349 (1987).Peyret, A. Perrin, A. Goldman, S. T. Massie, L. R. Brown, and R. A.
22. Vl. G. Tyuterev, V. I. Starikov, S. A. Tashkun, and S. N. Mikhailenko,Toth, J. Quant. Spectrosc. Radiat. Transfer 48, 469–507 (1992); L.J. Mol. Spectrosc. 170, 38–58 (1995).S. Rothman, J. Schroeder, A. McCann, R. R. Gamache, R. B. Wattson,
23. V. I. Starikov, S. A. Tashkun, and Vl. G. Tyuterev, J. Mol. Spectrosc.J.-M. Flaud, A. Perrin, V. Dana, J. Y. Mandin, A. Goldman, S. Massie,151, 130–147 (1992).P. Varanasi, and K. Yoshino, in ‘‘ASA-96 Workshop Proceedings,’’
pp. 289–293. University of Reims, Reims, 1996. 24. V. I. Starikov and Vl. G. Tyuterev, Opt. Spectrosk. 63, 75–79 (1987).25. A. V. Burenin and Vl. G. Tyuterev, J. Mol. Spectrosc. 108, 153–15413. N. Husson, B. Bonnet, N. A. Scott, and A. Chedin, J. Quant. Spectrosc.
Radiat. Transfer 48, 509 (1992). (1984).
Copyright q 1997 by Academic Press
AID JMS 7332 / 6t1e$$$164 08-19-97 14:10:58 mspas
2n2 BAND OF H216O 349
26. V. F. Golovko, Vl. G. Tyuterev, and A. V. Burenin, Opt. Spectrosk. 38. V. I. Starikov and Vl. G. Tyuterev, J. Mol. Spectrosc. 95, 288–296(1982).64, 764–769 (1988).
39. V. I. Starikov and Vl. G. Tyuterev, Opt. Atmosph. Ocean. 8(N1-2),27. L. H. Coudert, J. Mol. Spectrosc. 154, 427–442 (1992).181–200 (1995).28. L. H. Coudert, J. Mol. Spectrosc. 165, 406–425 (1994).
40. Yu. S. Makushkin and Vl. G. Tyuterev, ‘‘The Methods of Perturbation29. J. U. White, J. Opt. Soc. Am. 32, 285–288 (1942).Theory and Effective Hamiltonians in Molecular Spectroscopy,’’30. H. J. Bernstein and G. Herzberg, J. Chem. Phys. 16(1) , 30–39 (1948).Nauka, Nivosibirsk, 1984. [In Russian]31. M. Birk, M. Winnewisser, and E. A. Cohen, J. Mol. Spectrosc. 136,
41. V. I. Perevalov and Vl. G. Tyuterev, Opt. Spectrosk., 52, 644–650402–445 (1989).(1982).
32. K. A. Keppler, Ph.D. Dissertation, The Ohio State University42. V. I. Perevalov and Vl. G. Tyuterev, Izvestiya Vuzov ‘‘Fizika’’ N2,
(1995).108–111 (1982).
33. P. S. Ormsby, K. Narahari Rao, M. Winnewisser, B. P. Winnewisser, 43. R. A. Toth, J. Opt. Soc. B 8, 2236–2255 (1991).O. V. Naumenko, A. D. Bykov, and L. N. Sinitsa, J. Mol. Spectrosc. 44. J.-M. Flaud, C. Camy-Peyret, and J. P. Maillard, Mol. Phys. 32, 499–158, 109–130 (1993). 521 (1976).
34. B. P. Winnewisser, The Analyst 117, 343–349 (1992). 45. V. I. Starikov, J. Mol. Struct. 384, 73 (1996).35. G. Ch. Mellau, B., Winnewisser, and M. Winnewisser, Microchim. 46. P. Jensen, S. Tashkun, and Vl. G. Tyuterev, J. Mol. Spectrosc. 168,
Acta, (1995), accepted. 271–289 (1994).36. J. W. C. Johns, Mikrochim. Acta [Wien] III, 171–188 (1987). 47. O. Polyansky, P. Jensen, and J. Tennyson, J. Chem. Phys. 105, 6490–37. C. Camy-Peyret and J.-M. Flaud, Spectrochim. Acta A 29, 1711–1715 6497 (1996).
48. C. D. Paulse and J. Tennyson, J. Mol. Spectr. 168, 313 (1994).(1973).
Copyright q 1997 by Academic Press
AID JMS 7332 / 6t1e$$$164 08-19-97 14:10:58 mspas