the 21st century company's true value
TRANSCRIPT
The 21st century company's true value Intellectual capital disclosure and share prices on Nasdaq OMXS30
Authors: Mikael Andersson Tobias Wiklund
Supervisor: Rickard Olsson
Student Umeå School of Business and Economics Spring semester 2012 Degree project, 30 hp

I
Summary The gap between companies’ market value of equity and book value of equity is high and even further increasing (Pandian, 2011) and it seems like traditional accounting cannot take certain assets, such as intangibles in to account. During the 1990s, research started to focus on finding ways to account for so called Intellectual Capital (IC). Different studies use different measures. Pulic (2000) is an early user of proxies for IC while Guthrie & Petty (2000) used content analysis to investigate the relationship between IC disclosure and share price. Based upon the latter, with EMH (Fama, 1970), theory regarding Intellectual Capital (Sveiby, 1997; Edvinsson, 1997), Agency theory (Akerlof, 1970) in particular, we formulate the following research question: Is there a relationship between the OMXS30-companies’ IC disclosures and their share prices? Our purpose is, apart from answering the research question, to look at the development of IC disclosure over our research period and to make a theoretical contribution to this field of research. Previous studies have taken two different roads and we try to build a bridge between these two, to provide a good departure for future research. This study is positivistic to its epistemology, objectivistic to its ontology and deductive to its approach. Through content analysis on the OMXS30 companies’ annual reports for 2001, 2004, 2007 and 2010 and data collection of accounting data, we perform regressions to examine the relationship between share price and Intellectual Capital disclosure. Our final sample has 105 firm-years. Following previous research (Ferraro & Veltri, 2011; Wang, 2008), we use the Ohlson model (Ohlson, 1995) to investigate the relationship between Price and IC disclosure using linear regression. We will eliminate potential influential observations with a rule-based approach based on Cook’s distance and adjust for heteroscedasticity with White’s robust standard errors. We find a statistically significant positive relationship between Price and IC only for one of its subcategories: Internal Capital (IntCap). The other two, Human Capital (HumCap) and External Capital (ExtCap), were both negatively correlated, explaining why we could not see a relationship between our total IC score and price. Apart from this, we see that the average IC disclosure increased significantly during our researched time period and that IC disclosure in knowledge-intensive companies is statistically higher than for capital-intensive companies when it comes to ExtCap and HumCap. For IntCap, as well as for Total IC disclosure, we could not see any difference.

II
Acknowledgement We want to thank our supervisor Rickard Olsson, whose support has been outstanding throughout this semester. Thank you Rickard, we couldn’t have done it without you!

III
TABLE OF CONTENTS
1 INTRODUCTION ................................................................................................................................... 1 1.1 BACKGROUND 1 1.2 RESEARCH DISCUSSION 3 1.3 RESEARCH QUESTION 4 1.4 RESEARCH PURPOSE 5 1.5 CONTRIBUTION 5 1.6 LIMITATIONS 5 1.7 ACCOUNTING CONCEPTS 6 1.7.1 INTANGIBLE ASSETS ACCORDING TO IAS38 .................................................................................................. 6 1.7.2 GOODWILL ............................................................................................................................................................ 7
2 THEORETICAL METHODOLOGY ..................................................................................................... 8 2.1 INTRODUCTION 8 2.2 QUANTITATIVE STUDY 10 2.2.1 RELIABILITY ...................................................................................................................................................... 11 2.2.2 REPLICATION ..................................................................................................................................................... 12 2.2.3 VALIDITY ............................................................................................................................................................ 12 2.2.4 INTERNAL VALIDITY ......................................................................................................................................... 12 2.2.5 EXTERNAL VALIDITY ........................................................................................................................................ 13 2.3 PRE-‐UNDERSTANDING 13
3 THEORETICAL FRAMEWORK ....................................................................................................... 14 3.1 EFFICIENT MARKET HYPOTHESIS, AGENCY THEORY AND THE DRIVERS OF STOCK PRICE 14 3.2 INTELLECTUAL CAPITAL MODEL 19 3.3 PREVIOUS RESEARCH 22 3.3.1 BACKGROUND INFORMATION ......................................................................................................................... 22 3.3.2 INTELLECTUAL CAPITAL, MARKET CAPITALIZATION AND INFORMATION ASYMMETRY .................... 24 3.3.3 CONTENT ANALYSES ........................................................................................................................................ 26 3.3.4 STATISTICAL METHODOLOGY ........................................................................................................................ 27 3.4 OUR STUDY 29
4 PRACTICAL METHODOLOGY ........................................................................................................ 31 4.1 RESEARCH TECHNIQUE 31 4.2 CONTENT ANALYSIS FRAMEWORK 31 4.3 CONTENT ANALYSIS CODING PROCESS 33 4.4 SAMPLE 34 4.5 DATA SOURCES AND SOURCE CRITICISM 36 4.6 REGRESSION 37
5 EMPIRICAL RESULTS AND ANALYSIS ........................................................................................ 39 5.1 INTRODUCING THE RESULTS 39 5.2 OUTLIER-‐HANDLING, MULTICOLLINEARITY AND SUMMARIZED STATISTICAL DATA 42 5.3 H1: THERE IS NO CORRELATION BETWEEN IC DISCLOSURE AND PRICE 44 5.4 H2: THERE IS NO CORRELATION BETWEEN HUMAN CAPITAL AND PRICE 45 5.5 H3: THERE IS NO CORRELATION BETWEEN INTERNAL CAPITAL AND PRICE 45 5.6 H4: THERE IS NO CORRELATION BETWEEN AND EXTERNAL CAPITAL AND PRICE 45
IV
5.7 H5: THERE IS NO DIFFERENCE IN SIGNIFICANCE BETWEEN KNOWLEDGE-‐INTENSIVE AND CAPITAL-‐INTENSIVE COMPANIES IN OUR REGRESSIONS. 46 5.8 H6: THERE IS NO DIFFERENCE IN IC DISCLOSURE BETWEEN KNOWLEDGE-‐INTENSIVE AND CAPITAL-‐INTENSIVE COMPANIES. 48 5.9 H7: IC DISCLOSURE HAS NOT INCREASED DURING THE RESEARCHED TIME PERIOD. 51 5.10 TESTING FOR RELATIONSHIP BETWEEN OUR IC MEASURES AND IC PROXIES FROM PREVIOUS RESEARCH. 52 5.11 SUMMARY OF RESULTS 57
6 CONCLUSIONS AND SUGGESTIONS FOR FUTURE RESEARCH ............................................ 59 6.1 CONCLUSIONS 59 6.2 SUGGESTIONS FOR FUTURE RESEARCH 61
LIST OF REFERENCES ............................................................................................................................. 63
APPENDIX 1: THE OMXS30 COMPANIES
APPENDIX 2: CONTENT ANALYSIS DATA COLLECTION
APPENDIX 3: ADDITIONAL REGRESSIONS
TABLE OF FIGURES FIGURE 1. THE DEDUCTIVE PROCESS. ............................................................................................................................. 10 FIGURE 2. THE RELIABILITY-‐VALIDITY QUADRANT. ............................................................................................... 11 FIGURE 3. OUR THEORETICAL FRAMEWORK .............................................................................................................. 14 FIGURE 4. P/B-‐RATIOS AND THE NEW BALANCE SHEET. ..................................................................................... 17 FIGURE 5. ASSUMPTIONS ABOUT IC-‐LEVEL AND IC DISCLOSURE. .................................................................... 19 FIGURE 6. THE SKANDIA VALUE SCHEME. .................................................................................................................... 21 FIGURE 7. PREVIOUS RESEARCH FLOW. ......................................................................................................................... 22 FIGURE 8. SUBCATEGORIES’ SHARE OF TOTAL DISCLOSURE. ............................................................................. 41 FIGURE 9. IC DISCLOSURE IN CAPITAL-‐INTENSIVE AND KNOWLEDGE-‐INTENSIVE COMPANIES. ..... 49 FIGURE 10. IC DISCLOSURE OVER TIME. ........................................................................................................................ 51 FIGURE 11. IC GROWTH 2001-‐2010. ................................................................................................................................ 52 LIST OF TABLES TABLE 1. IC FRAMEWORK FROM BONTIS. ..................................................................................................................... 32 TABLE 2. OUR CONTENT ANALYSIS FRAMEWORK. .................................................................................................. 33 TABLE 3. THE SAMPLE PROCESS. ...................................................................................................................................... 35 TABLE 4. THE SAMPLE COMPANIES. ................................................................................................................................ 36 TABLE 5. IC PROXIES. ............................................................................................................................................................... 38 TABLE 6. DIVIDING THE ICB GROUPS INTO CAPITAL AND KNOWLEDGE INTENSIVE. ............................ 38 TABLE 8. CONTENT ANALYSIS RESULTS. ....................................................................................................................... 39 TABLE 9. TOP/BOTTOM 10 HITS. ...................................................................................................................................... 40 TABLE 10. OUTLIERS. .............................................................................................................................................................. 42 TABLE 11. MULTICOLLINEARITY MATRIX WITH COOK’S D. ................................................................................. 43 TABLE 12. VIF TABLE WITH COOK’S D. ........................................................................................................................... 43 TABLE 13. SUMMARIZED STATISTICAL DATA ............................................................................................................. 44 TABLE 14. OHLSON MODEL WITH IC-‐INDEX. ............................................................................................................... 44 TABLE 15. OHLSON MODEL WITH IC-‐SUBCATEGORIES. ........................................................................................ 45 TABLE 16. OHLSON MODEL WITH IC-‐SUBCATEGORIES, KNOWLEDGE-‐INTENSIVE FIRMS. .................. 47

V
TABLE 17. OHLSON MODEL WITH IC-‐SUBCATEGORIES, CAPITAL INTENSIVE FIRMS. ............................ 47 TABLE 18. CAPITAL INTENSIVE FIRMS’ IC DISCLOSURE. ....................................................................................... 48 TABLE 19. KNOWLEDGE INTENSIVE FIRMS’ IC DISCLOSURE. ............................................................................. 48 TABLE 20. DIFFERENCES IN TOTAL IC DISCLOSURE. ............................................................................................... 49 TABLE 21. DIFFERENCES IN INTCAP DISCLOSURE. .................................................................................................. 50 TABLE 22. DIFFERENCES IN EXTCAP DISCLOSURE. .................................................................................................. 50 TABLE 23. DIFFERENCES IN HUMCAP DISCLOSURE. ................................................................................................ 50 TABLE 24. HUMCAP REGRESSION. .................................................................................................................................... 53 TABLE 25. HUMCAP REGRESSION, CAPITAL-‐INTENSIVE FIRMS. ....................................................................... 54 TABLE 26. HUMCAP REGRESSION, KNOWLEDGE-‐INTENSIVE FIRMS. .............................................................. 54 TABLE 27. INTCAP REGRESSION. ....................................................................................................................................... 55 TABLE 28. INTCAP REGRESSION, CAPITAL-‐INTENSIVE FIRMS. .......................................................................... 55 TABLE 29. INTCAP REGRESSION, KNOWLEDGE-‐INTENSIVE FIRMS. ................................................................ 56 TABLE 30. EXTCAP REGRESSION. ...................................................................................................................................... 56 TABLE 31. EXTCAP REGRESSION, CAPITAL-‐INTENSIVE FIRMS. ......................................................................... 57 TABLE 32. EXTCAP REGRESSION, KNOWLEDGE-‐INTENSIVE FIRMS. ................................................................ 57 TABLE 33. HYPOTHESES REJECTION. .............................................................................................................................. 58
1
1 Introduction
1.1 Background "We had no real assets and the balance sheet was a joke; there was no visible equity, and the brand name of the journal was valued in accounts at a nominal one Swedish kronor. But we did have one thing: substantial invisible knowledge-based assets, including some of Sweden's best financial analysts, a well-known brand and a large network of friends and well-wishers in the business community" (Sveiby, 1997, p. ix). Sveiby talks about his time at one of Sweden’s biggest finance magazines and his words highlight the traditional accounting’s limitations in reflecting a company’s true value. This company, obviously had valuable assets, but they were unaccounted for. Behind every company there is at least one person with her own set of skills, knowledge and experience. Big companies hold large amounts of aggregate knowledge and information. The employees’ knowledge and skills combined with internal systems, information and other intangibles create the company’s Intellectual Capital (IC). Pandian (2011, p. 286) define IC as “the combined intangible assets which enable the company to function’”. It is popularly divided into Human Capital, Internal Capital and External Capital. Human Capital is the competence of the employees, including features like education and work-related knowledge. The Internal Capital is for example the Information Systems, R&D and Intellectual Property rights like trademarks and patents. External Capital is about the company’s relations with the outside world, primarily its customer relationships but also its distribution channels, business collaborations and franchising agreements (Bozzolan et al., 2003, pp. 548-549). Intellectual Capital is getting increasingly important in a world that gets more and more centered around knowledge and information. But the interest in Intellectual Capital is not a new phenomenon. Already in 1922 Paton observed that the value of a well-organized and loyal personnel could be as valuable as the inventory of a company. The problem was how to account for them in the balance sheet (Roslender & Fincham, 2004, p. 179). Roughly 40 years later, Hermanson introduced the term “human asset accounting”. Human asset accounting provided a first direction of how to account for people in the balance sheet. Roger H. Hermanson also dismissed the previous argument that the company does not own the employees and therefore cannot recognize them in the balance sheet. He argued that employees were operational assets and they, together with other owned assets, provided a value and therefore could be accounted for (Roslender & Stevenson, 2009, p. 856). After Hermanson’s work with human asset accounting the interest of accounting for people rose and in the early years of the 1970s, it was one of the most researched agendas. But because of limited results, the interest started to decline during the end of 1970s and the beginning of the 1980s (Roslender, 1997, p. 9). During the 1990s, the interest for intangible assets and the possibility to account for them started to grow again after a decade long hiatus. In the mid-1990s, the interest escalated due to the pioneering works of Leif Edvinsson amongst others, inspired by researchers such as
2
Sveiby and Kaplan & Norton. The growing interest was mainly because of the increased differences between companies’ book values and market values (Roslender & Fincham, 2004, p. 179). In the early 1990s, the Swedish insurance company Skandia developed a way to account for the value of human capital and structural capital in the annual report. This emerged from the need to find a new way of thinking, regarding Research and Development (R&D) in knowledge-intensive sectors, such as that of Skandia. Neither human capital nor development of IT systems was recognized at all in the balance sheet at that time. Hence: the larger investments in Intellectual Capital, the lower short-term profit (Edvinsson, 1997, p. 366). Skandia defined Intellectual Capital as the difference between a firm’s finance capital (authors’ note: book value of equity) and market value and also proposed a way of accounting for Intellectual Capital (IC), called The Skandia Navigator (Edvinsson, 1997, pp. 369-371). The idea of this model is to quantify the value creation of IC and to connect it to historical financial data. The model is illustrated as a house and Edvinsson (1997, p. 371) also uses that metaphor, where financial data is the roof, process- and customer focus the walls and the foundation consists of renewal and development focus. This is a way of stressing the importance of the latter - the financial performance depends on investments in knowledge in order to achieve a long-term sustainable value-generation. One can argue that consensus regarding the importance of intellectual capital’s role in value-generation today has been reached. Chen et al. (2005, p. 174) conclude: “Intellectual capital is increasingly recognized as an important strategic asset for sustainable corporate competitive advantages.“ In the same way, Johanson et al. (2001, p. 715) argue that organizations are beginning to realize that the only long-term sustainable competitive advantage is coming from intangibles. Beattie and Thomson (2007, p. 132) state that the terms Intellectual Capital and Intangible Assets are often used as synonyms in academic research. Chaminade & Roberts (2003 pp. 736-737) argue that intangibles are used as an accounting term and IC as a management or human resource term and this could very well be the case. There are however numerous definitions of the two terms. Pandian (2011, p. 286) defines intellectual capital as “the combined intangible assets which enable the company to function’.” The author also writes that IC is currently valued at zero in the balance sheet. We find this confusing since intangibles, although not to a high extent, are present in balance sheets under IAS/IFRS and the definition of an intangible asset is different, since it refers to intangibles meeting IFRS conditions, allowing it to be recognized in the balance sheet. The IFRS definition is: “an identifiable non-monetary asset without physical substance. An asset is a resource that is controlled by the entity as a result of past events (e.g. purchase or self-creation) and from which future economic benefits (inflows of cash or other assets) are expected.” (IAS 38.8) Thus, the three critical criteria of an intangible asset are:
• identifiability • control (power to obtain benefits from the asset) • future economic benefits (such as revenues or reduced future costs)
The term Intellectual Capital includes components like employees, leadership, technology and training (Edvinsson & Malone, 1997, p. 3). These elements are often hard to recognize

3
in the balance sheet because they do not fulfill the three criteria. For example, it is often argued that employees do not fulfill the control criteria because the firm does not own the employees and they can resign at any time. Other IC factors like leadership, employee training etc. are hard to recognize because they do not meet the identifiability-criteria. The most common time of recognition for goodwill and other intangibles is at the time of acquisition. Self-generated intangibles and IC are often left out of the balance sheet since they, unlike acquired intangibles lack a market value. We will in this study refer to intangibles when we are talking about IC items that are recognized in the balance sheet and IC when we talk about all IC terms including the ones that are not recognized. Failure to meet the criteria of an intangible asset according to IFRS leads to parts of a company’s value being omitted from the balance sheet, but the market may anticipate it by being reflected in the market value of a company’s equity. Intellectual capital researchers often, refer to the difference between market value and book value to as the “hidden value” (Brennan, 2001, p. 428; Roslender & Fincham, 2004, p. 179; Whiting & Miller, 2008, p. 26). It is called the ‘hidden value’ because it is not recognized in the balance sheet due to the limitations in the accounting standards, when it comes to reflecting the true value of certain assets (Financial Times, 2012). Price-to-book (P/B) is a ratio where P is the stock price and B is the firm’s equity per share. A “normal” P/B ratio is one (1), because at this stage share price and equity per share is equal (Penman, 1996, p. 246). A P/B above one (1) indicates that the investors believe that the firm is worth more than the equity in the balance sheet, because the price per share is higher than book value of equity per share. Chen et al. (2005, p. 174) found that investors value companies with better intellectual capital efficiency higher, suggesting that disclosing intellectual capital could increase the value of the company.
1.2 Research discussion Research has shown that the price-to-book ratios (P/B) are high and even further increasing (Gröjer & Johanson, 1998, pp. 499-500; Sundac & Krmpotic, 2009, p. 281; Pandian, 2011, p. 286). Since IC is believed to be the “hidden value”, in other words, the difference between the market value and the book value, we find it interesting to look in to how share prices are affected by IC disclosure in annual reports. A lot of research (Guthrie & Petty, 2000; Olsson, 2001; Brennan, 2001; Bontis, 2003; Bozzolan et al., 2003; Abdolmohammadi, 2005; Vandemaele et al., 2005; Vergauwen et al., 2007; Whiting & Miller, 2008; Vafei et al., 2011) has, to different extent and results, looked at IC disclosure using content analysis-based frameworks. Another popular way of measuring IC is in terms of efficiency, using proxies for the different types of IC. This has been done by the likes of Pulic (2000), Chen et al. (2005), Wang (2008) and Ferraro & Veltri (2011). These studies use efficiency measures, e.g. Net Sales Per Employee, which is used as an indicator of Human Capital. The differences in research methods, content analysis versus value efficiency, and within methods, different content analysis frameworks and different proxies, has made it hard to compare the studies to each other. The growing premium between companies market price and book value of equity (Gröjer & Johanson, 1998, pp. 499-500; Pandian, 2011, p. 286) increases the curiosity around what
4
drives the ratios up. Several researchers have highlighted traditional accounting’s limitations when it comes to taking the true value of companies in to account, especially regarding intellectual capital (Shareef & Davey, 2005 p. 78; Vandemaele et al., 2005, p. 417; Pandian, 2011, p. 286). Different methods deal with these limitations, e.g. Skandia IC Navigator and WM-Data (Edvinsson & Malone, 1997, p 158), but no one has to this date been able to create a model that makes it possible to put all their IC in the balance sheet. This raises the question: can disclosure of IC give stakeholders the information they need to value a firm’s IC even though the company cannot recognize it? Edvinsson (1997, p. 366) mentions a paradox related to IC investment. Investing in e.g. equipment will show up in the firm’s balance sheet, as assets and the book value of the company will remain intact. They will later be amortized over the assets’ useful lifetime. In contrast, investing in human capital will be shown as an expense in the firm’s income statement because the whole cost is being recognized at once and will lower the value of the firm. The more a company invests in human capital, e.g. education, training etc., the lower the value in the balance sheet in a short-term perspective. This paradox has caught plenty of attention during the last decade. Hand & Lev (2003, pp. 520-522) suggest a more consistent and mandatory IC disclosure in companies’ reports to decrease the information gap between investors and the firm. Vergauwen et al. (2007, p. 1165) state that IC disclosure can decrease the information asymmetry between the company and the market. Less asymmetric information means lower discounts on good investments since the market, to a higher extent, can separate them from the bad ones and subsequently, it should raise the price of ‘good investments’. We want to examine IC disclosure and share prices of the companies on Nasdaq OMX Stockholm. To conduct this study on Swedish companies is interesting in many ways. Previous research (Olsson, 2001; Vandemaele et al., 2005) has been done on IC disclosure in Sweden but not, to the best of our knowledge, in the way we aim to do it – regression analyze share price and IC disclosure. Previous researchers Guthrie & Petty, (2000); Brennan, (2001); Bozzolan et al., (2003); Abdolmohammadi, (2005); Whiting and Miller, (2008), to name some, have shown a relationship between IC disclosure and firms’ market value in different contexts but the results have been inconsistent. This motivates further research in this field. Scandinavian companies, in particular Swedish, have been concluded by researchers to be in the lead in terms of IC disclosure (Sveiby, 1997; Bontis, 2003; Bukh et al., 2005; Vandemaele et al., 2005). Hence, you can argue that Sweden is one of the best places in the world to conduct a study like this since the presumed relationship between IC disclosure and price should be more visible here than anywhere else in the world. If Intellectual Capital indeed is the difference between market price and book value, then it is interesting to investigate whether or not the level of IC disclosure can explain the share price.
1.3 Research question Is there a relationship between the OMXS30-companies’ IC disclosures and their share prices?
5
1.4 Research purpose Our purpose with this thesis is to examine if there is any relationship between companies’ IC disclosures and their share prices. We also want to investigate to what degree the level of IC disclosure can explain the price premium. Furthermore we intend to investigate the development of IC disclosure over our sample period, 2001 to 2010. Finally look to provide a bridge between content analysis based studies and studies using efficiency measures of IC by regression testing our IC measures against common proxies.
1.5 Contribution We want to contribute, with this study, to a broadening of the already existing research in this field e.g. Guthrie & Petty, 2000; Brennan, 2001; Abdolmohammadi, 2005; Whiting & Miller, 2008, with a perspective of Sweden that has not earlier been studied. When the previous research has been inconsistent about if disclosure of IC affects the market value we also want to help spread some light in the dark. Mainly we want to conclude if companies can show their real value by disclosing more information about IC to its investors. This will assist companies in their decision process regarding IC disclosure and investors, shareholders and analysts in their buy, sell and hold decisions/recommendations. Creditors could also be interested in this study when trying to determine the value of potential customers. Additionally we aim to contribute to an increased comparability between content analysis based studies and proxy based studies by regression test our IC disclosures against corresponding proxies from previous research.
1.6 Limitations The study is looking at the relationship between IC disclosure and the share price on the OMXS30 companies in their annual reports. The reason that we limit our study of IC disclosure to annual reports is that they are scrutinized by auditors and therefore should be materially accurate, in contrast to information on the companies’ websites, which is not always reviewed by a third party. Apart from this, previous studies such as Guthrie & Petty, 2000; Brennan, 2001; Bontis, 2003; Abdolmohammadi, 2005 have all investigated disclosure in annual reports and in order to make our results comparable with those mentioned we will look for disclosure in the same medium. Previous research has shown that the amount of IC disclosure is positively affected by company size (Bozzolan et al., 2003, p. 543). We want to investigate whether or not IC disclosure can explain differences in price by looking at the 30 most frequently traded stocks at Nasdaq OMX Stockholm, which all are listed on the large cap list, we are likely to cover those with the highest disclosure. It is also a matter of getting their annual reports in English, so that we can use our framework without translating it to Swedish. Not all smaller companies present annual reports in English but every company in our sample does. We will concentrate our study to the time period 2001 to 2010 because of the time limitation on this course; this will regulate but not limit our findings to this period. We will not be able, based on our results, to explain the relationship between share price and IC disclosure before 2001 but our findings may be transformable to future time periods beyond 2010. The study is limited to companies included in the OMXS30 because these are the most frequently traded stocks
6
and this will eliminate mispricing because of low liquidity of a stock. All companies on OMXS30 are also forced by Nasdaq OMX Nordic to present more information than just annual reports, e.g. quarterly reports that will keep the investors updated and lower the risk for apparent information asymmetries. Furthermore, our study does not make any difference between mandatory and voluntary IC disclosure, in contrast to previous research. This is due to lack of time, since we are working with a tight timeframe. Finally, IFRS has progressed during our researched time period and differences related to what were mandatory to disclose in the beginning of our sample period and the end may vary. This can have an impact on the results but it is outside the scope of this study to analyze this further
1.7 Accounting concepts Here are a couple of IFRS definitions of accounting principles that are relevant to this study. However, the reader needs basic knowledge in accounting and finance in order to fully understand this paper and to provide the basics are outside the scope of this work. We present this part to make a clear difference between IC and intangible assets. Intangible assets are, in this thesis, assets that are possible to recognize on the balance sheet according to the accounting rules. We are going to study firms on the OMXS30 index and even if some of the firms report according to US GAAP or other GAAP most of the firms in this index report according to IAS/IFRS. Because of this we will shortly go through the IAS/IFRS accounting principles for intangible assets. The definitions of the IFRS Standards are collected from iasplus.com (Deloitte, 2012).
1.7.1 Intangible Assets according to IAS38 Intangible assets have to fulfill these three categories to be recognizable. Identifiability: an intangible asset is identifiable when it: [IAS 38.12]
● is separable (capable of being separated and sold, transferred, licensed, rented, or exchanged, either individually or together with a related contract) or
● arises from contractual or other legal rights Control The entity holds the legal control and the ability to obtain future benefits of the asset. Future economic benefits That it is plausible that the asset will generate future benefit or reduce costs. IAS 38 states some examples of usual intangibles that often can be recognized.
● Computer software ● Patents ● Copyrights ● Motion picture films ● Customer lists ● Mortgage servicing rights ● Licenses ● Import quotas

7
● Franchises ● Customer and supplier relationships ● Marketing rights
1.7.2 Goodwill Goodwill is also an intangible asset but is covered by IFRS 3 instead of IAS 38. Goodwill is defined by IFRS 3 as: Goodwill is measured as the difference between:
● the aggregate of (i) the acquisition-date fair value of the consideration transferred, (ii) the amount of any NCI, and (iii) in a business combination achieved in stages (see Below), the acquisition-date fair value of the acquirer's previously-held equity interest in the acquiree; and
● the net of the acquisition-date amounts of the identifiable assets acquired and the liabilities assumed (measured in accordance with IFRS 3). [IFRS 3.32].

8
2 Theoretical methodology
2.1 Introduction To assess the quality of research in business economics one should know as much as possible about the researchers’ roles in this process – as much as possible in terms of how they collect and analyze data and about their theoretical point of departure. This understanding comes from scrutinizing the research methods (Bryman & Bell, 2005, p. 18). The research that we are about to conduct and the methods, which we will use are affected by how we, as authors, view the world. The research methods are not neutral instruments but are connected to the social researchers’ organizational reality. A central question is whether theory controls research or if research is creating theory, this corresponds to the use of a deductive or inductive approach respectively. Other important topics related to scientific philosophy include epistemological questions, like what is valid knowledge, and ontological questions, such as if social reality is something beyond the control of man or not. Finally, is the study built on positivism or interpretivism? (Bryman and Bell, 2005, pp. 15-16). What is knowledge? Epistemology’s main issue, how we can acquire knowledge, has a widely accepted definition: justified true belief, derived from Plato. From this definition, three sub-issues are created; the nature of belief, the basis of truth and the problem of justification. Saunders et al. (2007, p. 102) defines it, “epistemology concerns what constitutes acceptable knowledge in the field of study.” The two main schools in the field of epistemology are positivism and interpretivism. Positivism is derived from the natural science but is not limited to the same. The definition of Positivism differs among researchers but according to Bryman & Bell (2007 p. 16) the majority agrees that positivism is:
• Only phenomena and hence knowledge confirmed by the senses can genuinely be warranted as knowledge (the principle of phenomenalism).
• The purpose of theory is to generate hypotheses that can be tested and that will thereby allow explanations of laws to be assessed (the principle of deductivism).
• Knowledge is arrived at through the gathering of facts that provide the basis of laws (the principle of inductivism).
• Science must (and presumably can) be conducted in a way that is value free (that is objective).
• There is a clear distinction between scientific statements and normative statements and a belief that the former are the true domain of the scientist.
Bryman & Bell (2005) state that the role of science is to test theories and collect evidence to construct laws. This implies that the observation that the researcher collects can be retrieved without affecting the observations and one can therefore create generalizable propositions, which are testable (p. 27). Positivism also implies that a theoretical term that cannot be observed is not genuine science and hence, it ranks observations higher in the knowledge hierarchy than theory (Bryman and Bell, 2005, p. 27).

9
Interpretivism, which differentiates social science from natural science, is the opposite of positivism. Because of this social science needs different models and approaches than natural science (Bryman and Bell, 2005, p. 29). Under interpretivism the focus is to understand human behavior, in contrast to explaining it, which is the main focus of positivism (Bryman and Bell, 2005, p. 29) We are going to lean on mainstream accounting and say that theory and observations are two separate terms and quantitative methods are the best way of generating generalizable findings (Ryan et al., 2002, p. 11). Therefore we will adopt a positivistic approach. Ontology, Social and physical reality Ontological questions are related to if a social entity is a part of society and by this social and physical reality is beyond the objective’s control (objectivism), or if the objective it self creates the social and physical reality around it (constructionism) (Bryman & Bell, 2005, p. 33). In the school objectivism we as social entities will encounter social phenomena as external facts that lay outside our intellect and therefore our control. This means that social phenomena exists independent of the actors in it. The actors will adapt to these social organizations and we as researchers can observe these organizations and how actors behave (Bryman & Bell, 2005, p. 33). In contrary to objectivism we have constructionism. Constructionism is an ontological view where the social actors create social phenomena and that these organizations are not only created, but under constant revision, by the social actors (Bryman & Bell, 2005, pp. 33 - 34). If the researcher has a constructional standpoint she has to investigate the relationship between the social actors were the social phenomena occurs and not the phenomena itself (Bryman & Bell, 2005, p 35). Like mainstream accounting research (Ryan et al., 2002, p. 41) we believe that the social and physical reality is beyond the control of man and hence humans are passive but rational and society and organizations are stable – because of this, we adopt an objective ontological approach. Deductive and inductive approaches The deductive approach is the most common within the field of social science (Bryman & Bell, 2005, p. 23) In a deductive process the researchers take departure in theory from which they formulate hypotheses. Then they perform a data collection that will render results from which the hypotheses can either be confirmed or rejected. This will finally lead to a theoretical contribution, either a confirmation or a revision. The alternative to the deductive approach is the inductive approach. In contrast with the deductive approach the inductive approach take its starting point from the observations and results and from this the researcher constructs theories (Bryman & Bell, 2005, p. 25). Our study will have a deductive approach and by this take our point of departure from already established theory. We will in this degree project take you through the different steps in our deductive process. Already in the first chapter, we introduced you to the theories we took departure in. In this chapter, we introduce you to our methodological standpoints. In chapter three we present our theories and end the chapter with connecting them to our hypotheses. In between we also have a review of previous research to motivate our theoretical contribution and to connect our study to previous ones in the field. Our data collection process is covered in chapter four (4) and in chapter five (5) we will present our results and provide an analysis. Finally, in chapter six (6) we will draw our conclusions and present our theoretical contribution.

10
Figure 1. The deductive process.
Source: Bryman & Bell, 2005, p. 23. Although the deductive process looks linear there are, according to Bryman and Bell (2005, p. 24), several examples, which show that this does not have to be the case. New theories and new research findings might have been published by others, before the study is finished, data collection can put a theory in to a different light, different relevance and finally, the data might not be coherent with the original hypothesis. A deductive approach therefore has this chronological order in theory but in practice, it is more of an on-going process throughout the study and this means that the original theories and hypotheses might be slightly changed, which means that even deductive approaches have some inductive elements.
2.2 Quantitative study We are going to conduct a quantitative study and in doing so it is necessary to discuss measures such as reliability and validity. The findings must be both reliable and valid. For example, assume that one article state that the Swedish stock market is one of the most efficient in the world. The study has high reliability but the conclusion is based on a quantitative study of the Norwegian stock market. Can the findings really be generalized to the Swedish market? No, this is probably not the case. Assume instead that the study was conducted, examining the Swedish stock market, but the authors are not disclosing their course of actions, making it impossible to replicate the study. In this case the study is not reliable. Even though reliability and validity can be torn apart they are correlated. You can,
11
as mentioned above, have a study that is reliable but not valid but the opposite is impossible. E.g. if a measurement is not stable over time it cannot be valid because even if it at one time measured the objective in mind it will at another time measure something else. A measurement that measures different things over time can never be valid. (Bryman & Bell, 2005, p. 99)
Figure 2. The reliability-validity quadrant.
Source: Business Broadway, 2012.
2.2.1 Reliability The reliability concerns to what extent the results of a study would be the same if it were re-done, therefore also to what extent the results are biased due to random or temporary conditions. This means that a study that, to a high extent, will provide the same results has a high level of reliability and a study with significant biases a low. The measure is usually relevant in quantitative research since the researcher tend to be interested in whether a result is stable or not. (Bryman & Bell, 2005, p. 48) Milne & Adler (1999, p. 238) state that content analysts need to demonstrate the reliability of the coding and of the collected data in order for the findings to be replicable and valid. Reliability related to the collected data is usually motivated by the use of multiple coders, and that the differences between their results are few or that they have been re-coded. Apart from this, the reliability in the coding instruments needs to be motivated. This can be done by thoroughly specifying the decision categories as well as the decision rules (p. 239). Investigating the disclosure of the social and environmental reporting in annual reports, the authors conclude that there are no minimums that can be adopted to improve reliability. An advice that can be drawn from the study is that the researchers need to understand “...the
12
tools, their limits and the research context, before making careful interpretations of the results” (p. 252). We have in our study tried to make our study as reliable as possible by carefully state rules for the coding process during the content analysis. Because of the time and monetary limitations for this degree project we have not been able to apply external coders to execute the content analysis. Despite this limitation in the coding process we feel that the rules and guidelines we conducted are enough to make the data collection reliable. The rules and guidelines for the coding process are specified in 4.3 Content analysis coding process. Our framework in the content analysis is based on previous research that used just this. By this we know that previous studies that have measured IC disclosure have used these, which increases the reliability of the framework.
2.2.2 Replication Replication is an important part of the social science. If the possibility of replication is low or even impossible the validity of the study can be questioned and this is why researchers put a lot of effort in making their studies replicable. This can be done by carefully describing the way the study has been carried out. (Bryman & Bell, 2005, p. 102) Gray et al. (1995, p. 85) argue that when using content analysis the data collection should be replicable. We will disclose our content analysis framework; this way the reader can see which words or terms that were used in the analysis. It is almost impossible to be fully objective (Saunders et al., 2007, pp. 103-104) the researchers’ values will always affect the coding process that will make complete replication of the study by other researchers hard. But by showing our framework, coding process and coding decisions we will try to increase the transparency in our study and by this give the reader the best possible basis for replication. We will throughout this paper as carefully as possible describe how the study has been carried out to make it as replicable as possible, but specifics related to our research design is presented in chapter 4.
2.2.3 Validity Validity, together with reliability and replicability are relevant terms in quantitative studies. As given by the name, validity concerns how valid the findings are. The validity of the study is divided into internal and external validity. Internal validity answers how well the research answers the research problem and external to what extent the findings can be generalized to the population. In quantitative research, researchers are usually striving to make the studies as generalizable as possible (Bryman & Bell, 2005, pp. 100-102). If the internal validity is low, so is the external but the opposite does not have to be true (Ryan et al., 2002, p. 123). Optimizing one dimension however, tend to compromise the other. It is possible to argue that internal validity is the most important but this might vary with the field of research.
2.2.4 Internal validity The study is dependent on the research being coherent with the research question in order to be able to draw valid conclusions (Ryan et al., 2002, p. 122). If the there are biases in the data collection or the selected research approach do not measure what it should the internal validity is low. It is therefore crucial to make sure that one is using valid measures in order
13
to be able to draw valid conclusions. We are going to conduct our study using a content analysis framework based upon previous research in the field and we will also use regression to investigate if there is a relationship between IC disclosure and share price, together with two commonly used variables, earnings per share (EPS) and book value per share (BVPS). We will use an accepted research method in accounting research when using the OM, which has previously been used by Wang (2008) and Ferraro & Veltri (2011), looking for a relationship between IC and stock prices, measuring the relationship between Price and IC. These studies use a modified version of OM, including EPS and BVPS and we will use the same version as they do but we will switch their IC proxies for our IC scores from our content analysis. This will be explained more in chapter 4.
2.2.5 External validity External validity is defined as “the extent to which the results of a study may be generalized to other settings and samples...” (Ryan et al., 2002, p. 123). The problems related to external validity can be divided into three types. First, the population validity, since researchers almost always examine a sample of a certain population the sample has to represent the population. Second, the time validity is a factor: how can results from the researched time period be generalized to others? The third type that is mentioned is environmental validity, concerning e.g. the so-called “Hawthorne effect”. In financial research, “data-snooping” bias can arise when the researchers use the same computerized databases (p. 124). Our research will be limited to companies included in the OMXS30 index which make generalization to all publicly traded companies hard but most of the OMXS30 companies are large caps and it should be possible to draw conclusions that are generalizable for Swedish large caps.
2.3 Pre-understanding It is impossible to be completely objective but in the positivist approach it is crucial that the researcher has, to such high degree as possible, a value-free approach (Saunders et al., 2007, pp. 103-104). Everyone has their own values in life and it is up to us as authors, to present ourselves in order to give the reader sufficient information relevant to ours. Bryman & Bell (2005, p. 43) state that one should reflect upon how one’s background can affect the research outcome. We, Andersson & Wiklund, started to study at Umeå School of Business and Economics in the autumn of 2007. We have studied business economics and chosen to specialize ourselves in accounting. We are conducting this study as our degree project for a Degree of Master of Science in Business and Economics.

14
3 Theoretical framework In chapter 3 we will present the theories that we have built our study upon as well as relevant previous research, which will help illustrate the research gap that we look to fill. As this study is deductive in its nature we will end the chapter with our hypotheses.
Figure 3. Our theoretical framework
3.1 Efficient Market Hypothesis, Agency Theory and the drivers of stock price Eugene Fama introduced Efficient Market Hypothesis in his work from 1970. An efficient market is a market that at any time fully reflects all information available. In accordance with Fama’s EMH, prices on stock markets can react in the weak form, the semi-strong form and the strong form. If the market is efficient in the weak form it will react to historical information, in the semi-strong form the market reacts to all other information that is publicly available and in the strong form, there are no investors or groups that have monopolistic access to information (Fama, 1970, p. 383). Burgess (2010) among other researchers finds inconsistent evidence of EMH in emerged markets even in the weak form. Fama (1970; 1991) on the other finds evidences of markets being efficient in the weak and semi-strong form and Burgess (2010, p. 725) states that efficiency on markets tend to evolve over time and that they found the most efficient markets in their study to be the most mature markets. Fama (1970 p. 415) states that the strong form of efficiency is probably best seen as a benchmark to what divergences can be measured. In the strong form of efficiency, no information asymmetry exists. George A. Akerlof (1970) illustrates the negative effects of asymmetric information, taking the market for used cars as an example. In this market, the owner of a car has superior information of the quality of the car. Good cars are called cherries and bad cars are called lemons. The probability that a certain car is a cherry is defined as q and the probability that a car is a lemon is therefore one (1) less q. In such a market, the risk of buying a bad car sets the price for roughly all used cars. Of course, there are differences but the bottom line is: the buyer, who suffers from asymmetric information cannot know if a car is a lemon or a cherry, therefore the prices of used cars will reflect the average car. The owners of cherries can either sell their cars at discounts or keep them, the latter leading to them vanishing from the market and as Akerlof puts it: “It has been seen that the good cars may be driven out of the market by the lemons. But in a more continuous case with different grades of goods,
EfLicient Market
Hypothesis Agency Theory Ohlson Model
The Stock Price and its drivers
Intellectual Capital
Previous Research
Hypotheses creation
15
even worse pathologies can exist. For it is quite possible to have the bad driving out the not-so-bad driving out the medium driving out the not-so-good driving out the good in such a sequence of events that no market exists at all.” (Akerlof, 1970, pp. 489-490) Healy & Palepu (2001, p. 408) translate Akerlof’s example to the capital market, where investors, suffering from asymmetric information, cannot know if a certain investment is a good or a bad one. In the same way as with the market for used cars, the good investments will be undervalued. Rylander et al. (2000, p. 736) state that managers felt that their firms were undervalued. We see that adverse selection in the stock market is a concern for the modern-day company. Here IC disclosure in annual reports has a role to fill because research has shown that it decreases the information asymmetry between the market and the company (Vergauwen et al., 2007, p. 1165). Bukh et al. (2005, p. 727) state that firms whose value-creation, to a high extent, are coming from intangible assets must disclose more information regarding IC in order to decrease the level of information asymmetry, showing it is getting increasingly important as the service sector, which is heavily dependent on intellectual capital, continues to grow. In accordance with EMH and Agency theory, mispricing of stocks can occur from information asymmetry and inefficient markets. We will have this in mind during our study but by looking at the companies included in the OMXS30 index, which are the 30 most traded stocks on Nasdaq OMX Stockholm Stock Exchange, we will examine 30 of the markets most liquid stocks in Sweden. In doing so, you can argue that even if not the whole Swedish stock market is efficient, we will examine the part of the market that has the best conditions for efficiency. The Swedish stock market can be viewed as a mature market and based on this and previous studies we will assume that the Swedish stock market is efficient in at least the semi strong form. In these form of efficiency, the market would react to new information such as annual reports, both when it comes to qualitative and quantitative information. And even though the Stockholm Stock Exchange may not be efficient in the strong form, which will make it possible for insiders to use their information advantage, we will in this study view the market as efficient and hence; that laws and regulation against usage of inside information etc. are efficient enough. A firm’s value is dependent on the present value of future dividends (Penman, 1996, p. 237). According to this definition, is it possible to value firms that do not pay dividends? Yes, because some time in the future the company will pay some kind of dividend, a fraction each year or 100 % of its equity in the last year of existence – the present value of the paid dividends will still be the same. Some common valuation methods are The Residual Earnings Model (REM), The Dividend Discount Model (DDM) and The Abnormal Earnings Model (AEM). After its introduction, in the mid 1990s, The Ohlson Model (OM) has become the standard model for market-based research in accounting (Ferraro & Veltri, 2011, p. 69). The Ohlson Model makes it possible to value firms by using three defined variables: book value, earnings and dividends. Additionally, a fourth variable called ‘other information’ is included. It could represent different things in different research. In this field of research, it is generally an IC measure, e.g. in Ferraro & Veltri (2011). The model is based on a number of assumptions, 1; the firms’ value is based on present value of future dividends, 2; changes in equity follow the clean surplus relationship (Ohlson, 1995, p. 663).
16
𝐵! = 𝐵!!! + 𝐸! − 𝑑! Eq (1)
Dividends affect book value of equity but leaves earnings unchanged, 3; abnormal earnings, which is defined as the current earnings less the required rate of return (risk-free rate in the OM) times the book value of equity in the beginning of the period, has a stochastic time-series behavior. All investors are risk neutral and when risk neutrality is applied, the risk free rate is equal to the required rate of return (Ohlson, 1995, p. 663). The Ohlson Model is expressed like this by Wang (2008, p. 553).
𝑃! = 𝐵𝑉! + 𝛼!𝐴𝑅! + 𝛼!𝑣! Eq (2) In this model, P is the price of the stock, BV is the book value, AR is the abnormal earning and v is all other information not yet covered by the accounting data at time t. Alpha 1 and Alpha 2 are constants that need to meet a number of criteria, for more specific description see Ohlson (1995). In modern research it has been common to ignore v in the OM and by this put it equal to zero (0) (Ferraro & Veltri, 2011, p. 74) However Wang (2008) and Ferraro & Veltri (2011) are two studies that do not. They apply IC in different forms as measures of this ‘other information’. They use proxies from the balance sheet and the income statement as indicators of IC. We will in the same manner apply our IC-index as v in our model. Another important assumption in OM is the linear information dynamics (LID). LID assumes a time-series behavior of abnormal earnings (Wang, 2008, p. 553). Because of this, Wang (2008) also review the definition of abnormal earning and translate CSR and states that AR can, after these modifications, be described by book value of equity and net income for the time t (p. 553). Ferraro & Veltri (2011) state that using all values on per share basis is a natural starting point (p. 70). The new simplified model that is used both in Wang (2008) and Ferraro & Veltri (2011) is defined as below (Wang, 2008, p. 555; Ferraro & Veltri, 2011, p. 74). In order to use the OM combined with our IC-index to predict price in a regression we will use the same modified version of the OM as Ferraro & Veltri (2011, p. 74)
𝑃! = 𝛽! + 𝛽!𝐵𝑉𝑃𝑆! + 𝛽!𝐸𝑃𝑆! + 𝛽!𝑣! Eq (3) Here, BVPS is book value of equity per share, EPS is earnings per share and v is all other information that may affect the price, in Wang (2008) and Ferraro & Veltri (2011) the IC-proxies. We will in our study use the same modified OM as the two just mentioned studies because it makes it possible to use the model in a regular regression to measure particularly the “other information” – in our case the IC disclosure-index. In all these models, the valuator needs to calculate a cost of capital, in the OM as mentioned above the cost of capital is equal to risk free rate. One common way of calculating the required rate of return or the cost of capital is to use the CAPM-formula, which is defined in section 1.7.1. Under CAPM, each investment is expected to yield a return fair to its risk (Bruner et al., 2008, p. 90). This means that for two stocks with different risk, all else being equal, the stock with the lower risk should be the more expensive – due to its lower cost of capital.
17
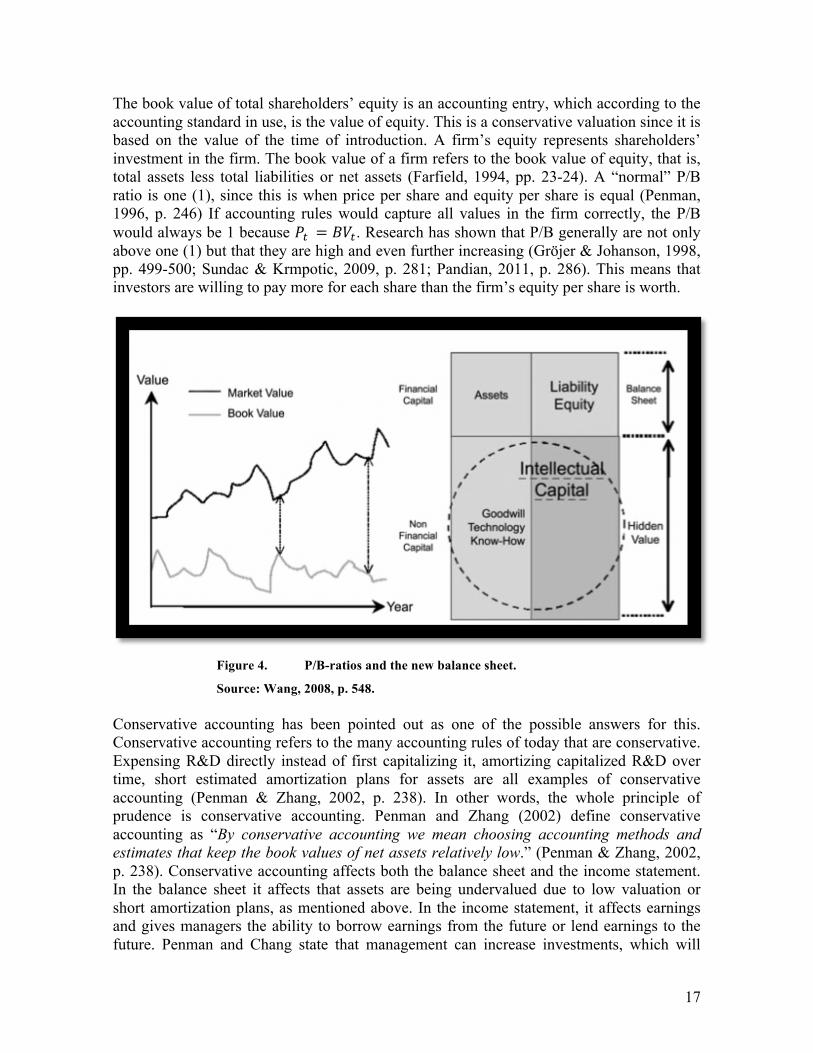
The book value of total shareholders’ equity is an accounting entry, which according to the accounting standard in use, is the value of equity. This is a conservative valuation since it is based on the value of the time of introduction. A firm’s equity represents shareholders’ investment in the firm. The book value of a firm refers to the book value of equity, that is, total assets less total liabilities or net assets (Farfield, 1994, pp. 23-24). A “normal” P/B ratio is one (1), since this is when price per share and equity per share is equal (Penman, 1996, p. 246) If accounting rules would capture all values in the firm correctly, the P/B would always be 1 because 𝑃! = 𝐵𝑉!. Research has shown that P/B generally are not only above one (1) but that they are high and even further increasing (Gröjer & Johanson, 1998, pp. 499-500; Sundac & Krmpotic, 2009, p. 281; Pandian, 2011, p. 286). This means that investors are willing to pay more for each share than the firm’s equity per share is worth.
Figure 4. P/B-ratios and the new balance sheet.
Source: Wang, 2008, p. 548. Conservative accounting has been pointed out as one of the possible answers for this. Conservative accounting refers to the many accounting rules of today that are conservative. Expensing R&D directly instead of first capitalizing it, amortizing capitalized R&D over time, short estimated amortization plans for assets are all examples of conservative accounting (Penman & Zhang, 2002, p. 238). In other words, the whole principle of prudence is conservative accounting. Penman and Zhang (2002) define conservative accounting as “By conservative accounting we mean choosing accounting methods and estimates that keep the book values of net assets relatively low.” (Penman & Zhang, 2002, p. 238). Conservative accounting affects both the balance sheet and the income statement. In the balance sheet it affects that assets are being undervalued due to low valuation or short amortization plans, as mentioned above. In the income statement, it affects earnings and gives managers the ability to borrow earnings from the future or lend earnings to the future. Penman and Chang state that management can increase investments, which will
18
lower the earnings and by this create reserves of earnings for the future. In the future they can increase these reserves to lower earnings further or release them to increase earnings (Penman & Zhang, 2002, p. 238). Nissim and Penman show in their work from 2003 that leverage affects the price and by that, the P/B ratio. There are two types of liabilities: operational and financial (Nissim & Penman, 2003, p. 531). Because liabilities are components of firms’ equity and P/B is determined of expected rate of return on equity. P/B will be affected by the firms’ leverage if the two types of leverage are associated with different risks or required rate of return. They found that firms with higher operational leverage have in general higher price than those with high level of financial leverage (Nissim & Penman, 2003, p. 531-532). This shows that investors in general associate financial leverage with higher risk than operational leverage. In the same way, tangible and intangible assets are associated with different risks or required rate of returns. How risk and required rate of return collaborate with each other was shown earlier, using the CAPM-formula. Bruner et al. (2008, p. 90) state that under CAPM, each investment assumes to yield a return fair to its risk. Because most intangible assets are considered to be high-risk assets they also need to require a high rate of return in association with CAPM (Chiucchi, 2008, p. 219). Furthermore, a considerable amount of the companies’ assets are today so called soft assets or intangibles and the main part of these do not appear in the balance sheet (Marr et al., 2003, p. 32). According to Bozzolan et al. (2003, p. 555) higher levels of disclosure can help to reduce the variability of future performance as perceived by external investors, as well as risk and, therefore, the cost of capital. As an investor in a company it is hard or even impossible to know how much intellectual capital the firm possesses. You know from the balance sheet at what amount intangible assets has been capitalized and from the income statement you know how much the company spends on personnel training but this is just a fraction of the total intellectual capital the firm possesses. Management of the firm on the other hand, knows or at least should know how big this intellectual capital is. In accordance with the agency theory there is an information asymmetry between investors and company management. The management knows more about the firms IC than the investors. This can lead to mispricing of the stock because the investors cannot value the firms IC correctly, which is common when the seller know more than the buyer (Akerlof, 1970, pp. 489-490; Healy & Palepu, 2001, p. 408), if we see the management as the sellers of the stock, they are at least the promoters. So how can management perceive the investors of the value of the IC. According to the agency theory the information asymmetry needs to be decreased. Management can simply communicate the value of the firm’s IC. This can be done through more advance models as the Skandia Value Scheme (Edvinsson, 1997, p. 369) or simpler ones literal descriptions in the annual report. So from the Agency Theory and the rules and regulations regarding intangible assets, one would expect that the firms that disclose more information about their IC would be the ones that have relatively more value of IC, and by this, bigger information asymmetry between investors and management. As Bukh et al. (2005, p. 727) state: firms that to higher extent rely on intangible assets must disclose more information about their IC to decrease the information asymmetry. The same principle is the case for the whole IC concept.

19
At least smaller investors, most often, do not have access to information about the intangible assets. Therefore a low level of disclosure can lead to a relatively higher perceived risk. This would make the companies’ cost of capital increase all else being the same. The case is the opposite with a high level of disclosure. (Marr et al., 2003, p. 32). Chiucchi (2008) states “In summary, it can be said that an IC statement produces positive effects on the company’s external as well as internal reputation in that it increases the trust from all stakeholders in the firm’s management. Making visible what is usually invisible, it reduces the uncertainties and the risks for all the stakeholders” (Chiucchi, 2008, p. 219). An as mentioned before, the big differences between market value and book value of equity indicate that traditional accounting cannot cover the fair value of a company. Disclosing IC should increase the perceived value of the company even further. Based on theory and previous research described earlier, the two statements in figure 5 would be true about two all else equal companies;
Figure 5. Assumptions about IC-level and IC disclosure.
It is clear that publishing IC reports can reduce the, by the investors, perceived risk, which would lower the companies’ cost of capital. Pursuant to the above statements the P/B would be different in the two cases. So in accordance with this we want to test the theory, whether or not today’s firms, to a higher extent, have more and more intangible assets that do not appear in the balance sheet. If so, their equity should be untouched. But if investors value this IC it would affect the price and the P/B-ratio would go up. So will price be different for firms with the same amount of equity but different amounts of IC disclosure? That would indicate that IC disclosure affects the share price. With the basic theory about firms’ IC and how IC disclosure should affect the price, the following equation is created;
𝑃! = 𝛽! + 𝛽!𝐵𝑉𝑃𝑆! + 𝛽!𝐸𝑃𝑆! + 𝛽!𝐼𝐶! Eq (4) The model is the same as the modified OM but 𝑣! is switched to 𝐼𝐶!, which is the IC disclosure index for each firm. This index can also be broken down to its components HumCap, IntCap and ExtCap.
3.2 Intellectual Capital model We are going to perform content analysis on annual reports looking for disclosure of Intellectual Capital. A relevant question is: what is intellectual capital? As you will see, there are no sole definition available but several. Depending on which researcher you ask, you get a different answer. In this study, we define Intellectual capital as everything that is
HIgh level of intangibles (IC) and low level of IC
disclosure Higher risk Lower price
HIgh level of intangibles (IC) and high level of IC
disclosure Lower risk Higher price
20
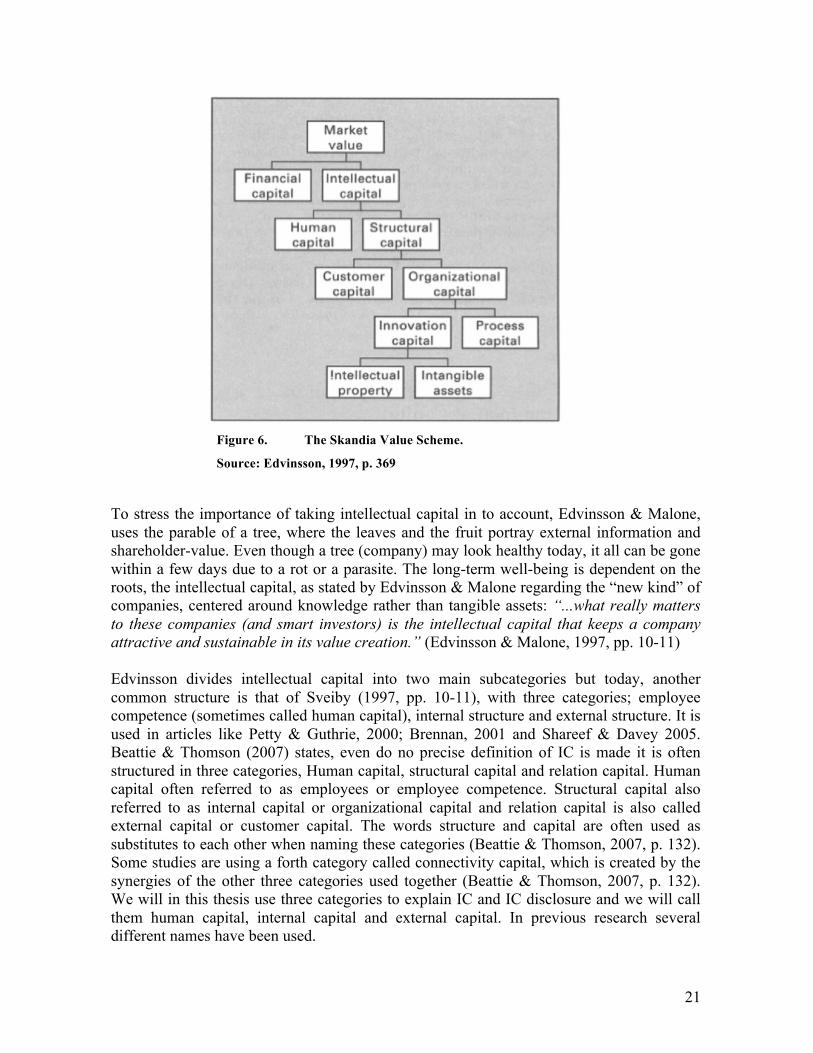
included in these following three subcategories; human capital, internal capital and external capital. Human Capital According to Bozzolan et al. (2003, p. 549) this refers to the human resources, which include features like education and work-related knowledge, competences and also e.g. average age and turnover. Internal Capital Consists of intellectual property (trademarks, patents and patterns) and infrastructure assets (corporate culture, management processes, information systems and networking systems) - things that can be created within the company (Bozzolan et al., 2003, p. 548-549) External Capital This consists, according to Bozzolan et al. (2003, p. 549) of a company’s relations with external stakeholders (customers, distribution channels, business collaborations and franchising agreements). The term intellectual capital was used by Skandia AFS and Leif Edvinsson in their strive to find a new logic regarding development costs (Edvinsson, 1997, p. 366). The work of Edvinsson was an enhancement of ideas coming from Kaplan & Norton’s Balanced Scorecard as well as Karl Erik Sveiby (Sveiby, 1997, pp. 186-189). Edvinsson (1997, pp. 368-370) defines intellectual capital as the difference between a firm’s market value and financial capital, as shown in the figure below. This way of thinking is a fundamental part of our research: If intellectual capital is the difference between market value and book value, then what happens to market value if intellectual capital is disclosed in the annual report? Research (Abdolhommadi, 2005; Whiting & Miller, 2008) has shown a positive association between IC disclosure and P/B. These studies have however, not investigated the Swedish market. In Figure 6, the Skandia Value Scheme is illustrated. The Market Value of the firm is divided in to Financial Capital and Intellectual Capital, where Financial Capital is accounting entry and Intellectual Capital the balancing value. In the same way, structural capital is the balance of intellectual capital and human capital and so on, further the author highlights the importance of transforming human capital, which cannot be owned, in to structural capital. Structural capital can be defined as the value that is left when the employees leave work; the biggest asset here is customer relationships, present as customer capital. After disclosing customer capital, then the balancing value is organizational capital, which then is consisting of innovation capital and process capital, innovation capital finally being sub-ordinated into intellectual property and intangible assets (Edvinsson, 1997, pp. 368-370).
21
Figure 6. The Skandia Value Scheme.
Source: Edvinsson, 1997, p. 369 To stress the importance of taking intellectual capital in to account, Edvinsson & Malone, uses the parable of a tree, where the leaves and the fruit portray external information and shareholder-value. Even though a tree (company) may look healthy today, it all can be gone within a few days due to a rot or a parasite. The long-term well-being is dependent on the roots, the intellectual capital, as stated by Edvinsson & Malone regarding the “new kind” of companies, centered around knowledge rather than tangible assets: “...what really matters to these companies (and smart investors) is the intellectual capital that keeps a company attractive and sustainable in its value creation.” (Edvinsson & Malone, 1997, pp. 10-11) Edvinsson divides intellectual capital into two main subcategories but today, another common structure is that of Sveiby (1997, pp. 10-11), with three categories; employee competence (sometimes called human capital), internal structure and external structure. It is used in articles like Petty & Guthrie, 2000; Brennan, 2001 and Shareef & Davey 2005. Beattie & Thomson (2007) states, even do no precise definition of IC is made it is often structured in three categories, Human capital, structural capital and relation capital. Human capital often referred to as employees or employee competence. Structural capital also referred to as internal capital or organizational capital and relation capital is also called external capital or customer capital. The words structure and capital are often used as substitutes to each other when naming these categories (Beattie & Thomson, 2007, p. 132). Some studies are using a forth category called connectivity capital, which is created by the synergies of the other three categories used together (Beattie & Thomson, 2007, p. 132). We will in this thesis use three categories to explain IC and IC disclosure and we will call them human capital, internal capital and external capital. In previous research several different names have been used.
22
Edvinsson (1997, p. 369), as illustrated in the Skandia value scheme, separates intellectual capital into two main categories, human capital and structural capital. Structural capital is then divided into customer capital and organizational capital, similar to Internal and External Structure used by e.g. Sveiby (1997) and Bozzolan et al. (2003). We see that these categorizations are closely related and which one to use is more a matter of taste than of importance for the research.
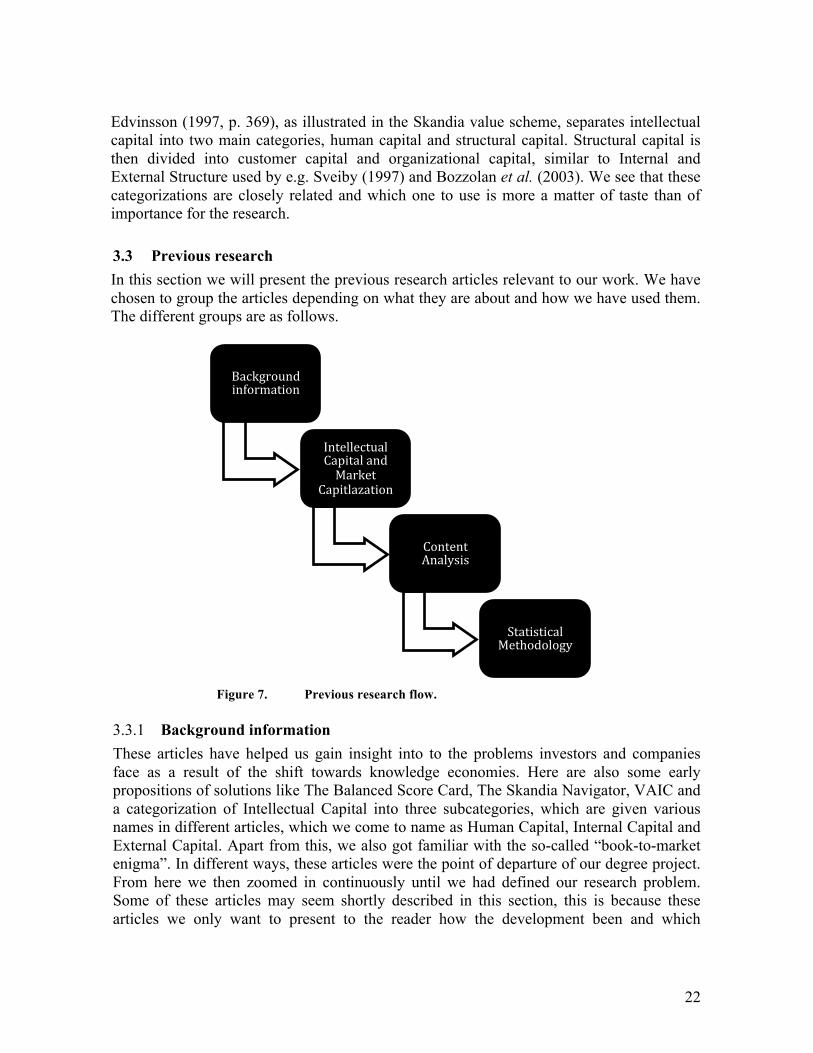
3.3 Previous research In this section we will present the previous research articles relevant to our work. We have chosen to group the articles depending on what they are about and how we have used them. The different groups are as follows.
Figure 7. Previous research flow.
3.3.1 Background information These articles have helped us gain insight into to the problems investors and companies face as a result of the shift towards knowledge economies. Here are also some early propositions of solutions like The Balanced Score Card, The Skandia Navigator, VAIC and a categorization of Intellectual Capital into three subcategories, which are given various names in different articles, which we come to name as Human Capital, Internal Capital and External Capital. Apart from this, we also got familiar with the so-called “book-to-market enigma”. In different ways, these articles were the point of departure of our degree project. From here we then zoomed in continuously until we had defined our research problem. Some of these articles may seem shortly described in this section, this is because these articles we only want to present to the reader how the development been and which
Background information
Intellectual Capital and Market
Capitlazation
Content Analysis
Statistical Methodology
23
researchers who made them. We refer the reader to the specific article if they want a deeper understanding. Kaplan & Norton (1996), famous for inventing the Balanced Scorecard, returns with a new article suggesting the Balanced Scorecard should be used as a strategic management system to connect financial planning with the strategic goals of the company. Lev & Sougiannis (1996) finds that after recalculating firms’ book value of equity and earning for R&D capitalization. R&D capitalization process yields statistically reliable and economically relevant information and that it is therefore relevant for determining future revenue streams and the value of the company. Edvinsson (1997), at the time director of IC at the Swedish company Skandia AFS, presents a definition for intellectual capital, as the balance of a firm’s market value and financial capital, derived from the Skandia value scheme, a way of quantifying intangibles. A second model, the Skandia Navigator is also presented. It is a way of harmonizing the company’s past, present and future as well as financial and non-financial measures. Renewal and development focus is illustrated as the foundation of the model stressing the importance of appreciating IC. These thoughts are then discussed more thoroughly in a book by Edvinsson & Malone (1997). Sveiby (1997) offers a three-category division of Intangibles, internal structure, external structure and employee competence. Further, the author presents a model for measuring intangibles called the Intangible Asset Monitor. According to the author, Sweden has taken the lead in disclosing personnel statements. Lev & Sougiannis (1999) looks in to the so-called Book-to-market enigma, investigating why there seems to be a positive relationship between Book-to-market and subsequent stock returns. Their findings provide a solution to the enigma only for R&D intensive firms. For such firms there is no longer a significant correlation between Book-to-market and subsequent returns when R&D capital is present in the regression. Furthermore the relationship between R&D capital and subsequent returns seems to be more due to a risk factor related to R&D than to mispricing (pp. 441-442). They leave for future studies to investigate if off-balance sheet intangibles can explain the book-to-market enigma. Pulic (2000) presents a new accounting tool for IC management called VAIC or Value-Added Intellectual Capital Coefficient. It can be seen as an enhancement of the Skandia Navigator, providing quantified measures of the value added by a firm’s structural capital as well as human capital. This model is used in several studies as a measure of IC, including Chen et al (2005), which we will get back to. Rylander et al. (2000) is a critical review of the efforts during the 1990’s to a), integrate intellectual capital into the balance sheet or b), create a separate complementary balance sheet for IC. The authors state that the information asymmetry between the company and the market is growing and that many managers feel that their companies are undervalued. They also argue for an inquiring approach, incorporating methods not usually used in business reporting.

24
Johanson et al. (2001) conducts a case study of three Swedish companies’ management control of intangibles - one consultant firm, one telecommunication-company and one bank. The authors argue that organizations are beginning to realize that their only long-term competitive advantage is their intangible resources. Beginning with Sveiby and Edvinsson, inspired by Kaplan & Norton, Intellectual Capital research gained ground during the 1990s and soon, there were two different groups of research. One using content analysis and one using efficiency measures to explain IC. The latter, were made popular by Pulic (2000), among others. We will focus more on the content analysis based studies.
3.3.2 Intellectual Capital, Market Capitalization and Information Asymmetry Taking departure in the IC literature of the 1990s and early 2000s we move on towards present time and more recent studies. We also zoom in more on the relationship between the share price, the book value per share, the intellectual capital and the proposed information asymmetry. Most of the articles use content analysis or proxies taken from the income statement or the balance sheet to measure IC. These articles helped us identify a knowledge gap that our study tries to fill. Healy & Palepu (2001) is an extensive literature review of research related to information asymmetry and corporate information. They summarize the last decades’ findings and highlight a number of questions that are still unanswered. One of these questions (Healy & Palepu, 2001, p. 432) is: “Does disclosure affect firms’ cost of capital?” Abdolmohammadi (2005) investigates voluntary intellectual capital disclosure and market capitalization, using content analysis, in the annual reports of a sample of 58 o 500 companies during 1993-1997. The study is based on Guthrie et al.’s 2003 framework but it was enhanced to contain ten IC categories and 58 components. The author concludes that the evidence is consistent with the literature indicating an overall positive correlation between voluntary disclosure and stock market capitalization. This suggests that there are incentives for companies to disclose information regarding IC but only if the benefits are greater than the costs of disclosure. According to the author, little research has been done on these costs. Bukh et al. (2005) investigate if information regarding intellectual capital is disclosed in Danish IPO prospectuses and furthermore, to analyze whether it has changed from 1999 to 2001 as well as what factors can explain the amount of disclosure. Chen et al. (2005) investigate the relationship between the value creation efficiency, the firms’ market capitalization and financial performance using Pulic’s VAIC. Regression models comparing value creation efficiency and P/B were constructed and implemented on Taiwanese listed companies. They found that investors place higher value on companies with better intellectual capital efficiency.
25
Shareef & Davey (2005) state that even though the ability to create, transform and capitalize knowledge is the optimal source of competitive advantage and that the market-to-book ratios are higher than before, the accounting rules makes it hard to account for intangible assets in a proper way. Shareef & Davey study IC disclosure in listed English football clubs. The authors highlight the issue of recognition of players. Homegrown players will not appear in the balance sheet but bought players will. This could have the affect that clubs with many bought players could be seen healthier than clubs with many homegrown players. According to the authors, many football clubs disclose a monetary valuation of their squad. This could be seen as a disappointment of the accounting framework. The study found that there was a positive relationship between IC disclosure and both size and performance. They also found that the ways of disclose IC varied a lot between different clubs. Shareef & Davey suggest that more specific guidelines should be developed to increase the level and quality of IC disclosure. Litschka et al. (2006) looks into managerial awareness of Intellectual capital, based on empirical evidence from Austria and found that it is still low but that intellectual assets can be measured and quantified, using e.g. the Plexus model. Translating non-financial information into financial is necessary to convince managers as well as the public of the usefulness of IC-related activities. Vergauwen et al. (2007) aim to examine the relationship between the level of IC disclosure and intangible value drivers, using content analysis. They investigated differences in disclosure based upon the level of IC divided into three IC categories namely; Human Capital, Structural Capital and Resource Capital. They also looked at whether firms with big IC have more disclosures. Companies are taken from Sweden, Denmark and the United Kingdom. The only hypothesis they could reject at their level of significance was that firms with a high level of Structural Capital have relatively more Structural Capital disclosures. Whiting & Miller (2008) investigate the relationship between IC disclosure and hidden value in 70 companies from New Zealand. The authors (Whiting & Miller, 2008, p. 36) state hidden value to be a flawed measure of IC since it is dependent on growth expectations. For this reason, they have included two measures of growth expectations, Price-to-Earnings (P/E) and IRG’s analyst’s recommendations (AR) in the study. Regression testing, taking the company’s growth expectations in account, showed an insignificant relationship between hidden value and voluntary IC disclosure, apart from revaluing firms, for which a positive correlation was found. Pandian (2011) argues in his work that the accounting techniques of today cannot account for intellectual capital and stated that the gap between firms’ market values and book values of equity were wider than ever before. We see that studies from the 2000s focus more on explaining the difference between market value and book value of equity by measuring IC disclosure, alternatively IC scores based upon proxies. More and more research identifies that current accounting cannot account for firms’ real value and see IC as a answer for these differences in value. Where early studies tried to find ways to account for IC, more recent studies have focused on the impact of IC disclosure.
26
3.3.3 Content Analyses Further down the road we decided to specify our research to IC disclosure in annual reports as opposed to e.g. the Balanced Scorecard or VAIC, which quantifies qualitative information in different ways through the design of the models. Instead we are moving in the tracks of the likes of Hackston & Milne, Guthrie & Petty and Vandemaele et al. who, through content analyses rank IC disclosure. From these articles we also furthermore zoomed in on a knowledge gap and our sought contribution, which turned out to be: is there a relationship between share price and IC disclosure in annual reports. We also gather information about content analysis and ad it helped us build our content analysis framework. Hackston & Milne (1996) study voluntary corporate social disclosure in the annual reports of New Zealand companies. The authors use content analysis, counting sentences. They found differences in disclosure related to size and industry. This is one of the first content analyses we found in this field of research and it is well cited among our other content analysis-based articles. Guthrie & Petty (2000) investigate the level of voluntary IC disclosure on Australia’s 20 largest companies. Australian GDP have, in a short period of time, turned away from domination by resource-based companies to more knowledge-based service companies. This development is shared with the rest of the ”first world countries” although in Australia the case is very clear. In 1980, the majority of the 20 largest companies in the country were resource-based (mining and petroleum included). In 1998 this number was down to only two. IC disclosure is measured using content analysis based upon a self-made framework with 24 attributes, divided into three IC categories, External Structure, Internal Structure and Human Capital (Employee competence), influenced by Sveiby’s (1997, p. 10-11) categorization. The findings show that the Australian sample companies had, at this time, with one exception, not developed standardized frameworks for IC reporting and the level of IC disclosure were low. When IC was disclosed it was usually expressed in a non-financial way. Olsson (2001) compares two empirical studies by Schriwer & Thynell and Blomqvist & Nilsson, conducted in 1995 and 1999 respectively, based on content analysis. The first, of voluntary IC disclosure in annual reports of 18 Swedish A-list firms in 1990 and 1994 and the second, a comparative study of companies from Sweden, Germany and the United Kingdom in the annual reports of 1998. Findings indicate that IC disclosure in Swedish companies had increased between 1990 and 1994 but somewhat remained unchanged between 1994 and 1998. The comparative study puts Swedish companies’ IC disclosure second to their German neighbors but ahead of the British. We have not been able to find the two mentioned studies and our information regarding them comes completely from Olsson (2001). It is however evident that both are the works of students, under the supervision of Olsson (Olsson, 2001, p. 44). We think that relevant information regarding the educational levels of the students are omitted and threatens the reliability of this study. As said by Bryman & Bell (2005, p. 43) it is important to reflect upon how ones’

27
background can affect the research outcome, something that we think has not been done to an adequate extent. Brennan (2001) conducts a content analysis of voluntary IC disclosure in the annual reports of eleven Irish knowledge-intensive companies. The author stated the overall level of disclosure to be low. The author also compared the price-to-book ratios of the selected companies. Two of eleven selected companies had a P/B < 1 while for the rest, Price exceeded Book with between 53 and 93 %. Bontis (2003) investigated the annual reports of Canadian companies using content analysis and found that the level of disclosure was low while Scandinavian companies drove the development. The author executed his content analysis using an electronic word search. Bozzolan et al. (2003) investigate voluntary IC disclosure in Italian listed companies’ annual reports from 2001. It replicates Guthrie and Petty’s (2000) study on Australian listed companies, using the same content analysis framework but it also includes a regression test having IC disclosure amount as a function of industry and size. The authors find that the average number of disclosed items is 51. A high number, compared to studies in other countries. Regression shows that company size and industry affect the level of voluntary IC disclosure. Vandemaele et al. (2005) analyze 180 annual reports during the time period 1998 to 2002 from the Netherlands, the United Kingdom and from Sweden using content analysis and looking for voluntary IC disclosure. They used three measurement years 1998, 2000 and 2002. Swedish companies disclosed the most, followed by the Netherlands and in third place, the United Kingdom. The study shows an upward trend in the amount of disclosure, with the exception of Sweden between the years of 2000 and 2002 were it actually decreased – something that, according to the authors could be viewed as a sign of convergence of disclosure between companies in the sample countries. In this field of research, the use of content analyses escalated after works of the likes of Hackston & Milne (1996) and Guthrie & Petty (2000). Some of the content analysis frameworks of today are still built upon Guthrie & Petty (2000), which in turn are influenced by Edvinsson (1997) and Sveiby (1997) but new frameworks have also been made. These helped us build our own framework for this study. Also, we saw how they conducted their studies and therefore and assured ourselves that our approach were suitable, based upon the outcome of previous research.
3.3.4 Statistical Methodology In order for us to be able to conduct a regression analysis we looked for studies that had done just that and also, studies that were investigating similar subjects. Wang (2008) and Ferraro & Veltri (2011) fit this description. In both of the studies they use proxies taken from the income statement or the balance sheet to measure IC. We will in our study switch these proxies to our IC disclosure index but use the same regression model. The second thing we came into contact with in these articles was the Ohlson Model (OM), which was used in both articles to analyze the relationship between IC and price on stocks. Another
28
article that was important in our statistical analysis was Barth & Clinch (2009). It helped us decide to use earnings and book value on per share basis to remove size effects. Wang (2008) aims to measure the relationship between IC and market value of US electronic firms during the time period 1996 – 2005. To measure IC they use proxies like net income/employees and sales/employees. They found that book value; net income and total assets could explain 47.1 % of the stock price. The remaining 52.9 % have to be explained by other variables. The overall conclusions are that there is a significant relationship between IC and the market value of US electronic firms. They are using a simplified version of the OM were the abnormal earnings have been switched to net income and all variables are on a per share basis. In this model the IC-indexes are used as other information that could affect the price. Barth & Clinch (2009) investigate the impacts of five potential scale-related effects; multiplicative and additive, omitted scale factors, scale-varying coefficients, survivorship, and heteroscedasticity. The research is conducted using data simulated using a modified version of the Ohlson Model. Barth & Clinch (2009) look at six specifications of regressions of equity market value on equity book value and earnings: undeflated, share-deflated, equity book value-deflated, lagged price-deflated, returns, and equity market value-deflated. They find that share-deflated and un-deflated specifications generally are the best for all types of scale effects. This led us to use share-deflated specifications. Ferraro & Veltri (2011) investigate the value relevance of IC of Italian listed firms using proxies for IC and its subcategories. The sample is 524 firm years of companies listed on the Milan Stock Exchange, financial sector excluded, between 2006 and 2008 and they are using regression analysis to determine the value relevance. It is one of their regression equations, Eq 2 in this paper, which is of great interest for us (p. 74). This equation is build upon a simplified Ohlson model. Although we have different ways of measuring IC, content analysis versus proxies, we believe that their regression equation is useful. They find that BVPS and EPS are affecting the share price of Italian companies but for IC and its subcategories they do not come to this conclusion. This could according to the authors have many possible reasons, namely (p. 79):
1. The inadequacy of the accounting proxies selected to identify the IC subcategories 2. The imperfect functioning of the Italian market 3. The low degree of investor awareness, e.g., inability to ‘read’ the accounting
information from an IC perspective. Finally, the authors’ suggestions for future research are to expand it to other parts of the world and to use more relevant proxies. They state that if the accounting normative would require the disclosure of IC in their financial statements, it would enable researchers to use a huge and standardized data set and also and in a more effective way investigate and analyze how investors value IC (Ferraro & Veltri, 2011, p. 79). Ferraro & Veltri are using a similar model to Wang (2008) but they use different IC-proxies as ‘other information’.
29
3.4 Our Study Taking previous research into consideration we see that many studies have investigated the level of voluntary IC disclosure in annual reports using content analysis (Guthrie & Petty, 2000; Olsson, 2001; Brennan, 2001; Bontis, 2003; Bozzolan et al., 2003; Abdolmohammadi, 2005; Vandemaele et al., 2005; Vergauwen et al., 2007; Whiting & Miller, 2008). Most of the studies have merely measured disclosure without investigating the impacts that the disclosure has. However some research (Abdolmohammadi 2005; Whiting & Miller, 2008) has covered our point of interest more specifically: that being, the relationship between IC disclosure and price. We believe more research is needed since they are based on companies in the USA and New Zealand respectively. Usually, the research is also covering one or a few years. We will cover nine and therefore include well more than a macro-economic cycle. Apart from investigating the relationship between price and IC disclosure, our study will investigate the development of IC disclosure in annual reports in Sweden between 2001 and 2010. Vandemaele et al. (2005, p. 423) see a slight decrease in disclosure between 2000 and 2002 and it is interesting for us to see if we see the same trend and also if that trend continues or if IC disclosure starts to increase once again. We look to test the following hypotheses. H1: There is no correlation between IC disclosure and price This hypothesis will be tested using linear regression with price as the dependent variable and Earnings Per Share (EPS), Book Value Per Share (BVPS), and Intellectual Capital (IC) as independent variables. The reason that we use share deflated measures (BVPS, EPS, Share Price) is due to the fact that it is, according to Barth & Clinch (2009) a way of mitigating so called heteroscedasticity and it is used in Ferraro & Veltri (2011), who use a simplified version of the Ohlson Model. If there is a correlation between IC disclosure and price, we see that disclosing more information to investors and other stakeholders has an effect on the pricing of the share. In that case Akerlof’s (1970) theories regarding information asymmetry can explain the stock market and by shrinking the information gap the investors can, with lower risk, estimate the fair value of the company. This should increase the prices on good investments since shareholders are willing to pay more for subsequent stock returns if the risk decrease. H2: There is no correlation between Human Capital and price H3: There is no correlation between Internal Capital and price H4: There is no correlation between and External Capital and price H2, H3 and H4 are also tested through linear regression with price as the dependent variable and EPS and BVPS but instead of total IC, the three subcategories Human Capital (HumCap), Internal Capital (IntCap) and External Capital (ExtCap) are used. This will provide interesting information about differences between IC categories. Regression testing using disclosure scores for IC subcategories are also used in previous research such as Whiting & Miller, 2008; Ferraro & Veltri (2011); Wang (2008). The latter two used proxies to measure IC instead of number of disclosures.
30
H5: There is no difference in significance between knowledge-intensive and capital-
intensive companies in our regressions. Here we will test if there are any differences in significance in the model between knowledge-intensive and capital-intensive firms. We will look at the two groups on a subcategory basis of IC to see if the price is correlated in any different way between the two groups. H6: There is no difference in IC disclosure between knowledge-intensive and capital-
intensive companies. We want to measure if there is a difference in disclosure between knowledge-intensive and capital-intensive companies and we will check this by looking at the mean number of disclosures for the two groups of companies, over the sample period of 2001 to 2010. Pulic (2000, p. 703) state “the once significant resources have become less important from the standpoint of modern business since knowledge is acknowledged as the basic resource.” With this in mind we argue that modern companies acknowledge knowledge as the basic resource but what about older companies, present in mature markets characterized by capital-intensive structures such as oil and mining? H7: IC disclosure has not increased during the researched time period. With our final hypothesis we look to see how IC disclosure have developed during our sample period of 2001 to 2010. Furthermore, with background of Vandemaele et al’s (2005, p. 423) study that saw a decrease in disclosure in Sweden between 2000 and 2002, we also want to see if our study supports or contradicts their findings and investigate the development after 2002. Vandemaele et al. (2005, p. 417) interpreted this as a possible sign of convergence of IC disclosure between their sample countries, which were Sweden, Netherlands and the UK. This was due to the fact that IC in the latter two countries closed in on Sweden’s between 2000 and 2002. Our aim is that our study could work as a point of reference for future research in other countries, on this particular subject: IC disclosure development over time.

31
4 Practical methodology
4.1 Research technique We are going to measure IC disclosure using content analysis on annual reports of the OMXS30 companies. Our framework is based upon previous ones from recent research (Guthrie & Petty, 2000; Brennan, 2001; Bozzolan et al., 2003; Abdolmohammadi, 2005) The IC disclosure in annual reports measured using this content analysis will then be tested using a regression model to determine to what extent, if any, this disclosure can explain the price of the stock. The method is dependent on a framework and one of the strongest limitations of this method is the subjectivity in coding but we will present our coding process and motivate our choices in order to keep the subjectivity as low as possible. Furthermore, we base our framework on those of previous research in order to make our findings more comparable and also because these frameworks are fairly accepted. Content analysis is defined by Krippendorff (2004, p. 18) as: “... a research technique for making replicable and valid inferences from texts (or other meaningful matter) to the contexts of their use.” It is a widely used method when measuring IC disclosure (Guthrie, 2004, p. 283) According to Krippendorff there are two reasons for why content analysis should start with a research question, ideally before the data collection, and these two are: efficiency and empirical grounding. The research question grounds the research empirically and it should also save time because the researcher knows what to look for in the text (Krippendorff, 2004, p. 32). With, among other things, Krippendorff’s two stated reasons for why content analysis should start with a research question, it is natural for us to do just that. We also take the characteristics, according to Krippendorff (2004, pp. 32-33) in to account when designing ours. The characteristics of content analysis research questions are stated as:
• They are believed to be answerable (abductively inferable) by examinations of a body of texts
• They delineate a set of possible (hypothetical) answers among which analysts select • They concern currently inaccessible phenomena • They allow for (in) validation - at least in principle - by acknowledging another way
to observe or substantiate the occurrence of the inferred phenomena
4.2 Content Analysis Framework We are going to conduct an electronic search for specific keywords, influenced by previous research some examples are Guthrie & Petty (2000), Brennan, Bontis (2003) and Abdolmohammadi (2005). Further we will interpret the context of every search hit to make sure that it is used in the way we intend the keyword to be. Beattie & Thomson (2007, p. 140) state that a keyword specific search cannot detect IC disclosures expressed in company-specific terms. They take ‘company names’ as an example: searching for that will not identify specific company names like Microsoft or Apple. Further, it is said that using an Intellectual Capital Thesaurus as framework may curb the downsides of conducting an
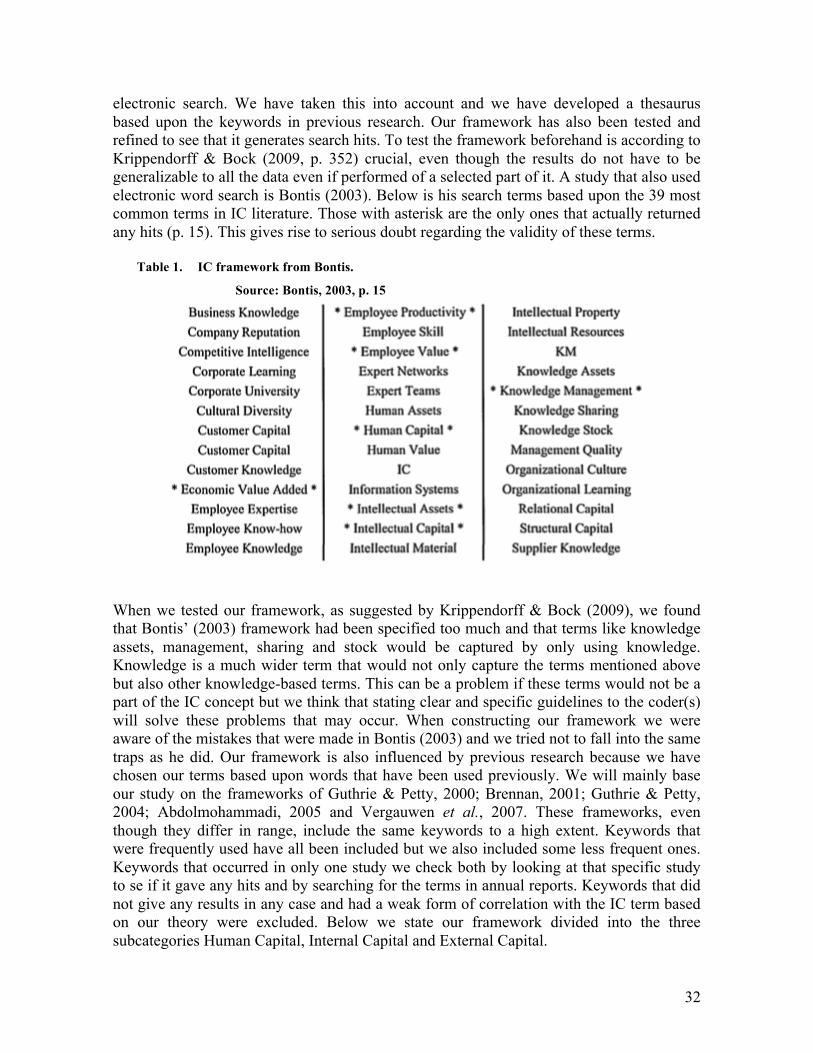
32
electronic search. We have taken this into account and we have developed a thesaurus based upon the keywords in previous research. Our framework has also been tested and refined to see that it generates search hits. To test the framework beforehand is according to Krippendorff & Bock (2009, p. 352) crucial, even though the results do not have to be generalizable to all the data even if performed of a selected part of it. A study that also used electronic word search is Bontis (2003). Below is his search terms based upon the 39 most common terms in IC literature. Those with asterisk are the only ones that actually returned any hits (p. 15). This gives rise to serious doubt regarding the validity of these terms.
Table 1. IC framework from Bontis.
Source: Bontis, 2003, p. 15
When we tested our framework, as suggested by Krippendorff & Bock (2009), we found that Bontis’ (2003) framework had been specified too much and that terms like knowledge assets, management, sharing and stock would be captured by only using knowledge. Knowledge is a much wider term that would not only capture the terms mentioned above but also other knowledge-based terms. This can be a problem if these terms would not be a part of the IC concept but we think that stating clear and specific guidelines to the coder(s) will solve these problems that may occur. When constructing our framework we were aware of the mistakes that were made in Bontis (2003) and we tried not to fall into the same traps as he did. Our framework is also influenced by previous research because we have chosen our terms based upon words that have been used previously. We will mainly base our study on the frameworks of Guthrie & Petty, 2000; Brennan, 2001; Guthrie & Petty, 2004; Abdolmohammadi, 2005 and Vergauwen et al., 2007. These frameworks, even though they differ in range, include the same keywords to a high extent. Keywords that were frequently used have all been included but we also included some less frequent ones. Keywords that occurred in only one study we check both by looking at that specific study to se if it gave any hits and by searching for the terms in annual reports. Keywords that did not give any results in any case and had a weak form of correlation with the IC term based on our theory were excluded. Below we state our framework divided into the three subcategories Human Capital, Internal Capital and External Capital.
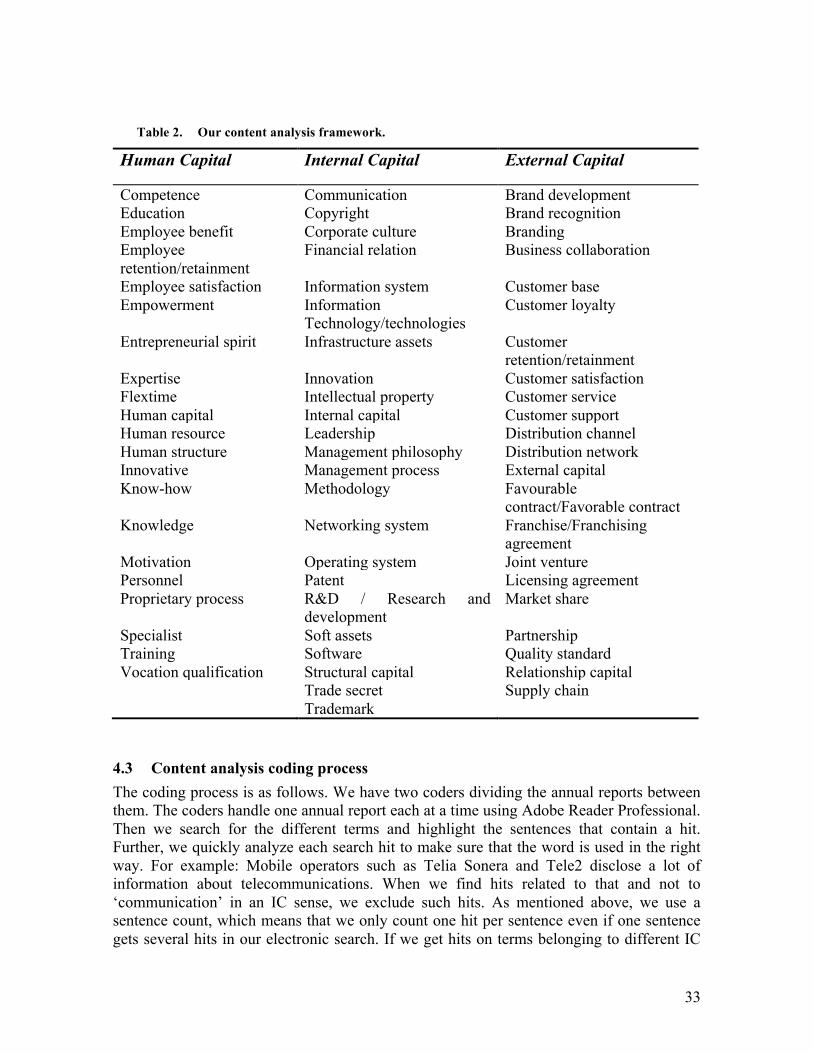
33
Table 2. Our content analysis framework.
Human Capital Internal Capital External Capital
Competence Communication Brand development Education Copyright Brand recognition Employee benefit Corporate culture Branding Employee retention/retainment
Financial relation Business collaboration
Employee satisfaction Information system Customer base Empowerment Information
Technology/technologies Customer loyalty
Entrepreneurial spirit Infrastructure assets Customer retention/retainment
Expertise Innovation Customer satisfaction Flextime Intellectual property Customer service Human capital Internal capital Customer support Human resource Leadership Distribution channel Human structure Management philosophy Distribution network Innovative Management process External capital Know-how Methodology Favourable
contract/Favorable contract Knowledge Networking system Franchise/Franchising
agreement Motivation Operating system Joint venture Personnel Patent Licensing agreement Proprietary process R&D / Research and
development Market share
Specialist Soft assets Partnership Training Software Quality standard Vocation qualification Structural capital Relationship capital Trade secret Supply chain Trademark
4.3 Content analysis coding process The coding process is as follows. We have two coders dividing the annual reports between them. The coders handle one annual report each at a time using Adobe Reader Professional. Then we search for the different terms and highlight the sentences that contain a hit. Further, we quickly analyze each search hit to make sure that the word is used in the right way. For example: Mobile operators such as Telia Sonera and Tele2 disclose a lot of information about telecommunications. When we find hits related to that and not to ‘communication’ in an IC sense, we exclude such hits. As mentioned above, we use a sentence count, which means that we only count one hit per sentence even if one sentence gets several hits in our electronic search. If we get hits on terms belonging to different IC

34
categories, we try to determine which term is most fundamental. If two terms from the same category are present in one sentence, we simply acknowledge the first of them. This may bias the distribution within but not between categories. We include hits in the whole annual report with some exceptions. The audit report, table of contents, personal names and other personal information, company names, cover pages, income statement, balance sheet and cash flow statement are all excluded. Although we mainly count sentences there are a few exceptions. For headlines, footnotes and bulleted lists we highlight the whole headline, the footnote in question and the particular item in the bulleted list. To minimize human errors in the word counting we record every hit instantly and paste the search terms into the search field. The latter means that we are positive that no search term during the data collection is misspelled. As mentioned earlier, most of the previous research in this field has measured voluntary IC disclosure but due to limitations in time associated with this degree project we have chosen to measure all disclosures, if not for some other reason excluded in this section. We do not see this as a problem considering we are consistent.
4.4 Sample Nasdaq OMX Group Inc. is today the world’s biggest exchange company. They deliver services in trading, exchange technology but also various types of services to public listed companies. They are represented in six continents and have over 3.500 listed companies. The Nasdaq OMX Nordic is the combined name for the exchanges in Helsinki, Copenhagen, Stockholm, Iceland, Tallinn, Riga and Vilnius. (Nasdaq OMX Nordic, 2012) The OMXS30 or OMX Stockholm 30 index, which is its full name, is the index over the 30 most frequently traded stocks on the Stockholm Stock Exchange. The index is revised two times a year (Nasdaq OMX Nordic, 2012). In our study we will include the firms which stocks were included in the OMXS30 index during the end of the observed year. According to Bryman & Bell (2005, pp. 109-110) it is usually too time consuming, if possible at all, to investigate the whole population and researchers therefore use samples. The aim is to get a sample that, as much as possible, represents the population. The sample size is the annual reports of the companies in the OMXS30 index as of the ends of 2001, 2004, 2007 and 2010. This means that we will investigate the annual reports every third during the time span of 2001-2010. The OMXS30 index is updated twice a year and we are going to investigate the annual reports of those companies that were part of the index at the closing of the researched years. Because this study is limited to the spring semester of 2012, we had to assure that the chosen sample was possible to gather and analyze within this time frame. Early in the planning phase, we tested the time it took to check one annual report for items from a preliminary content analysis framework. This left us with the conclusion that the data gathering would not be that time-consuming per each researched year and it enabled us to examine four different years covering a nine-year time span. There is no definite answer to how big a certain sample should be in order to be representable. With our 30 per year and four observation years we have a total of 120 observations. The biggest sample size we have come across is that of Abdolmohammadi
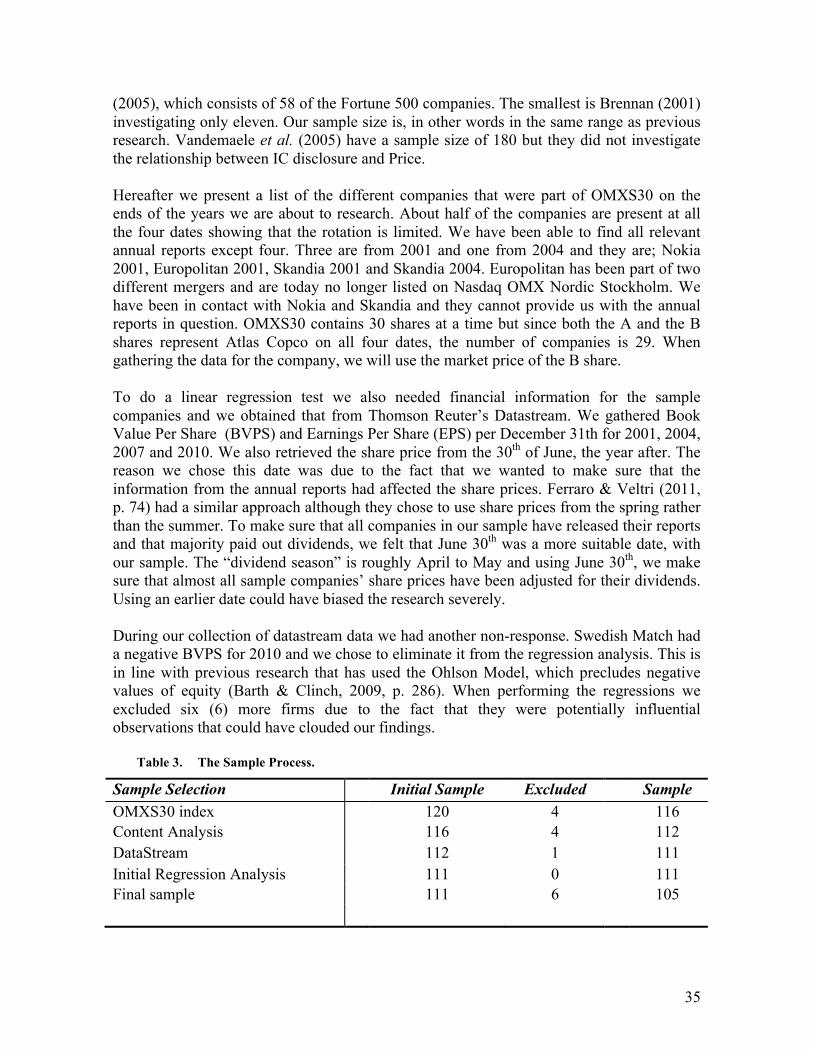
35
(2005), which consists of 58 of the Fortune 500 companies. The smallest is Brennan (2001) investigating only eleven. Our sample size is, in other words in the same range as previous research. Vandemaele et al. (2005) have a sample size of 180 but they did not investigate the relationship between IC disclosure and Price. Hereafter we present a list of the different companies that were part of OMXS30 on the ends of the years we are about to research. About half of the companies are present at all the four dates showing that the rotation is limited. We have been able to find all relevant annual reports except four. Three are from 2001 and one from 2004 and they are; Nokia 2001, Europolitan 2001, Skandia 2001 and Skandia 2004. Europolitan has been part of two different mergers and are today no longer listed on Nasdaq OMX Nordic Stockholm. We have been in contact with Nokia and Skandia and they cannot provide us with the annual reports in question. OMXS30 contains 30 shares at a time but since both the A and the B shares represent Atlas Copco on all four dates, the number of companies is 29. When gathering the data for the company, we will use the market price of the B share. To do a linear regression test we also needed financial information for the sample companies and we obtained that from Thomson Reuter’s Datastream. We gathered Book Value Per Share (BVPS) and Earnings Per Share (EPS) per December 31th for 2001, 2004, 2007 and 2010. We also retrieved the share price from the 30th of June, the year after. The reason we chose this date was due to the fact that we wanted to make sure that the information from the annual reports had affected the share prices. Ferraro & Veltri (2011, p. 74) had a similar approach although they chose to use share prices from the spring rather than the summer. To make sure that all companies in our sample have released their reports and that majority paid out dividends, we felt that June 30th was a more suitable date, with our sample. The “dividend season” is roughly April to May and using June 30th, we make sure that almost all sample companies’ share prices have been adjusted for their dividends. Using an earlier date could have biased the research severely. During our collection of datastream data we had another non-response. Swedish Match had a negative BVPS for 2010 and we chose to eliminate it from the regression analysis. This is in line with previous research that has used the Ohlson Model, which precludes negative values of equity (Barth & Clinch, 2009, p. 286). When performing the regressions we excluded six (6) more firms due to the fact that they were potentially influential observations that could have clouded our findings.
Table 3. The Sample Process.
Sample Selection Initial Sample Excluded Sample OMXS30 index 120 4 116 Content Analysis 116 4 112 DataStream 112 1 111 Initial Regression Analysis 111 0 111 Final sample 111 6 105
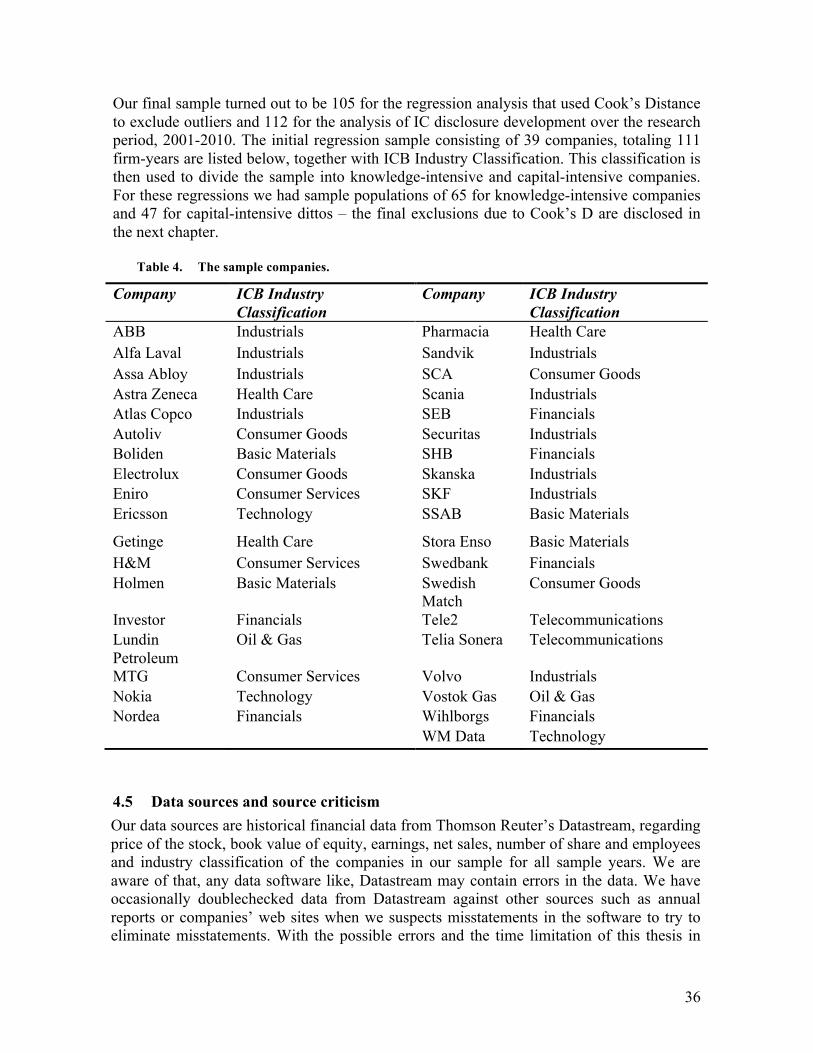
36
Our final sample turned out to be 105 for the regression analysis that used Cook’s Distance to exclude outliers and 112 for the analysis of IC disclosure development over the research period, 2001-2010. The initial regression sample consisting of 39 companies, totaling 111 firm-years are listed below, together with ICB Industry Classification. This classification is then used to divide the sample into knowledge-intensive and capital-intensive companies. For these regressions we had sample populations of 65 for knowledge-intensive companies and 47 for capital-intensive dittos – the final exclusions due to Cook’s D are disclosed in the next chapter.
Table 4. The sample companies.
Company ICB Industry Classification
Company ICB Industry Classification
ABB Industrials Pharmacia Health Care Alfa Laval Industrials Sandvik Industrials Assa Abloy Industrials SCA Consumer Goods Astra Zeneca Health Care Scania Industrials Atlas Copco Industrials SEB Financials Autoliv Consumer Goods Securitas Industrials Boliden Basic Materials SHB Financials Electrolux Consumer Goods Skanska Industrials Eniro Consumer Services SKF Industrials Ericsson Technology SSAB Basic Materials
Getinge Health Care Stora Enso Basic Materials H&M Consumer Services Swedbank Financials Holmen Basic Materials Swedish
Match Consumer Goods
Investor Financials Tele2 Telecommunications Lundin Petroleum
Oil & Gas Telia Sonera Telecommunications
MTG Consumer Services Volvo Industrials Nokia Technology Vostok Gas Oil & Gas Nordea Financials Wihlborgs Financials WM Data Technology
4.5 Data sources and source criticism Our data sources are historical financial data from Thomson Reuter’s Datastream, regarding price of the stock, book value of equity, earnings, net sales, number of share and employees and industry classification of the companies in our sample for all sample years. We are aware of that, any data software like, Datastream may contain errors in the data. We have occasionally doublechecked data from Datastream against other sources such as annual reports or companies’ web sites when we suspects misstatements in the software to try to eliminate misstatements. With the possible errors and the time limitation of this thesis in
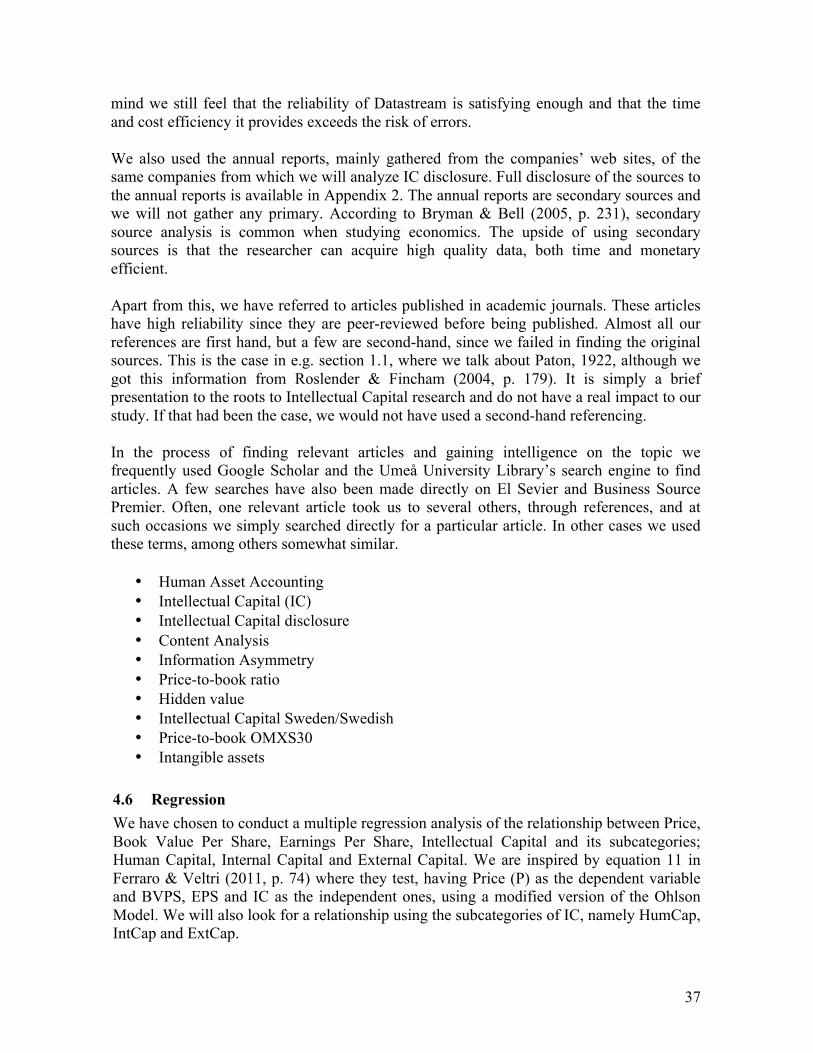
37
mind we still feel that the reliability of Datastream is satisfying enough and that the time and cost efficiency it provides exceeds the risk of errors. We also used the annual reports, mainly gathered from the companies’ web sites, of the same companies from which we will analyze IC disclosure. Full disclosure of the sources to the annual reports is available in Appendix 2. The annual reports are secondary sources and we will not gather any primary. According to Bryman & Bell (2005, p. 231), secondary source analysis is common when studying economics. The upside of using secondary sources is that the researcher can acquire high quality data, both time and monetary efficient. Apart from this, we have referred to articles published in academic journals. These articles have high reliability since they are peer-reviewed before being published. Almost all our references are first hand, but a few are second-hand, since we failed in finding the original sources. This is the case in e.g. section 1.1, where we talk about Paton, 1922, although we got this information from Roslender & Fincham (2004, p. 179). It is simply a brief presentation to the roots to Intellectual Capital research and do not have a real impact to our study. If that had been the case, we would not have used a second-hand referencing. In the process of finding relevant articles and gaining intelligence on the topic we frequently used Google Scholar and the Umeå University Library’s search engine to find articles. A few searches have also been made directly on El Sevier and Business Source Premier. Often, one relevant article took us to several others, through references, and at such occasions we simply searched directly for a particular article. In other cases we used these terms, among others somewhat similar.
• Human Asset Accounting • Intellectual Capital (IC) • Intellectual Capital disclosure • Content Analysis • Information Asymmetry • Price-to-book ratio • Hidden value • Intellectual Capital Sweden/Swedish • Price-to-book OMXS30 • Intangible assets
4.6 Regression We have chosen to conduct a multiple regression analysis of the relationship between Price, Book Value Per Share, Earnings Per Share, Intellectual Capital and its subcategories; Human Capital, Internal Capital and External Capital. We are inspired by equation 11 in Ferraro & Veltri (2011, p. 74) where they test, having Price (P) as the dependent variable and BVPS, EPS and IC as the independent ones, using a modified version of the Ohlson Model. We will also look for a relationship using the subcategories of IC, namely HumCap, IntCap and ExtCap.
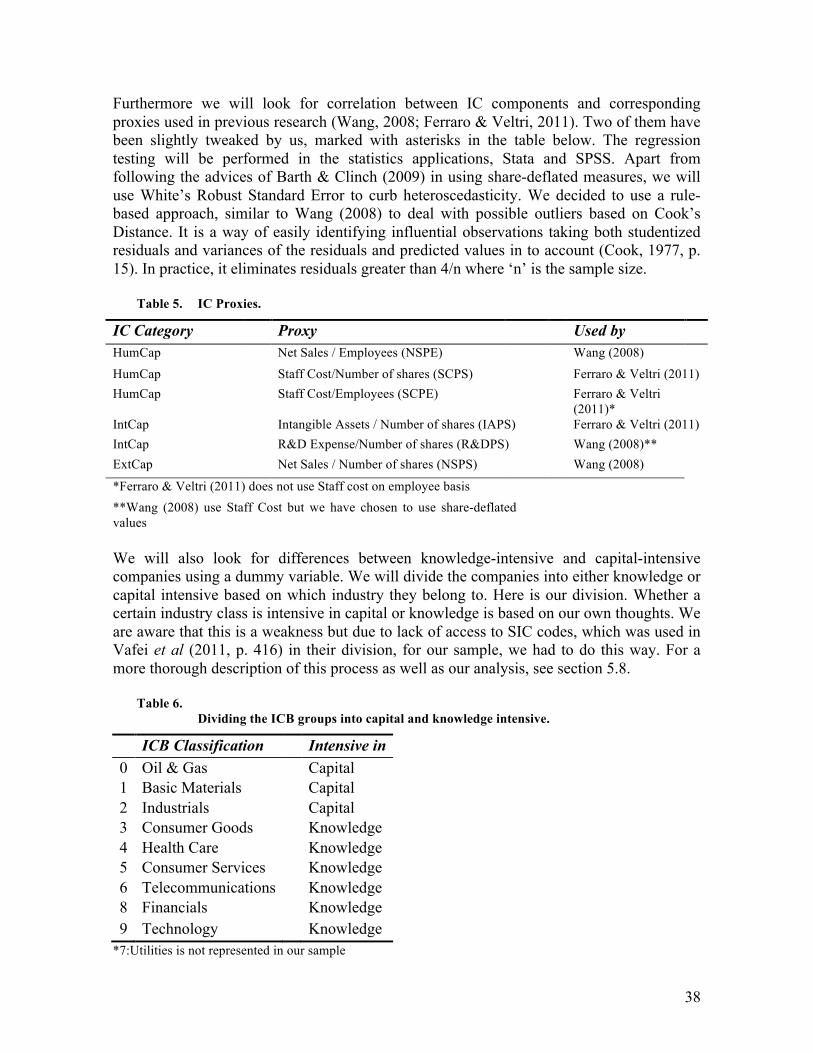
38
Furthermore we will look for correlation between IC components and corresponding proxies used in previous research (Wang, 2008; Ferraro & Veltri, 2011). Two of them have been slightly tweaked by us, marked with asterisks in the table below. The regression testing will be performed in the statistics applications, Stata and SPSS. Apart from following the advices of Barth & Clinch (2009) in using share-deflated measures, we will use White’s Robust Standard Error to curb heteroscedasticity. We decided to use a rule-based approach, similar to Wang (2008) to deal with possible outliers based on Cook’s Distance. It is a way of easily identifying influential observations taking both studentized residuals and variances of the residuals and predicted values in to account (Cook, 1977, p. 15). In practice, it eliminates residuals greater than 4/n where ‘n’ is the sample size.
Table 5. IC Proxies.
IC Category Proxy Used by HumCap Net Sales / Employees (NSPE) Wang (2008) HumCap Staff Cost/Number of shares (SCPS) Ferraro & Veltri (2011) HumCap Staff Cost/Employees (SCPE) Ferraro & Veltri
(2011)* IntCap Intangible Assets / Number of shares (IAPS) Ferraro & Veltri (2011) IntCap R&D Expense/Number of shares (R&DPS) Wang (2008)** ExtCap Net Sales / Number of shares (NSPS) Wang (2008) *Ferraro & Veltri (2011) does not use Staff cost on employee basis **Wang (2008) use Staff Cost but we have chosen to use share-deflated values We will also look for differences between knowledge-intensive and capital-intensive companies using a dummy variable. We will divide the companies into either knowledge or capital intensive based on which industry they belong to. Here is our division. Whether a certain industry class is intensive in capital or knowledge is based on our own thoughts. We are aware that this is a weakness but due to lack of access to SIC codes, which was used in Vafei et al (2011, p. 416) in their division, for our sample, we had to do this way. For a more thorough description of this process as well as our analysis, see section 5.8.
Table 6. Dividing the ICB groups into capital and knowledge intensive.
ICB Classification Intensive in 0 Oil & Gas Capital 1 Basic Materials Capital 2 Industrials Capital 3 Consumer Goods Knowledge 4 Health Care Knowledge 5 Consumer Services Knowledge 6 Telecommunications Knowledge 8 Financials Knowledge 9 Technology Knowledge
*7:Utilities is not represented in our sample
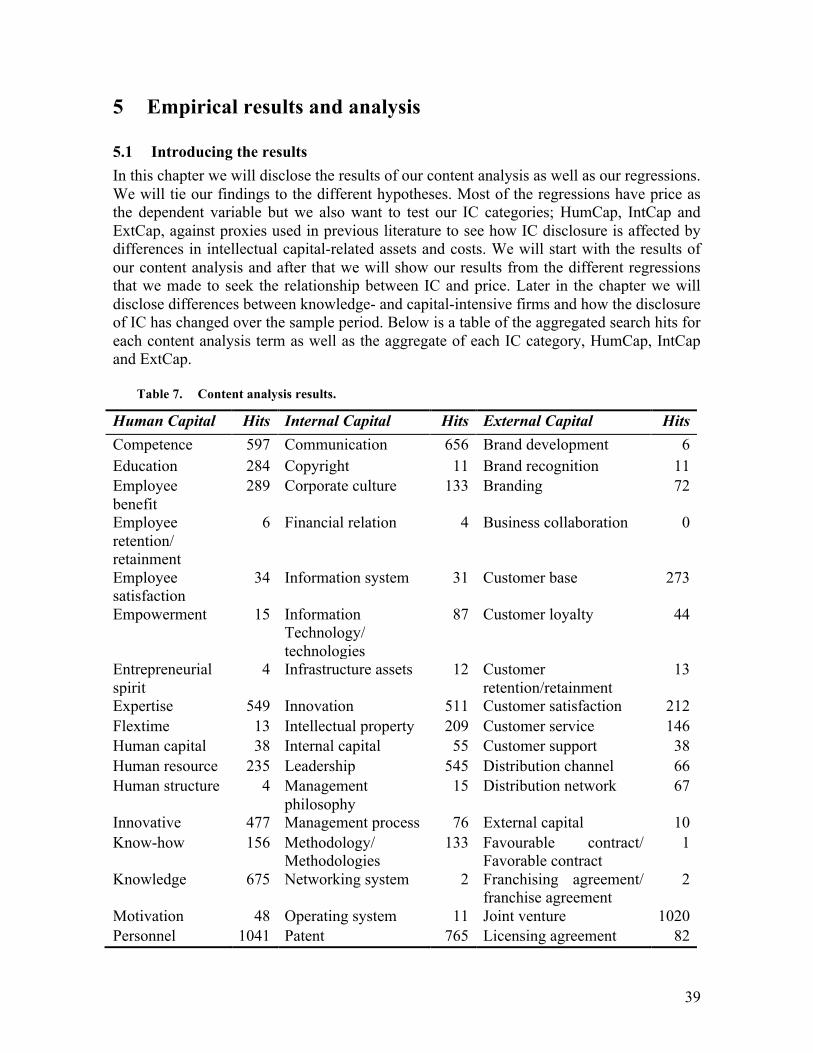
39
5 Empirical results and analysis
5.1 Introducing the results In this chapter we will disclose the results of our content analysis as well as our regressions. We will tie our findings to the different hypotheses. Most of the regressions have price as the dependent variable but we also want to test our IC categories; HumCap, IntCap and ExtCap, against proxies used in previous literature to see how IC disclosure is affected by differences in intellectual capital-related assets and costs. We will start with the results of our content analysis and after that we will show our results from the different regressions that we made to seek the relationship between IC and price. Later in the chapter we will disclose differences between knowledge- and capital-intensive firms and how the disclosure of IC has changed over the sample period. Below is a table of the aggregated search hits for each content analysis term as well as the aggregate of each IC category, HumCap, IntCap and ExtCap.
Table 7. Content analysis results.
Human Capital Hits Internal Capital Hits External Capital Hits Competence 597 Communication 656 Brand development 6 Education 284 Copyright 11 Brand recognition 11 Employee benefit
289 Corporate culture 133 Branding 72
Employee retention/ retainment
6 Financial relation 4 Business collaboration 0
Employee satisfaction
34 Information system 31 Customer base 273
Empowerment 15 Information Technology/ technologies
87 Customer loyalty 44
Entrepreneurial spirit
4 Infrastructure assets 12 Customer retention/retainment
13
Expertise 549 Innovation 511 Customer satisfaction 212 Flextime 13 Intellectual property 209 Customer service 146 Human capital 38 Internal capital 55 Customer support 38 Human resource 235 Leadership 545 Distribution channel 66 Human structure 4 Management
philosophy 15 Distribution network 67
Innovative 477 Management process 76 External capital 10 Know-how 156 Methodology/
Methodologies 133 Favourable contract/
Favorable contract 1
Knowledge 675 Networking system 2 Franchising agreement/ franchise agreement
2
Motivation 48 Operating system 11 Joint venture 1020 Personnel 1041 Patent 765 Licensing agreement 82

40
Proprietary process
0 R&D / Research and development
1231 Market share 1040
Specialist 267 Soft assets 19 Partnership 400 Training 866 Software 455 Quality standard 46 Vocation qualification
0 Structural capital 9 Relationship capital 2
Total 5598 Trade secret 13 Supply chain 184 Trademark 274 Total 3735 Total 5257 In table 8, can see that the total number of hits in our content analysis were 14 590. Human Capital is the most frequently used category with Internal Capital as a close second. External Capital is the category that is least frequently used. It seems like Human Capital is the genre of IC that management puts most interest in. This is maybe the most common category when talking about IC overall. It is not uncommon to hear managers say phrases like “our personnel is our greatest asset” or “our personnel possesses a great amount of know-how”. The top ten (10) respectively bottom ten (10) keywords in terms of hits are shown below. The mean number of hits per category was 231.52, or roughly 232. A high value but it is mainly due to the great impact of the top ten categories, which contribute with 57.8 % of the total hits. One could argue that some of the used keywords should not have been in the framework and in the light of these findings it is possible to refine it for future research but for the most part, we feel that the terms returned enough hits to motivate them being part of the framework. What it all comes down to is if there is a relationship between the results from our content analysis and the price of the shares within the sample – more about that later in this chapter.
Table 8. Top/Bottom 10 hits.
Top 10 Hits Bottom 10 Hits R&D / Research and development
1231 Vocation qualification 0
Personnel 1041 Business collaboration 0 Market share 1040 Proprietary process 0 Joint venture 1020 Favourable contract/ Favorable
contract 1
Training 866 Franchising agreement/ franchise agreement
2
Patent 765 Networking system 2 Knowledge 675 Relationship capital 2 Communication 656 Financial relation 4 Competence 597 Human structure 4 Expertise 549 Entrepreneurial spirit 4

41
By looking at table 9, one can see that R&D, Personnel, Market Share and Joint venture are terms that management puts a lot of interest with a total of 4 332 hits while Vocation Qualification, Business Collaboration and Proprietary Process are terms that are not present in our sample with zero (0) hits. These results are in line with the pre-thoughts of the authors. Research and development is by far the most commonly used term in our sample, with 190 hits more than the ‘Personnel’. The importance of R&D capital has earlier been concluded by Lev & Sougiannis (1996; 1999) and we see that firms choose to disclose R&D related information more frequently than other IC terms. In Abdolmohammadi (2005), ‘R&D’ is one of the least frequently disclosed categories but it is understandable since it is consisting of a stand-alone search-term while the others have ranged from two (2) to eleven (11). ‘Personnel’ is the second least disclosed category although it contains seven (7) search-terms. This is somewhat surprising and it contradicts our findings. Previous research has stated that Sweden is in the lead when it comes to IC disclosure. This can explain the higher disclosures. One should have in mind that Abdolmohammadi (2005) and most of the other research in this field has limited their content analyses to voluntary disclosure. If a relatively higher percentage of the personnel disclosures than the others, are mandatory it can explain the difference in rank between our study and Abdolmohammadi’s (2005). Furthermore Abdolmohammadi (2005) looks at companies that present their financial statements under US GAAP while our companies, in general, use IFRS. The most disclosed category in Abdolmohammadi (2005) is ‘brand’, spanning five search-terms; brand, brand recognition, brand development, goodwill and trademark (pp. 399-400). Our corresponding terms are brand recognition, brand development and branding but those did not generate more than an aggregate of 89 hits, divided eleven (11), six (6) and 72 respectively. Chen et al. (2005, p. 159) state that there is a positive relationship between R&D expenditure and firm value, as well as profitability. R&D disclosures should therefore decrease the information asymmetry and increase the price of the share. We will not test if R&D alone can explain share price but if the category it is a part of, IntCap, can.
Figure 8. Subcategories’ share of total disclosure.
IntCap 36%
HumCap 38%
ExtCap 26%
IC disclosure
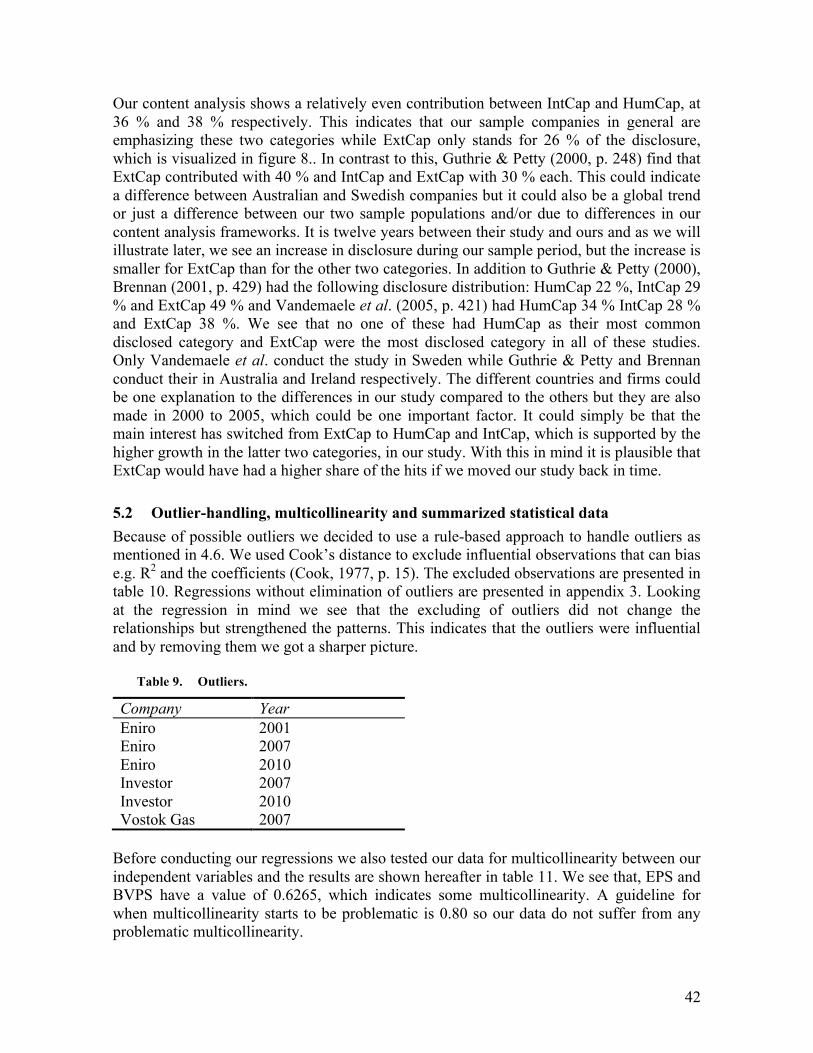
42
Our content analysis shows a relatively even contribution between IntCap and HumCap, at 36 % and 38 % respectively. This indicates that our sample companies in general are emphasizing these two categories while ExtCap only stands for 26 % of the disclosure, which is visualized in figure 8.. In contrast to this, Guthrie & Petty (2000, p. 248) find that ExtCap contributed with 40 % and IntCap and ExtCap with 30 % each. This could indicate a difference between Australian and Swedish companies but it could also be a global trend or just a difference between our two sample populations and/or due to differences in our content analysis frameworks. It is twelve years between their study and ours and as we will illustrate later, we see an increase in disclosure during our sample period, but the increase is smaller for ExtCap than for the other two categories. In addition to Guthrie & Petty (2000), Brennan (2001, p. 429) had the following disclosure distribution: HumCap 22 %, IntCap 29 % and ExtCap 49 % and Vandemaele et al. (2005, p. 421) had HumCap 34 % IntCap 28 % and ExtCap 38 %. We see that no one of these had HumCap as their most common disclosed category and ExtCap were the most disclosed category in all of these studies. Only Vandemaele et al. conduct the study in Sweden while Guthrie & Petty and Brennan conduct their in Australia and Ireland respectively. The different countries and firms could be one explanation to the differences in our study compared to the others but they are also made in 2000 to 2005, which could be one important factor. It could simply be that the main interest has switched from ExtCap to HumCap and IntCap, which is supported by the higher growth in the latter two categories, in our study. With this in mind it is plausible that ExtCap would have had a higher share of the hits if we moved our study back in time.
5.2 Outlier-handling, multicollinearity and summarized statistical data Because of possible outliers we decided to use a rule-based approach to handle outliers as mentioned in 4.6. We used Cook’s distance to exclude influential observations that can bias e.g. R2 and the coefficients (Cook, 1977, p. 15). The excluded observations are presented in table 10. Regressions without elimination of outliers are presented in appendix 3. Looking at the regression in mind we see that the excluding of outliers did not change the relationships but strengthened the patterns. This indicates that the outliers were influential and by removing them we got a sharper picture.
Table 9. Outliers.
Company Year Eniro 2001 Eniro 2007 Eniro 2010 Investor 2007 Investor 2010 Vostok Gas 2007
Before conducting our regressions we also tested our data for multicollinearity between our independent variables and the results are shown hereafter in table 11. We see that, EPS and BVPS have a value of 0.6265, which indicates some multicollinearity. A guideline for when multicollinearity starts to be problematic is 0.80 so our data do not suffer from any problematic multicollinearity.
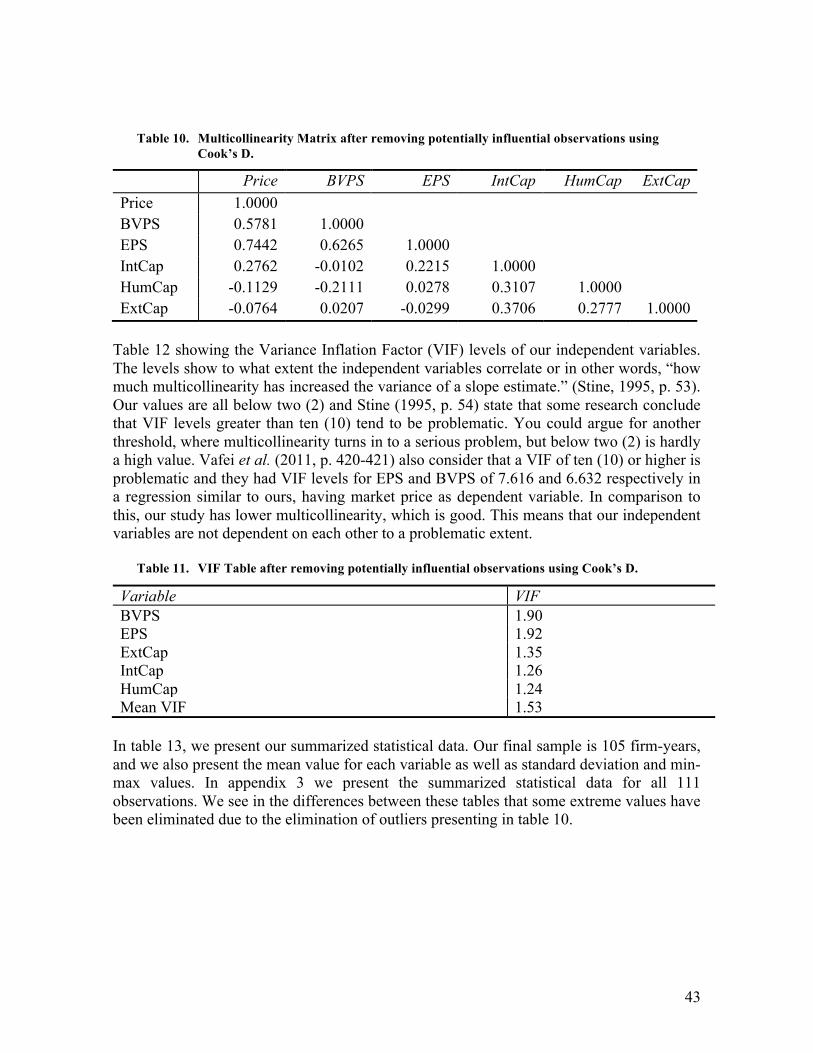
43
Table 10. Multicollinearity Matrix after removing potentially influential observations using Cook’s D.
Price BVPS EPS IntCap HumCap ExtCap Price 1.0000 BVPS 0.5781 1.0000 EPS 0.7442 0.6265 1.0000 IntCap 0.2762 -0.0102 0.2215 1.0000 HumCap -0.1129 -0.2111 0.0278 0.3107 1.0000 ExtCap -0.0764 0.0207 -0.0299 0.3706 0.2777 1.0000
Table 12 showing the Variance Inflation Factor (VIF) levels of our independent variables. The levels show to what extent the independent variables correlate or in other words, “how much multicollinearity has increased the variance of a slope estimate.” (Stine, 1995, p. 53). Our values are all below two (2) and Stine (1995, p. 54) state that some research conclude that VIF levels greater than ten (10) tend to be problematic. You could argue for another threshold, where multicollinearity turns in to a serious problem, but below two (2) is hardly a high value. Vafei et al. (2011, p. 420-421) also consider that a VIF of ten (10) or higher is problematic and they had VIF levels for EPS and BVPS of 7.616 and 6.632 respectively in a regression similar to ours, having market price as dependent variable. In comparison to this, our study has lower multicollinearity, which is good. This means that our independent variables are not dependent on each other to a problematic extent.
Table 11. VIF Table after removing potentially influential observations using Cook’s D.
In table 13, we present our summarized statistical data. Our final sample is 105 firm-years, and we also present the mean value for each variable as well as standard deviation and min-max values. In appendix 3 we present the summarized statistical data for all 111 observations. We see in the differences between these tables that some extreme values have been eliminated due to the elimination of outliers presenting in table 10.
Variable VIF BVPS 1.90 EPS 1.92 ExtCap 1.35 IntCap 1.26 HumCap 1.24 Mean VIF 1.53
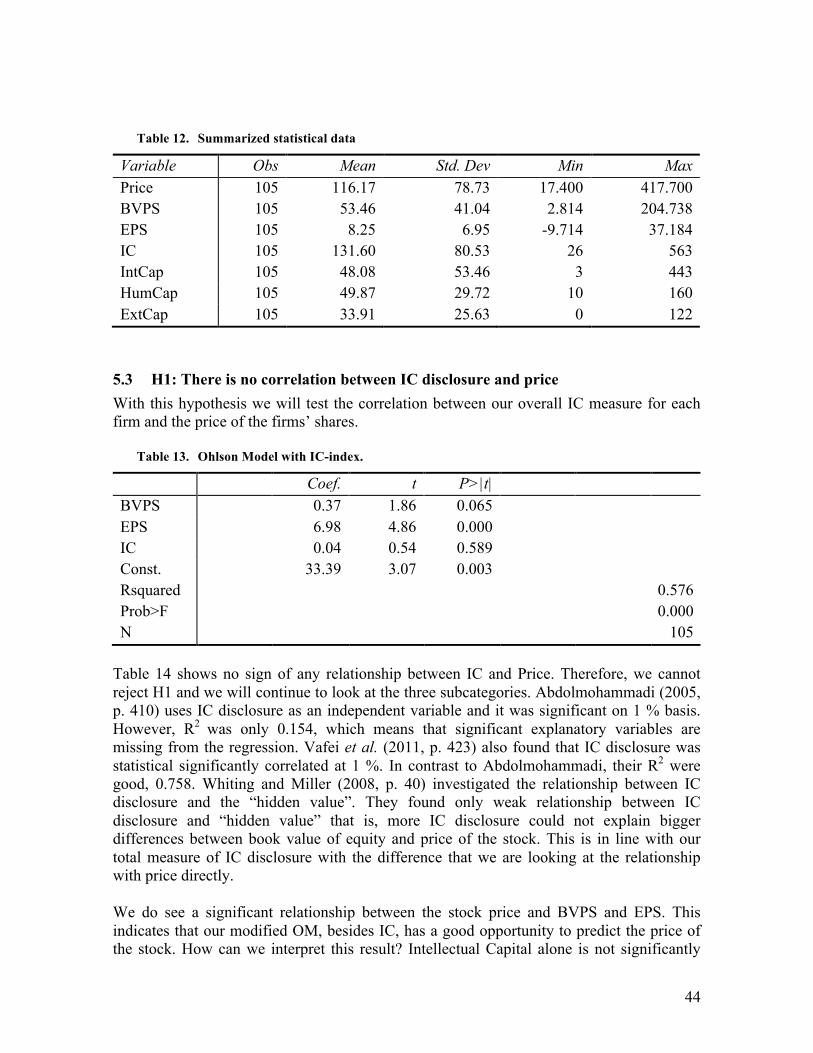
44
Table 12. Summarized statistical data
Variable Obs Mean Std. Dev Min Max Price 105 116.17 78.73 17.400 417.700 BVPS 105 53.46 41.04 2.814 204.738 EPS 105 8.25 6.95 -9.714 37.184 IC 105 131.60 80.53 26 563 IntCap 105 48.08 53.46 3 443 HumCap 105 49.87 29.72 10 160 ExtCap 105 33.91 25.63 0 122
5.3 H1: There is no correlation between IC disclosure and price With this hypothesis we will test the correlation between our overall IC measure for each firm and the price of the firms’ shares.
Table 13. Ohlson Model with IC-index.
Coef. t P>|t| BVPS 0.37 1.86 0.065 EPS 6.98 4.86 0.000 IC 0.04 0.54 0.589 Const. Rsquared Prob>F N
33.39
3.07
0.003
0.576 0.000
105 Table 14 shows no sign of any relationship between IC and Price. Therefore, we cannot reject H1 and we will continue to look at the three subcategories. Abdolmohammadi (2005, p. 410) uses IC disclosure as an independent variable and it was significant on 1 % basis. However, R2 was only 0.154, which means that significant explanatory variables are missing from the regression. Vafei et al. (2011, p. 423) also found that IC disclosure was statistical significantly correlated at 1 %. In contrast to Abdolmohammadi, their R2 were good, 0.758. Whiting and Miller (2008, p. 40) investigated the relationship between IC disclosure and the “hidden value”. They found only weak relationship between IC disclosure and “hidden value” that is, more IC disclosure could not explain bigger differences between book value of equity and price of the stock. This is in line with our total measure of IC disclosure with the difference that we are looking at the relationship with price directly. We do see a significant relationship between the stock price and BVPS and EPS. This indicates that our modified OM, besides IC, has a good opportunity to predict the price of the stock. How can we interpret this result? Intellectual Capital alone is not significantly

45
correlated with price. But some of its drivers might be. When we test the IC measure, we in fact test the sum of its subcategories HumCap, IntCap and ExtCap. Depending on how these are divided between each other and how they correlate. For example, if two of these categories are positively correlated with the share price and one is not correlated or negatively correlated we would see a weaker or no form of correlation between the total IC measure and price. Because of this we break our IC measure down to its subcategories to test them against price and see how they correlate.
5.4 H2: There is no correlation between Human Capital and price
5.5 H3: There is no correlation between Internal Capital and price
5.6 H4: There is no correlation between and External Capital and price With these three hypotheses, we test if the subcategories of IC one by one are correlated with the price and if there are differences in how they correlate with it. In table 15, the results after switching the total IC variable against the three subcategories are shown. R2 has, as a result, improved from 0.576 to 0.626, which is a high coefficient of determination compared to previous research in this field. For example Ferraro & Veltri (2011, p. 77), which inspired us in our regression design, had 0.52. Vafei et al. (2011, p. 423) had 0.758, which is higher than ours but Abdolmohammadi (2005, p 410) had 0.154. We see that our coefficient of determination is among the best there is in terms of research on this topic.
Table 14. Ohlson Model with IC-subcategories.
Coef. t P>|t| BVPS 0.39 1.86 0.067 EPS 6.40 4.30 0.000 IntCap HumCap ExtCap
0.35 -0.34 -0.36
2.15 -1.61 -1.86
0.034 0.110 0.066
Const. Rsquared
54.78
4.73
0.000
0.626
Prob>F N
0.000 105
Price and EPS are statistically significant at 1 % basis and IntCap is significant at 5 % level. Additionally, BVPS and ExtCap are significant at the 10 %. HumCap is not statistically significant even on 10 % with a p value of 0.110. BVPS, EPS and IntCap are positively correlated with price, meaning that increases in these variables tend to drive the share price up, all other variables being constant. For ExtCap however, we see a negative correlation. We can see patterns of the same relationship for HumCap even though it’s not significant. In this case higher values of HumCap and ExtCap mean lower share prices.
46
Firms with more HumCap and ExtCap disclosures have relatively lower share prices and it is somewhat surprising for us. A reasonable explanation could be that companies that have high HumCap and ExtCap disclosures have high amounts of expenses in these areas. The high disclosure is then a way of motivating high expenses relatively lower profit. An acknowledged paradox when it comes to IC is that the higher investment in e.g. human capital, or other things that are expensed straight away, will decrease the value of the company on a short-term basis (Edvinsson, 1997, p. 366). Ferraro & Veltri (2011, p. 78) states “It is easy to note that the proxies that are based on ‘negative’ accounting values (i.e., costs) are not perceived by investors as investments – rather they are perceived as empty costs; Instead proxy based on ‘positive’ accounting values, such as RC, are positively evaluated by investors.” Ferraro & Veltri found negative relationships with all their IC measures except RC, ExtCap in our study. They use net sales per share as a proxy for ExtCap and costs or intangible assets for the others. This could be why they only find a positive relationship for ExtCap. Later in this chapter we see that their ExtCap proxy does not have a clear relationship with our ExtCap measure. But based on their statement it would be logical that HumCap and ExtCap is negatively associated with Price if they are associated with high costs or “negative accounting values” and that IntCap is positively correlated with Price if it is associated with investments or “positively accounting values”. If so is the case our findings are in line with Ferraro & Veltri’s findings of positive and negative accounting values. In our framework IntCap is strongly related to many intangible assets that are possible to recognize in the balance sheet and would be seen as positively account values according to Ferraro and Veltri (2011, p. 78) We see that both EPS and BVPS positively correlated and are statistical significant at 1 % and 10 % respectively, increase in EPS and BVPS will increase Price, ceteris paribus. This is what you expect from the structure of common valuation models. Later on, we will divide the companies into capital intensive and knowledge intensive based on which ICB group they belong to in order to see if that has impact on the significance of the measures. Are R2 of 0.626 is as a high measure in comparison of other studies in the field and it means that our model can explain more than 62 % of the variance in Price.
5.7 H5: There is no difference in significance between knowledge-intensive and capital-intensive companies in our regressions.
We have showed earlier, in 5.2, that there are no correlation between the IC-measure as a whole and the stock price but if we tear it down to subcategory level we find signs of relationship. Now we want to see if there are any differences between the two groups in what variable that affects the stock price. In order to determine whether or not there is a difference between the two groups we performed two separate regressions: one with capital-intensive and one with knowledge-intensive companies. Which companies that are capital-intensive and which are knowledge-intensive you can find in 4.4 and 4.6.

47
Table 15. Ohlson Model with IC-subcategories, Knowledge-intensive firms.
Coef. t P>|t| BVPS 0.34 1.30 0.198 EPS 7.29 3.83 0.000 IntCap HumCap ExtCap
0.43 -1.06 -0.45
2.16 -2.37 -1.15
0.035 0.022 0.254
Const. Rsquared
76.12
4.20
0.000
0.659
Prob>F N
0.000 59
For knowledge-intensive firms we observe that EPS is strongly positively correlated with the price on a 1 % basis while BVPS is only weak positively correlated and are insignificant even on a 10 % level of significance. IntCap is strongly positive correlated while HumCap is negatively correlated and ExtCap has a weak or no correlation with price.
Table 16. Ohlson Model with IC-subcategories, Capital Intensive firms.
Coef. t P>|t| BVPS 0.56 2.73 0.009 EPS 4.20 2.86 0.007 IntCap HumCap ExtCap
0.39 -0.01 -0.14
1.40 -0.06 -0.92
0.170 0.949 0.363
Const. Rsquared
35.19
2.14
0.039
0.634
Prob>F N
0.000 46
For capital-intensive firms, both BVPS and EPS are positively correlated and significant on a 5 % basis. Neither IntCap, HumCap or ExtCap are significantly correlated on 5 or 10 % basis but IntCap has a weak positive relationship with price. For capital-intense firms we have a R2 of 63.4 % that should be seen as a high number in accounting research and for knowledge-intense firms we have a R2 that is even higher, 65.9 %. We see that for both firm types investors tend to pay a great interest in EPS, which according to the Ohlson Model, can be viewed as a future earnings indicator. Higher earnings tend to yield higher price, which also is expected. BVPS is only significant for capital-intensive firms and is only weakly correlated for knowledge-intensive firms. Investors tend to pay more interest in equity in the traditional firms when valuating the firms. This could be due to the fact that knowledge-intensive or non-traditional firms have less of its “assets” in the balance sheet and hence less book value of equity. This is also in line with previous research such as Pandian (2011, p. 286), who states that the gap between market value of equity and book
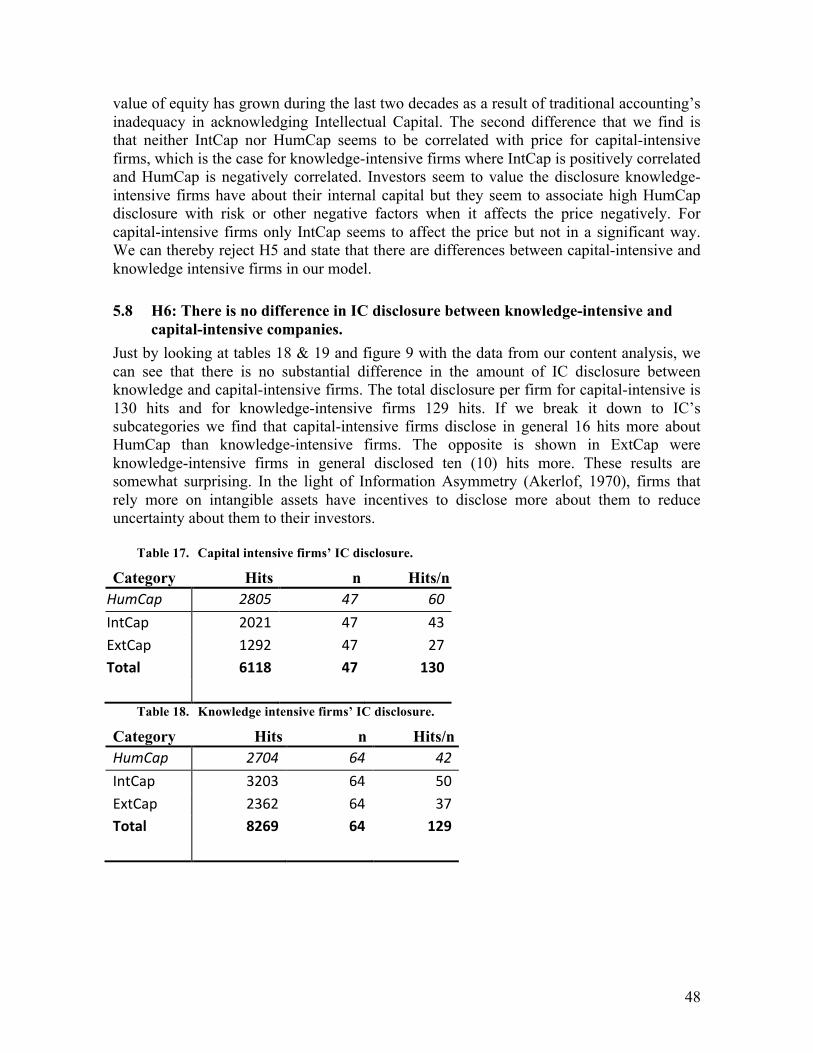
48
value of equity has grown during the last two decades as a result of traditional accounting’s inadequacy in acknowledging Intellectual Capital. The second difference that we find is that neither IntCap nor HumCap seems to be correlated with price for capital-intensive firms, which is the case for knowledge-intensive firms where IntCap is positively correlated and HumCap is negatively correlated. Investors seem to value the disclosure knowledge-intensive firms have about their internal capital but they seem to associate high HumCap disclosure with risk or other negative factors when it affects the price negatively. For capital-intensive firms only IntCap seems to affect the price but not in a significant way. We can thereby reject H5 and state that there are differences between capital-intensive and knowledge intensive firms in our model.
5.8 H6: There is no difference in IC disclosure between knowledge-intensive and capital-intensive companies.
Just by looking at tables 18 & 19 and figure 9 with the data from our content analysis, we can see that there is no substantial difference in the amount of IC disclosure between knowledge and capital-intensive firms. The total disclosure per firm for capital-intensive is 130 hits and for knowledge-intensive firms 129 hits. If we break it down to IC’s subcategories we find that capital-intensive firms disclose in general 16 hits more about HumCap than knowledge-intensive firms. The opposite is shown in ExtCap were knowledge-intensive firms in general disclosed ten (10) hits more. These results are somewhat surprising. In the light of Information Asymmetry (Akerlof, 1970), firms that rely more on intangible assets have incentives to disclose more about them to reduce uncertainty about them to their investors.
Table 17. Capital intensive firms’ IC disclosure.
Category Hits n Hits/n HumCap 2805 47 60 IntCap 2021 47 43 ExtCap 1292 47 27 Total 6118 47 130
Table 18. Knowledge intensive firms’ IC disclosure.
Category Hits n Hits/n HumCap 2704 64 42 IntCap 3203 64 50 ExtCap 2362 64 37 Total 8269 64 129
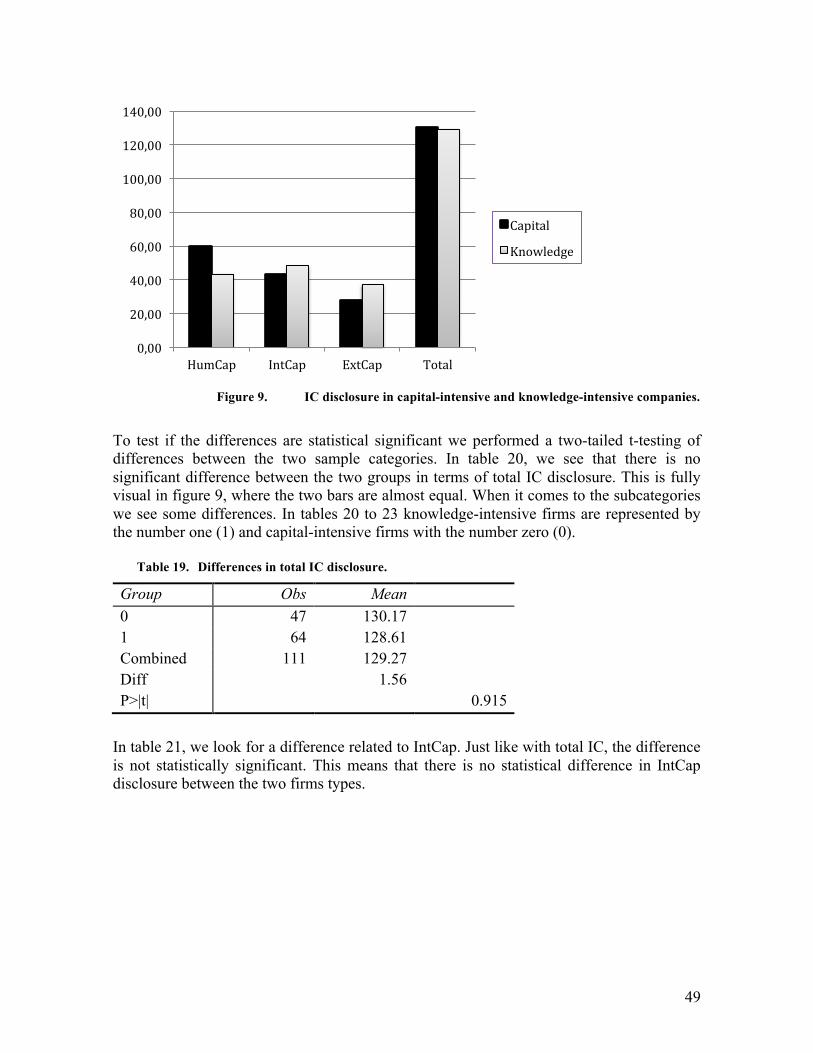
49
Figure 9. IC disclosure in capital-intensive and knowledge-intensive companies.
To test if the differences are statistical significant we performed a two-tailed t-testing of differences between the two sample categories. In table 20, we see that there is no significant difference between the two groups in terms of total IC disclosure. This is fully visual in figure 9, where the two bars are almost equal. When it comes to the subcategories we see some differences. In tables 20 to 23 knowledge-intensive firms are represented by the number one (1) and capital-intensive firms with the number zero (0).
Table 19. Differences in total IC disclosure.
Group Obs Mean 0 47 130.17 1 64 128.61 Combined 111 129.27 Diff P>|t|
1.56 0.915
In table 21, we look for a difference related to IntCap. Just like with total IC, the difference is not statistically significant. This means that there is no statistical difference in IntCap disclosure between the two firms types.
0,00
20,00
40,00
60,00
80,00
100,00
120,00
140,00
HumCap IntCap ExtCap Total
Capital
Knowledge
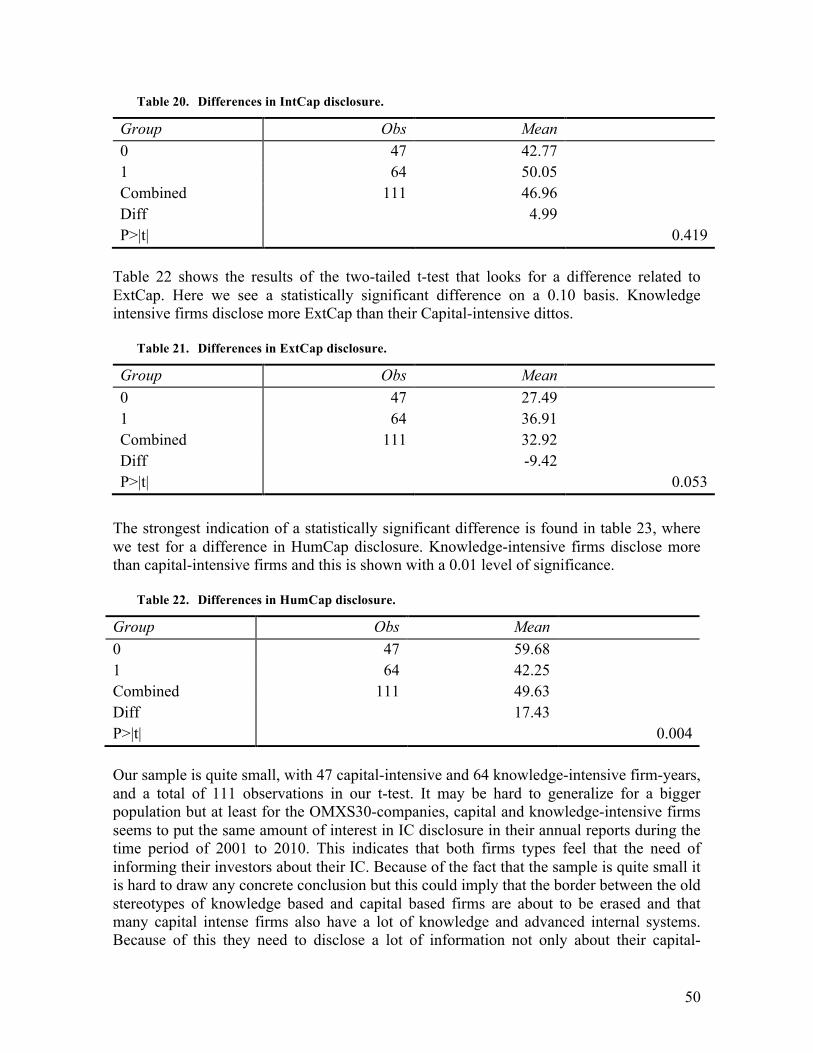
50
Table 20. Differences in IntCap disclosure.
Group Obs Mean 0 47 42.77 1 64 50.05 Combined 111 46.96 Diff P>|t|
4.99 0.419
Table 22 shows the results of the two-tailed t-test that looks for a difference related to ExtCap. Here we see a statistically significant difference on a 0.10 basis. Knowledge intensive firms disclose more ExtCap than their Capital-intensive dittos.
Table 21. Differences in ExtCap disclosure.
Group Obs Mean 0 47 27.49 1 64 36.91 Combined 111 32.92 Diff P>|t|
-9.42 0.053
The strongest indication of a statistically significant difference is found in table 23, where we test for a difference in HumCap disclosure. Knowledge-intensive firms disclose more than capital-intensive firms and this is shown with a 0.01 level of significance.
Table 22. Differences in HumCap disclosure.
Group Obs Mean 0 47 59.68 1 64 42.25 Combined 111 49.63 Diff P>|t|
17.43 0.004
Our sample is quite small, with 47 capital-intensive and 64 knowledge-intensive firm-years, and a total of 111 observations in our t-test. It may be hard to generalize for a bigger population but at least for the OMXS30-companies, capital and knowledge-intensive firms seems to put the same amount of interest in IC disclosure in their annual reports during the time period of 2001 to 2010. This indicates that both firms types feel that the need of informing their investors about their IC. Because of the fact that the sample is quite small it is hard to draw any concrete conclusion but this could imply that the border between the old stereotypes of knowledge based and capital based firms are about to be erased and that many capital intense firms also have a lot of knowledge and advanced internal systems. Because of this they need to disclose a lot of information not only about their capital-

51
intensive investments but also their knowledge-intensive investments. Another thing to have in mind is that we have a sample containing the most frequently traded stocks on the Stockholm Stock Exchange. They cannot be generalized to Swedish companies in general but it is plausible that they can be generalized to large Swedish companies. We believe that a trend towards convergence of IC disclosure between companies in the world leading country when it comes to IC disclosure, Sweden, first would be seen in the companies that are the leading ones. In general, the OMXS30 companies are just that. A weakness of our definitions of capital- and knowledge-intensive companies respectively is that it is based on our thoughts and therefore lacks a distinguishable theoretical grounding. One could argue for a more strict definition of a knowledge-intensive company, including only telecommunications, technology and health care. We did the other way around and were strict in the definition of capital-intensive companies. Previous research has acknowledged the shift towards a knowledge economy, e.g. the Australian stock market, which has seen a clearer shift from capital-intensive towards knowledge-intensive firms than the world in general (Guthrie & Petty, 2000, pp. 241-242). A lot of companies are, to some extent, intensive in knowledge. Therefore we did only include extremely capital-intensive industries in the capital-intensive group. It is possible that this bluntness in defining the two categories could hide a contingent marginal difference. Finally, why the differences in disclosure of the subcategories occur are outside the scope of this study. However, one possible reason for the differences in HumCap, which was the category where the differences were most significant, could be that in knowledge-intensive firms, investors anticipate the firms to spend a lot on their employees and their competence but in capital-intense firms management may need to justify their investments in personnel more than their knowledge-intensive competitors.
5.9 H7: IC disclosure has not increased during the researched time period.
Figure 10. IC Disclosure over time.
0,00
20,00
40,00
60,00
80,00
100,00
120,00
140,00
160,00
180,00
2001 2004 2007 2010
Intellectual Capital Disclosure
Mean Hum Cap
Mean Int Cap
Mean Ext Cap
Mean IC

52
We found that the mean level of IC disclosure (ICD) decreased between 2001 and 2004 but increased substantially between 2004 and 2007, which is illustrated in figure 10. This was followed by a slight increase between 2007 and 2010. Between 2001 and 2010, we see a 46 % increase in disclosure and we therefore reject H7. The slight decrease between 2001 and 2004 is in line with Vandemaele et al. (2005, p. 423), since they saw a decrease in the Swedish companies’ ICD between 2000 and 2002. They also state that this might indicate a slow-down in the upward trend of ICD. Vandemaele et al. (2005) study period ended 2002. Since ICD, according to our study continued to grow once again, we see it as more of temporary recoil. What caused this recoil? Perhaps the economic hardships in the early 2000s, following the burst of the dot-com bubble over-shadowed IC, but the other sample countries had IC growth during the same time span so it is not likely. Human Capital starts off with a slight decrease between 2001 and 2004, just like the total ICD. From 2004 to 2010, HumCap increases and reaches a peak for our sample period in 2010, at 64.2. Both Internal and External Capital decrease for the first time period but increase in the second. For IntCap the ICD increase is almost halted and we only see a 1.87 % growth between 2007 and 2010, peaking at 58,14. ExtCap actually peaked 2007, at 39.10 and decreases with 7.23 % during the final period.
Figure 11. IC growth 2001-2010.
5.10 Testing for relationship between our IC measures and IC proxies from previous research.
As an ending to this chapter we want to test if our IC disclosure measures are related to other measures of IC used in different studies. If so, we want to investigate in what way they are correlated. In accordance with the agency theory and previous research we formulate a general hypothesis that all other measures of IC, or proxies that we will call them and that we will test, are positively related to our indices. If the proxies are negatively
0%
10%
20%
30%
40%
50%
60%
70%
IC Growth Hum Cap Growth Int Cap Growth Ext Cap Growth
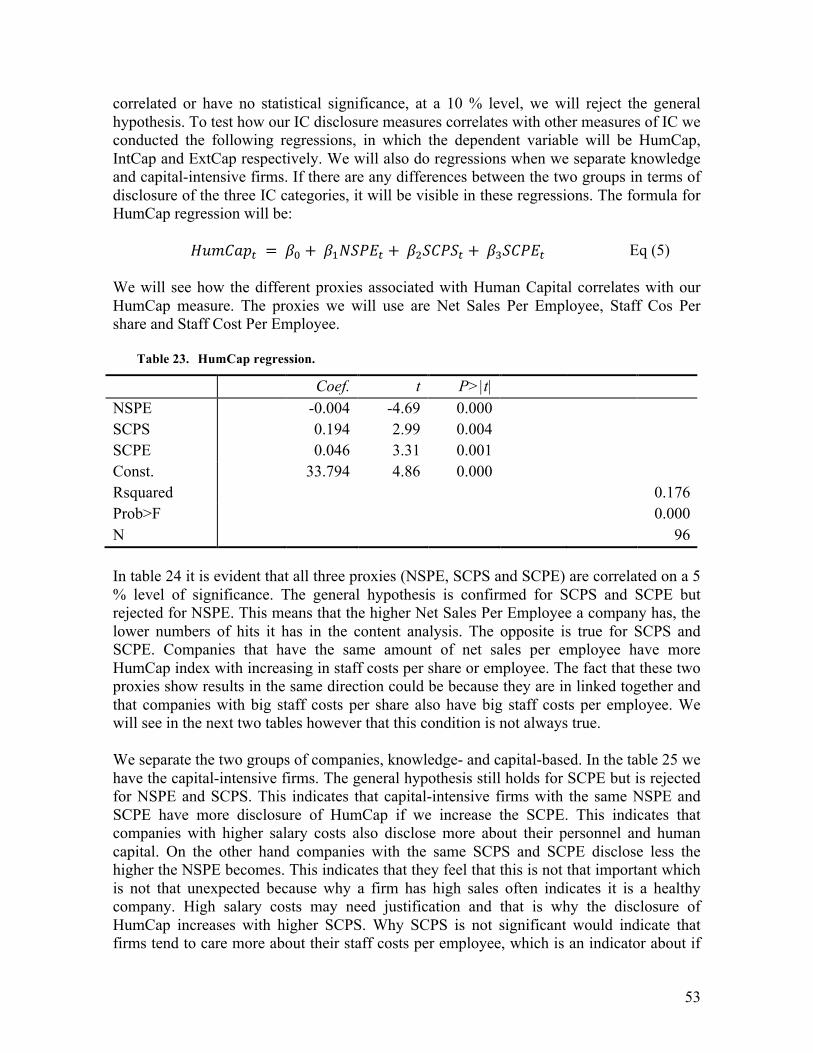
53
correlated or have no statistical significance, at a 10 % level, we will reject the general hypothesis. To test how our IC disclosure measures correlates with other measures of IC we conducted the following regressions, in which the dependent variable will be HumCap, IntCap and ExtCap respectively. We will also do regressions when we separate knowledge and capital-intensive firms. If there are any differences between the two groups in terms of disclosure of the three IC categories, it will be visible in these regressions. The formula for HumCap regression will be:
𝐻𝑢𝑚𝐶𝑎𝑝! = 𝛽! + 𝛽!𝑁𝑆𝑃𝐸! + 𝛽!𝑆𝐶𝑃𝑆! + 𝛽!𝑆𝐶𝑃𝐸! Eq (5) We will see how the different proxies associated with Human Capital correlates with our HumCap measure. The proxies we will use are Net Sales Per Employee, Staff Cos Per share and Staff Cost Per Employee.
Table 23. HumCap regression.
Coef. t P>|t| NSPE SCPS SCPE
-0.004 0.194 0.046
-4.69 2.99 3.31
0.000 0.004 0.001
Const. Rsquared
33.794 4.86 0.000 0.176
Prob>F N
0.000 96
In table 24 it is evident that all three proxies (NSPE, SCPS and SCPE) are correlated on a 5 % level of significance. The general hypothesis is confirmed for SCPS and SCPE but rejected for NSPE. This means that the higher Net Sales Per Employee a company has, the lower numbers of hits it has in the content analysis. The opposite is true for SCPS and SCPE. Companies that have the same amount of net sales per employee have more HumCap index with increasing in staff costs per share or employee. The fact that these two proxies show results in the same direction could be because they are in linked together and that companies with big staff costs per share also have big staff costs per employee. We will see in the next two tables however that this condition is not always true. We separate the two groups of companies, knowledge- and capital-based. In the table 25 we have the capital-intensive firms. The general hypothesis still holds for SCPE but is rejected for NSPE and SCPS. This indicates that capital-intensive firms with the same NSPE and SCPE have more disclosure of HumCap if we increase the SCPE. This indicates that companies with higher salary costs also disclose more about their personnel and human capital. On the other hand companies with the same SCPS and SCPE disclose less the higher the NSPE becomes. This indicates that they feel that this is not that important which is not that unexpected because why a firm has high sales often indicates it is a healthy company. High salary costs may need justification and that is why the disclosure of HumCap increases with higher SCPS. Why SCPS is not significant would indicate that firms tend to care more about their staff costs per employee, which is an indicator about if
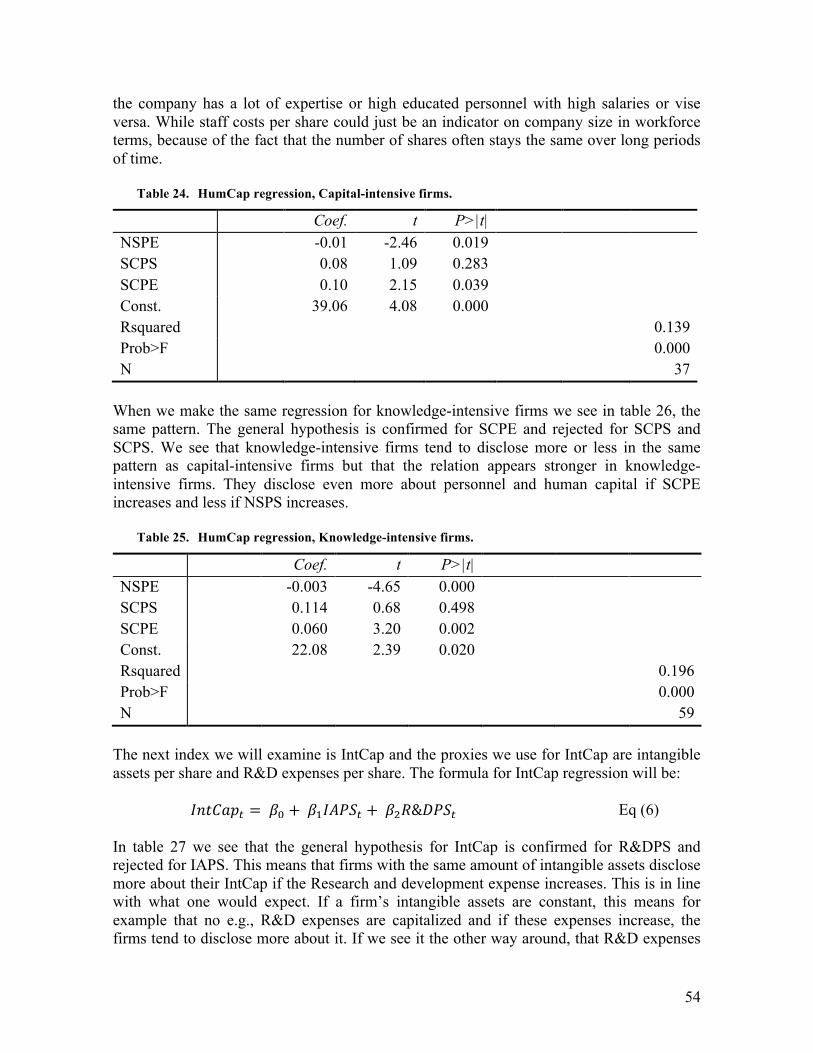
54
the company has a lot of expertise or high educated personnel with high salaries or vise versa. While staff costs per share could just be an indicator on company size in workforce terms, because of the fact that the number of shares often stays the same over long periods of time.
Table 24. HumCap regression, Capital-intensive firms.
Coef. t P>|t| NSPE SCPS SCPE
-0.01 0.08 0.10
-2.46 1.09 2.15
0.019 0.283 0.039
Const. Rsquared
39.06 4.08 0.000 0.139
Prob>F N
0.000 37
When we make the same regression for knowledge-intensive firms we see in table 26, the same pattern. The general hypothesis is confirmed for SCPE and rejected for SCPS and SCPS. We see that knowledge-intensive firms tend to disclose more or less in the same pattern as capital-intensive firms but that the relation appears stronger in knowledge-intensive firms. They disclose even more about personnel and human capital if SCPE increases and less if NSPS increases.
Table 25. HumCap regression, Knowledge-intensive firms.
Coef. t P>|t| NSPE SCPS SCPE
-0.003 0.114 0.060
-4.65 0.68 3.20
0.000 0.498 0.002
Const. Rsquared
22.08 2.39 0.020 0.196
Prob>F N
0.000 59
The next index we will examine is IntCap and the proxies we use for IntCap are intangible assets per share and R&D expenses per share. The formula for IntCap regression will be:
𝐼𝑛𝑡𝐶𝑎𝑝! = 𝛽! + 𝛽!𝐼𝐴𝑃𝑆! + 𝛽!𝑅&𝐷𝑃𝑆! Eq (6) In table 27 we see that the general hypothesis for IntCap is confirmed for R&DPS and rejected for IAPS. This means that firms with the same amount of intangible assets disclose more about their IntCap if the Research and development expense increases. This is in line with what one would expect. If a firm’s intangible assets are constant, this means for example that no e.g., R&D expenses are capitalized and if these expenses increase, the firms tend to disclose more about it. If we see it the other way around, that R&D expenses

55
are constant and intangibles assets increase, it will be shown in the balance sheet and this gives the investors enough information. But when no intangibles are recognized the management feels that they need to disclose more, if R&DSP increases, to justify the increase.
Table 26. IntCap regression.
Coef. t P>|t| IAPS R&DPS
-0.06 2.71
-1.50 3.16
0.137 0.002
Const. Rsquared
37.40
10.56 0.000 0.086
Prob>F N
0.008 106
If we tear it down to capital-intensive firms and knowledge-intensive firms we see in table 28 that the general hypothesis is still rejected for IAPS and confirmed for R&DPS.
Table 27. IntCap regression, Capital-intensive firms.
Coef. t P>|t| IAPS R&DPS
0.001 1.407
0.03 1.96
0.979 0.057
Const. Rsquared
39.236 8.98 0.000 0.076
Prob>F N
0.122 45
For the knowledge-intensive firms in table 30 we see that the hypothesis is confirmed for R&DPS but rejected for IAPS. It seems that the pattern described above is true also for capital-intensive firms, they disclose more about their IntCap if R&D expenses increases but we cannot se any relation between IAPS and IntCap. But for the knowledge-intensive firms we also see that if the intangibles increases the level of disclosure goes down. This is probably a result of the accounting rules that we described earlier in 1.8 and 3.3 about intangible assets and conservative accounting. Many parts of internal capital are possible to account for in the balance sheet such as software and patents, which would increase intangible assets. Research and development costs are on the other hand not always possible to recognize on the balance sheet because of conservative accounting and accounting rules and will therefore not increase intangible assets. These findings indicate that firms, especially so-called knowledge-intensive firms, do feel a need to disclose information about their investments that are not possible to recognize in balance sheet.
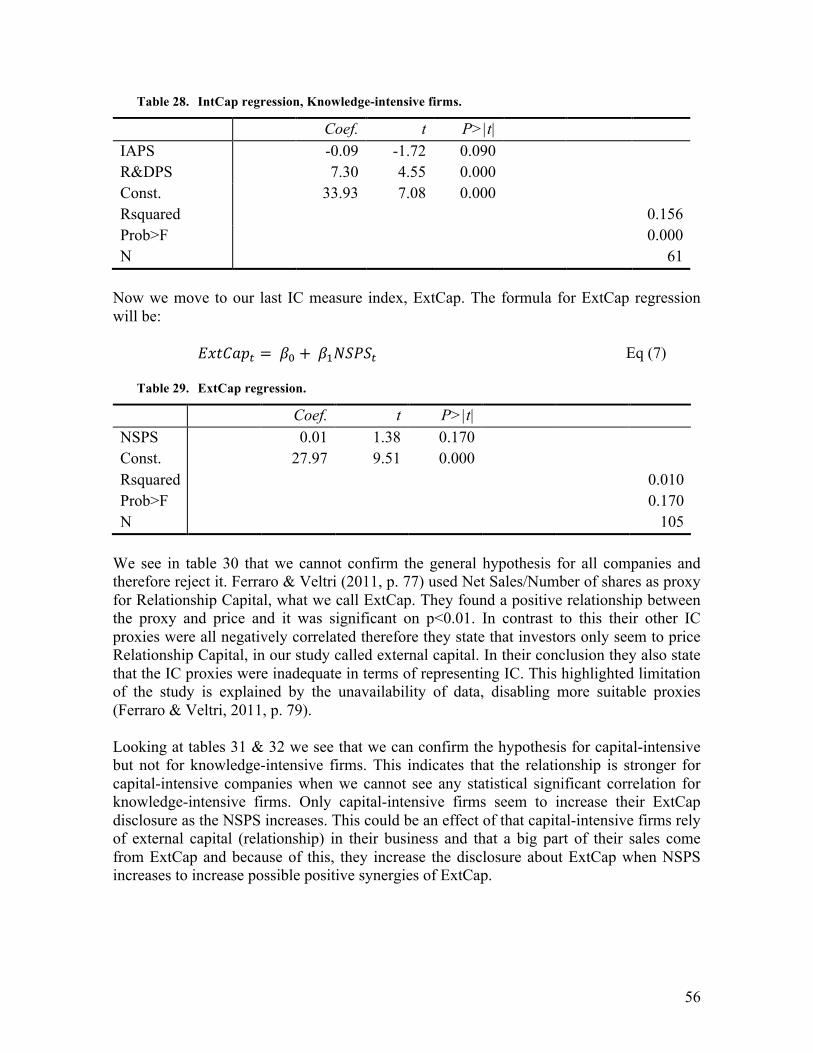
56
Table 28. IntCap regression, Knowledge-intensive firms.
Coef. t P>|t| IAPS R&DPS
-0.09 7.30
-1.72 4.55
0.090 0.000
Const. Rsquared
33.93
7.08 0.000 0.156
Prob>F N
0.000 61
Now we move to our last IC measure index, ExtCap. The formula for ExtCap regression will be:
𝐸𝑥𝑡𝐶𝑎𝑝! = 𝛽! + 𝛽!𝑁𝑆𝑃𝑆! Eq (7)
Table 29. ExtCap regression.
Coef. t P>|t| NSPS Const. Rsquared
0.01 27.97
1.38 9.51
0.170 0.000
0.010 Prob>F N
0.170 105
We see in table 30 that we cannot confirm the general hypothesis for all companies and therefore reject it. Ferraro & Veltri (2011, p. 77) used Net Sales/Number of shares as proxy for Relationship Capital, what we call ExtCap. They found a positive relationship between the proxy and price and it was significant on p<0.01. In contrast to this their other IC proxies were all negatively correlated therefore they state that investors only seem to price Relationship Capital, in our study called external capital. In their conclusion they also state that the IC proxies were inadequate in terms of representing IC. This highlighted limitation of the study is explained by the unavailability of data, disabling more suitable proxies (Ferraro & Veltri, 2011, p. 79). Looking at tables 31 & 32 we see that we can confirm the hypothesis for capital-intensive but not for knowledge-intensive firms. This indicates that the relationship is stronger for capital-intensive companies when we cannot see any statistical significant correlation for knowledge-intensive firms. Only capital-intensive firms seem to increase their ExtCap disclosure as the NSPS increases. This could be an effect of that capital-intensive firms rely of external capital (relationship) in their business and that a big part of their sales come from ExtCap and because of this, they increase the disclosure about ExtCap when NSPS increases to increase possible positive synergies of ExtCap.
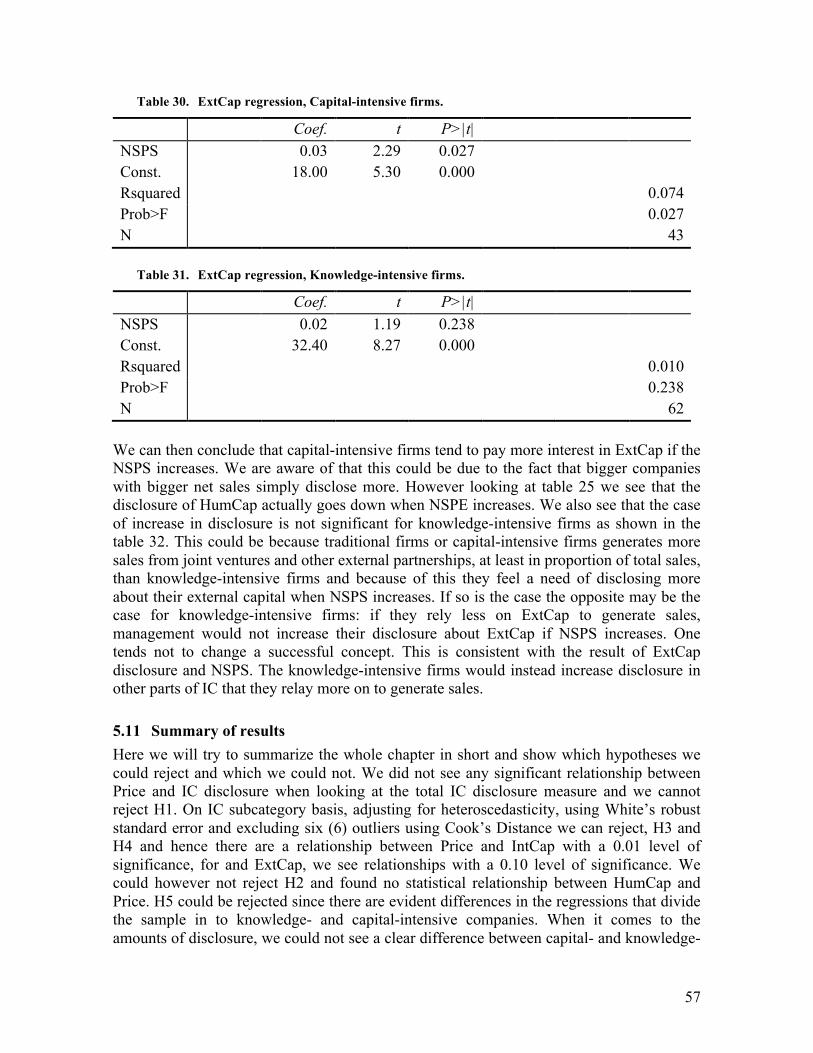
57
Table 30. ExtCap regression, Capital-intensive firms.
Coef. t P>|t| NSPS Const. Rsquared
0.03 18.00
2.29 5.30
0.027 0.000
0.074 Prob>F N
0.027 43
Table 31. ExtCap regression, Knowledge-intensive firms.
Coef. t P>|t| NSPS Const. Rsquared
0.02 32.40
1.19 8.27
0.238 0.000
0.010 Prob>F N
0.238 62
We can then conclude that capital-intensive firms tend to pay more interest in ExtCap if the NSPS increases. We are aware of that this could be due to the fact that bigger companies with bigger net sales simply disclose more. However looking at table 25 we see that the disclosure of HumCap actually goes down when NSPE increases. We also see that the case of increase in disclosure is not significant for knowledge-intensive firms as shown in the table 32. This could be because traditional firms or capital-intensive firms generates more sales from joint ventures and other external partnerships, at least in proportion of total sales, than knowledge-intensive firms and because of this they feel a need of disclosing more about their external capital when NSPS increases. If so is the case the opposite may be the case for knowledge-intensive firms: if they rely less on ExtCap to generate sales, management would not increase their disclosure about ExtCap if NSPS increases. One tends not to change a successful concept. This is consistent with the result of ExtCap disclosure and NSPS. The knowledge-intensive firms would instead increase disclosure in other parts of IC that they relay more on to generate sales.
5.11 Summary of results Here we will try to summarize the whole chapter in short and show which hypotheses we could reject and which we could not. We did not see any significant relationship between Price and IC disclosure when looking at the total IC disclosure measure and we cannot reject H1. On IC subcategory basis, adjusting for heteroscedasticity, using White’s robust standard error and excluding six (6) outliers using Cook’s Distance we can reject, H3 and H4 and hence there are a relationship between Price and IntCap with a 0.01 level of significance, for and ExtCap, we see relationships with a 0.10 level of significance. We could however not reject H2 and found no statistical relationship between HumCap and Price. H5 could be rejected since there are evident differences in the regressions that divide the sample in to knowledge- and capital-intensive companies. When it comes to the amounts of disclosure, we could not see a clear difference between capital- and knowledge-
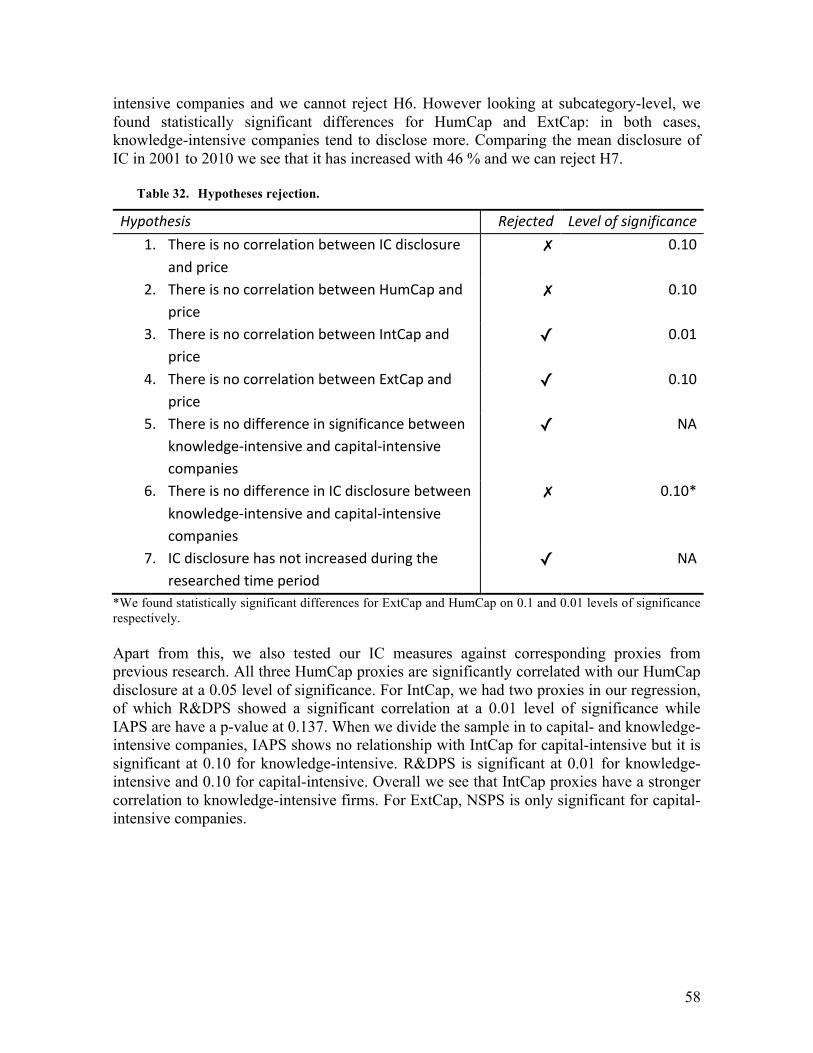
58
intensive companies and we cannot reject H6. However looking at subcategory-level, we found statistically significant differences for HumCap and ExtCap: in both cases, knowledge-intensive companies tend to disclose more. Comparing the mean disclosure of IC in 2001 to 2010 we see that it has increased with 46 % and we can reject H7.
Table 32. Hypotheses rejection.
Hypothesis Rejected Level of significance 1. There is no correlation between IC disclosure
and price ✗ 0.10
2. There is no correlation between HumCap and price
✗ 0.10
3. There is no correlation between IntCap and price
✓ 0.01
4. There is no correlation between ExtCap and price
✓ 0.10
5. There is no difference in significance between knowledge-‐intensive and capital-‐intensive companies
✓ NA
6. There is no difference in IC disclosure between knowledge-‐intensive and capital-‐intensive companies
✗ 0.10*
7. IC disclosure has not increased during the researched time period
✓ NA
*We found statistically significant differences for ExtCap and HumCap on 0.1 and 0.01 levels of significance respectively. Apart from this, we also tested our IC measures against corresponding proxies from previous research. All three HumCap proxies are significantly correlated with our HumCap disclosure at a 0.05 level of significance. For IntCap, we had two proxies in our regression, of which R&DPS showed a significant correlation at a 0.01 level of significance while IAPS are have a p-value at 0.137. When we divide the sample in to capital- and knowledge-intensive companies, IAPS shows no relationship with IntCap for capital-intensive but it is significant at 0.10 for knowledge-intensive. R&DPS is significant at 0.01 for knowledge-intensive and 0.10 for capital-intensive. Overall we see that IntCap proxies have a stronger correlation to knowledge-intensive firms. For ExtCap, NSPS is only significant for capital-intensive companies.
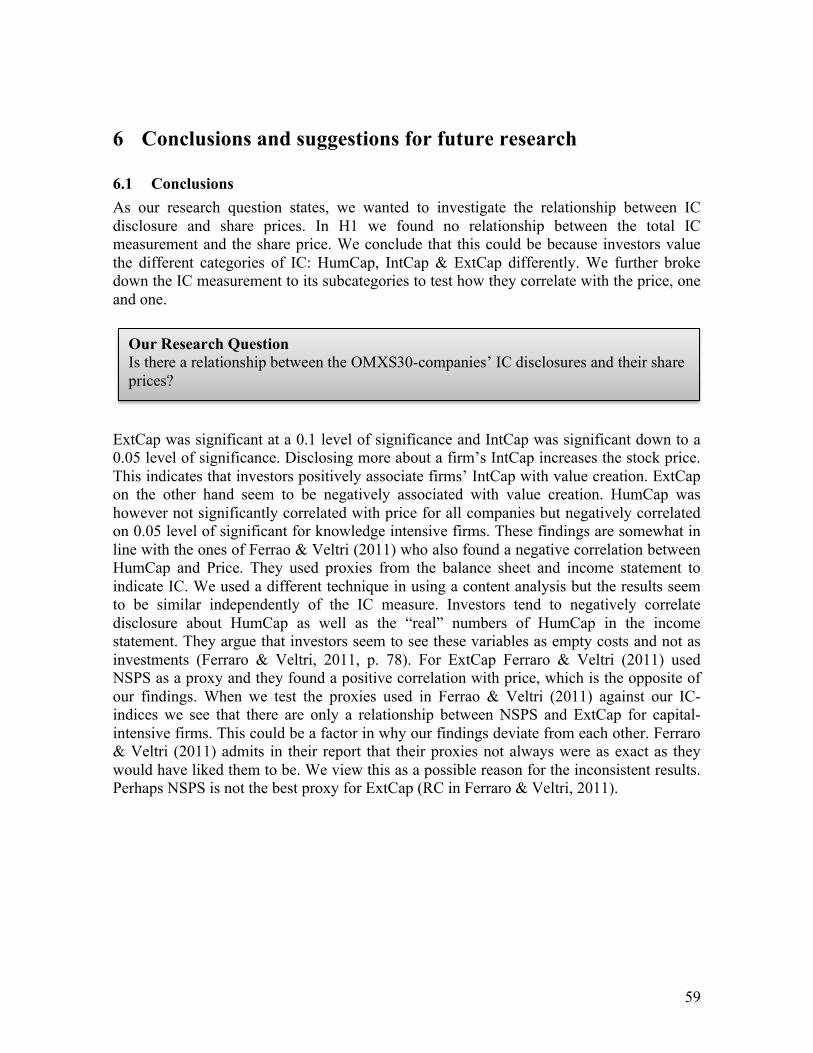
59
6 Conclusions and suggestions for future research
6.1 Conclusions As our research question states, we wanted to investigate the relationship between IC disclosure and share prices. In H1 we found no relationship between the total IC measurement and the share price. We conclude that this could be because investors value the different categories of IC: HumCap, IntCap & ExtCap differently. We further broke down the IC measurement to its subcategories to test how they correlate with the price, one and one.
ExtCap was significant at a 0.1 level of significance and IntCap was significant down to a 0.05 level of significance. Disclosing more about a firm’s IntCap increases the stock price. This indicates that investors positively associate firms’ IntCap with value creation. ExtCap on the other hand seem to be negatively associated with value creation. HumCap was however not significantly correlated with price for all companies but negatively correlated on 0.05 level of significant for knowledge intensive firms. These findings are somewhat in line with the ones of Ferrao & Veltri (2011) who also found a negative correlation between HumCap and Price. They used proxies from the balance sheet and income statement to indicate IC. We used a different technique in using a content analysis but the results seem to be similar independently of the IC measure. Investors tend to negatively correlate disclosure about HumCap as well as the “real” numbers of HumCap in the income statement. They argue that investors seem to see these variables as empty costs and not as investments (Ferraro & Veltri, 2011, p. 78). For ExtCap Ferraro & Veltri (2011) used NSPS as a proxy and they found a positive correlation with price, which is the opposite of our findings. When we test the proxies used in Ferrao & Veltri (2011) against our IC-indices we see that there are only a relationship between NSPS and ExtCap for capital-intensive firms. This could be a factor in why our findings deviate from each other. Ferraro & Veltri (2011) admits in their report that their proxies not always were as exact as they would have liked them to be. We view this as a possible reason for the inconsistent results. Perhaps NSPS is not the best proxy for ExtCap (RC in Ferraro & Veltri, 2011).
Our Research Question Is there a relationship between the OMXS30-companies’ IC disclosures and their share prices?
60
We feel that we have succeeded in examining the relationship between IC disclosure and share price, for which IntCap is positively correlated at 0.05 level of significance and since it is positively correlated with price. If we have two companies that are identical but one has more IntCap disclosure, that one should also trade at a price premium compared to the other company. The opposite seems to be the case for ExtCap were more disclosure tend to be related to lower share price. For HumCap we found no relationship between the disclosure and the share rice for capital-intensive firms but for knowledge-intensive firms we see a negative relationship. We can conclude that the level of disclosure has increased during the study period and total IC disclosure increased with 46 % from 2001 to 2010. This indicates that management focuses more and more disclosing IC in the annual reports. This is also in line what one should expect. Looking at research of IC disclosure, it had a great increase in interest after Guthrie & Petty’s (2000) work, which was somewhat a starting point for IC disclosure researchers. In line with Vandemaele et al. (2005, p. 423) we saw a decrease in IC from 2001 to 2004 but from 2004 and 2010 the disclosure increased. We believe that the decrease in disclosure was temporary recoil. The economic hardships that followed the burst of the dot-com bubble could be a factor. During this time, it is plausible that the companies focused on other types of disclosure, especially since the bubble was caused by overconfidence in young firms with large amounts of intellectual capital. Since Sweden was in the lead at the time, when it comes to IC disclosure, they had gotten farther along the line than the UK and Netherlands, the suggested recoil could have been more apparent here. Explaining why the latter two countries had IC disclosure growth during the same time period in Vandemaele et al. (2005). We have tested for correlation between our IC subcategories and as mentioned above, we only see a positive relationship between NSPS and ExtCap for Capital Intensive companies.
Our research purpose Our purpose with this thesis is to examine if there is any relationship between companies’ IC disclosures and their share prices. We also want to investigate to what degree the level of IC disclosure can explain the price premium. Furthermore we aim to investigate the development of IC disclosure over our sample period, 2001 to 2010. Finally look to provide a bridge between content analysis based studies and studies using efficiency measures of IC by regression testing our IC measures against common proxies.
61
Looking at our sought contribution and the actual outcome, we feel that we have contributed with an extensive study of large Swedish companies, covering a time period of ten years and we hope that other researchers can use our findings as a stepping stone for even more interesting results. During our work with this paper, we have referred to previous studies and to agency theory when saying that firms should be able to show their real value by disclosing more information about Intellectual Capital. It turned out to be true only for Internal Capital. This should be valuable information for companies designing their annual report, and for shareholders, investors, analysts and creditors in their valuations and decision making regarding companies and their true value. As discussed above our goal to contribute to an increased comparability between content analysis based studies and proxy-based studies indicate that proxies based on ‘positive’ accounting information, such as sales or profit, can explain IC but there is still a long way to go. Our final sample turned out to be 105 firm-years, a sample size that we are satisfied with considering the time limitations that we worked under. Limitations to this study include elements characterized by subjectivity, such as the content analysis coding process and the definition of capital- and knowledge-intensive companies. The first limitation, related to the coding process, is strongly influenced by previous frameworks from the likes of (Guthrie & Petty, 2000; Abdolmohammadi, 2005; Whiting & Miller, 2008) and the number of search hits, together with our found relationship between our variables and Price indicates validity. The latter limitation could have been avoided if we had found a previously used definition for which data was available. Vafei et al. (2011, p. 416) use a definition, which is based upon SIC codes. Unavailability of these codes for parts of our sample in DataStream made it impossible for us to use this.
6.2 Suggestions for future research For future research it would be interesting to replicate the methodology of this study on another sample population to see if the same relationships can be seen worldwide. In order to be able to generalize the findings however, a standardized framework and a generally accepted definition of Intellectual Capital would be of great use for future research.
Our Contribution We want to contribute, with this study, to a broadening of the already existing research in this field e.g. Guthrie & Petty, 2000; Brennan, 2001; Abdolmohammadi, 2005; Whiting & Miller, 2008, with a perspective of Sweden that has not earlier been studied. When the previous research has been inconsistent about if disclosure of IC affects the market value we also want to help spread some light in the dark. Mainly we want to conclude if companies can show their real value by disclosing more information about IC to its investors. This will assist companies in their decision process regarding IC disclosure. Additionally we aim to contribute to an increased comparability between content analysis based studies and proxy based studies by regression testing our IC disclosures against corresponding proxies from previous research.
62
Another topic of interest is the negative relationships that we found for HumCap and ExtCap. According to our regressions, increases in those variables led to a decreased share price. We have discussed why this might be but future research focusing on this and perhaps comparing companies that differ in reporting standards, e.g. US GAAP versus IFRS, in order to see how such the standards affect the relationship between price and the IC subcategories would be a new and interesting angle. We made a subjective division of the companies in to knowledge-intensive and capital-intensive based on the ICB Codes. A standardization of e.g. ICB codes or SIC codes to be used by future research would increase the comparability of future studies and take the whole field to a new level. Furthermore, an in depth investigation over firms’ reasoning regarding Intellectual Capital Disclosure to see if our conclusions as well as those within this field of research as a whole represent what they believe. Most of the previous research has only investigated voluntary IC disclosure but due to our time limitations we did not prioritize this. We believe that our findings are as valid as any but one could redo our study and only count voluntary disclosure to see if this is the case. That would mean that distinguishing voluntary disclosure might be a waste of time and money in certain studies. Studies with a company perspective have naturally an interest in voluntary disclosure in particular because it is that disclosure that the company can control, while mandatory disclosure must be included in the annual reports either way. Our study is primarily from a stock-market perspective since we aimed to investigate if IC disclosure affected the price of the share and by that, decreased a company’s ‘hidden value’. Investigating this subject but taking a creditor or auditor perspective would be interesting and somewhat groundbreaking. For example, one could investigate how IC disclosure affects a bank’s willingness to grant loans or if there is a relationship between IC disclosure and clean audit reports.

63
List of references Abdolmohammadi, M. J. (2005). Intellectual capital disclosure and market capitalization.
Journal of Intellectual Capital 6(3), 397-416. Akerlof, G. A. (1970). The Market for 'Lemons': Quality Uncertainty and the Market
Mechanism. The Quarterly Journal of Economics, 84(3), 488-500. Barth, M. E., & Clinch, G. (2009). Scale Effects in Capital Markets-Based Accounting Research.
Journal of Business Finance & Accounting, 36(3, 4), 253–288. Beattie, V., & Thomson, S. J. (2007). Lifting the lid on the use of content analysis to
investigate intellectual capital disclosures. Accounting Forum, 31, 129-163. Bontis, N. (2003). Intellectual Capital Disclosure in Canadian Corporations Journal of
Human Resource Costing and Accounting, 7(1-2), 9-20. Bozzolan, S., Favotto, F., & Ricceri, F. (2003). Italian annual intellectual capital disclosure.
Journal of Intellectual Capital 4(4), 543-558. Brennan, N. (2001). Reporting intellectual capital in annual reports:
evidence from Ireland. Accounting, Auditing & Accountability Journal, 14(4), 423-436.
Business Broadway. (2012) Retrieved 2012-02-29, from http://businessoverbroadway.com/wp-content/uploads/2011/12/reliability-validity-quadrant.png
Bruner, R. F., Li, W., Kritzman, M., Myrgrenc, S., & Pagec, S. b. (2008). Market
integration in developed and emerging markets: Evidence from the CAPM. Emerging Markets Review 9, 89-103.
Bryman, A., Bell, E. (2005). Företagsekonomiska forskningsmetoder (1. uppl. ed.). Malmö:
Liber ekonomi. Bryman, A., Bell, E. (2007). Business Research Methods. Retrieved 2012-05-22, from http://books.google.se/books?id=JTLdqpYb7FAC&printsec=frontcover&dq=bryma
n+%26+bell&hl=sv&sa=X&ei=Cke6T7zWJ63c4QTp7f3hCQ&redir_esc=y#v=onepage&q=bryman%20%26%20bell&f=false
Bukh, P. N., Nielsen, C., Gormsen, P., & Mouritsen, J. (2005). Disclosure of information
on intellectual capital in Danish IPO prospectuses Accounting, Auditing & Accountability Journal, 18(6), 713-732.
Burgess, M. R. (2010). Efficient Market Hypothesis in European Stock Markets. The
European Journal of Finance, 16(7), 711-726. Chaminade, C., & Roberts, H. (2003). What it means is what it does: a comparative
64
analysis of implementing intellectual capital in Norway and Spain. European Accounting Review, 12(4), 733-751.
Chen, M.-C., Cheng, S.-J., & Hwang, Y. (2005). An empirical investigation of the
relationship between intellectual capital and firms’ market value and financial performance. Journal of Intellectual Capital 6(2), 159-185.
Chiucchi, M. S. (2008). Exploring the benefits of measuring intellectual capital. The Aimag
case study. Human Systems Management 27, 217-231. Cook, R. D. (1977). Detection of Influential Observation in Linear Regression. Technometrics,
19(1), 15-18. Deloitte (2012). IAS Plus. Retrieved: 2012-05-24, from http://www.iasplus.com/en/standards/standard37 http://www.iasplus.com/en/standards/standard43 Edvinsson, L. (1997). Developing Intellectual Capital at Skandia. Long Range
Planning 30(3), 366-373. Edvinsson, L., & Malone, M. S. (1997). Intellectual capital: realizing your company's true
value by finding its hidden brainpower (1 ed.). New York: Harper Business. Fairfield, P. M. (1994). P/E, P/B and the Present Value of Future Dividends. Financial
Analysts Journal, 50(4), 23-31. Fama, E. F. (1970). Efficient Capital Markets: A review of Theory and Empirical Work.
The Journal of Finance, 25(2), 383-417. Fama, E. F. (1991). Effecient Capital Markets: II. The Journal of Finance, 46(5), 1575-
1617. Fama, E. F., & French, K. R. (2004). The Capital Asset Pricing Model: Theory and
Evidence. The Journal of Economic Perspectives, 18(3), 25-46. Ferraro, O., & Veltri, S. (2011). The value relevance of intellectual capital on the firm’s market
value: an empirical survey on the Italian listed firms. Int. J. Knowledge-Based Development 2(1), 66-84.
Financial Times. (2012). Price-to-book ratio Retrieved 2012-02-16, 2012, from http://lexicon.ft.com/Term?term=price_to_book-ratio Gray, R., Kouhy, R., & Lavers, S. (1995). Methodological themes
Constructing a research database of social and environmental reporting by UK companies. Accounting, Auditing & Accountability Journal,, 8(2), 78-101.
Gröjer, J.-E., & Johanson, U. (1998). Current development in human resource costing and
accounting Reality present, researchers absent? Accounting Auditing &

65
Accountability Journal, 11(4), 495-505. Guthrie, J. (2001). The management, measurement and the reporting of intellectual capital.
Journal of Intellectual Capital, 2(1), 27-41. Guthrie, J., & Petty, R. (2000). Intellectual capital: Australian annual reporting practices.
Journal of Intellectual Capital, 1(3), 241-250. Hackston, D., & Milne, M. J. (1996). Some determinants of social and environmental
disclosures in New Zealand companies Accounting, Auditing & Accountability Journal,, 9(1), 77-108.
Hand, J. R. M., & Lev, B. (2003). Intangible assets : values, measures, and risks. Oxford
New York: Oxford University Press. Healy, P. M., & Palepu, K. G. (2001). Information asymmetry, corporate disclosure, and
the capital markets: A review of the empirical disclosure literature. Journal of Accounting and Economics, 31, 405-440.
Johanson, U., Ma, M., & Skoog, M. (2001 ). Mobilizing change through the management
control of intangibles. Accounting, Organizations and Society, 26, 715-733. Kaplan, R. S., & Norton, D. P. (1996). Using the Balanced Scorecard as a Strategic Management
System. Harvard Business Review, 74(1), 75-85. Krippendorff, K. (2004). Content analysis : an introduction to its methodology (2. ed.).
Thousand Oaks, Calif.: Sage. Krippendorff, K., & Bock, M. A. (2009). The content analysis reader. London: SAGE. Lev, B., & Sougiannis, T. (1996). The capitalization, amortization and value-relevance of R&D.
Journal of Accounting and Economics, 21, 107-138. Lev, B., & Sougiannis, T. (1999). Penetrating the Book-to-Market Black Box: The R&D
Effect. Journal of Business Finance & Accounting, 26(3&4), 419-449. Litschka, M., Markom, A., & Schunder, S. (2006). Measuring and analysing intellectual
assets: an integrative approach. Journal of Intellectual Capital, 7(2), 160-173. Marr, B., Mouritsen, J., & Bukh, P. N. (2003). Perceived Wisdom. Financial
Management(July/August 2003), 32. . Milne, M. J., & Adler, R. W. (1999). Exploring the reliability of social and environmental
disclosures content analysis Accounting, Auditing & Accountability Journal, 12(2), 237-256.
Nasdaq OMX Nordic (2012). Retrieved 2012-02-16, from
66
http://www.nasdaqomxnordic.com https://indexes.nasdaqomx.com/Data.aspx?IndexSymbol=OMXS30 http://www.nasdaqomxnordic.com/about_us?languageId=1 http://www.nasdaqomxnordic.com/indexes/historical_prices/?Instrument=SE0000337842
Nissim, D. & Penman, S.H. (2003). Financial Statement Analysis and How It Informs
About Profitability and Price-to-Book Ratios. Review of Accounting Studies 8. 531-560.
Ohlson (1995). Earnings, Book Values, and Dividends in Equity Valuation. Contemporary Accounting Research, 11(2), 661-687. Olsson, B. (2001). Annual Reporting Practices: Information about Human Resources in
Corporate Annual Reports in Major Swedish Companies. Journal of Human Resource Costing and Accounting, 6(1), 39-52.
Pandian, P. S. (2011). Intellectual capital: today’s challenge! Tomorrow’s asset. Int. J.
Learning and Intellectual Capital 8(3), 285-289. Penman, S. H. (1996). The Articulation of Price-Earnings Ratios and Market-to-Book Ratios
and the Evaluation of Growth Journal of Accounting Research, 34(2), 235-259. Penman, S. H. (2010). Financial Statement Analysis and Security Valuation (International
Edition 2010 ed.). Singapore. Penman, S.H. & Zhang X.J (2002). Accounting Conservatism, the Quality of Earnings, and
Stock Returns. The Accounting Review 77(2), 237-264. Pulic, A. (2000). VAICTM – an accounting tool for IC management Int. J. Technology
Management 20(5/6/7/8), 702-714. Roslender, R. (1997). Accounting for the Worth of Employees: Is the Discipline Finally
Ready to Respond to the Challenge? Journal of Human Resource Costing and Accounting, 2(1), 9-17.
Roslender, R., & Fincham, R. (2004). Intellectual capital accounting in the UK.
Accounting, Auditing & Accountability Journal, 17(2), 178-209. Roslender, R., & Stevens, J. (2009). Accounting for People: A real step forward or more a
case of wishing and hoping?. Critical Perspectives on Accounting, 20, 855-869. Ryan, B., Scapens, R. W., & Theobald, M. (2002). Research method and methodology in
finance and accounting (2. ed.). London: Thomson. Rylander, A., Jacobsen, K., & Roos, G. R. (2000). Towards improved information

67
disclosure on intellectual capital. Int. J. Technology Management, 20(5/6/7/8), 715-741
. Saunders, M., Lewis, P., & Thornhill, A. (2007). Research methods for business students
(4. ed.). Harlow: Financial Times/Prentice Hall. Shareef, F., & Davey, H. (2005). Accounting for intellectual capital: Evidence from listed English football clubs. The Journal of Applied Accounting Research, 7(3), 78-116. Stine, R. A. (1995). Graphical Interpretation of Variance Inflation Factors. The American
Statistician, , 49(1), 53-56. Sundac, D., & Krmpotic, I. F. (2009 ). Measurement and Management of Intellectual
Capital. Tourism and Hospitality Management,, 15(2), 279-290. Sveiby, K.-E. (1997). The new organizational wealth : managing & measuring knowledge-
based assets (1. ed.). San Francisco, Calif.: Berrett-Koehler. Vafaei, A., Taylor, D., & Ahmed, K. (2009). The value relevance of intellectual capital disclosures.
Journal of Intellectual Capital, 12(3), 407 - 429. Vandemaele, S. N., Vergauwen, P. G. M. C., & Smits, A. J. (2005). Intellectual capital
disclosure in The Netherlands, Sweden and the UK. Journal of Intellectual Capital 6(3), 417-426.
Vergauwen, P., Bollen, L., & Oirbans, E. (2007). Intellectual capital disclosure and
intangible value drivers: an empirical study. Management Decision 45(7), 1163-1180.
Wang, J.-C. (2008). Investigating market value and intellectual capital for S&P 500. Journal of Intellectual Capital, 9(4), 546 - 563. Whiting, R. H., & Miller, J. C. (2008). Voluntary disclosure of intellectual capital in New
Zealand annual reports and the “hidden value”. Journal of Human Resource Costing & Accounting, 12(1), 26-50.

1
Appendix 1: The OMXS30 companies 2001-‐12-‐31 2004-‐12-‐31 2007-‐12-‐31 2010-‐12-‐31 ABB ABB ABB ABB Assa Abloy Alfa Laval Alfa Laval Alfa Laval Astra Zeneca Assa Abloy Assa Abloy Assa Abloy Atlas Copco Astra Zeneca Astra Zeneca Astra Zeneca Autoliv Atlas Copco Atlas Copco Atlas Copco Electrolux Autoliv Autoliv Boliden Eniro Electrolux Boliden Electrolux Ericsson Eniro Electrolux Ericsson Europolitan Ericsson Eniro Getinge Föreningssparbanken Föreningssparbanken Ericsson H&M H&M H&M H&M Investor
Holmen Holmen Investor Lundin Petroleum
Investor Investor Nokia MTG Nokia Nokia Nordea Nokia Nordea Nordea Sandvik Nordea Pharmacia Sandvik SCA Sandvik Sandvik SCA Scania SCA SCA SEB SEB Scania SEB Securitas Securitas SEB Securitas SHB SHB Securitas SHB Skandia Skanska SHB Skandia Skanska SKF Skanska Skanska SKF SSAB SKF SKF Stora Enso Swedbank SSAB Stora Enso Swedish Match Swedish Match Swedbank Tele2 Tele2 Tele2 Swedish Match Telia TeliaSonera TeliaSonera Tele2 Volvo Volvo Volvo TeliaSonera WM Data Wihlborgs Vostok Gas Volvo
1
Appendix 2: Content Analysis Data Collection ABB 2010 http://www400.abbext.com/2010/ar/servicepages/downloads/files/annual_report_2010.pdf 2007 http://www05.abb.com/global/scot/scot266.nsf/veritydisplay/36b8f674fa5823ffc1257410003ba1eb/$file/ABB%20Group%20Annual%20Report%2007,%20Operational%20review.pdf 2004 http://www05.abb.com/global/scot/scot266.nsf/veritydisplay/6d207e4378fbafe4c1256fea00515021/$file/ABB_OR04en_finish_120705.pdf 2001 http://www05.abb.com/global/scot/scot266.nsf/veritydisplay/6fc717b12ff65d2cc1256cb40053f274/$file/ABB%20Group%20Annual%20Report,%202001_English.pdf Alfa Laval 2010 http://www.alfalaval.com/about-us/investors/Reports/annual-reports/Documents/Annual_report_2010_engx.pdf 2007 http://alfalaval.halvarsson.se/2007en/getpdf.aspx 2004 http://www.alfalaval.com/about-us/investors/Reports/annual-reports/Documents/Annual_report_2004_eng.pdf Autoliv 2007 http://www.autoliv.com/wps/wcm/connect/756f73804ce4f4bab171f7f594aebdee/AutolivAR_LOW.pdf?MOD=AJPERES 2004 http://www.autoliv.com/wps/wcm/connect/387d9e004ce4f507b315f7f594aebdee/ALV-AR2004.pdf?MOD=AJPERES 2001 http://www.autoliv.com/wps/wcm/connect/60ed78804ce4f30ca62ae6f594aebdee/AR2001e.pdf?MOD=AJPERES ASSA ABLOY 2010: http://www.assaabloy.com/Global/Investors/Annual-Report/2010/Annual-Report-2010-EN-ASSA-ABLOY.pdf 2007: http://www.assaabloy.com/Global/Investors/Annual-Report/2007/ASSA%20ABLOY__Annual%20Report_2007_ENG.pdf 2004: http://www.assaabloy.com/Global/Investors/Annual-Report/2004/AR2004eng.pdf 2001:
2
http://www.assaabloy.com/Global/Investors/Annual-Report/2001/AR2001eng_TheCompleteAnnualReport.pdf 1998: http://www.assaabloy.com/Global/Investors/Annual-Report/1998/AR1998eng_1_Introduction.pdf http://www.assaabloy.com/Global/Investors/Annual-Report/1998/AR1998eng_2_Summaryofoperations.pdf http://www.assaabloy.com/Global/Investors/Annual-Report/1998/AR1998eng_3_Financialstatements.pdf http://www.assaabloy.com/Global/Investors/Annual-Report/1998/AR1998eng_4_Board,Managementandaddresses.pdf Astra Zeneca 2010: http://www.astrazeneca.com/cs/Satellite?blobcol=urldata&blobheader=application%2Fpdf&blobheadername1=Content-Disposition&blobheadername2=MDT-Type&blobheadervalue1=inline%3B+filename%3DEnglish.pdf&blobheadervalue2=abinary%3B+charset%3DUTF-8&blobkey=id&blobtable=MungoBlobs&blobwhere=1285624983389&ssbinary=true 2007: http://www.astrazeneca-annualreports.com/2007/Downloads/Annual_Report.pdf 2004: http://www.astrazeneca.com/cs/Satellite?blobcol=urldata&blobheader=application%2Fpdf&blobheadername1=Content-Disposition&blobheadername2=MDT-Type&blobheadervalue1=inline%3B+filename%3DEnglish.pdf&blobheadervalue2=abinary%3B+charset%3DUTF-8&blobkey=id&blobtable=MungoBlobs&blobwhere=1285616438483&ssbinary=true 2001: http://www.zonebourse.com/ASTRAZENECA-PLC 4000930/pdf/7365/AstraZeneca%20plc_Rapport-annuel.pdf Atlas Copco http://www.atlascopco.com/us/Investorrelations/presentations/Annualreport/ Boliden 2010: http://investors.boliden.com/afw/files/press/boliden/Boliden2010_en.pdf 2007: http://investors.boliden.com/afw/files/press/boliden/BolidenAR2007_en.pdf 1998: http://investors.boliden.com/afw/files/press/boliden/Boliden_Annual_Report_1998.pdf Electrolux 2010:
3
http://group.electrolux.com/en/wp-content/uploads/2011/09/Electrolux-Annual-Report-2010-Part1-2-English.pdf 2007: http://group.electrolux.com/en/wp-content/uploads/2010/07/Electrolux-Annual-Report-2007-Part1-English.pdf http://group.electrolux.com/en/wp-content/uploads/2010/07/Electrolux-Annual-Report-2007-Part2-English.pdf 2004: http://group.electrolux.com/en/wp-content/uploads/2010/07/Electrolux-Annual-Report-2004-English.pdf 2001: http://group.electrolux.com/en/wp-content/uploads/2010/07/ELUX_2001_eng.pdf 1998: http://group.electrolux.com/en/wp-content/uploads/2011/08/ELECTROLUX-ANNUAL-REPORT-1998-ENGLISH.pdf Eniro 2007 http://investors.eniro.com/files/press/eniro/200804022264-3.pdf 2004 http://investors.eniro.com/files/press/eniro/200503222083en2.pdf 2001 http://investors.eniro.com/files/press/eniro/Eniro_Annual_Report_2001_eng.pdf Ericsson 2010: http://www.ericsson.com/res/investors/docs/2010/ericsson_ar_2010_en.pdf 2007: http://www.ericsson.com/res/investors/docs/2007/annual-report/ar_en_complete.pdf 2004: http://www.ericsson.com/res/investors/docs/2004/annual-report/ericsson_ar2004_complete_en.pdf 2001: http://www.ericsson.com/res/investors/docs/annual-reports-1970-2002/annual01_review_en.pdf http://www.ericsson.com/res/investors/docs/annual-reports-1970-2002/annual01_financial_en.pdf 1998: http://www.ericsson.com/res/investors/docs/annual-reports-1970-2002/AnnualReport1998.pdf Getinge 2010: http://www.getingegroup.com/Global/Reports/Annual%20Reports/Annual%20Reports%202010/315510_Getinge_AR_2010_110322_ENG_Web_.pdf
4
1998: http://www.getingegroup.com/Global/Reports/Annual%20Reports/Annual%20Reports%201998/annual_98eng.pdf H&M http://about.hm.com/content/hm/AboutSection/en/About/Facts-About-HM/About-HM/download-archive.htmlInvestor Holmen 2004 http://investors.holmen.com/files/press/holmen/Holmen_2004_AR_en.pdf 2001 http://feed.ne.cision.com/wpyfs/00/00/00/00/00/02/74/8F/wkr0001.pdf Investor 2010 http://ir.investorab.com/files/press/investor/201103142056-2.pdf 2007 http://ir.investorab.com/files/press/investor/AR2007ENGfinal.pdf 2004 http://ir.investorab.com/files/press/investor/200503112095en2.pdf 2001 http://ir.investorab.com/files/press/investor/investor-report-2002-03-26-en.pdf Lundin Petroleum 2010: http://www.lundin-petroleum.com/Documents/ar_2010_e.pdf MTG 2010: http://www.mtg.se/documents/annualreportfiles/2010/en/annual%20report%202010/mtg_2010_eng_final.pdf Nokia 2010: http://i.nokia.com/blob/view/-/263824/data/1/-/Request-Nokia-in-2010-pdf.pdf 2007: http://i.nokia.com/blob/view/-/264062/data/1/-/Request-Nokia-in-2007-pdf.pdf 2004: http://i.nokia.com/blob/view/-/263666/data/1/-/Request-Nokia-in-2004-pdf.pdf Nordea 2010 http://www.nordea.com/sitemod/upload/root/www.nordea.com%20-%20uk/Investorrelations/reports/ar/Nordea_Annual_Report_2010.pdf 2007 http://www.nordea.com/sitemod/upload/root/www.nordea.com%20-%20uk/Investorrelations/reports/ar/Nordea_Annual_Report_2007.pdf

5
2004 http://www.nordea.com/sitemod/upload/root/www.nordea.com%20-%20uk/Investorrelations/reports/ar/Nordea_Annual_Report_2004.pdf 2001: http://www.nordea.com/sitemod/upload/Root/www.nordea.com%20-%20uk/Investorrelations/reports/ar/Nordea_Annual_Report_2001.pdf Pharmacia 2001 http://media.corporate-ir.net/media_files/NYS/PHA/reports/ar2001.pdf Sandvik 2010: http://www.sandvik.com/Global/Investor%20relations/Annual%20reports/Annual%20Report%202010.pdf 2007 http://www.sandvik.com/Global/Investor%20relations/Annual%20reports/Annual%20Report%202007.pdf 2004 http://www.sandvik.com/Global/Investor%20relations/Annual%20reports/Annual%20Report%202004.pdf 2001 http://www.sandvik.com/Global/Investor%20relations/Annual%20reports/Annual%20Report%202001.pdf 1998 http://www.sandvik.com/Global/Investor%20relations/Annual%20reports/Annual%20Report%201998.pdf SCA 2010 http://www.sca.com/Documents/en/Annual_Reports/SCA-Annual-Report-2010-EN.pdf 2007 http://www.sca.com/Documents/en/Annual_Reports/Annual_Report_2007_en.pdf 2004 http://www.sca.com/Documents/en/Annual_Reports/Annual_Report_2004_en.pdf 2001 http://www.sca.com/Documents/en/Annual_Reports/Annual_Report_2001_en.pdf Scania 2010: http://www.scania.com/Images/14582-Scania_ENG%2072%20indexed_240606.pdf 2007: http://www.scania.com/Images/Scania-annual-report-Eng_tcm10-199660_54421.pdf 1998: http://www.scania.com/Images/Sca98EN_tcm10-8535_54365.pdf SEB
6
2010: http://np.netpublicator.com/np/n50488567/AR_eng_2010.pdf 2007: http://np.netpublicator.com/np/n91350131/SEB_AR_2007_ENG.pdf 2004: http://hugin.info/1208/R/985886/147127.pdf 2001: http://reports.huginonline.com/909264/119837.pdf 1998: Securitas 2010 http://www.securitas.com/PageFiles/54399/AR%202010.pdf 2007 http://www.securitas.com/Global/_DotCom/Annual%20reports/AR%2007.pdf 2004 http://www.securitas.com/Global/_DotCom/Annual%20reports/AR%2004.pdf 2001 http://www.securitas.com/Global/_DotCom/Annual%20reports/AR%2001.pdf 1998 http://www.securitas.com/Global/_DotCom/Annual%20reports/AR%2098.pdf Skanska 2010 http://www.skanska.com/Global/Investors/Reports/2010/Annual%20Report/Skanska_Annual_Report_2010.pdf 2007 http://www.skanska.com/Global/Investors/Reports/2007/annual_report/skanska_annual_report_2007.pdf 2004 http://www.skanska.com/Global/Investors/Reports/2004/skanska_annual_report_2004.pdf 2001 http://www.skanska.com/Global/Investors/Reports/2001/Skanska_annual_report_2001.pdf 1998 http://www.skanska.com/Global/Investors/Reports/Arkiv/Annual_Report_1998.pdf SKF 2010 http://investors.skf.com/files/press/skf/SKF-Annual-Report-2010-english.pdf 2007 http://investors.skf.com/files/press/skf/SKF_Annualreport2007_eng.pdf 2004 http://investors.skf.com/files/press/skf/skf_en_2004new.pdf 2001 http://investors.skf.com/files/press/skf/SKF_annual2001_en.pdf 1998 http://investors.skf.com/files/press/skf/full_98.pdf
7
SSAB 2010 http://feed.ne.cision.com/wpyfs/00/00/00/00/00/14/25/66/wkr0005.pdf 2007 http://feed.ne.cision.com/wpyfs/00/00/00/00/00/0B/D4/1F/wkr0003.pdf SHB 2010 http://www.handelsbanken.se/shb/inet/icentsv.nsf/vlookuppics/investor_relations_en_hb_10_eng_ar/$file/hb10eng_medfoto.pdf 2007 http://www.handelsbanken.se/shb/inet/icentsv.nsf/vlookuppics/investor_relations_en_hb_07_eng_annual_review/$file/hb07eng_arsover.pdf 2004 http://www.handelsbanken.se/shb/inet/icentsv.nsf/vlookuppics/investor_relations_en_hb_04_eng_ar_withphoto/$file/hb04eng_medfoto.pdf 2001 http://www.handelsbanken.se/shb/inet/icentsv.nsf/vlookuppics/investor_relations_en_hb_01_eng_ar_withphoto/$file/hb01eng_medfoto.pdf 1998 http://www.handelsbanken.se/shb/INeT/ICentSv.nsf/vLookUpPics/Investor_Relations_En_HB_98_eng_ar_withoutphoto/$file/HB98eng_utanfoto.pdf Stora Enso 2004 http://web.lib.hse.fi/FI/yrityspalvelin/pdf/2004/Estoraenso2004.pdf 2001 http://web.lib.hse.fi/FI/yrityspalvelin/pdf/2001/Estoraen.pdf Swedbank 2010 http://www.swedbank.com/idc/groups/public/@i/@sbg/@gs/@ir/documents/publication/cid_208131.pdf 2007 http://www.swedbank.com/idc/groups/public/@i/@sbg/@gs/@ir/documents/financial/fa_100279.pdf 2004 http://www.swedbank.com/idc/groups/public/@i/@sbg/@gs/@ir/documents/financial/fa_100100.pdf 2001 http://www.swedbank.com/idc/groups/public/@i/@sbg/@gs/@ir/documents/financial/fa_100166.pdf 1998 http://www.swedbank.com/idc/groups/public/@i/@sbg/@gs/@ir/documents/financial/fa_100162.pdf
8
Swedish Match 2010 http://www.swedishmatch.com/Reports/Annual%20reports/2010_SwedishMatchAnnualReport_EN.pdf 2007 http://www.swedishmatch.com/Reports/Annual%20reports/2007_AnnualReport_EN.pdf 2004 http://www.swedishmatch.com/Reports/Annual%20reports/2004_AnnualReport_EN.pdf 1998 http://www.swedishmatch.com/Reports/Annual%20reports/1998_AnnualReport_EN.pdf Tele2 2010 http://www.tele2.com/files/2010-Annual_Report_Tele2_AB_publ.pdf 2007 http://www.tele2.com/files/Tele2_ENG_2007_index.pdf 2004 http://www.tele2.com/files/2004en.pdf 2001 http://www.zonebourse.com/TELE2-AB-6492175/pdf/7023/Tele2%20AB_Rapport-annuel.pdf TeliaSonera 2010 http://www.teliasonera.com/Documents/Reports/2010/AnnualReports/TeliaSonera-Annual-Report-2010-EN.pdf?epslanguage=en 2007 http://www.teliasonera.com/Documents/Reports/2007/AnnualReports/TeliaSonera-Annual-Report-2007-EN.pdf?epslanguage=en 2004 http://www.teliasonera.com/Documents/Reports/2004/AnnualReports/TeliaSonera-Annual-Report-2004-EN.pdf?epslanguage=en 2001 http://www.teliasonera.com/Documents/Reports/2001/AnnualReports/Sonera-Annual-Report-2001-FI.pdf?epslanguage=en Volvo Group 2010 http://www3.volvo.com/investors/finrep/ar10/ar_2010_eng.pdf 2007 http://www3.volvo.com/investors/finrep/ar07/annual_report_2007_eng.pdf 2004 http://www3.volvo.com/investors/finrep/ar04/fin_rep_2004_eng.pdf 2001 http://www.volvogroup.com/SiteCollectionDocuments/Volvo%20AB/media/publications/financial/annual%20reports/2001en.pdf 1998
9
http://www.volvogroup.com/SiteCollectionDocuments/Volvo%20AB/media/publications/financial/annual%20reports/1998en.pdf Vostok Gas 2007 http://www.vostokgas.se/web/vgas_ar2007_eng.pdf SHB Fondrapport (Referens till OMXS30 för 2004 och 2001) 2004 http://www.handelsbanken.se/shb/inet/icentsv.nsf/vlookuppics/a_fonder_handelsbanken_fonder_ab_-_arsrapport_2004/$file/shb_fondrapport_2004.pdf Retrieved 2012-03-26 2001 http://www.handelsbanken.se/shb/inet/icentsv.nsf/vlookuppics/a_fonder_handelsbanken_fonder_ab_-_arsrapport_2001/$file/shb_fondrapport_2001.pdf Retrieved: 2012-03-26 Wihlborgs 2004 http://www.fabege.se/Documents/ReportsAndPresentations/pdf/2004/wihlborgsannualreport2004_eng_webb.pdf WM-Data http://www.logica.com/~/media/Global%20site/investors/annual%20reports/wmdata/wm_data_01_eng.ashx
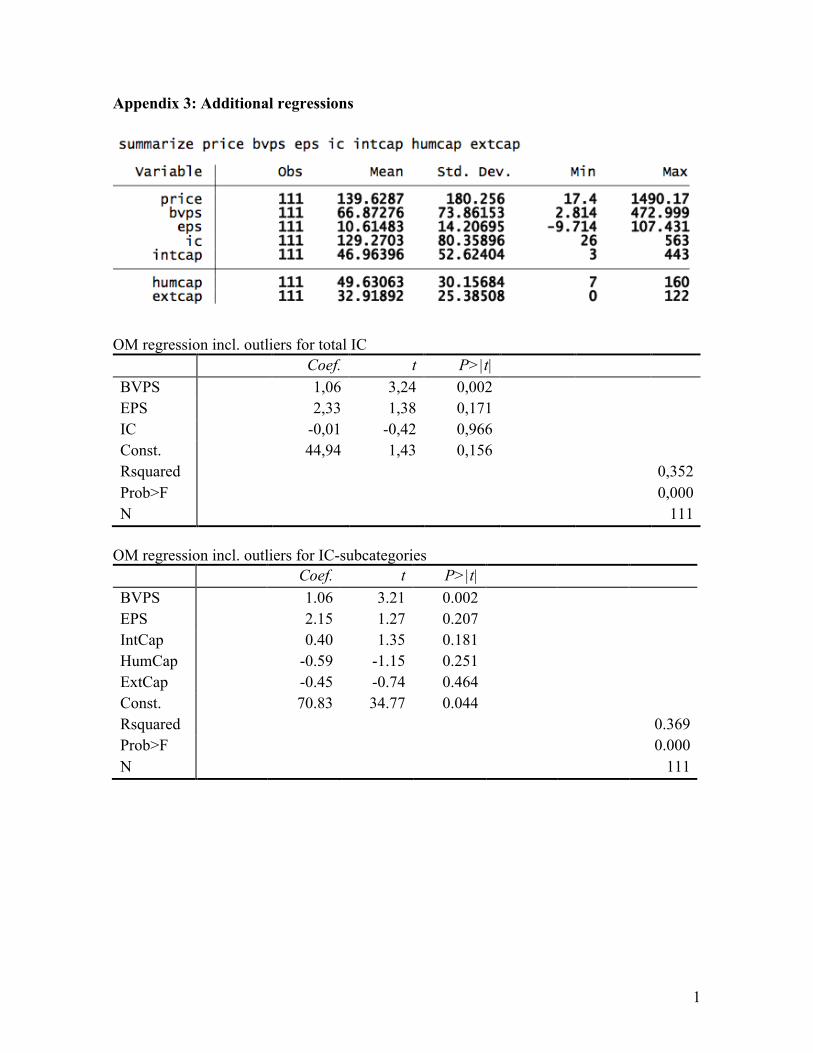
1
Appendix 3: Additional regressions
OM regression incl. outliers for total IC
Coef. t P>|t| BVPS 1,06 3,24 0,002 EPS 2,33 1,38 0,171 IC -0,01 -0,42 0,966 Const. Rsquared Prob>F N
44,94
1,43
0,156
0,352 0,000
111 OM regression incl. outliers for IC-subcategories Coef. t P>|t| BVPS 1.06 3.21 0.002 EPS 2.15 1.27 0.207 IntCap HumCap ExtCap
0.40 -0.59 -0.45
1.35 -1.15 -0.74
0.181 0.251 0.464
Const. Rsquared
70.83 34.77 0.044 0.369
Prob>F N
0.000 111

Umeå School of Business and Economics Umeå University SE-901 87 Umeå, Sweden www.usbe.umu.se