the 2020 hispanic market report
TRANSCRIPT

The 2020 Hispanic Market Report
Copyright ©2020 Claritas, LLC. Confidential and proprietary.
The New American Mainstream

EXECUTIVE SUMMARY
It is incredible to think we are three quarters of the way through 2020, one of the most challenging years our country has experienced in the last decade. A year which has been especially challenging for U.S. Hispanics who have been disproportionately impacted from a health and economic standpoint. I believe that Hispanics’ resiliency, incredible work ethic, and strong cultural connections will be key to them thriving individually and collectively as a community over the next few years.
Today, Hispanics make up 19% of the U.S. population and nearly a quarter of the youngest generational cohorts, the Millennial and Gen-Z consumers. Hispanics are by far one of the fastest-growing segments of the American population accounting for 56% of the growth over the past two decades, adding 5,170,926 people during this period. The growth trend will continue into the foreseeable future as Hispanics are projected to drive 62% of the population growth through 2025.
The economic environment this year has forced companies to adapt, many pivoting to reach consumers digitally. Hispanics, who are digital-savvy consumers, quickly adapted their way of connecting with each other and the way in which they shop. They have been strong users of social media and streaming services for several years now. We are also seeing Hispanics leverage social media to seek shopping advice. Businesses seeking to connect with Hispanics online should go beyond simply being in-language, they should also focus on being in-culture and culturally relevant.
The fact is Hispanic consumers are driving consumer spending growth in this country, and they should be associated with economic growth. Hispanics are in their prime spending years and will be major contributors of consumer spending growth for years to come. In 2020, Claritas estimates the aggregate household income of Hispanics in the U.S. totals $1.285 Trillion. Hispanics, with their increasing buying power and influence, are impacting many industries—from financial services, telecommunications, and consumer packaged goods to automotive and tech companies.
Companies that plan to reemerge and grow in 2021 would be wise to include Hispanic consumers in their strategic business growth plans. Hispanics are critical to our country’s recovery, and they will be major drivers for our growth and expansion over the next 5-10 years. Simply put, Hispanics are “Good for Business Growth”.
I hope you find value in The Hispanic American Market Report. May you have a strong finish to 2020 and ride that momentum into a successful 2021!
In Gratitude,David F. Mesas
Copyright ©2020 Claritas, LLC. Confidential and proprietary.
3Copyright ©2020 Claritas, LLC. Confidential and proprietary.
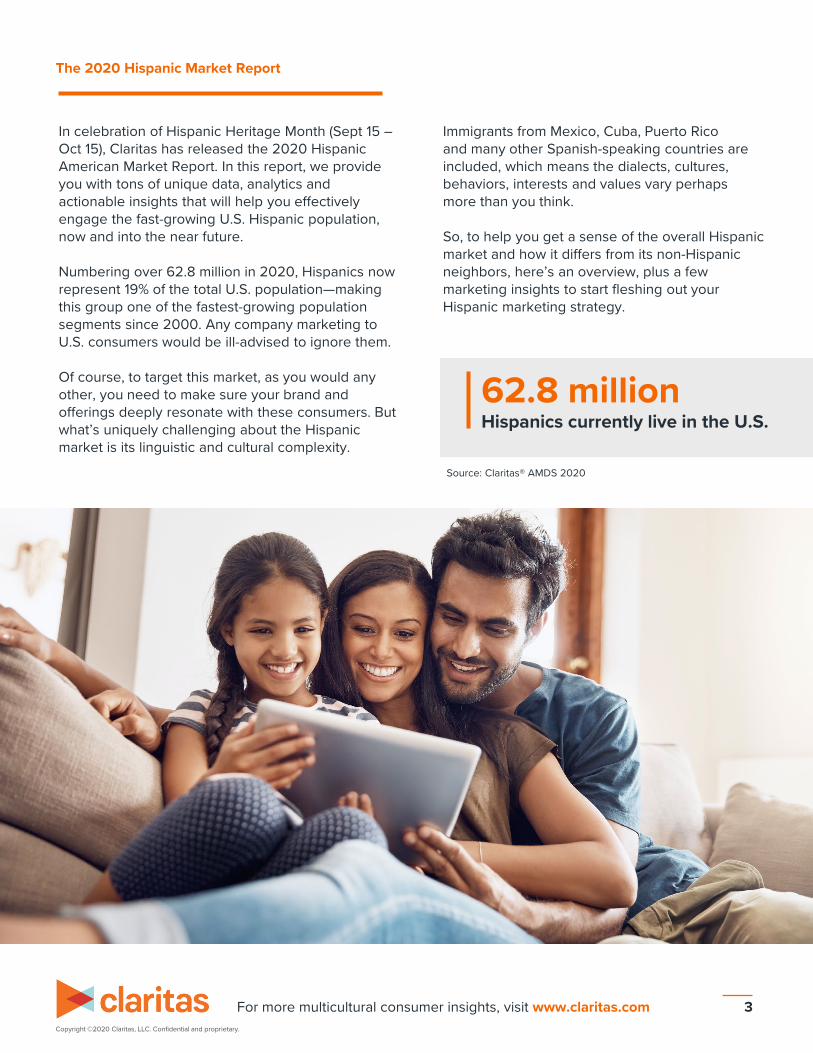
In celebration of Hispanic Heritage Month (Sept 15 –Oct 15), Claritas has released the 2020 Hispanic American Market Report. In this report, we provide you with tons of unique data, analytics and actionable insights that will help you effectively engage the fast-growing U.S. Hispanic population, now and into the near future.
Numbering over 62.8 million in 2020, Hispanics now represent 19% of the total U.S. population—making this group one of the fastest-growing population segments since 2000. Any company marketing to U.S. consumers would be ill-advised to ignore them.
Of course, to target this market, as you would any other, you need to make sure your brand and offerings deeply resonate with these consumers. But what’s uniquely challenging about the Hispanic market is its linguistic and cultural complexity.
The 2020 Hispanic Market Report
62.8 million Hispanics currently live in the U.S.
Source: Claritas® AMDS 2020
Immigrants from Mexico, Cuba, Puerto Rico and many other Spanish-speaking countries are included, which means the dialects, cultures, behaviors, interests and values vary perhaps more than you think.
So, to help you get a sense of the overall Hispanic market and how it differs from its non-Hispanic neighbors, here’s an overview, plus a few marketing insights to start fleshing out your Hispanic marketing strategy.
For more multicultural consumer insights, visit www.claritas.com

By 2025, more than 69.5 million Hispanic Americans will live in the United States.
In terms of percent of the U.S. population, Hispanics will become 20% of our nation’s population over the next 5 years. The non-Hispanic Black population will be nearly constant as a proportion of the total population, and White non-Hispanic will decline steadily as a proportion of the total U.S. population.
U.S. Hispanic 2020 Population Facts
62.6%
12.4%
6%
19.0%
37.4%
Non-Hispanic All OthersNon-Hispanic BlackNon-Hispanic Asian & Pacific IslanderHispanic
Currently, there are 134,280,015 multicultural Americans in the U.S. and they account for 37.4% of the U.S. population. Hispanics account for the largest multicultural segment at 19% and are the second fastest growing ethnic group since 2000, with 78% growth.
69%
64%59%
57%
13%16%
19% 20%
12% 12% 12% 12%
4% 5% 6% 7%
2% 3% 4% 4%
0%
10%
20%
30%
40%
50%
60%
70%
80%
2000 2010 2020 2025
Perc
enta
ges
Percent of U.S. Population: 2000-2025
N-H White Hispanic N-H Black N-H Asian & PI All Others
4Copyright ©2020 Claritas, LLC. Confidential and proprietary.
Source: Claritas® AMDS 2020
19% of the total U.S. population are Hispanic
For more multicultural consumer insights, visit www.claritas.com
The 2020 Hispanic Market Report

5
POPULATION 2000 2010 2020 2025
N-H White 194,525,198 196,791,642 195,964,867 194,670,805
Hispanic 35,303,163 50,474,297 62,872,319 69,550,841
N-H Black 33,947,580 37,684,944 40,863,783 42,568,090
N-H Asian & PI 10,470,977 14,939,805 19,730,457 22,318,141
All Others 7,082,199 8,759,861 10,813,456 11,926,315
Copyright ©2020 Claritas, LLC. Confidential and proprietary.
Between 2000 and 2020, the Hispanic population made up nearly 56% of the total growth in the U.S. On the other hand, the non-Hispanic (N-H) White population who make up 62.6% of the total population, grew at a much slower pace representing only 3% of the total growth between the years 2000-2020.
78%
1%
21%
88%
53%
17%
0%
10%
20%
30%
40%
50%
60%
70%
80%
90%
100%
Hispanic N-H White N-H Black N-H Asian/PI All Others Total
Population Growth by Percent 2000-2020
56%
3%
14%
19%
8%
Percent of Total Growth by Race/Ethnicity 2000-2020
Hispanic
N-H White
N-H Black
N-H Asian/PI
Other
These findings suggest that virtually all the growth now and into the foreseeable future will emanate from groups other than the traditional non-Hispanic White population.
Source: Claritas® AMDS 2020
Source: Claritas® AMDS 2020
Since 2000, the Hispanic population expanded from 35.3M to over 62.8M
For more multicultural consumer insights, visit www.claritas.com
The 2020 Hispanic Market Report

6Copyright ©2020 Claritas, LLC. Confidential and proprietary.
As illustrated below, virtually all the growth now and into the foreseeable future will emanate from minority race or ethnic groups. Nearly all the U.S. population growth since 2000 has come from multicultural segments, and that trend is likely to continue in the future. The Hispanic population continues to show significant growth, thus representing one of the biggest opportunities for marketers to grow their businesses in the future. The non-Hispanic White population is declining steadily as baby boomers age and fertility rates remain low.
Growth For 20 Year Period 2000 - 2020
Population Segment Population Growth
Growth During 2000-2020
% of Total Growth
Hispanic 27,569,156 78% 56%non-Hispanic White 1,439,669 1% 3%non-Hispanic Black 6,916,203 21% 14%
non-Hispanic Asian/PI 9,259,480 88% 19%
All Others 3,731,257 53% 8%
Into the Future: The Multicultural Boom 2000 - 2025
Population SegmentAverage Growth in Population 2020-2025
Year Month Day Hour
Hispanic 1,335,704 111,309 3,659 152
non-Hispanic White -258,812 -21,568 -709 -30
non-Hispanic Black 340,861 28,405 934 39
non-Hispanic Asian/PI 517,537 43,128 1,418 59
All Others 222,572 18,548 610 25 Source: Claritas® AMDS 2020
62% of the projected growth over the next 5 years will emerge from the Hispanic segment.
For more multicultural consumer insights, visit www.claritas.com
The 2020 Hispanic Market Report
7Copyright ©2020 Claritas, LLC. Confidential and proprietary.
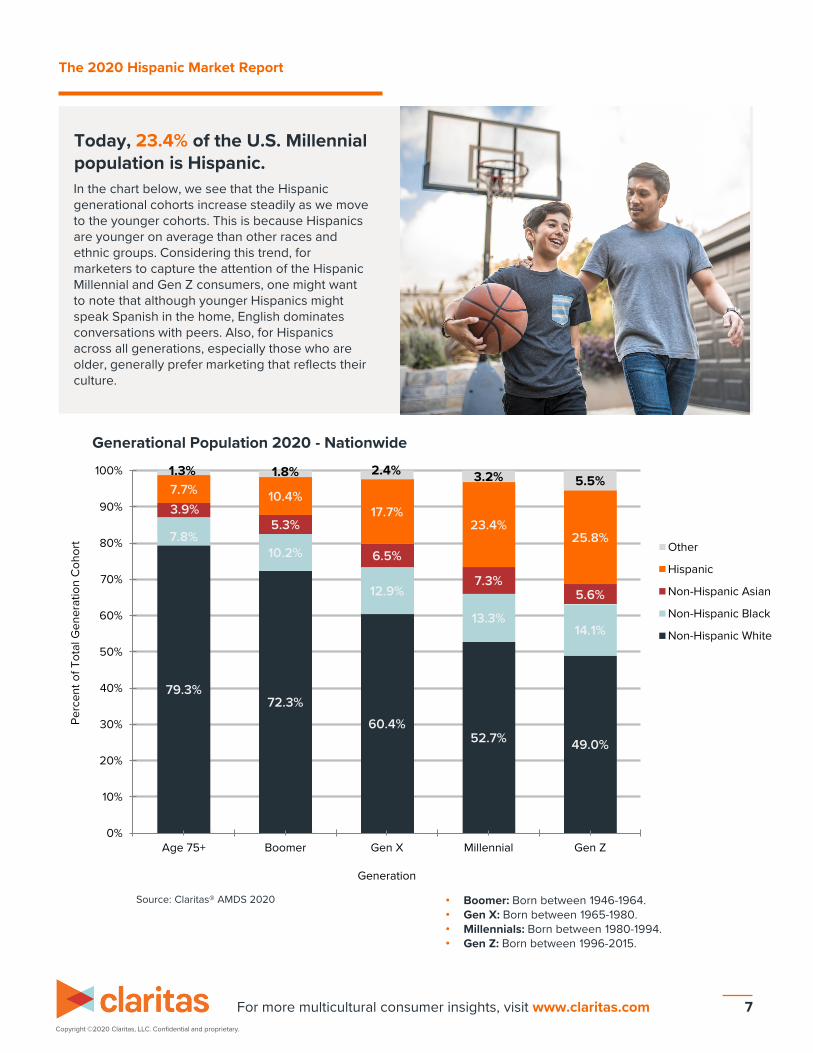
Today, 23.4% of the U.S. Millennial population is Hispanic.In the chart below, we see that the Hispanic generational cohorts increase steadily as we move to the younger cohorts. This is because Hispanics are younger on average than other races and ethnic groups. Considering this trend, for marketers to capture the attention of the Hispanic Millennial and Gen Z consumers, one might want to note that although younger Hispanics might speak Spanish in the home, English dominates conversations with peers. Also, for Hispanics across all generations, especially those who are older, generally prefer marketing that reflects their culture.
79.3%72.3%
60.4%52.7% 49.0%
7.8%10.2%
12.9%
13.3%14.1%
3.9%5.3%
6.5%
7.3%5.6%
7.7% 10.4%17.7%
23.4%25.8%
1.3% 1.8% 2.4% 3.2% 5.5%
0%
10%
20%
30%
40%
50%
60%
70%
80%
90%
100%
Age 75+ Boomer Gen X Millennial Gen Z
Perc
ent o
f Tot
al G
ener
atio
n C
ohor
t
Generation
Other
Hispanic
Non-Hispanic Asian
Non-Hispanic Black
Non-Hispanic White
Generational Population 2020 - Nationwide
Source: Claritas® AMDS 2020
For more multicultural consumer insights, visit www.claritas.com
The 2020 Hispanic Market Report
• Boomer: Born between 1946-1964. • Gen X: Born between 1965-1980. • Millennials: Born between 1980-1994. • Gen Z: Born between 1996-2015.

8Copyright ©2020 Claritas, LLC. Confidential and proprietary.
By 2025, 27% of the U.S. Gen Z population will be Hispanic. America’s Gen Z population in 2025 is expected to be very diverse, as over half of the Gen Z population will emanate from groups other than the non-Hispanic White population. These children will identify as mixed race or as part of a minority race or ethnic group. The White population will make up 47.4% of the Gen Z population in 2025, followed by 27% Hispanic, 13.9% Black, 6.2% Asian and 5.5% for multiracial and other populations.
Generational Population 2025 - Nationwide
78.9%72.2%
60.8%50.8% 47.4%
7.6%9.6%
12.8%
13.6%13.9%
4.0%5.7%
6.9%
8.1%6.2%
8.2% 10.6%17.0%
24.3%27.0%
1.4% 1.9% 2.5% 3.2% 5.5%
0%
10%
20%
30%
40%
50%
60%
70%
80%
90%
100%
Age 75+ Boomer Gen X Millennial Gen Z
Perc
ent o
f Tot
al G
ener
atio
n C
ohor
t
Generation
Other
Hispanic
Non-Hispanic Asian
Non-Hispanic Black
Non-Hispanic White
Source: Claritas® AMDS 2020
For more multicultural consumer insights, visit www.claritas.com
The 2020 Hispanic Market Report
• Boomer: Born between 1946-1964. • Gen X: Born between 1965-1980. • Millennials: Born between 1980-1994. • Gen Z: Born between 1996-2015.

Where Does the Hispanic Population Live?The Hispanic population is concentrated in Los Angeles, New York, Houston, Miami, Dallas, Chicago and San Francisco. Their presence in many other markets is growing as well, with significant growth in Phoenix, Washington, D.C., Orlando, Philadelphia and Tampa-St. Petersburg. On a percentage basis, very strong growth is seen in the southeastern DMAs.
LAN
ew York
Houston
Miam
i
Dallas
Chicago
San Francisco
Phoenix
San Antonio
Sacramento
Rio Grande
Fresno-Visalia
San Diego
Washington, D
C
Orlando
Philadelphia
Denver
Tampa-St.
Petersburg
Albuquerque-Santa
Fe
El Paso
0%
10%
20%
30%
40%
50%
60%
70%
-
1
2
3
4
5
6
7
8
9
10
% P
erce
nt
His
pani
c Ad
ults
in M
illio
ns
Hispanic Population (2020) % Growth (2010-2020)
Top 20 DMAs By Hispanic Population vs. Growth (2010-2020)
For more multicultural consumer insights, visit www.claritas.com 9Copyright ©2020 Claritas, LLC. Confidential and proprietary.
2020 U.S. Hispanic Population Distribution by DMA
Source: Claritas® AMDS 2020
Source: Claritas® AMDS 2020
The 2020 Hispanic Market Report

10Copyright ©2020 Claritas, LLC. Confidential and proprietary.
0
1
2
3
4
5
6
7
8
His
pani
c Ad
ults
in M
illio
ns
Hispanic Country of Origin 202041.6MM
Country of Origin MattersHispanics are by no means a homogeneous group. U.S. Hispanics speak many variations of the Spanish language and like many immigrant cultures, integrate traditions from their countries of origin that influence their decisions such as buying habits. So, in order to market successfully to Hispanics, you must take into consideration their country of origin.Compounding the complexity of Hispanic country of origin is that of Hispanic language preference. Over 32% of Hispanic Americans are Spanish language dependent or bi-lingual Spanish preferred. Businesses seeking to connect with Hispanics should go beyond simply being in-language, they should focus on being in-culture and culturally relevant and traditionally accurate.
Source: Claritas® AMDS 2020
For more multicultural consumer insights, visit www.claritas.com
The 2020 Hispanic Market Report

11Copyright ©2020 Claritas, LLC. Confidential and proprietary.
Retention of values and beliefs from one’s own culture
Adoption of mainstreamsociety’s values and beliefs
CultureCode® HISPANICITY™Hispanicity™ is a Claritas CultureCode® measuring the degree to which people of Hispanic heritage in the United States retain elements of their Hispanic culture, while they acquire elements of the American culture. Hispanicity can be dimensionalized by various characteristics, including country-of-origin, life stage, socioeconomic status, income, media usage and a variety of shopping behaviors.
HA1 (Americanizado)
HA2(Nueva Latina)
HA3(AmBi-Cultural)
HA4(Hispano)
HA5(Latinoamericana)
17.1% 29.5% 25.8% 15.1% 12.5%
English dominant (nearly no Spanish); Born in US; 3rd+ generation. Few Hispanic cultural practices.
English preferred (some Spanish); Born in U.S.; 2nd generation. Some Hispanic cultural practices; often “retro-acculturate”.
Bi-Lingual (equal or nearly); Immigrant as child or young adult. Many Hispanic cultural practices.
Spanish preferred (some English); Immigrant as adult; in U.S. 10+ years. Pre-dominant Hispanic cultural practices.
Spanish dominant; Recent immigrant as adult (less than 10 years ago). Primarily Hispanic cultural practices. Identify with home country more than U.S.
For more multicultural consumer insights, visit www.claritas.com
HA117%
HA229%
HA326%
HA415%
HA513%
The 2020 Hispanic Market Report
In 2020, 46% of the U.S. Hispanic population classified as being more acculturated (HA1s and HA2s).
Source: Claritas® AMDS 2020
CultureCode applications are used to segment consumers by cultural group, helping you understand preferences and usage across culturally diverse segments to realize market share gains. CultureCode segments helps you identify specific channels based on preference by cultural group; tailor stores to consumer preferences within a trade area or market; and determine the long-term potential of consumer segments by comparing growth and potential across product categories.
CultureCode® HISPANICITY™

12Copyright ©2020 Claritas, LLC. Confidential and proprietary.
19%
29%25%
15%
12%
Mexican Americans
HA1 Mexicans
HA2 Mexicans
HA3 Mexicans
HA4 Mexicans
HA5 Mexicans
16%
31%
17%
14%
22%
Cuban Americans
HA1 Cubans
HA2 Cubans
HA3 Cubans
HA4 Cubans
HA5 Cubans
Hispanicity Acculturation Segments by Country of Origin
8%
29%
29%
18%
16%
Dominican Americans
HA1 Dominicans
HA2 Dominicans
HA3 Dominicans
HA4 Dominicans
HA5 Dominicans
24%
39%
24%
9%4%
Puerto Ricans
HA1 Puerto Ricans
HA2 Puerto Ricans
HA3 Puerto Ricans
HA4 Puerto Ricans
HA5 Puerto Ricans
Country of Origin MattersMore than 63% of Puerto Ricans in the U.S. classify as more acculturated. These individuals, known as HA1s and HA2s, prefer to speak English and have few Hispanic cultural practices. On the other hand, 36% of Cubans in the U.S. classify as less acculturated. These individuals, known as HA4s and HA5s, prefer to speak Spanish and are immigrants who maintain many Hispanic cultural practices.
Source: Claritas® AMDS 2020
For more multicultural consumer insights, visit www.claritas.com
The 2020 Hispanic Market Report

13Copyright ©2020 Claritas, LLC. Confidential and proprietary.
25%
26%24%
17%
8%
Total U.S. SES 2020
13%
22%
31%
21%
13%
Total Hispanic SES 2020
SES A
SES B
SES C
SES D
SES E
For more multicultural consumer insights, visit www.claritas.com
17%
27%
32%
16%8%
HA2
18%
27%29%
16%
10%
HA1
11%
22%
34%
21%
12%
HA3
8%12%
27%27%
26%
HA5
8%17%
32%
26%
17%
HA4
Hispanicity Acculturation Segments by Socioeconomic Status
Socioeconomic Status (SES) Attributes• SES A (Upper Class) - HHs with over $85K/yr, 4-year college or graduate degree, own housing, professional occupations• SES B (Upper-Middle Class) - HHs between $50K-$120K/yr, some college or higher education, own housing, professional occupations• SES C (Middle Class) - HHs between $30K-$75K/yr, high school graduate to some college, skilled labor or service worker• SES D (Lower-Middle Class) - HHs between $15K-$35K/yr, high school or lower education, rent housing, service or labor worker• SES E (Lower Class) - HHs below $20K/yr, less than high school education; rent housing, labor or service worker or unemployed
Source: Claritas® AMDS 2020
Upper Class Upper-Middle Class Lower-Middle ClassMiddle Class Lower Class
The 2020 Hispanic Market Report

Higher education levels are strongly correlated with higher household incomes, especially for Hispanics
Hispanic households who have a post graduate degree are 9xmore likely to be in the top income bracket ($250k+ per year) than Hispanic households who only have high school diplomas. When looking at non-Hispanic White households, we see that they’re only 7x more likely within the same context.
0
100
200
300
400
< $35K $35K -$49.9K
$50K -$74.9K
$75K -$99.9K
$100K -$249.9K
> $250K
Inde
x
Hispanic HH Income by Level of Education
High school graduate Any college College graduate Post graduate
How does level of education improve earning potential for Hispanics?
The graph shows evidence that a college degree and especially a post-graduate degree significantly improves the earning potential for Hispanic households, even more so than for non-Hispanic White households. In fact, Hispanic households with a post graduate degree are 9x more likely to earn over $250,000 per year than Hispanic households that only have a high school diploma. Hispanic households with a college degree are 4x more likely to earn between $100,000 and $250,000 per year than Hispanic households that only have a high school diploma.
14Copyright ©2020 Claritas, LLC. Confidential and proprietary.
How does level of education improve earning potential for Whites?
The graph shows evidence that a college degree and especially a post graduate degree significantly improves one’s earning potential. For example, White households with a post graduate degree are 3x more likely to earn between $100,000 and $250,000 per year than their peer households who only have a high school diploma. Also, the earnings gap between college graduates and those with less education is much wider than households with college degrees and those with post graduate degrees. 0
100
200
300
400
< $35K $35K -$49.9K
$50K -$74.9K
$75K -$99.9K
$100K -$249.9K
> $250K
Inde
x
Non-Hispanic White HH Income by Level of Education
High school graduate Any college College graduate Post graduate * An index of 100 is the average for a U.S. household.
Source: Claritas® AMDS 2020
For more multicultural consumer insights, visit www.claritas.com
The 2020 Hispanic Market Report

15Copyright ©2020 Claritas, LLC. Confidential and proprietary.
Today, the aggregate household income for Hispanics is $1.285TDue to Hispanics being in their prime spending years, they are a major driving force to the economy. In fact, the annual aggregate Hispanic household spending in 2020 is projected to be $978 billion. That makes Hispanics the single largest and highest-spending minority group in the U.S. Any company marketing to U.S. consumers would be ill-advised to ignore the U.S. Hispanic community.
Source: Claritas® AMDS 2020
$66,971
$82,991
$51,640
$56,519
$69,408
Average
Asian
Black
Hispanic
White
Average Annual Household Expenditures
Source: Claritas® AMDS 2020
For more multicultural consumer insights, visit www.claritas.com
Spending at Auto Parts & Service Retailers
Hispanic households spend 15% less on vehicle services (lube, oil change) and 13% less on tune-ups. However, Hispanic households spend 18% more than the average household on motor oil and 9% more on coolant, additives, brake and transmission fluids – indicating that Hispanics are purchasing these products directly and servicing their own vehicles, rather than paying a service provider. This makes Hispanics an excellent target group for automotive aftermarket retailers. 80
90
100
110
120
Motor Oil Coolant,Additives, Brake& Transmission
Fluids
Lube & OilChange
Motor Tune-Up
Inde
xAverage Spending
Per Hispanic Household
Auto ProductsAuto Services
0
100
200
300
400
500
600
HA1 HA2 HA3 HA4 HA5
Inde
x
Grocery Stores Visited By Hispanicity
Whole Foods Market Costco Wholesale Walmart
Food 4 Less Publix
Spending at Grocery Stores
When looking at grocery stores, Hispanics index the highest for bargain shopping at Food 4 Less. Also, the more accultured tend to shop at Costco and Whole Foods, but the less acculturated tend to shop at Publix.
The 2020 Hispanic Market Report

16Copyright ©2020 Claritas, LLC. Confidential and proprietary.
Hispanics seek out exclusive offers, coupons and discounts online via deal sites and social media.
When looking at internet sites visited/apps used in the past 30 days, we see that Hispanics indexed highest for Craigslist, eBay, Coupons.com, Groupon and RetailMeNot. This suggests that Hispanic consumers prefer to seek out exclusive offers, coupons and discounts online via bargain sites. In fact, Hispanic Millennials are 19% more likely than Gen X Hispanics to use their mobile device to find coupons online. Not only do Hispanics like visiting sites that offer discounted products, Hispanics also tend to visit social media sites to find additional exclusive offers, coupons and discounts. When considering these facts, it would be wise to launch marketing campaigns to Hispanics that incorporate exclusive offers within the messaging.
129114
104
77
0
20
40
60
80
100
120
140
0
1
2
3
4
5
6
7
8
Veryimportant
Somewhatimportant
Not veryimportant
Not at allimportant
Inde
x
His
pani
c Ad
ults
in M
illio
ns
I visit or use social media sites to receive exclusive offers, coupons or other discounts
Hispanic (Counts) Hispanic (Index)
Hispanics are 41% more likely to connect with brands through social media and they are using it for more than entertainment.
When looking at the major social media sites, we see that Hispanics index highest for Facebook, Instagram and Snapchat. Hispanics turn to these sites not only to be entertained, but to be informed and educated. For example, when looking at reasons why Hispanics visit social media, we see that they are 25% more likely to visit a social media site to review products or services and Hispanic Millennials are 46% more likely. When considering these facts, businesses may want to consider updating their products and services section on their social media profiles to best connect, inform and educate Hispanics about their offerings and maximize their potential to steer traffic to their website.
141 137
9684
020406080100120140160
02468
1012141618
Agreemostly
Agreesomewhat
Disagreesomewhat
Disagreemostly
Inde
x
His
pani
c Ad
ults
in M
illio
ns
I like to connect with brands through social-networking sites
Hispanic (Counts) Hispanic (Index)
Hispanics are a digital-savvy group, who increasingly embrace mobile and social media platforms. They are also far more receptive to mobile advertising compared to the general population. Ignoring the needs of Hispanics, particularly Hispanic Millennials means missing out on an enormous audience (by far the fastest-growing segment of the population).
Source: Claritas® AMDS 2020
For more multicultural consumer insights, visit www.claritas.com
The 2020 Hispanic Market Report

17Copyright ©2020 Claritas, LLC. Confidential and proprietary.
In terms of TV preferences, we see that Hispanics who have not yet adopted the American mainstream culture and who have retained their own culture (H4-HA5) prefer to watch Telemundo and Univision. When comparing Telemundo vs. Univision, we see that HA1 through HA4 individuals prefer to watch Telemundo and HA5 individuals prefer to watch Univision.
0
200
400
600
800
1000
1200
HA1 HA2 HA3 HA4 HA5
Inde
x
TV Preferences By Hispanicity
Comedy Channel MTV TV Boxing Telemundo Univision
134 128
100
81
020406080100120140160
02468
10121416
Agree completely Agree somewhat Disagreesomewhat
Disagreecompletely
Inde
x
His
pani
c Ad
ults
in M
illio
ns
I am interested in watching live TV on my cell phone
Hispanic (Counts) Hispanic (Index)
Smartphones have become more ubiquitous than ever before. Smartphones now let you do more than steal quick glances at social media. Digital video streaming is on the rise, and more viewers have cut the cord completely, replacing traditional TV watching for streaming platforms, such as Netflix, Amazon, Hulu, Apple and now Disney+.
Hispanics are spending less time watching traditional TV and are now using streamingapps via their mobile devices.
Hispanics are 17% more likely than average to view the internet as their main source of entertainment and 16% more likely than average to think of their mobile phone as a source of entertainment. The top ways Hispanics used the internet in the past 30 days on their smartphone include listening to internet radio, watching or downloading movies, social networking and to watch TV programs using online subscriptions. In fact, Hispanics are 34% more likely than average to watch live TV on their mobile phone, 18% more likely than average to stream digital video via Amazon Prime, and 14% more likely to stream via Netflix. With such a significant proportion of Hispanics in the U.S. streaming content online, these platforms have become a viable channel to reach Hispanic consumers.
118
110
114
112
106108110112114116118120
02468
101214
AmazonPrime
Hulu Netflix YouTube
Inde
x
His
pani
c Ad
ults
(18-
34) i
n M
illio
ns
Streaming services used by Hispanics (Ages 18-34)
Hispanics (Counts) Hispanics (Index)
Source: Claritas® AMDS 2020
For more multicultural consumer insights, visit www.claritas.com
The 2020 Hispanic Market Report

Online Purchasing BehaviorsHispanics view the internet as a great way to make purchases. Beyond the online purchasing data illustrated below, in our research, we discovered that Hispanic Millennials are 41% more likely than the average Millennial to buy pet supplies online and44% more likely than the average Millennial to buy flowers online. For some categories, Hispanics perform their due diligenceonline to an even greater degree. For example, Hispanics are 12% more likely to do research online before buying technology products or electronics. They are also 15% more likely to read reviews before buying technology products or electronics and are 37% more likely to be the first of their friends to try new technology products. Below are the items bought on the internet by Hispanics over the past 12 months.
9581
96 8998 105
90108 107
97109 108 102
11796 94 93 89 96
108 103119
0
20
40
60
80
100
120
140
02468
1012141618
Inde
x
His
pani
c Ad
ults
in M
illio
ns
Items bought on the Internet past 12 months
Hispanic (Counts) Hispanic (Index)
18Copyright ©2020 Claritas, LLC. Confidential and proprietary.
109 111 113 117 119 121 121 122 124 128 128 139 146 155 155
020406080100120140160180
02468
1012141618
20
Inde
x
His
pani
c Ad
ults
in M
illio
ns
Ways used Internet/apps in past 30 days on smartphone
Hispanics (Counts) Hispanics (Index)
Source: Claritas® AMDS 2020
For more multicultural consumer insights, visit www.claritas.com
The 2020 Hispanic Market Report
19Copyright ©2020 Claritas, LLC. Confidential and proprietary.
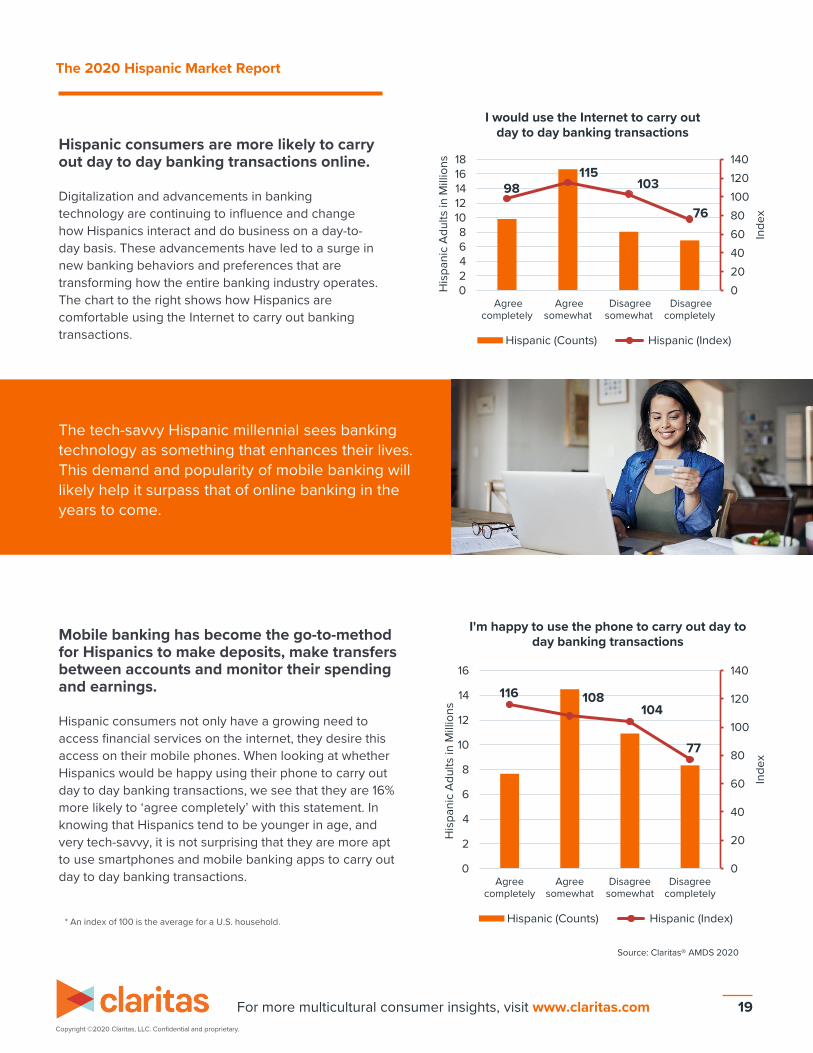
Mobile banking has become the go-to-method for Hispanics to make deposits, make transfers between accounts and monitor their spending and earnings.
Hispanic consumers not only have a growing need to access financial services on the internet, they desire this access on their mobile phones. When looking at whether Hispanics would be happy using their phone to carry out day to day banking transactions, we see that they are 16% more likely to ‘agree completely’ with this statement. In knowing that Hispanics tend to be younger in age, and very tech-savvy, it is not surprising that they are more apt to use smartphones and mobile banking apps to carry out day to day banking transactions.
* An index of 100 is the average for a U.S. household.
Hispanic consumers are more likely to carry out day to day banking transactions online.
Digitalization and advancements in banking technology are continuing to influence and change how Hispanics interact and do business on a day-to-day basis. These advancements have led to a surge in new banking behaviors and preferences that are transforming how the entire banking industry operates. The chart to the right shows how Hispanics are comfortable using the Internet to carry out banking transactions.
The tech-savvy Hispanic millennial sees banking technology as something that enhances their lives. This demand and popularity of mobile banking will likely help it surpass that of online banking in the years to come.
98115
103
76
020406080100120140
02468
1012141618
Agreecompletely
Agreesomewhat
Disagreesomewhat
Disagreecompletely
Inde
x
His
pani
c Ad
ults
in M
illio
ns
I would use the Internet to carry out day to day banking transactions
Hispanic (Counts) Hispanic (Index)
116 108104
77
0
20
40
60
80
100
120
140
0
2
4
6
8
10
12
14
16
Agreecompletely
Agreesomewhat
Disagreesomewhat
Disagreecompletely
Inde
x
His
pani
c Ad
ults
in M
illio
ns
I'm happy to use the phone to carry out day to day banking transactions
Hispanic (Counts) Hispanic (Index)
Source: Claritas® AMDS 2020
For more multicultural consumer insights, visit www.claritas.com
The 2020 Hispanic Market Report

20Copyright ©2020 Claritas, LLC. Confidential and proprietary.
0
20
40
60
80
100
120
140
160
Asian Black Hispanic White
Inde
x
“When I find a brand I like, I stick to it”
Agree Mostly
Agree somewhat
Disagree somewhat
Disagree Mostly
In general, Hispanics are less loyal to brands than other ethnic groups, but the older and least acculturated Hispanics are far more loyal than younger bicultural and acculturated U.S. Hispanics. This shows that age and acculturation levels play an important role for brand loyalty and that the Hispanic market is not as homogeneous as some marketers may think.
Hispanic consumers in general show less brand loyalty than White and Asian ethnic groups.
0
25
50
75
100
125
18 - 20 21 - 24 25 - 29 30 - 34 35 - 39 40 - 44 45 - 49 50 - 54 55 - 59 60 - 64 65 - 69 70 +
Inde
x
Age
“When I find a brand I like, I stick to it” (Hispanic Consumers)
Agree Mostly
Disagree mostly
Hispanic consumers age 45+ are more likely to be loyal to a brand than younger Hispanic consumers.
Source: Claritas® AMDS 2020
For more multicultural consumer insights, visit www.claritas.com
The 2020 Hispanic Market Report
21Copyright ©2020 Claritas, LLC. Confidential and proprietary.
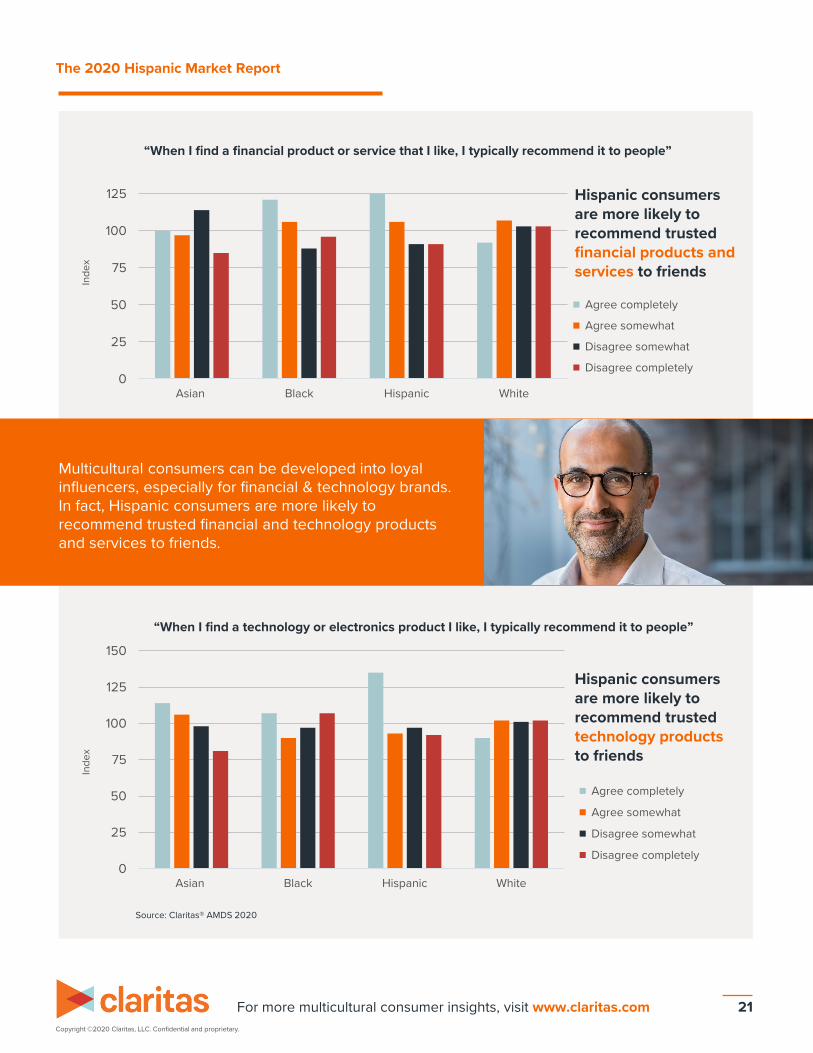
Multicultural consumers can be developed into loyal influencers, especially for financial & technology brands. In fact, Hispanic consumers are more likely to recommend trusted financial and technology products and services to friends.
0
25
50
75
100
125
Asian Black Hispanic White
Inde
x
“When I find a financial product or service that I like, I typically recommend it to people”
Agree completely
Agree somewhat
Disagree somewhat
Disagree completely
Hispanic consumers are more likely to recommend trusted financial products and services to friends
0
25
50
75
100
125
150
Asian Black Hispanic White
Inde
x
“When I find a technology or electronics product I like, I typically recommend it to people”
Agree completely
Agree somewhat
Disagree somewhat
Disagree completely
Hispanic consumers are more likely to recommend trusted technology products to friends
Source: Claritas® AMDS 2020
For more multicultural consumer insights, visit www.claritas.com
The 2020 Hispanic Market Report
22
About ClaritasClaritas is a data-driven marketing company. With over 10,000 highly-predictive demographic and behavioral indicators and the most comprehensive multicultural data, our proprietary data assets give marketers the most complete understanding of the American consumer.
Our industry-leading Identity Graph unifies data from multiple sources, connecting devices to online behavior in a privacy compliant manner and into the intelligence you need to execute seamless multichannel engagements.
Our multichannel execution solutions coupled with powerful analytics and modeling capabilities will make your marketing more effective and increase the ROI on every dollar.
Targeting the New American Mainstream (AMDS) Consumer
To capture multicultural growth opportunities, you must first understand them: their likes, dislikes, preferences, behaviors, etc. These insights let you create personas, tailor messages and promotions specific to their wants and needs. Marketers leverage Claritas’ deep understanding of multicultural segments, using our various solutions across local, national and digital markets for smarter targeting, smarter planning and smarter buying to help drive bigger profits.
To learn more about how to find and win your next multicultural consumer, visit www.claritas.com or call 800.234.5973
Multicultural Insights to Shape a Smarter Plan
Data from Claritas can be applied to a wide variety of situations and challenges. Some of the applications are listed below.
• Strategic Planning• Market Potential Assessment• Product Development & Positioning• Database Mining & Modeling• Retail Site Selection & Distribution• Marketing Communications & Media Planning• Promotions & Direct Response• Market Research: Surveys, Focus Groups, etc.• Industry Specific Intelligence Applications• Sales Potential & Forecasting• Consumer Segmentation & Targeting• Customer Relationship Management• Investment Valuation• Public & Social Services• Budget Allocation• Staffing• In-store Experience Management• Retail Shelf-space Planning
Copyright ©2020 Claritas, LLC. Confidential and proprietary.