the 2018 state of women-owned businesses report · the state of women-owned businesses, 2018 33...
TRANSCRIPT

THE 2018
STATE OF WOMEN-OWNED BUSINESSES REPORT Commissioned by American Express
Summary of Key Trends
22The State of Women-Owned Businesses, 2018
IDEAS FOR BUSINESSES ARE EVERYWHERE
Entrepreneurs solve problems, transform the way we do things, create jobs, spur
economic growth and drive prosperity. Yet there is a significant gap between the
number of women who start businesses and those who commit to growing them.
Women are increasingly harnessing their entrepreneurial spirit and it is critical to
encourage and support this behavior, eliminate obstacles, and facilitate growth of their
businesses. Unlocking the potential of women-owned businesses represents a powerful
opportunity for economic growth.
What gets measured gets managed. To better understand the dimensions that drive
the entrepreneurial process, American Express has for the past eight years provided
annual updates on a variety of sociodemographic characteristics that influence overall
movement of the women-owned business sector. Some of these characteristics
relate to the business owner, such as her race/ethnicity and motivations for starting
the business, while others relate to the company, such as industry, firm size, and the
geographical region in which the business is located.
The State of Women-Owned Businesses reports are used by the women’s enterprise
development community — media, funders, entrepreneurial support organizations,
elected officials, suppliers and customers and even women themselves–to inform
practices, policies and advocacy efforts that encourage successful business outcomes,
as well as to inspire and motivate women to start and grow businesses.
The projections in this report use the most recent (2012) Survey of Business Owners
data from the U.S. Census Bureau as their foundation. Numbers are then adjusted for
each year by the annual gross domestic product estimates as of January of the current
year at the national, state and metropolitan levels and by industry.
To provide a historical view of women’s business ownership, the report compares some
topline numbers from 2018 with numbers from 1972 — the first time the U.S. Census
Bureau provided data on minority- and women-owned businesses and around the
time baby boomers began reaching the age at which they might start a business. To
observe how women-owned businesses changed from the recession to now, 2007 was
compared to 2018.
American Express hopes the report will continue to serve key players within the women’s advocacy arena with data on changing business conditions and will identify opportunities for accelerated growth, as well as acknowledge and celebrate women’s progress and identify where they still struggle.
The data in the 2018 State of Women-Owned Businesses report is part of an ongoing annual measurement of business trends.
The 2018 State of Women-Owned
Businesses report examines the
periods 2007, 2012, 2017 and 2018,
looking at trends in the number of
firms, employment, and revenue by
various groupings.
Nationally
Race and ethnicity
Industry
Company size
State
Top 50 metropolitan areas
Age of the business owners (for the first time)
Introduction

33The State of Women-Owned Businesses, 2018
ANALYSIS OF OVERALL BUSINESS OWNERSHIP,
EMPLOYMENT AND REVENUES
This report focuses on women-owned businesses, which
are defined as businesses that are at least 51% owned,
operated, and controlled by one or more females. Over the
past 46 years, women of all ages have become business
owners in droves - from baby boomers and Gen Xers to
millennials and younger generations.
The number of women-owned businesses increased a
dramatic 31 times between 1972 and 2018, rising from
402,000 (4.6% of all firms) in 1972 to 12.3 million (40%
of all firms) in 2018. Employment surged from 230,000
to 9.2 million, growing 40-fold. Revenues rose from $8.1
billion (representing 0.3% of all firms revenue) in 1972
to $1.8 trillion (4.3% of total firms revenue) in 2018 — a
breathtaking multiple of 217.
In-depth analysis of the period 2007-2018 showed
that overall growth in women-owned businesses has
continued unabated for the last 11 years:
• The number of women-owned businesses surged 58%, while all businesses increased only 12%.
• Total employment by women-owned businesses rose 21%, while for all businesses it declined 0.8%.
• Total revenue of women-owned businesses jumped 46%, while revenue for all businesses increased 36%.
In the meantime, while the number of all firms increased
by 1.0% annually between 2007 and 2018, the number
of women-owned businesses grew 4.2% each year.
There was an uptick in the annual growth rate for the
most recent year: 6% for women-owned firms and 1.6%
for all firms.
Four out of every 10 businesses (40%) in the United
States are now women-owned. These businesses
employ 8% of the total private sector workforce and
contribute 4.3% of total revenues. The combination of
women-owned businesses and firms equally owned by
men and women — 14,622,700 — account for 48% of
all businesses. These firms employ 16,155,900 people
or 14% of the workforce and generate $3.1 trillion or
7% of revenues.
National Trends
Women-owned Firms
All Firms
Number of Firms Employment Revenues
58%21%
46%
-0.8%
12%
36%
2007-2018 GROWTH RATES FORWOMEN-OWNED BUSINESSES VS. ALL FIRMS
Overall Growth2007-2018
Women-Owned firms All firms
58%
12%
TRENDS IN THE GROWTH RATE OF THE NUMBER OF WOMEN-OWNED BUSINESSES VS. ALL FIRMS
Annual Growth2007-2018
4.2% 1.0%
2017-2018
6% 1.6%

44The State of Women-Owned Businesses, 2018
The ratio of women-owned businesses to total businesses in the U.S. increased much faster than their proportion of employment and revenue growth increased during the past 11 years. While the share of women-owned businesses leapt from 29% in 2007 to 40% in 2018, the proportion of total employment and revenues crept up by only a few percentage points. Over this period, total employment increased from 6% to 8% and total revenues increased from 4.0% to 4.3%.
NUMBER OF NET NEW WOMEN-OWNED BUSINESSES1 PER DAY
There were 1,821 net new women-owned business added per day between 2017 and 2018. This is higher than during the prerecession period between 2002 and 2007 (714), the recession and recovery period between 2007 and 2012 (1,143), and the post-recession period between 2012 and 2017 (952).
A combination of necessity entrepreneurship and opportunity entrepreneurship is driving the high 2017-2018 net new number. A necessity entrepreneur is an individual who cannot find quality employment or is unemployed and whose only viable employment option is to start a business. These businesses tend to be smaller than those started by opportunity entrepreneurs,2 which target a market opportunity.
Necessity entrepreneurs typically return to the workforce when the economy improves. With the increasing wealth gap, especially among women of color, clearly women need these businesses to supplement their income.
More opportunity entrepreneurs also enter the market as the economy improves.
ANALYSIS OF BUSINESS OWNER DEMOGRAPHICS
Trends in Racial/Ethnic Diversity
The Rise of Entrepreneurship Among Minority Women
From 2007 to 2018, higher unemployment rates, long-term unemployment and a much greater gender and racial pay gap led women of color to start businesses at a higher rate out of necessity and the need to survive, rather than a desire to seize a market opportunity. Necessity entrepreneurship is countercyclical in relation to peak economic cycles. This means that when job creation is higher, necessity entrepreneurs are more likely to be employed.
However, the numbers reveal that an improving economy did not affect all groups equally. Even as the economy improved, the rate at which women of color started or stuck with businesses remained high. This represents a combination of entrepreneurship based both on necessity and rebounding opportunity.
2007
29%
6%
WOMEN-OWNED BUSINESSES’ SHARE OF ALL FIRMS BY FIRMS, EMPLOYMENT, AND REVENUES
4.0%
39%
8%4.2%
40%
8% 4.3%
2017 2018
Firms Employment Revenue
2002-2007Prerecession
2007-2012Recession & Recovery
714
A COMPARISON OF NET NEW WOMEN-OWNED BUSINESSES3 ADDED PER DAY BY TIME PERIOD
1,143
952
1,821
2017-20182012-2017
National Trends
1. “Net new” takes into account the number of firm births minus firm deaths or changes in ownership resulting in the loss of women-owned status.
2. “Including People of Color in the Promise of Entrepreneurship,” Ewing Marion Kauffman Foundation, Entrepreneurship Policy Digest, December 2016, accessed May 31, 2017,
http://www.kauffman.org/what-we-do/resources/entrepreneurshippolicy- digest/including-people-of-color-in-the-promise-ofentrepreneurship
3. “Net new” takes into account the number of firm births minus firm deaths or changes in ownership resulting in the loss of women-owned status.
55The State of Women-Owned Businesses, 2018
CURRENT NUMBERS FOR FIRMS OWNED
BY WOMEN OF COLOR
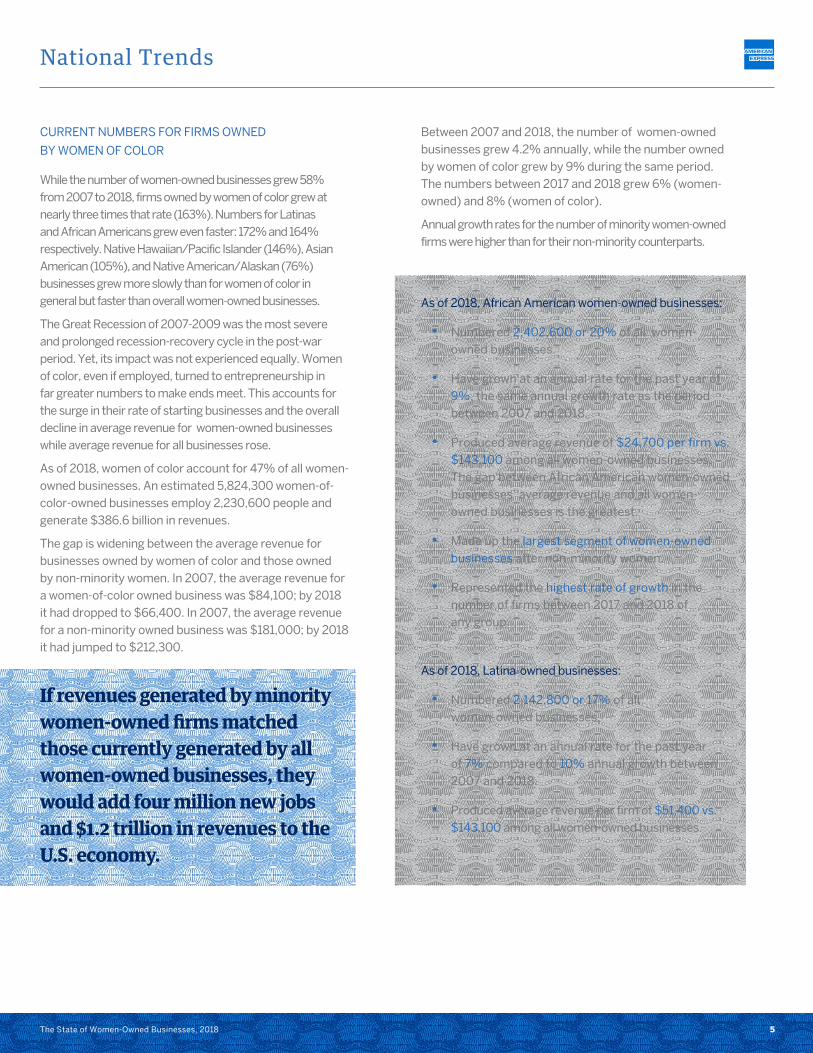
While the number of women-owned businesses grew 58% from 2007 to 2018, firms owned by women of color grew at nearly three times that rate (163%). Numbers for Latinas and African Americans grew even faster: 172% and 164% respectively. Native Hawaiian/Pacific Islander (146%), Asian American (105%), and Native American/Alaskan (76%) businesses grew more slowly than for women of color in general but faster than overall women-owned businesses.
The Great Recession of 2007-2009 was the most severe and prolonged recession-recovery cycle in the post-war period. Yet, its impact was not experienced equally. Women of color, even if employed, turned to entrepreneurship in far greater numbers to make ends meet. This accounts for the surge in their rate of starting businesses and the overall decline in average revenue for women-owned businesses while average revenue for all businesses rose.
As of 2018, women of color account for 47% of all women-owned businesses. An estimated 5,824,300 women-of-color-owned businesses employ 2,230,600 people and generate $386.6 billion in revenues.
The gap is widening between the average revenue for businesses owned by women of color and those owned by non-minority women. In 2007, the average revenue for a women-of-color owned business was $84,100; by 2018 it had dropped to $66,400. In 2007, the average revenue for a non-minority owned business was $181,000; by 2018 it had jumped to $212,300.
If revenues generated by minority women-owned firms matched those currently generated by all women-owned businesses, they would add four million new jobs and $1.2 trillion in revenues to the U.S. economy.
Between 2007 and 2018, the number of women-owned businesses grew 4.2% annually, while the number owned by women of color grew by 9% during the same period. The numbers between 2017 and 2018 grew 6% (women-owned) and 8% (women of color).
Annual growth rates for the number of minority women-owned firms were higher than for their non-minority counterparts.
As of 2018, African American women-owned businesses:
• Numbered 2,402,600 or 20% of all women-owned businesses.
• Have grown at an annual rate for the past year of 9%, the same annual growth rate as the period between 2007 and 2018.
• Produced average revenue of $24,700 per firm vs. $143,100 among all women-owned businesses. The gap between African American women-owned businesses’ average revenue and all women-owned businesses is the greatest.
• Made up the largest segment of women-owned businesses after non-minority women.
• Represented the highest rate of growth in the number of firms between 2017 and 2018 of any group.
As of 2018, Latina-owned businesses:
• Numbered 2,142,800 or 17% of all women-owned businesses.
• Have grown at an annual rate for the past year of 7% compared to 10% annual growth between 2007 and 2018.
• Produced average revenue per firm of $51,400 vs. $143,100 among all women-owned businesses.
National Trends

66The State of Women-Owned Businesses, 2018
As of 2018, Asian American women-owned businesses:
• Numbered 1,072,600 or 9% of all women-owned businesses.
• Have grown at an annual rate for the past year of — 7% — the same as the rate over the past 11 years.
• Produced average revenues per firm of $189,200 vs. $143,100 among all women-owned businesses, representing the highest number for any racial/ethnic group.
As of 2018, Native American/Alaska Native
women-owned businesses:
• Numbered 169,500 or 1.4% of all women-owned businesses.
• Have grown at an annual rate for the past year of 5%, the same as the rate between 2007 and 2018.
• Produced average revenue per firm of $68,600 vs. $143,100 among all women-owned businesses.
As of 2017, Native Hawaiian/Pacific Islander women-
owned businesses:
• Numbered 36,800 or 0.3% of all women-owned businesses.
• Have grown at an annual rate for the past year of 8% compared to 9% annual growth between 2007 and 2018.
• Produced average revenue per firm of $70,600 vs. $143,100 among all women-owned businesses.
Number of Net New Women-Owned Businesses4
Over the past 11 years, women-owned businesses
increased in number by 4.5 million. Women of color own
a majority — 64% or 1,162 — of the new women-owned
businesses launched each day, compared to only 659 non-
minority-owned businesses. African American women-
owned businesses increased per day by 541, Latina-owned
firms by 401, Asian American women-owned businesses
by 191, Native American/Alaska Native women-owned
businesses by 22, and Native Hawaiian/Pacific Islander
women-owned businesses by seven.
National Trends
Race/Ethnicity
All women-owned firms
All minority-owned
African American
Asian American
Latina
Native American/Alaska Native
Native Hawaiian/Pacific Islander
Non-minority
Number of Firms
1,821
1,162
541
191
401
22
7
659
NET NEW WOMEN-OWNED BUSINESSES5 PER DAY BY RACE/ETHNICITY 2017-2018
4. IBID.
5. IBID.

77The State of Women-Owned Businesses, 2018
National Trends
All women-owned firms
All minority-owned
African American
Asian American
Latina
Native American/Alaska Native
Native Hawaiian/Pacific Islander
Non-minority
Race/Ethnicity 2018 Number % Chg2007-2018
% Chg2017-2018
Share of All Women-Owned Businesses
Annual % Chg2007-2018
12,280,248
5,824,301
2,402,643
1,072,586
2,142,816
169,470
36,787
6,455,947
57.6%
163.2%
163.5%
105.1%
172.0%
75.5%
145.9%
16.0%
4.2%
9.2%
9.2%
6.7%
9.5%
5.2%
8.5%
1.4%
5.7%
7.9%
8.9%
7.0%
7.3%
4.9%
7.6%
3.9%
100%
47%
20%
9%
17%
1.4%
0.3%
53%
TRENDS IN NUMBER OF FIRMS, EMPLOYMENT AND REVENUES FOR WOMEN-OWNED BUSINESSES BY RACIAL/ETHNIC GROUP
Number of Firms
All women-owned firms
All minority-owned
African American
Asian American
Latina
Native American/Alaska Native
Native Hawaiian/Pacific Islander
Non-minority
Race/Ethnicity 2018 Number % Chg2007-2018
% Chg2017-2018
Avg # of Employees*
Addtl Empl ifEmply at Parity**
Annual % Chg2007-2018
9,184,488
2,230,559
420,012
1,093,032
634,233
62,840
20,443
6,953,928
21.2%
84.2%
71.1%
94.8%
74.5%
19.8%
69.3%
10.7%
1.8%
5.7%
5.0%
6.3%
5.2%
1.7%
4.9%
0.9%
2.2%
5.9%
5.4%
5.9%
5.8%
2.5%
38.1%
1.1%
0.7
0.4
0.2
1.0
0.3
0.4
0.6
1.1
$4,043,002
$2,167,960
$62,288
$1,673,870
$119,703
$19,181
Employment
All women-owned firms
All minority-owned
African American
Asian American
Latina
Native American/Alaska Native
Native Hawaiian/Pacific Islander
Non-minority
Race/Ethnicity 2018 Number % Chg2007-2018
% Chg2017-2018
Avg Rev PerFirm (000)
Addtl Rev if Rev atParity (000)***
Annual % Chg2007-2018
$1,757,210,058
$386,565,558
$59,305,016
$202,947,209
$110,092,927
$11,623,228
$2,597,179
$1,370,644,500
46.2%
107.6%
61.1%
131.5%
97.8%
31.2%
72.1%
36.0%
3.5%
6.9%
4.4%
7.9%
6.4%
2.5%
5.1%
2.8%
5.6%
7.2%
6.6%
7.9%
6.5%
4.8%
6.3%
5.2%
$143.1
$66.4
$24.7
$189.2
$51.4
$68.6
$70.6
$212.3
$1,236,155,026,836
$510,039,309,296
$227,514,800,306
$454,825,278,194
$35,968,180,416
$7,807,458,624
Revenues
* Other than owner
** Employment numbers were calculated as follows: Average employment of all women-owned firms x Number of women-owned firms in a specific group = Number of employees that women-owned firms in a specific group would employ if they reached average employment of all women-owned firms. Number of employees that women-owned firms in a specific group would employ - Number of employees that women-owned firms already employ = Additional employment.
*** Revenues were calculated as follows: Average revenues for all women-owned firms x Number of women-owned firms in a specific group = Revenues that group of women firms would have if they reached average revenues of all women-owned firms. Revenues that women-owned firms in a specific group would have - Revenues that group of women-owned firms already have = Additional revenues.

88The State of Women-Owned Businesses, 2018
AGE-RELATED TRENDS AMONG WOMEN BUSINESS OWNERS
Analysis by Age Group
Common perception suggests entrepreneurs start their
companies in their 20s. The reality is that successful
entrepreneurs generally start their businesses later, once
they have accumulated business experience, connections,
and financial capital.
Nearly half of women business owners are between the
ages of 45 and 65 (48%) and two thirds (67%) are 45 or
older. This reflects an aging population that wants to — or
must — work longer, or has faced age-related workplace
barriers. The next largest age group of women business
owners is ages 25-44. Nearly one in three women business
owners (31%) are between the ages of 25 and 44.
Analysis of Race and Ethnicity by Age and Generation
Distinctive trends emerge when racial and ethnic groups are
analyzed by generations. The report uses the age breaks in
the Census that come closest to representing the different
generations: under 35 (millennials and younger), 35 to 54
(Gen Xers), and 55-plus (baby boomers).
• African American women business owners tend to
be younger: four out of ten (39%) were millennials
and younger. Higher barriers to advancement in
the traditional workforce may lead them to more
often step out on their own at a younger age.
• Gen Xers (ages 35 to 54) represented the highest
concentration of Latina business owners (53%).
• Gen X also represented the highest concentration of
Asian American women-business owners (54%).
• Native American/Alaska Native business owners
were more likely to be older, between the ages of
45 and 64 (47%).
• Native Hawaiian/Pacific Islander women business
owners were more evenly divided between age
categories ranging from 25 to 54 (70%).
• Baby boomers had the highest proportion of
non-minority women business owners. Whether
because they could not find a job, wanted
meaningful work or wanted to supplement their
retirement savings, non-minority women in their
50s and 60s increasingly own businesses.
National Trends
Under 25
25-34
35-44
45-54
55-64
65 or over
2.4%
13.1%
17.7%
21.7%
26.1%
19.0%
PERCENTAGE OF WOMEN BUSINESS OWNERS BY AGE GROUP
Non-minority Asian American African American
Latina American Indian Native Hawaiian
40%
35%
30%
25%
20%
15%
10%
5%
0%
Under 25 25-34 35-44 45-54 55-64 65 or over
PERCENTAGE BY AGE, RACE AND ETHNICITY OF WOMEN BUSINESS OWNERS

99The State of Women-Owned Businesses, 2018
ANALYSIS OF BUSINESS DEMOGRAPHICS
Trends in Women-Owned Businesses by Number of Employees
On average, women-owned businesses employ 0.7 workers, compared to 1.9 for all privately held businesses and 3.9 for all firms (including publicly traded companies).
For women-owned businesses, the average number of employees shrank from 1.0 in 2007 to 0.7 in 2018. For privately held businesses, the average number of employees declined from 2.2 in 2007 to 1.9 in 2018. For all firms, the average number of employees dropped from 4.4 in 2007 to 3.9 in 2018. As a result of accessibility, ease-of-use, and lower costs of technology, as well as the rising use of freelance and contract workers, the average number of workers a company employs is on the decline.
Trends in Women-Owned Businesses by Revenue Size
While high-growth entrepreneurialism has rebounded from the great recession slump, there is an overall long-term decline. This is not true for women, however, whose contributions continue to grow significantly. Unlocking the potential of women-owned businesses requires understanding the growth rates of those businesses by revenue size.
In 2018, women-owned businesses that generated revenues less than $100,000:
• Were the vast majority — 10,775,600 or 88% — of all women-owned businesses.
• Grew in number at a rate that was faster than the growth rate for larger ones: 56% vs. a rate ranging from 34% to 46% for larger women-owned business categories and 12% for all businesses.
• Accounted for only 3.8% of total women-owned businesses’ employment and just 10% of revenue. Over the past 11 years employment shrank by 6% (vs. a decline of 0.8% for all businesses) and revenue grew 53% (vs. 36% for all businesses). Revenue growth for women-owned businesses was driven by the addition of firms, not an increase in average revenue per firm.
Because of an owner’s inexperience, insufficient capital, inadequate networks or the desire for flexibility and/or work-life balance, many of these smaller firms have limited prospects for growth. For the purposes of this report, women who start their own businesses because workforce policies do not accommodate their caregiving responsibilities or their desire to have more control over when and where they work are defined as flexibility entrepreneurs.
In 2018, women-owned businesses that generated revenues between $100,000 and $249,999:
• Numbered 638,800, accounting for 5% of all women-owned businesses.
• Grew in number at the slowest rate compared to other business sizes: 34%. Yet this rate of growth was still nearly three times higher than the growth rate of 12% for all businesses.
• Employed 660,600, representing 7% of women-owned businesses’ total employment. Over the past 11 years employment grew by 3% vs. a decrease of 0.8% for all businesses.
• Generated $100.3 billion in revenue or 6% of women-owned businesses’ total revenues. Over the past 11 years, revenues grew by 35% vs. 36% for all businesses.
• Focused on revenue growth, enabling them to hire their first employee.
National Trends
1010The State of Women-Owned Businesses, 2018
National Trends
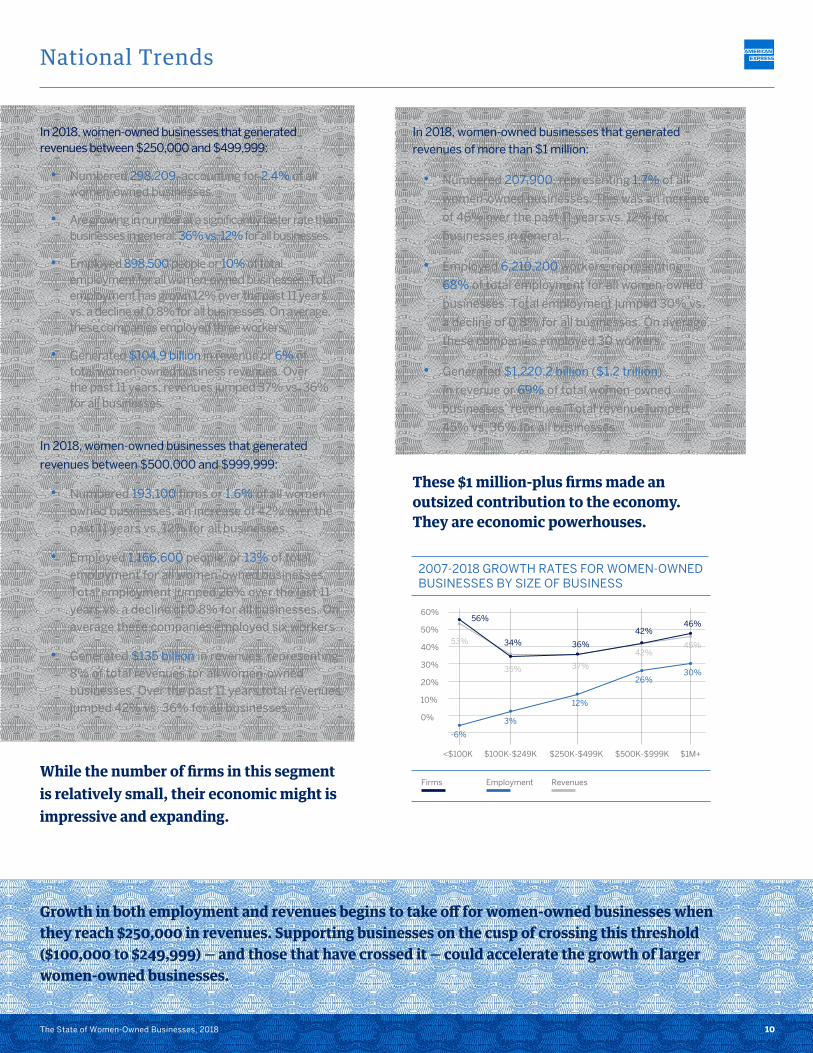
In 2018, women-owned businesses that generated revenues between $250,000 and $499,999:
• Numbered 298,209, accounting for 2.4% of all women-owned businesses.
• Are growing in number at a significantly faster rate than businesses in general: 36% vs. 12% for all businesses.
• Employed 898,500 people or 10% of total employment for all women-owned businesses. Total employment has grown 12% over the past 11 years vs. a decline of 0.8% for all businesses. On average, these companies employed three workers.
• Generated $104.9 billion in revenue or 6% of total women-owned business revenues. Over the past 11 years, revenues jumped 37% vs. 36% for all businesses.
In 2018, women-owned businesses that generated
revenues between $500,000 and $999,999:
• Numbered 193,100 firms or 1.6% of all women-owned businesses, an increase of 42% over the past 11 years vs. 12% for all businesses.
• Employed 1,166,600 people, or 13% of total employment for all women-owned businesses. Total employment jumped 26% over the last 11 years vs. a decline of 0.8% for all businesses. On average these companies employed six workers.
• Generated $135 billion in revenues, representing 8% of total revenues for all women-owned businesses. Over the past 11 years total revenues jumped 42% vs. 36% for all businesses.
While the number of firms in this segment is relatively small, their economic might is impressive and expanding.
In 2018, women-owned businesses that generated revenues of more than $1 million:
• Numbered 207,900, representing 1.7% of all
women-owned businesses. This was an increase
of 46% over the past 11 years vs. 12% for
businesses in general.
• Employed 6,210,200 workers, representing
68% of total employment for all women-owned
businesses. Total employment jumped 30% vs.
a decline of 0.8% for all businesses. On average,
these companies employed 30 workers.
• Generated $1,220.2 billion ($1.2 trillion)
in revenue or 69% of total women-owned
businesses’ revenues. Total revenue jumped
45% vs. 36% for all businesses.
These $1 million-plus firms made an outsized contribution to the economy. They are economic powerhouses.
Growth in both employment and revenues begins to take off for women-owned businesses when they reach $250,000 in revenues. Supporting businesses on the cusp of crossing this threshold ($100,000 to $249,999) — and those that have crossed it — could accelerate the growth of larger women-owned businesses.
Firms Employment Revenues
60%
50%
40%
30%
20%
10%
0%
<$100K $100K-$249K $250K-$499K $500K-$999K $1M+
2007-2018 GROWTH RATES FOR WOMEN-OWNED BUSINESSES BY SIZE OF BUSINESS
-6%
3%
12%
26%30%
53%
35% 37%
42%45%
56%
34% 36%
42%46%

1111The State of Women-Owned Businesses, 2018
Industry Trends
Half of all women-owned businesses are concentrated in three industries.
1. Other services
(e.g., hair and nail salons and pet care
businesses): There has been a dramatic rise
in the number of women-owned businesses
categorized as “other services.” This category
more than doubled between 2007 and 2018,
from 1.3 million to 2.8 million, and its growth
rate of 126% was far above the 58% growth
rate for all women-owned businesses for
that time period. As a result, the proportion
of these businesses surged from 16% of all
women-owned businesses to 23%. These
businesses generated less revenue per firm
($29,200) than women-owned businesses as
a whole ($143,100). Necessity and flexibility
entrepreneurs frequently started businesses
in this category.
3. Professional/scientific/technical services
(including lawyers, bookkeepers, architects,
public relations firms, and consultants):
While the number of professional/scientific/
technical services firms rose from 1.0 million
in 2007 to 1.5 million in 2018, the category’s
growth rate of 37% was below the 58%
growth rate for all women-owned businesses
for that time period. As a result, the proportion
of firms in the professional/scientific/
technical services category shrank from
14% to 12%. These businesses generated
less average revenue than women-owned
businesses generally: $110,000 vs. $143,100.
2. Health care and social assistance
(including child day care and home health care
services): While the number of healthcare and
social assistance firms grew from 1.2 million
in 2007 to 1.8 million in 2018, this segment’s
growth rate of 47% was below the 58% growth
rate for all women-owned businesses for that
time period. As a result, the proportion of
women-owned firms in the health care and
social assistance sector dropped from 16% to
15%. These businesses generated less revenue
per firm than women-owned businesses as a
whole: $86,300 vs. $143,100.
The three industries in which women-owned businesses have the highest total employment are healthcare and social assistance (20%), accommodations and food services (16%) and administrative, support and waste management services (13%).
The three industries in which women-owned businesses have the highest total revenue are wholesale trade (17%), retail trade (15%) and professional, scientific and technical services (10%).
The growth rate in the number of women-owned firms between 2007 and 2018 increased the most for these five industries: utilities (151%), other services (126%), construction (94%), accommodations and food services (85%) and administrative, support and waste management services (70%).
PERCENTAGE OF WOMEN-OWNED FIRMS IN THE TOP FIVE INDUSTRIES FOR NUMBER OF FIRMS, EMPLOYMENT AND REVENUE
Firms Employment Revenues
%
Other Services
23
5 5
HC & Social Asst
15
20
9
Prof/Sci/Tech Svcs
129 10
Admin/Supp/Waste Svcs
11 13
6
Retail Trade
9 9
15
Accom/Food Svcs
2.9
16
6
Wholesale Trade
1.44.2
17
Construction
4.3 5
9
THE FIVE INDUSTRIES IN WHICH THE NUMBER OF WOMEN-OWNED BUSINESSES GREW THE MOST BETWEEN 2007 AND 2018
Utilities 151%
Other Services 126%
Construction 94%
Accommodation & Food Svcs 85%
Admin, Support, Waste Mgmnt Svcs 70%

1212The State of Women-Owned Businesses, 2018
Geographic Trends
The report uses two types of rankings to evaluate the economic vibrancy of women-owned businesses by geography. The first metric — economic clout — ranks all 50 states (and the District of Columbia) and top metropolitan areas by the combined growth rates of women-owned businesses for number of firms, employment and revenues.
Job creation is one of the main priorities in the U.S. When jobs are created, incomes rise, and individuals have more money to buy goods and services, which further strengthens the economy. Women-owned businesses employ fewer workers on average (0.7) than all privately held businesses (1.9) and all firms, including publicly traded companies (3.9).
The second ranking is based on employment vitality, which is a combined measurement by geography of:
• the employment growth rate of women-owned businesses over the past 11 years and
• the average number of employees per women-owned business in 2018.
This metric takes into account employment growth rates and average number of employees, which controls for the size of states and metropolitan areas.
ECONOMIC CLOUT State Economic Clout Rankings
Economic clout is defined as the growth in the number of firms and growth in employment and revenues. The top 10 states where women-owned businesses most increased their economic clout between 2007 and 2018 were geographically diverse:
1. South Dakota
2/3. Texas, Utah (tied for second place)
4. Delaware
5/6. North Dakota, Tennessee (tied for fifth place)
7. Indiana
8/9. Georgia, Iowa (tied for eighth place)
10. Virginia
The five states with the lowest economic clout were: Massachusetts, West Virginia, Nebraska, Connecticut and New Hampshire.
Women-owned businesses thrived in populous states such as Texas and Georgia as well as small ones such as South Dakota and North Dakota. They thrived in states from coast to coast and north to south.
Metropolitan Area Economic Clout Rankings
From 2007 to 2018, the metropolitan areas that increased their economic clout — a combination of growth rates for number of firms, employment and revenues — were:
1. Charlotte-Concord-Gastonia metro area, NC/SC
2. San Antonio, TX
3. Austin, TX
4. Indianapolis, IN
5. Miami, FL
6. Richmond, VA
7/8. Detroit, MI / Memphis, TN (tied for seventh place)
9. Dallas, TX
10. Salt Lake City, UT
THE TEN STATES IN WHICH WOMEN-OWNED BUSINESSES HAVE THE HIGHEST AND LOWEST ECONOMIC CLOUT GROWTH RATE, 2007-2018
Highest Economic Clout Growth Rate
South Dakota, Texas, Utah, Delaware,
North Dakota, Tennessee, Indiana,
Georgia, Iowa, Virginia
Lowest Economic Clout Growth Rate
New Hampshire, Connecticut, Nebraska,
West Virginia, Massachusetts, Arkansas,
New Mexico, Illinois, Mississippi,
Pennsylvania, New Jersey
(11 states included due to ties)
Economic clout ranks all 50 states (and the District of Columbia) by the combined growth rates of women-owned businesses for number of firms, employment and revenues.

1313The State of Women-Owned Businesses, 2018
The metropolitan areas with lowest growth in economic clout were: Virginia Beach, VA/NC; Pittsburgh, PA; St. Louis, MO/IL; Louisville, KY/IN; and Sacramento, CA.
Southern hospitality agreed with women-owned businesses: seven of the top 10 cities for economic clout were in the south.
EMPLOYMENT VITALITY State Employment Vitality Rankings
The 10 states showing the highest employment vitality — employment growth rate from 2007 to 2018 and average numbers of employees — were:
1. Minnesota
2/3. Maine / North Dakota (tied for second place)
4. Iowa
5/6. Delaware / Virginia (tied for fifth place)
7. Alaska
8. Indiana
9/10. Washington / Wyoming (tied for ninth place)
The five states with the lowest employment vitality were Arizona, Florida, Michigan, Arkansas and Mississippi.
When it comes to employment vitality, women-owned businesses showed the greatest strength in rural states: Maine, North Dakota, Iowa, Alaska and Wyoming.
City Employment Vitality Rankings
The top city ranking showing the highest employment vitality — employment growth rate from 2007 to 2018 and average numbers of employees — were:
1. San Antonio, TX
2. Minneapolis, MN / St. Paul, WI
3. Salt Lake City, UT
4. Buffalo, NY
5. Indianapolis, IN
6. Austin, TX
7. Seattle, WA
8. Oklahoma City, OK
9. Washington, D.C. metro area, MD/VA/WV
10/11. Columbus, OH / Richmond, VA (tied for tenth place)
The five cities with the lowest employment vitality were: Birmingham, AL; Chicago, IL/IN/WI; Nashville, TN; Tampa/St. Petersburg, FL; and San Jose, CA.
Cities across the country provided a great home for women-owned business with the greatest employment vitality.
Job-creating women-owned businesses flourished in states and cities not traditionally thought of as entrepreneurial hubs.
Geographic Trends
Highest Employment Vitality
Minnesota, Maine, North Dakota, Iowa,
Delaware, Virginia, Alaska, Indiana,
Washington, Wyoming
Lowest Employment Vitality
Mississippi, Arkansas, Michigan, Florida,
Arizona, Illinois, Nebraska, Hawaii, Alabama,
California, Kentucky
(11 states included due to ties)
THE TEN STATES IN WHICH WOMEN-OWNED BUSINESSES HAVE THE HIGHEST AND LOWEST EMPLOYMENT VITALITY, 2007-2018
Employment vitality is a combined measurement by state of the employment growth rate of women-owned businesses and the average number of employees per women-owned business. This metric takes into account employment growth rates and average number of employees, which controls for the size of states and metropolitan areas.
1414The State of Women-Owned Businesses, 2018
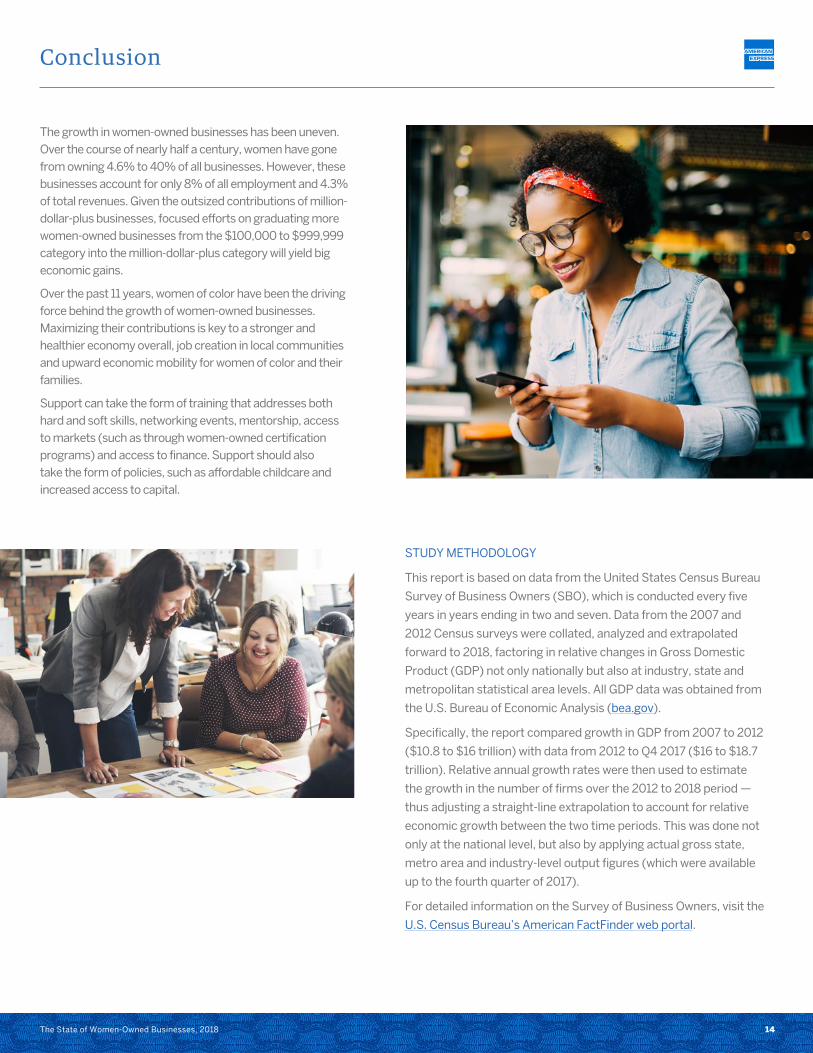
The growth in women-owned businesses has been uneven. Over the course of nearly half a century, women have gone from owning 4.6% to 40% of all businesses. However, these businesses account for only 8% of all employment and 4.3% of total revenues. Given the outsized contributions of million-dollar-plus businesses, focused efforts on graduating more women-owned businesses from the $100,000 to $999,999 category into the million-dollar-plus category will yield big economic gains.
Over the past 11 years, women of color have been the driving force behind the growth of women-owned businesses. Maximizing their contributions is key to a stronger and healthier economy overall, job creation in local communities and upward economic mobility for women of color and their families.
Support can take the form of training that addresses both hard and soft skills, networking events, mentorship, access to markets (such as through women-owned certification programs) and access to finance. Support should also take the form of policies, such as affordable childcare and increased access to capital.
STUDY METHODOLOGY
This report is based on data from the United States Census Bureau
Survey of Business Owners (SBO), which is conducted every five
years in years ending in two and seven. Data from the 2007 and
2012 Census surveys were collated, analyzed and extrapolated
forward to 2018, factoring in relative changes in Gross Domestic
Product (GDP) not only nationally but also at industry, state and
metropolitan statistical area levels. All GDP data was obtained from
the U.S. Bureau of Economic Analysis (bea.gov).
Specifically, the report compared growth in GDP from 2007 to 2012
($10.8 to $16 trillion) with data from 2012 to Q4 2017 ($16 to $18.7
trillion). Relative annual growth rates were then used to estimate
the growth in the number of firms over the 2012 to 2018 period —
thus adjusting a straight-line extrapolation to account for relative
economic growth between the two time periods. This was done not
only at the national level, but also by applying actual gross state,
metro area and industry-level output figures (which were available
up to the fourth quarter of 2017).
For detailed information on the Survey of Business Owners, visit the
U.S. Census Bureau’s American FactFinder web portal.
Conclusion

1515The State of Women-Owned Businesses, 2018
This report is commissioned and provided by American Express. American Express is a global services company, providing customers with access to products, insights and experiences that enrich lives and build business success. Learn more at americanexpress.com and connect with us on
facebook.com/americanexpress
instagram.com/americanexpress
linkedin.com/company/american-express
twitter.com/americanexpress
youtube.com/americanexpress
Key links to products, services and corporate responsibility information:
charge and credit cards, business credit cards, travel services, gift cards,
prepaid cards, merchant services, Accertify, InAuth, corporate card,
business travel, and corporate responsibility.
This report was prepared for American Express by Ventureneer with the
support of CoreWoman. Ventureneer researches and advocates on behalf
of entrepreneurs and small business owners, especially women, to help
policy makers create a better environment for entrepreneurship. It also
educates and trains entrepreneurs and small business owners to help
them be more successful. Learn more at ventureneer.com.
Acknowledgments