the 2009 foundation for child development child and youth ...cwi/2009cwireport.pdf · 2009 fcd-cwi...
TRANSCRIPT

2009 FCD-CWI Report
**EMBARGOED UNTIL 12:01 AM EDT ON MAY 18, 2009**
1
The 2009 Foundation for Child Development Child and Youth Well-Being Index (CWI) Report, Including: � An Update of the CWI for the Years 1975-2007, � Projections of the CWI for 2008, and � A Special Focus Report on Anticipating the Impacts of
a 2008-2010 Recession
Kenneth C. Land, Project Coordinator Duke University Durham, North Carolina

2009 FCD-CWI Report
**EMBARGOED UNTIL 12:01 AM EDT ON MAY 18, 2009**
2
The Foundation for Child Development (FCD) The Foundation for Child Development (FCD) is a national, private philanthropy dedicated to the principle that all families should have the social and material resources to raise their children to be healthy, educated, and productive members of their communities. The Foundation seeks to understand children, particularly the disadvantaged, and to promote their well-being. We believe that families, schools, nonprofit organizations, businesses, and government at all levels share complementary responsibilities in the critical task of raising new generations of children. Kenneth C. Land, Project Coordinator Kenneth C. Land, Ph.D., is the John Franklin Crowell Professor of Sociology and Demography at Duke University. He has conducted extensive research on contemporary social trends and quality-of life measurement, social problems, demography, criminology, organizations, and mathematical and statistical models and methods for the study of social and demographic processes. He is the co-author or co-editor of five books, more than 100 research articles, and numerous book chapters. Dr. Land has been elected a Fellow of the American Statistical Association, the Sociological Research Association, the American Association for the Advancement of Science, the International Society for Quality-of-Life Studies, and the American Society of Criminology.

2009 FCD-CWI Report
**EMBARGOED UNTIL 12:01 AM EDT ON MAY 18, 2009**
3
Introduction—Executive Summary
I. Overview The Foundation for Child Development Child and Youth Well-Being Index Project at Duke University issues an annual comprehensive measure of how children are faring in the United States. The Child Well-Being Index (CWI) is based on a composite of 28 Key Indicators of well-being that are grouped into seven Quality-of-Life/Well-Being Domains, including economic well-being, health, safety, educational attainment, community connectedness, social relationships and emotional/spiritual well-being. This year’s CWI is an updated measure of trends over the 32-year period from 1975 to 2007, with projections for 2008. This year, for the first time, we have also produced a Special Focus Report that offers projections of the impact the recession is likely to have on children’s well-being through the year 2010. These projections are drawn from time series forecasting of data from the CWI databank and from an analysis of past recessions.
II. Major Findings: Recent Trends in the Child and Youth Well-Being Index The major trends that can be drawn from the 2009 CWI Update include: Progress in American children’s quality of life has fluctuated since 2002, and began a decline in 2008. Overall well-being – as measured by the composite Child and Youth Well-
Being Index (CWI) – peaked in 2002, after 9/11, at 102.07. This was followed by a decline below the 2002 level in 2003 and 2004. The CWI then rose by small amounts in the 2005 to 2007 years, reaching an estimated 103.17 in 2007, and began a decline in 2008.
III. Major Findings: Special Focus Report on Likely Impacts of the Current Economic Recession on Child Well-Being The Special Report shows that the impact of the current recession on children will be dramatic. While data on most of the Key Indicators in the CWI for 2008 will not be available for two to three years, early indications are that the CWI began to decline during the past year and will continue to have negative impacts. Our projections show that virtually all the progress made in family economic well-being since 1975 will be wiped out. The Impact on Family Economic Well-Being
As in past recessions of the early 80s, 90s and 2001-2002, it is likely that today’s macroeconomic problems will impact a number of indicators of Family Economic Well-Being for families with children and adolescents.

2009 FCD-CWI Report
**EMBARGOED UNTIL 12:01 AM EDT ON MAY 18, 2009**
4
• The percentage of children in poverty is expected to peak at 21 percent in 2010, comparable to that of previous economic recessions.
• More than a quarter (27 percent) or 8 million children will have at least one parent not working full-time year-round in 2010.
• For all families, median annual family income (in constant 2007 dollars) is expected to decline from $59,200 in 2007, to about $55,700 in 2010. For single female-headed households, median annual family income is expected to decline from $24,950 in 2007, to $23,000 in 2010. The steepest drop, however, will be among single male-headed households where median annual family income is expected to decline from $38,100 in 2007 to $33,300 in 2010.
The Impact on Other CWI Domains The significant decrease in the family economic well-being domain is projected to cause negative ripple effects across the other domains which the CWI measures. Because the projections for these domains reflect indirect impacts drawn from time series forecasting of data from the CWI databank and from an analysis of past recessions, they are less quantifiable, and, therefore, stated qualitatively in the report. While the overall impact of the recession on children’s well-being is expected to resemble similar impacts from recessions past, a few trends make this economic downturn unique. Among them:
• Social relationships domain: The rate of residential mobility for children normally decreases during a recession. Due to the greater severity of the housing crisis accompanying the current economic recession, however, this decline in residential mobility will be counterbalanced by the increased mobility of low-income families that lose their housing and either move or become homeless. For those children, there will be substantial negative impacts on peer and other neighborhood social relationships.
• Health domain: Children’s overall health is expected to decline due to obesity. Though obesity has been on the rise for several years, it is now likely to spike as the recession drives parents to rely more on low-cost fast food. While this obesity increase is expected to bring down the health domain, however, there is some positive news. The total number of children with health insurance is expected to remain at just under 90 percent in 2010, due to the fact that government health insurance policies will provide a public safety net for children who are likely to lose private coverage.
Other projected impacts across the domains include:
• Community connectedness domain: The connection that children have to their surrounding communities is likely to be negatively impacted by declines in Pre-Kindergarten participation.

2009 FCD-CWI Report
**EMBARGOED UNTIL 12:01 AM EDT ON MAY 18, 2009**
5
• Safety/behavioral domain: Children’s safety and behavior is expected to fare worse due to higher rates of violent crime where youth are both victims and perpetrators. This is based on historic recessionary trends of budget cuts for policing and juvenile crime prevention.
Finally, the focus of the CWI and its Key Indicators is on national averages across the U.S. and across the population of all children and youths. However, it must be emphasized that there will be a diversity of impacts of the current economic downturn – geographically across the nation and across racial/ethnic subpopulations and socioeconomic groups. Low-income African American and Latino children are generally more susceptible to the consequences of economic fluctuations. When the economy is doing well, their well-being gains are more dramatic; when the economy slumps, they are harder hit than their white counterparts because more children of color live in poverty to begin with.

2009 FCD-CWI Report
**EMBARGOED UNTIL 12:01 AM EDT ON MAY 18, 2009**
6
The Child and Youth Well-Being Index (CWI) 1975 – 2007, with Projections for 2008
I. Child and Youth Well-Being Index: A Brief Overview
The Child and Youth Well-Being Index (CWI) is an evidence-based composite measure of trends over time in the quality of life of America’s children from birth to age 181. The CWI tracks changes in the well-being of children annually as compared to 1975 base year values.
The CWI is designed to address questions such as the following:
� Overall, on average, how did child and youth well-being in the U.S. change in the last quarter of the 20th century and beyond?
� Did it improve or deteriorate? � By approximately how much? � In which domains of social life? � For specific age groups? � For particular race/ethnic groups?
The CWI is computed and updated annually, and is based on data from the Key Indicators
through the year 2005. Updates on most of Key Indicators currently are available for the years 2006 and 2007, and three are available for 2008. The remaining indicators are projected by use of statistical time series models. Due to the substantial inertia in many of the indicators time series, the one-year-ahead projected values have been found to be quite accurate.
The objective of the Child and Youth Well-Being Index is to give a view of changes over
time in the overall well-being of children and youth in the United States. The composite Index, an equally-weighted average of the seven domains, provides a sense of the overall direction of change in well-being, as compared to a base year of the indicators, 1975. For this reason, the focus of the Index is not primarily on specific indicators, but rather on the way in which they interact and change over time.
Children and youth live unique lives and as such, at some point, each experiences a range of social conditions. The Index is comprised of Key Indicators associated with different stages of the life course in the first two decades of life.
The CWI includes the following 28 Key Indicators organized into seven domains of well-being that have been found in numerous social science studies to be related to an overall sense of subjective well-being or satisfaction with life. Appendix A briefly describes the Methods of Index Construction for the CWI. Sources for time series data on the Key Indicators are presented in Appendix B. Unless otherwise noted, indicators refer to children ages 0-17:
1 Or, equivalently, in Census/demographic notation, ages 0 to age 17 at last birthday, which is abbreviated 0-17 in the text.

2009 FCD-CWI Report
**EMBARGOED UNTIL 12:01 AM EDT ON MAY 18, 2009**
7
Family Economic Well-Being Domain
1. Poverty Rate (All Families with Children) 2. Secure Parental Employment Rate 3. Median Annual Income (All Families with Children) 4. Rate of Children with Health Insurance
Health Domain
1. Infant Mortality Rate 2. Low Birth Weight Rate 3. Mortality Rate (Ages 1-19) 4. Rate of Children with Very Good or Excellent Health (as reported by parents) 5. Rate of Children with Activity Limitations (as reported by parents) 6. Rate of Overweight Children and Adolescents (Ages 6-19)
Safety/Behavioral Domain
1. Teenage Birth Rate (Ages 10-17) 2. Rate of Violent Crime Victimization (Ages 12-19) 3. Rate of Violent Crime Offenders (Ages 12-17) 4. Rate of Cigarette Smoking (Grade 12) 5. Rate of Binge Alcohol Drinking (Grade 12) 6. Rate of Illicit Drug Use (Grade 12)
Educational Attainment Domain
1. Reading Test Scores (Ages 9, 13, and 17) 2. Mathematics Test Scores (Ages 9, 13, and 17)
Community Connectedness
1. Rate of Persons who have Received a High School Diploma (Ages 18-24) 2. Rate of Youths Not Working and Not in School (Ages 16-19) 3. Rate of Pre-Kindergarten Enrollment (Ages 3-4) 4. Rate of Persons who have Received a Bachelor’s Degree (Ages 25-29) 5. Rate of Voting in Presidential Elections (Ages 18-20)
Social Relationships Domain
1. Rate of Children in Families Headed by a Single Parent 2. Rate of Children who have Moved within the Last Year (Ages 1-18)
Emotional/Spiritual Well-Being Domain:
1. Suicide Rate (Ages 10-19) 2. Rate of Weekly Religious Attendance (Grade 12) 3. Percent who report Religion as Being Very Important (Grade 12)
Taken together, changes in the performance of these 28 Key Indicators and the seven domains into which they are grouped provide a view of the changes in the overall well-being of children and youth in American society. Each domain represents an important area that affects well-being/quality of life: economic well-being, health, safety/behavior, educational attainment,

2009 FCD-CWI Report
**EMBARGOED UNTIL 12:01 AM EDT ON MAY 18, 2009**
8
community connectedness (participation in major social institutions), social relationships, and emotional/spiritual well-being. The performance of the nation on each indicator also reflects the strength of America’s social institutions: its families, schools, and communities. All of these Key Indicators either are well-being indicators that measure outcomes for children and youths or surrogate indicators of the same.
II. Annual Update of the CWI
Each year, we report the updated values of the CWI through the three most recent years – 2006, 2007 and 2008 in the current report. Figure 1 charts changes since 1975 in the overall composite CWI and Figure 2 displays changes in the seven domain-specific indices.2
85
90
95
100
105
110
Pe
rcen
t o
f B
ase
Ye
ar
197
5
197
7
197
9
198
1
198
3
198
5
198
7
198
9
199
1
199
3
199
5
199
7
199
9
200
1
200
3
200
5
200
7
Year
Figure 1: Child Well-Being Index, 1975-2007, with Projections for 2008.
2 The specific annual numerical values of the CWI, from which Figure 1 is constructed, are given in Appendix C.

2009 FCD-CWI Report
**EMBARGOED UNTIL 12:01 AM EDT ON MAY 18, 2009**
9
Figure 2. Domain-Specific Summary Indices, 1975-2007, with Projections for 2008.
50
60
70
80
90
100
110
120
130
140
150
1975
1977
1979
1981
1983
1985
1987
1989
1991
1993
1995
1997
1999
2001
2003
2005
2007
Year
Pe
rce
nt
of
Ba
se
Ye
ar
Family Economic Well-Being
Health
Safety/Behavioral Concerns
Educational Attainment
Community Connectedness
Social Relationships
Emotional/Spiritual Well-Being
For the three most recent years, Figure 1 shows that:
� With a value of 102.20 for 2006, the last year for which data are available for almost all
28 Key Indicators, the CWI was essentially unchanged from 2005. � For 2007, the partially projected3 CWI increased to 103.17. Contributions to this
increase came from continued improvements in the community connectedness domain, specifically in the rate of pre-Kindergarten enrollment at ages 3 to 4. and, despite a second year of increases in births to teenage mothers, overall improvements in the safety/behavioral domain due to a decline in the rate of violent crime victimization at ages 12-19. The social relationships domain also improved substantially in 2007, due to smaller numbers of children living in single-parent families.
� This is followed by a mostly projected4 decline to 103.07 in 2008, as the impacts of the
2008-2010 economic recession began to negatively impact the family economic well-being domain (more about this below).
3 As reported in Appendix C, 9 of the 28 Key Indicators are projected for 2007. 4 As reported in Appendix C, 25 of the 28 Key Indicators are projected for 2008.

2009 FCD-CWI Report
**EMBARGOED UNTIL 12:01 AM EDT ON MAY 18, 2009**
10
Medium-term (since 2000) and long-term (since 1975) changes in the CWI are described in Appendix D.

2009 FCD-CWI Report
**EMBARGOED UNTIL 12:01 AM EDT ON MAY 18, 2009**
11
Special Focus Report
Anticipating Impacts of a 2008-2010 Recession As is common knowledge, the financial and banking crisis of 2008 has mushroomed into a severe downturn in the economy. This makes salient the question: What will be the impacts of the current period of financial crisis, rising unemployment, and economic recession on child well-being? Can these impacts be anticipated today, well before the corresponding official statistics are compiled and released some four or five years from now?
We think they can be, at least to some extent. Our long-term record of changes in the CWI and its component domains and Key Indicators provide a basis on which to do so. This is the special focus of this year’s report to which we now turn. Predictions always are precarious, especially those of the future. However, based on our studies of the behavior of the CWI and its component domains and indicators over the years, we can at least begin to anticipate the rough outlines of what will happen to the well-being of America’s children and youth over the next two to four years, as we work our way through this economically difficult period. We emphasize that the anticipated impacts stated below are tentative, as this is uncharted territory – no one, to the best of our knowledge, has engaged in this kind of systematic anticipatory exercise for child and youth well-being. A Note on Terminology and the Time Frame of the Predictions: For clarity of the exposition, we emphasize the following properties of the predictions/projections given below.
First, we distinguish two types of impacts – direct or primary and indirect or secondary. The most direct/primary impacts of the recession will be on the Family Economic Well-Being Domain and its four Key Indicators, as identified above.5 Specifically, there will be direct impacts through the employment and income circumstances of families with children, as the economy loses jobs, parents become unemployed, and incomes decline. We project these direct impacts and state them quantitatively. In addition, however, as families cope with losses of jobs of one or more employed parents, corresponding losses or declines in family income, and stable employment, and as communities cope with declining public sector budgets due to decreases in taxes collected and with strained resources available to community organizations and voluntary associations, there will be many indirect/secondary impacts on other Domains and Key Indicators of child and youth well-being in the CWI. Based on the CWI databank of time series indicators of child and youth well-being and our analyses thereof, we can crosswalk among the Well-Being Domains and Key Indicators of the CWI to anticipate some of these secondary impacts. However, since they are secondary impacts and based on only three prior recessionary periods in the U.S. since 1975, these projections are more tentative and are stated qualitatively in terms of expected directions of impacts, but not in terms of magnitudes.
Second, concerning the time frame of the predictions/projections stated below, the
reality of the current recession is clear. Generally, it is dated from December 2007. The
5 See also Appendix A for a list of Well-Being Domains and Key Indicators in the CWI.

2009 FCD-CWI Report
**EMBARGOED UNTIL 12:01 AM EDT ON MAY 18, 2009**
12
recession gained momentum through 2008 and now has extended into 2009. Many economic forecasters expect that the economic contraction will bottom in late 2009. Even if the economy begins to turn around and improve in late 2009, however, there will be a substantial period of time before unemployment levels, family incomes, and stable jobs return to pre-recession levels. Therefore, while the official time period of the recession may date from December 2007 to late 2009, the predictions/projections stated below have the negative impacts of the recession on family economic well-being extending into 2010.6 Hence, for brevity, we refer to “the economic recession of 2008-2010.” In addition, our projections of direct impacts of the economic recession on family economic well-being are reported for the years 2008 to 2012 in order to include the years of expected downturn, 2008-2010, as well as recovery in 2011-2012. By comparison, our projections of secondary impacts on other Well-Being Domains and Key Indicators use 2010 as the focal year, as 2010 likely will be the worst year of the 2008-2012 period for these impacts.
I. Impacts on the Composite CWI
For the overall composite CWI, we anticipate a decline of about 2 points – about 2 percent – from its recent peak in 2007 to a low point in 2010. This will bring the CWI down to just above the 100 at which it is set in its base year 1975.
This overall decline in the CWI will occur through several of the Domains of the CWI
and their Key Indicators. As indicated above, however, the overall decline in the CWI will be driven most directly by a decline in the Family Economic Well-Being Domain Index, to which we turn our attention.
II. Impacts on Family Economic Well-Being Figure 3 shows an expected trajectory of the Family Economic Domain Index from the
year 2007, the last year for which we currently have observed data on the Key Indicators of this domain, through 2008, 2009, 2010, 2011, and 2012.
This expected trajectory is based on the assumption that the current
economic decline will be in the form of a severe recession, on the order of that of 1981-1982, and not a depression that lasts several years.
In particular, the scenario depicted in Figure 3 and the associated Key Indicators for this domain index given below assumes that the U.S. civilian unemployment rate in the current downturn peaks at an annual level of 9.5 percent in 2009 and then begins a slow recovery through 2010-2012. In Section V below, we describe how the trajectory depicted in Figure 3 could be affected if the recession becomes more severe or extended in time.
6 Section V below gives details on the assumptions on which our projections are based and the methods of their derivation.

2009 FCD-CWI Report
**EMBARGOED UNTIL 12:01 AM EDT ON MAY 18, 2009**
13
Figure 3. Family Economic Well-Being Index, 1975-2007, with Projections for 2008-2012.
80
85
90
95
100
105
110
115
1975
1977
1979
1981
1983
1985
1987
1989
1991
1993
1995
1997
1999
2001
2003
2005
2007
2009
2011
Year
Pe
rcen
t of B
ase Y
ear
Observed
Projected
Under these assumptions, Figure 3 shows that the Family Economic Domain Index is expected to decline from a recent peak of 109 to a low point of just above 100 in 2010. This low will be reached in 2010 rather than 2009 because of lags in the impact of recessions on the Key Indicators in the Family Economic Well-Being Domain. Carrying our projections out through the years 2011 and 2012, we then expect to see a slow recovery in the Family Economic Domain Index.
Importantly, however, since the Family Economic Well-Being Domain Index has an initial value of 100 in 1975, this scenario implies that it will have declined, for all practical purposes, to its level of 35 years
earlier. Thus, the current recession will wipe out the gains, particularly since the late 1990s, of this 35-year-period.
As noted earlier in this report, the Family Economic Well-Being Domain Index is comprised of four Key Indicators: the poverty rate for all families with children, the secure parental employment rate (children living in families with at least one parent with secure employment), median annual income for all families with children, and the rate of children living in families with some form of health insurance. To interpret the changes over time in the Family Economic Well-Being Index shown in Figure 3, we next report the corresponding expected changes in each of these component Key Indicators for the years 2008-2012.

2009 FCD-CWI Report
**EMBARGOED UNTIL 12:01 AM EDT ON MAY 18, 2009**
14
Figure 4 gives the over time and expected trajectories for the first of these four Key Indicators, the percentage of children ages 0 to 17 living in families classified as having incomes below the official poverty line as set each year by the U.S. Census Bureau. While this official poverty line is somewhat arbitrary and has been critiqued widely and frequently for not providing an adequate accounting of levels of poverty, its important attribute for the CWI is not its level but rather its trend over time and across the years. That is, even if alternative definitions of poverty lines would yield different estimates of the percentage of children living in families with poverty level incomes, their trends over time in terms of ups and downs from year to year would likely be quite consistent with those given by the official poverty line and exhibited in Figure 4.
To assist in the interpretation of the extent of population impacts of the expected upturn in this poverty rate during the current recession on the economic well-being of families with children, Figure 4 also contains a chart of the corresponding trend in the number of children living in families with incomes below the official poverty line.
Figure 4. Number and Percentage of Children Ages 0-17 Living in Families Below the Poverty Line,
1975-2007, with Projections for 2008-2012.
0
2000
4000
6000
8000
10000
12000
14000
16000
1975
1977
1979
1981
1983
1985
1987
1989
1991
1993
1995
1997
1999
2001
2003
2005
2007
2009
2011
Year
Nu
mb
er
(in
th
ou
sa
nd
s)
10
15
20
25
30
35
40
45
50
Pe
rcen
tag
e
Observed number of children ages 0-17 living in families below the poverty line
Projected number of children ages 0-17 living in families below the poverty line
Observed percentage of children ages 0-17 living in families below the poverty line
Projected percentage of children ages 0-17 living in families below the poverty line
Figure 4 shows that, under the assumptions described above, the percentage of children living in families with incomes below the
official poverty line is expected to peak at about 21 percent in 2010, a level comparable to that of the economic recessions
of 1981-1982 and 1990-1991.

2009 FCD-CWI Report
**EMBARGOED UNTIL 12:01 AM EDT ON MAY 18, 2009**
15
Correspondingly, the numbers of children living in families with incomes below the official poverty line will rise from a recent low of
12.3 million in 2006 to about 14.9 million in 2010 – an increase of over 2.6 million.
Figure 5 presents the historical and expected trajectories of the second Key Indicator in the Family Economic Well-Being Index, the percentage and, correspondingly, the numbers of children living in families with at least one parent with secure employment in the sense of being employed full time on a year-round basis. The percentage of children in families who meet this criterion has had a secular increase across the decades from the high 60s to the high 70s, as more and more couples with children have had both members in the labor force and employed. In addition, single parents will find it increasingly difficult to maintain full-time work year-round. Nevertheless, with the loss of jobs and the rise in the unemployment rate during the current recession, this percentage is anticipated to decline, as shown in the figure.
Figure 5. Percentage and Number of Children Ages 0–17 Living With At Least One Parent
Employed Year Round, Full Time, 1975 or 1981 to 2006, with Projections for 2007-2012.
0
10000
20000
30000
40000
50000
60000
70000
80000
90000
100000
1975
1977
1979
1981
1983
1985
1987
1989
1991
1993
1995
1997
1999
2001
2003
2005
2007
2009
2011
Year
Nu
mb
er
(in
th
ou
sa
nd
s)
0
10
20
30
40
50
60
70
80
90
Pe
rce
nta
ge
Observed number of children ages 0–17 living with at least one parent employed year round, full time
Projected number of children ages 0–17 living with at least one parent employed year round, full time
Observed percentage of children ages 0–17 living with at least one parent employed year round, full time
Projected percentage of children ages 0–17 living with at least one parent employed year round, full time
Specifically, it is expected that the percentage of children living in families with at least one parent employed full time, year round, will
decline from a recent peak of 78 percent in the years 2004-2006 to about 73 percent in 2010.

2009 FCD-CWI Report
**EMBARGOED UNTIL 12:01 AM EDT ON MAY 18, 2009**
16
There will be a corresponding decrease in numbers of children in families with at least one parent employed full time
of about 1,760,000. The historical and expected trajectories of the third Key Indicator in the Family Economic Well-Being Index, median annual family income in constant 2007 dollars, are given in Figure 6. In addition to median family income for all families with children ages 0 to 17, the figure also gives the corresponding charts of the median annual incomes of single-parent families, both female-headed and male-headed. Median incomes of all three types of families with children are expected to decline during the current recession.
Figure 6. Median Family Income in Families with Children Under 18 Years Old in 2007 Dollars, 1975-
2007, with Projections for 2008-2012.
17000
27000
37000
47000
57000
67000
77000
1975
1977
1979
1981
1983
1985
1987
1989
1991
1993
1995
1997
1999
2001
2003
2005
2007
2009
2011
Year
Am
ou
nt in
Dolla
rs
Observed median income for all families with children ages 0-17
Projected median income for all families with children ages 0-17
Observed median income for male-headed single-parent families with children ages 0-17
Projected median income for male-headed single-parent families with children ages 0-17
Observed median income for female-headed single-parent families with children ages 0-17
Projected median income for female-headed single-parent families with children ages 0-17
For all families with children, it is expected that median annual
income will decline from just over $59,000 in 2007 to about $55,700 in 2010.
For children in female-headed single-parent families, median annual
income is expected to decline from a peak of just over $25,000 in 2006 to about $23,000 in 2010.

2009 FCD-CWI Report
**EMBARGOED UNTIL 12:01 AM EDT ON MAY 18, 2009**
17
The median annual income of male-headed single-parent families will be even more severely impacted, declining from about $38,500
in 2006 to about $33,300 in 2010. This is largely a consequence of more severe job losses for males
than females during a recession.
The fourth Key Indicator in the Family Economic Well-Being Domain Index is the rate (percentage) of children living in families with some form of health insurance. This is an important indicator of children’s access to health care, and therefore of the material well-being of children, trends in which the economic domain index seeks to measure. Data on this indicator series are available back to 1987 rather than the 1975 base year for most of the CWI indicators. Figure 7 shows the historical and expected trajectories of three versions of this indicator: the percentage with all types of health insurance (which is used in the CWI), the percentage with private health insurance, and the percentage with public health insurance.
Figure 7. Percentage of Children Living in Families With Health Insurance, 1987-2007,
with Projections for 2008-2012
0
10
20
30
40
50
60
70
80
90
100
1987
1988
1989
1990
1991
1992
1993
1994
1995
1996
1997
1998
1999
2000
2001
2002
2003
2004
2005
2006
2007
2008
2009
2010
2011
2012
Year
Perc
enta
ge Observed all types of insurance
Projected all types of insurance
Observed private insurance
Projected private insurance
Observed public insurance
Projected Public Insurance
Of all of the Key Indicators in the Family Economic Well-Being
Domain, the health insurance indicator will be the least negatively impacted by the current recession. The main reason is that health insurance coverage for children is substantially impacted by public programs, such as the State Children’s Health Insurance Program
(SCHIP) and other community health care programs.

2009 FCD-CWI Report
**EMBARGOED UNTIL 12:01 AM EDT ON MAY 18, 2009**
18
Thus, the percentage of children in families with some form of health
insurance likely will remain relatively stable at just under 90 percent, as in recent years.
In addition, the trend towards substitution of publicly-funded health
insurance programs for children for private-sector funding likely will continue and perhaps even accelerate during
the recession because working families may lose access to private health insurance plans.
III. Impacts on Other Domains and Indicators In brief, there is little doubt that the current economic recession will have very substantial negative impacts directly on the Family Economic Well-Being Domain of the CWI and its component Key Indicators. As noted above, impacts of the recession on other Domains and Key Indicators will be less direct and less severe and they may be counterbalancing in some cases. And, as noted previously, because these secondary impacts are based on a historical record of only three prior recessionary periods since 1975, our analyses are more tentative and stated qualitatively in terms of expected directions of impacts, not in terms of magnitudes. Specifically, we cite expected impacts on the following 12 Key Indicators and 5 Well-Being Domains.7 First, in the Health Domain, one Key Indicator is the rate of overweight children and adolescents. As we noted in the first annual CWI report in 2004, this indicator has been on an increasing long term upward trend since the 1970s. In addition, there may well be a “recession obesity” impact during 2008-2010. That is, if parents are less able to afford healthy food options for their children during the current recession and instead turn to low-cost fast-food, this indicator may show an additional increase in overweight and obese children above the increasing trend line. Second, in the Safety/Behavioral Domain, considerable vigilance should be given to the potential for substantial negative consequences of the recession for the rates of violent crime victimization (ages 12-19) and offending (ages 12-17). Not only will families and their teenage children be stressed by the consequences of the recession for their economic well-being, but these consequences may accumulate within certain neighborhoods and cities and lead to increased crime victimization and offending. These impacts may also be multiplied as local and state governments, due to cutbacks in tax receipts and public funding, are forced to reduce police personnel and programs that are targeted towards juvenile crime reduction and prevention.
7 Combined with impacts on the four Key Indicators in the Family Economic Well-Begin Domain cited above, this is a total of 16 of the 28 Key Indicators of the CWI from 6 of its 7 Domains of Well-Being for we anticipate impacts of the economic recession. For the other 12 Key Indicators, the data do not indicate that there will be detectable impacts, either because changes therein are driven by other logics or mechanisms or because any impacts will be very small.

2009 FCD-CWI Report
**EMBARGOED UNTIL 12:01 AM EDT ON MAY 18, 2009**
19
Third, in the Community Connectedness Domain, the Key Indicator that most directly will be negatively impacted by the recession is the rate of youths ages 16 to 19 who are not working/employed and not attending school. This is a very important indicator of the extent of non-participation of youths in the economic and educational institutions of the society. Especially for the ages of 16 to 19, which are beyond the age of mandatory school attendance, an increase in this rate signals a rise in the size of the population of teenagers who, by virtue of their lack of connections to the economic or schooling institutions, are at greater risk of participation in criminal activities. Two other Key Indicators in the Community Connectedness Domain may be affected by the economic recession: The rate of Pre-Kindergarten enrollment (ages 3-4) may decline as communities are forced to cut back on schooling opportunities due to budget pressures. On the other hand, the lack of employment opportunities for young adults may lead to an increase in higher education enrollments and thus the rate of young adults who have received a Bachelor’s Degree (ages 25-29) may increase.8 Fourth, in the Social Relationships Domain, recessions ordinarily slow the rate of residential mobility of families and the associated breaking of ties of children to friends, families, and neighborhoods. However, the current recession has a much more substantial housing finance crisis than previous recessions. This will be associated with increases in residential mobility and the corresponding negative impacts on social relationships of children in families who lose their residences and either move or become homeless. On balance, the reduced rate of residential mobility of families and children typical of recessions thus will be tempered by the impacts of the housing crisis. In addition, the crush of the financial and employment crisis on family structures also should result in an increase in the rate of family breakdowns and thus of the rate of children living in families headed by a single parent. Fifth, the Emotional/Spiritual Domain also will show the imprint of the economic recession. The economic and social stresses cited above generally will impact negatively on emotional well-being, and this may lead to an increase in the suicide rate (ages 10-19). Counterbalancing this, however, is the increase in participation in religious services and in the assessed importance of religious beliefs that has been characteristic of past recessions. Through their social bounding and emotional counterbalancing effects, increase in these indicators may be associated with restraints of increases in the suicide rate.
IV. A Diversity of Impacts The focus of the CWI is on statistical indicators of child and youth well-being at the national level. Accordingly, all of the economic and social impacts cited above have been for the nation as a whole. Beneath these national level indicators and associated impacts, there will be a diversity of impacts across the U.S. We cite two important variants of this diversity.
8 Past economic recessions have seen higher education enrollment increases overall, although there may be some shifting of enrollments from higher cost to lower cost institutions.

2009 FCD-CWI Report
**EMBARGOED UNTIL 12:01 AM EDT ON MAY 18, 2009**
20
To begin with, there will be much geographical diversity of impacts. Some local communities and some of the 50 states will be impacted much more severely and negatively by the recession than the national averages. Specifically, some local communities and states will experience civilian unemployment rates in the 12 to 20 percent range – levels that define economic depressions, not recessions. In these communities and states, the negative impacts on child well-being cited above will be much more severe than the national averages. There also will be some communities and states that will be less severely impacted than the national averages.
In addition, there will be a diversity of impacts across race/ethnic and socioeconomic
lines. In prior studies of the CWI and the temporal changes in child well-being across the last quarter of the 20th century and the first decade of the 21st century that it measures, we have found that when the general trend is one of improving child well-being, children from those racial and ethnic groups, socioeconomic strata, and communities that have lesser economic resources often experience rates of improvement in well-being that are above the national average. On the other hand, the reverse is true when the general trend is one of declining child well-being. That is, when the general trend is one of deteriorating child well-being – as will be the case during the 2008-2010 period – children from racial and ethnic groups, socioeconomic strata, and communities that have lesser economic resources and reserves experience rates of deterioration that are greater than the national average.9
V. Methodology of the Projections and the Range of Potential Impacts of the Economic Downturn As indicated at the outset of this special emphasis report, the levels of the expected impacts on domains and indicators cited above are based on an assumption, shared among many economic forecasters, that the current economic downturn will be in the form of an severe economic recession similar to that of 1981-82, with the monthly civilian unemployment rate peaking in the 9 to 11 percent range and a duration of two to three years.10 If, however, the current downturn becomes a depression, with the monthly unemployment rate rising above 11 percent and an extended period of economic collapse lasting more than three years, then the negative impacts on child well-being cited above would become much more severe. Indeed, at that point, just as there were lasting negative birth cohort effects in the 20th century on “children of the Great Depression,” as documented by sociologist Glen
9 For example, our prior studies imply that for every one point decline of the composite CWI during a period of deteriorating child well-being for all children, there will be approximately a two point decline in the CWI among African-American and Hispanic children and youths. 10 See, e.g., See, e.g., Chris Isidore, CNNMoney.com senior writer, March 25, 2009, “The Great Recession.”
“Economists generally agree this is the worst economic downturn since the Great Depression, but they say despite pain, another depression isn’t likely.” Accessed on April 4, 2009 at: http://money.cnn.com/2009/03/25/news/economy/depression_comparisons/index.htm?postversion=2009032517. Also Chris Isidore, CNNMoney.com senior writer, March 6, 2009, “Worst is Yet to Come for Job Market.” “This is the most brutal downturn in decades, but the unemployment numbers only show part of the pain.” Accessed on April 4, 2009 at:
http://money.cnn.com/2009/03/05/news/economy/jobs_outlook/index.htm?postversion=2009030609.

2009 FCD-CWI Report
**EMBARGOED UNTIL 12:01 AM EDT ON MAY 18, 2009**
21
Elder11, we would anticipate that there would be similar negative impacts that the children of today would carry with them well into the 21st century.12 A second assumption on which our anticipated impacts, as described above, are based is that the negative consequences of the current economic downturn are not accompanied by other major economic, demographic and social changes that lead to a cascade of negative consequences for child well-being. A confluence of several sources of societal changes occurred in the early 1980s and accounts for the fact that the 1981-1982 economic recession was the leading event in a long recession/decline in child and youth well-being that – as shown in Figure 1 – lasted into the early-1990s. In brief, the economic recession of the early 1980s occurred at the same time as other major economic and demographic changes. This included economic restructuring – the decline of the “rust belt” heavy industrial sectors of the economy to be replaced by the beginnings of the e-economy – and the demographic succession of the World War II generation of parents by their Baby Boomer children as parents, with all of the changes in family structures (e.g., more single-parenting) and childcare that they wrought. If the current economic downturn again coincides with similar economic, demographic, and social changes, then the anticipated impacts described above could again cascade into a prolonged downturn/long recession in child and youth well-being. Based on these two assumptions, the projections reported above were calculated as weighted averages of the historical records of impacts (changes from peak to valley) on the Key Indicators in the CWI during the 1981-1982, 1990-1991, and 2001-2002 recessions, with the 1981-1982 recession weighted twice as much as the last two. As noted previously, this weighting is based on the diagnosis by many analysts that the current economic downturn is the most severe in a quarter century and more like the first of these three previous recessions than the last two. The particular scenario of the recession that we utilized for the projections reported in this report assumes that the U.S. civilian unemployment rate in the current downturn peaks at an annual level of 9.5 percent in 2009 and then begins a slow recovery through 2010-2012. As noted previously, since employment and income levels rebound slowly during a recovery period, this scenario still implies that the most severe impacts of the downturn on child and youth well-being will occur in 2010, which is the focal year we have used for many of the impacts reported above. Granting the foregoing two assumptions as the basis for calculation of the anticipated impacts described above, we close by emphasizing that they are based on a particular scenario of the civilian unemployment cycle for the current recession. The actual course of the current economic downturn is not deterministic and we are not infallible forecasters. Thus, in addition to the foregoing two provisos under which the projections described above have been developed,
11 Elder, Glen H. (1999) Children of the Great Depression: Social Change in Life Experience. 25th Anniversary
Edition. Boulder, CO: Westview Press. Elder found that the youngest children during the Great Depression, that is, those in early childhood (born in the late-1920s) had more negative and long-term consequences than did those in middle childhood (born in the early-1920s). 12 Combining Elder’s work with the geographic diversity of impacts of the recession cited above, it, in fact, likely is the case that there will be localized birth cohort impacts among those subpopulations and in those communities where the economic downturn reaches depression levels in 2009-2010 and lasts several years.

2009 FCD-CWI Report
**EMBARGOED UNTIL 12:01 AM EDT ON MAY 18, 2009**
22
we note that, as with any demographic, economic, or social projection or forecast, there are bands of uncertainty around the projections. A first source of uncertainty is the actual levels at which the economy will bottom and unemployment will peak. For instance, if the increase in the unemployment rate peaks at a 8.5 or 9 percent annual rate instead of the 9.5 percent used the in the projections, then the impacts we have described would be scaled back accordingly. On the other hand, if the unemployment rate goes to a 10 or 10.5 percent annual rate, then the impacts would be scaled up. A second source of uncertainty pertains to what will become the unique features of the current economic downturn. As with all recessions, there will be unique features of the current recession, such as its concentration in the housing-construction-real estate sector of the economy, the impacts of which are difficult to fully anticipate. These unique features also will produce observed outcomes that deviate somewhat from the expected values that we have charted. We believe, however, that the general outlines of the impacts that will be available in the historical record a few years from now when the data have been collected will be similar in many respects to our expectations – both for the Family Economic Well-Being Domain and its Key Indicators and for the other Well-Being Domains and Key Indicators – that have been stated above.
VI. Conclusion The comprehensive, composite view of well-being taken by the CWI leads to cross-walks and comparisons among the various dimensions tapped by its indicators. This analysis of interdependencies and interactions among indicators and dimensions of child and youth well-being alerts us to a number of negative consequences of the current economic downturn. There is a high probability that there will be some reversal of decades-long improvements. It is important for citizens, parents, and community and political leaders to be aware of these potential deteriorations so that actions at all levels of society can be taken for their amelioration.

2009 FCD-CWI Report
**EMBARGOED UNTIL 12:01 AM EDT ON MAY 18, 2009**
23
Acknowledgements and Contact Information
The Foundation for Child Development Child and Youth Well-Being Index Project at Duke University is coordinated by Kenneth C. Land, Ph.D., John Franklin Crowell Professor, Department of Sociology and Center for Demographic Studies, P.O. Box 90088, Duke University, Durham, NC 27708-0088 (e-mail: [email protected]). Other researchers involved in the project include Vicki L. Lamb, Ph.D. (North Carolina Central University and Duke University), Sarah O. Meadows, Ph.D. (Princeton University), and Hui Zheng, M.A. (Duke University). The Project is supported by grants from the Foundation for Child Development (http://www.fcd-us.org/). We especially acknowledge the support and encouragement of Ruby Takanishi, President, and Fasaha Traylor, Senior Program Officer, Foundation for Child Development. We also thank Kristin A. Moore, Ph.D. and Brett Brown, Ph.D. of Child Trends, Inc. (http://www.childtrends.org) and Donald Hernandez, Ph.D. of the State University of New York at Albany for invaluable advice and assistance in this project.
On the Web: More information about the CWI, its construction, and the scientific papers and publications on which it is based can be found on the World Wide Web:
http://www.soc.duke.edu/~cwi/

2009 FCD-CWI Report
**EMBARGOED UNTIL 12:01 AM EDT ON MAY 18, 2009**
24
Appendix A Methods of Construction and Indicator List for the CWI
Methods of Construction
Annual time series data (from vital statistics and sample surveys) were assembled on 28 national-level indicators in seven quality-of-life domains: Family Economic Well-Being, Health,
Safety/Behavioral Concerns, Educational Attainment, Community Connectedness, Social
Relationships, and Emotional/Spiritual Well-Being. These seven domains of quality of life have been well-established as recurring time after time in over three decades of empirical research in numerous subjective well-being studies. They also have been found, in one form or another, in studies of the well-being of children and youths. To calculate the CWI, each of the time series of the indicators is indexed by a base year (1975). The base year value of the indicator is assigned a value of 100 and subsequent values of the indicator are taken as percentage changes in the CWI. The directions of the indicators are oriented so that a value greater (lesser) than 100 in subsequent years means the social condition measured has improved (deteriorated).
The indexed Key Indicator time series then are grouped into the seven domains of well-being by equal weighting to compute the domain-specific Index values for each year. The seven domain-specific Indices then are grouped into an equally-weighted Child and Youth Well-Being Index value for each year. The CWI Project uses an equal-weighting strategy for constructing its composite indices for two reasons. First, it is the simplest and most transparent strategy and can easily be replicated by others. Second, statistical research done in conjunction with the CWI Project has demonstrated that, in the absence of a clear ordering of the indicators of a composite index by their relative importance to the composite and on which there is a high degree of consensus in the population, an equal weighting strategy is privileged in the sense that it will achieve the greatest level of agreement among the members of the population. In statistical terminology, the equal-weighting method is a minimax estimator. See Hagerty Michael R. and Kenneth C. Land 2007 “Constructing Summary Indices of Quality of Life: A Model for the Effect of Heterogeneous Importance Weights,” Sociological Methods and Research, 35(May):455-496.
Since it builds on the subjective well-being empirical research base in its identification of domains of well-being to be measured and the assignment of indicators to the domains, the CWI can be viewed as well-being-evidence-based measures of trends in averages of the social
conditions encountered by children and youth in the United States across recent decades.
2009 FCD-CWI Report
**EMBARGOED UNTIL 12:01 AM EDT ON MAY 18, 2009**
25
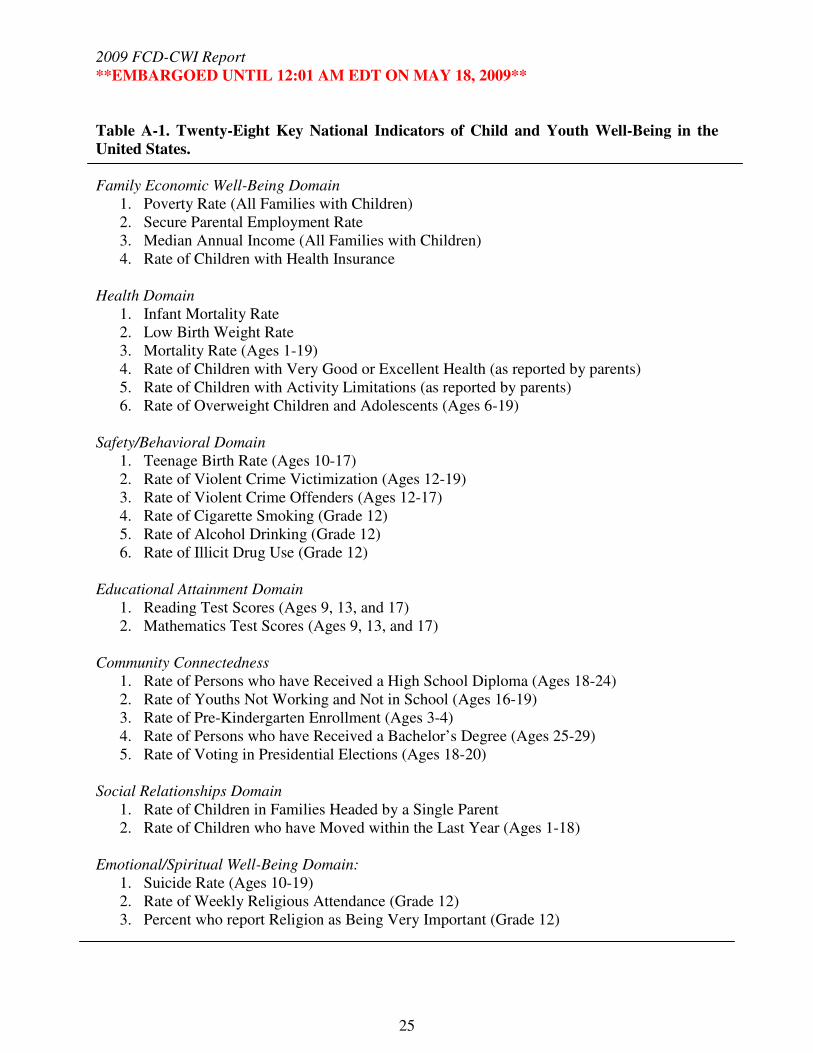
Table A-1. Twenty-Eight Key National Indicators of Child and Youth Well-Being in the United States. Family Economic Well-Being Domain
1. Poverty Rate (All Families with Children) 2. Secure Parental Employment Rate 3. Median Annual Income (All Families with Children) 4. Rate of Children with Health Insurance
Health Domain
1. Infant Mortality Rate 2. Low Birth Weight Rate 3. Mortality Rate (Ages 1-19) 4. Rate of Children with Very Good or Excellent Health (as reported by parents) 5. Rate of Children with Activity Limitations (as reported by parents) 6. Rate of Overweight Children and Adolescents (Ages 6-19)
Safety/Behavioral Domain
1. Teenage Birth Rate (Ages 10-17) 2. Rate of Violent Crime Victimization (Ages 12-19) 3. Rate of Violent Crime Offenders (Ages 12-17) 4. Rate of Cigarette Smoking (Grade 12) 5. Rate of Alcohol Drinking (Grade 12) 6. Rate of Illicit Drug Use (Grade 12)
Educational Attainment Domain
1. Reading Test Scores (Ages 9, 13, and 17) 2. Mathematics Test Scores (Ages 9, 13, and 17)
Community Connectedness
1. Rate of Persons who have Received a High School Diploma (Ages 18-24) 2. Rate of Youths Not Working and Not in School (Ages 16-19) 3. Rate of Pre-Kindergarten Enrollment (Ages 3-4) 4. Rate of Persons who have Received a Bachelor’s Degree (Ages 25-29) 5. Rate of Voting in Presidential Elections (Ages 18-20)
Social Relationships Domain
1. Rate of Children in Families Headed by a Single Parent 2. Rate of Children who have Moved within the Last Year (Ages 1-18)
Emotional/Spiritual Well-Being Domain:
1. Suicide Rate (Ages 10-19) 2. Rate of Weekly Religious Attendance (Grade 12) 3. Percent who report Religion as Being Very Important (Grade 12)

2009 FCD-CWI Report
**EMBARGOED UNTIL 12:01 AM EDT ON MAY 18, 2009**
26
Note: Unless otherwise noted, indicators refer to children ages 0-17.
Appendix B
Sources of Data for the CWI Child Poverty US Bureau of the Census, March Population Survey, Current Population Reports, Consumer
Income, Series P-60, Washington, D.C.: US Bureau of the Census. http://www.census.gov/hhes/www/poverty/histpov/hstpov3.xls 1975-present
Secure Parental Employment
US Bureau of the Census, March Current Population Survey, Washington, D.C.: US Bureau of the Census. Available from Forum on Child and Family Statistics, http://childstats.ed.gov/americaschildren/tables/econ2.asp 1980-present. Special tabulation from CPS CD 1975-1979.
Median Annual Income
US Bureau of the Census, March Current Population Survey, Historical Income Tables – Families, Washington, D.C.: US Bureau of the Census. http://www.census.gov/hhes/www/income/histinc/f10AR.html 1975-present.
Health Insurance US Bureau of the Census, Housing and Household Economic Statistics Division, unpublished tabulations from the March Current Populations Surveys, Washington, DC: US Bureau of the Census. Special tabulation by Federal Intra-agency Forum http://www.census.gov/hhes/www/hlthins/historic/hihistt3.xls 1987–present.
Infant Mortality CDC, National Center for Health Statistics, National Vital Statistics System, Monthly Vital Statistics Report (v25-v46), National Vital Statistics Report (v47-v49): Hyattsville, MD: NCHS. http://www.cdc.gov/nchs/data/nvsr/nvsr56/nvsr56_21.htm#ldt 1975-present.
Low Birth Weight CDC, National Center for Health Statistics, National Vital Statistics System, Report of Final Natality Statistics, Monthly Vital Statistics Reports (1975-1996), National Vital Statistics Reports (1997-present). Hyattsville, MD: NCHS. http://www.cdc.gov/nchs/data/nvsr/nvsr57/nvsr57_12.pdf
Child and Adolescent Mortality
CDC, National Center for Health Statistics, National Vital Statistics System, Leading Causes of Death. http://www.cdc.gov/nchs/data/nvsr/nvsr56/nvsr56_16.pdf 1975–present.
Subjective Health and Activity Limitations
CDC, National Center for Health Statistics, National Health Interview Survey, Hyattsville, MD: National Center for Health Statistics. www.cdc.gov/nchs Available from Forum on Child and Family Statistics, http://www.childstats.gov/ 1984–present.
Obesity CDC, National Center for Health Statistics, Health United States, 2003 and National Health and Nutrition Examination Survey (NHANES), Hyattsville, MD. www.cdc.gov/nchs/data/hus/tables/2003/03hus069.pdf 1975-present.
Teen Births CDC, National Center for Health Statistics, National Vital Statistics System. Monthly Vital Statistics Reports (1975-1996), National Vital Statistics Reports (1997-present). Hyattsville, MD: National Center for Health Statistics. http://www.cdc.gov/nchs/data/nvsr/nvsr57/nvsr57_12.pdf
Crime Victimization
US Department of Justice, Bureau of Justice Statistics, National Crime Victimization Survey and FBI Supplementary Homicide Reports. Available from Sourcebook of Criminal Justice Statistics Online, http://www.albany.edu/sourcebook/pdf/t342007.pdf 1975-present.
Violent Crime Offenders
US Department of Justice, Bureau of Justice Statistics, National Crime Victimization Survey. http://www.ojp.usdoj.gov/bjs/ 1975-present.
Smoking, Drinking, and Drugs
The Monitoring the Future Study, Institute for Social Research, University of Michigan: Ann Arbor, MI. www.monitoringthefuture.org/data/data.html, 1975-present.
Reading and Mathematics Scores
US Department of Education Statistics, National Assessment of Education Progress (NAEP). http://nces.ed.gov/nationsreportcard 1975-present.
High School Completion
US Bureau of the Census, October Current Population Surveys, Washington, D.C.: US Bureau of the Census. http://www.census.gov/population/socdemo/school/TableA-5a.xls

2009 FCD-CWI Report
**EMBARGOED UNTIL 12:01 AM EDT ON MAY 18, 2009**
27
1975-present.
Not Working and Not in School
US Bureau of Labor Statistics, Current Population Surveys, Washington, D.C.: US Bureau of the Census. Available from Forum on Child and Family Statistics, http://www.childstats.gov/ 1985-present. Special tabulation from CPS CD, 1975-1984.
Preschool Enrollment
US Department of Education, National Center for Education Statistics, Digest of Education Statistics and Bureau of the Census, Current Population Survey. http://www.nces.ed.gov/programs/digest/d07/tables/dt07_006.asp, 1980-present, interpolated years 1976-1979.
Bachelor’s Degree US Department of Education, National Center for Education Statistics, Condition of Education http://nces.ed.gov/programs/coe/2008/section3/table.asp?tableID=907, 1975-present.
Voting in Presidential Elections
US Bureau of the Census, Current Population Reports, Series P-20, Voting and Registration, Washington, D.C.: US Bureau of the Census http://www.census.gov/population/www/socdemo/voting/cps2004.html 1975-present.
Single Parent Families
US Bureau of the Census, Current Population Reports, Marital Status and Living Arrangements, Annual Reports. http://www.census.gov/population/socdemo/hh-fam/cps2007/tabC3-all.xls 1975–present.
Residential Mobility
US Bureau of the Census, Series P-20, Geographic Mobility, Washington, D.C.: US Bureau of the Census. http://www.census.gov/population/socdemo/migration/cps2007/tab01-01.xls 1975-present.
Suicide CDC, National Center for Health Statistics, National Vital Statistics System. www.cdc.gov/nchs//datawh/statab/unpubd/mortabs.htm 1975-present.
Church Attendance and Importance
The Monitoring the Future Study, Institute for Social Research, University of Michigan: Ann Arbor, MI. http://www.monitoringthefuture.org/ 1975-present.
2009 FCD-CWI Report
**EMBARGOED UNTIL 12:01 AM EDT ON MAY 18, 2009**
28
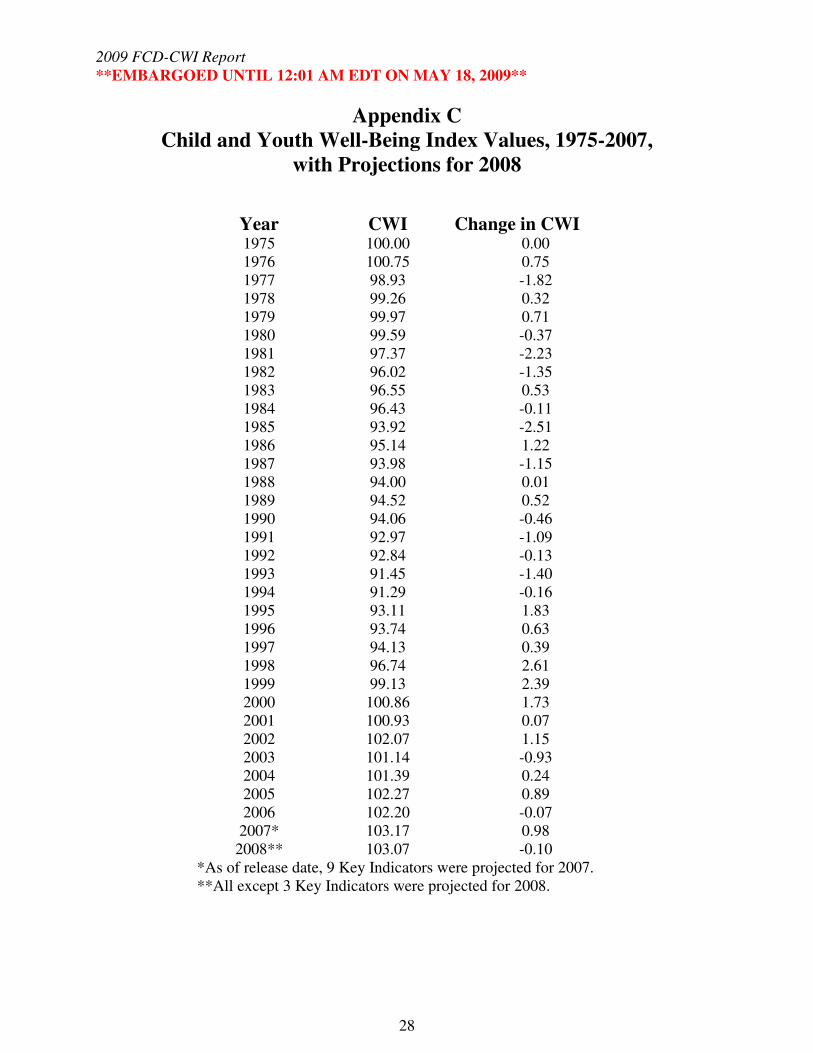
Appendix C Child and Youth Well-Being Index Values, 1975-2007,
with Projections for 2008
Year CWI Change in CWI 1975 100.00 0.00 1976 100.75 0.75 1977 98.93 -1.82 1978 99.26 0.32 1979 99.97 0.71 1980 99.59 -0.37 1981 97.37 -2.23 1982 96.02 -1.35 1983 96.55 0.53 1984 96.43 -0.11 1985 93.92 -2.51 1986 95.14 1.22 1987 93.98 -1.15 1988 94.00 0.01 1989 94.52 0.52 1990 94.06 -0.46 1991 92.97 -1.09 1992 92.84 -0.13 1993 91.45 -1.40 1994 91.29 -0.16 1995 93.11 1.83 1996 93.74 0.63 1997 94.13 0.39 1998 96.74 2.61 1999 99.13 2.39 2000 100.86 1.73 2001 100.93 0.07 2002 102.07 1.15 2003 101.14 -0.93 2004 101.39 0.24 2005 102.27 0.89 2006 102.20 -0.07
2007* 103.17 0.98 2008** 103.07 -0.10
*As of release date, 9 Key Indicators were projected for 2007. **All except 3 Key Indicators were projected for 2008.
2009 FCD-CWI Report
**EMBARGOED UNTIL 12:01 AM EDT ON MAY 18, 2009**
29
A Note on the Accuracy of CWI Projections The values of several of the time series of the 28 Key Indicators (particularly in Health) in the CWI tend to be published with lags of two to three years behind the current calendar year. In order to provide updated values that can be used for calculating the CWI for the most recent two years, the Project accordingly has estimated statistical time series models for those time series that lag in publication. Since these time series tend to be relatively slowly moving, it has been found that the resulting projected values are fairly accurate and produce overall CWI values that also are relatively accurate. Some recent comparisons:
� In the 2005 CWI Report, we projected an increase of 0.63 in the Index from 2003 to 2004. This compares to an observed increase of 0.24.
� In the 2006 CWI Report, we projected an increase of 0.76 in the Index from 2004 to 2005. This compares to an observed increase of 0.89.
� In the 2007 CWI Report, we projected an increase of 0.01 in the Index from 2005 to 2006. This compares to an observed increase of -0.07.
� In the 2008 CWI Report, we projected an increase of 0.45 in the Index from 2006 to 2007. This compares to an observed increase of 0.98.
Because of lags in the availability of Key Indicators series (particularly in Health) and occasional revisions of previously published data points, it is not expected that our projected values will be completely accurate. However, the projections have been fairly close to the real data series.
2009 FCD-CWI Report
**EMBARGOED UNTIL 12:01 AM EDT ON MAY 18, 2009**
30
Appendix D Medium-Term and Long-Term Changes in the CWI
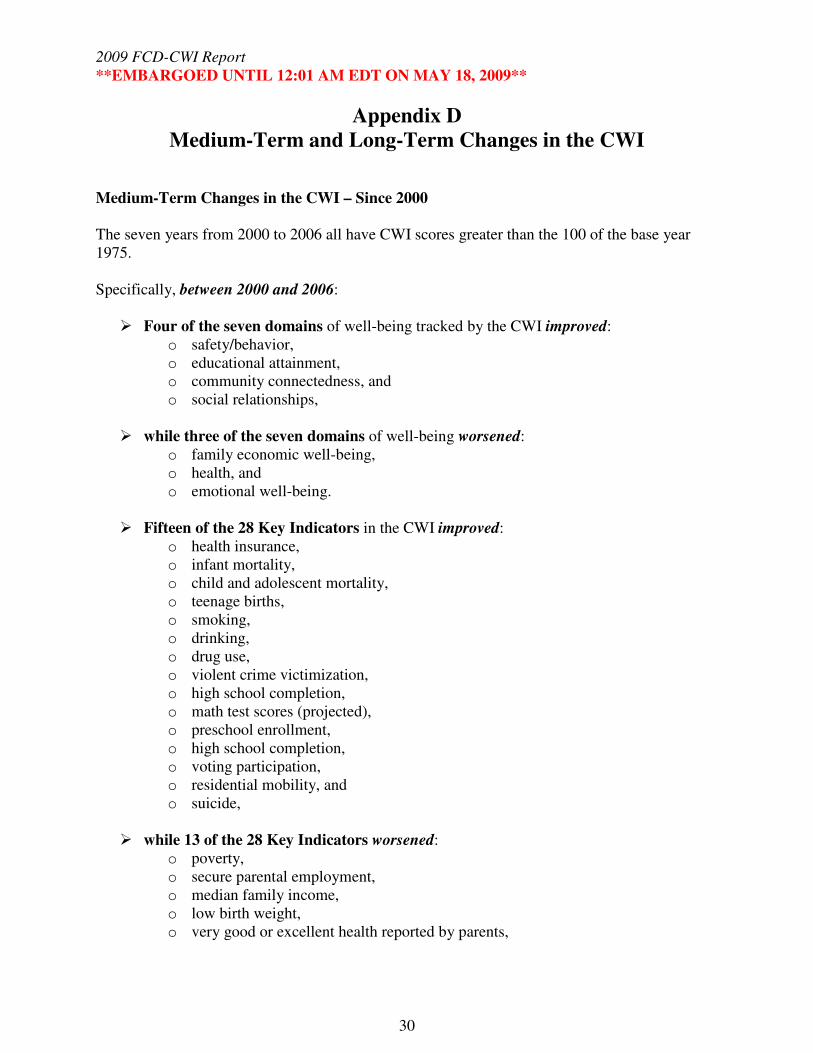
Medium-Term Changes in the CWI – Since 2000 The seven years from 2000 to 2006 all have CWI scores greater than the 100 of the base year 1975. Specifically, between 2000 and 2006:
� Four of the seven domains of well-being tracked by the CWI improved: o safety/behavior, o educational attainment, o community connectedness, and o social relationships,
� while three of the seven domains of well-being worsened:
o family economic well-being, o health, and o emotional well-being.
� Fifteen of the 28 Key Indicators in the CWI improved:
o health insurance, o infant mortality, o child and adolescent mortality, o teenage births, o smoking, o drinking, o drug use, o violent crime victimization, o high school completion, o math test scores (projected), o preschool enrollment, o high school completion, o voting participation, o residential mobility, and o suicide,
� while 13 of the 28 Key Indicators worsened:
o poverty, o secure parental employment, o median family income, o low birth weight, o very good or excellent health reported by parents,

2009 FCD-CWI Report
**EMBARGOED UNTIL 12:01 AM EDT ON MAY 18, 2009**
31
o activity limitations, o overweight prevalence, o reading test scores (projected), o not working and not in school, o bachelor’s degree attainment, o single parent households, o religious attendance, and o religious importance.
Long-Term Changes – Since 1975 With its base year of 1975, the CWI also can be used to assess long-term changes (through 2006) in child and youth well-being. Specifically, since 1975:
� The overall composite CWI is up only about 2 percent over its 1975 base year value of 100.
� Four of the domains of well-being improved:
o family economic well-being, o safety/behavior, o educational attainment, and o community connectedness.
� Three of the domains of well-being deteriorated:
o health, o social relationships, and o emotional/spiritual well-being.
� Twenty-one of the 28 specific Key Indicators improved:
o median family income, o health insurance, o secure parental employment, o residential mobility, o infant mortality, o child and adolescent mortality, o very good or excellent health reported by parents, o teenage births, o smoking, o drinking, o drug use, o violent crime victimization, o violent crime offenders, o high school completion,

2009 FCD-CWI Report
**EMBARGOED UNTIL 12:01 AM EDT ON MAY 18, 2009**
32
o not working or in school, o college degree, o preschool enrollment, o voting, o reading, o math, and o religion importance
� Seven of the 28 Key Indicators deteriorated:
o poverty, o single parenthood, o low birth weight, o activity limitation reported by parents, o overweight, o suicide, and o church attendance.
Comparisons by Time-Period An analysis of the CWI by time-period over the 32 years from 1975 to 2006 helps to clarify the pattern of trends. Starting Ending Change
Index Index During
Value Value Period
Period
1975 – 1980 100.00 99.59 -0.41% 1980 – 1985 99.59 93.92 -5.69% 1985 – 1990 93.92 94.06 +0.15% 1990 – 1995 94.06 93.11 -1.01% 1995 – 2000 93.11 100.86 +8.32% 2000 – 2006 100.86 102.20 +1.33% In brief:
� The CWI showed relative stability in overall child and youth well-being in the five years from 1975 to 1980 followed by a sharp decline from 1980 to 1985.
� This was followed by further deterioration through the mid-1990s.
� The last half of the 1990s saw a strong recovery of the CWI to, or above, its 1975 value
of 100.

2009 FCD-CWI Report
**EMBARGOED UNTIL 12:01 AM EDT ON MAY 18, 2009**
33
� In the most recent period from 2000 to 2006, the Index improved slightly while exhibiting fluctuations up and down – down in 2002 and 2003 after 9/11 and the 2001-2002 recession, up in 2004, down slightly in 2005, and up slightly in 2006.