the 14th survey on business conditions of japanese ... · firms in the seven major latin american...
TRANSCRIPT
The 14th Survey on Business
Conditions of Japanese Companies in
Latin America
December, 2013
Japan External Trade Organization (JETRO)
Latin America Division, Overseas Research
Department

[DISCLAIMER]………………………………………………………………………………………………
Please use the information provided in this report at your own discretion and risk. At JETRO, we
aim to provide you with the most accurate data possible. However, we kindly ask for your
understanding that should you, the reader of this report, suffer financial loss, etc., in connection with
the report's contents, neither JETRO nor the authors of the report can be held responsible.
………………………………………………………………………………………………………………………

Preface
This report summarizes the results of the survey conducted between September and October
2013 by the Japan External Trade Organization (JETRO), on the business conditions of Japanese
firms in the seven major Latin American countries (Mexico, Venezuela, Colombia, Peru, Chile,
Brazil, and Argentina).
This is the 14th issue of the periodic survey conducted by JETRO. For each survey, the
Japanese companies in Latin America have given us considerable support, and we sincerely
appreciate their cooperation.
We hope that this report will be informative for Japanese companies in Latin America, as
well as for those looking to do business in the region.
Latin American Offices
Latin America Division, Overseas Research Department
Japan External Trade Organization (JETRO)

Contents
Chapter 1 ............................................................................................................................. 1
1. Response Situation by Country ......................................................................................... 1
2. Ratio of Manufacturing and Non-Manufacturing among Respondent Companies .............. 1
3. Product Category of Manufacturing Respondents ............................................................ 2
4. Business Category of Non-Manufacturing Respondents ................................................... 3
5. Location of Headquarters for Latin American Business................................................ 5
Chapter 2 ............................................................................................................................. 6
1. Operating Profits Forecast for 2013 .............................................................................. 6
Slightly Declining Trend from 2012.............................................................................................. 6
Business Sentiment Bottomed Out, Showing Recovery .................................................................. 7
The Lower the Profit Forecast, the Higher the Business Sentiment ...................................... 8
Expanding Domestic Market Large Factor for Profit Improvement .......................................... 10
Increasing Labor Costs Main Factor for Profit Decrease Forecast ...................................... 11
2. 2014 Forecasts for Operating Profits .......................................................................... 12
2014 Profits Expected to Further Improve ................................................................................ 12
Same Reasons as 2013 for Profit Increase ................................................................................ 14
Operating Profits Depend Greatly on Market Conditions ........................................................ 15
3. Business Outlook for the Future ................................................................................... 16
Business Outlook Varies by Country............................................................................................ 16
Business Expansion Based on Market Potential ......................................................................... 18
Most of Expansion Intended in Sales .......................................................................................... 19
Tighter Regulations Prompt Transfer/Withdrawal ..................................................................... 20
Localization of Labor Force, while Management Remains in Headquarters ........................... 21
Competent Employees Required for Localization ....................................................................... 22
Further Localization of Employees ............................................................................................. 23
Plans for Local Employee Increase Apparent in Mexico and Brazil ...................................... 24
4. Approaches for Market Development ............................................................................... 25
In Latin America Overall, Competition Highest Among Japanese Companies ......................... 25
Intensifying Market Competition ................................................................................................. 26
5. Issues on Business Management ....................................................................................... 27
Challenged with Emergence of Competitors and Price Reduction Requests ........................... 27
Financially Challenged by Exchange Rate Fluctuations and Taxation .................................. 28
Notable Increase in Wages of Employees .................................................................................... 29
Time-Consuming and Complicated Customs Procedure .................................................................. 30
Faced with Difficulties of Local Procurement ......................................................................... 31
Complex Tax and Administrative Procedures Prominent in Mercosur Countries ................... 32
[Reference] Benefits (Strengths) in the Investment Environment ........................................ 34
Concern over Security and Terrorism in Some Countries ........................................................ 35

Comparing Brazil and Mexico—Labor Costs, Taxation, and Administrative Procedures ...... 36
6. Procurement Situation of Raw Material and Parts ...................................................... 37
High Ratio of Local Procurement in Brazil ............................................................................... 37
Procurement Mostly from Japan, Though Less Than Previous Survey ...................................... 39
7. FTA/EPA Utilization and Problems ................................................................................. 40
Mexico: Over 50% FTA Utilization in All Areas ....................................................................... 40
Brazil: High Use of Mercosur, as Well as Auto Sector Agreement with Mexico for Imports
.......................................................................................................................................................... 41
Chile: Over 70% Utilization for Imports in All Regions ....................................................... 42
Argentina: Utilization of Mercosur as Well as Auto Sector Agreement with Mexico ........ 43
Colombia: Used for Exports to the Andean Community, and Imports from Mercosur and Mexico
.......................................................................................................................................................... 44
Peru: High Utilization for Imports............................................................................................ 45
Venezuela: Only Using FTA with Mercosur .................................................................................. 46
Issues on Export FTAs—Receiving Certificate of Origin and Capable Staff Shortage ...... 47
Demand for FTA Conclusion ............................................................................................................ 48
Questionnaire survey tables……………….……………………………….……………....……….49

1
Copyright © 2013 JETRO. All rights reserved
Chapter 1 Outline of the Survey
1. Response Situation by Country
From September to October 2013, we conducted a questionnaire survey on business conditions
of Japanese companies in seven Latin American countries (Mexico, Venezuela, Colombia, Peru,
Chile, Brazil, and Argentina). The questionnaires were sent to 742 companies. We received
responses from a record-high 436 companies, giving a return rate of 58.8%.
Chart: Number of Questionnaires sent, number of responses, response rate
Surveyed Countries Questionnaires
Sent
Respondent
Companies
Response
Rate
Mexico 210 105 50.0%
Venezuela 23 19 82.6%
Colombia 29 22 75.9%
Peru 21 14 66.7%
Chile 54 36 66.7%
Brazil 359 206 57.4%
Argentina 46 34 73.9%
Latin American Total 742 436 58.8%
2. Ratio of Manufacturing and Non-Manufacturing among Respondent Companies
Of those who responded, 181 companies (41.5%) were operating as manufacturers in Latin
America, and 255 companies (58.5%) were non-manufacturers.
Fig 0-1: Breakdown of Respondents by Industry

2
Copyright © 2013 JETRO. All rights reserved
3. Product Category of Manufacturing Respondents
As for the product category of the respondent manufacturers, “Parts for transportation
machinery (car and motor cycle)” had the most respondents, followed by “Electric &
electronic parts,” “Transportation machinery (car and motor cycle),” and “Food,
agriculture & fishery processing.”
Fig. 0-2: Number of Respondents by Product Category in Manufacturing (181 companies)
Manufacturing
41.5% Non-
manufacturing
58.5%

3
Copyright © 2013 JETRO. All rights reserved
4. Business Category of Non-Manufacturing Respondents
Looking at the respondent non-manufacturers by business category, the largest number
belonged to “Sales,” followed by “Trading,” “Other non-manufacturing industries,” and
“Transportation/warehouse.”
Fig 0-3: Number of Respondents by Business Category in Non-Manufacturing (255 companies)
35
20
20
16
12
10
10
8
7
6
5
5
3
3
3
3
2
2
1
1
0
0
9
0 10 20 30 40
Parts for transportation machines
Electric and electronic parts
Transportation machines
Food, agriculture, and fishery processing
Electric machines
Chemical products, oil products
Machines
Steel
Metal goods
Precision machines and apparatuses
Clothes and textiles
Pharmaceuticals
Textiles (yarn, woven fabric products)
Plastic products
Rubber goods
Non-ferrous metals
Timber and wood products (excluding furniture and
interior design products)
Ceramic, earth and stone products
Paper and pulp
Medical instruments
Furniture and interior design products
Printung / Publishing
Other manufacturing industries
(Companies)

4
Copyright © 2013 JETRO. All rights reserved
102
61
23
17
9
9
8
7
7
3
3
2
2
1
1
0
0 20 40 60 80 100 120
Sales
Trading
Other non-manufacturing industries
Transportation/warehouse
Telecommunications/IT
Construction/plant
Banking
Distribution
Insurance
Mining
Hotel/travel/food and restaurant service
Fishing and fisheries
Real estate
Agriculture and forestry
Legal and taxation service
Securities
(Companies)

5
Copyright © 2013 JETRO. All rights reserved
5. Location of Headquarters for Latin American Business
Respondents were asked to choose the location of their headquarters from four options: in
Japan, in North America, in Latin America, and other.
For Latin America overall, the majority of respondents had their business headquarters in
Japan, followed by North America, then Latin America. Looking at each country, companies in
Mexico had the largest ratio of North American headquarters, while many companies in Argentina
had headquarters in Latin America. Since these two countries are neighbored by economic giants
U.S. and Brazil, it is likely that the company headquarters are located there.
Fig. 0-4: Location of Headquarters for Latin American Operations
53.8
45.0
52.6
45.5
42.9
52.8
65.0
23.5
28.1
49.0
10.5
18.2
14.3
16.7
23.3
29.4
16.9
5.0
36.8
36.4
42.9
25.0
10.7
47.1
1.2
1.0
0.0
0.0
0.0
5.6
1.0
0.0
0% 20% 40% 60% 80% 100%
Latin America Total(
n=431)
Mexico(n=100)
Venezuela(n=19)
Colombia(n=22)
Peru(n=14)
Chile(n=36)
Brazil(n=206)
Argentina(n=34)
Headquarters in Japan
Regional headquarters in North America
Regional headquarters in Latin America
Other

6
Copyright © 2013 JETRO. All rights reserved
Chapter 2 Main Survey Results
1. Operating Profits Forecast for 2013
Slightly Declining Trend from 2012
For 2013 operating profits forecast, 57.1% (249 companies) answered they would have profits,
20.9% (91 companies) said they would break even, and 22.0% (96 companies) expected losses.
In the 2012 survey, “Profits” were 64.7% (202 companies), “Breakeven” were 19.9% (62
companies), and “Losses” were 15.4% (48 companies), so a slightly declining trend can be
seen in operating profits.
The percentage of “Profits” was high in Argentina, Colombia, and Venezuela, while low
in Peru and Brazil.
Fig. 1-1: Operating Profits Forecast for 2013
70.6
51.0
61.1
50.0
68.2
63.2
61.0
57.1
20.6
24.3
19.4
28.6
18.2
21.1
14.3
20.9
8.8
24.8
19.4
21.4
13.6
15.8
24.8
22.0
0% 20% 40% 60% 80% 100%
Argentina(n=34)
Brazil(n=206)
Chile(n=36)
Peru(n=14)
Colombia(n=22)
Venezuela(n=19)
Mexico(n=105)
Latin America Total(
n=436)
Profit Breakeven Loss

7
Copyright © 2013 JETRO. All rights reserved
Business Sentiment Bottomed Out, Showing Recovery
The respondents were asked whether their operating profits will “increase,” “remain the
same,” or “decrease” in 2013 compared to 2012. The diffusion index (DI= “increase” ratio
- “decrease” ratio) calculated from the survey result was 21.1 points. This is 10.5 points
higher than last year’s 10.6 points, and the business sentiment is recovering from the
two-year decline.
The DI value for 2014 (forecast) is even higher at 45.4 points, indicating that companies
have a positive outlook, expecting operating profits to continue to improve after 2014.
Fig. 1-2: Changes in DI Value for Latin America Overall
3.0
22.6
-7.4
10.3
19.9
39.5
26.2
38.3
30.2
-2.1
-10.8
40.8
24.2
10.6
21.1
45.4
-20
-10
0
10
20
30
40
50

8
Copyright © 2013 JETRO. All rights reserved
The Lower the Profit Forecast, the Higher the Business Sentiment
As for the DI value for each country, they were high in Brazil, Mexico, and Peru, while
low in Venezuela, Columbia, Chile, and Argentina. Comparing this result with the “Profits,”
“Breakeven,” or “Losses” ratio of operating profit forecast shown in Fig. 1-1, the
countries with a high ratio of “Profits” had lower DI values, and those with low “Profits”
had high DI values, thus showing a reverse phenomenon.
It seems that the companies with negative forecast consider that the economy has bottomed
out and the worst is over, so even though they currently forecast bad results, they feel that
it’s getting better than the previous year.
Meanwhile, in Venezuela, the regulation on foreign currency acquisition and the resulting
lack of raw materials, and high inflation rate discourage new entry into its market. Since
there is little competition, the companies are currently able to make profits. Yet it is
difficult to foresee the future with unstable politics and economy, which seems to result
in low business sentiments.
Fig. 1-3: DI Value by Country (2013)
21.1 24.8
-21.0 -18.2
21.5
2.8
32.5
8.8
-30
-20
-10
0
10
20
30
40

9
Copyright © 2013 JETRO. All rights reserved
Fig. 1-4: 2013 Operating Profits Forecast Compared to 2012
35.3
50.0
25.0
42.9
18.2
15.8
42.9
41.7
38.2
32.5
52.8
35.7
45.5
47.4
39.0
37.6
26.5
17.5
22.2
21.4
36.4
36.8
18.1
20.6
0% 20% 40% 60% 80% 100%
Argentina(n=34)
Brazil(n=206)
Chile(n=36)
Peru(n=14)
Colombia(n=22)
Venezuela(n=19)
Mexico(n=105)
Latin America Total(
n=436)
Increase Remain the same Decrease

10
Copyright © 2013 JETRO. All rights reserved
Expanding Domestic Market Large Factor for Profit Improvement
As the reasons for improvement in the profit forecast, “Sales increase in own country”
stand out at 67.6% (123 companies), followed by “Reduction of expenditure (management, energy
costs)” (23.6%, 43 companies), “Improvement of sales efficiency” (20.3%, 37 companies),
“Sales increase due to expansion of exports” (18.7%, 34 companies), and “Effects of
exchange rate fluctuation” (18.1%, 33 companies).
The results show that rather than the corporate efforts such as cost reduction and improved
efficiency, the expansion of the domestic market plays a larger role in profit forecasts.
Fig. 1-5: Reasons for Increase in 2013 Profit Forecast (Latin America overall, multiple
answers by 182 respondents)
8.8
11.0
15.4
17.0
18.1
18.7
20.3
23.6
67.6
0 20 40 60 80
Other
Reduction of labor costs
Improvement of production efficiency* (the
manufacturing industry only)
Reduction of procurement costs in your
country
Effects of exchange rate fluctuation
Sales increase due to expansion of exports
Improvement of sales efficiency
Reduction of other expenditures (e.g.,
management, administrative and energy costs)
Sales increase in your country
(%)

11
Copyright © 2013 JETRO. All rights reserved
Increasing Labor Costs Main Factor for Profit Decrease Forecast
For the reasons of decreased profit forecast, “Increase of labor costs” had the highest
score at 48.9% (44 companies), followed by “Sales decrease in own country” (46.7%, 42
companies), and “Effects of exchange rate fluctuation” (41.1%, 37 companies). Even in the
2011 and 2012 survey, “Increase of labor costs” had the highest score. The issue of labor
cost is considered to be a structural factor affecting corporate earnings.
Looking at each country, Argentina (66.7%), Chile (62.5%), and Brazil (61.1%) had high scores
for “Increase of labor costs,” while Colombia (25.0%) and Mexico (26.3%) had extremely low
scores for that reason, showing that the situation differs by country within Lain America.
As for Colombia, the main reasons for decreased profit forecast are “Sales decrease in own
country” (75.0%), Effects of exchange rate fluctuation” (37.5%), and “Costs insufficiently
passed along in sales prices” (37.5%). For Mexico, “Sales decrease in own country” (52.6%)
is given as the main reason for decreased profit forecast.
Fig. 1-6: Reasons for Decrease in 2013 Profit Forecast (Latin America overall, multiple
answers by 90 respondents)
31.1
3.3
14.4
28.9
30
31.1
41.1
46.7
48.9
0 10 20 30 40 50 60
Other
Rising interest rates
Sales decrease due to slowdown of exports
Increase of procurement costs in your country
Increase of other expenditures (e.g., management,
administrative and energy costs)
Costs insufficiently passed along in sales prices
Effects of exchange rate fluctuation
Sales decrease in your country
Increase of labor costs
(%)

12
Copyright © 2013 JETRO. All rights reserved
2. 2014 Forecasts for Operating Profits
2014 Profits Expected to Further Improve
The DI value showing the business sentiment for 2014 was 45.4 points for Latin America
overall. This is significantly higher than the 2013 figure of 21.1, reflecting the companies’
expectations for improved profits in 2014.
Looking at each country, all except Venezuela have higher DI values for 2014 compared
to 2013. As we have seen in Fig. 1-1, Venezuela had a high ratio of companies expecting profits
for 2013, but the future outlook is unclear due to political and economic instability,
resulting in low business sentiment for both 2013 and 2014.
Fig. 2-1: DI Value by Country (2014)
45.4
58.1
-21.1
54.6 50.0
30.6
50.9
17.6
-30
-20
-10
0
10
20
30
40
50
60
70
13
Copyright © 2013 JETRO. All rights reserved
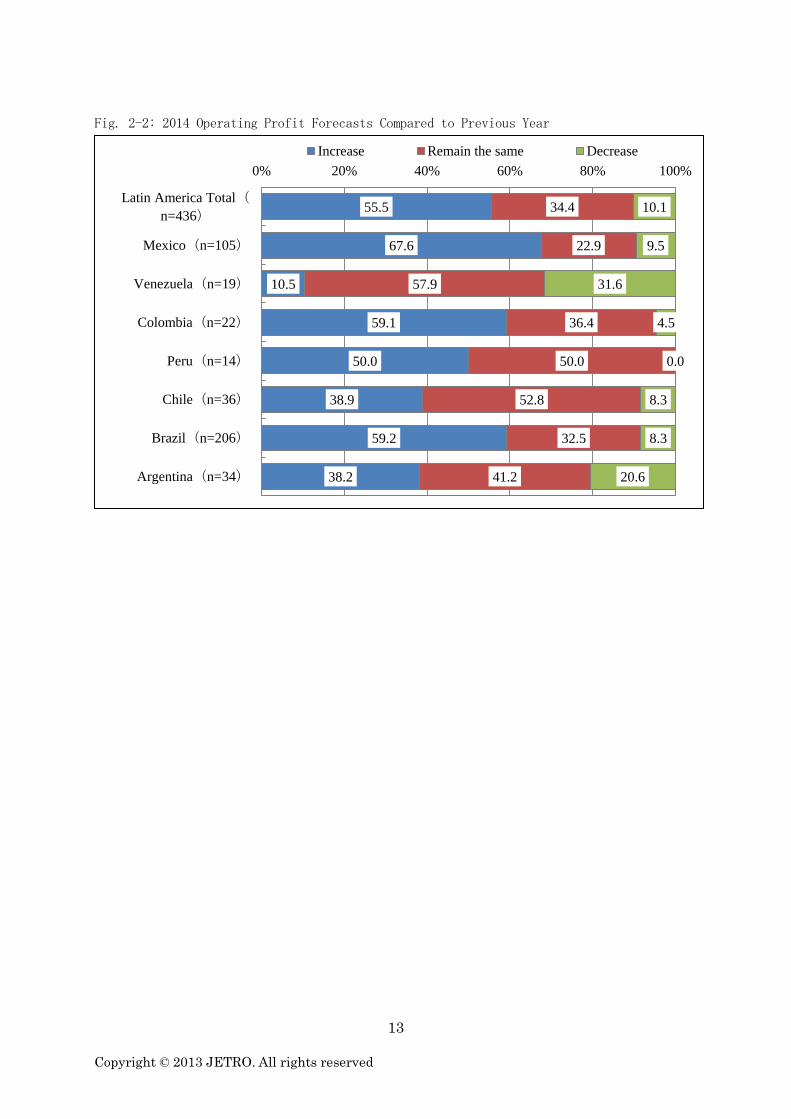
Fig. 2-2: 2014 Operating Profit Forecasts Compared to Previous Year
55.5
67.6
10.5
59.1
50.0
38.9
59.2
38.2
34.4
22.9
57.9
36.4
50.0
52.8
32.5
41.2
10.1
9.5
31.6
4.5
0.0
8.3
8.3
20.6
0% 20% 40% 60% 80% 100%
Latin America Total(
n=436)
Mexico(n=105)
Venezuela(n=19)
Colombia(n=22)
Peru(n=14)
Chile(n=36)
Brazil(n=206)
Argentina(n=34)
Increase Remain the same Decrease

14
Copyright © 2013 JETRO. All rights reserved
Same Reasons as 2013 for Profit Increase
For reasons on operating profits increase, “Sales increase in own country” scored the
highest at 77.3%, way ahead of “Improvement of sales efficiency” (29.8%) and “Sales
increase due to expansion of exports” (21.1%). Although the order is slightly different,
the results are roughly the same as the reasons for increase in 2013 profit forecast.
Fig. 2-3: Reasons for Increase in 2014 Profit Forecast (Latin America overall, multiple
answers by 242 respondents)
10.7
4.1
9.1
15.3
15.7
16.5
21.1
29.8
77.3
0.0 25.0 50.0 75.0 100.0
Other
Effects of exchange rate fluctuation
Reduction of labor costs
Improvement of production efficiency (the
manufacturing industry only)
Reduction of other expenditures (e.g.,
management, administrative and energy costs)
Reduction of procurement costs in your country
Sales increase due to expansion of exports
Improvement of sales efficiency
Sales increase in your country
(%)

15
Copyright © 2013 JETRO. All rights reserved
Operating Profits Depend Greatly on Market Conditions
The main reasons for decrease in operating profit forecast are “Decrease of sales volume
in own country” (53.5%), “Increase of labor costs” (51.2%), and “Increase of other
expenditures (management, administrative, and energy costs)” (41.9%). As shown in Fig. 2-3,
the major reason for increases in operating profit forecast was “Sales increase in own
country,” while the major reason for decreases is also “Sales decrease in own country,”
showing relations with market conditions. It can be viewed to mean that while market expansion
leads to improved operating profits, the tougher competition reduces sales and weighs on the
operating profits.
We can also see that increases in labor and management costs negatively affect the operating
profits.
Fig. 2-4: Reasons for Decrease in 2014 Profit Forecast (Latin America overall, multiple
answers by 43 respondents)
37.2
9.3
16.3
25.6
27.9
37.2
41.9
51.2
53.5
0 10 20 30 40 50 60
Other
Rising interest rates
Sales decrease due to slowdown exports
Effects of exchange rate fluctuation
Increase of procurement costs in your country
Costs insufficiently passed along in sales prices
Increase of other expenditures (e.g., management,
administrative and energy costs)
Increase of labor costs
Sales decrease volume in your country
(%)

16
Copyright © 2013 JETRO. All rights reserved
3. Business Outlook for the Future
Business Outlook Varies by Country
For Latin America overall, concerning the business outlook in the next one or two years,
67.7% (295 companies) answered “Expansion,” far exceeding the answers “Remain the same”
at 27.3% (119 companies) and “Reduction” at 4.1% (18 companies).
Looking at each country, 76.2% in both Brazil and Mexico answered “Expansion,” followed
by 71.4% in Peru. In contrast, “Remain the same” scored the highest in Venezuela (68.4%)
and Argentina (55.9%).
In Venezuela and Argentina, there are many factors of political and economic uncertainty
such as import regulations, exchange control, sales price control due to high inflation, and
unstable government. So it can be assumed that compared to other countries, the ratio of
“Reduction” and “Transferring to a third country/region or withdrawal from own country”
were higher. Especially in Venezuela, although all companies answered “Remain the same”
in the previous survey, this time, some companies answered “Reduction” and “Transferring
to a third country/region or withdrawal from own country.”
In Venezuela, various factors with negative impact on business are becoming apparent, such
as excess social security for the poor, stagnating capital investment in the main oil industry,
the accompanying delays in foreign currency issuance for import settlement with decreasing
foreign reserve, and the resulting goods shortages and inflation. In March 2013, President
Chavez died and the administration was succeeded by President Maduro. Yet the situation shows
no signs of improvement, and some companies may be considering pulling out their business.
However, both Venezuela and Argentina are rich in natural resources with a relatively large
population and market. So many companies still have not decided on reduction or withdrawal,
but are taking a wait-and-see attitude.

17
Copyright © 2013 JETRO. All rights reserved
Fig. 3-1: Business Outlook for the Next 1-2 years
67.7
76.2
10.5
68.2
71.4
55.6
76.2
32.4
27.3
17.1
68.4
27.3
28.6
38.9
21.8
55.9
4.1
5.7
10.5
4.5
0.0
5.6
1.5
11.8
0.9
1.0
10.5
0.0
0.0
0.0
0.5
0.0
0% 20% 40% 60% 80% 100%
Latin America Total(
n=436)
Mexico(n=105)
Venezuela(n=19)
Colombia(n=22)
Peru(n=14)
Chile(n=36)
Brazil(n=206)
Argentina(n=34)
Expansion
Remaining the same
Reduction
Transferring to a third country/region or withdrawal from your country

18
Copyright © 2013 JETRO. All rights reserved
Business Expansion Based on Market Potential
The main reasons given for business expansion were “Sales increase” (86.8%) and “High
growth potential” (59.7%).
Looking at each country, the answer “Sales increase” was high in Venezuela (100.0%, 2
companies), Mexico (93.8%, 75 companies), and Colombia (93.3%, 14 companies), while “High
growth potential” scored high in Venezuela (100.0%, 2 companies), Colombia (86.7%, 13
companies), and Peru (80.0%, 8 companies).
Overall, many companies are planning to expand their business based on market growth and
high potential, and few consider “Ease in securing labor force” or “Deregulation” as
reasons for business expansion.
Fig. 3-2: Reasons for “Expansion” (Latin America overall, multiple answers by 295
respondents)
4.4
1.4
2.7
9.8
18.6
20.7
25.1
59.7
86.8
0 20 40 60 80 100
Other
Deregulation
Ease in securing labor force
Reduction of costs (e.g., procurement costs,
labor costs)
Reviewing production and sales networks
High receptivity for high-value added products
Relationship with clients
High growth potential
Sales increase
(%)

19
Copyright © 2013 JETRO. All rights reserved
Most of Expansion Intended in Sales
As for the specific area intended for expansion, “Sales function” (71.9%) ranks way at
the top, while “Production (general products)” (26.1%), “Production (high-value added
products)” (25.8%), and “Logistics function” (20.7%) follow far behind.
Looking at each country, high scores in “Sales function” were noted in Peru (90%, 9
companies), Colombia (86.7%, 13 companies), and Chile (80.0%, 16 companies).
For Latin America overall, those who answered they would expand “Production” and
“Logistics” functions remained in the 20% level, showing that strengthening of sales is
the main focus in developing business in the Latin American market.
Fig. 3-3: Areas of Expansion (Latin America overall, multiple answers)
9.2
6.4
8.8
11.9
20.7
25.8
26.1
71.9
0 20 40 60 80
Other
R&D
Function of regional headquarters
Function for service administration (e.g., shared
services, call center)
Logistics function
Production (high-value added products)
Production (ubiquitous products)
Sales function
(%)
20
Copyright © 2013 JETRO. All rights reserved
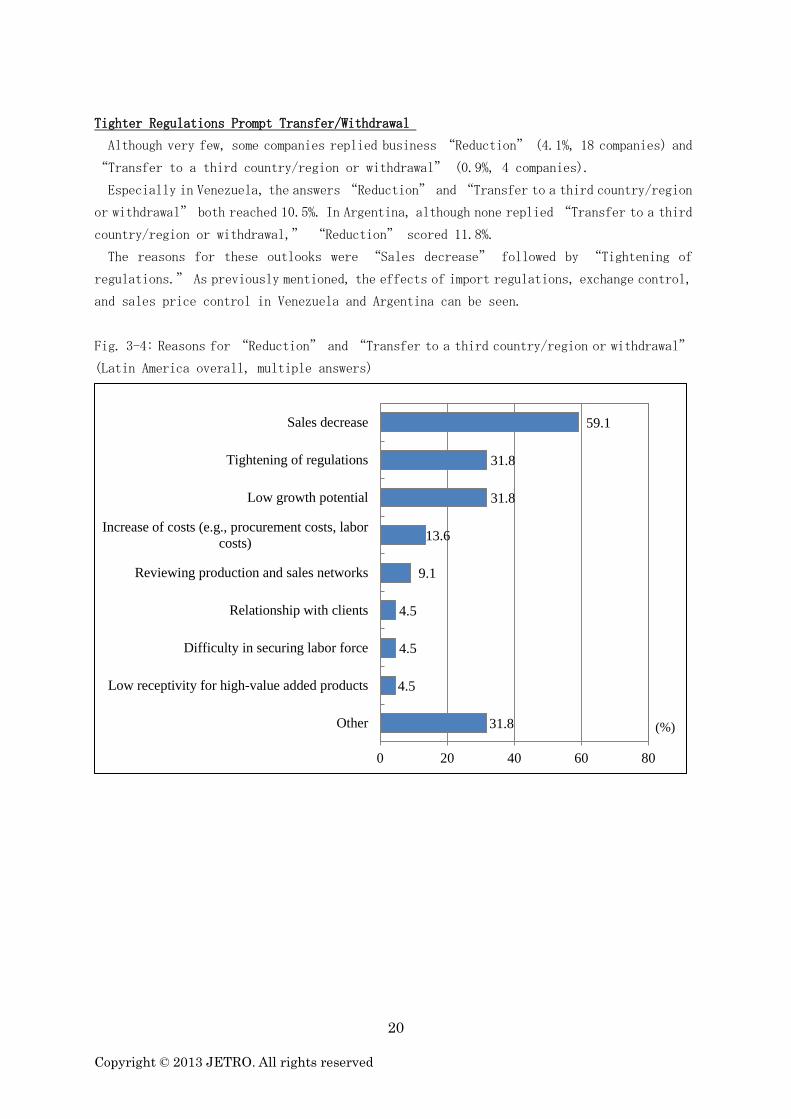
Tighter Regulations Prompt Transfer/Withdrawal
Although very few, some companies replied business “Reduction” (4.1%, 18 companies) and
“Transfer to a third country/region or withdrawal” (0.9%, 4 companies).
Especially in Venezuela, the answers “Reduction” and “Transfer to a third country/region
or withdrawal” both reached 10.5%. In Argentina, although none replied “Transfer to a third
country/region or withdrawal,” “Reduction” scored 11.8%.
The reasons for these outlooks were “Sales decrease” followed by “Tightening of
regulations.” As previously mentioned, the effects of import regulations, exchange control,
and sales price control in Venezuela and Argentina can be seen.
Fig. 3-4: Reasons for “Reduction” and “Transfer to a third country/region or withdrawal”
(Latin America overall, multiple answers)
31.8
4.5
4.5
4.5
9.1
13.6
31.8
31.8
59.1
0 20 40 60 80
Other
Low receptivity for high-value added products
Difficulty in securing labor force
Relationship with clients
Reviewing production and sales networks
Increase of costs (e.g., procurement costs, labor
costs)
Low growth potential
Tightening of regulations
Sales decrease
(%)

21
Copyright © 2013 JETRO. All rights reserved
Localization of Labor Force, while Management Remains in Headquarters
In relation to the business outlook, we also asked about the localization of the management.
The high scoring answers were “Focusing on the training of local employees” (70.9%, 309
companies), “Hiring director or manager-level employees” (62.4%, 272 companies), “Hiring
experienced employees who can contribute to the localization of management” (53.4%, 233
companies). Within each country, the answers were roughly in the same order as in Latin America
overall.
Meanwhile, “Strengthening the capacity of production and service development in the region”
(23.2%, 101 companies),“Giving the regional Headquarters more power to make strategies”
(18.1%, 79 companies) and “Transferring authority from headquarter to region” (14.7%, 64
companies) scored low. This shows that although the labor force continues to be localized,
the management authority remains at the headquarters.
Fig. 3-5: Efforts Toward Localization (Latin America overall, multiple answers)
2.5
3.7
4.8
14.7
18.1
23.2
27.5
31.4
53.4
62.4
70.9
0 20 40 60 80
Other
Acquiring human resources and management
resources through M&A activities
No actions taken to promote the localization of
management
Transferring authority to make decisions from
the headquarters in Japan to the regional
headquarters
Giving the regional headquarters more power to
make sales strategies
Strengthening the capability of production and
service development in the regional
headquarters
Hiring executive-level employees
Improving the personnel system such as
introducing a merit system
Hiring experienced employees who can
contribute to the localization of management
Hiring director or manager-level employees
Focusing on the training of local employees
(%)

22
Copyright © 2013 JETRO. All rights reserved
Competent Employees Required for Localization
As for the problems in pursuing localization of management, “Difficulty in hiring executive
level employees” (44.7%, 195 companies), “Poor capabilities and motivation of local
employees” (41.5%, 181 companies), and “Slow progress in the training of local employees”
(25.2%, 110 companies) were the top reasons for Latin America overall. But when we look at
each country, the answers come in a different order.
For example, in Peru, 50.0% of the companies gave “Lack of language proficiency (Japanese
and English) in employees” as the highest scoring answer, but it is not a big issue in Colombia
(13.6%) or Mexico (15.2%). In Argentina, “No problems” came in second at 29.4% following
“Difficulty in hiring executive level employees” (35.3%), and there seems to be little
problem in localization.
Fig. 3-6: Problems Concerning Localization of Management (Latin America overall, multiple
answers)
13.1
6.9
3.4
8.5
10.3
14.9
16.7
17.9
23.2
25.2
41.5
44.7
0 20 40 60
No problems regarding the localization of management
Other
Disagreement between the headquarters in Japan and
regional headquarters in the regarding recruitment
Poor production and service development capability in
the regional headquarters
Difficulty in reducing the number of expats from the
headquarters in Japan
Difficulty in transferring authority to make decisions
from the headquarters in Japan to the regional
headquarters
Poor planning and marketing capability in the regional
headquarters
High turnover rate of executive level employees
Language barriers (the lack of Japanese language
proficiency)
Slow progress in the training of local employees
Poor capabilities and motivation of local employees
Difficulty in hiring executive level employees
(%)
23
Copyright © 2013 JETRO. All rights reserved
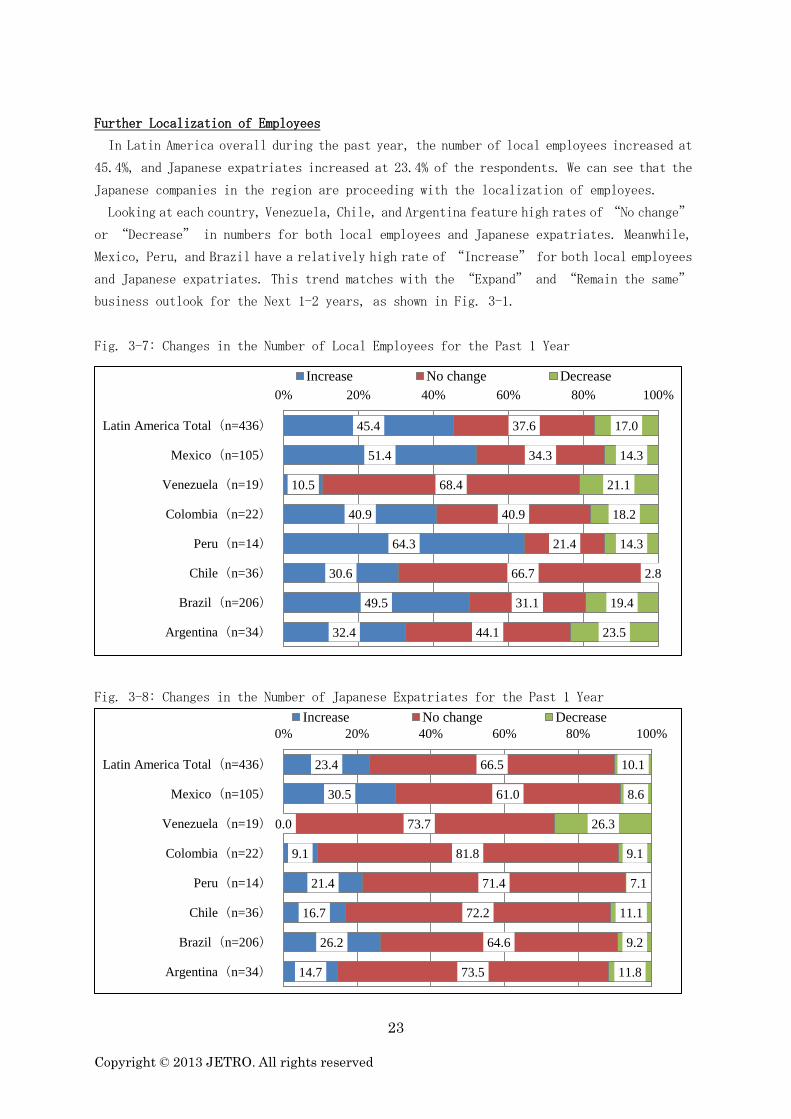
Further Localization of Employees
In Latin America overall during the past year, the number of local employees increased at
45.4%, and Japanese expatriates increased at 23.4% of the respondents. We can see that the
Japanese companies in the region are proceeding with the localization of employees.
Looking at each country, Venezuela, Chile, and Argentina feature high rates of “No change”
or “Decrease” in numbers for both local employees and Japanese expatriates. Meanwhile,
Mexico, Peru, and Brazil have a relatively high rate of “Increase” for both local employees
and Japanese expatriates. This trend matches with the “Expand” and “Remain the same”
business outlook for the Next 1-2 years, as shown in Fig. 3-1.
Fig. 3-7: Changes in the Number of Local Employees for the Past 1 Year
Fig. 3-8: Changes in the Number of Japanese Expatriates for the Past 1 Year
45.4
51.4
10.5
40.9
64.3
30.6
49.5
32.4
37.6
34.3
68.4
40.9
21.4
66.7
31.1
44.1
17.0
14.3
21.1
18.2
14.3
2.8
19.4
23.5
0% 20% 40% 60% 80% 100%
Latin America Total(n=436)
Mexico(n=105)
Venezuela(n=19)
Colombia(n=22)
Peru(n=14)
Chile(n=36)
Brazil(n=206)
Argentina(n=34)
Increase No change Decrease
23.4
30.5
0.0
9.1
21.4
16.7
26.2
14.7
66.5
61.0
73.7
81.8
71.4
72.2
64.6
73.5
10.1
8.6
26.3
9.1
7.1
11.1
9.2
11.8
0% 20% 40% 60% 80% 100%
Latin America Total(n=436)
Mexico(n=105)
Venezuela(n=19)
Colombia(n=22)
Peru(n=14)
Chile(n=36)
Brazil(n=206)
Argentina(n=34)
Increase No change Decrease
24
Copyright © 2013 JETRO. All rights reserved
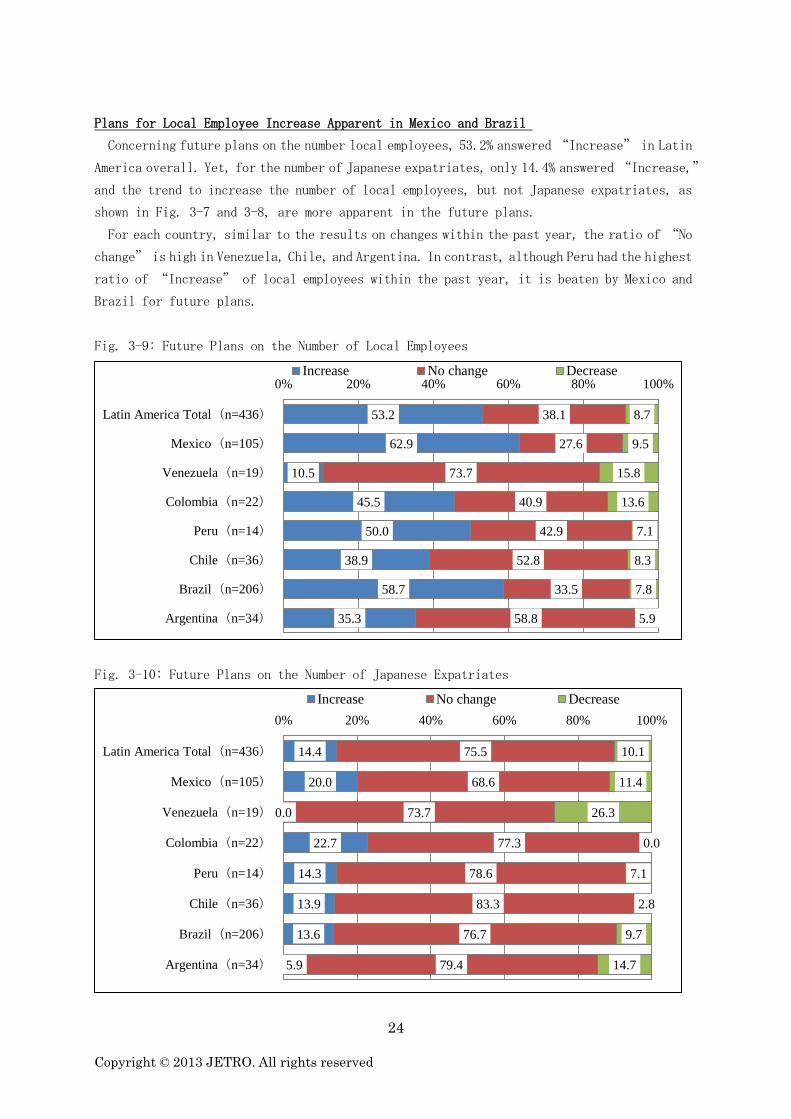
Plans for Local Employee Increase Apparent in Mexico and Brazil
Concerning future plans on the number local employees, 53.2% answered “Increase” in Latin
America overall. Yet, for the number of Japanese expatriates, only 14.4% answered “Increase,”
and the trend to increase the number of local employees, but not Japanese expatriates, as
shown in Fig. 3-7 and 3-8, are more apparent in the future plans.
For each country, similar to the results on changes within the past year, the ratio of “No
change” is high in Venezuela, Chile, and Argentina. In contrast, although Peru had the highest
ratio of “Increase” of local employees within the past year, it is beaten by Mexico and
Brazil for future plans.
Fig. 3-9: Future Plans on the Number of Local Employees
Fig. 3-10: Future Plans on the Number of Japanese Expatriates
53.2
62.9
10.5
45.5
50.0
38.9
58.7
35.3
38.1
27.6
73.7
40.9
42.9
52.8
33.5
58.8
8.7
9.5
15.8
13.6
7.1
8.3
7.8
5.9
0% 20% 40% 60% 80% 100%
Latin America Total(n=436)
Mexico(n=105)
Venezuela(n=19)
Colombia(n=22)
Peru(n=14)
Chile(n=36)
Brazil(n=206)
Argentina(n=34)
Increase No change Decrease
14.4
20.0
0.0
22.7
14.3
13.9
13.6
5.9
75.5
68.6
73.7
77.3
78.6
83.3
76.7
79.4
10.1
11.4
26.3
0.0
7.1
2.8
9.7
14.7
0% 20% 40% 60% 80% 100%
Latin America Total(n=436)
Mexico(n=105)
Venezuela(n=19)
Colombia(n=22)
Peru(n=14)
Chile(n=36)
Brazil(n=206)
Argentina(n=34)
Increase No change Decrease
25
Copyright © 2013 JETRO. All rights reserved
4. Approaches for Market Development
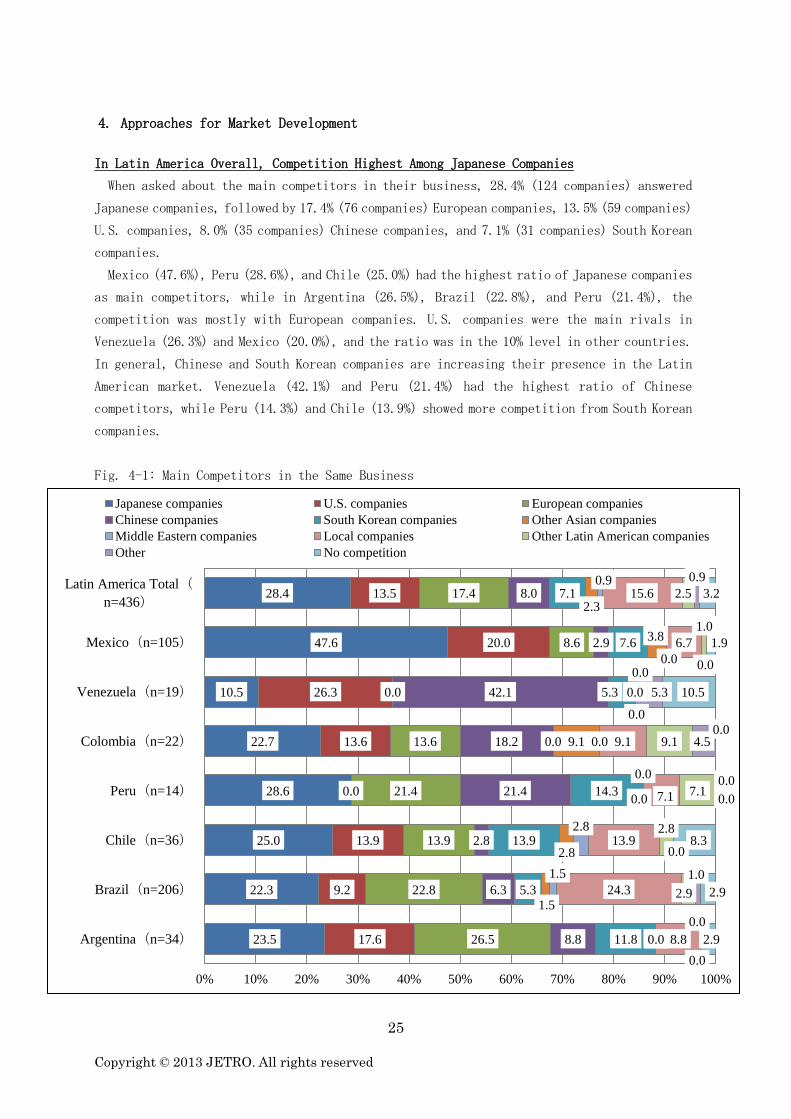
In Latin America Overall, Competition Highest Among Japanese Companies
When asked about the main competitors in their business, 28.4% (124 companies) answered
Japanese companies, followed by 17.4% (76 companies) European companies, 13.5% (59 companies)
U.S. companies, 8.0% (35 companies) Chinese companies, and 7.1% (31 companies) South Korean
companies.
Mexico (47.6%), Peru (28.6%), and Chile (25.0%) had the highest ratio of Japanese companies
as main competitors, while in Argentina (26.5%), Brazil (22.8%), and Peru (21.4%), the
competition was mostly with European companies. U.S. companies were the main rivals in
Venezuela (26.3%) and Mexico (20.0%), and the ratio was in the 10% level in other countries.
In general, Chinese and South Korean companies are increasing their presence in the Latin
American market. Venezuela (42.1%) and Peru (21.4%) had the highest ratio of Chinese
competitors, while Peru (14.3%) and Chile (13.9%) showed more competition from South Korean
companies.
Fig. 4-1: Main Competitors in the Same Business
28.4
47.6
10.5
22.7
28.6
25.0
22.3
23.5
13.5
20.0
26.3
13.6
0.0
13.9
9.2
17.6
17.4
8.6
0.0
13.6
21.4
13.9
22.8
26.5
8.0
2.9
42.1
18.2
21.4
2.8
6.3
8.8
7.1
7.6
5.3
0.0
14.3
13.9
5.3
11.8
2.3
3.8
0.0
9.1
0.0
2.8
1.5
0.0
0.9
0.0
0.0
0.0
0.0
2.8
1.5
0.0
15.6
6.7
0.0
9.1
7.1
13.9
24.3
8.8
2.5
1.0
0.0
9.1
7.1
2.8
2.9
0.0
0.9
0.0
5.3
4.5
0.0
0.0
1.0
0.0
3.2
1.9
10.5
0.0
0.0
8.3
2.9
2.9
0% 10% 20% 30% 40% 50% 60% 70% 80% 90% 100%
Latin America Total(
n=436)
Mexico(n=105)
Venezuela(n=19)
Colombia(n=22)
Peru(n=14)
Chile(n=36)
Brazil(n=206)
Argentina(n=34)
Japanese companies U.S. companies European companies
Chinese companies South Korean companies Other Asian companies
Middle Eastern companies Local companies Other Latin American companies
Other No competition

26
Copyright © 2013 JETRO. All rights reserved
Intensifying Market Competition
Concerning the change in market competition, 55.5% answered that it has increased. This
ratio has risen from the 2011 survey (50.6%) and the 2012 survey (54.4%). Meanwhile, 44.0%
answered “Unchanged”, gradually decreasing from 2011 (47.8%) and 2012 (44.5%) surveys.
The results reveal the fierce competition between Japanese, U.S., European, Chinese, and
South Korean companies in the Latin American market. The ratio of increased competition
was, from the highest order, 86.4% in Colombia, 66.7% in Chile, 57.1% in Peru, 55.8% in
Brazil, and 48.6% in Mexico. Compared to the previous fiscal year, the “Increased” ratio
rose in Colombia (55.6% in 2012), Chile (51.6% in 2012), and Peru (55.6% in 2012), while
Brazil (61.3% in 2012) and Mexico (53.5% in 2012) each showed a slight decrease.
For Japanese companies, Brazil and Mexico are still the main battlefields for developing
the Latin American market. Yet, more Japanese companies may be considering Colombia, Chile,
and Peru as the next market after Brazil and Mexico, thereby intensifying the competition.
Similar to previous surveys, the ratio of “Unchanged” is high in Argentina and Venezuela.
Behind this is the fact that there are few newcomers to the market due to problems in the
business environment.
Fig. 4-2: Change in Competition in the Past 12 Months
55.5
48.6
42.1
86.4
57.1
66.7
55.8
50.0
44.0
50.5
57.9
13.6
42.9
33.3
43.7
50.0
0.5
1.0
0.0
0.0
0.0
0.0
0.5
0.0
0% 20% 40% 60% 80% 100%
Latin America Total(n=436)
Mexico(n=105)
Venezuela(n=19)
Colombia(n=22)
Peru(n=14)
Chile(n=36)
Brazil(n=206)
Argentina(n=34)
Competition increased Unchanged Competition lessened
27
Copyright © 2013 JETRO. All rights reserved
5. Issues on Business Management
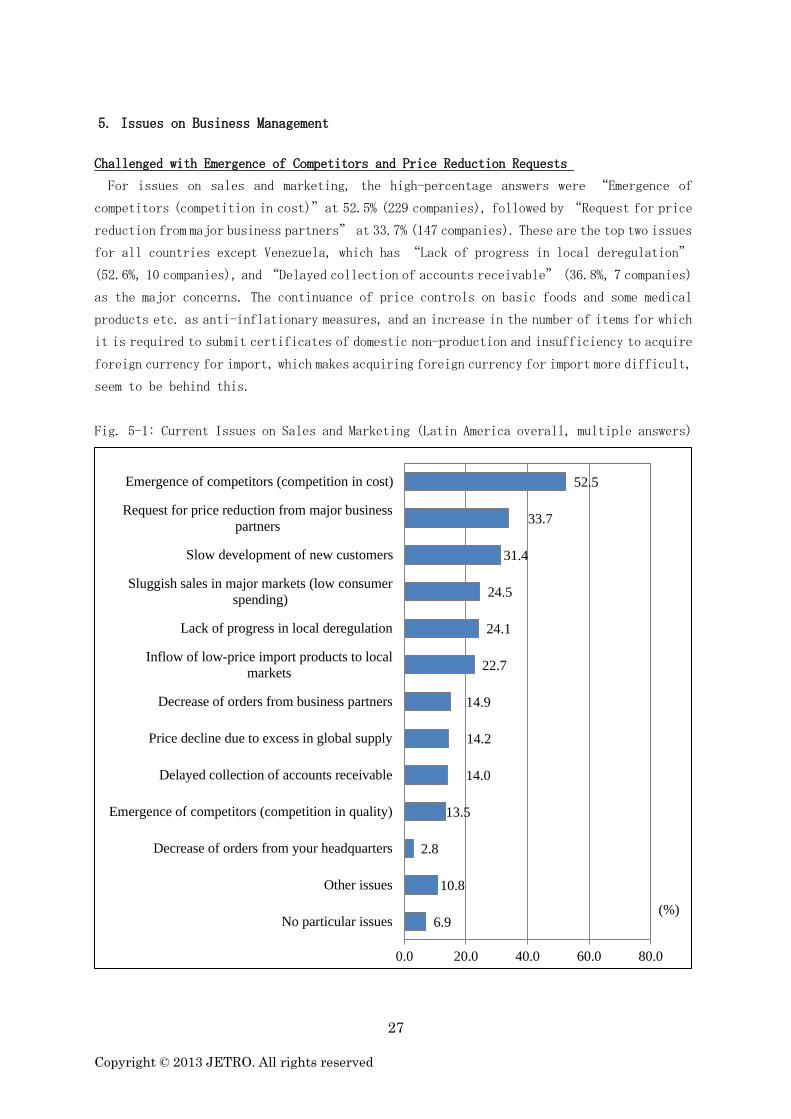
Challenged with Emergence of Competitors and Price Reduction Requests
For issues on sales and marketing, the high-percentage answers were “Emergence of
competitors (competition in cost)”at 52.5% (229 companies), followed by “Request for price
reduction from major business partners” at 33.7% (147 companies). These are the top two issues
for all countries except Venezuela, which has “Lack of progress in local deregulation”
(52.6%, 10 companies), and “Delayed collection of accounts receivable” (36.8%, 7 companies)
as the major concerns. The continuance of price controls on basic foods and some medical
products etc. as anti-inflationary measures, and an increase in the number of items for which
it is required to submit certificates of domestic non-production and insufficiency to acquire
foreign currency for import, which makes acquiring foreign currency for import more difficult,
seem to be behind this.
Fig. 5-1: Current Issues on Sales and Marketing (Latin America overall, multiple answers)
6.9
10.8
2.8
13.5
14.0
14.2
14.9
22.7
24.1
24.5
31.4
33.7
52.5
0.0 20.0 40.0 60.0 80.0
No particular issues
Other issues
Decrease of orders from your headquarters
Emergence of competitors (competition in quality)
Delayed collection of accounts receivable
Price decline due to excess in global supply
Decrease of orders from business partners
Inflow of low-price import products to local
markets
Lack of progress in local deregulation
Sluggish sales in major markets (low consumer
spending)
Slow development of new customers
Request for price reduction from major business
partners
Emergence of competitors (competition in cost)
(%)

28
Copyright © 2013 JETRO. All rights reserved
Financially Challenged by Exchange Rate Fluctuations and Taxation
The top issue in the finance, monetary, and foreign exchange fields was “Fluctuation in
the exchange rate between local currency and the dollar” at 61.7% (269 companies), followed
by “Tax burden (corporate tax, transfer pricing taxation, etc.)” at 50.7% (221 companies).
For “Fluctuation in the exchange rate between local currency and the dollar,” Argentina
(73.5%, 25 companies) and Colombia (68.2%, 15 companies) had high scores. As for “Tax burden
(corporate tax, transfer pricing taxation, etc.)”, Brazil (70.9%, 146 companies) and Peru
(57.1%, 8 companies) have high scores. Meanwhile, on “Regulations concerning overseas
remittance,” the two countries Argentina (88.2%, 30 companies) and Venezuela (84.2%, 16
companies) stood out, while all other countries scored low. This is because when securing
foreign currency for transferring profits in Argentina, the central bank’s inspection is
becoming more strict while the inspection criteria is not disclosed. In Venezuela, allocation
of foreign currency needs to be acquired from the Commission for the Administration of Currency
Exchange (CADIVI) when securing foreign currencies. However, allocations for transferring
profits and dividends are hardly ever approved, although they are authorized in CADIVI’s
administrative decision document.
Fig. 5-2: Current Issues on Finance, Monetary, and Foreign Exchange (Latin America overall,
multiple answers)
10.3
5.5
5.7
11.7
12.8
12.8
17.2
23.6
25.0
50.7
61.7
0 20 40 60 80
No particular issues
Other issues
Difficulty in getting financing from local banks
Regulations concerning financing and payment
Fluctuations in the exchange rate between the yen
and the dollar
Rising interest rates
Fluctuations in the exchange rate between local
currency and the yen
Regulations concerning overseas remittance
Shortage of cash flow required for business
expansion
Tax burden (corporate tax, transfer pricing
taxation, etc.)
Fluctuations in the exchange rate between local
currency and the dollar
(%)

29
Copyright © 2013 JETRO. All rights reserved
Notable Increase in Wages of Employees
For issues regarding employment and labor, “Increase in wages of employees” scored high
at 73.4% (320 companies). This ratio has been increasing, from 58.9% in 2011 and 60.2% in
2012, and accounts for the largest portion of management issues.
This is followed by “Quality of employees” at 44.3% (193 companies), then “Difficulty
in recruiting workforce (middle management level)” at 34.9% (152 companies). Against a
backdrop of a steady economy, the unemployment rate has become lower in Latin America, and
the turnover rate is on the rise. Regardless of positions, there is a strong competition over
talented staff, and Japanese companies seem to be having a hard time in securing the desired
quality and headcount in the workforce.
Fig. 5-3: Current Issues on Employment and Labor (Latin America overall, multiple answers)
4.1
4.8
4.8
6.0
8.7
9.6
10.8
19.7
24.3
28.0
28.7
29.1
34.9
44.3
73.4
0.0 20.0 40.0 60.0 80.0
No particular issues
Other issues
Restriction on hiring foreigners
Difficulty in recruiting workforce (general
workers) (manufacturing companies only)
Restriction on visa issuance for dispatched
Japanese executives (stationed representatives)
Difficulty in appointing local personnel as
managers and supervisors
Difficulty in recruiting workforce (engineers)
(manufacturing companies only)
Difficulty in recruiting workforce (general staff,
office workers)
Retention rate of employees
Labor-related lawsuits
Cost for dispatched Japanese executives (stationed
representatives)
Regulations concerning dismissal and reduction of
personnel
Difficulty in recruiting workforce (middle
management level)
Quality of employees
Increase in wages of employees
(%)

30
Copyright © 2013 JETRO. All rights reserved
Time-Consuming and Complicated Customs Procedure
Regarding the trade system, the highest scoring issues were “Complex procedures for customs
clearance” at 50.9% (222 companies), and “Significant time required for customs clearance”
at 49.1% (214 companies). The ratio for these two were especially high in the Mercosur nations
of Brazil, Argentina, and Venezuela (60% to less than 90%), while in the Pacific Alliance
countries, the figures for Mexico, Colombia, and Peru were at the 30% level, and less than
3% in Chile. The results portray the characteristics of the Mercosur countries, which are
seen as pursuing protectionist policies.
Fig. 5-4: Current Issues on the Trade System (Latin America overall, multiple answers)
24.5
8.9
4.4
5.5
9.6
15.4
17.2
19.3
28.4
36.5
49.1
50.9
0 20 40 60 80
No particular issues
Other issues
Strict or unclear quarantine system
Export restriction and export tax
Rules of origin
High non-tariff barriers
Unclear variation assessment / classification
criteria for tariffs
Unclear inspection system
Inadequate communication and enforcement of
notices and rules
High import tariffs
Significant time required for customs clearance
Complex procedures for customs clearance
(%)

31
Copyright © 2013 JETRO. All rights reserved
Faced with Difficulties of Local Procurement
For issues on production, “Difficulty in local procurement of materials and parts” (55.2%,
100 companies) and “Rising procurement cost” (48.1%, 87 companies) showed high percentages.
Especially on the difficulty of local procurement, the response was in the 60% to 90% range
in all countries surveyed except for Peru and Chile, where very few Japanese companies have
their production base. So the issue can be seen as a common problem among Japanese
manufacturers in Latin America. However, Brazil alone remained at 49.4%. This is probably
due to the fact that Brazil had already set high customs barrier compared to Mexico and other
countries to promote the growth of its domestic industries, and therefore some parts-supply
industries already exist.
Fig. 5-5: Current Production Issues (Latin America overall, multiple answers by 181
manufacturing companies)
2.8
6.6
9.4
12.2
13.3
13.3
20.4
33.1
37.0
41.4
48.1
55.2
0 20 40 60 80
No particular issues
Other issues
Difficulty in changing production items in a short
period of time
High tariffs on imports of capital and intermediate
goods
Low production capacity due to limited facilities
Environmental regulations becoming more strict
Instability of electricity supply and frequent
outages
Inadequate logistics infrastructure
Cost reduction which has nearly reached the limit
Difficulty in quality control
Rising procurement cost
Difficulty in local procurement of materials and
parts
(%)

32
Copyright © 2013 JETRO. All rights reserved
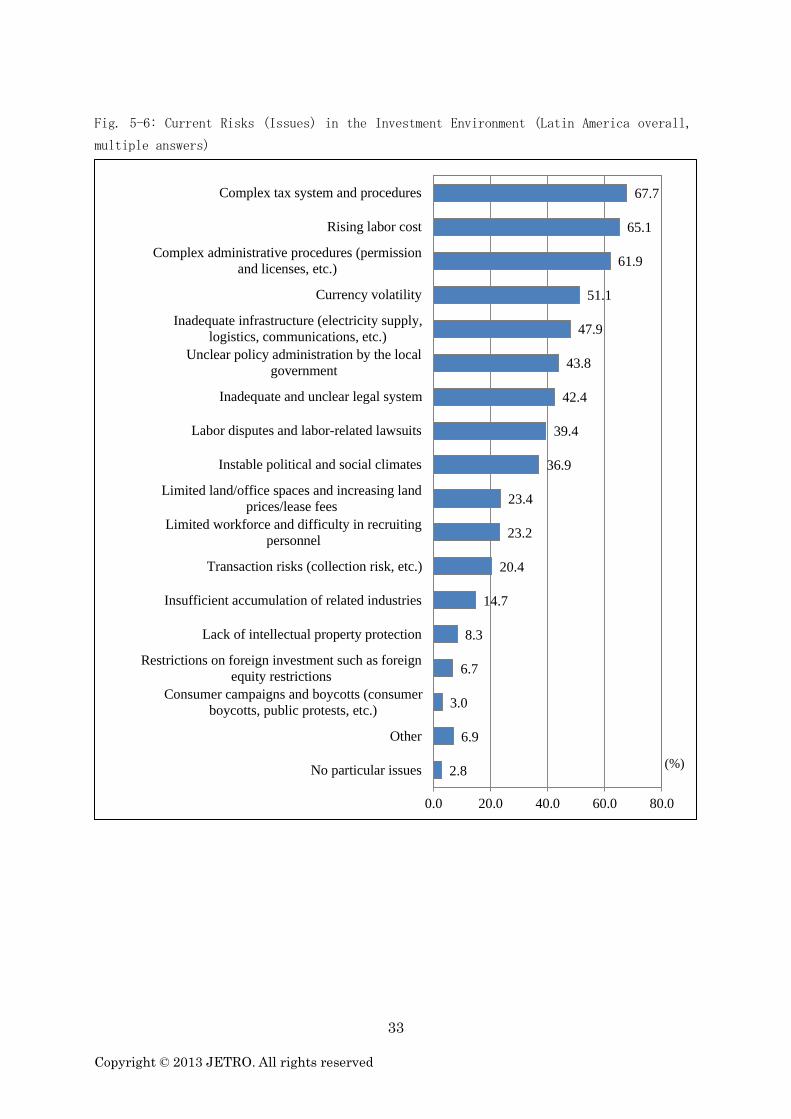
Complex Tax and Administrative Procedures Prominent in Mercosur Countries
For issues on the investment environment, “Complex tax system and procedures” scored 67.7%
(295 companies) for Latin America overall. Yet when looking at each country, the Mercosur
states of Brazil (88.3%, 182 countries), Argentina (64.7%, 22 companies), and Venezuela (63.2%,
12 companies), showed high percentages. Similarly, with “Complex administrative procedures
(permission and licenses, etc.),” the response was 61.9% (270 companies) for Latin America
overall, while the Mercosur countries Venezuela (94.7%, 18 companies), Argentina (76.5%, 26
companies), and Brazil (73.8%, 152 companies) all had higher percentages than the total for
Latin America. In addition to the previously mentioned customs procedure, the Mercosur
countries have noticeably tough investment environments.
Meanwhile, those who answered “Rising labor cost” were 85% (175 companies) in Brazil,
79.4% (27 companies) in Argentina, followed by 68.4% (13 companies) in Venezuela, 61.1% (22
companies) in Chile, and 40.9% (9 companies) in Colombia, showing that the issue is a common
problem for all Japanese companies in Latin America, regardless of location.
33
Copyright © 2013 JETRO. All rights reserved
Fig. 5-6: Current Risks (Issues) in the Investment Environment (Latin America overall,
multiple answers)
2.8
6.9
3.0
6.7
8.3
14.7
20.4
23.2
23.4
36.9
39.4
42.4
43.8
47.9
51.1
61.9
65.1
67.7
0.0 20.0 40.0 60.0 80.0
No particular issues
Other
Consumer campaigns and boycotts (consumer
boycotts, public protests, etc.)
Restrictions on foreign investment such as foreign
equity restrictions
Lack of intellectual property protection
Insufficient accumulation of related industries
Transaction risks (collection risk, etc.)
Limited workforce and difficulty in recruiting
personnel
Limited land/office spaces and increasing land
prices/lease fees
Instable political and social climates
Labor disputes and labor-related lawsuits
Inadequate and unclear legal system
Unclear policy administration by the local
government
Inadequate infrastructure (electricity supply,
logistics, communications, etc.)
Currency volatility
Complex administrative procedures (permission
and licenses, etc.)
Rising labor cost
Complex tax system and procedures
(%)

34
Copyright © 2013 JETRO. All rights reserved
[Reference] Benefits (Strengths) in the Investment Environment
The percentage of “Market scale and potential for its growth” stands out at 75.2% (328
companies). The high-scoring countries were Colombia at 90.9% (20 companies), Mexico at 85.7%
(90 companies), and Brazil at 84.0% (173 companies). “Stable political and social climates”
came in second at 31.0% (135 companies), with high percentage in Chile at 83.3% (30 companies)
and in Colombia at 59.1% (13 companies).
Fig. 5-7: Benefits (Strengths) in the Investment Environment (Latin America overall, multiple
answers)
8.3
1.6
1.8
2.1
4.4
4.8
5.0
6.4
6.7
6.7
7.3
7.6
7.8
9.2
12.6
13.8
31.0
75.2
0.0 20.0 40.0 60.0 80.0
Other
Prompt clearance of procedures
Substantial investment incentive scheme
Concentration of supporting industries
(convenience of local procurement)
Easy recruitment of employees (specialists and
engineers, middle management level, etc.)
High retention rate of employees
Developed infrastructure (electricity supply,
transportation, communications, etc.)
Abundant land/office spaces and low land
prices/lease fees
High quality of employees (specialists and
engineers)
Tax incentives (corporate taxes, export and import
tariffs, etc.)
Low language and communication barriers
High quality of employees (middle management
level)
High quality of employees (general workers)
Comfortable living environment for representatives
stationed from headquarters
Easy recruitment of employees (general workers,
general staff and office workers, etc.)
Concentration of partner companies (customer
companies)
Stable political and social climates
Market scale and potential for its growth
(%)
35
Copyright © 2013 JETRO. All rights reserved
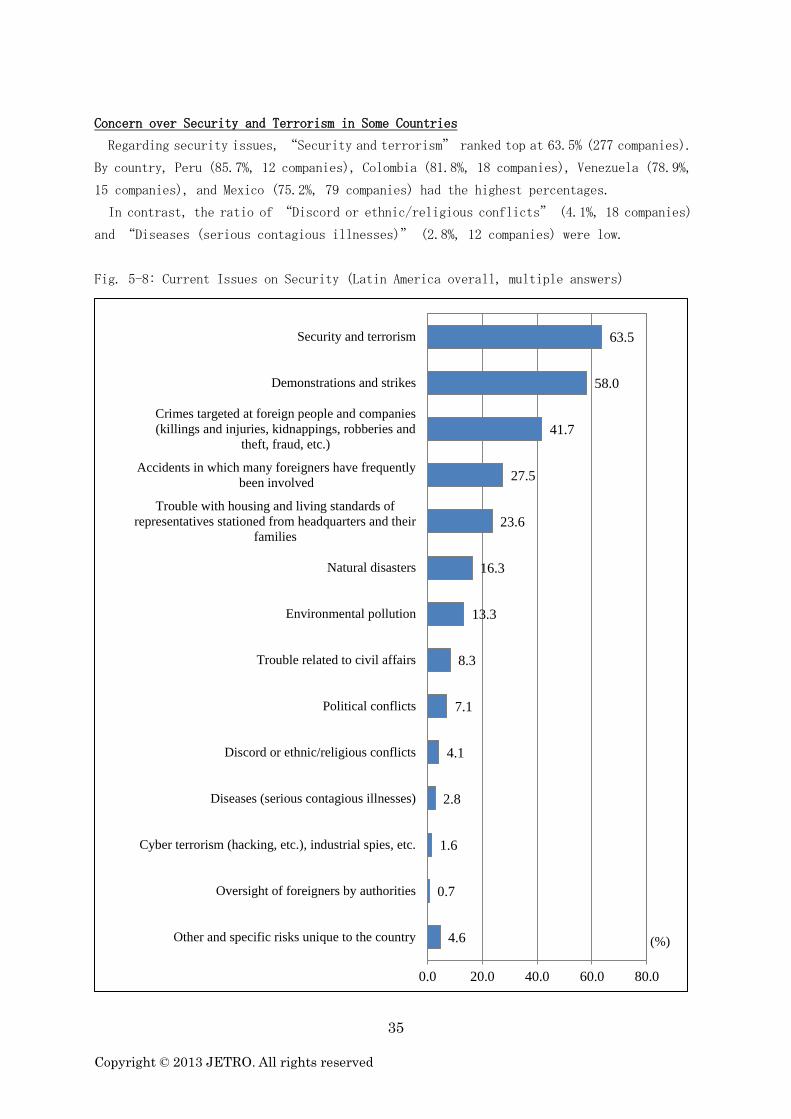
Concern over Security and Terrorism in Some Countries
Regarding security issues, “Security and terrorism” ranked top at 63.5% (277 companies).
By country, Peru (85.7%, 12 companies), Colombia (81.8%, 18 companies), Venezuela (78.9%,
15 companies), and Mexico (75.2%, 79 companies) had the highest percentages.
In contrast, the ratio of “Discord or ethnic/religious conflicts” (4.1%, 18 companies)
and “Diseases (serious contagious illnesses)” (2.8%, 12 companies) were low.
Fig. 5-8: Current Issues on Security (Latin America overall, multiple answers)
4.6
0.7
1.6
2.8
4.1
7.1
8.3
13.3
16.3
23.6
27.5
41.7
58.0
63.5
0.0 20.0 40.0 60.0 80.0
Other and specific risks unique to the country
Oversight of foreigners by authorities
Cyber terrorism (hacking, etc.), industrial spies, etc.
Diseases (serious contagious illnesses)
Discord or ethnic/religious conflicts
Political conflicts
Trouble related to civil affairs
Environmental pollution
Natural disasters
Trouble with housing and living standards of
representatives stationed from headquarters and their
families
Accidents in which many foreigners have frequently
been involved
Crimes targeted at foreign people and companies
(killings and injuries, kidnappings, robberies and
theft, fraud, etc.)
Demonstrations and strikes
Security and terrorism
(%)
36
Copyright © 2013 JETRO. All rights reserved
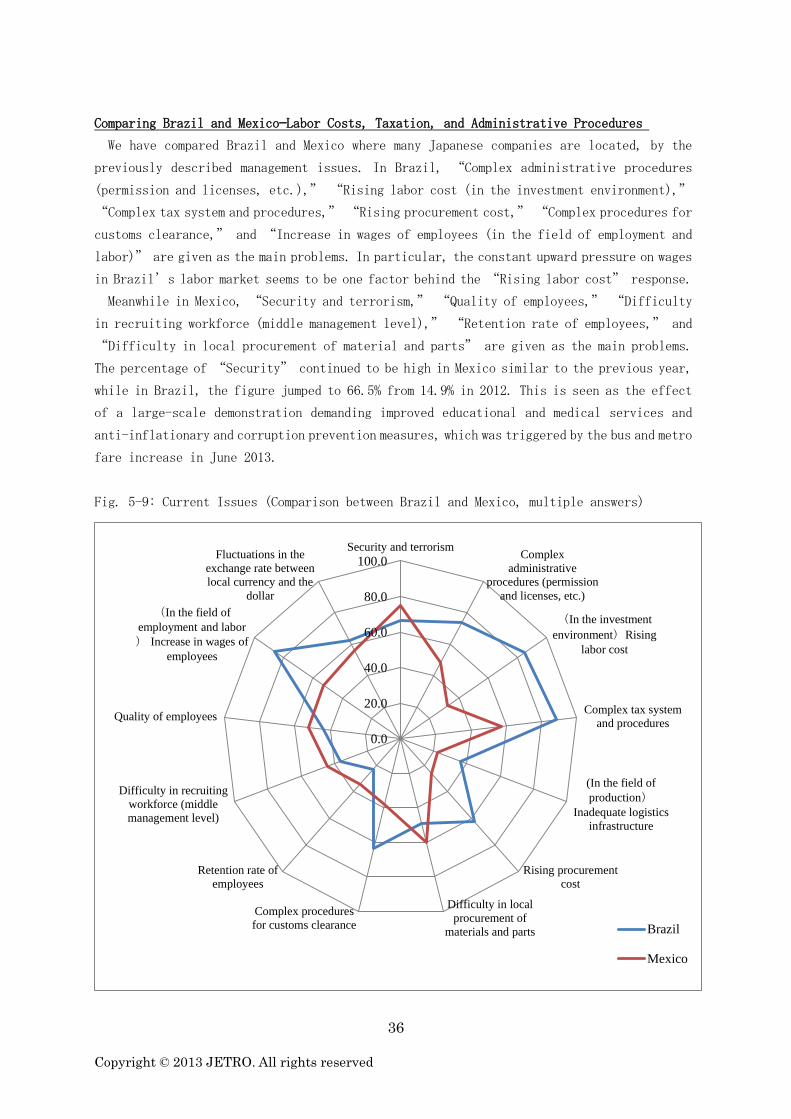
Comparing Brazil and Mexico—Labor Costs, Taxation, and Administrative Procedures
We have compared Brazil and Mexico where many Japanese companies are located, by the
previously described management issues. In Brazil, “Complex administrative procedures
(permission and licenses, etc.),” “Rising labor cost (in the investment environment),”
“Complex tax system and procedures,” “Rising procurement cost,” “Complex procedures for
customs clearance,” and “Increase in wages of employees (in the field of employment and
labor)” are given as the main problems. In particular, the constant upward pressure on wages
in Brazil’s labor market seems to be one factor behind the “Rising labor cost” response.
Meanwhile in Mexico, “Security and terrorism,” “Quality of employees,” “Difficulty
in recruiting workforce (middle management level),” “Retention rate of employees,” and
“Difficulty in local procurement of material and parts” are given as the main problems.
The percentage of “Security” continued to be high in Mexico similar to the previous year,
while in Brazil, the figure jumped to 66.5% from 14.9% in 2012. This is seen as the effect
of a large-scale demonstration demanding improved educational and medical services and
anti-inflationary and corruption prevention measures, which was triggered by the bus and metro
fare increase in June 2013.
Fig. 5-9: Current Issues (Comparison between Brazil and Mexico, multiple answers)
0.0
20.0
40.0
60.0
80.0
100.0Security and terrorism
Complex
administrative
procedures (permission
and licenses, etc.)
(In the investment
environment)Rising
labor cost
Complex tax system
and procedures
(In the field of
production)Inadequate logistics
infrastructure
Rising procurement
cost
Difficulty in local
procurement of
materials and parts
Complex procedures
for customs clearance
Retention rate of
employees
Difficulty in recruiting
workforce (middle
management level)
Quality of employees
(In the field of
employment and labor
) Increase in wages of
employees
Fluctuations in the
exchange rate between
local currency and the
dollar
Brazil
Mexico

37
Copyright © 2013 JETRO. All rights reserved
6. Procurement Situation of Raw Material and Parts
High Ratio of Local Procurement in Brazil
For Latin America overall, the local procurement rate of “25% to less than 75%” garnered
the highest response at 35.4%, followed by “Less than 10%” at 24.3%. We have compared Brazil
(83 respondents to this question) and Mexico (58 respondents to this question) where many
manufacturing companies are located. In Brazil, “75% to 100%” rose to 32.5% from 32.1% in
2012, and “25% to less than 75%” rose to 43.4% from 35.8% in 2012. In Mexico, the ratio
of “75% to 100%” fell to 10.3% from 16.2% in 2012, and “25% to less than 75%” fell to
31.0% from 35.1% in 2012. In Brazil, the “Less than 10%” response fell to 13.3% from 18.9%
in 2012, and “10% to less than 25%” also decreased to 10.8% from 13.2% in 2012. In contrast,
Mexico’s figures for “Less than 10%” fell to 37.9% from 45.9%, while “10% to less than
25%” showed a notable increase to 20.7% from 2.7% in 2012.
The local procurement rate is low in Mexico. This is because Mexico can utilize preferential
duties such as FTAs and The Program of Sectoral Promotion (PROSEC) when importing raw materials
and parts. Yet in recent years, Japanese supplier chains are being built to Tier2 and Tier3
levels, mostly in the auto industry. So in the medium term, local procurement is expected
to expand.
Fig. 6-1: Local Procurement Ratio for Products Manufactured at Local Plant (181 manufacturing
companies)
42.9
13.3
12.5
33.3
16.7
16.7
37.9
24.3
42.9
10.8
0.0
16.7
50.0
0.0
20.7
17.1
14.3
43.4
25.0
0.0
33.3
66.7
31.0
35.4
0.0
32.5
62.5
50.0
0.0
16.7
10.3
23.2
0% 20% 40% 60% 80% 100%
Argentina(n=14)
Brazil(n=83)
Chile(n=8)
Peru(n=6)
Colombia(n=6)
Venezuela(n=6)
Mexico(n=58)
Latin America Total(
n=181)
Less than 10% 10% to less than 25% 25% to less than 75% 75% to 100%

38
Copyright © 2013 JETRO. All rights reserved
Fig. 6-2: Local Procurement Rate of Raw Materials/Parts for Products Manufactured in Local
Plants (Comparison between Brazil and Mexico, changes from 2012 to 2013)
13.3
10.8
43.4
32.5
18.9
13.2
35.8
32.1
0.0 10.0 20.0 30.0 40.0 50.0
Less than 10%
10% to less than 25%
25% to less than 75%
75% to 100%
2012 Brazil 2013 Brazil
37.9
20.7
31.0
10.3
45.9
2.7
35.1
16.2
0.0 10.0 20.0 30.0 40.0 50.0
Less than 10%
10% to less than 25%
25% to less than 75%
75% to 100%
2012 Mexico 2013 Mexico
39
Copyright © 2013 JETRO. All rights reserved
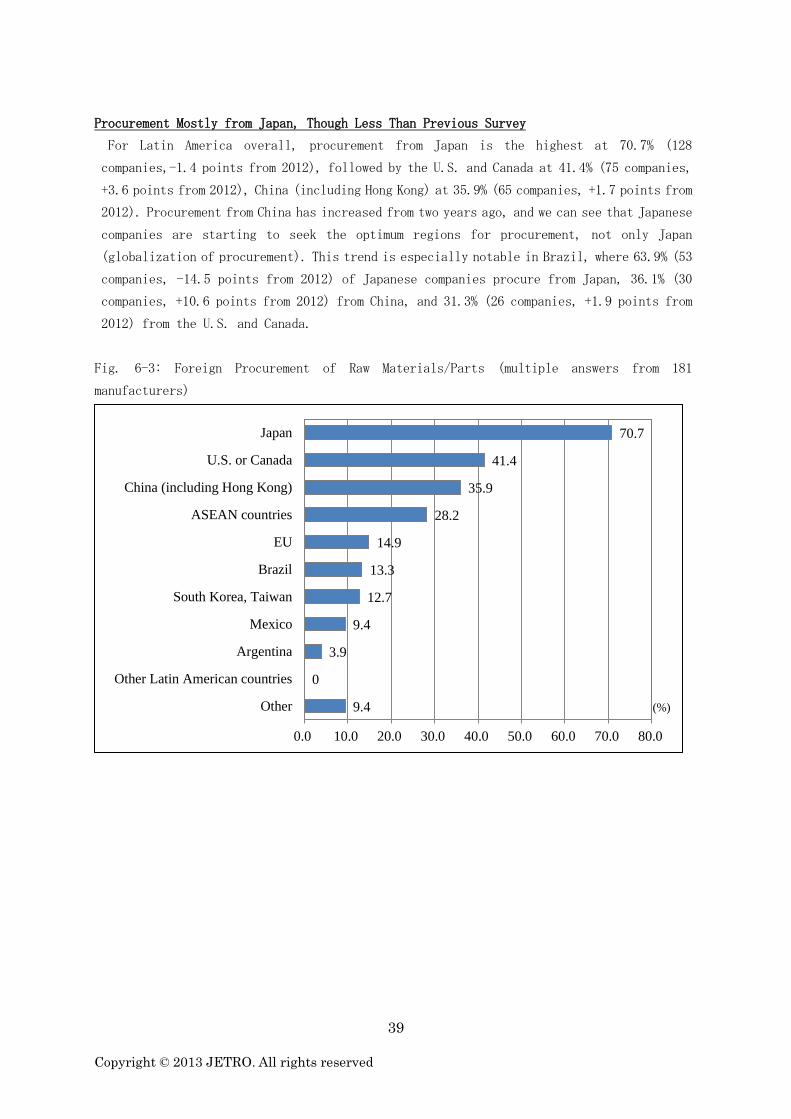
Procurement Mostly from Japan, Though Less Than Previous Survey
For Latin America overall, procurement from Japan is the highest at 70.7% (128
companies,-1.4 points from 2012), followed by the U.S. and Canada at 41.4% (75 companies,
+3.6 points from 2012), China (including Hong Kong) at 35.9% (65 companies, +1.7 points from
2012). Procurement from China has increased from two years ago, and we can see that Japanese
companies are starting to seek the optimum regions for procurement, not only Japan
(globalization of procurement). This trend is especially notable in Brazil, where 63.9% (53
companies, -14.5 points from 2012) of Japanese companies procure from Japan, 36.1% (30
companies, +10.6 points from 2012) from China, and 31.3% (26 companies, +1.9 points from
2012) from the U.S. and Canada.
Fig. 6-3: Foreign Procurement of Raw Materials/Parts (multiple answers from 181
manufacturers)
9.4
0
3.9
9.4
12.7
13.3
14.9
28.2
35.9
41.4
70.7
0.0 10.0 20.0 30.0 40.0 50.0 60.0 70.0 80.0
Other
Other Latin American countries
Argentina
Mexico
South Korea, Taiwan
Brazil
EU
ASEAN countries
China (including Hong Kong)
U.S. or Canada
Japan
(%)

40
Copyright © 2013 JETRO. All rights reserved
7. FTA/EPA Utilization and Problems
Mexico: Over 50% FTA Utilization in All Areas
The most utilized FTA in Mexico is NAFTA. Among the companies exporting to the NAFTA region
(U.S. and Canada), 80.0% (77.3% in 2012) utilize NAFTA. Also, out of the 60 companies (42
in 2012) importing from the NAFTA region, 43 companies (35 in 2012) use NAFTA. As for other
free trade agreements, the Mexico-Mercosur Auto Sector Agreement, Mexico-Five Central
American Countries FTA, Mexico-Chile FTA, and Mexico-EU FTA are widely utilized for export,
and Mexico-EU FTA and the Japan-Mexico FTA are the ones most utilized for import.
Mexico is considered one of the advanced FTA nations in Latin America, actively building
FTA networks with various countries and regions. The results of this survey reveal that
Japanese companies in Mexico are making full use of these networks in developing their
business.
Fig. 7-1: Mexico (Exports)
Fig. 7-2: Mexico (Imports)
50.0
66.7
77.8
80.0
80.0
47.4
16.7
0.0
0.0
0.0
0.0
5.3
33.3
33.3
22.2
20.0
20.0
47.4
0% 10% 20% 30% 40% 50% 60% 70% 80% 90% 100%
EU27(n=6)
Chile(n=3)
Five Central American
Countries(n=9)
Mercosur(n=10)
NAFTA(n=35)
Japan(n=19)
Utilizing Considering utilization Not utilizing (No plan to utilize)
83.3
0.0
50.0
71.7
62.9
0.0
0.0
0.0
6.7
12.9
16.7
100.0
50.0
21.7
24.3
0% 10% 20% 30% 40% 50% 60% 70% 80% 90% 100%
EU27(n=6)
Five Central American
Countries(n=1)
Mercosur(n=2)
NAFTA(n=60)
Japan(n=70)
Utilizing Considering utilization Not utilizing (No plan to utilize)

41
Copyright © 2013 JETRO. All rights reserved
Brazil: High Use of Mercosur, as Well as Auto Sector Agreement with Mexico for Imports
The free trade agreement mostly used by Japanese companies in Brazil is Mercosur, utilized
by 51.8% (29 companies) for exports and 41.4% (12 companies) for imports. FTAs are highly
used for imports from Mexico. This is probably due to the utilization of auto sector
agreements which define the customs-free amount for finished cars etc. between Mexico and
Mercosur.
Fig. 7-3: Brazil (Exports)
Fig. 7-4: Brazil (Imports)
(Note: FTAs with India, Peru, Chile, Mexico, and the Andean Community are concluded within
the Mercosur framework. Agreements with Mexico consist only of those related to automobiles
and auto parts.)
14.3
23.5
21.1
22.2
28.6
51.8
0.0
5.9
5.3
5.6
0.0
10.7
85.7
70.6
73.7
72.2
71.4
37.5
0% 10% 20% 30% 40% 50% 60% 70% 80% 90% 100%
India(n=7)
Peru(n=17)
Chile(n=19)
Andean Community
(n=18)
Mexico(n=14)
Mercosur(n=56)
Utilizing Considering utilization Not utilizing (No plan to utilize)
12.5
0.0
0.0
0.0
45.8
41.4
12.5
0.0
0.0
0.0
12.5
6.9
75.0
100.0
100.0
100.0
41.7
51.7
0% 10% 20% 30% 40% 50% 60% 70% 80% 90% 100%
India(n=8)
Peru(n=5)
Chile(n=7)
Andean Community
(n=5)
Mexico(n=24)
Mercosur(n=29)
Utilizing Considering utilization Not utilizing (No plan to utilize)
42
Copyright © 2013 JETRO. All rights reserved
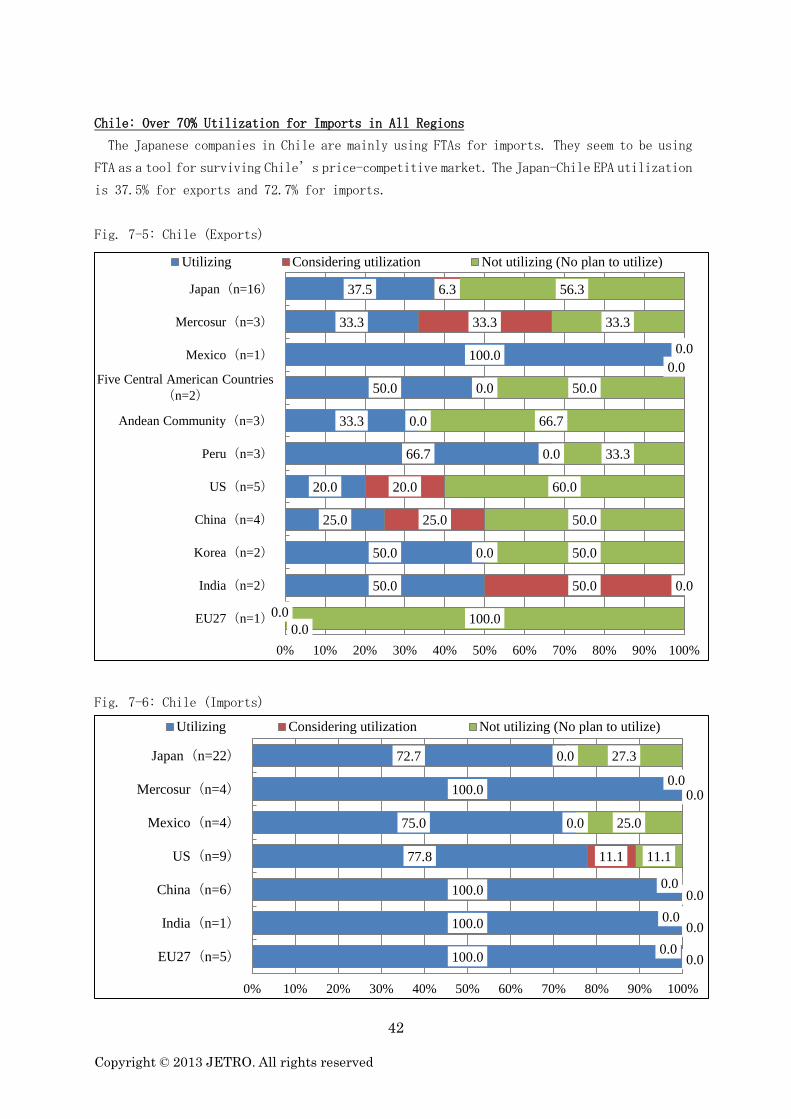
Chile: Over 70% Utilization for Imports in All Regions
The Japanese companies in Chile are mainly using FTAs for imports. They seem to be using
FTA as a tool for surviving Chile’s price-competitive market. The Japan-Chile EPA utilization
is 37.5% for exports and 72.7% for imports.
Fig. 7-5: Chile (Exports)
Fig. 7-6: Chile (Imports)
0.0
50.0
50.0
25.0
20.0
66.7
33.3
50.0
100.0
33.3
37.5
0.0
50.0
0.0
25.0
20.0
0.0
0.0
0.0
0.0
33.3
6.3
100.0
0.0
50.0
50.0
60.0
33.3
66.7
50.0
0.0
33.3
56.3
0% 10% 20% 30% 40% 50% 60% 70% 80% 90% 100%
EU27(n=1)
India(n=2)
Korea(n=2)
China(n=4)
US(n=5)
Peru(n=3)
Andean Community(n=3)
Five Central American Countries
(n=2)
Mexico(n=1)
Mercosur(n=3)
Japan(n=16)
Utilizing Considering utilization Not utilizing (No plan to utilize)
100.0
100.0
100.0
77.8
75.0
100.0
72.7
0.0
0.0
0.0
11.1
0.0
0.0
0.0
0.0
0.0
0.0
11.1
25.0
0.0
27.3
0% 10% 20% 30% 40% 50% 60% 70% 80% 90% 100%
EU27(n=5)
India(n=1)
China(n=6)
US(n=9)
Mexico(n=4)
Mercosur(n=4)
Japan(n=22)
Utilizing Considering utilization Not utilizing (No plan to utilize)

43
Copyright © 2013 JETRO. All rights reserved
Argentina: Utilization of Mercosur as Well as Auto Sector Agreement with Mexico
The trade agreement utilized by Japanese companies in Argentina is Mercosur, used by 75.0%
for exports, and 92.3% for imports. The auto sector agreement with Mexico is also being used,
mostly for imports, utilized by three companies (one company for exports).
Fig. 7-7: Argentina (Exports)
Fig. 7-8: Argentina (Imports)
(Note: FTAs with Peru, Chile, Mexico, and the Andean Community are concluded within the
Mercosur framework.)
0.0
33.3
0.0
50.0
75.0
0.0
0.0
0.0
0.0
8.3
100.0
66.7
100.0
50.0
16.7
0% 10% 20% 30% 40% 50% 60% 70% 80% 90% 100%
Peru(n=2)
Chile(n=3)
Andean Community(
n=1)
Mexico(n=2)
Mercosur(n=12)
Utilizing Considering utilization Not utilizing (No plan to utilize)
50.0
0.0
0.0
60.0
92.3
0.0
0.0
0.0
20.0
0.0
50.0
100.0
100.0
20.0
7.7
0% 10% 20% 30% 40% 50% 60% 70% 80% 90% 100%
Peru(n=2)
Chile(n=1)
Andean Community(
n=1)
Mexico(n=5)
Mercosur(n=13)
Utilizing Considering utilization Not utilizing (No plan to utilize)

44
Copyright © 2013 JETRO. All rights reserved
Colombia: Used for Exports to the Andean Community, and Imports from Mercosur and Mexico
The free trade agreements utilized by Japanese companies in Colombia are the FTAs with the
Andean Community and Mercosur. With the Andean Community, the FTA is utilized for exports
by 72.7%. With Mercosur, the FTA is mainly used for imports at 83.3%. The FTA utilization
for imports from Mexico is also high. Three companies (75.0%) were utilizing FTAs for exports
to the five Central American countries.
Fig. 7-9: Colombia (Exports)
Fig. 7-10: Colombia (Imports)
0.0
72.7
75.0
0.0
100.0
100.0
9.1
0.0
0.0
0.0
0.0
18.2
25.0
100.0
0.0
0% 10% 20% 30% 40% 50% 60% 70% 80% 90% 100%
Chile(n=1)
Andean Community(
n=11)
Five Central American
Countries(n=4)
Mexico(n=1)
Mercosur(n=2)
Utilizing Considering utilization Not utilizing (No plan to utilize)
100.0
66.7
83.3
0.0
0.0
0.0
0.0
33.3
16.7
0% 10% 20% 30% 40% 50% 60% 70% 80% 90% 100%
Chile(n=1)
Mexico(n=6)
Mercosur(n=6)
Utilizing Considering utilization Not utilizing (No plan to utilize)

45
Copyright © 2013 JETRO. All rights reserved
Peru: High Utilization for Imports
Japanese companies in Peru mainly utilize FTAs for imports. As is the case in Chile, the
FTAs are being used as a tool for surviving the price-competitive market in Peru. The
Japan-Peru EPA is used by two companies (40.0%) for export, and four companies (50.0%) for
import. There are also three Japanese companies (100%) utilizing the China-Peru EPA for
imports.
Fig. 7-11: Peru (Exports)
Fig. 7-12: Peru (Imports)
100.0
0.0
100.0
50.0
50.0
50.0
40.0
0.0
0.0
0.0
0.0
0.0
0.0
20.0
0.0
100.0
0.0
50.0
50.0
50.0
40.0
0% 10% 20% 30% 40% 50% 60% 70% 80% 90% 100%
EU27(n=1)
China(n=1)
US(n=1)
Chile(n=2)
Andean Community
(n=2)
Mercosur(n=2)
Japan(n=5)
Utilizing Considering utilization Not utilizing (No plan to utilize)
0.0
100.0
66.7
100.0
100.0
100.0
100.0
50.0
0.0
0.0
33.3
0.0
0.0
0.0
0.0
25.0
100.0
0.0
0.0
0.0
0.0
0.0
0.0
25.0
0% 10% 20% 30% 40% 50% 60% 70% 80% 90% 100%
EU27(n=2)
China(n=3)
US(n=3)
Chile(n=1)
Andean Community
(n=2)
Mexico(n=4)
Mercosur(n=2)
Japan(n=8)
Utilizing Considering utilization Not utilizing (No plan to utilize)

46
Copyright © 2013 JETRO. All rights reserved
Venezuela: Only Using FTA with Mercosur
Among Japanese companies in Venezuela, those utilizing the trade agreement with Mercosur
were two for exports, and just one for imports.
Fig. 7-13: Venezuela (Exports)
Fig. 7-14: Venezuela (Imports)
40.0 20.0 40.0
0% 10% 20% 30% 40% 50% 60% 70% 80% 90% 100%
Mercosur(n=5)
Utilizing Considering utilization Not utilizing (No plan to utilize)
14.3 28.6 57.1
0% 10% 20% 30% 40% 50% 60% 70% 80% 90% 100%
Mercosur(n=7)
Utilizing Considering utilization Not utilizing (No plan to utilize)

47
Copyright © 2013 JETRO. All rights reserved
Issues on Export FTAs—Receiving Certificate of Origin and Capable Staff Shortage
In utilizing the FTAs for exports, there currently seems to be no serious problems. Yet,
the same issues pointed out in the last survey, “Procedures for certificates of origin take
too long” at 17.2% (16.1% in 2012) and “Shortage of capable personnel in company” at 10.1%
(9.5% in 2012) still remain. Other relatively high responses include “Rules of origin for
existing FTAs/EPAs are different from each other causing confusion” at 9.7% and “FTAs/EPAs
do not exist with major export destinations” at 8.8%.
Fig. 7-15: Problems in Utilizing FTAs for Exports
5.9
50.8
7.1
2.1
2.9
7.6
8.4
8.8
9.7
10.1
17.2
0 20 40 60
Other
No problem in particular
Expensive issuance costs of certificates of origin
Tariff quota systems of FTAs/EPAs are not
functioning
Difficulty in getting cooperation from suppliers in
utilizing FTAs/EPAs
Rules of origin cannot be met or are very difficult to
meet
Complicated procedures in getting certificates of
origin
FTAs/EPAs do not exist with major export
destinations
Rules of origin for existing FTAs/EPAs are different
from each other causing confusion
Shortage of capable personnel in our company
Procedures for certificates of origin take too long
(%)
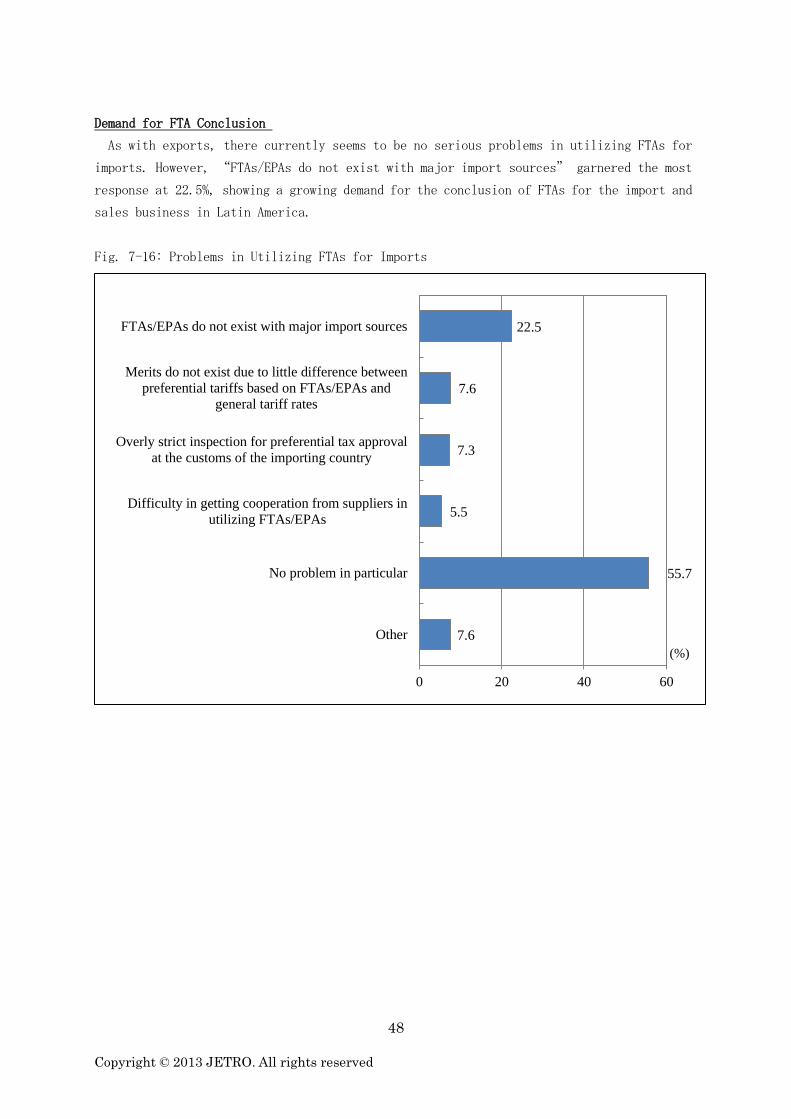
48
Copyright © 2013 JETRO. All rights reserved
Demand for FTA Conclusion
As with exports, there currently seems to be no serious problems in utilizing FTAs for
imports. However, “FTAs/EPAs do not exist with major import sources” garnered the most
response at 22.5%, showing a growing demand for the conclusion of FTAs for the import and
sales business in Latin America.
Fig. 7-16: Problems in Utilizing FTAs for Imports
7.6
55.7
5.5
7.3
7.6
22.5
0 20 40 60
Other
No problem in particular
Difficulty in getting cooperation from suppliers in
utilizing FTAs/EPAs
Overly strict inspection for preferential tax approval
at the customs of the importing country
Merits do not exist due to little difference between
preferential tariffs based on FTAs/EPAs and
general tariff rates
FTAs/EPAs do not exist with major import sources
(%)
49
Copyright © 2013 JETRO. All rights reserved
2013 JETRO Survey on Business Conditions of
Japanese Companies in Latin America
Thank you very much for your kind cooperation in these JETRO surveys. Estimated
time to complete this survey is about 20 – 30 minutes.
1. Every year, JETRO conducts this survey focusing on the activities of Japanese
companies operating in Latin America, to assess and to understand the business
situation in Latin America.
2. Throughout the survey, "Your Company" refers to the company in Latin America.
Please base your responses solely on the business activities/performance/
management issues of the company in Latin America.
3. Your individual response to this survey will not be made public. Data on individual
companies will be strictly held confidential. JETRO will only publicize aggregate
data of this survey. General information such as your headquarters name and
address will be used only to keep JETRO and your company in touch.
4. If you have any technical problems while filling out the survey, please contact the
following person in charge. (For inquires about contents of the survey or the way to fill
in your answers, please contact the JETRO overseas office which sent you this survey.)
Latin America Division, Overseas Research Department, Japan External Trade
Organization (JETRO)
6F, Ark Mori Building, 12-32, Akasaka 1-chome, Minato-ku, Tokyo 107-6006 Japan
Tel: +81-3-3582-4690, Fax: +81-3-3587-2485, E-mail: [email protected]
If the direct or indirect Japanese ownership of your company is less than 10%, or your corporate status is an “expatriate office” or “liaison office”, your company is NOT subject to this survey. In this case, please click the “Cancel” button below to terminate the survey.
Cancel
Please reply no later than 15/10, 2013

50
Copyright © 2013 JETRO. All rights reserved
Please fill in the blanks below.
Country of operation for Your Company (or factory)
□ Mexico □ Colombia □ Venezuela □ Peru □ Chile □ Argentina □ Brazil
Company name
Your name
Your title
Address
Phone
Fax
Name of Japanese parent company
<Regional headquarters for business in Latin America>
(Please select, from the following options, the organization taking primary responsibility for
business in the region.)
□ 1. Headquarters in Japan
□ 2. Regional headquarters in North America
□ 3. Regional headquarters in Latin America, (Country name )
□ 4. Other
Industry (In the case that Your Company is a sales company owned by a manufacturer and does
not engage in manufacturing in Latin America, please answer with “sales company” )
<Manufacturing in Latin America: Please check the category below that best describes your
main products.>
□ 1. Food, agriculture, and fishery processing
□ 2. Textiles (yarn, woven fabric products)
□ 3. Clothes and textiles
□ 4. Timber and wood products (excluding furniture and interior design products)
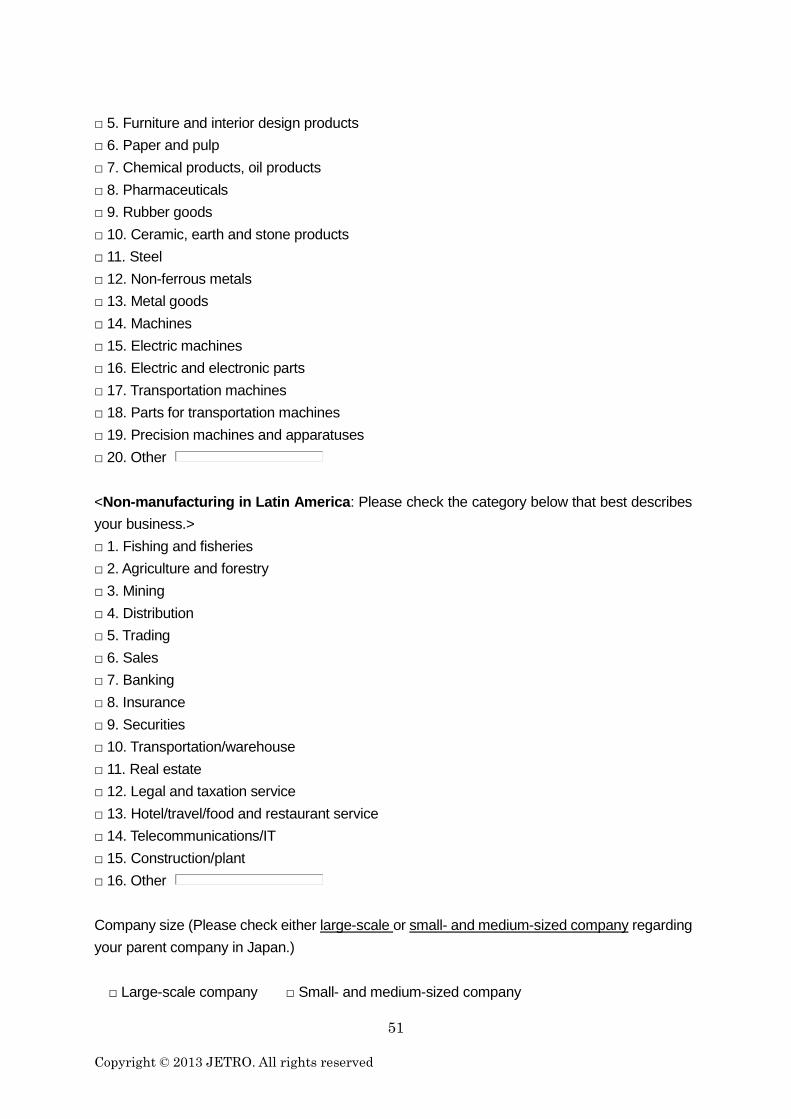
51
Copyright © 2013 JETRO. All rights reserved
□ 5. Furniture and interior design products
□ 6. Paper and pulp
□ 7. Chemical products, oil products
□ 8. Pharmaceuticals
□ 9. Rubber goods
□ 10. Ceramic, earth and stone products
□ 11. Steel
□ 12. Non-ferrous metals
□ 13. Metal goods
□ 14. Machines
□ 15. Electric machines
□ 16. Electric and electronic parts
□ 17. Transportation machines
□ 18. Parts for transportation machines
□ 19. Precision machines and apparatuses
□ 20. Other
<Non-manufacturing in Latin America: Please check the category below that best describes
your business.>
□ 1. Fishing and fisheries
□ 2. Agriculture and forestry
□ 3. Mining
□ 4. Distribution
□ 5. Trading
□ 6. Sales
□ 7. Banking
□ 8. Insurance
□ 9. Securities
□ 10. Transportation/warehouse
□ 11. Real estate
□ 12. Legal and taxation service
□ 13. Hotel/travel/food and restaurant service
□ 14. Telecommunications/IT
□ 15. Construction/plant
□ 16. Other
Company size (Please check either large-scale or small- and medium-sized company regarding
your parent company in Japan.)
□ Large-scale company □ Small- and medium-sized company

52
Copyright © 2013 JETRO. All rights reserved
*Your parent company in Japan is categorized as a “small- and medium-sized company” if it
satisfies any of the following conditions stipulated by the Small and Medium-sized Enterprise
Basic Act of Japan.
1) Manufacturing, construction, transportation and all other industries not listed under items 2) –
4): capital of 300 million JPY or less, or employs 300 or fewer people
2) Wholesale industry: capital of 100 million JPY or less, or employs 100 or fewer people
3) Service industry: capital of 50 million JPY or less, or employs 100 or fewer people
4) Retail industry: capital of 50 million JPY or less, or employs 50 or fewer people
■ Employees in your company
Total number of employees: Of that number, how many employees are full time?
Number of managers: Of that number, how many are locally hired?
1. Status of operations
Q1. What is your operating profit forecast for 2013 (from January to December)?
□ 1. Profit □ 2. Breakeven □ 3. Loss
Q2. How will your operating profits for 2013 (from January to December) change compared to
2012?
□ 1. Increase □ 2. Remain the same □ 3. Decrease
→Go to Q3 →Go to Q5 →Go to Q4
Q3. (This question is only for those who answered “Increase” in Q2.)
What are the reasons for increased operating profits forecast for 2013
(Choose as many as apply)
□ 1. Sales increase due to expansion of exports
□ 2. Sales increase in your country
□ 3. Effects of exchange rate fluctuation

53
Copyright © 2013 JETRO. All rights reserved
□ 4. Reduction of procurement costs in your country
□ 5. Reduction of labor costs
□ 6. Reduction of other expenditures (e.g., management, administrative and energy
costs)
□ 7. Improvement of production efficiency* (the manufacturing industry only)
□ 8. Improvement of sales efficiency
□9. Other
* “Improvement of production efficiency” here includes improvement of manufacturing
procedures (e.g., introduction of a cell production system) and computerized production management.
Q4. (This question is only for those who answered “Decrease” in Q2.)
What are the reasons for decreased operating profits forecast for 2013?
(Choose as many as apply)
□ 1. Sales decrease due to slowdown of exports
□ 2. Sales decrease in your country
□ 3. Effects of exchange rate fluctuation
□ 4. Increase of procurement costs in your country
□ 5. Increase of labor costs
□ 6. Increase of other expenditures (e.g., management, administrative and energy costs)
□ 7. Rising interest rates
□ 8. Costs insufficiently passed along in sales prices
□9. Other
Q5. What is your operating profit forecast for 2014 compared to 2013?
□ 1. Increase □ 2. Remain the same □ 3. Decrease
→Go to Q6 →Go to Q8 →Go to Q7
Q6. (This question is only for those who answered “Increase” in Q5.)
What are the reasons for increased operating profits forecast for 2014?
(Choose as many as apply)
□ 1. Sales increase due to expansion of exports
□ 2. Sales increase in your country
□ 3. Effects of exchange rate fluctuation
□ 4. Reduction of procurement costs in your country

54
Copyright © 2013 JETRO. All rights reserved
□ 5. Reduction of labor costs
□ 6. Reduction of other expenditures (e.g., management, administrative and energy
costs)
□ 7. Improvement of production efficiency* (the manufacturing industry only)
□ 8. Improvement of sales efficiency
□9. Other
* “Improvement of production efficiency” here includes improvement of manufacturing
procedures (e.g., introduction of a cell production system) and computerized production management.
Q7. (This question is only for those who answered “Decrease” in Q5.)
What are the reasons for decreased operating profits forecast for 2014?
(Choose as many as apply)
□ 1. Sales decrease due to slowdown exports
□ 2. Sales decrease volume in your country
□ 3. Effects of exchange rate fluctuation
□ 4. Increase of procurement costs in your country
□ 5. Increase of labor costs
□ 6. Increase of other expenditures (e.g., management, administrative and energy costs)
□ 7. Rising interest rates
□ 8. Costs insufficiently passed along in sales prices
□9. Other
2. Future business outlook
Q8. What is the outlook of your business in the next one or two years?
□ 1. Expansion □ 2. Remaining the same □ 3. Reduction
→Go to Q9, 10 →Go to Q12 →Go to Q11
□ 4. Transferring to a third country/region or withdrawal from your country
→Go to Q11
Q9. (This question is only for those who answered “Expansion” in Q8.)
What are the reasons for the future expansion of business?
(Choose as many as apply)
□ 1. Sales increase

55
Copyright © 2013 JETRO. All rights reserved
□ 2. High growth potential
□ 3. High receptivity for high-value added products
□ 4. Reduction of costs (e.g., procurement costs, labor costs)
□ 5. Deregulation
□ 6. Ease in securing labor force
□ 7. Reviewing production and sales networks
□ 8. Relationship with clients
□9. Other
Q10. (This question is only for those who answered “Expansion” in Q8.)
What function would you like to expand?
(Choose as many as apply)
□ 1. Sales function
□ 2. Production (ubiquitous products)
□ 3. Production (high-value added products)
□ 4. R&D
□ 5. Function of regional headquarters
□ 6. Logistics function
□ 7. Function for service administration (e.g., shared services, call center)
□ 8. Other
Q11. (This question is only for those who answered “Reduction” or “Transferring to a third
country/region or withdrawal from your country” in Q8.)
What are the reasons for the future reduction, transfer or withdrawal?
(Choose as many as apply)
□ 1. Sales decrease
□ 2. Low growth potential
□ 3. Low receptivity for high-value added products
□ 4. Increase of costs (e.g., procurement costs, labor costs)
□ 5. Tightening of regulations
□ 6. Difficulty in securing labor force
□ 7. Reviewing production and sales networks
□ 8. Relationship with clients
□ 9. Other

56
Copyright © 2013 JETRO. All rights reserved
Q12. Localization of management
How do you carry out the localization of management? Please answer based on your efforts toward localization since the establishment of the local office. (Choose as many as apply)
□ 1. Focusing on the training of local employees
□ 2. Hiring experienced employees who can contribute to the localization of management.
□ 3. Improving the personnel system such as introducing a merit system
□ 4. Hiring executive-level employees
□ 5. Hiring director or manager-level employees
□ 6. Strengthening the capability of production and service development in the regional
headquarters
□ 7. Giving the regional headquarters more power to make sales strategies
□ 8. Transferring authority to make decisions from the headquarters in Japan to the
regional headquarters
□ 9. Acquiring human resources and management resources through M&A
activities.
□ 10. No actions taken to promote the localization of management
□ 11. Other
Q13. What are problems in pursuing localization of management (if you are pursuing
localization)?
(Choose as many as apply)
□ 1. Difficulty in hiring executive level employees
□ 2. High turnover rate of executive level employees
□ 3. Disagreement between the headquarters in Japan and regional headquarters in the
regarding recruitment
□ 4. Language barriers (the lack of Japanese language proficiency)
□ 5. Poor capabilities and motivation of local employees
□ 6. Difficulty in reducing the number of expats from the headquarters in Japan
□ 7. Slow progress in the training of local employees
□ 8. Difficulty in transferring authority to make decisions from the headquarters in Japan
to the regional headquarters
□ 9. Poor production and service development capability in the regional headquarters
□ 10. Poor planning and marketing capability in the regional headquarters
□ 11. Other
□ 12. No problems regarding the localization of management
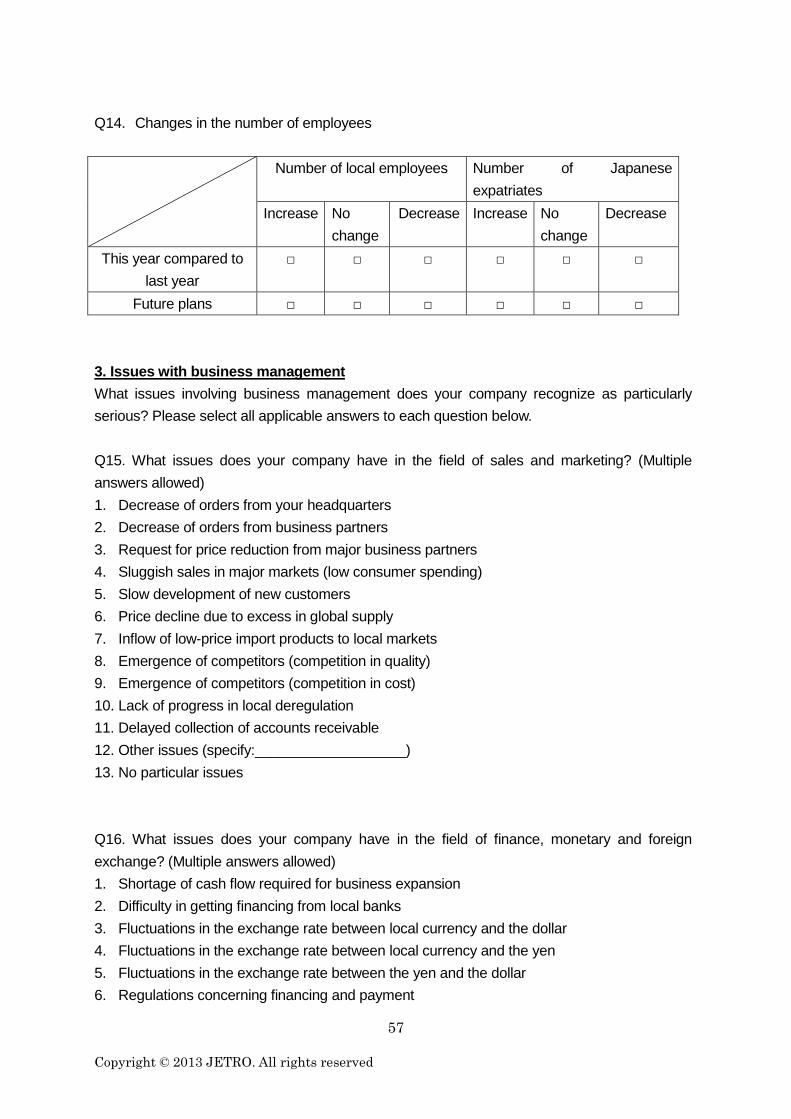
57
Copyright © 2013 JETRO. All rights reserved
Q14. Changes in the number of employees
Number of local employees Number of Japanese
expatriates
Increase No
change
Decrease Increase No
change
Decrease
This year compared to
last year
□ □ □ □ □ □
Future plans □ □ □ □ □ □
3. Issues with business management
What issues involving business management does your company recognize as particularly
serious? Please select all applicable answers to each question below.
Q15. What issues does your company have in the field of sales and marketing? (Multiple
answers allowed)
1. Decrease of orders from your headquarters
2. Decrease of orders from business partners
3. Request for price reduction from major business partners
4. Sluggish sales in major markets (low consumer spending)
5. Slow development of new customers
6. Price decline due to excess in global supply
7. Inflow of low-price import products to local markets
8. Emergence of competitors (competition in quality)
9. Emergence of competitors (competition in cost)
10. Lack of progress in local deregulation
11. Delayed collection of accounts receivable
12. Other issues (specify:___________________)
13. No particular issues
Q16. What issues does your company have in the field of finance, monetary and foreign
exchange? (Multiple answers allowed)
1. Shortage of cash flow required for business expansion
2. Difficulty in getting financing from local banks
3. Fluctuations in the exchange rate between local currency and the dollar
4. Fluctuations in the exchange rate between local currency and the yen
5. Fluctuations in the exchange rate between the yen and the dollar
6. Regulations concerning financing and payment
58
Copyright © 2013 JETRO. All rights reserved
7. Regulations concerning overseas remittance
8. Tax burden (corporate tax, transfer pricing taxation, etc.)
9. Rising interest rates
10. Other issues (specify:___________________)
11. No particular issues
Q17. What issues does your company have in the field of employment and labor? (Multiple
answers allowed)
1. Increase in wages of employees
2. Difficulty in recruiting workforce (general staff, office workers)
3. Difficulty in recruiting workforce (middle management level)
4. Difficulty in recruiting workforce (general workers) (manufacturing companies only)
5. Difficulty in recruiting workforce (engineers) (manufacturing companies only)
6. Retention rate of employees
7. Quality of employees
8. Cost for dispatched Japanese executives (stationed representatives)
9. Restriction on visa issuance for dispatched Japanese executives (stationed
representatives)
10. Regulations concerning dismissal and reduction of personnel
11. Difficulty in appointing local personnel as managers and supervisors
12. Restriction on hiring foreigners
13. Labor-related lawsuits
14. Other issues (specify:___________________)
15. No particular issues
Q18. What issues does your company have in the trade system? (Multiple answers allowed)
1. Complex procedures for customs clearance
2. Significant time required for customs clearance
3. Inadequate communication and enforcement of notices and rules
4. Unclear variation assessment / classification criteria for tariffs
5. High import tariffs
6. Unclear inspection system
7. High non-tariff barriers*
8. Strict or unclear quarantine system
9. Export restriction and export tax
10. Rules of origin
11. Other issues (specify:___________________)
12. No particular issues

59
Copyright © 2013 JETRO. All rights reserved
*Non-tariff barriers are measures to protect domestic industries from imported products by
restricting imports through means other than tariffs. Examples of this measure include
quantitative restriction and subsidies for production and consumer tax not directly related to
trade.
Q19. (This question is only for manufacturing companies. For non-manufacturing companies,
please go to Q20) What issues does your company have in the field of production? (Multiple
answers allowed)
1. Low production capacity due to limited facilities
2. Cost reduction which has nearly reached the limit
3. Rising procurement cost
4. Difficulty in local procurement of materials and parts
5. Difficulty in changing production items in a short period of time
6. Difficulty in quality control
7. High tariffs on imports of capital and intermediate goods
8. Instability of electricity supply and frequent outages
9. Inadequate logistics infrastructure
10. Environmental regulations becoming more strict
11. Other issues (specify:___________________)
12. No particular issues
4. Benefits and risks in the investment environment
Q.20 What benefits (strengths) does your company see in the investment environment?
(Multiple answers allowed)
1. Stable political and social climates
2. Market scale and potential for its growth
3. Abundant land/office spaces and low land prices/lease fees
4. Developed infrastructure (electricity supply, transportation, communications, etc.)
5. Concentration of supporting industries (convenience of local procurement)
6. Concentration of partner companies (customer companies)
7. Easy recruitment of employees (general workers, general staff and office workers, etc.)
8. Easy recruitment of employees (specialists and engineers, middle management level, etc.)
9. High retention rate of employees
10. High quality of employees (general workers)
11. High quality of employees (specialists and engineers)
12. High quality of employees (middle management level)
13. Tax incentives (corporate taxes, export and import tariffs, etc.)
60
Copyright © 2013 JETRO. All rights reserved
14. Substantial investment incentive scheme
15. Prompt clearance of procedures
16. Low language and communication barriers
17. Comfortable living environment for representatives stationed from headquarters
18. Other (specify:___________________)
Q.21 What risks (issues) does your company see in the investment environment? (Multiple
answers allowed)
1. Instable political and social climates
2. Inadequate infrastructure (electricity supply, logistics, communications, etc.)
3. Unclear policy administration by the local government
4. Complex administrative procedures (permission and licenses, etc.)
5. Complex tax system and procedures
6. Inadequate and unclear legal system
7. Restrictions on foreign investment such as foreign equity restrictions
8. Lack of intellectual property protection
9. Insufficient accumulation of related industries
10. Currency volatility
11. Limited workforce and difficulty in recruiting personnel
12. Limited land/office spaces and increasing land prices/lease fees
13. Rising labor cost
14. Labor disputes and labor-related lawsuits
15. Transaction risks (collection risk, etc.)
16. Consumer campaigns and boycotts (consumer boycotts, public protests, etc.)
17. Other (specify:___________________)
18. No particular issues
Q.22 What risks (issues) does your company have in the field of security? (Multiple answers
allowed)
1. Discord or ethnic/religious conflicts
2. Political conflicts
3. Demonstrations and strikes
4. Natural disasters
5. Environmental pollution
6. Diseases (serious contagious illnesses)
7. Security and terrorism
8. Cyber terrorism (hacking, etc.), industrial spies, etc.
9. Oversight of foreigners by authorities

61
Copyright © 2013 JETRO. All rights reserved
10. Crimes targeted at foreign people and companies (killings and injuries, kidnappings,
robberies and theft, fraud, etc.)
11. Accidents in which many foreigners have frequently been involved
12. Trouble related to civil affairs
13. Trouble with housing and living standards of representatives stationed from headquarters
and their families
14. Other and specific risks unique to the country (specify:_____________)
5. Challenges to explore market and source of competitive power
Q23. Regarding competition between your company and companies in the same business
categories (Please select only one.):
(1) Which of the following competes most intensively with your company?
Japanese companies U.S. companies European companies
Chinese companies South Korean companies Other Asian companies
Middle Eastern companies Local companies
Other Latin American companies Other No competition
(2) How has the competition with companies selected in (1) above changed in the last 12
months?
Competition increased Unchanged Competition lessened
<Procurement of raw materials and parts (Only for companies engaged in manufacturing
activity locally)>
Q.24. What was the ratio of the local procurement of raw materials/parts for products
manufactured in your local plant? (Based on the price as of September 2013)
Less than 10% 10% to less than 25% 25% to less than 75%
75% to 100%
Q25. What foreign country is your company mainly purchasing raw materials and parts from, if
any? (Choose as many as apply)

62
Copyright © 2013 JETRO. All rights reserved
Japan U.S. or Canada EU China (including Hong Kong)
ASEAN countries South Korea, Taiwan Mexico Brazil
Argentina Other Latin American countries Other
* Please answer for procurement from countries other than the country in which your
company is located.
In Latin America, multilateral and bilateral free trade agreements (FTAs), economic
partnership agreements (EPAs), ACE (the Economic Complementary Agreement, auto
agreements, etc.) and preferential trade agreements and tariff reduction have developed.
Please answer the following questions on your utilization of these FTAs/EPAs/ACE. (Prior
tariff reduction measures and/or Early Harvest* are included.)
* Early Harvest refers to an early tariff reduction undertaken on specified products.
Q26. How has your company been utilizing existing bilateral or multilateral FTAs/ EPAs/ACE ?
Please fill any other countries in parentheses if they are not listed.
(Choose as many as apply)
Please select all of
your export/import
destinations.
Utilization of preferential tax rates
provided by FTAs in exports
Utilization of preferential tax rates
provided by FTAs in imports
Exporting
to
Importing
from Utilizing
Considering utilization
Not utilizing (No plan to
utilize) Utilizing
Considering utilization
Not utilizing (No plan to
utilize)
Japan □1 □2
□3 □4 □5 □6 □7 □8
NAFTA* □1 □2 □3 □4 □5 □6 □7 □8
Mercosur** □1 □2 □3 □4 □5 □6 □7 □8
Five Central
American
Countries***
□1
□2
□3 □4 □5 □6 □7
□8
Chile □1 □2 □3 □4 □5 □6 □7 □8
EU 27 □1
□2 □3 □4 □5 □6 □7
□8
( ) □1
□2 □3 □4 □5 □6 □7 □8
( ) □1
□2 □3 □4 □5 □6 □7 □8

63
Copyright © 2013 JETRO. All rights reserved
*NAFTA: US, Canada and Mexico
**Mercosur: Brazil, Argentina, Paraguay, Uruguay and Venezuela
***Five Central American Countries: Guatemala, El Salvador, Honduras, Nicaragua and Costa
Rica
Q27. What problems are you facing in utilizing FTAs/EPAs in exports? (Only for companies
engaged in exporting)(Choose as many as apply)
□ 1. Expensive issuance costs of certificates of origin
□ 2. Procedures for certificates of origin take too long
□ 3. Rules of origin cannot be met or are very difficult to meet
□ 4. Rules of origin for existing FTAs/EPAs are different from each other causing confusion
□ 5. Complicated procedures in getting certificates of origin
□ 6. Difficulty in getting cooperation from suppliers in utilizing FTAs/EPAs
□ 7. FTAs/EPAs do not exist with major export destinations
□ 8. Tariff quota systems of FTAs/EPAs are not functioning
□ 9. Shortage of capable personnel in our company
□ 10. No problem in particular
□ 11. Other
Q28. What problems are you facing in utilizing FTAs/EPAs in imports? (Only for companies
engaged in importing)
(Choose as many as apply)
□ 1. Difficulty in getting cooperation from suppliers in utilizing FTAs/EPAs
□ 2. Merits do not exist due to little difference between preferential tariffs based on FTAs/EPAs
and general tariff rates
□ 3. FTAs/EPAs do not exist with major import sources
□ 4. Overly strict inspection for preferential tax approval at the customs of the importing country
□ 5. No problem in particular
□ 6. Other

64
Copyright © 2013 JETRO. All rights reserved
Q29. If there are any problems which you consider to have had an impact on your business
development in the country Your Company is located, other than those chosen in above
questions, please let us know the details and its impacts on Your Company.
Thank you very much for your cooperation.

The 14th Survey on Business Conditions of Japanese Companies
in Latin America
Issued December 2013
Written by Overseas Research Dept. Satoshi Yoshida
Latin America Div. Overseas
Research Dept.
Yusuke Uchio
Takao Nakahata
Akira Ito
Collaborators Mexico Office Nobuhiro Nakajima
Caracas Office Kentaro Matsuura
Bogota Office Fumihiro Shimizu
Lima Office Masayuki Fujimoto
Santiago Office Takaharu Horinouchi
Sao Paulo Office Toshio Kii
Japan External Trade Organization(JETRO)
an Independent Administrative Institution
Ark Mori Bldg., PO Box 528
1-12-32 Akasaka, Minato-ku, Tokyo 107-6006
Phone: +81-3-3582-4690
(Overseas Research Department, Latin American Division)
Copyright © 2013 JETRO. All rights reserved.