thanfinalpaper2013, seismic testing or rc, masonry, braced steel frames.pdf
TRANSCRIPT
DATA ANALYSIS OF LARGE SCALE EXPERIMENTAL RESULTS FROM SEISMIC TESTING OF REINFORCED CONCRETE MASONRY BRACED
STEEL FRAMES NEES REU Final Report Summer 2013
Soknirorn Than
San Jose State University University of Illinois at Urbana-Champaign
Mentor: Timothy Gregor
P.I.: Daniel Abrams
P a g e | 1
Abstract
At the University of Illinois at Urbana-Champaign, several hybrid masonry walls were
constructed and tested under cyclic loading. These specimens consisted of a two story, one-bay
steel frame with two reinforced concrete masonry panels. This system is designed to act as a
lateral force resisting system during an extreme event such as an earthquake. The focus, during
the summer 2013 NEES REU program, was on post data processing of 3 completed tests. This
post data processing is done using MATLAB. This report details the processes that were used to
develop MATLAB protocols, which include: categorizing and sorting data from the data
acquisition system, calculating forces, and creating visual effects from the force diagrams. In
addition, this report contains force and strain diagrams of the four inch fuse test as an example.
P a g e | 2
Table of Contents
1. Introduction .............................................................................................................................................. 3
1.1. Project Overview ....................................................................................................................... 3
1.2. Literature Review ...................................................................................................................... 3
2. Data Processing Methods ......................................................................................................................... 6
2.1. Experimental Setup and Loading Protocol ................................................................................ 6
2.2. MATLAB Process to Analyze Beam and Columns ..................................................................... 7
2.2.1. Categorizing Beam and Column Data ......................................................................................... 7
2.2.2. Columns Force Calculation .......................................................................................................... 8
2.2.3. Beam Force Calculation ............................................................................................................ 10
2.3. MATLAB Process to Determine the Yield Point ...................................................................... 11
2.4. MATLAB Process to Analyze Masonry Panels ......................................................................... 12
2.4.1. Krypton System & Constant Strain Triangle Calculation ........................................................... 12
3. Results ..................................................................................................................................................... 13
3.1. Beam and Column Force Diagrams ......................................................................................... 13
3.1.1. Column Forces at Yield Point .................................................................................................... 13
3.1.2. Beam Forces at Yield Point ....................................................................................................... 14
3.2. Concrete Masonry Panels Strain Diagram .............................................................................. 14
4. Conclusion ............................................................................................................................................... 15
5. Contact Information ................................................................................................................................ 16
6. Acknowledgements ................................................................................................................................. 16
7. References .............................................................................................................................................. 17
P a g e | 3
1. Introduction
1.1. Project Overview
This project allows researchers to determine the behavior of reinforced concrete masonry
panels in bracing steel frame structures during seismic events. Unlike typical concrete masonry
panels, Hybrid masonry systems are used to resist lateral loads, such as shear and flexural.
Within this system, the reinforced concrete masonry panels resist the lateral loads through the
use of connector plates or shear studs. This project is a collaborative effort between the
University of Illinois at Urbana-Champaign (UIUC), Rice University, University of Hawaii at
Manoa, Ryan-Biggs Associates, and is funded by the National Science Foundation (NSF) award
#0936464.
The project is divided into seven different tasks: prototype and design studies, connector
development, large scale testing, simulation models, system analyses, trial designs, and
outreach. Work is currently being done on task number 3, large scale testing, at UIUC. As part
of the hybrid masonry project, this summer’s REU program was able to process the results from
previous large scale experiments and generate graphic representations of the results through
the use of MATLAB.
1.2. Literature Review
Masonry structural systems have been utilized for many millennia. Not only are they
cost effective, but they also provide many additional features in the design. Masonry structural
systems are fire resistant, thermal resistant, and environmentally friendly. Despite their
benefits, masonry structural systems still need to be studied more in depth before it can be
safely used in high seismic regions. Due to the lack of understanding, masonry structural
systems were mainly used to resist out-of-plane loads, such as wind and gravitational loads,
rather than to resist in-plane loads from the structures, such as shear and flexural loads. For
this reason, many researchers began developing a structural system that utilizes masonry walls
as a means to resist shear and flexural loads in steel frame structures during seismic events.
Hybrid masonry walls consist of vertical and horizontal reinforcement bars in grouted masonry
blocks. These components are placed within a steel frame bay in the same plane as the steel
members. Two building materials are connected with either connector plates or shear studs.
The concept of combining reinforced concrete masonry and steel frames benefits from the
stiffness, ductility and strength of both building materials [Abrams, 2011]. Consequently, three
types of hybrid masonry wall were developed: Type I, Type II and Type III. These different types
of walls can be used to disperse gravitational forces, story shears, and overturning moments
from the steel structure to the masonry panels, along with the foundation.
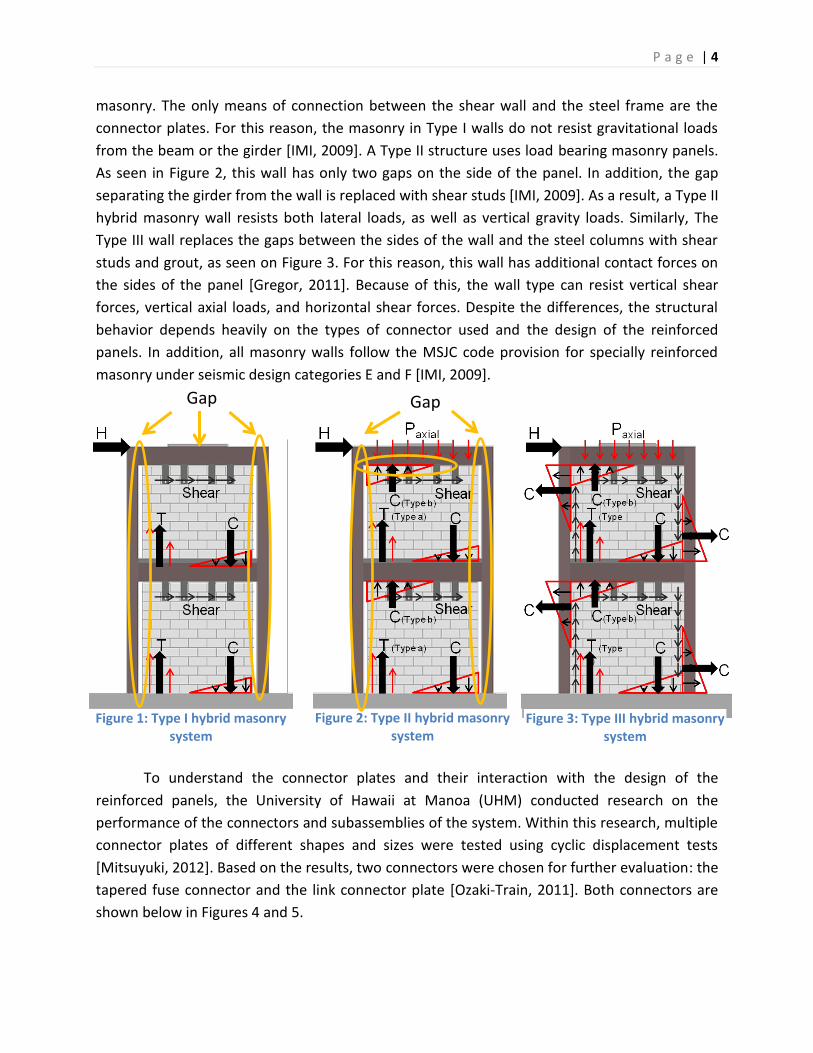
Type I hybrid masonry walls use the masonry as a non-load bearing shear wall. From
Figure 1, this type of wall has gaps surrounding the panel, separating the steel frame from the
P a g e | 4
Figure 3: Type III hybrid masonry system
masonry. The only means of connection between the shear wall and the steel frame are the
connector plates. For this reason, the masonry in Type I walls do not resist gravitational loads
from the beam or the girder [IMI, 2009]. A Type II structure uses load bearing masonry panels.
As seen in Figure 2, this wall has only two gaps on the side of the panel. In addition, the gap
separating the girder from the wall is replaced with shear studs [IMI, 2009]. As a result, a Type II
hybrid masonry wall resists both lateral loads, as well as vertical gravity loads. Similarly, The
Type III wall replaces the gaps between the sides of the wall and the steel columns with shear
studs and grout, as seen on Figure 3. For this reason, this wall has additional contact forces on
the sides of the panel [Gregor, 2011]. Because of this, the wall type can resist vertical shear
forces, vertical axial loads, and horizontal shear forces. Despite the differences, the structural
behavior depends heavily on the types of connector used and the design of the reinforced
panels. In addition, all masonry walls follow the MSJC code provision for specially reinforced
masonry under seismic design categories E and F [IMI, 2009].
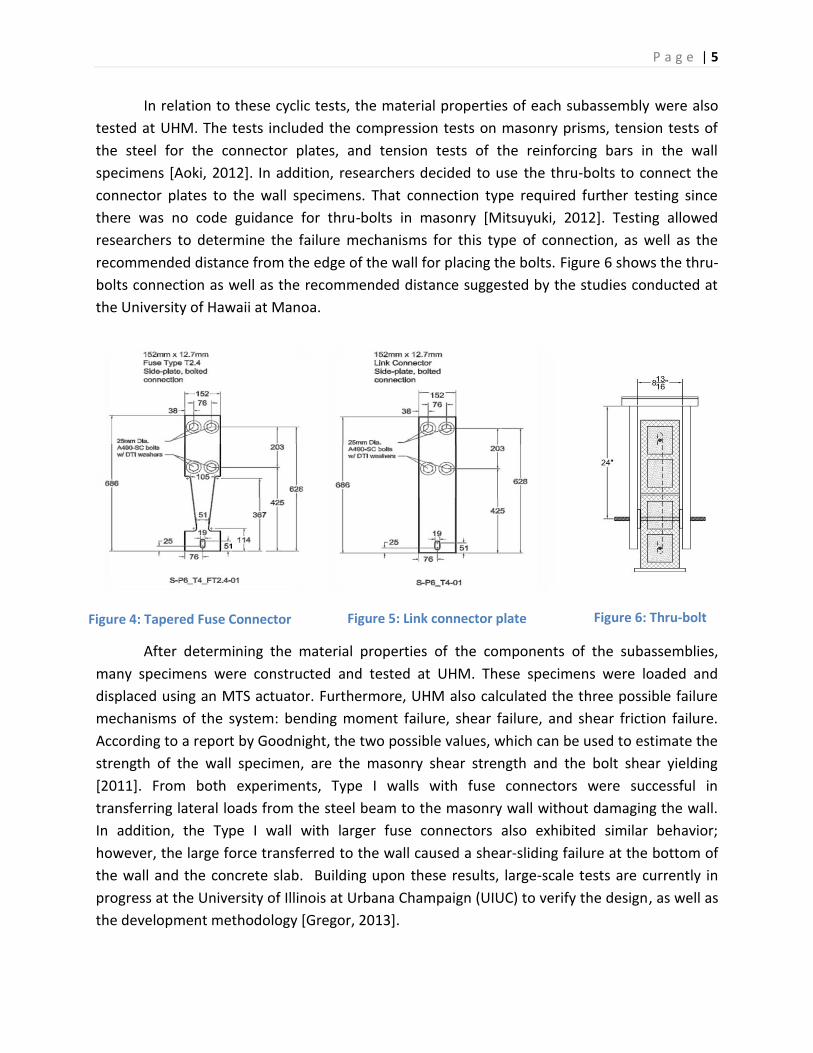
To understand the connector plates and their interaction with the design of the
reinforced panels, the University of Hawaii at Manoa (UHM) conducted research on the
performance of the connectors and subassemblies of the system. Within this research, multiple
connector plates of different shapes and sizes were tested using cyclic displacement tests
[Mitsuyuki, 2012]. Based on the results, two connectors were chosen for further evaluation: the
tapered fuse connector and the link connector plate [Ozaki-Train, 2011]. Both connectors are
shown below in Figures 4 and 5.
Figure 2: Type II hybrid masonry system
Gap Gap
Figure 1: Type I hybrid masonry system
P a g e | 5
Figure 5: Link connector plate Figure 4: Tapered Fuse Connector Figure 6: Thru-bolt connection
In relation to these cyclic tests, the material properties of each subassembly were also
tested at UHM. The tests included the compression tests on masonry prisms, tension tests of
the steel for the connector plates, and tension tests of the reinforcing bars in the wall
specimens [Aoki, 2012]. In addition, researchers decided to use the thru-bolts to connect the
connector plates to the wall specimens. That connection type required further testing since
there was no code guidance for thru-bolts in masonry [Mitsuyuki, 2012]. Testing allowed
researchers to determine the failure mechanisms for this type of connection, as well as the
recommended distance from the edge of the wall for placing the bolts. Figure 6 shows the thru-
bolts connection as well as the recommended distance suggested by the studies conducted at
the University of Hawaii at Manoa.
After determining the material properties of the components of the subassemblies,
many specimens were constructed and tested at UHM. These specimens were loaded and
displaced using an MTS actuator. Furthermore, UHM also calculated the three possible failure
mechanisms of the system: bending moment failure, shear failure, and shear friction failure.
According to a report by Goodnight, the two possible values, which can be used to estimate the
strength of the wall specimen, are the masonry shear strength and the bolt shear yielding
[2011]. From both experiments, Type I walls with fuse connectors were successful in
transferring lateral loads from the steel beam to the masonry wall without damaging the wall.
In addition, the Type I wall with larger fuse connectors also exhibited similar behavior;
however, the large force transferred to the wall caused a shear-sliding failure at the bottom of
the wall and the concrete slab. Building upon these results, large-scale tests are currently in
progress at the University of Illinois at Urbana Champaign (UIUC) to verify the design, as well as
the development methodology [Gregor, 2013].
P a g e | 6
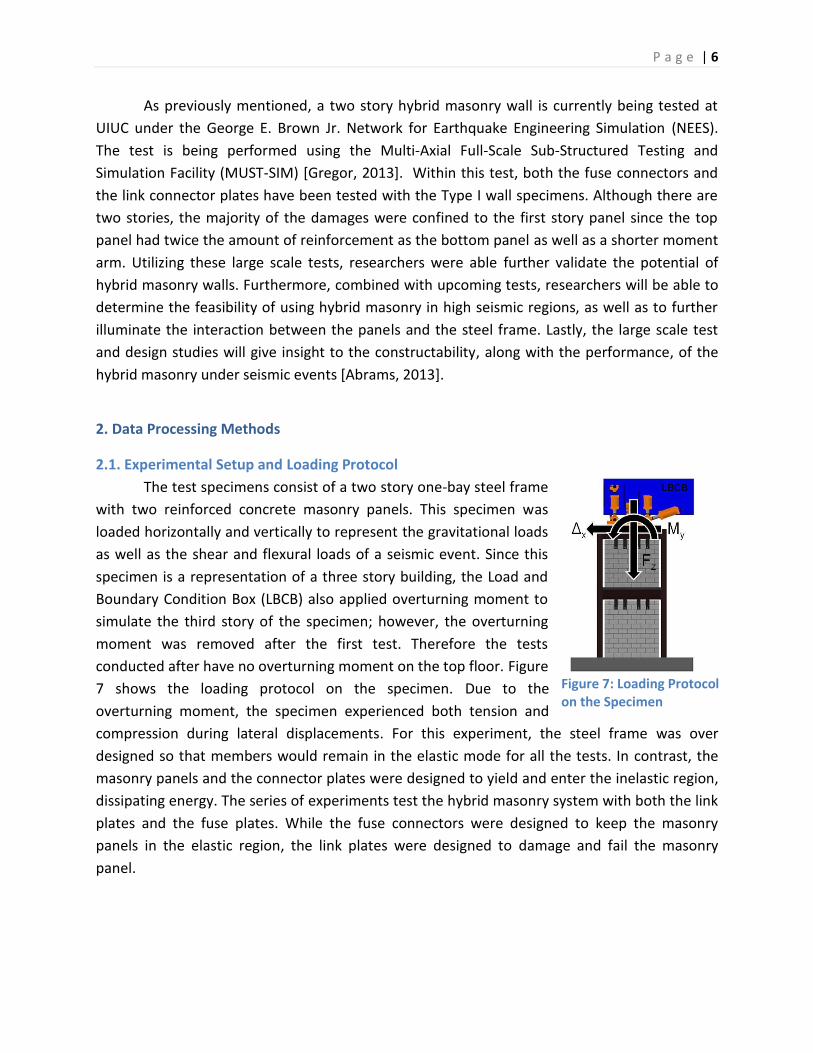
Figure 7: Loading Protocol on the Specimen
As previously mentioned, a two story hybrid masonry wall is currently being tested at
UIUC under the George E. Brown Jr. Network for Earthquake Engineering Simulation (NEES).
The test is being performed using the Multi-Axial Full-Scale Sub-Structured Testing and
Simulation Facility (MUST-SIM) [Gregor, 2013]. Within this test, both the fuse connectors and
the link connector plates have been tested with the Type I wall specimens. Although there are
two stories, the majority of the damages were confined to the first story panel since the top
panel had twice the amount of reinforcement as the bottom panel as well as a shorter moment
arm. Utilizing these large scale tests, researchers were able further validate the potential of
hybrid masonry walls. Furthermore, combined with upcoming tests, researchers will be able to
determine the feasibility of using hybrid masonry in high seismic regions, as well as to further
illuminate the interaction between the panels and the steel frame. Lastly, the large scale test
and design studies will give insight to the constructability, along with the performance, of the
hybrid masonry under seismic events [Abrams, 2013].
2. Data Processing Methods
2.1. Experimental Setup and Loading Protocol
The test specimens consist of a two story one-bay steel frame
with two reinforced concrete masonry panels. This specimen was
loaded horizontally and vertically to represent the gravitational loads
as well as the shear and flexural loads of a seismic event. Since this
specimen is a representation of a three story building, the Load and
Boundary Condition Box (LBCB) also applied overturning moment to
simulate the third story of the specimen; however, the overturning
moment was removed after the first test. Therefore the tests
conducted after have no overturning moment on the top floor. Figure
7 shows the loading protocol on the specimen. Due to the
overturning moment, the specimen experienced both tension and
compression during lateral displacements. For this experiment, the steel frame was over
designed so that members would remain in the elastic mode for all the tests. In contrast, the
masonry panels and the connector plates were designed to yield and enter the inelastic region,
dissipating energy. The series of experiments test the hybrid masonry system with both the link
plates and the fuse plates. While the fuse connectors were designed to keep the masonry
panels in the elastic region, the link plates were designed to damage and fail the masonry
panel.
P a g e | 7
2.2. MATLAB Process to Analyze Beam and Columns
MATLAB was used to sort and process all of the data from the data acquisition system
(DAQ). Experimental data includes all the feedback from the string potentiometers, strain
gages, linear potentiometers, and linear variable differential transformers (LVDTs). Moreover,
these MATLAB functions are streamlined for ease of use with multiple completed tests and
future tests.
2.2.1. Categorize Beam and Column Data
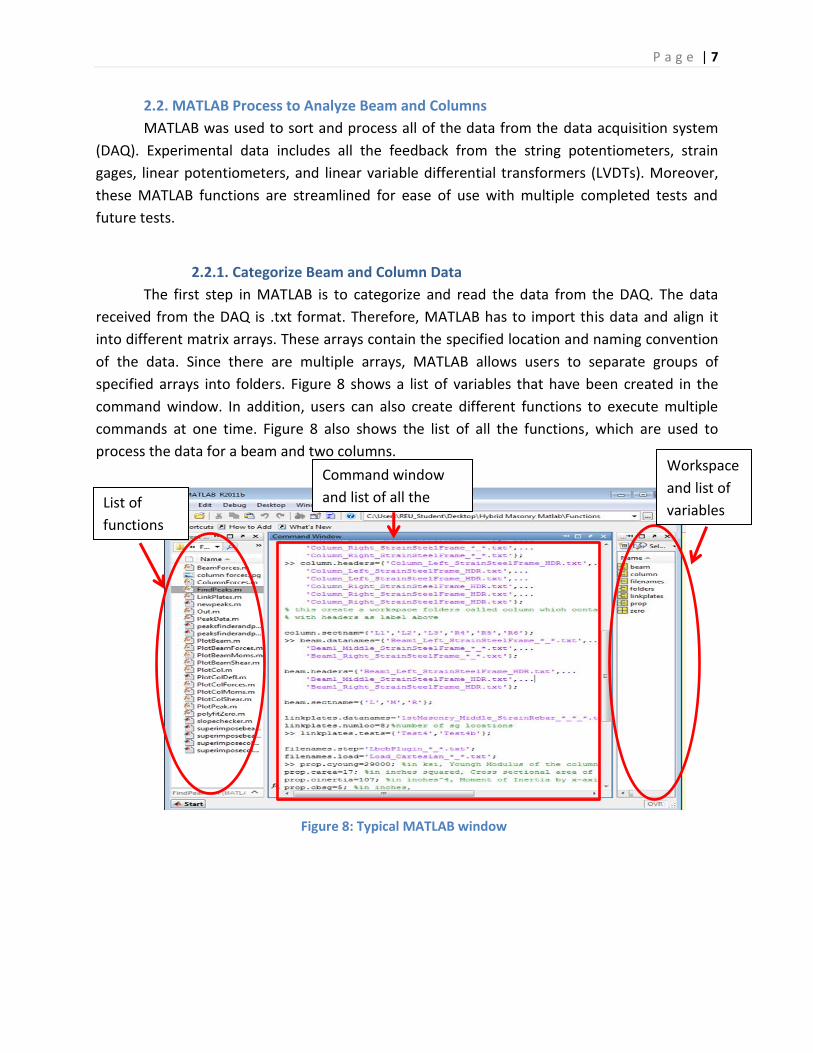
The first step in MATLAB is to categorize and read the data from the DAQ. The data
received from the DAQ is .txt format. Therefore, MATLAB has to import this data and align it
into different matrix arrays. These arrays contain the specified location and naming convention
of the data. Since there are multiple arrays, MATLAB allows users to separate groups of
specified arrays into folders. Figure 8 shows a list of variables that have been created in the
command window. In addition, users can also create different functions to execute multiple
commands at one time. Figure 8 also shows the list of all the functions, which are used to
process the data for a beam and two columns.
Figure 8: Typical MATLAB window
Command window
and list of all the
command
Workspace
and list of
variables List of
functions
P a g e | 8
Figure 10: Strain gages location
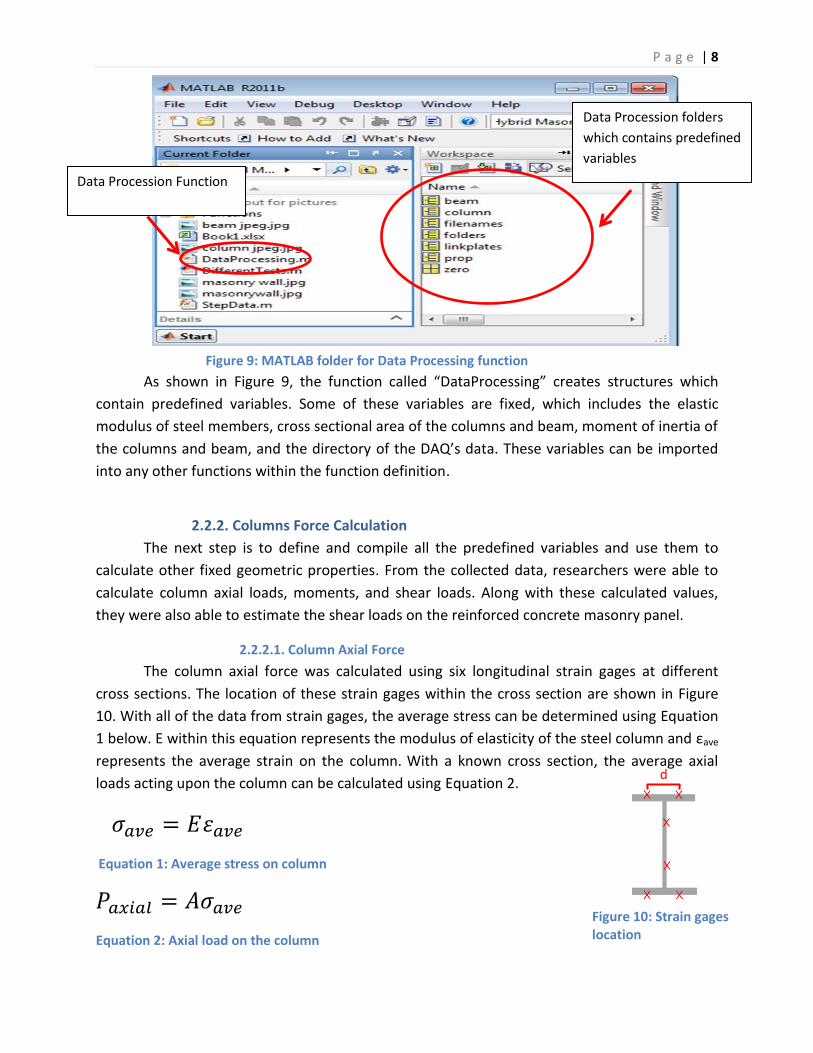
As shown in Figure 9, the function called “DataProcessing” creates structures which
contain predefined variables. Some of these variables are fixed, which includes the elastic
modulus of steel members, cross sectional area of the columns and beam, moment of inertia of
the columns and beam, and the directory of the DAQ’s data. These variables can be imported
into any other functions within the function definition.
2.2.2. Columns Force Calculation
The next step is to define and compile all the predefined variables and use them to
calculate other fixed geometric properties. From the collected data, researchers were able to
calculate column axial loads, moments, and shear loads. Along with these calculated values,
they were also able to estimate the shear loads on the reinforced concrete masonry panel.
2.2.2.1. Column Axial Force
The column axial force was calculated using six longitudinal strain gages at different
cross sections. The location of these strain gages within the cross section are shown in Figure
10. With all of the data from strain gages, the average stress can be determined using Equation
1 below. E within this equation represents the modulus of elasticity of the steel column and εave
represents the average strain on the column. With a known cross section, the average axial
loads acting upon the column can be calculated using Equation 2.
Equation 1: Average stress on column
Equation 2: Axial load on the column
Figure 9: MATLAB folder for Data Processing function
Data Procession Function
Data Procession folders
which contains predefined
variables
d
P a g e | 9
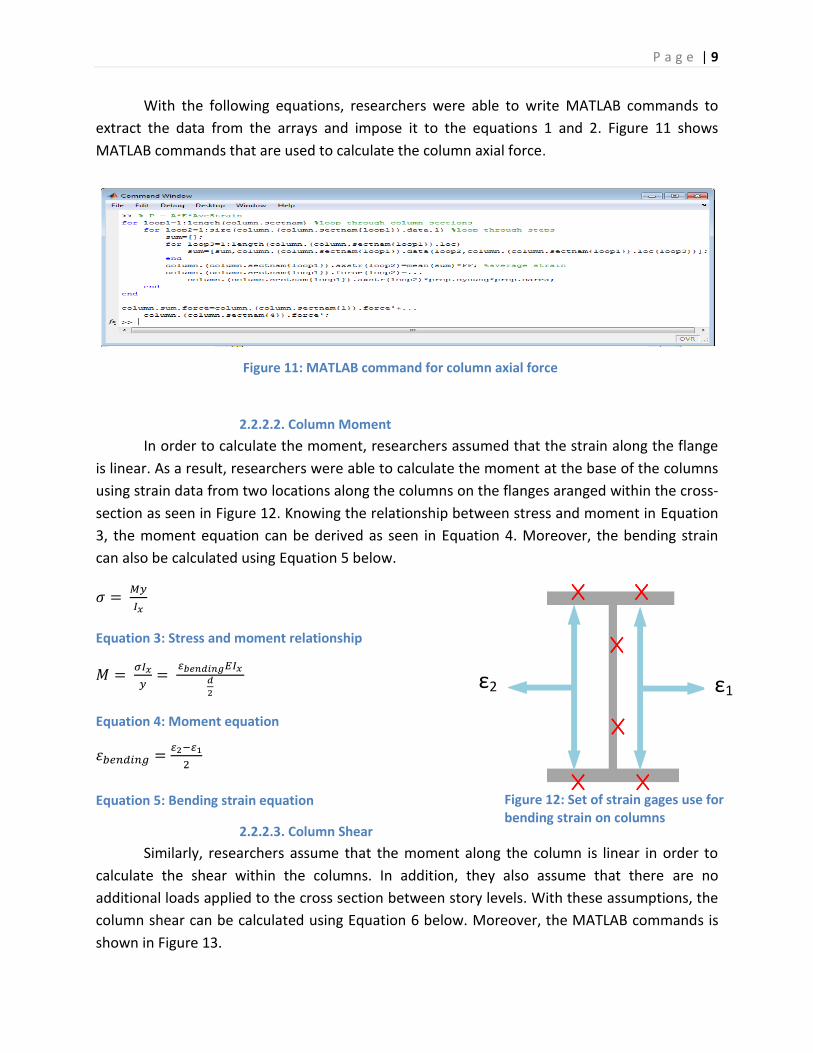
With the following equations, researchers were able to write MATLAB commands to
extract the data from the arrays and impose it to the equations 1 and 2. Figure 11 shows
MATLAB commands that are used to calculate the column axial force.
2.2.2.2. Column Moment
In order to calculate the moment, researchers assumed that the strain along the flange
is linear. As a result, researchers were able to calculate the moment at the base of the columns
using strain data from two locations along the columns on the flanges aranged within the cross-
section as seen in Figure 12. Knowing the relationship between stress and moment in Equation
3, the moment equation can be derived as seen in Equation 4. Moreover, the bending strain
can also be calculated using Equation 5 below.
Equation 3: Stress and moment relationship
Equation 4: Moment equation
Equation 5: Bending strain equation
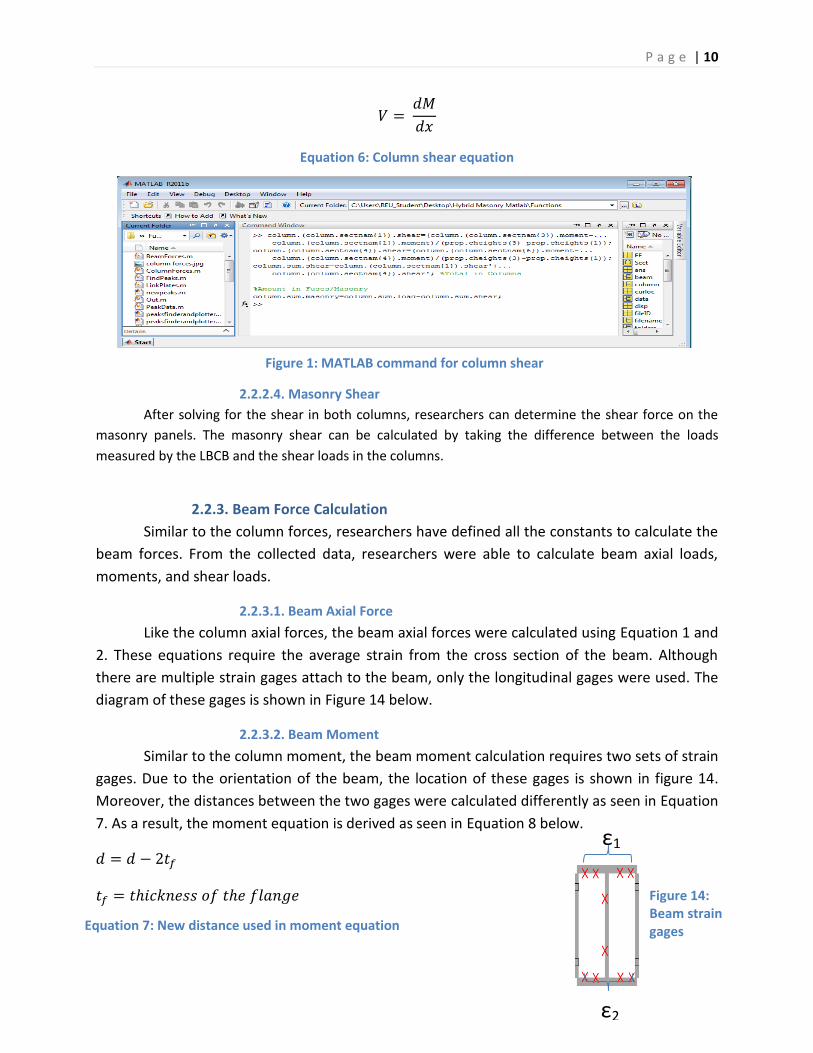
2.2.2.3. Column Shear
Similarly, researchers assume that the moment along the column is linear in order to
calculate the shear within the columns. In addition, they also assume that there are no
additional loads applied to the cross section between story levels. With these assumptions, the
column shear can be calculated using Equation 6 below. Moreover, the MATLAB commands is
shown in Figure 13.
Figure 11: MATLAB command for column axial force
ε2 ε1
Figure 12: Set of strain gages use for bending strain on columns
P a g e | 10
Figure 14: Beam strain gages
Equation 6: Column shear equation
2.2.2.4. Masonry Shear
After solving for the shear in both columns, researchers can determine the shear force on the
masonry panels. The masonry shear can be calculated by taking the difference between the loads
measured by the LBCB and the shear loads in the columns.
2.2.3. Beam Force Calculation
Similar to the column forces, researchers have defined all the constants to calculate the
beam forces. From the collected data, researchers were able to calculate beam axial loads,
moments, and shear loads.
2.2.3.1. Beam Axial Force
Like the column axial forces, the beam axial forces were calculated using Equation 1 and
2. These equations require the average strain from the cross section of the beam. Although
there are multiple strain gages attach to the beam, only the longitudinal gages were used. The
diagram of these gages is shown in Figure 14 below.
2.2.3.2. Beam Moment
Similar to the column moment, the beam moment calculation requires two sets of strain
gages. Due to the orientation of the beam, the location of these gages is shown in figure 14.
Moreover, the distances between the two gages were calculated differently as seen in Equation
7. As a result, the moment equation is derived as seen in Equation 8 below.
Figure 1: MATLAB command for column shear
ε1
ε2
Equation 7: New distance used in moment equation
P a g e | 11
Equation 8: Beam moment equation
2.2.3.3. Beam Shear
In order to calculate the shear on the beam, researchers assume that the web will take
the majority of the shear strain. In addition, the researchers also assume that the shear strain is
uniform throughout the web. Therefore, they only need the two rosettes strain gages located
on the web, as seen in Figure 14, to calculate shear strain. Since the set of rosettes are placed
only at the two ends of the beam, the beam shear was only calculated at the two ends of the
beam. The equation for beam shear is presented in Equation 9 below.
( )
Equation 9: Beam shear equation
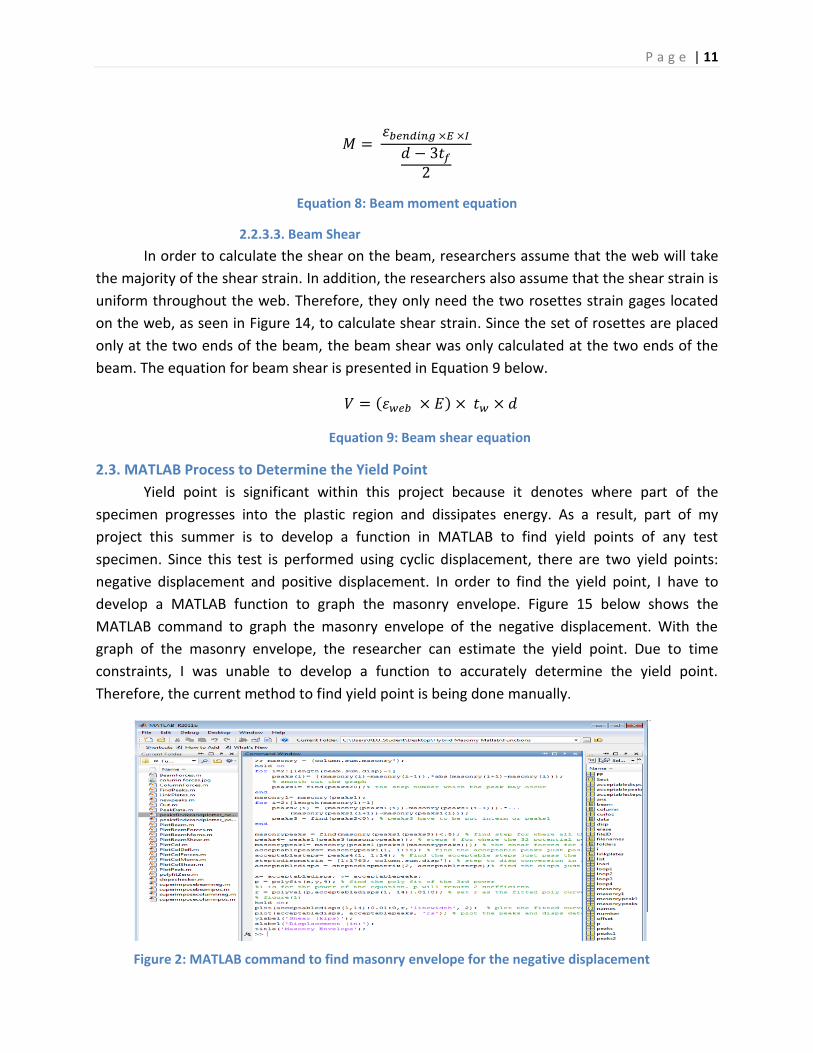
2.3. MATLAB Process to Determine the Yield Point
Yield point is significant within this project because it denotes where part of the
specimen progresses into the plastic region and dissipates energy. As a result, part of my
project this summer is to develop a function in MATLAB to find yield points of any test
specimen. Since this test is performed using cyclic displacement, there are two yield points:
negative displacement and positive displacement. In order to find the yield point, I have to
develop a MATLAB function to graph the masonry envelope. Figure 15 below shows the
MATLAB command to graph the masonry envelope of the negative displacement. With the
graph of the masonry envelope, the researcher can estimate the yield point. Due to time
constraints, I was unable to develop a function to accurately determine the yield point.
Therefore, the current method to find yield point is being done manually.
Figure 2: MATLAB command to find masonry envelope for the negative displacement
P a g e | 12
2.4. MATLAB Process to Analyze Masonry Panels
Since hybrid masonry is a combined structural system, it is important to understand
both the steel structure and the reinforced masonry walls. As mentioned earlier, the large scale
specimen consists of both a steel frame and masonry panels. Within this experiment, the
second story received minimal damage; therefore, a more detailed analysis is being done to the
lower level. For this experiment, researchers use the high speed and high accuracy Krypton
K600-DMM cameras to measure the displacement of the bottom masonry panel. Similar to the
beam and column data, the Krypton data is also being processed with MATLAB. Similar MATLAB
commands are also used to organize the krypton data.
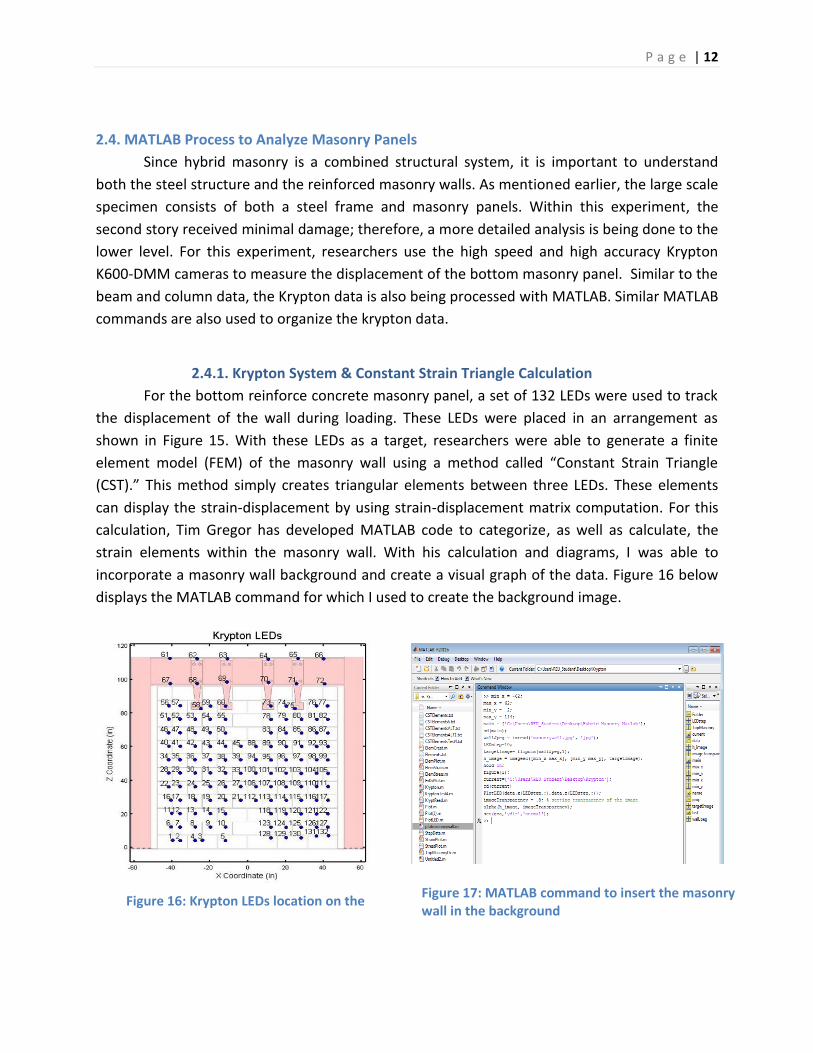
2.4.1. Krypton System & Constant Strain Triangle Calculation
For the bottom reinforce concrete masonry panel, a set of 132 LEDs were used to track
the displacement of the wall during loading. These LEDs were placed in an arrangement as
shown in Figure 15. With these LEDs as a target, researchers were able to generate a finite
element model (FEM) of the masonry wall using a method called “Constant Strain Triangle
(CST).” This method simply creates triangular elements between three LEDs. These elements
can display the strain-displacement by using strain-displacement matrix computation. For this
calculation, Tim Gregor has developed MATLAB code to categorize, as well as calculate, the
strain elements within the masonry wall. With his calculation and diagrams, I was able to
incorporate a masonry wall background and create a visual graph of the data. Figure 16 below
displays the MATLAB command for which I used to create the background image.
Figure 17: MATLAB command to insert the masonry wall in the background
Figure 16: Krypton LEDs location on the
P a g e | 13
3. Results
For the 4 inch fuse plate tests, Type I hybrid masonry large scale test has been
performed. All of the data gathered from this test were made available. For this reason, I was
able to run these test results through MATLAB and generate multiple graphs to aid researchers
in understanding the interaction between the reinforced concrete masonry panels and the steel
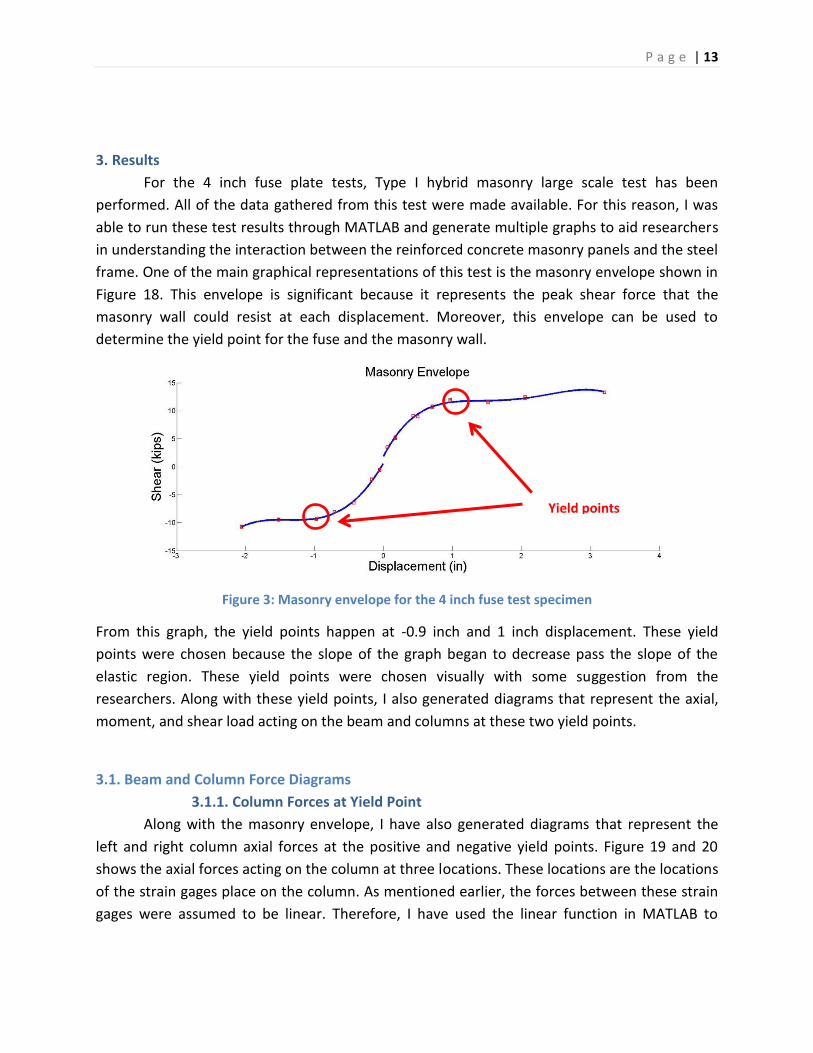
frame. One of the main graphical representations of this test is the masonry envelope shown in
Figure 18. This envelope is significant because it represents the peak shear force that the
masonry wall could resist at each displacement. Moreover, this envelope can be used to
determine the yield point for the fuse and the masonry wall.
Figure 3: Masonry envelope for the 4 inch fuse test specimen
From this graph, the yield points happen at -0.9 inch and 1 inch displacement. These yield
points were chosen because the slope of the graph began to decrease pass the slope of the
elastic region. These yield points were chosen visually with some suggestion from the
researchers. Along with these yield points, I also generated diagrams that represent the axial,
moment, and shear load acting on the beam and columns at these two yield points.
3.1. Beam and Column Force Diagrams
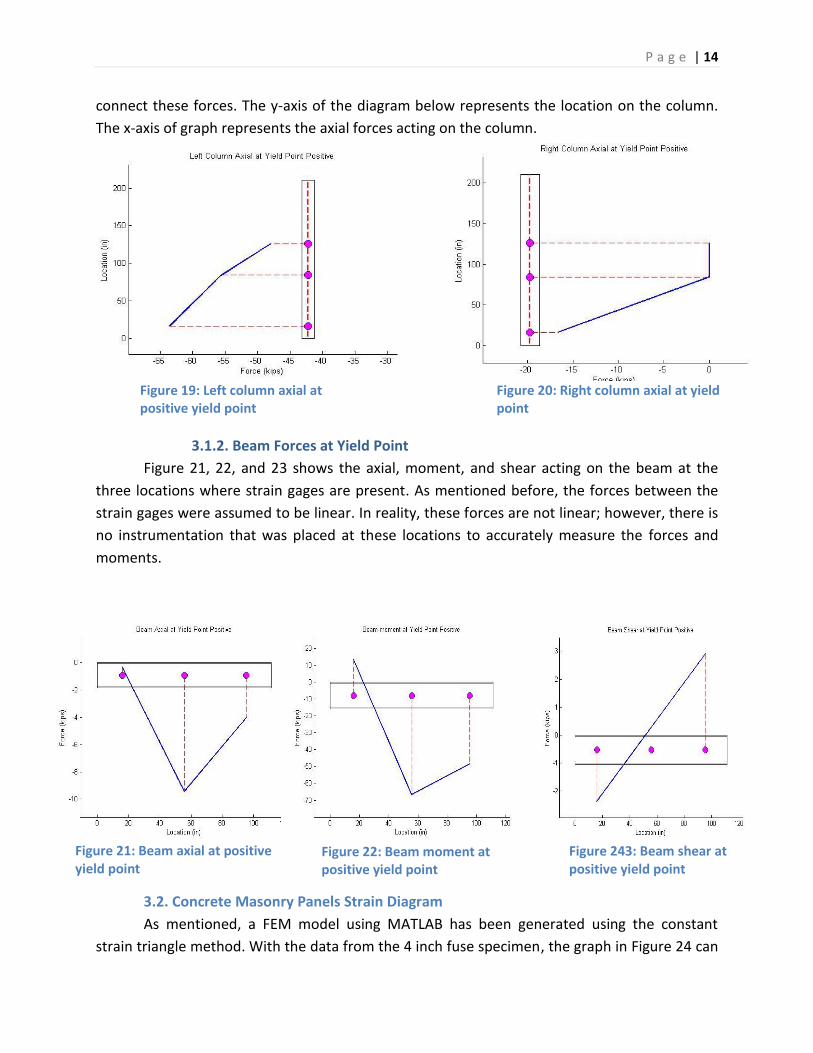
3.1.1. Column Forces at Yield Point
Along with the masonry envelope, I have also generated diagrams that represent the
left and right column axial forces at the positive and negative yield points. Figure 19 and 20
shows the axial forces acting on the column at three locations. These locations are the locations
of the strain gages place on the column. As mentioned earlier, the forces between these strain
gages were assumed to be linear. Therefore, I have used the linear function in MATLAB to
Yield points
P a g e | 14
connect these forces. The y-axis of the diagram below represents the location on the column.
The x-axis of graph represents the axial forces acting on the column.
3.1.2. Beam Forces at Yield Point
Figure 21, 22, and 23 shows the axial, moment, and shear acting on the beam at the
three locations where strain gages are present. As mentioned before, the forces between the
strain gages were assumed to be linear. In reality, these forces are not linear; however, there is
no instrumentation that was placed at these locations to accurately measure the forces and
moments.
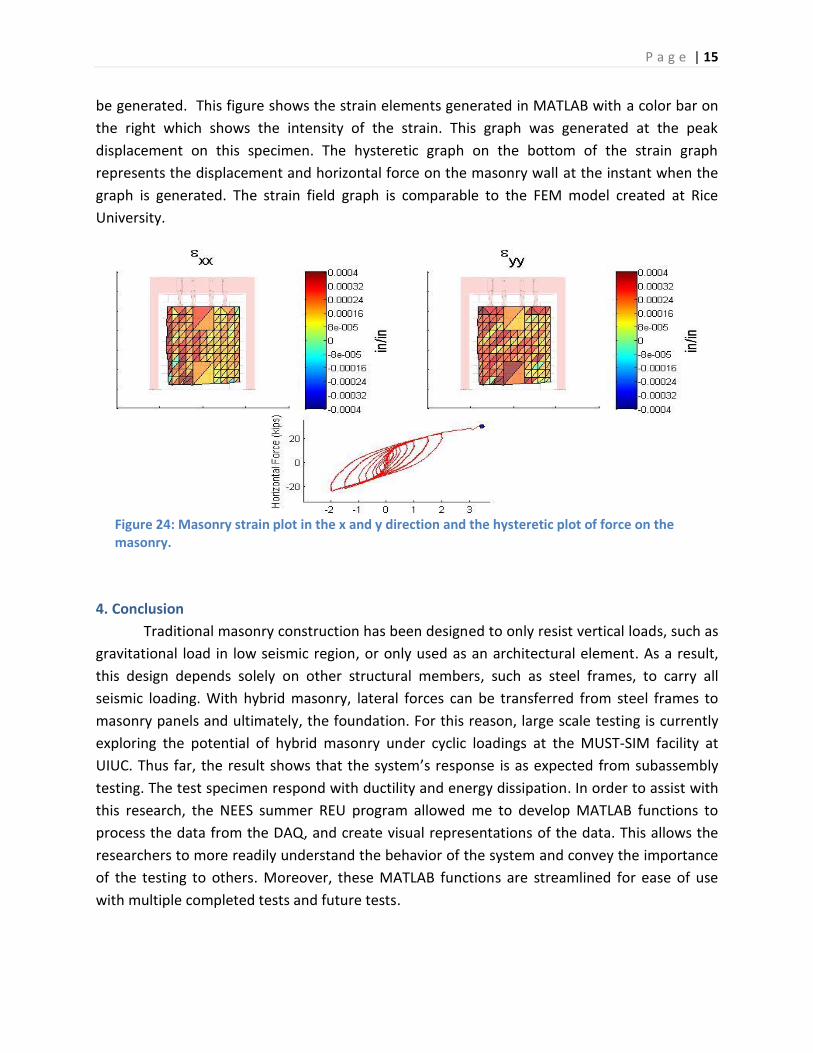
3.2. Concrete Masonry Panels Strain Diagram
As mentioned, a FEM model using MATLAB has been generated using the constant
strain triangle method. With the data from the 4 inch fuse specimen, the graph in Figure 24 can
Figure 21: Beam axial at positive yield point
Figure 22: Beam moment at positive yield point
Figure 243: Beam shear at positive yield point
Figure 19: Left column axial at positive yield point
Figure 20: Right column axial at yield point
P a g e | 15
Figure 24: Masonry strain plot in the x and y direction and the hysteretic plot of force on the masonry.
be generated. This figure shows the strain elements generated in MATLAB with a color bar on
the right which shows the intensity of the strain. This graph was generated at the peak
displacement on this specimen. The hysteretic graph on the bottom of the strain graph
represents the displacement and horizontal force on the masonry wall at the instant when the
graph is generated. The strain field graph is comparable to the FEM model created at Rice
University.
4. Conclusion
Traditional masonry construction has been designed to only resist vertical loads, such as
gravitational load in low seismic region, or only used as an architectural element. As a result,
this design depends solely on other structural members, such as steel frames, to carry all
seismic loading. With hybrid masonry, lateral forces can be transferred from steel frames to
masonry panels and ultimately, the foundation. For this reason, large scale testing is currently
exploring the potential of hybrid masonry under cyclic loadings at the MUST-SIM facility at
UIUC. Thus far, the result shows that the system’s response is as expected from subassembly
testing. The test specimen respond with ductility and energy dissipation. In order to assist with
this research, the NEES summer REU program allowed me to develop MATLAB functions to
process the data from the DAQ, and create visual representations of the data. This allows the
researchers to more readily understand the behavior of the system and convey the importance
of the testing to others. Moreover, these MATLAB functions are streamlined for ease of use
with multiple completed tests and future tests.
P a g e | 16
5. Contact Information
For more information about post data procession contact: Soknirorn Than,
San Jose State University [email protected].
For more information about the overall aspect of the project contact: Timothy Gregor,
University of Illinois at Urbana-Champaign, [email protected].
6. Acknowledgements
This project is funded by NSF NEESR CMMI-0936464. I want to thank my P.I. Dr. Daniel Abrams
and my mentor, Tim Gregor, for helping me throughout the summer. I want to extent my
gratitude to Dr. Chia-Ming Chang and Weslee Walton for their guidance. I would also want to
thank my fellow NEES Reu students, Chloe Johansen and Amory Martin for their support.
P a g e | 17
7. References
Abrams, D.P.,( 2011), “NSF NEESR Research on Hybrid Masonry Seismic Structural Systems,”
Proceedings 11th North American Masonry Conference, Minneapolis, MN
Abrams, D. P., (2013) “NEES Research on Hybrid Masonry Structural Systems,” Proceedings 12th
Canadian Masonry Symposium, Vancouver, British Columbia
Aoki, James, (2012) “Hybrid Masonry Connector Plate and Headed Stud Small-Scale Wall
Testing,” M.S. Thesis, Civil Engineering Dept, University of Hawii, Manoa, Hawaii,
Gregor, T., Fahnestock, L.A., and Abrams, D.P., (2011) “Experimental evaluation of seismic
performance for hybrid masonry,” Proceedings of 11th North American masonry
Conference, Minneapolis, MN, USA, paper 2.01-6.
Gregor, T., Fahnestock, L.A., (2013) “Large-Scale Testing of Hybrid Masonry,” Proceedings of
12th Canadian Masonry Symposium, Vancouver, British Columbia
IMI Technology Brief 02.13.01 (2009), Hybrid Masonry Construction, International Masonry
Institute, Annapolis, MD
Mitsuyuki Steven, (2012) “Verification of Fuse Connector Performance for Hybrid Masonry
Seismic Structural Systems”, M.S. Thesis, Civil Engineering Dept, University of Hawii,
Manoa, Hawaii
Ozaki-Train, R., Robertson, N. Ian, (2011) “Hybrid Masonry Connector Development and
Design,” University of Hawaii, Manoa, Hawaii