thammasat review of economic and social … vol.2 issu… · · 2016-07-05thammasat review of...
TRANSCRIPT

Faculty of Economics, Thammasat University
THAMMASAT REVIEW OF
ECONOMIC AND SOCIAL POLICY
Invited Article:
Commentary Note on Thailand’s Current Inequality Situation
and its Prospects
Pasuk Phongpaichit
Practitioner's Perspectives:
Thailand’s Current Socio-Politco-Economy: Perspectives and
Prospects
Prasittidesh Vichitsorasatra
Property Tax in Thailand: An Assessment and Policy Implica-
tions
Duangmanee Laovakul
Market Expansion, Political Relationship and Geographical
Inequality in the Early Rattanakosin Siam: A Theoretical Per-
spective
Pornthep Benyaapikul
Income Elasticity for Medical Care Services: An Empirical
Study in Thailand
Kaewkwan Tangtipongkul
How can Promoting “Desirable” Elderly Employment Opportu-
nities Alleviate the Shortfalls of Thailand’s Ageing Society?
Euamporn Phijaisanit
Volume 2, Number 1, January - June 2016
ISSN 2465-390X (Print)
ISSN 2465-4167 (Online)

THAMMASAT REVIEW OF
ECONOMIC AND SOCIAL POLICY Volume 2, Number 1, January – June 2016
ISSN 2465-390X (Print)
ISSN 2465-4167 (Online)

Thammasat Review of Economic and Social Policy
Thammasat Review of Economic and Social Policy (TRESP) is a double-blind peer reviewed biannual international journal published in June and December. The journal is managed by the Research Committee under the supervision of the Academic Affairs Division of the Faculty of Economics, Thammasat University. Our editorial board and review panel comprise of academicians and practitioners across various areas of economic and social policies. The goal of the journal is to provide up-to-date practical and policy-oriented analysis and assessment of economic and social issues, with particular focus on Asia and the Pacific region. However, research findings from other parts of the world that are relevant to the theme of the journal may be considered. Aims & Scope
Our journal is dedicated to serve as a platform for debate and critical discussion pertaining to the current issues of public policy. The outcome of such research is expected to yield concrete policy implications. Some of the targeted issues include urban and regional socio-economic disparities, ageing society, healthcare, education and welfare policies, environmental and natural resources, local communities, labor migration, productivity, economic and political integration, political economy, macroeconomic instability, trade and investment, fiscal imbalances, decentralization, gender issues, behavioral economics and regulations; and law and economics. The journal makes its best effort to cater a wide range of audience, including policymakers, practitioners in the public and business sectors, researchers as well as graduate students. Articles should identify any particular issue concisely, address the problems of the research explicitly and supply sufficient empirical data or strong evidence and substantial argument to support the discussion of policy initiatives asserted by the author(s). Theoretical and applied papers are equally welcome provided their contributions are policy-relevant.

Advisory Board
Sakon Varanyuwatana, Thammasat University, Thailand Medhi Krongkaew, National Institute of Development Administration, Thailand Arayah Preechametta, Thammasat University, Thailand Duangmanee Laovakul, Thammasat University, Thailand Editor-in-Chief
Euamporn Phijaisanit, Thammasat University, Thailand Associate Editors
Pornthep Benyaapikul, Thammasat University, Thailand Phatta Kirdruang, Thammasat University, Thailand
Editorial Board Kirida Bhaophichitr, Thailand Development Research Institute, Thailand
Brahma Chellaney, Center for Policy Research, New Delhi, India
Aekapol Chongvilaivan, Asian Development Bank, Manila, Philippines
Ian Coxhead, University of Wisconsin-Madison, United States
Tran Van Hoa, Centre for Strategic Economic Studies, Victoria University, Australia
Emma Jackson, Bank of England, UK
Prajak Kongkirati, Faculty of Political Science, Thammasat University, Thailand
Somprawin Manprasert, Faculty of Economics, Chulalongkorn University, Thailand
Gareth D. Myles, Tax Administration Research Centre, University of Exeter, UK
Songtham Pinto, Bank of Thailand, Thailand
Pathomdanai Ponjan, Fiscal Policy Office, Ministry of Finance, Thailand
Nattapong Puttanapong, Faculty of Economics, Thammasat University, Thailand Sasatra Sudsawasd, National Institute of Development Administration, Thailand
Maria-Angeles Tobarra-Gomez, University of Castilla-La Mancha, Spain Soraphol Tulayasathien, Fiscal Policy Office, Ministry of Finance, Thailand
Editorial Assistants Darawan Raksuntikul Sorravich Kingsuwankul Panit Buranawijarn
Editorial and Managerial Contact
c/o Mrs. Darawan Raksuntikul Thammasat Review of Economic and Social Policy (TRESP) Faculty of Economics, Thammasat University 2 Prachan Road, Bangkok 10200, Thailand Tel. +66 2 696 5979 Fax. +66 2 696 5987 E-mail: [email protected]

Thammasat Review of Economic and Social Policy
Volume 2, Number 1, January – June 2016
Editorial Introduction 1
ARTICLES
Commentary Note on Thailand’s Current Inequality Situation and Its Prospects 4 Pasuk Phongpaichit
Thailand’s Current Socio-Politico-Economy: Perspectives and Prospects 18 Prasittidesh Vichitsorasatra
Property Tax in Thailand: An Assessment and Policy Implications 24 Duangmanee Laovakul
Market Expansion, Political Relationship and Geographical Inequality in the Early Rattanakosin Siam: A Theoretical Perspective 54 Pornthep Benyaapikul
Income Elasticity for Medical Care Services: An Empirical Study in Thailand 76 Kaewkwan Tangtipongkul
How can Promoting “Desirable” Elderly Employment Opportunities Alleviate the Shortfalls of Thailand’s Ageing Society? 124 Euamporn Phijaisanit

Thammasat Review of Economic and Social Policy Volume 2, Number 1, January - June 2016
1
Editorial Introduction
Following the success of our inaugural issue in December last year, this special issue focuses on the theme concerning inequality and welfare issues in Thailand. Particularly, the disparities, for instance, in income and wealth distribution, healthcare access, development and work opportunities that trouble our society are the problems that we have long made efforts to solve.
In this issue, our journal is very honoured to have Professor Pasuk Pongphaichit accepting our invitation to produce a very insightful article, “Commentary Note on Thailand’s Current Inequality Situation and Its Prospects”. The article explores the trends and reasons for the rise in multiple dimensions of inequality in Thailand. It also provides an outline of possible policies and discussion for future prospects, focusing on the key and obvious factors, namely; rights, representation, education, public goods and fair tax system.
In addition to the research articles, this issue also reflects some practitioner’s perspective via the article, “Thailand’s Current Socio-Politico-Economy: Perspectives and Prospects” by Prasittidesh Vichitsorasatra, former Consul-General to the Royal Thai Consulate-General in Kolkata, India. Southeast Asia has seen much change over the past few decades. The article describes how the shocks and aftershocks of the global turbulence have been amplified by a precarious and fragile political situation in Thailand. Ultimately, however, Thailand’s future and developmental outcomes will depend on the engagement and cooperation of the Thai people.
The first research article of this issue, “Property Tax in Thailand: an Assessment and Policy Implications,” by Duangmanee Laovakul portrays how inequality in all its dimensions remains a large issue in Thailand. This article

Thammasat Review of Economic and Social Policy Volume 2, Number 1, January - June 2016
2
focuses on tax policies, in particular taxes on property in Thailand, as a means to use fiscal policy to address inequality. Currently, property taxes remain very low, and many exemptions exist resulting in low tax revenues. Furthermore, poor enforcement and monitoring exacerbate collection issues. In the case of the local development tax, the tax base is assessed according to the value of land during the period 1978-1981 resulting in undervaluation. The article suggests that urgent reformation of these bills is required which is currently taking place.
The second article, “Market Expansion, Political Relationship and Geographical Inequality in the Early Rattanakorn Siam: a Theoretical Perspective” by Pornthep Benyaapikul displays the dominance of the social structure and geographical location in the economy during Rattanakosin Siam (1782-1855). Coercive relationship existed between the aristocrats (munnai) and the commoners (phrai). The elite class had power over commoners through forced employment and restricted movement of labor which consequently resulted in concentration of trading activities, income and wealth among the nobles. This study provides a game-theoretical perspective to explain a mechanism for which market economy proliferates through geographical locations and its implications on locational inequality. This can hint to the policy implications for the present-day situation.
The third article “Income Elasticity of Demand for Outpatient and Inpatient Services: an Empirical Study in Thailand,” by Kaewkwan Tangtipongkul investigates the potential household income effect on public and private healthcare choices for outpatient and inpatient services by combining data from the Health and Welfare Survey 2006 with information on hospitals and doctors in each province. It also seeks to provide information for policymakers to improve policy decisions. For example, the article suggests that the

Thammasat Review of Economic and Social Policy Volume 2, Number 1, January - June 2016
3
government can improve the level of service provided at district level hospitals in order to reduce the referral process and transportation costs incurred by Universal Coverage beneficiaries (which mainly consists of low income persons). Moreover, improving the prevention and promotional care program will also increase awareness of how to prevent common diseases in households.
The forth article, “How can Promoting “Desirable” Elderly Employment Opportunities Alleviate the Shortfalls of Thailand’s Ageing Society?” by Euamporn Phijaisanit examines the implications of Thailand’s ageing population on economic growth in the light of existing social structures and policy infrastructures. The article proposes policy options, which seeks to bring about a more desired ageing society through greater elderly labor participation, improved elderly welfare structures, and fiscally sustainable public finance.
Thammasat Review of Economic and Social Policy
(TRESP) is our newly constructed biannual double-blind peer reviewed international journal published in June and December. The Faculty of Economics, Thammasat University and the Editorial Team of TRESP seek to provide an effective platform for reflecting policy-oriented perspectives that links the academic and policymaking community. Having devoted to our ‘knowledge-for-all’ philosophy so as to drive our society forward, the Faculty decided that TRESP published under an open access model. For further information and updates on this journal, or to submit an article, please visit our website at www.tresp.econ.tu.ac.th.
Euamporn Phijaisanit Editor-in-Chief

Thammasat Review of Economic and Social Policy Volume 2, Number 1, January - June 2016
4
Invited Article
Commentary Note on Thailand’s Current
Inequality Situation and Its Prospects
Pasuk Phongpaichit
Professor Faculty of Economics
Chulalongkorn University Bangkok, Thailand

Thammasat Review of Economic and Social Policy Volume 2, Number 1, January - June 2016
5
I became interested in economic aspects of inequality because economic inequalities underlie inequality of power, social position, and access to resources of all kinds, including good education, a fair trial and a decent chance in life of individuals and their children.
In this commentary note I first give a sketch of the international debate on the impact of inequality on economic growth and democracy. I then outline the trends of inequality of income and wealth in Thailand and explain the reasons for the steep rise in inequalities. Next I briefly discuss findings about the impact of inequality on social division and political conflict. This is followed by an outline of policies and actions that can lead to a reduction of inequality in Thailand today. Last is a brief concluding remark on the future prospects.
1. The debate on the effect of inequality on economic
growth and democracy
There is no consensus on the impact of inequality on economic growth1, but mechanisms through which inequality
1 Traditionally many economists have held the view that inequality is good for growth because of a higher saving rate by the rich, sunk cost and investment indivisibilities, and higher incentives to work (Aghion et al., 1999). Alesina and Rodrik (1994) add that in countries with high inequality a majority votes in favor of redistributive policies, resulting in higher taxes and lower growth (see also, Person & Tabellini, 1994). In a context of credit constraint, however, redistribution may be good for growth because it helps entrepreneurs who lack resources to start up new businesses. Redistribution can also promote growth in the long term because it enables children of poor household to have education. A recent study finds a large and statistically significant association between income inequality and growth duration; a one percentage point higher Gini decreases the expected length of a growth spell by 11 to 15 percent (Berg & Ostry, 2011). Berg et al. (2008) also ranks

Thammasat Review of Economic and Social Policy Volume 2, Number 1, January - June 2016
6
may be harmful to growth have been identified: in particular, when inequality is coupled with credit market imperfections resulting in under-investment in human capital and credit restraints on entrepreneurs without collateral; and when large inequalities foster social and political instability as more people engage in crime and violent protests, which deter investment (Perotti, 1996). Acemoglu’s analysis of oligarchy postulates, on the basis of historical evidence, that extreme inequality in the command over resources is prejudicial to economic growth (Acemoglu, 2008).
In the US, a thorough study for the period 1979-2007 found that although inequality did not reduce the overall growth rate or contribute to economic crisis, there is strong evidence that it reduced the rate of growth of middle class income, increased disparities in education, health, family structure and happiness and heightened residential segregation (Epstein et al., 2003). In Thailand, economic inequalities lead to other forms of economic and social inequality, such as in access to tertiary education (Lathapipat, 2016), which is prejudicial for growth in the long term.
On the impact of inequality on democracy, there is also no consensus but an inclination to see the impact as negative. In his monumental work, Capital in the Twenty-First Century, Piketty finds a relationship between inequality and anti-democratic forces (Piketty, 2014:517). The new institutional economist, Acemoglu and his co-authors have produced a game theory analysis using two actors, rich elites and poor masses. They show how, as the masses press for democracy to gain from redistributive policies, the elites are likely to resist,
income distribution as the most influential and robust factor for growth sustainability followed by trade openness, political institutions, foreign direct investment, exchange rate competitiveness and external debt.

Thammasat Review of Economic and Social Policy Volume 2, Number 1, January - June 2016
7
especially where inequality is high, as they fear they will be forced to pay higher taxes to finance redistribution. Acemoglu et al. also show that the higher is the proportion of the rich elites that is dependent on land for their income, the stronger is the resistance to democracy because land is vulnerable to tax and difficult to conceal (Acemoglu & Robinson, 2006; Acemoglu et al., 2010).
The model has been criticized,2 but it fits contemporary Thailand rather well (Phongpaichit, 2016).
From the 1960s to the early 90s, Thailand achieved rather high economic growth rates. This period came to an end in the financial crisis of 1997. Over this period of rapid growth, inequality shifted from a relatively moderate level to a very high level, comparable to some Latin American countries. Proposals for land tax reforms have been stalled.
The power structure has become more ossified and the movement towards democratization in the 1980s and 90s, following the fall of the military regime in the early 70s, has not been consolidated. For the last decade a battle has been waged between those who want elected parliamentary democracy, and those who want a “managed democracy”, believing that it is necessary to curb the power and authority of corrupt elected politicians. The conflict has been played out in street protests by both sides, causing confusion and instability. Coups to topple the elected governments staged by the military junta of the same camp in 2006 and 2014, which were supported by non-democratic forces, have moved Thailand back to a military dominated political regime.
2 By those who disagree with their assumption about the rational self-interested motivations of actors in their model, and doubt if their hypothesis that distributional conflict is at the heart of political transition of all counties is always true. See American Political Science Association (2013).

Thammasat Review of Economic and Social Policy Volume 2, Number 1, January - June 2016
8
2. Inequality has come down but not fast enough
Inequality in income and wealth rose fast following the economic boom of the 1980s. Since the mid-1990s a declining trend is noticeable, but the level is still rather high and higher than other Asian neighbors.
The Gini Index on household income rose from 0.413 in the early 1960s to 0.536 in 1992. Over the boom era from 1981 to 1992, the top 10 percent of the population increased their share of total income by 8 percentage point from 34 to 42 percent. Inequality has tended to decline over the past two decades, but slowly and fitfully. By 2011, the Gini of household income was 0.484, which is still the highest in ASEAN (Phongpaichit & Baker, 2016: Introduction; Phongpaichit, 2016).
Kobsak Pootrakul has made a detailed study of the trends in inequality over the period from 1988 to 2011. He found that the income of the top 1 percent grew spectacularly fast, around 2.8 times the average rate. So while the trend towards better income distribution now seems well established, Kobsak Pootrakul has shown Thailand has a “1 percent problem,” just like the US and many advanced economies. He estimates that the top 1 percent group includes around 600,000 people in families headed by business people, property owners, professional and managers (Pootrakul, 2013).
On wealth inequality, recently available data on household assets, bank deposits and land ownership, have shown extreme inequality. Laovakul (2016) found a highly skewed distribution of titled land, with a Gini Index as high as 0.88.
There are many reasons behind the high inequality in Thailand in the 1990s. Among the most prominent are the development strategy that favored capital, coupled with repressive policies on labor organizations; the urban bias in development with investment being concentrated around

Thammasat Review of Economic and Social Policy Volume 2, Number 1, January - June 2016
9
Bangkok; the rise of prices, profits and salaries in the modern sector to assimilate to international levels; a boom in urban property prices that especially benefited prime land in certain areas; falling agricultural prices from the mid-1970s onwards; and a lack of political interest or will to combat growing inequality. As a result, Thailand does not have progressive property or wealth taxes, nor really progressive personal income tax, although the official rates may appear so.3 Because of the revenue constraint, overall expenditure on public goods has been low, with a distinct pro-rich and pro-urban bias, leading to great inequality in access to public services including education.
Combining these wealth data with other information on the trends in corporate wealth in the aftermath of the financial crisis of 1997, including the recent Forbes lists of wealthy families, two recent trends can be noted (Phongpaichit, 2016). The first is that wealth has become more concentrated at the high end of the business community. The second is the growing importance of non-wage income from profits, rents, and financial assets. These findings corroborate Pootrakul’s (2013) finding that income from rents and financial assets is very highly concentrated at the upper end of the income scale in the period from 1988 to 2011.
With the distribution of wealth, especially land and savings, being highly skewed, and with no tax policy to moderate this situation, a very few at the top earn much from rent, dividends, interests and other investment income while the majority have very limited assets or negative savings. From his study of many countries over the 18th and 19th centuries,
3 A preliminary look by the author’s research team on the effective personal income tax rates in Thailand for the period 2006-2009 found that the tax is regressive at the highest end of the income band because of a large number of exemptions and allowances which counteract the nominally progressive tax rates.

Thammasat Review of Economic and Social Policy Volume 2, Number 1, January - June 2016
10
Piketty (2014) shows that investment income always grows faster than GDP, and hence the trend towards inequality of wealth is self-sustaining.
An additional factor is the political system, in which power is concentrated in the hands of the few, and little attention is paid to social justice or redistributive policies.4
3. Inequality, social division and political conflicts
The effects of inequality on social cleavages and political conflict has become a prominent topic of debate around the world. A widening income gap among people in the same society can cause deterioration in the sense of community and a decline in mutual trust. Many societies have experienced a decay in social cohesion and a rise of protest and conflict. Stiglitz, the Nobel Laureate expresses this worry, “It’s easier to act together where most people are in similar situations”.
Researchers in the UK found that unequal societies have more crime, less trust, more anxiety, more mental and physical health problems, poorer education performance, more violence and less mobility (Wilkinson & Pickett, 2009)
A recent study on the US shows that growing income inequality results in increased political influence among the top wealthy, with potential harmful effects on policies concerning health, education expenditure, taxation, and climate change (Mayer, 2016).
4 Technocrats in the Ministry of Finance have proposed a reform of the existing regressive land development tax for some time, but have not succeeded. The first inheritance tax was approved in 2016, but the original proposal was so watered down that it is not effective as a measure to reduce wealth inequality, as originally intended. On the impact of rule by the few, Winters (2011) has argued that the wealthy in all societies strive to control or influence politics to protect or promote their wealth.

Thammasat Review of Economic and Social Policy Volume 2, Number 1, January - June 2016
11
In Thailand, researchers have drawn attention to the impact of inequality on crime, teen pregnancy, prostitution, insecurity in life, and access to education, as well as the political conflicts of the last decade.
Concern over the relationship between inequality and Thailand’s political conflict is shared across the political spectrum. The National Council for Peace and Order, the military junta which seized power from the elected government by a coup in 2014, made solving inequality one of its priorities. The prime minister and head of the NCPO, General Prayut Chan-ocha, said, “The disparity is a big challenge to the government. We have to create jobs and income for people and solve the corruption problem.”5 In his address to the UN in September 2015, he stated that “to reduce inequality” was among “the first priorities of my administration.”6 Borwornnsak Uwanno, the chairperson of the first Constitutional Drafting Committee in 2015 stated that “disparity in income, wealth distribution, and access to opportunities constitutes the underlying root cause of the social and economic ills of the Nation,” and claimed his draft was designed to cure this problem.7
5 “Prayut declares battle against inequality,” The Nation, 5 Oct 2014 6 “The Royal Thai Government attaches importance to creating equal opportunities and access to natural resources because we do not wish to leave anyone behind. We cannot allow the abuse of power for political gains at the expense of the majority, which led in the past to social discord and exploitation, injustice and corruption, still causing divisions in society.” http://www.mfa.go.th/main/en/media-center/14/60612-Statement-by-Prime-Minister-of-Thailand---Interact.html 7 Borwornsak Uwanno and Navin Damrigan, “Constitutional drafting in Thailand,” distributed by the authos at the presentation at the Foreign Correspondence Club of Thailand on April 8, 2015. Subsequently, Bavornsak’s draft constitution was rejected by the National Legislative Assembly under the junta. A new drafting committee headed by Meechai Ruchuphan was later appointed and a new draft, known as the Meechai Draft was unveiled in March 2016. The new draft has been promoted as an

Thammasat Review of Economic and Social Policy Volume 2, Number 1, January - June 2016
12
4. What policies and actions are needed?
There is a large debate on policies to mitigate inequality, with a large spectrum of different views. However, the basic policies needed, especially in a situation of rather extreme inequality such as Thailand today, are rather simple and obvious. The key factors are: rights, representation, education, and public goods.8
Ensuring equal access to quality education is one of the most important measures, not to mention the fair access to other quality public goods and services in general.
Most important of all, a country should have a political system that adequately guarantees rights and representation to enable citizens to defend their rights, their property, and their opportunities against injustice, unfairness and exploitation.
In Thailand, apart from the universal health care scheme, public goods and services are highly unevenly distributed and the rich and powerful have greater access to them, including good quality public education. The only way to improve fairness in access to public goods and services is to increase the quantity and improve the quality. This will require not only better management of existing government spending, but also an increase of tax revenues. The demand for public goods and services, required both for economic growth and for social provision, has far outstripped the rate of increase in
anti-corruption constitution, but critics called it undemocratic, as it does not give adequate guarantee of rights and representation, and it contains provisions which perpetuate the junta’s control over elected government. Educationists pointed out that it reduces the years of free education for Thai citizens, among other weaknesses. 8 Others include macro policies to support full employment, finance regulations that ensure directing investment to productive activities, well-designed institutions that govern work contracts, other public and social policies that support the working and non-working population in the same way (Berg, 2015).

Thammasat Review of Economic and Social Policy Volume 2, Number 1, January - June 2016
13
government revenue from taxation, which lags behind the rate of growth in GDP (Cripps, 2016).
Therefore, a reform in the taxation system is imperative, both to increase the flow of revenue, and to increase the fairness within the tax system itself. Given the very skewed distribution of land and other assets, wealth taxes should be part of the tax reform agenda.
5. A concluding remark
“Reform” has been the clarion call of the military government and its supporters. How have the reforms completed or promised so far including the current draft constitution (Meechai version), contributed to its declared aim of reducing inequality?
Popular representation has been cut back, and the constitution aims to continue that trend. The discourse of rights has been discouraged, community rights has been undercut significantly by cancelling planning regulations and provisions for environmental protection. The draft constitution reduces the provision of free education by two years. Both corporate and income tax rates have been reduced, and new provisions for wealth tax will not provide significant revenues.
There seems little chance that inequality will be further reduced under this policy regime.
Acemoglu and Robinson have argued in Why Nations Fail that only countries with inclusive political and economic institutions can blossom to modern prosperity (Acemoglu & Robinson, 2012). Political elites that refuse to cede power to inclusive institutions are in fact working against their own interests in the long term.

Thammasat Review of Economic and Social Policy Volume 2, Number 1, January - June 2016
14
References
Acemoglu, D. (2008). Oligarchic versus democratic societies. Journal of the European Economic
Association, 6(1), 1-44.
Acemoglu, D., & Robinson, J. A. (2006). Economic origins of
dictatorship and democracy. Cambridge University Press.
Acemoglu, D., Ticchi, D., & Vindigni, A. (2008). A theory of
military dictatorships (No. w13915). National Bureau of Economic Research, 1-42.
Acemoglu, D., & Robinson, J. (2012). Why nations fail: the
origins of power, prosperity, and poverty. Crown Business.
Aghion, P., Caroli, E., & Garcia-Penalosa, C. (1999). Inequality and economic growth: the perspective of the new growth theories. Journal of Economic
literature, 37(4), 1615-1660.
Alesina, A., & Rodrik, D. (1994). Distributive politics and
economic growth (No. w3668). Quarterly Journal of
Economics, 109, 465-490.
American Political Science Association (2013). Inequality and
Democratization: What Do We Know?. Comparative
Democratization 11 (3), 1-42.
Berg, A., Ostry, J. D., & Zettelmeyer, J. (2008). What makes growth sustained?. (No. 08/59). International Monetary Fund
Berg, J. (Ed.). (2015). Labour Markets, Institutions and
Inequality: Building Just Societies in the 21st Century. Geneva:International Labour Office.

Thammasat Review of Economic and Social Policy Volume 2, Number 1, January - June 2016
15
Cripps, Francis. (2016). “A National Accounting Perspective on Thai Government Income and Expenditure, 1990-2013. A note prepared for the project “Guidelines for Reform of the Personal Income Tax (PIT) for Effective Implementation and Analysis of Income Distribution at the Upper End of the Income Scale in Thailand”, a research funded by the Thailand Research Fund, 2016-2017.
Epstein D, L., Robert B., Jack G., Ida K., and Sharyn O’ H. (2003). Democratic Transition, Draft of April 2, 2003, from http://politics.as.nyu.edu/docs/IO/4753/epstein.pdf
Lathapipat, D. (2016). Inequality in Education and Wages, In Unequal Thailand: Aspects of Income, Wealth, and
Power [edited by Pasuk Phongpaichit and Chris Baker], 32–42. Singapore: NUS Press
Laovakul, D. (2016). Concentration of Land and Other Wealth
in Thailand [Edited by Pasuk Phongpaichit and Chris Baker], Unequal Thailand: Aspects of Income, Wealth,
and Power, 32–42. Singapore: NUS Press.
Li, H., & Zou, H. F. (1998). Income inequality is not harmful for growth: theory and evidence. Review of development
economics, 2(3), 318-334.
Ostry, J. D., & Berg, A. (2011). Inequality and unsustainable
growth: two sides of the same coin? (No. 11/08). International Monetary Fund.
Mayer, J. (2016). Dark Money: The Hidden History of the
Billionaires Behind the Rise of the Radical Right. New York: Doubleday.
Phongpaichit, P. & Baker, C. eds. (2016). Unequal Thailand:
Aspects of Income, Wealth and Power, Singapore: NUS Press.

Thammasat Review of Economic and Social Policy Volume 2, Number 1, January - June 2016
16
Phongpaichit, P. (2016). Inequality, Wealth and Thailand’s Politics, Journal of Contemporary Asia, Special Issue, 2016. On line available, February 2016. Hard copy end of 2016.
Perotti, R. (1996). Growth, income distribution, and democracy: what the data say. Journal of Economic
growth, 1(2), 149-187.
Persson, T., & Tabellini, G. (1994). Is inequality harmful for growth?. The American Economic Review, 600-621.
Piketty, T. (2014). Capital in the twenty-first century. Harvard University Press.
Pootrakul, K. (2013). Khunaphap kan charoen toepto jak miti
khong kan krajai raidai panha lae thang ook, [The quality of growth from the perspective of income distribution: problems and solutions]. Paper presented at the Bank of Thailand annual seminar, 19 September.
Wilkinson, R., Pickett, K., & Cato, M. S. (2009). The spirit level. Why more equal societies almost always do better. Allen Lane and Democracy.
Winters, J. A. (2011). Oligarchy. Cambridge University

Thammasat Review of Economic and Social Policy Volume 2, Number 1, January - June 2016
17

Thammasat Review of Economic and Social Policy Volume 2, Number 1, January - June 2016
18
Practitioner’s Perspectives
Thailand’s Current Socio-Politico-Economy:
Perspectives and Prospects*
Prasittidesh Vichitsorasatra
Freelance Columnist and Former Consul-General (2011-2014)
Royal Thai Consulate-General Kolkata, India
* Contents of the article are the full responsibility of the author and do not necessarily reflect views of the author’s affiliations.

Thammasat Review of Economic and Social Policy Volume 2, Number 1, January - June 2016
19
For almost two years, Thailand has become a country characterized by a relatively modest democratic system amidst the rapid political and economic development in the Indo-Chinese peninsula; Myanmar, Cambodia, Laos, and Vietnam. Additionally, the island nations in the Southeast Asian region, namely, Indonesia, the Philippines, East Timor and Brunei, far from the core interest of Thai businesses, have gradually continued to develop. Meanwhile, countries with economic stability and credibility, including Singapore, Malaysia, and Thailand, have been consistently affected by both internal and external influences such as deflation and continuously decreasing agricultural products price. Exports have also deteriorated. The value of the local currency decreased by over ten percent while the value of gold increased to a close proportion or more.
Southeast Asia region consists of variation of religions, beliefs and governing systems. Although there have been long attempts to integrate the economy, politics, and security of the region for more than half a century, the intentions were partially succeeded due to the multi-dimensional differences. Besides, the similarity of the economic background of this region, which emphasizes on producing and exporting labor-intensive agricultural products, resulted in a competition that lowers the integrative potential of the countries. Most countries in the region depend heavily on foreign influences for the development of high technology, while their research and development (R&D) expenditure remains relatively low compared to those of the developed nations. The outcomes of the development of material products in the world, including modern transportation systems, such as high speed trains, underground trains, super highways; the mass production of automobiles and the rapid development of other technologies; mobile phones, computers, do not yield much long-term self-capacity-improvement benefits to local residents.

Thammasat Review of Economic and Social Policy Volume 2, Number 1, January - June 2016
20
Multinational companies accessed the full benefits from the sales of products and services, while the local residents in most countries receive labor wages, salaries and humble affordability to live their daily lives and to pay for their rents and household utilities each month.
The by-products of the “Tom Yum Kung” financial crisis in 1997 and the recent global financial crisis in 2009 have a role in influencing the perspectives of the middle class and elites in Thailand. The rise in conservative anti-government and anti-capitalism movements reflects the belief that the capitalism is the culprit of the political monopolization and/or the vice versa. This resulted in a nation-wide confrontation among the different groups, which continued to reoccur at least over past ten years since before the coup d’etat of 2006 until the present time. Since 2005 when the Thai Rak Thai political party won the general elections, with the large majority of supporting votes in the parliament, there has been an increasing fear that the country will be led to destruction. There were major coups in 2006 and 2014, bringing back Thailand to the basics of the traditional ways of governing and managing the country. This can be observed from the drafting of the new constitution, which reflects the preservation of the conservative administration for at least five or six years until 2021.
How Thailand’s socio-politico economic climate will turn out in the future depends much on a few remaining factors, namely the maintenance and the exercise of the strength and authority of the current leaders, the economic and business sentiment of the country and its ability to adapt to the “New Normal” settings; and last but not least, the tolerance of the general public. In simplicity, the survival of the Thai people, similar to all human beings in the world, is subject to the four basic needs: food, pills and medical facilities, clothing and shelter. The rising costs of these factors, while the general

Thammasat Review of Economic and Social Policy Volume 2, Number 1, January - June 2016
21
income of the majority of the population does not catch up with the rising costs, inevitably causes hardship in everyday living. To put it simply in layman’s observation, houses lower than five million Baht is harder to find in Bangkok these days; even a small townhouse costs two to four million Baht. Small sized studios of twenty to thirty square meters in the outskirts of Bangkok cost over 1 million Baht. The price of food, beverages, and medicine has doubled within the past ten years, in spite to the officially announced low inflation rate.
To this end, there are at least two key factors that determine the success and survival of the current administration. The first factor is the ability to reform the political system. Certainly, most of the Thais have not read the constitution. They also have no knowledge of the complicated legal system that seems irrelevant to their lives. Their more urgent concern is about daily living, wishing and praying to have a better life with enough food to eat, being able to send their children for good education, being able to take care of themselves and family in times of illness. All in all, they dream of a more dignified life in the future, whether being realistic or not. Reformers must take into account these basic factors into their constitutional drafting, and minimize all the other factors that are irrelevant to the beneficial causes of the people and the country.
The second factor is the speeding of the development of the nation’s infrastructure. Thailand must accelerate its communication and transportation infrastructure projects. In fact, Thailand has initiated these types of projects several times before, such as the deep-sea port in Chabang district, petrochemical factories, oil refineries, or the mass transit system, and Suvarnabhumi airport. Thailand has large foreign currency reserve, a strong monetary system, and skilled labor force with the potential to develop further. Financial and economic advisors can provide appropriate guidance and

Thammasat Review of Economic and Social Policy Volume 2, Number 1, January - June 2016
22
recommendations to the administration so that they can command the rapid acceleration of these development projects, which on the whole, will benefit the Thai population. Given the existing situation, the current administration should utilize this opportunity to hasten the progress of these infrastructure projects as in the reigning period of General Prem Tinsulanond three decades ago.
If we consider Thailand as a state under the current type of administration and situation, the country is not without an experience. Thailand had undergone this similar situation for about 84 years, almost a century, after moving from absolute to constitutional monarchy. We already have had 19 constitutions and dozens of coup d’états. Nevertheless, Thailand has been able to develop considerably in the Southeast Asia region. The success of Thailand’s progress and development owes to the visionary leaders, strong and tolerant citizens, and assistance from ally countries. Whatever the governing system is, with less self-interested administration, if the citizens were able to unite in solidarity, Thailand will be able to steadily and sustainably progress in the future. It all depends on the Thai people to choose their path.

Thammasat Review of Economic and Social Policy Volume 2, Number 1, January - June 2016
23

Thammasat Review of Economic and Social Policy Volume 2, Number 1, January - June 2016
24
Property Tax in Thailand: An Assessment and
Policy Implications∗
Duangmanee Laovakul
Assistant Professor Faculty of Economics
Thammasat University Bangkok, Thailand
∗ Some findings of this article were publicly released in the presentation (and subsequent work) titled “Land and Inheritance taxes: Who own, who pay and who get benefit?” given by the author during the Thammasat Economic Focus No.2 held at the Faculty of Economics, Thammasat University, Bangkok, on December 1, 2014.

Thammasat Review of Economic and Social Policy Volume 2, Number 1, January - June 2016
25
ABSTRACT
This paper explores the ways in which the proposed new Land and Building Tax bill could be used to increase local government revenue and reduce wealth inequality in Thailand while rationalizing the current system of land taxes. After comparing the current system to the new proposed system, it finds that the new bill would be fairer, as it would be a more reasonable tax rate, and more broadly (and fairly) collected, and would do so based on current land values, not the values calculated in 1981. Additionally, by having the tax collected and used at a local level, it would promote fiscal decentralization and local governmental accountability.
Keywords: Land and Building Tax, inequality, fiscal decentralization, local government JEL Classification: H20, H41, H70

Thammasat Review of Economic and Social Policy Volume 2, Number 1, January - June 2016
26
1. Introduction
Even though Thailand’s economy and society have been developing for many decades, Thailand still faces inequality problems, including economic, societal and political inequalities. Fiscal policy is one of the tools for alleviating such inequality. The government can implement fiscal policies using both tax and expenditure policies. This article focuses on tax policies in the context of property taxes (i.e. Land and building taxes).
Normally, there are 3 types of tax bases; income base, consumption base and property base. Generally, both developed and developing countries impose a mix of taxes on these 3 tax bases. In the case of Thailand, the government primarily imposes taxes mainly on the income base (such as personal income tax and corporate income tax ( and consumption base (such as value added tax and excise tax). We do not really cover our property base. Currently, the only significant property taxes are the Inheritance tax (which was recently introduced in February 2016), the Local development tax and the Building and land taxes which have a lot of problems and tax loopholes.
The Local development tax and the Building and land tax are revenues which are collected by the local governments as their own source of revenue. The share of locally levied taxes is very low (around 10% of all local government revenue) since 1999 (see Figure 1). The Local development tax and the Building and land tax do not significantly contribute to local government revenue. This has strong implications for inequality measures, as the study of land distribution in Thailand shows that Thailand’s distribution of land holdings is highly concentrated (Laovakul, 2013).

Thammasat Review of Economic and Social Policy Volume 2, Number 1, January - June 2016
27
Fig
ure
1:
Str
uct
ure
of
Loca
l G
over
nm
ent
Rev
enu
e: 1
999-2
016
S
ourc
e: O
ffic
e o
f th
e D
ecen
tral
izat
ion t
o t
he
Lo
cal
Go
ver
nm
ent
Org
aniz
atio
n C
om
mit
tee

Thammasat Review of Economic and Social Policy Volume 2, Number 1, January - June 2016
28
Property taxes can be one of the important instruments to alleviate the inequality in the society, as well as being a good source of local revenue. Thus, any reforms in Thailand’s tax system should include reforms to property tax. This article emphasizes on a proposal of Land and building tax bill which will be able to increase local government tax revenue and can be an instrument to reduce the inequality in Thailand.
2. Theories of property taxes
In constructing a theory of property taxes, it is important to distinguish between residential property taxes, which economists generally consider to be a useful form of taxation for certain purposes, and non-residential (commercial) property taxes, which are more complex. In both cases, the advantages and disadvantages of each tax are dependent on several factors, such as income levels and inequality levels, the uses of the tax, the existence of competing jurisdictions that respond to taxpayers by tailoring spending and tax levels to local residents, who are free to move to other areas with a differing mix 1 . Put simply, while a properly designed and administered property tax can bring in revenue at low administrative cost with minimal evasion, the context matters.
A residential property tax has several advantages over other taxes. The primary benefit is that the level of this tax can be easily linked to the quantity and quality of the public goods and services being provided by the local government. So taxes paid on the residential property to fund something local, such as a school, are clearly connected to the service being provided. If the local school operates well, property values go up – which benefit the property owners far more than the 1-5% increase in their taxes. And they get a better school, with
1 See details in Slack (2010), 1-4.

Thammasat Review of Economic and Social Policy Volume 2, Number 1, January - June 2016
29
the obvious benefits that entail. Conversely, if taxes go up and schools deteriorate in quality, local voters know whom to blame. Finally, residential property taxes are very hard to avoid, as long as the assessed value of the property is defined consistently across the district, it is clear and fair, and it is extremely difficult for people to hide their land or houses. Thus, they are administratively easy to implement.
For these benefits to happen, three conditions must be met. Firstly, the property tax must be assessed at a local level, and the money must be administered and spent at the local level. Secondly, the local governments must be responsive to their local citizens. Higher taxes will only be tolerated to the extent that they are linked to better services. This, of course, implies that the local government must not only have the responsibility to provide the goods, but it must also have the power to do so. Finally, it is important that each local government be given the discretion not just to administer the programs, but also to do so in different ways. Therefore, different localities can offer different packages of goods to citizens, at different overall price levels, and the citizens in turn can either collectively reject the deals through voting when they do not like the package, or they can individually reject (or approve) of the deal by moving out of (or into) those localities that they feel strongly about.
Even if all of the above are true, there are still some unavoidable costs associated with a personal property tax. One is that the tax incidence may be such that much of the costs are pushed onto others. A second consideration is that local residents may not be very sensitive to property taxes and service benefits, and thus will tolerate bad outcomes for long periods of time. A third issue is that local property taxes are highly visible. They are typically collected once a year, and there is no withholding on them, you cannot hide them from the voters. Finally, no matter how small a property tax is, at

Thammasat Review of Economic and Social Policy Volume 2, Number 1, January - June 2016
30
the margin it will distort the housing market in such a way that smaller houses, fewer land improvements, and lesser value-enhancing renovation will occur.
While the above considerations suggest some difficulties with residential property taxes, when they are properly administered they are still, on balance, the best option and seem to offer real advantages over other taxes that could be levied. Local government, funded by local taxes will be much more accountable to local taxpayers than would be the case if they paid a higher national valued added tax (VAT), which went to the central government, which then got distributed back to the locality which is now accountable to the central government, as opposed to the local voters. Local services are much clearer to local communities than what is going on far away, and a reliance on a very visible tax serves as a natural check on politicians. Higher taxes can be collected if and only if the local government can show they are delivering services worth the money. And taxpayers will recoup at least some of the taxes, if their property values go up. All taxes create distortions, administrative and political costs, and opportunities for mismanagement and corruption, but local property taxes strongly coupled to independent local governments seem to be a good way to minimize these problems while still delivering effective local services.
A tax on non-residential property, (hereafter referred to as a ‘commercial property tax’), while superficially similar to a residential property tax, is much less clear cut of an effective system, for several reasons. Businesses are usually more mobile than residents, and thus are more sensitive to taxes than consumers. Therefore, we would expect them to quickly move as the taxes go up, unless they can simply pass the tax on to the consumer. Hence, business taxes are much more likely to either not be paid, or to be paid indirectly by residents in their role as local consumers. Secondly, commercial property

Thammasat Review of Economic and Social Policy Volume 2, Number 1, January - June 2016
31
generally consumes less public goods than local residents do, especially in developed countries where they often provide their own garbage services, security, and sewage, and they do not consume welfare services, healthcare or schooling. As such, the link between who pays for the services and who benefits from them is not clear cut.
This problem is magnified by the fact that there are almost always fewer commercial enterprises in a given locality than residential properties, so the commercial properties may be under-represented in the political process. It will always be tempting for local politicians to try and tax the local commercial properties to pay for public services. If the tax can be shifted to local consumers or out of district holders of the capital or consumers of the good, then local goods are being paid for by non-local people, or indirectly by locals who do not know they are paying it. If the tax burden cannot be paid, the business leaves, and taxes are not paid2. In other words, the tight link between who pays tax, and who benefits from the goods it produces is much less tight when talking about commercial property taxes than when talking about residential property taxes.
This is not to say that commercial property taxes cannot be or should not be assessed. But the economic argument for doing so is somewhat weaker, especially when one adds in that local businesses generally consume less of the public services that the local government provides.
3. Current Property Taxes in Thailand
Besides the recently implemented inheritance tax, the current property taxes in Thailand are the Building and land
2 Valuable public goods (such as parking services in the mall or private security) provided by the commercial enterprise are also discontinued.

Thammasat Review of Economic and Social Policy Volume 2, Number 1, January - June 2016
32
tax and the Local development tax. These 2 types of taxes have a lot of tax loopholes and cannot create revenue for the local governments as they should.
Currently, the Local development tax is collected based on assessed values of the land that is far below the actual market value of the land and with many exemptions. Thus, the cost of holding land and buildings, even if they are being used unproductively or not used at all, is very low. This leads to inefficient land and building usage, a lot of vacant land and high concentration of land holding (see details in section 4).
The draft of the Land and building tax bill is an important bill which will create a real property tax bill in Thailand. This new tax will benefit citizens, the state as well as the local governments.
3.1 The Main Contents of the Building and Land Tax Bill and
the Local Development Tax Bill
The Building and land tax bill was issued in 1932, which levies a tax on buildings or construction and the land adjacent to those buildings or construction. The Local development tax bill was issued in 1965, which levies taxes on land owned by the individuals or groups who have possessory right over state land. The main contents of the Building and land tax bill and the Local development tax bill are shown in Table 1.
Table 1 The Main Contents of the Building and Land Tax
Bill and
the Local Development Tax Bill Building and land
tax
Local development
tax
1. Property • Building used for rental, commercial and industrial purposes.
• Land for agricultural and residential purposes.

Thammasat Review of Economic and Social Policy Volume 2, Number 1, January - June 2016
33
2. Tax base • Rental value of buildings and land including the value of machine.
• The assessed value of land during 1978 – 1981
3. Tax rate • 12.5% of the rental value
• Progressive tax rate for lower assessed value of land and then regressive for high assessed value of land.
4. Exemption /Deduction
• Exemption for residential buildings resided by owners and vacant buildings.
• Tax deduction based on land area (50 square wahs – 5 rais) which are determined by each jurisdiction.
• Land used for Herbaceous plants grown by owner: 5 baht per rai.
• Land used for herbaceous plants grown by renter: half rate
Source: Fiscal Policy Office
3.2 Problems and Tax Loopholes of the Building and Land Tax
and the Local Development Tax
Problems and tax loopholes of the Building and land tax are as follows3 (see Table 2).
3 Laovakul (2012); Summary and Analysis of Draft Land and
Building Tax Bill, 5.

Thammasat Review of Economic and Social Policy Volume 2, Number 1, January - June 2016
34
1. The tax base is the annual rental value and this rental income is also counted in personal income tax base. Thus, Building and land tax will duplicate the personal income tax. In other words, citizens have to pay double taxes. In general, the property tax base should be the assessment or the market value of land and buildings.
2. The local governments receive a tiny amount of the Building and land tax revenue due to the following reasons.
• The tax exemption on land and buildings which the owners use as their own residence. This leads to a narrow tax base and also creates difficulties in trying to separate between the usage of land and buildings for residential purpose or commercial purpose (i.e. for rent).
• There is no standard “annual rental value” for tax base. Thus, the tax base depends on the reported rental value from the owners. In the case of using their own buildings for commercial purposes, there is no market rental value to calculate taxes. The tax base is then judged based on the discretion of the officers with opportunities for corruption that entails.
• The government does not have the monitoring and enforcement measures it needs to scrutinize the real tax payers. Moreover, the fees and penalty assessed for tax evasion are also low, and do not serve as a meaningful deterrent.
3. There is a cost to prove that the buildings are really vacant as reported or not.
4. The tax rate of the Building and land tax is high (12.5%) which creates high tax burden on entrepreneurs. This will be an incentive for tax evasion.

Thammasat Review of Economic and Social Policy Volume 2, Number 1, January - June 2016
35
Problems and tax loopholes of the Local development tax are as follows4 (see Table 2).
1. Residential buildings are exempted from Local
development tax which benefits the wealthier who own big piece of land and houses.
2. The current tax base is the assessed value of land during 1978 – 1981 which is very obsolete and has never been updated since then. The land is undervalued, and local governments will get less tax revenue. With low tax cost, rich people tend to buy more land for speculation.
3. The tax base is narrow because of varieties of tax exemptions and deductions as mentioned in Table 1.
4. Local development tax has a regressive tax structure. The tax burden falls disproportionally on lower value of land. Moreover, the tax rate is low when compared to that of aboard.
Table 2 Tax Loopholes and Problems of the Building and
land tax and the Local development tax Building and land tax Local development tax
1. Tax base • The duplication between the Building and land tax and personal income tax which both imposed on the same tax base.
• Corruption is easy to happen because the annual rental value depends on the officers’ discretion.
• For industrial purpose, the value of the machine on that
• Tax base covers only value of land not building.
• The assessed value of land is from the year 1978 – 1981 and has not been updated since then. The local governments get less tax revenue because the assessed value of land is less than its actual value. People have an incentive to
4 ibid., 6.

Thammasat Review of Economic and Social Policy Volume 2, Number 1, January - June 2016
36
piece of land is also included in the tax base.
buy land for speculation because of the low cost of land holding.
2. Tax rate • The entrepreneurs have an incentive to evade taxes because of the high tax rate.
• The regressive tax rate When the assessed
value of land is less than 30,000 baht per rai, the average tax rate is 0.5%.
When the assessed value of land is more than 30,000 baht per rai, the tax rate is 0.25%.
• The tax rate is very low compared to that in foreign countries.
3. Tax exemption and tax deduction
• No tax on residential land and buildings which the owners reside in. Thus, the tax base is narrow. This exemption is a loophole for tax avoidance.
• There is cost of determining which land and buildings are really vacant and subject to tax exemption.
• Tax base is narrow because of tax exemptions and deductions and varies across locality.
Source: Fiscal Policy Office

Thammasat Review of Economic and Social Policy Volume 2, Number 1, January - June 2016
37
4. Land Holding Concentration in Thailand
The total area of Thailand is 320.70 million rai (51.2 million hectare) 5 which composes of 130.74 6 million rai (40.88%) under the Department of lands, 34.76 million rai (10.87%) under Agricultural land reform office, 144.51 million rai (45.19%) as natural forest reserve, and 9.78 million rai (3.06%) as state lands (see Table 3).
The regular land title, known as ‘chanot’ (meaning titled
land) covers 95 million rai (14.4 million hectare). Based on Laovakul (2013), there were 15,900,047 people who own titled land in 2012. The average owner holds 5 rais 3 ngans and 87 square wahs of land. There are 15,687,551 individuals )98.7%) who own land under personal ownership. The average individual owner holds 5 rais 2 ngans and 76 square wahs. There are 212,496 juristic persons (1.3%) own land under corporate ownership. The average corporate owner holds 26 rais 1 ngan and 85 square wahs. Land holding concentration in Thai society is very high. The Gini coefficients are 0.886, 0.881 and 0.953 for overall land holding, individual personal land holding and juristic personal land holding respectively (see Table 4)7. The largest area which is held by an individual land owner is 631,263 rais.
5 1 rai = 0.16 hectare, 1 ngan = 0.04 hectare and 1 square wah = 0.0004 hectare 6 Regular land titles and temporary or special titles. 7 The calculation does not include people who do not own any land.

Thammasat Review of Economic and Social Policy Volume 2, Number 1, January - June 2016
38
Thammasat Review of Economic and Social Policy Volume 2, Number 1, January - June 2016
39
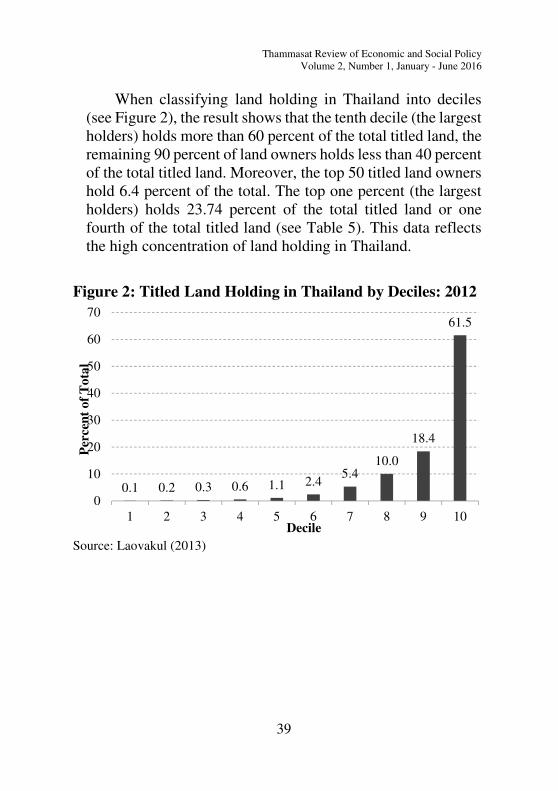
When classifying land holding in Thailand into deciles (see Figure 2), the result shows that the tenth decile (the largest holders) holds more than 60 percent of the total titled land, the remaining 90 percent of land owners holds less than 40 percent of the total titled land. Moreover, the top 50 titled land owners hold 6.4 percent of the total. The top one percent (the largest holders) holds 23.74 percent of the total titled land or one fourth of the total titled land (see Table 5). This data reflects the high concentration of land holding in Thailand.
Figure 2: Titled Land Holding in Thailand by Deciles: 2012
Source: Laovakul (2013)
0.1 0.2 0.3 0.6 1.1 2.45.4
10.0
18.4
61.5
0
10
20
30
40
50
60
70
1 2 3 4 5 6 7 8 9 10
Per
cen
t o
f T
ota
l
Decile

Thammasat Review of Economic and Social Policy Volume 2, Number 1, January - June 2016
40
Table 5 Top One Percent Titled Land Holding in
Thailand: 2012
Number of Land
Owners Area
Rai Ngan
Square Wah
Top 1% 159,007 22,522,047 3 53
Percent 1 23.74
Total 15,900,047 94,868,613 2 39 Source: Laovakul )2014(
Around 50 percent of titled land owners (7,979,128 owners) hold no more than 1 rai. Moreover, 72.08 percent of titled land owners (1,461,334 owners( hold no more than 5 rais, which means most people in Thailand, who own land, hold 5 or lesser rai of land.
5. The Main Contents of the Draft Land and Building Tax
Bill
The Building and land tax bill and the Local development tax bill will be terminated after implementing the Land and building tax bill. The Land and building tax should benefit taxpayers who will get benefits from the public services which are provided by local governments (benefit principle).
The justification of the new Land and building tax bill are as follows:
1. It is a fair tax with a reasonable rate. Local governments
can use this tax revenue to locally develop their jurisdictions.
2. It should enhance effective land usage.

Thammasat Review of Economic and Social Policy Volume 2, Number 1, January - June 2016
41
3. The local government should have enough revenue to provide good quality public services.
4. It links local revenue to local expenditures, which will create accountability with the local administrators.
The main contents of the draft Land and building tax bill
can be summarized as follows8: 1. Tax payers are the owners of land and building and people
who have possessory right over state land and building. 2. The local governments are the tax collectors and tax
revenue belongs to the local governments. 3. The tax base is the assessed value of land, buildings and
apartments. 4. There are 3 ceiling tax rates categorized by land and
building usage (agricultural purposes, residential purposes and other purposes such as for commercial endeavors). Agricultural land gets the lowest rate while the other purposes are taxed at a higher rate. The examples of the proposed ceiling tax rates are shown in Table 6.
5. The vacant or underutilized land will be taxed at a higher rate and the rate will be increased according to the number of years the land is not utilized.
The examples of the proposed ceiling tax rates shown in Table 6.
8 The main contents from draft Land and building tax bill was passed the office of the council of state, No. 194/2554 and the revised versions after that. The main contents in different versions of the bill are the same but there are some changes in details. Since it is still a draft bill, we can see the new revised version after one another.

Thammasat Review of Economic and Social Policy Volume 2, Number 1, January - June 2016
42
Table 6 Examples of the Proposed Ceiling Tax Rates
Agricultural
Purpose
Residential
Purpose
Other
Purposes
Vacant
Land
0.05 0.1 0.5 2
1 0.1 2 2
0.5 1 4 4
0.25 0.5 2 2
0.2 0.5 2 5 Source: Draft Land and building tax bill (2011), Matichon Online (2012), Leenothai (2014), Bangkokbiznews (2015) and the Ministry of Finance (2016).
6. Home owners and farmers may get tax deductions or
exemptions. Examples of the proposals for tax burden relief on home owners and farmers are as follows.
• Allowing tax exemption for home owners by area such as those whose land is not more than 50 square wahs or those apartment owners with an area less than 50 square meters are exempted from the tax.
• Home owners get tax exemption by the value of land and buildings as follows:
1. The owners of the property with less than some certain amount such as 3 million baht do not have to pay tax.
2. If the property value is less than 2 million baht, the owners pay 25% of their tax burden. If the property value is between 2 – 4 million baht, the owners pay 50% of their tax burden. If the property value is

Thammasat Review of Economic and Social Policy Volume 2, Number 1, January - June 2016
43
more than 4 million baht, there is no tax deduction9.
3. 50% tax deduction from its tax base (maximum 1 million baht).
• The tax base of agricultural and residential purposes in the first 3 years counts only the land value (excluding building value).
• For agricultural purpose, if the land value is less than 1.5 million baht, the owners will be exempted from tax.
• Allow tax exemption for property used for agricultural and residential purposes (applicable only to owner-occupied residences) with a value of less than 50 million baht.
7. The local governments have the authority to increase their tax rates up to the ceiling rates and will be able to reduce the amount of tax exemptions and tax deductions lower than the criteria which are stated in the bill10.
8. From the most recent draft Land and building tax bill which the cabinet approved on June 7, 2016, the actual tax rates for each categories are shown in Table 7.
9 Retrieved from http://www.bangkokbiznews.com/news/detail/660180. 10 In order to do so, that means the local governments need to get the approval of the citizens in their jurisdictions.

Thammasat Review of Economic and Social Policy Volume 2, Number 1, January - June 2016
44

Thammasat Review of Economic and Social Policy Volume 2, Number 1, January - June 2016
45
Table 8 The Main Contents of the Draft Land and
Building Tax Bill
Tax Payer • The owners of land and buildings. • The citizens with possessory right over
state owned land and buildings.
Tax Base • The value of property (land, buildings and apartments) calculated from the assessed value of land, buildings and apartments.
• For industrial purpose, exclude the value of the machines in the tax base.
Ceiling Tax
Rate
Agricultural purpose < Residential purpose < Other purposes
Vacant Land
or
Underutilized
Land
The tax rate is higher than other categories and will be increased according to the number of years for which land is not utilized.
The Actual
Tax Rate Determined by a committee and revised every 4 years.
Source: Summarized from the draft Land and building tax bill (2011) and its proposals thereafter.
6. Why the Land and Building Tax Should Be Imposed in
Thailand?
If the Land and building tax is imposed, there are some advantages over the earlier bills, such as:
1. Imposing Land and building tax is an important tax
reform which can reduce the inequality in the society since the tax base is based on wealth. This type of tax follows “the ability to pay principle” which implies that citizens who own a higher value of property will pay more taxes than those who own a lesser value of property.

Thammasat Review of Economic and Social Policy Volume 2, Number 1, January - June 2016
46
2. The assessed value of the property is the tax base so the officers do not have to use their discretionary decision making. This should reduce corruption and the use of tax loopholes.
3. The Land and building tax has a wide tax base which covers most property owners resulting in an increase in local tax revenue. The local tax revenue should be increased by at least 30,000 – 40,000 million baht. The actual tax revenue will increase depending on the final size of tax exemptions and tax deductions. Recently, the locally levied tax (the Building and land tax and the Local development tax) contributed less than 10% of the local government’s revenue (see Table 9). The proportion of Thai property tax to gross domestic product is just 0.2%, which is very small compared to the other countries in the world (see Figure 3).
4. The tax rate is flat, so it will not be a regressive rate the way Local development tax is.
5. Locally levied taxes such as the Land and building tax supports fiscal decentralization. The local governments will have their own source of revenue to provide social services to meet the needs of citizens in their jurisdictions.
6. The Land and building tax will promote accountability in the jurisdictions. The citizens have to pay taxes each year so they will monitor their local government’s administrative performance to make sure that it is worth their money.

Thammasat Review of Economic and Social Policy Volume 2, Number 1, January - June 2016
47

Thammasat Review of Economic and Social Policy Volume 2, Number 1, January - June 2016
48
F
igu
re
3T
he
Pro
po
rti
on
of
Pro
per
ty T
ax t
o G
ross
Dom
esti
c P
rod
uct
Ab
road
Co
mp
are
d t
o T
hail
an
d
S
ourc
e: N
orr
egaa
rd (
20
13
).

Thammasat Review of Economic and Social Policy Volume 2, Number 1, January - June 2016
49
7. Local governments can impose a higher tax rate on a vacant and underutilized land. This will increase the cost of holding land to owners who do not use their land productively. Thus, they will need to either utilize their land to earn some income, or sell it to somebody who can fruitfully utilize it. Land should be used more efficiently.
8. Land holding cost to land speculators is also increased f rom impos ing Land and bui ld ing tax . Land speculation will decrease depending on how close are the tax rate and the percentage change in land price each year. Table 10 shows that the land price in 2016-2019 will increase by an estimated 7% over 2012-2015 prices. If the maximum Land and building tax rate is 3%, it is still lower than past increases in land price. The Land and building tax will probably not cause significant reduction in the concentration of land holding in the near future, but this is a good start.
Table 10 The Comparison of Percentage Change in the
Assessed Value of Land between 2012 – 2015 and 2016 -
2019
Area
The Percentage Change in the
Assessed Land Value per Year
(%/year)
Whole country 6.93
Bangkok 3.95
The other provinces 6.97
Surrounding Bangkok 4.74
Central 5.70
North 9.33
East 5.75
Northeast 8.38
South 5.26
West 9.90
Source: The Treasury Department

Thammasat Review of Economic and Social Policy Volume 2, Number 1, January - June 2016
50
7. Recommendation for Property Tax Reform in Thailand
Based on the above information about Thailand’s current property tax and the concentration of land holding, my recommendations for property tax reform are as follows11:
1. The government and the legislative branch should pay
more attention to property tax reform proposal and pass the tax bill.
2. Tax exemptions and tax deductions should be as small as possible, to protect only the truly poor, in order to broaden the base as much as possible and to avoid tax loopholes in the future.
3. One way to reduce tax burden for home owners or farmers would be for the government to allow tax payers to deduct property taxes that they pay from their personal income tax. There should be a ceiling amount for tax deductions. For instance, not more than 20,000 baht per year.
4. Vacant land possessed by government offices should be returned to the state so that such land can be distributed or leased to the needy who have no land for cultivation or shelter.
5. Even though some pieces of property are exempted from tax payment, taxes should still be estimated and shown to the public. It is only fair that all know the magnitude of tax exemption.
6. The local government should have some measures to monitor the usage of land. Otherwise, tax evasion will become an issue.
11 Laovakul (2014), Laovakul (2016a) and Laovakul (2016b).

Thammasat Review of Economic and Social Policy Volume 2, Number 1, January - June 2016
51
7. The central government should support the assessed land value by pieces which will be an important factor to calculate tax base for Land and Building Tax.
8. The local governments need to communicate with their citizens and explain to them how important Land and building tax is and what benefits they can get by paying taxes.
9. If we would like to reduce the inequality of land holding, the flat tax rate may not be sufficient as a tool to alleviate land concentration in Thailand. The government may have to implement one additional tool which is a progressive tax rate.

Thammasat Review of Economic and Social Policy Volume 2, Number 1, January - June 2016
52
References
Laovakul, D. (2012). Summary and Analysis of Draft Land and Building Tax Bill. Supported by Legislative Process Development for Supporting People Participation in Thailand Project, in Thai.
Laovakul, D. (2013). The Concentration of Wealth in Thai Society. In Towards a More Equitable Thailand: A Study of Wealth, Power and Reform Project. Supported by Thailand Research Fund, Office of the Higher Education Commission and Chulalongkorn University, conducted by Pasuk Phongpaichit, in Thai.
Laovakul, D. (2014). Land and Inheritance taxes: Who own, who pay and who benefit? Thammasat Economic Focus, No. 2, available at http://www.tef.econ.tu.ac.th/wp-content/uploads/2015/03/02_TEF-Final-paper.pdf, in Thai.
Laovakul, D. (2016a). Concentration of Land and Other Wealth in Thailand. in Unequal Thailand: Aspects of Wealth and Power. Chapter 2. Pasuk Phongpaichit and Chris Baker (Eds), National University of Singapore Press.
Laovakul, D. (2016b). The Model for Improving Land Tax to Promote Land Distribution in Thailand. Supported by the Thailand Research Fund, in Thai.
Leenothai, S. (2014). Summary of the Main Contents of the Draft Land and Building Tax Bill or the Property Tax. Presented at a Seminar on “The Land and Building Tax or the Property Tax for Fairness and Reducing the Inequality” at Khonkaen University,December 12, 2014, in Thai.

Thammasat Review of Economic and Social Policy Volume 2, Number 1, January - June 2016
53
Norregaard, J. (2013). Taxing Immovable Property Revenue Potential and Implementation Challenges. IMF Working Paper.
Office of the Council of State. Draft Land and Building Tax Bill, No. 194/2554, in Thai.
Slack, E. (2010). The Property Tax … in Theory and Practice. IMFG Working Paper 02.
Bangkokbiznews Online (2015). The Minister of Finance Prepares to Submit the Draft Land and Building Tax Bill to the Cabinet. (2015, August 9). Retrieved from http://www.bangkokbiznews.com/news/detail/660180, in Thai.
Matichon Online (2012). The Ministry of Finance Pushes Forward the Draft Land and Building Tax Bill, Revises 4 Issues and Increases the Tax Ceiling Rates. (2012, September 11). Retrieved from http://www.matichon.co.th/news_detail.php?newsid=1347341486, in Thai.
Ministry of Finance (2016). Draft Land and Building Tax B.E…… The Ministry of Finance Press Release. (2016, June 7). Retrieved from http://www.fpo.go.th/FPO/index2.php?mod=Content&file=contentview&contentID=CNT0015818&categoryID=CAT0000153, in Thai.

Thammasat Review of Economic and Social Policy Volume 2, Number 1, January - June 2016
54
Market Expansion, Political Relationship and
Geographical Inequality in the Early
Rattanakosin Siam: A Theoretical Perspective*
Pornthep Benyaapikul
Assistant Professor Faculty of Economics
Thammasat University Bangkok, Thailand
* This research was supported by the Thailand Research Fund (TRF) as a part of TRF Senior Research Scholar project: “Spatial Dynamics and the Persistence of Inequality in Thailand”, grant no. RT558005. This paper benefited greatly from conversations with Professor Arayah Preechametta, the project leader. Valuable comments and suggestions from Professor Pasuk Phongpaichit, Professor Mingsarn Kaosa-ard, Thorn Pitidol and workshop participants at the faculty of Economics, Thammasat University are gratefully acknowledged.
Thammasat Review of Economic and Social Policy Volume 2, Number 1, January - June 2016
55
ABSTRACT
This paper provides a simple theoretical model that explains a mechanism for which market economy might proliferate through various geographical locations in the early Rattanakosin Siam and its implication on locational inequality. The proliferation of market economy is often facilitated by a widespread network of merchants and the elite’s profit-maximisation trade incentives. The degree of market expansion in each city depends on elite’s benefits from the market and geographical location of the city. The results suggest four factors that contribute to the level of inequality both within and between cities: social structure, geographical location, individual’s connection with powerful elites and worker’s ability. Keywords: Geography, inequality, market structure, institutional development, Thailand JEL Classification: D4, D63, N25, R3

Thammasat Review of Economic and Social Policy Volume 2, Number 1, January - June 2016
56
1. Introduction
Exchange is universal. People have traded things for thousands of years: evidence of exchanged artefacts such as shells and other goods over long distances dates back to before any written history (Pomeranz & Topik, 2006). As argued by Adam Smith in 1776, the “propensity to truck, barter, and
exchange” was inherent in human nature. One of the central questions about the foundation of
market economy in the pre-modern era concerns the role of social structure and geographical location in the transition process from subsistence economy. Historical evidence suggests that social structure played an important role in trade expansion in the economy. The literature identified the protection of property rights and contract enforceability as two important institutional foundations necessary for the evolution of market economy.1 In the context of pre-modern societies, much of economic transaction is based on coercive relationship between workers/merchants and a ruler/elite who controls specific territory or trade routes and is the monopoly supplier of legitimate coercion. Institutional arrangements that align the interests of the two groups are needed to capture larger benefits from trade (Bates, 2001; Greif, 2008).
For example, in Medieval Europe, before a trading centre was established trade and commerce was obstructed by little security on trade routes and the system of fines and tolls which each landowner collected before letting merchandise pass through his domains. Itinerant traders, or merchant guilds in the “Commercial Revolution of the Middle Ages Europe” from the tenth to the eighteenth centuries, that dominated long-
1 The commitment problem occurred when the ruler, after pledging their protection for traders, have an incentive to renege on his promise by using coercive power to abuse their property rights once trade was established. See Greif (2006) for a survey of this literature.

Thammasat Review of Economic and Social Policy Volume 2, Number 1, January - June 2016
57
distance commerce was the most important institution that facilitated the expansion of trade. Merchant guilds emerged as an efficient institution to allow rulers of trade centres to commit to the security of alien merchants (Greif et al., 1994; Hicks, 1969) contributing to the growth of long-distance trade (Ogilvie, 2011).2 There have been theoretical explanations on the function of merchant networks in the market economy transition. For example, Greif et al. (1994) highlights that the merchant network as an institution for communication and coordination was important for trade expansion as its helped solve the problem of commercial insecurity. More recent literature focuses on a key function of the merchant network (or guilds) in facilitating collusion between merchants and city rulers in order to restrict trade and maximise joint rent (Dessi & Ogilvie, 2004; Dessi & Piccolo, 2015).
In early Rattanakosin Siam (1782-1855), the patron-client relationship between the princes or the noble aristocrat class (munnai) and the commoner (phrai) class was the important institutional foundation of legitimate coercive power.3 There are two basic kinds of phrai: the phrai som belonged to the nobles or the prince and free from government corvée labour, the phrai luang belonged to the king and were subject to government corvée labour for 4 months every year.
2 For an extensive survey and discussion of the role of guilds as an economic institution, see Ogilvie (2014). 3 Scott (1972) defines patron-client relationship as an
exchange relationship between roles . . . involving a largely instrumental friendship in which an individual of higher socioeconomic status (patron) uses his own influence and resources to provide protection or benefits, or both, for a person of lower status (client) who, for his part, reciprocates by offering general support and assistance, including personal services, to the patron.

Thammasat Review of Economic and Social Policy Volume 2, Number 1, January - June 2016
58
Commoners must be registered under a prince or an aristocrat, from whom they are provided with aid, protection from government exaction (Rabibhadana, 1969) and social insurance of a powerful leader (Scott &Kerkvliet, 1973). A noble and prince had certain power over his commoners in the form of corvée labour and movement restriction; they were not allowed to migrate between towns or leaders. This was because of the shortage of labour during this period, thus controlling labour was an essential key to power. Territorial control was not important.
Corvée labour service and movement restriction limit workers market access. Trading and commerce between towns in the kingdom were operated by the widespread network of Chinese merchants that established patron-client relationships with the nobles and princes of small towns (Eoseewong, 2012). Trading activities were concentrated among these elites and Chinese merchants while foreign trade, which drove domestic trade, was monopolised by the king.
Even though an elite can force his commoners to work for him, corvée labour suffers from the moral hazard problem and is productively inefficient. Workers have no incentive to exert effort and are likely to slack (Nartsupha & Manarangsarn,1984; Preechametta, 2014). As trading activities increase, workers have better work opportunity and return from the market. It became more profitable for the elites to allow commoners to avoid corvée by paying an exemption fee.4 However, granting workers market access was implemented in a limited and controlled manner. The phrai
system was not entirely abolished as corvée labour still benefits the elites (Eoseewong, 2012).
4 Historical evidence shows that during the King Rama III period, more and more workers would want to pay fee to avoid corvée burden (Hong, 1981 cited in Eoseewong, 2012)

Thammasat Review of Economic and Social Policy Volume 2, Number 1, January - June 2016
59
This study aims to provide game-theoretical foundation that explains a mechanism for which market economy can proliferate through various geographical locations within a state and how factors such as social structure, geographical location and labour productivity gave rise to inequality in a pre-modern society like early Rattanakosin Siam. To formulate a simple model, it is assumed that allocation of resources is controlled by the elites. Workers’ participation in the market is jointly determined by elite’s decision to grant market access and the network connection with the elite that the workers are invested in.
The paper is organised as follows: Section 2 sets up and describes the basic model. Section 3 characterises equilibrium of the model and discusses comparative static results. Finally, Section 4 concludes.
2. The Model
In this section, we describe the environment. We start with the social structure that is characterised by the coercive relationship between an elite and workers in each city. We then describe the structure of the game before analysing equilibrium in the next section.
2.1 Social Structure
A kingdom is populated by > 0 localities or cities. The cities are indexed by ∈ 1,2, . . . , which also represents a rank of a city’s distance from the capital in an ascending order. In each city, there is a continuum of identical workers of mass equal one with Von-Neumann-Morgenstern-type utility function. Workers’ output can be high or low depending on the effort they put on work. Each worker has potential productivity of 1 + ≥ 1 per unit of time. It is assumed that is privately known only by worker but it is common

Thammasat Review of Economic and Social Policy Volume 2, Number 1, January - June 2016
60
knowledge that is drawn uniformly from interval [0,1]. When a worker chooses effort level ∈ [0,1] at private cost (), output 1 + is realised with probability and 1 with probability 1 − . We assume that (0) = 0 and that (·) is strictly increasing, strictly convex and twice differentiable,
with derivative denoted by that also satisfies lim→! (") = ∞.5 In any given period, all workers are forced to spend a part of their time working for the elite and, depending upon being selected (see Section 2.2 below), participate in the market.
Each city is overseen by an elite whose powers have been delegated by the king. The elite can force workers to devote a fraction α of their time working for him. For now, we assume that $ is exogenously set by the king and, therefore, fixed. In return, workers receive constant wage %. We assume that the elite can sell these output at price &' . It is straightforward to see that forced workers maximise their utility by choosing effort = 0 when working for the elite.
2.2 Market economy
Apart from coercive relationship between the elite and the workers, the cities may benefit from trade by visiting merchants. We assume that market activities are controlled by the elite. Workers can participate in the market only if the elite opens up the city for merchants to trade and allows workers to access the market. We also assume that merchants’ valuations
for the product in city j are identical and can be given by &( = &(), ) where ) = ∑ + + $ is the aggregate output available for trade, & (·) is strictly positive, decreasing in both ) and , and continuously differentiable (in )) demand
5 This assumption follows Acemoglu and Wolitzky (2011) while Chwe (1990) assumed the effort cost to have form () =,(− log(1 − )).

Thammasat Review of Economic and Social Policy Volume 2, Number 1, January - June 2016
61
schedule. This captures the idea that greater output will reduce price and demand for trade is lower in a more remote city. If no worker in city is allowed to participate in the market, the elite becomes a monopolist in which he sells his output at price &' = &(($, ) = &(/. If the elite allow workers to trade, the
elite receives benefits from trade by taxing merchants at an exogenous rate 0 per unit of output traded.
To open up the city for trade, the ruling elite of the city
provides trade facilitating public goods at cost 1(. These public
goods could be interpreted as physical markets where trades actually take place, transportation routes or protection to merchants. However, in this paper, we will refer to this as an elite’s ‘network’ to reflect historical records that the proliferation of market economies, for example in medieval Europe or during early Rattanakosin period, Thailand, might be hindered by workers’ limited access to the market. This limited access is caused by many factors such as availability of money, distance from trading centres, transportation difficulties or information availability. Opportunity of accessing and participating in the market for each worker may be provided by the ‘profit-maximising’ elite and this depends partly on their informal network or relationship. The parameter 1( > 0 corresponds to the cost of trade facilitating public
goods to the elite which is determined by city specific factors such as geographical location.
Workers need to invest in order to get into an elite’s network circle. We assume that each worker chooses whether to invest in network formation with the elite or not. The cost of network investment is fixed at 2. Only workers with network connection with the elite are granted a market access. The workers then devote their remaining (1 − $) unit of time producing output. Each worker is then matched with a merchant. The pair then bargains over term of trade. We assume Nash bargaining solution to this process. Workers

Thammasat Review of Economic and Social Policy Volume 2, Number 1, January - June 2016
62
without market access is assumed to receive utility 3 per unit
of time.
The timing of the game is as follows: 1. All workers spend a fraction $ of their time working for
the elite. The elite decides whether to open city for trade. 2. Workers with market access choose effort level to
produce output.
3. If the trade is allowed, merchant valuation &( is
determined. The elite sells output at &(. Each worker is
matched with a merchant. Both parties bargain over the trading price. The elite receives trading tax.
3. Equilibrium
To find an equilibrium, the subgames are solved backward. We begin with the bargaining subgame between market-participating workers and merchants where trading price will be determined. Workers’ and elite’s problems are then analysed.
3.1 Workers vs Merchants Bargaining Subgame
In the bargaining subgame between a worker and a merchant, worker with output + meets a merchant to trade and negotiate over the price &4. Once a buyer meets a seller, they negotiate a price to trade. For simplicity, suppose one of the two, chosen at random, announces a take-it-or-leave-it price offer. If trade occurs the merchant receives 56 =7&(()) − &4 − 08+ while the worker receives 54 = &4+. If both parties cannot agree to trade, the merchant receive zero utility from this match; this means the disagreement outcome for the merchant is 96 = 0. On the contrary, if workers refuse to trade with the matched merchant, they have to pay search

Thammasat Review of Economic and Social Policy Volume 2, Number 1, January - June 2016
63
cost : per unit of output to match with the new merchant and start the bargaining process over again. This bargaining protocol is equivalent to the Nash solution.
Suppose that, in equilibrium, bargaining is successfully concluded with probability ; which the worker receives equilibrium bargaining payoff. Workers’ disagreement outcome is given by
94< = =54<∗ − :+ + (1 − =)794<8 = =54<∗ − :+ ?(1 − =)
@
AB
= =54<∗ − :+= (3.1)
where 54<∗ is the equilibrium bargaining payoff for the worker.
We use Nash bargaining solution (Nash, 1950) as a solution concept for this bargaining problem. The outcome of the bargaining is given by the following Proposition
Proposition 3.1 The Nash bargaining solution between a
worker with output qi and a merchant involves &4∗ = &D − 0 −:.
Proof. First, notice that the Nash bargaining solution must be Pareto-efficient. Therefore, in equilibrium, the bargaining involves no delay or ; = 1. This means the disagreement outcome for a worker reduces to 94 = 54∗ − :+. The Nash bargaining solution is the optimal solution of the following problem maxGH,GI[56 − 96][54 − 94]
↔ maxKI [7&( − &4 − 08+][&4+ − (5L∗ − :+)]

Thammasat Review of Economic and Social Policy Volume 2, Number 1, January - June 2016
64
By the first-order optimality conditions, we have
&4∗ = &( − 02 − 54∗ − :+2+
Since 54∗ = &4∗+, we have &4∗(), , 0, :) = &(()) − 0 − :
3.2 Workers’ problem
3.2.1 Worker’s efforts
Upon being granted market access, the workers allocate their remaining (1 − $) unit of their time for market production. As described above in Section 2.1, the level of output produced is uncertain and depends on worker’s efforts. We assume that workers without market access receive utility (1 − $)3. We also assume that 3 is sufficiently small. In
particular, 3 < &4N (3.2)
where &4N is workers’ expected selling price to ensure that, ceteris paribus, being in the market is always better than staying out.6
Workers with market access choose effort a to solve the following problem:
5() = maxO∈[B,!] [&4∗(1 − $)(1 + )] + (1 − )[&4∗(1 − $)] − (1 − $)()
6 The condition 3.2 implies that workers’ expected utility received when in the market but exerting no effort ( = 0), &4N(1 − $), is higher than being out of the market.

Thammasat Review of Economic and Social Policy Volume 2, Number 1, January - June 2016
65
= maxO∈[B,!](1 − $)[&4∗(1 + ) − ()] (3.3)
The optimal level of efforts, ∗, is given by the first order
condition: &4∗ = %(∗) (3.4)
Since (·) is increasing in , optimal efforts are
increasing in output price &( and productivity and decreasing
in trading tax, 0 and decreasing in search cost, :. The following lemma summarises this.
Lemma 3.2 Worker’s optimal efforts, ∗ is increasing in both
productivity () and market price (&() and decreasing in both
trading tax (0) and search cost (:)
Proof. The proof is a straightforward application of the Implicit Function Theorem on equation 3.4 using Proposition 3.1 and hence omitted. 3.2.2 Network investment
Only workers in the elite’s network could be chosen to participate in the market. Workers who want to gain access to the market must invest in (political) networks in order to have ‘connections’ with the elite. We assume that the worker must choose whether to spend 2 on network investment. Apart from building a social network, 2 is a completely wasteful investment. We assume that the network investment cost is not prohibitively high such that no worker will ever invest in network and participate in the market. In particular, 2 <5( = 1) − (1 − $)3. Those who invest receive equal
probability of market access. Since the worker’s expected benefits from investing on the network depend both his own

Thammasat Review of Economic and Social Policy Volume 2, Number 1, January - June 2016
66
and other workers’ privately known types (level of productivity), this network investment game is a Bayesian game. We will look for the symmetric Bayesian Nash equilibria in monotone (i.e. weakly increasing) strategies. The following proposition describes this.
Proposition 3.3 A symmetric Bayesian Nash equilibrium in
monotone strategies of the network investment game has a cut-
off value Q satisfying
2 = R5(Q) − (1 − $)3S (3.5)
such that equilibrium monotone strategy of worker , :∗(),
is :∗() = UVW:X , ≥ Q = UYX UVW:X , < Q Proof. We show that no worker has an incentive to deviate from the equilibrium strategy. Notice that the payoff from investment is Z( UVW:X, :[∗ |) = 5() − 2
Payoff from “not invest” is simply (1 − $)3. The payoff-
difference between “invest” and “not invest” is therefore ∆Z() = Z( UVW:X, :[∗ |) − Z(UYX UVW:X, :[∗ |)
= [5() − (1 − $)3] − 2
By the Envelope Theorem, 5() is 3.3, ∆Z() also increases with . Considering = Q.

Thammasat Review of Economic and Social Policy Volume 2, Number 1, January - June 2016
67
∆Z(Q) = R5(Q) − (1 − $)3S − 2 (3.6)
Plugging 2 = [5(Q) − (1 − $)3] into 3.6 gives ∆Z(Q) = 0.
This means that when ≥ Q, according to :∗, player invests at . Since ∆Z(Q) ≥ = 0, “invest” is the optimal action and the workers do not have an incentive to deviate from “invest” to “not invest”. Similarly, when < Q, according to :∗, player does not invest. Since ∆Z(Q) < 0, “not invest” is the optimal action and the workers do not have an incentive to deviate from “not invest” to “invest”.
According to Proposition 3.3, in a pure strategy Bayesian Nash equilibrium, the size of workers participating in networking activities (1 − Q) decreases in cost of building political network with the elite (2) and the relative payoff between being in and out of the market.7 The total expenditure
on networking activity by the workers in city is 2(1 − Q() =[5(Q() − (1 − $)3](1 − Q(). We can analyse the implication
of trading tax (0), search cost (:) and city’s geographical location () on workers’ networking expenditure. This can be done by analysing the effects of the aforementioned variables
on the cut-off value Q(.
Corollary 3.4 The fraction of workers investing in the
network, 1 − Q, increases in worker’s selling price, &4∗.
Proof. We show that Q is decreasing in &4∗ . Define _ =5(Q) − (1 − $)3 − 2 = (1 − $)[&4∗(1 + ∗Q) − (∗)] =0. Using the Implicit Function Theorem
7 This is not the only Nash equilibrium for this subgame. There are also mixed equlibria; for example, a symmetric mixed strategy Nash equilibrium where all workers choose to invest on networking with
the elite with equal probability` = !a (5(Q) − (1 − $)3)

Thammasat Review of Economic and Social Policy Volume 2, Number 1, January - June 2016
68
bQb&4∗ = − _cI∗_dQ
= − (1 + ∗Q)&4∗∗
which is negative.
Corollary 3.4 is intuitive; higher market price increases workers’ expected return from participating in the market. This provides incentive to less productive workers to invest in
network to connect with the elite. In addition, since &4∗ = &D −0 − :, comparative static analysis for these variables is straightforward. Higher trading tax (0) and search cost (:) reduces selling price inducing less workers to participate in the market while stronger demand provides opposite effects. Corollary 3.5 summarises this.
Corollary 3.5 The fraction of workers investing in the
network, 1 − Q, increases in merchant’s valuation (&D) and
decreases in trading tax (0) and search cost (:)
The effect of geographical location on networking activities can also easily analysed. Since cities are indexed according to their distance to the capital in an ascending order and the farther city has weaker demand, network activity is, therefore, decreasing in .
Corollary 3.6 The fraction of workers investing in the
network, 1 − Q, decreases in .

Thammasat Review of Economic and Social Policy Volume 2, Number 1, January - June 2016
69
3.3 Elite’s problem
In this simple model, trading tax rate and the proportion of time workers are forced to work for the elite is assumed to be fixed. The elite only needs to decide whether the workers are allowed to participate in market economy or not. If he chooses not to open the city for merchant trade, he becomes
the monopolist selling $ unit of output at price &(($) = &(/
and receives profit eB = $&(/. If the elite allows workers to
participate in the market, the elite receives profit of e! = $&(()) + 0Ε[+| ≥ Q] − 1( (3.7)
which consists of two sources of revenues. The first term on the right-hand side (RHS) of equation (3.7) is revenues from output $ sold at the market price. The second term is expected tax revenues collected from every output traded when a fraction (1 − Q) of workers participating in market activities. The elite pay cost 1( for opening up city for trade. The term Ε[+| ≥ Q(] is the expected total output produced by workers
for the market when only workers with productivity ≥ Q
participated. That is,
ΕR+h ≥ Q(S = Εi jk +9!
dQlm
= k Ε(+)9!
dQl
= k (1 − $)(1 + ∗)9!
dQl
= (1 − $)(1 − Q() n1 + ∗(1 + Q()2 o

Thammasat Review of Economic and Social Policy Volume 2, Number 1, January - June 2016
70
Then, equation (3.7) can be written as
e! = $&(()) + 0(1 − $)71 − Q(8 n1 + ∗71 + Q(82 o − 1((3.8)
with = $ + (1 − $)71 − Q(8 q1 + O∗7!rdQl8s t .
The elite compares profits between the two options. He
allows workers to trade if and only if e! ≥ eB, or when the cost of opening the city to trade is sufficiently small,
1( ≤ −$7&(/ − &(8 + 0(1 − $)71 − Q(8 n1 + ∗71 + Q(82 o (3.9)
The RHS of (3.9) represents the benefit of market economy to the elite. The first term in RHS is profit loss from allowing workers to trade. The elite gives up his monopoly position and the equilibrium price decreases. The second term represents an additional source of revenue, trading tax income, that the elite collects at rate 0 on every output traded.
We impose the following assumption on market demand, &(()):
Assumption 3.7 &(/ − &( is increasing in
Assumption 3.7 states that the difference between elite’s
monopoly price and the competitive price when workers are allowed to trade is larger if the city is located farther. This assumption may seem ad hoc but it reflects the view that markets located farther from the capital get thinner and the elite’s output is large relative to the size of the market. If workers are allowed to trade, additional output would drive

Thammasat Review of Economic and Social Policy Volume 2, Number 1, January - June 2016
71
down the competitive price more steeply in the farther markets
resulting in a larger difference between &(/ and &(. In contrast,
the elite’s output is less significant in a nearer, more centrally located market where traders are much more concentrated. Thick markets mean that price will not drop as steeply as in thin markets when the city is opened to trade. Monopoly profit loss to the elite is therefore smaller.
Assumption 3.7 allows us to establish the relationship between geographical location and market proliferation.
Proposition 3.8 There exists 1 = −$7&(/ − &(8 + 0(1 −$)71 − Q(8 q1 + O∗7!rdQl8
s t such that all cities with 1( ≤ 1 are
opened up to trade.
Proof. The term −$(&(/ − &() is decreasing in by
Assumption 3.7. We will now show that the second term in
RHS is also decreasing in . Since (1 − $)71 − Q(8 q1 +O∗7!rdQl8
s t = ΕR+h ≥ Q(S is the expected total output produced
by workers in the market and this is decreasing in Q( as
bΕR+h ≥ Q(SbQ( = −(1 − $)71 + ∗Q(8 < 0
Also, from Corollary 3.6, the cutoff value, Q(, is
increasing in . Therefore, ΕR+h ≥ Q(S is decreasing in .
Since both terms in RHS are decreasing in while 1( increases
in , there exists the cut-off value 1 = −$7&(/ − &(8 +0(1 − $)71 − Q(8 q1 + O∗7!rdQl8
s t where elites in city with 1( ≤ 1 opens up the city to trade and closes otherwise.

Thammasat Review of Economic and Social Policy Volume 2, Number 1, January - June 2016
72
Proposition 3.8 defines the geographical boundary of the market economy of the kingdom. Only cities with sufficiently large trade demand would allow their workers to participate in the market. The elite in a farther city is reluctant to embrace market economy as the competitive price would drop too large and tax revenue would be too small.
4. Conclusion
This study provides a theoretical model that explains a mechanism for which market economy can proliferate through various geographical locations within a nation in the pre-modern era (early Rattanakosin Siam) and its implication on locational inequality. An economy is characterised by political-power-induced-economic-institution in which resources are controlled and allocated, specifically the hierarchical power and economic relationship between workers (commoners) and elites (the nobles or princes). The elites provide a public good, protection, in exchange for the labor of commoners producing output for them (or working on their lands). The elites can coerce workers to spend time working for them. The workers cannot migrate between cities. Four factors that could contribute to inequality are analysed: social structure, geographical location, political connection and worker’s ability.
In this model, towns differ in their trading potential and the expansions of market economy depends on the elites decision on whether to allow workers participation in market trade. By restricting workers from the market, the elites become the monopolists selling their output to visiting merchants. On the contrary, by allowing workers to trade, the elite enjoys trading tax revenue instead of monopoly profits. We showed that an elite will open his town to trade only when demand for output is sufficiently large.

Thammasat Review of Economic and Social Policy Volume 2, Number 1, January - June 2016
73
When worker’s opportunity to access the market also depends on their relationship with the elites, workers have to invest to build network or connection with the elites. We showed that the fraction of city’s workers investing on network building (and participating in the market) depends not only on tax rate or trading search cost but also geographical location of the city.
Apart from social structure and political networking, workers’ ability also contributes to inequality within the city. In equilibrium, only a small fraction of high productivity workers invests and participates in the market, especially in remote cities. Lower productivity workers receive better opportunity to participate in the market if they live closer to the capital.

Thammasat Review of Economic and Social Policy Volume 2, Number 1, January - June 2016
74
References
Acemoglu, D. & Wolitzky, A. (2011). “The Economics of Labor Coercion.”, Econometrica, 79(2), 555-600.
Bates, R. (2001). Prosperity and Violence: The Political
Economy of Development., New York: Norton.
Chwe, M. (1990). “Why Were Workers Whipped? Pain in a Principal-Agent Model.”, Economic Journal, 100, 1109-1121.
Dessi, R. & Ogilvie, S. (2004). “The Political Economy of Merchant Guilds: Commitment or Collusion?”, IDEI
Working Paper, no.278.
Dessi, R. & Piccolo, S. (2015). “Merchant Guilds, Taxation and Social Capital”, TSE Working Paper, no.581, Toulouse School of Economics.
Eoseewong, N. (2012). Quill and Sails, 4h ed., Bangkok: Sameskybooks Press. (in Thai).
Greif, A. (2006). Institutions and the Path to the Modern
Economy: Lessons from Medieval Trade, New York: Cambridge University Press.
Greif, A. (2008). “Coercion and Exchange: How Did Markets Evolve?”, Unpublished manuscript.
Greif, A., Milgrom, P. & Weingast, B. (1994). “Coordination, Commitment, and Enforcement: The Case of the Merchant Guild.”, Journal of Political Economy, 102(4), 745-776.
Hicks, J. (1969). A Theory of Economic History, Oxford UK: Oxford University Press.

Thammasat Review of Economic and Social Policy Volume 2, Number 1, January - June 2016
75
Hong, L. (1981). The Evolution of the Thai Economy in the
Early Bangkok Period and Its Historiography, PhD thesis, The University of Sydney.
Nartsupha, C. & Manarangsarn, S. (1984). Economic History
of Thailand until 1941., Bangkok: Thammasat University Press. (in Thai).
Nash, J. (1950). “The Bargaining Problem.”, Econometrica, 18(2), 155162.
Ogilvie, S. (2011). Institutions and European Trade:
Merchant Guilds, 1000-1800, New York: Cambridge University Press.
Ogilvie, S. (2014). “The Economics of Guilds.”, Journal of
Economic Perspectives, 28(4), 169-192.
Pomeranz, K. & Topik, S. (2006). The World That Trade Created: Society, Culture, and the World Economy,
1400 to Present, New York: M.E. Sharpe Inc.
Preechametta, A. (2014). “Spatial Dynamics and the Persistence of Inequality in Siam during 1782-1855”, Applied Economics Journal, 21(2), 1-29. (In Thai)
Rabibhadana, A. (1969). The organization of Thai society in
the early Bangkok period, 1782-1783., Ithaca, NewYork: Dept. of Asian Studies, Cornell University,
Scott, J. (1972). “Patron-Client Politics and Political Change in Southeast Asia”, American Political Science Review, 66, 91-113.
Scott, J. & Kerkvliet, B. (1973). “The Politics of Survival: Peasant Response to ‘Progress’ in Southeast Asia?, Journal of Southeast Asian Studies, 4(2), 241-268.
Smith, A. (1776). An Inquiry into the Nature and Causes of the
Wealth of Nations, Oxford, U.K: Clarendon Press.

Thammasat Review of Economic and Social Policy Volume 2, Number 1, January - June 2016
76
Income Elasticity for Medical Care Services:
An Empirical Study in Thailand
Kaewkwan Tangtipongkul
Assistant Professor Faculty of Economics
Thammasat University Bangkok, Thailand

Thammasat Review of Economic and Social Policy Volume 2, Number 1, January - June 2016
77
ABSTRACT
The objective of this paper is to investigate the potential household income effect on public and private health care choices for outpatient and inpatient services. A multinomial logit model on choice of health care services is estimated using the Health and Welfare Survey 2006 data from Thailand with information on the number of hospitals and doctors in each province. The results indicate that an increase in monthly household income has an impact on the likelihood of healthcare utilization. Income elasticity for outpatient services is approximately 0.17 and 0.21 at clinics and private hospitals respectively. Income elasticity for inpatient services is approximately 0.10 at public provincial hospitals and 0.25 at private hospitals. The positive income elasticity indicates that services at these healthcare providers are a necessity. In contrast, income elasticity is approximately -0.13 and -0.20 for outpatient and inpatient services at public district hospitals. This suggests that district hospitals may be an inferior good. This implies that patients from wealthier families are more likely to visit private hospitals or public provincial hospitals. The Universal Coverage or Gold Card beneficiaries show a positive statistically significant probability of visiting public district hospitals for outpatient and inpatient services. From the policy perspective, Universal Coverage or Gold Card plan should be designed for segments of population below a certain income level. The government can use funds that made available by the decreased number of Universal Coverage or Gold Card beneficiaries to raise the capitation rate or hire additional medical staff at district hospitals.
Keywords: Income elasticity of demand, outpatient, inpatient, health insurance, Thailand
JEL Classification: I11, I13

Thammasat Review of Economic and Social Policy Volume 2, Number 1, January - June 2016
78
1. Introduction
The high cost of outpatient and inpatient services is a barrier to affordable healthcare in developing countries especially among the low and middle income population. People in the low income group are less likely to gain access to quality healthcare. It is an important issue that the government improves the healthcare policy for needy households. Although there is increasing literature about health policy and its determinants, there are few studies that mention this issue in Thailand. As a result, there is limited information for the policy maker to evaluate and improve the existing healthcare policy. The objective of this study is to investigate the potential household income effect on public and private healthcare choices for outpatient and inpatient services. This study mainly shows that outpatient and inpatient service choices can be explained by household socioeconomic characteristics and the availability of health insurance.
High outpatient and inpatient service costs compel the government to develop a policy or a program to alleviate high healthcare expenses. Thailand is an example of a lower-middle income country that introduced universal healthcare coverage in 2001. The universal coverage allows the insured to pay a minimal fee of 30 Baht for each visit to the public health centers and district hospitals. Healthcare policy decisions often raise the following important questions: Is household demand for medical care responsive to financial resources and its time cost? Is the demand for outpatient and inpatient health services elastic to household income? How can the government provide and finance medical service access to all population? How can the government promote equal access to medical care for the least well-off segment of the population? These questions are important for the policy maker to evaluate the funding plans from taxation for the program. The setting up of hospital

Thammasat Review of Economic and Social Policy Volume 2, Number 1, January - June 2016
79
facilities and medical faculty in each region throughout the country should also be evaluated.
To examine the relationship of income on demand for outpatient and inpatient services, this study uses the Health and Welfare Survey 2006. The survey provides information about the health and economic status of households. In addition, I combined this data set with information on the number of hospitals and doctors in each province. With the multinomial logit model of outpatient and inpatient service choices, the results indicate that the elasticity of income shows that the district public hospital is an inferior good, while other public and private hospitals are a normal good. This implies that the change of monthly household income has an impact on the choice of outpatient and inpatient services.
This finding will be beneficial not only for the government, as a policy maker to design an appropriate healthcare policy, but also as a major contribution in the long run because the analysis includes the household socioeconomic factor, types of morbidity, and health insurance information needed to analyze the determinants of outpatient and inpatient services in Thailand. All of these factors may affect the decision-making of households as well as that of the government. The existing literature only focuses on the policy and descriptive statistics with limited analysis using econometric tools.
This paper is organized as follows: Section 2 discusses the literature review. Section 3 introduces the public health programs in Thailand. Section 4 describes the theoretical model, empirical strategy, and data. Section 5 discusses empirical results. The last section discusses the policy implication and concludes the paper.

Thammasat Review of Economic and Social Policy Volume 2, Number 1, January - June 2016
80
2. Literature Review
Demand for medical care in developing countries has received a lot of attention due to the local populations’ limited facility access, higher mortality rates, and insufficient healthcare knowledge. By identifying important factors which influence an individual’s decision in healthcare choices, policy makers can use this information to construct policy that is suitable for the target population.
In previous literature on the demand for healthcare, economic factors such as income and medical services fees show the contradictory effects on the likelihood of healthcare. There appears to be a positive statistically significant income effect on the decision to seek healthcare in urban China (Mocan, Tekin, & Zax, 2004), rural Benin (Bolduc, Lacroix, & Muller, 1996), and outpatient and inpatient services in Iran (Kermani, Ghaderi, & Yousefi, 2008). An increase in income also appears to promote the substitution of private healthcare for public healthcare for Malaria fever treatment in Nigeria (Anyanwu, 2007) and outpatient services in Nigeria (Akin, Guilkey, & Denton, 1995) and Malaysia (Heller, 1982). Chernichovsky and Meesook (1986) state that income has a qualitative effect on healthcare decisions toward more sophisticated practitioners and services in Indonesia. However, some evidence shows that income has insignificant effect on childbirth and delivery decisions in the Philippines (Schwartz, Akin, & Popkin, 1988) and curative healthcare choices in Mozambique (Lindelow, 2005).
Another important economic factor is price, i.e. the medical service fees. Several studies show that introduced fee in public facilities reduced healthcare utilization in Cambodia (Jacobs & Price, 2004), Niger (Meuwissen, 2002), Kenya (Mwabu, Mwanzia, & Liambia, 1995), Papua-New Guinea (Thomason, Mulou, & Bass, 1994), Zambia (Van der Geest, Macwangi, Kamwagna, Mulikelela, Mazimba, &

Thammasat Review of Economic and Social Policy Volume 2, Number 1, January - June 2016
81
Mwangelwa, 2000), rural Ghana (Waddington & Enyimayew, 1990), urban Iran (Kermani et al., 2008), urban Pakistan (Alderman & Gertler, 1989), rural India (Borah, 2006), and Indonesia (Chernichovsky & Meesook, 1986). In addition, other studies find that demand become less price elastic as income rises in the Philippines for child healthcare (Ching, 1995), rural area of Ethiopia (Asfaw, Braun, Klasen, 2004), Kenya (Mwabu, Wangombe, & Nganda, 2003), China (Mocan, et al., 2004), urban Peru (Gertler, Locay, & Sanderson, 1987), and Peru and Cote d’Iviore for both children and adult healthcare (Gertler & van der Gaag, 1990). On the other hand, some evidence support that demand for outpatient and inpatient cares is insensitive to change in price (Heller, 1982; Akin et al., 1986).
There are also non-economic factors that influence healthcare choices, including traveling time, level of education, and the quality of the facilities and medical staff. Longer distances from home to the healthcare providers weaken the demand for healthcare services in Malaysia (Heller, 1982), modern healthcare services in Nigeria (Amaghionyeodiwe, 2008), child curative care in two rural Thanas of Bangladesh (Levin, Rahman, Quayyum, Routh, & Khuda, 2001), and child healthcare in the Philippines (Ching, 1995). However, Borah (2006) confirms that when health status is poor, the distance becomes less significant in adult medical decisions in rural India. Anyanwu (2007) also finds that travel time costs have an insignificant effect on demand for public healthcare in Nigeria.
Level of education is also an important determinant of healthcare decisions. Bolduc et al. (1996) find that having more than primary education increases the probability of seeking care at the hospital in rural Benin. The mother’s education is significant in choice of child delivery method in the Bicol region of the Philippines (Akin, et al., 1986) and

Thammasat Review of Economic and Social Policy Volume 2, Number 1, January - June 2016
82
Turkey (Celik & Hotchkiss, 2000). Lindelow (2005) confirms that the higher levels of education are associated with a fall in the probability of homecare and a rise in the probability of seeking care at a hospital or healthcare facility in Mozambique. Mwabu, Ainsworth, and Nyamete (1995) also suggest that government healthcare facilities are likely to be chosen over self-treatment among patients with more schooling.
Another non-economic factor is the quality of healthcare. This encompasses facilities, doctors, medical staff, operation hours, and availability of drugs as important factors in the choice of healthcare. Existing literature shows that the quality of healthcare has a positive effect on the demand for healthcare in Kenya (Mwabu, Ainsworth, & Nyamete, 1995) and the Cebu region of the Philippines (Schwartz et al., 1988). Akin et al. (1995) state that Nigerian people appear to prefer healthcare facilities with greater over availability of drug choice, better physical conditions, and higher per capita spending on care. The previous literature suggests that both economic and non-economic factors have influence over the demand for healthcare. There are still a limited number of studies on demand for outpatient and inpatient healthcare services in Thailand.
The healthcare choice model is a categorical discrete model. There are several estimation models that are broadly used in previous literature including the multinomial logit model (Akin et al., 1986; Kermani et al., 2008; Lindelow, 2005; Asfaw et al., 2004), the nested multinomial logit model (Gertler et al., 1987; Gertler & van der Gaag, 1990; Levin et al., 2001), the multinomial probit (Akin et al., 1995), and the mixed multinomial logit (Akin, Guilkey, Hutchinson, & McIntosh, 1998; Borah, 2006; Schwartz et al., 1988; Ching, 1995). In my study, I use the multinomial logit model due to the structure and availability of the data.

Thammasat Review of Economic and Social Policy Volume 2, Number 1, January - June 2016
83
3. Public Health Programs in Thailand
Following the public health policy reform in 2001, the Thai public health insurance program now consists of three schemes as shown in Table 1. First, the Civil Servant Medical Benefit Scheme (CSMBS) insures government employees, retirees, and their dependents. CSMBS beneficiaries receive free access to admission and ambulatory services with free choice of providers that are paid by Fee-for-Service (Limwattananon, Tangcharoensathien, & Prakongsai, 2005). CSMBS funding comes from general tax. Second, Social Security Scheme (SSS) insures private sector employees. SSS beneficiaries receive free access to admission and ambulatory services only at registered hospitals that are paid by capitation (Limwattananon et al., 2005). SSS funding comes from mandatory social security taxes on employees and employers, and government contributions. Third, Universal Coverage or the Gold Card plan is for the rest of the population. Universal Coverage or Gold Card plan funding is derived from government tax revenue.
The introduction of Universal Coverage (UC) or Gold Card plan is expected to reduce the barrier to healthcare access and make healthcare more affordable. The Gold Card plan is categorized into two groups. The first group of Gold Card beneficiaries includes elders, children under the age of 12, monks, and disabled persons, who are exempted from a co-payment of 30 Baht per visit. The second group of Gold Card beneficiaries includes the rest of the Thai population, who are required a co-payment of 30 Baht (equivalent to $0.70) per visit at registered healthcare institutions (Suraratdecha, Saitanu, & Tangcharoensathien, 2005). The program covers outpatient and inpatient services at public healthcare centers or district hospitals close to home. Public health centers cater to populations of 1,000 - 5,000 at the sub-district level.

Thammasat Review of Economic and Social Policy Volume 2, Number 1, January - June 2016
84

Thammasat Review of Economic and Social Policy Volume 2, Number 1, January - June 2016
85
Three to five health workers provide basic curative, preventive and health promotion services at public health centers (Tangcharoensathien, Limwattananon, & Prakongsai, 2007). District hospitals cover populations of 10,000 - 50,000 with the number of beds ranging from 10 - 150. At district hospitals with 30 - 60 beds, there are three to five physicians, two to three pharmacists, a dentist, and 20 nurses providing curative, preventive, and health promotion services (Tangcharoensathien et al., 2007). Public health and medical staff usually consist of recent medical graduates who received government funding during their study in medical college. The Universal Coverage or Gold Card plan coverage by capitation rate from 2002 to 2005 is distributed in Table 2.
The distribution of the beneficiaries of these three public health schemes according to household income level using HWS 2006 data is illustrated in Figure 1. The graph indicates that the beneficiaries of the Gold Card plan are mostly in the low income quartile. In addition to analyzing the income effect on choice of healthcare, I investigate whether the availability of health insurance has an impact on an individual’s decision on the choice of healthcare. The following section describes the theoretical model of the study.
Table 2 Capitation rate for Gold Card plan: Baht per
capita from 2002 to 2005 2002 2003 2004 2005
Outpatient 574 574 488 533
Inpatient 303 303 418 435
Prevention and health promotion 175 175 206 210
Accident and Emergency 25 25 20 25
High cost services 32 32 66 99
Pre-hospital care - 10 10 10
Capital replacement 93 83 85 77
Adjusted for remote areas - - 10 7
No fault liability payment - - 5 0
Capitation Baht 1,202 1,202 1,309 1,396

Thammasat Review of Economic and Social Policy Volume 2, Number 1, January - June 2016
86
Source: Tangcharoensathien, Prakongsai, Limwattananon, Patcharanarumoi and Jongudomsuk (2007)
Figure 1 Scheme beneficiaries by household income
quartiles, 2006
Source: NSO Health and Welfare Survey 2006
4. Theoretical, Empirical Strategy and Data
4.1. Theoretical Model
It is assumed that an individual will seek treatment from healthcare providers when he or she experiences the need for medical service by virtue of being ill or pregnant. It is assumed that an individual will choose the healthcare providers that yield him or her maximum expected utility. Based on Mwabu et al. (1995), the direct utility derived by individual i from the choices of treatment by healthcare providers j, conditional upon seeking treatment, is expressed as equation (1)
( , )ij ij ij ij
U U h c= (1)
31.44%
8.65% 6.25%
28.55%
23.24%
10.72%
23.64%
34.46%
25.93%
16.37%
33.65%
57.10%
0%
10%
20%
30%
40%
50%
60%
70%
80%
90%
100%
UC SSS CSMBS
Quartile1 Quartile2 Quartile3 Quartile4

Thammasat Review of Economic and Social Policy Volume 2, Number 1, January - June 2016
87
where ij
U is the direct conditional utility which an individual i
expects from visiting healthcare provider j. ij
h is the expected
health status improvement for individual i after receiving
treatment from healthcare provider j. ij
c is the consumption of
other goods unrelated to healthcare affected by the choice of healthcare j and the related monetary (cash price) and non-monetary (time price) costs of treatment by healthcare provider j.
The expected improvement in health status ij
h is a
function of the choice of healthcare provider (j
Y ) and
conditional upon household and individual characteristics
( iX ). The presentation of this general form is shown by
equation (2). The healthcare choices are different in terms of price, quality, and time needed to access, that may heterogeneously vary for each individual.1 Therefore, an individual will maximize the utility from the choice of healthcare and its consumption, subject to budget constraint (3). Note that the choice of healthcare is the discrete-choice variable, therefore the matrix form between price and choice is an appropriate way to structure the model.
( ( ), | )ij ij ij ij ij ij
U U h Y c X= (2)
PY c M+ = (3)
1 If we assert the healthcare choice as a function of price, the empirical strategy should consider the price as an endogenous variable. The variation of price may come from the direct price of healthcare, government subsidy, insurance coverage, opportunity cost from waiting time and transportation cost.

Thammasat Review of Economic and Social Policy Volume 2, Number 1, January - June 2016
88
Equation (3) represents the budget constraint where M is household income, c is consumption, Y is a vector of healthcare service by a specific provider, and P is a vector of healthcare service price. For simplicity, the price of consumption is normalized to one.
This study attempts to explain the choice of healthcare. The modified reduced form of a system demand equation of healthcare choice is from Akin et al. (1986)2 with the incorporation of health insurance as shown in equation (4). The optimal choice is a function of exogenous price of healthcare and income conditional upon the individual and household characteristics. The following section describes the empirical strategy.
( , ; )ij ij ij i i
Y Y p M X= (4)
4.2. Empirical Strategy
I use the multinomial logit model to estimate healthcare provider choices for outpatient and inpatient services. The choice of healthcare providers includes different levels of public and private providers. When an individual is sick, he or
2 A system of demand equations by Akin et al. (1986) is
( , , , , , , , )j j j j j jij ij pu pr tr pu pr tr j j
Q f p p p t t t Y Z= , where ij
Q is whether
medical service i is used by individual j , p is a vector of facility
level cash prices (visit price, drug cost, and transportation cost) associated with each service, t is a vector of facility level time costs
(waiting time and transportation time) associated with each services,
jY is household income for the individual j .
jZ is a vector of
control variables for individual j . Medical service i includes public
modern, private modern, traditional and no care.

Thammasat Review of Economic and Social Policy Volume 2, Number 1, January - June 2016
89
she faces J healthcare options. The individual must decide which provider to obtain healthcare services from which facility in order to maximize his or her utility in equation (5). The derivation on a multinomial logit is referred from Greene (2003).
Assuming that the individual ith is sick, he or she is faced with J choices. Suppose that his or her utility choice j is shown by (5)
ij i j ijU x β ε′= + (5)
where ix represents the individual, household and
demographic characteristics and the disturbance termij
ε .
If an individual chooses choice j, indicating that ij
U will
provide the maximum utility among the J utilities, then the statistical model is shown by the probability choice j is chosen is illustrate by equation (6).
( )ij ik
prob U U j k> ∀ ≠ (6)
The model operates under the assumption of a distribution
of disturbance. McFadden (1973) has shown that J disturbance has a type I extreme value (Gumbel) distribution if and only if the J disturbance are independent and identically distributed as shown in (7)
( ) exp( )ij
ijF eε
ε−
= − (7)
A multinomial logit model estimates a set of probability
for the J choice for a decision maker with characteristics ix . I
normalized 0 0β = (base outcome). The probability must sum

Thammasat Review of Economic and Social Policy Volume 2, Number 1, January - June 2016
90
up to one, so we only need 1J − parameter to determine the
J probability. The probability of choosing j under a multinomial logit is shown by equation (8). The probability of choosing j when j is zero is illustrated by equation (9).
0
1
( | ) 0, 2,... , 01
j i
k i
x
i i j x
k
eprob Y j x for j J
e
β
ββ
′
′
=
= = = =+∑
(8)
1
1( 0 | )
1 k ii i j x
k
prob Y xe
β ′
=
= =+∑
(9)
Equation (10) shows that the J log-odds ratio can be
computed. When k is zero, then J log-odd ratios is shown by equation (11).
ln ( )ij
i j k
ik
Px
Pβ β
′= −
(10)
lnij
i j
ik
Px
Pβ
′=
(11)
According to the independence of disturbances in equation (5),
it assumed that the odds ratio /j k
P P does not depend on other
choices. However, it is not a practical assumption from a behavior perspective.
To estimate a multinomial logit model, Newton’s numerical algorithm method is used to solve the log-likelihood function. Equation (12) shows the derivation on the log-likelihood for each individual i. If alternative j is chosen,
1ij
d = otherwise 0ij
d = , for 1J − possible outcomes. The

Thammasat Review of Economic and Social Policy Volume 2, Number 1, January - June 2016
91
derivatives of equation (12) have the characteristic form as presented in equation (13).
1 0
ln ln ( )n J
ij i
i j
L d prob Y j= =
= =∑∑ (12)
ln( )ij ij i
ij
Ld P x
β
∂= −
∂∑ (13)
The marginal effects of the characteristics on the probabilities are shown in equation (14).
0
Jj
j j j k k j j
ki
PP P P
xδ β β β β
=
∂ = = − = − ∂
∑ (14)
Therefore, every sub-vector of β enters every marginal
effect, through the probabilities and the weighted average that
shows inj
δ . The estimation of the marginal effect parameters
are used to answer the empirical objective of this study. The following section describes data.
4.3. Data
The data in the empirical analysis is based on Health and Welfare Survey (HWS) 2006. This survey was conducted by the National Statistical Office in Thailand during the period January to July 2006. The sample was geographically stratified to ensure representation at provincial levels. The full sample consists of 74,057 individuals from 22,517 households. The survey contains information on demographic characteristics, economic status, and health information. Due to the construction of survey questionnaires, healthcare expenditure

Thammasat Review of Economic and Social Policy Volume 2, Number 1, January - June 2016
92
is only available on individuals who reported having been sick for outpatient service four weeks prior to the interview and individual who reported for inpatient service 12 months prior to the interview. The analysis consists of two parts, which are outpatient and inpatient services. The outpatient services refer to the 11,690 sub-sample of individuals that reported having been sick in the four weeks prior to the interview.3 The inpatient services refer to the 4,762 sub-sample of individuals that reported receiving inpatient care within the 12 months prior to the interview.4
Approximately 17% of respondents self-reported report being sick for outpatient services within four weeks prior to the interview. In Figure 2, Panel A shows the percentage breakdown of the respondents according to demographics such as monthly household income group, gender, and living area, while Panel B shows types of morbidity. Unlike existing literature which suggest that higher income groups are more likely to self-report, in Panel A of Figure 2 suggests no significant income differences in self-reported information in this sample. However, women and individuals who live in the municipal area are more likely to report being sick. In addition, Panel B of Figure 2 reports types of morbidity. Diseases of the respiratory system show the highest percentage of morbidity as presented in Panel B of Figure 2.
Approximately 6% of respondents self-reported receiving inpatient care services in 12 months prior to the interview. In Figure 3, Panel A shows the percentage breakdown of the
3 Individuals who have negative monthly household income are not included in the sub-sample. In addition, individuals who report seeking care at home, traditional medicines and others are not included in the sub-sample. 4 Individuals who have negative monthly household income are not included in the sub-sample. Individuals who did not report specific type of hospitals are also not included.

Thammasat Review of Economic and Social Policy Volume 2, Number 1, January - June 2016
93
respondents according to demographics such as monthly household income group, gender, living area, while Panel B shows types of morbidity. There are no significant income, gender and living area differences in self-reported information. Conditions related to childbirth, diseases of digestive system, and diseases of the respiratory system constitute a higher percentage of morbidity as shown in Panel B of Figure 3.
The utilization of outpatient and inpatient services likely depends on determinant factors such as income, education and health insurance. Several proxy variables have been used to represent income variable including annual household income (Schwartz et al., 1988), household consumption expenditure (Chernichovsky & Meesook, 1986), per capita household consumption (Lindelow, 2005), household monthly income (Heller, 1982; Ching, 1995; Anyanwu, 2007; Amaghionyeodiwe, 2008), and per capita household income (Akin et al., 1995; Anyanwu, 2007). This empirical study uses household monthly income in the estimation.
The analysis focuses on three types of explanatory variables: individual, household, and hospitals in each province. Among the individual level variables, I use a monthly household income. A monthly household income is a summation of average monthly income, income in kind from rental estimated of free occupied house, unpaid goods and services, unpaid food and beverages, and all other average monthly receipts. I control for individual age, squared of age, head of household education, types of morbidity and types of health insurance. Head of household education is generated as a dummy variable and classified into four groups: (i) head of household with primary schooling, (ii) head of household with lower secondary schooling, (iii) head of household with upper secondary schooling, and (iv) head of household with college level.
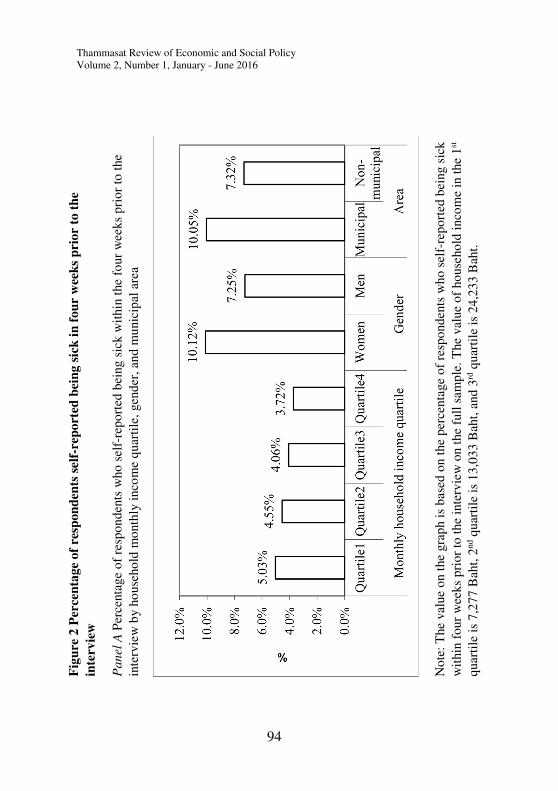
Thammasat Review of Economic and Social Policy Volume 2, Number 1, January - June 2016
94
Fig
ure
2 P
erce
nta
ge
of
resp
on
den
ts s
elf
-rep
ort
ed b
ein
g s
ick
in
fo
ur
wee
ks
pri
or
to t
he
inte
rvie
w
Pa
nel
A P
erce
nta
ge
of
resp
on
den
ts w
ho
sel
f-re
po
rted
bei
ng s
ick w
ithin
the
four
wee
ks
pri
or
to t
he
inte
rvie
w b
y h
ouse
ho
ld m
onth
ly i
nco
me
quar
tile
, gen
der
, an
d m
unic
ipal
are
a
No
te:
The
val
ue
on t
he
gra
ph i
s b
ased
on t
he
per
centa
ge
of
resp
ond
ents
wh
o s
elf-
rep
ort
ed b
eing s
ick
wit
hin
fo
ur
wee
ks
pri
or
to t
he
inte
rvie
w o
n t
he
full
sam
ple
. T
he
val
ue
of
ho
use
ho
ld i
nco
me
in t
he
1st
quar
tile
is
7,2
77
Bah
t, 2
nd q
uar
tile
is
13
,03
3 B
aht,
and
3rd
quar
tile
is
24
,23
3 B
aht.

Thammasat Review of Economic and Social Policy Volume 2, Number 1, January - June 2016
95
Fig
ure
2 P
erce
nta
ge
of
resp
on
den
ts s
elf
-rep
ort
ed b
ein
g s
ick
in
fo
ur
wee
ks
pri
or
to t
he
inte
rvie
w
Pa
nel
B T
yp
es o
f m
orb
idit
y f
rom
ind
ivid
ual
s w
ho
sel
f-re
po
rted
bei
ng s
ick w
ithin
the
four
wee
ks
pri
or
to t
he
inte
rvie
w
So
urc
e: N
SO
Hea
lth a
nd
Wel
fare
Surv
ey (
20
06
)

Thammasat Review of Economic and Social Policy Volume 2, Number 1, January - June 2016
96
Fig
ure
3 P
erce
nta
ge
of
resp
on
den
ts s
elf
-rep
ort
ed r
ecei
vin
g i
np
ati
ent
care
ser
vic
e w
ith
in t
he
12
mo
nth
s
pri
or
to t
he
inte
rvie
w
Pa
nel
A P
erce
nta
ge
of
resp
on
den
ts w
ho
sel
f-re
po
rted
rec
eivin
g i
np
atie
nt
care
ser
vic
es w
ithin
the
12
mo
nth
s p
rio
r
to t
he
inte
rvie
w b
y m
onth
ly h
ouse
ho
ld i
nco
me
quar
tile
, gen
der
, an
d m
un
icip
al a
rea
The
val
ue
on t
he
gra
ph i
s b
ased
on t
he
per
centa
ge
of
resp
on
den
ts w
ho
sel
f-re
po
rted
rec
eivin
g i
np
atie
nt
care
serv
ices
wit
hin
the
12
mo
nth
s p
rio
r to
the
inte
rvie
w o
n t
he
full
sam
ple
. T
he
val
ue
of
ho
use
ho
ld i
nco
me
in t
he
1st
quar
tile
is
7,2
77
Bah
t, 2
nd q
uar
tile
is
13
,03
3 B
aht,
and
3rd
quar
tile
is
24
,23
3 B
aht.

Thammasat Review of Economic and Social Policy Volume 2, Number 1, January - June 2016
97
Fig
ure
3 P
erce
nta
ge
of
resp
on
den
ts s
elf-
rep
ort
ed r
ecei
vin
g i
np
ati
ent
care
ser
vic
e w
ith
in t
he
12
mo
nth
s p
rio
r to
th
e in
terv
iew
Pa
nel
B T
yp
es o
f m
orb
idit
y f
rom
in
div
idual
s w
ho s
elf-
repo
rted
rec
eivin
g i
npat
ient
care
ser
vic
es w
ithin
the
12
mo
nth
s pri
or
to t
he
inte
rvie
w
So
urc
e: N
SO
Hea
lth
an
d W
elfa
re S
urv
ey (
2006)

Thammasat Review of Economic and Social Policy Volume 2, Number 1, January - June 2016
98
Types of morbidity is the symptom self-reported by the patient, which is generated as dummy variable and classified into 12 groups: (i) diseases of the respiratory system, (ii) diseases of the digestive system, (iii) diseases of the urinary system, (iv) cardiovascular diseases, (v) infectious diseases, (vi) diseases of the skin, (vii) allergic conditions, (viii) diseases of the oral cavity, ear, throat, nose, eye, (ix) diseases of female genital organs, (x) conditions related to childbirth, (xi) diseases of the endocrine system, metabolic diseases and nutritional system, and (xii) diseases of the musculoskeletal system and connective tissue. I control for types of morbidity because different symptoms may lead to different decisions on choice of healthcare providers.
Types of health insurance is also generated as dummy variable and classified into four groups: (i) Universal Coverage or Gold Card beneficiary Type I, (ii) Universal Coverage or Gold Card beneficiary Type II, (iii) Other public health insurance beneficiary such as CSMBS and SSS, and (iv) Private health insurance beneficiary. Household demographic variables include family size and living area. Living area consists of region and municipal area. Municipal area indicates urban area in Thailand. I also include information of hospitals in each province including the number of doctors, number of public, and private hospitals in each region.
Table 3 presents the description of explanatory variables and choices of outpatient and inpatient services. Table 4 presents descriptive statistics of explanatory variables and choices of outpatient services as dependent variables. Table 5 presents descriptive statistics of explanatory variables and choices of inpatient services as dependent variables.

Thammasat Review of Economic and Social Policy Volume 2, Number 1, January - June 2016
99
Table 3 List of detailed description of dependent and independent
variables
Variables Description
Dependent variables
(Choice of health care)
Multinomial outcome
Public health centers Visit public health centers within village
District hospital Visit district hospitals or community hospitals
Provincial hospitals, University hospitals and other public hospitals
Visit provincial hospitals, university hospital, or other government hospitals
Clinics Visit clinics- Clinics are small private owned health centers that are spread throughout all regions. Majority of the clinics are owned by doctors.
Private hospital Visit private hospitals
Drugs
Taking drugs without doctor consultation
Independent variables
Northψ Living in the north region
Northeastψ Living in the northeast region
Southψ Living in the south region
Bangkokψ Living in Bangkok
Municipal areaψ Living in the municipal area
Maleψ Gender of individual observation (Male=1, otherwise=0)
Continued on the next page

Thammasat Review of Economic and Social Policy Volume 2, Number 1, January - June 2016
100
Table 3 (continued)
Variables Description
Independent
variables
Widowed, Divorced, and
Separatedψ
Marital status including widowed, divorced, and separated (Individual who reports with widowed, divorced or separated =1, otherwise =0)
Marriedψ Marital status (married =1 , otherwise=0)
Family size Number of family members in the household included servant
Age Age (years)
Age-squared Age squared (years)
Primary
education levelψ
Head of household with primary schooling (between grade one to grade six)
Lower secondary
education levelψ
Head of household with lower secondary schooling (between grade seven to grade nine)
Upper secondary
education levelψ
Head of household with upper secondary schooling (between grade ten to grade twelve)
College levelψ Head of household with college level
Income Monthly household income (Baht) (Summation of all average money income per month, income in kind from rental estimated of free occupied house (include own house), unpaid of goods and services, unpaid food and beverage, and sum of average all other money receipt per month)
Continued on the next page

Thammasat Review of Economic and Social Policy Volume 2, Number 1, January - June 2016
101
Table 3 (continued)
Variables Description
Independent
variables
Gold Card plan
Type Iψ
Gold Card health insurance type I status, refers to Gold Card beneficiaries including elders, children under the age of 12, monks, and a person who is disabled. They are exempted from a co-payment of 30 Baht per visit at eligible public health care provider.
Gold Card plan
Type IIψ
Gold Card health insurance type II status refers to the rest of the population who registered. They are required a co-payment of 30 Baht per visit at eligible public health care provider.
Other public
schemeψ
Other public health insurance status including CSMBS and SSS
Private health
insuranceψ
Private health insurance status
Diseases of the respiratory
systemψ
Dummy variable for individual who reports with diseases in respiratory system (bronchial asthma, bronchitis, coughing, cold, tonsillitis, chest pain, esophagus cancer, lung cancer, pneumonia, pulmonary TB)
Diseases of the digestive
systemψ
Dummy variable for individual who reports with diseases in digestive system (diarrhea, constipation, food poisoning, gastritis, hepatitis, inflammatory bowel disease, appendicitis and others)
Diseases of the
urinary systemψ
Dummy variable for individual who reports with diseases in urinary system (kidney disease, cystitis, kidney cancer and others)
Continued on the next page

Thammasat Review of Economic and Social Policy Volume 2, Number 1, January - June 2016
102
Table 3 (continued)
Variables Description
Independent
variables
Cardiovascular
diseasesψ
Dummy variable for individual who reports with cardiovascular diseases (hypertension, coronary heart disease, and others)
Infectious diseasesψ Dummy variable for individual who reports with infectious diseases (malaria, hemorrhagic fever, measles, chicken pox, diphtheria, whooping cough, herpes simplex, rabies, aids, typhoid, TB, meningitis unspecified, herpes simplex, and others)
Diseases of the
skinψ
Dummy variable for individual who reports with skin diseases (skin disease, athlete’s foot, and others)
Allergic
conditionsψ
Dummy variable for individual who reports with allergic condition (sinusitis, food allergic, and others)
Diseases of the oral cavity, ear, throat,
nose, eyeψ
Dummy variable for individual who reports with diseases of oral cavity, ear, throat, nose, eye (gingivitis, ear infection, glaucoma, eye infection, hemorrhagic conjunctivitis, and others)
Diseases of female
genital organsψ
Dummy variable for individual who reports with diseases of female genital organ
Condition relate to
childbirthψ
Dummy variables for individual who reports with condition relate to child delivery and prenatal care
Continued on the next page

Thammasat Review of Economic and Social Policy Volume 2, Number 1, January - June 2016
103
Table 3 (continued)
Variables Description
Independent variables
Diseases of the endocrine system, metabolic diseases and
nutritional systemψ
Dummy variable for individual who reports with diseases of endocrine system, metabolic diseases and nutritional system (diabetes, goiter, anemia, malnutrition disease and others)
Diseases of the musculoskeletal system and
connective tissueψ
Dummy variable for individual who reports with diseases of musculoskeletal system and connective tissue (backache, arthritis, gout, aching, and others)
Number of public hospitals Number of public hospitals in each province in year 2002
Number of private hospitals Number of private hospitals in each province in year 2002
Total number of hospitals Total number of public and private hospitals in each province in year 2002
Number of doctors Number of doctors in each province in year 2002
Note ψ indicates the binary variable (dummy variable).

Thammasat Review of Economic and Social Policy Volume 2, Number 1, January - June 2016
104

Thammasat Review of Economic and Social Policy Volume 2, Number 1, January - June 2016
105

Thammasat Review of Economic and Social Policy Volume 2, Number 1, January - June 2016
106

Thammasat Review of Economic and Social Policy Volume 2, Number 1, January - June 2016
107

Thammasat Review of Economic and Social Policy Volume 2, Number 1, January - June 2016
108
Table 5 List of descriptive statistics of dependent and independent
variables for inpatient services
Mean
(Standard Deviation)
Variables District
hospitals
Provincial
hospitals,
University
hospitals and
other public
hospitals
Private
hospitals
Total
Independent variables
Northψ 0.2865 (0.4523)
0.2674 (0.4427)
0.2387 (0.4266)
0.2705 (0.4443)
Northeastψ 0.3344 (0.4719)
0.2403 (0.4273)
0.1889 (0.3917)
0.2684 (0.4432)
Southψ 0.1299 (0.3363)
0.1479 (0.3551)
0.1201 (0.3253)
0.1371 (0.3440)
Bangkokψ 0.0011 (0.0334)
0.0306 (0.1724)
0.1215 (0.3269)
0.0325 (0.1775)
Municipal areaψ 0.4437 (0.4969)
0.6127 (0.4872)
0.4275 (0.4951)
0.5577 (0.4967)
Maleψ 0.4075 (0.4915)
0.3982 (0.4896)
0.4275 (0.4951)
0.4059 (0.4911)
Widowed, Divorced,
and Separatedψ
0.1678 (0.3738)
0.1716 (0.3771)
0.1420 (0.3493)
0.1659 (0.3720)
Marriedψ 0.5674 (0.4956)
0.5996 (0.4901)
0.5476 (0.4981)
0.5800 (0.4936)
Family size 3.9326 1.6814
3.9427 (1.8028)
3.8082 (1.7438)
3.9196 (1.7497)
Age 40.9286 (24.3168)
42.4389 (22.7008)
40.0337 (23.2199)
41.5249 (23.4092)
Age-squared 2,266.1290 (2,102.0140)
2,316.1660 (2,010.7320)
2,141.0700 (1,984.8420)
2,272.2020 (2042.3800)
Primary education
levelψ
0.7179 (0.4501)
0.6004 (0.4899)
0.5081 (0.5003)
0.6315 (0.4825)
Lower secondary
education levelψ
0.0803 (0.2718)
0.1077 (0.3100)
0.1229 (0.3287)
0.0995 (0.2994)
Upper secondary
education levelψ
0.0629 (0.2430)
0.0945 (0.2926)
0.1157 (0.3201)
0.0857 (0.2799)
College levelψ
0.0279 (0.1646)
0.1037 (0.3049)
0.1362 (0.3432)
0.0798 (0.2710)
Income 12,728.6000 (12,896.1700)
20,024.6800 (38,260.8600)
35,776.5500 (74,981.3700)
19,535.2600 (40,319.8200)
Gold Card plan
Type Iψ
0.4303 (0.4953)
0.2998 (0.4583)
0.2328 (0.4229)
0.3394 (0.4735)
Gold Card plan
Type IIψ
0.3963 (0.4893)
0.3527 (0.4779)
0.3353 (0.4724)
0.3667 (0.4819)
Continued on the next page

Thammasat Review of Economic and Social Policy Volume 2, Number 1, January - June 2016
109
Table 5 (continued)
Mean
(Standard Deviation)
Variables District
hospitals
Provincial
hospitals,
University
hospitals and
other public
hospitals
Private
hospitals
Total
Diseases of the
respiratory systemψ
0.1460 (0.3532)
0.0867 (0.2814)
0.1318 (0.3385)
0.1155 (0.3197)
Diseases of the
digestive systemψ
0.1962 (0.3972)
0.1654 (0.3716)
0.2459 (0.4309)
0.1886 (0.3912)
Diseases of the
urinary systemψ
0.0390 (0.1937)
0.0473 (0.2123)
0.0439 (0.2051)
0.0437 (0.2044)
Cardiovascular
diseasesψ
0.0953 (0.2937)
0.0932 (0.2908)
0.0835 (0.2768)
0.0926 (0.2899)
Infectious diseasesψ 0.0557 (0.2295)
0.0346 (0.1827)
0.0527 (0.2236)
0.0451 (0.2077)
Diseases of the skinψ 0.0061 (0.0781)
0.0061 (0.0781)
0.0117 (0.1077)
0.0069 (0.0829)
Allergic conditionsψ 0.0173 (0.1303)
0.0127 (0.1119)
0.0219 (0.1467)
0.0157 (0.1245)
Diseases of the oral cavity, ear, throat,
nose, eyeψ
0.0178 (0.1324)
0.0521 (0.2222)
0.0264 (0.1603)
0.0355 (0.1850)
Diseases of female
genital organsψ
0.0151 (0.1218)
0.0354 (0.1849)
0.0307 (0.1728)
0.0271 (0.1624)
Condition relate to
childbirthψ
0.1460 (0.3532)
0.1829 (0.3867)
0.0776 (0.2677)
0.1539 (0.3609)
Diseases of the endocrine system, metabolic diseases and nutritional
systemψ
0.0563
(0.2306)
0.0455
(0.2085)
0.0425
(0.2018)
0.0491
(0.2162)
Diseases of the musculoskeletal system and connective
tissueψ
0.0468
(0.2113)
0.0661
(0.2485)
0.0571
(0.2322)
0.0575
(0.2329)
Number of public hospitals
13.6873 (6.7042)
13.2398 (7.7167)
16.96925 11.48762
13.9433 (8.1224)
Number of private hospitals
2.9721 (4.3146)
5.5719 (14.9498)
14.89898 27.48863
5.9303 (15.4068)
Total number of hospitals
16.8256 (9.4622)
18.9786 (21.0256)
31.92972 37.47274
20.0249 (21.7177)
Number of doctors 16.8255 (9.4622)
324.8280 (1,028.8250)
922.4217 1922.918
347.9372 (1059.3430)
Number of observations
1,794 2,285 683 4,762
ψ is dummy variable

Thammasat Review of Economic and Social Policy Volume 2, Number 1, January - June 2016
110
5. Empirical Results
Table 6 and Table 7 present the results from the estimation of the multinomial logit with two specifications. Specification (1) is that the results do not include health insurance variables. Specification (2) is that the results include health insurance variables as control variables. Table 6 provides estimates of the demand for outpatient services. Table 7 provides estimates of the demand for inpatient services. The full marginal effect estimation outcome results are presented in Appendix A (available in the online version). The coefficient for each variable indicates how a change in these variables affects the probability of choosing a particular type of healthcare provider. The following discussion will highlight the impact of these variables on the demand for healthcare.
5.1. Monthly household income
There is a significant difference on the elasticity between specifications (1) and (2). In specification (1) the demand for all type of healthcare except taking medicine without doctor consultant shows significant income elasticity. The results from specification (2) suggest that by adding health insurance variables as control variables, income elasticity reduces for all healthcare choices. Specification (1) is more likely to have omitted variables bias. The following paragraph is the analysis on income elasticity of demand for outpatient and inpatient services under specification (2).
The results suggest that the income elasticity of demand is negative at the district hospitals for both outpatient and inpatient services. The income elasticities are approximately -0.1259 and -0.1982 for outpatient and inpatient services, respectively, at the district hospitals. This suggests that district hospitals may be an inferior good. As monthly household income increases, there are lower percentages of propensity to

Thammasat Review of Economic and Social Policy Volume 2, Number 1, January - June 2016
111
choose the district hospitals. On the other hand, the income elasticity of demand for other government hospitals and private healthcare providers, including clinics and private hospitals are positive, suggesting a normal good. The income elasticity for outpatient is 0.0994 at public provincial hospitals, university hospitals, and other public hospitals. The income elasticities for outpatient services are 0.1655 and 0.2055 at clinics and private hospitals respectively. The income elasticities for inpatient services are 0.2502 at private hospitals and 0.1037 at public provincial hospitals, university hospitals, and other government hospitals. As monthly household income increases, there are higher percentages of propensity to choose private healthcare providers for outpatient and inpatient services. 5.2. Living in a municipal area
A municipal area can be described as an urban area in Thailand. The result suggests that patients living in a municipal area are less likely to visit public health centers and public district hospitals for outpatient and inpatient services. They are more likely to visit public provincial hospitals, other government hospitals, or private hospitals. The higher propensity to select healthcare providers may due to the accessibility. 5.3. Types of health insurance
Specification (2) includes health insurance variables. There are four health insurance categories: Gold Card plan Type I, Gold Card plan Type II, other public health insurance, and private health insurance. Gold Card Type I and Gold Card Type II beneficiaries appear to have similar propensities in their choice of healthcare providers for outpatient and inpatient services. For outpatient services, Gold Card beneficiaries are

Thammasat Review of Economic and Social Policy Volume 2, Number 1, January - June 2016
112
more likely to visit to public health centers and public district hospitals. For inpatient services, they are more likely to visit district hospitals. Beneficiaries with other public health insurance including CSMBS or SSS are more flexible in their choice of healthcare providers compared to Gold Card beneficiaries. They are more likely to visit provincial hospitals, other government hospitals and private hospitals for outpatient service. Beneficiaries with private health insurance are more likely to visit private hospitals for outpatient and inpatient services. 5.4. Head of household schooling
Head of household schooling is categorized into four groups: (i) head of household with primary schooling, (ii) head of household with lower secondary schooling, (iii) head of household with upper secondary schooling, and (iv) head of household with college level. Under specification (2), the findings suggest that heads of household with at least secondary education level are less likely to visit public health centers for outpatient services. Head of household with college level are more likely to visit provincial hospitals, university hospitals, and other public hospitals. 5.5. Types of morbidity
The most common disease for outpatient services is respiratory diseases. Under specification (2), the findings suggest that patients with respiratory system diseases are more likely take drugs without doctor consultation, visits public health centers, or private clinics for outpatient services. Patients with diseases of the urinary system have positive statistically significant on their propensity to visit public provincial hospitals, university hospitals, or other government hospitals. Patients with allergic conditions have positive

Thammasat Review of Economic and Social Policy Volume 2, Number 1, January - June 2016
113
statistically significant on their propensity to visit private clinics.
For inpatient services, patients with respiratory system diseases are more likely to visit public district hospitals. Patients with diseases of the female genital organs or diseases of the oral cavity, ear, throat, nose or eyes are more likely to visit public provincial hospitals, university hospitals, and other government hospitals. Provincial hospitals, university hospitals or other public hospitals provide more extensive medical facility and staffs with specialized medical skills than public health centers and district hospitals.

Thammasat Review of Economic and Social Policy Volume 2, Number 1, January - June 2016
114

Thammasat Review of Economic and Social Policy Volume 2, Number 1, January - June 2016
115

Thammasat Review of Economic and Social Policy Volume 2, Number 1, January - June 2016
116
6. Conclusion and Policy Implications
This study estimates a demand model with multiple choices for healthcare services using HWS 2006 data from Thailand with information on the number of hospitals and doctors in each province. The alternatives for healthcare services include different levels of public and private healthcare providers. A multinomial logit demand function for outpatient and inpatient services is developed for individuals who demonstrate the need for medical services by virtue of being ill or pregnant. The outpatient service analysis refers to the 11,690 sub-sample of individuals who reported having been sick in the four weeks prior to the interview. The inpatient service analysis refers to the 4,762 sub-sample individuals who reported receiving inpatient care within the 12 months prior to the interview.
The empirical results show that the choice of outpatient and inpatient services can be explained by household socioeconomic characteristics and the availability of health insurance. Demand for healthcare services can be determined by household income. The evidence suggests that income elasticity of demand is different for public and private healthcare providers. The income elasticity of demand indicates that district hospitals are an inferior good for outpatient and inpatient services, while provincial hospitals, university hospitals, other government hospitals, clinics and private hospitals are a normal good. Changes in monthly household income have an impact on the demand for healthcare. District hospitals are generally categorized under the first level of secondary care and provide non-specialized care. As monthly household income increases, there are lower percentages of propensity to choose the district hospitals. The income elasticity coefficient suggests that the majority of patients at district hospitals are from the low income population.

Thammasat Review of Economic and Social Policy Volume 2, Number 1, January - June 2016
117
The availability of health insurance in developing
countries can prevent low income groups from falling into poverty moreover give the poor households’ access to health care (Sidorenko & Butler, 2007). Many developing countries try to promote equity to the healthcare access by providing public health insurance. The introduction of Universal Coverage policy can reduce this barrier. Thailand is an example of a developing country that introduced the Universal Coverage policy known as the Gold Card plan in 2001. This plan aims to extend healthcare coverage to 18.5 million people who were previously uninsured (Towse, Mills, & Tangcharoensathien, 2004). Type of health insurance also influences the patient’s choice of healthcare. Beneficiaries with private health insurance are more likely to visit either clinics or private hospitals for outpatient and inpatient services. CSMBS and SSI provide flexible healthcare provider choices to their beneficiaries. Beneficiaries with either CSMBS or SSS are more likely to visit provincial hospitals, other government hospitals or private healthcare providers for outpatient and inpatient services. Beneficiaries with Universal Coverage or Gold Card plan show a positive propensity to choose public health centers for outpatient services and district hospitals for inpatient services.
Analyzing income elasticity of demand for each healthcare option can help the policy maker to improve existing policies such as Universal Coverage or Gold Card plan. From the policy perspective, Universal Coverage or Gold Card plan should be designed for segments of population below a certain income level. The government can use funds that made available by the decreased number of Universal Coverage or Gold Card beneficiaries to raise the capitation rate or hire additional medical staff at district hospitals. With a higher capitation rate, the policy maker can either provide

Thammasat Review of Economic and Social Policy Volume 2, Number 1, January - June 2016
118
more flexible healthcare options which may reduce the referral process and transportation costs among Universal Coverage beneficiaries. Another possible option is improving the prevention and promotional care program, which can encourage Universal Coverage beneficiaries to have more knowledge on how to prevent common diseases for their family. The government can increase spending on the supply side by hiring additional medical staff in district hospitals. This can reduce the waiting time and improve working conditions for medical staff in the hospital.
The limitation of this study is the price information in the HWS 2006 data. The only information related to medical price is the out-of-pocket healthcare expenses self-reported individuals who were sick or hospitalized. The out-of-pocket healthcare expenditure refers to the price with health insurance subsidization, so the estimation results may not capture the real price effect. Without healthcare prices from healthcare providers, we cannot use other estimation methods such as nested logit or mixed logit that require less restriction on flexible distribution of disturbance assumption.
Acknowledgements
The author thanks Professor Gerard Russo, Professor Sang-Hyop Lee, Professor Timothy Halliday, and Professor Sally Kwak for providing comments at University of Hawaii at Manoa. The author thanks the anonymous referees for useful comments and suggestions. The views expressed in this report, as well as any errors or omissions, are sole responsibility of the author.

Thammasat Review of Economic and Social Policy Volume 2, Number 1, January - June 2016
119
References
Akin, J.S., Griffin, C.C., Guilkey, D.K., & Popkin, B.M. (1986). The demand for primary health care services in the Bicol region of the Philippines. Economic
Development and Cultural Change, 755-781.
Akin, J.S., Guilkey, C.C., & Denton, E.H. (1995). Quality of services and demand for health care in Nigeria: a multinomial probit estimation. Social Science and
Medicine, 40(11), 1527-1537.
Akin, J.S., Guilkey, C.C., Hutchinson, P.L., & McIntosh, M.T. (1998). Price elasticities of demand for curative health care with control for sample selectivity on endogenous illness: an analysis for Sri Lanka. Economics of Health
Care Systems, 7, 509-531.
Alderman, H. & Gertler, P. (1989). The substitutability of public and private health care for the treatment of children in Pakistan. LSMS Working paper Number 57.
Amaghionyeodiwe, L.A. (2008). Determinants of the choice of health care provider in Nigeria. Health Care Manage
Sciences, 11, 215-227.
Anyanwu, J.C. (2007). Demand for health care institutions’ services: evidence from Malaria fever treatment in Nigeria. Journal compilation, 304-334.
Asfaw, A., Braun J., & Klasen S. (2004). How big is the crowding-out effect of user fees in the rural areas of Ethiopia? Implications for equity and resources mobilization. World development, 32(12), 2065-2081.
Bolduc, D., Lacroix, G., & Muller, C. (1996). The choice of medical providers in rural Benin: a comparison of

Thammasat Review of Economic and Social Policy Volume 2, Number 1, January - June 2016
120
discrete choice models. Journal of Health Economics, 15, 477-498.
Borah, B. (2006). A mixed logit model of health care provider choice: analysis of NSS data for rural India. Health
Economics, 15(9), 915-932.
Celik, Y. & Hotchkiss D. (2000). The socio-economic determinants of maternal health care utilization in Turkey. Social Science & Medicine, 50, 1797-1806.
Chernichovsky, D. & Meesook, O.A. (1986). Utilization of health services in Indonesia. Social Science and
Medicine, 23 (6), 611-620.
Ching, P. (1995). User fees, demand for children’s health care and access across income groups: the Philippine case. Social Science and Medicine, 41(1), 37-46.
Gertler, P., Locay, L., & Sanderson, W. (1987). Are user fees regressive?: the welfare implication of health care financing proposals in Peru. Journal of Econometrics, 6, 291-304.
Gertler, P. & Van Der Gaag, J. (1990). The willingness to pay for medical care: evidence from two developing counties. The John Hopkins University Press: Baltimore,
MD.
Green, W.H. (2003). Econometric Analysis. Prentice-Hall: Upper Saddle River, NJ.
Heller, P. (1982). A model of the demand for medical and health services in Peninsular Malaysia. Social Science
and Medicine, 16, 267-284.
Health and Welfare Survey (2006). The National Statistical
Office Thailand

Thammasat Review of Economic and Social Policy Volume 2, Number 1, January - June 2016
121
Jacobs, B., & Price, N. (2004). The impact of the introduction of user fees at a district hospital in Cambodia. Health
Policy and Planning, 19(5), 310-321.
Kermani, M., Ghaderi, H., & Yousefi, A. (2008). Demand for medical in the urban areas of Iran: an empirical investigation. Health Economics, 17, 849-862.
Levin, A., Rahman, M.A., Quayyum, Z., Routh, S., & Khuda, B. (2001). The demand for child curative care in two rural thanas of Bangladesh: effect of income and women’s employment. International Journal of Health
Planning and Management, 16, 179-194.
Lindelow, M. (2005). The utilization of curative healthcare in Mozambique: does income matter? Journal of African
Economies, 14(3), 435-482.
McFadden, D. (1973). Conditional Logit analysis of qualitative choice behavior. In Frontiers in
Econometrics, Zarembka P (ed.). Academic Press, NY.
Meuwissen, L.E. (2002). Problems of cost recovery implementation in district health care: A case study from Niger. Health Policy and Planning, 17(3), 304-313.
Mocan, H.N., Tekin, E., & Zax, J.S. (2004). The demand for medical care in urban China. World Development, 32(2), 289-304.
Mwabu, G., Ainsworth, M., & Nyamete, A. (1995). Quality of Medical Care and Choice of Medical Treatment in Kenya an empirical analysis. Investment in women’s
human capital. University of Chicago Press.
Mwabu, G., Wangombe, J., & Nganda, B. (2003). The demand for medical care in Kenya. African Development Review, 439-453.

Thammasat Review of Economic and Social Policy Volume 2, Number 1, January - June 2016
122
Sidorenko, A. and Butler, J.R.G. 2007. Financing health insurance in Asia Pacific countries. Asian-Pacific
Economic Literature. 21(1). pp. 34-54.
Suraratdecha, C., Saithanu, S. & Tangcharoensathien, V. (2005). Is universal coverage a solution for disparities in health care? Finding from three low-income provinces of Thailand. Health Policy, 73, 272-284.
Schwartz, J., Akin, J., & Popkin, B. (1988). Price and income elasticities of demand for modern health care: the case of infant delivery in the Philippines. The World Bank
Economic Review, 2(1), 49-76.
Tangcharoensathien, V., Limwattananon, S., & Prakongsai, P. (2005). Equity in financing healthcare: impact of universal access to healthcare in Thailand. EQUITAP
Project: Working Paper # 16.
Tangcharoensathien, V., Limwattananon, S., & Prakongsai, P. (2007). Improving health-related information systems to monitor equity in health: lessons from Thailand. The
Economic of Health Equity, 222-246.
Tangcharoensathien, V., Prakongsai, P., Limwattananon, S., Patcharanarumol, W., & Jongudomsuk, P. (2007). Achieving universal coverage in Thailand: what lessons do we learn? A case study commissioned by the Health
Systems Knowledge Network.
Thomason, J., Mulou, N., & Bass, C. (1994). User charges for rural health-services in Papua-New-Guinea. Social
Science & Medicine, 39(8), 1105-1115.
Towse, A., Mills, A., and Tangcharoensathien V. 2004. Learning from Thailand’s health reforms. British
Medical Journal. v328(7431). pp. 103-105.

Thammasat Review of Economic and Social Policy Volume 2, Number 1, January - June 2016
123
Van der Geest, S., Macwan’gi, M., Kamwanga, J., Mulikelela, D., Mazimba, A., & Mwangelwa, M. (2000). User fees and drugs: What did the health reforms in Zambia achieve? Health Policy and Planning, 15(1), 59-65.
Waddington, C. & Enyimayew, K.A. (1990). A price to pay, part 2: the impact of user charges in the Volta region of Ghana. International Journal of Health Planning and
Management, 5, 287-312.

Thammasat Review of Economic and Social Policy Volume 2, Number 1, January - June 2016
124
How can Promoting “Desirable” Elderly
Employment Opportunities Alleviate the
Shortfalls of Thailand’s Ageing Society?*
Euamporn Phijaisanit
Associate Professor Faculty of Economics
Thammasat University Bangkok, Thailand
* This is a modified version of the paper presented at the Academic Symposium 2015 organized by the Faculty of Economics, Thammasat University, Thailand, on 29 October 2015. The author appreciates comments and suggestions from Dr. Thaworn Sakunphanich and anonymous referees.

Thammasat Review of Economic and Social Policy Volume 2, Number 1, January - June 2016
125
ABSTRACT
This research article considers a simulated scenario in which there exists policy infrastructure that promotes employment options to support desirable life after retirement with fiscal sustainability. Two proposed “demo” policy tools, among many others, include (1) legislative flexibility in employment and (2) tax incentives for employers. These measures aim at encouraging employment structure with working conditions favorable for elderly workers. The results of the simulation imply that, given suitable working conditions, a minimum of 50% of the potential elderly workforce participating in the market can yield marginal annual income of approximately 44,268 - 165,295 Baht per elderly worker and approximately 4.74 - 9.35% GDP increase from the baseline GDP growth with ageing population structure. Moreover, the estimated possible minimum marginal net tax revenue is approximately 33,279- 65,994 million Baht. This marginal government revenue, if allocated to old-age expenditure, amounts to approximately 4,000 Baht per elderly per year. The proposed scenario with policy infrastructure that encourages elderly labor participation in the economy constitutes a self-funded model with fiscal sustainability and represents a win-win scenario. Nevertheless, the success of implementing such policy tools depends on the understanding, co-operation and synchronization among the Thai public institutions as well as all parts of the society. Keywords: ageing society, policies for old-age employment options, fiscal sustainability JEL Classification: H53, H55, C53

Thammasat Review of Economic and Social Policy Volume 2, Number 1, January - June 2016
126
1. Introduction
The question that sparks this research paper relates to how Thailand’s ageing society can be structured to become a desirable one. In the first instance, a desirable ageing society that one can imagine can be a society in which both the elderly and working population are happy, and there is fiscal sustainability to support their living at least at the subsistence level. Nevertheless, the value of subsistence level varies considerably from person to person; ranging from a level of “just enough” at 5,000 baht per month (Tankulrat, 2015a)1 and 6,000 baht per month (Hempornwisan & Akarachanon, 2014) for the Thai formal labor force to a “sufficient” level at 16,000 baht per month for Thai civil servants (Tankulrat, 2015b)2.
With that said, what can be done particularly to enable the elderly access this desirable condition? Based on literature in the past, a body of research tries to examine the trend, sustainability and management of the pension funds, the old age funds, and the other forms of old age allowances, which pressed for the need to increase saving for retirement at national as well as local levels. Other studies analyzed the extension of working tenure under the existing structure of society, culture and law. The recommendations from both groups of research are restricted to specific context in practice. As for the first group, policy implications encounter limitations regarding budget constraint and fiscal space. It is widely accepted that with limited budget and other governmental expenditures that lack flexibility, it is difficult to achieve efficient distribution of sufficient amount of money or create a desirable condition for the elderly. For the second
1 The article refers to the research “Adequate Minimum Lump sum for retirement”, Chulalongkorn University 2 The article refers to the study by Thailand’s Government Pension Fund.

Thammasat Review of Economic and Social Policy Volume 2, Number 1, January - June 2016
127
group, extension of working tenure (or retirement age) in such a way that “requires completion of task unto one’s last breath” may be excruciatingly brutal. This also faces limitations, at least, pertaining to the physical aspect of old age that requires them to continue with their usual task which do not seem to be beneficial for the physical and mental wellbeing of the elderly in the case that it is mandatory for them to work in the same quantity as their younger colleagues. Such stress and time constraint lacks the flexibility for living a desirable elderly life.
As of now, Thai society still lacks policy infrastructure to create an old-age employment option to support a desirable life after retirement, which encourages elderly of all backgrounds and education level to maintain “vigor” in the organization and at the same time, gives them flexibility in living their lives as an elderly. The example of such flexibility includes scheme that requires old age labor to work fewer days per week with work condition that is suitable with their age. As Serge Volkoff, a statistician and ergonomist3 at Centre d’etudes de l’emploi in France, suggested that sustainable work over the life course4 need to have 3 main characteristics namely; (1) the work should be suitable with human’s bodily caliber and adjust with life’s timeline (bio-compatible), (2) the work should encourage development of efficiency that determines working strategy (ergo-compatible) and (3) the work should strengthen balance between working, personal and familial life (socio-compatible) (Fric, 2014). In addition, the by-products are “pocket money” in addition to the existing saving and old-age pension provided by government, sense of dignity that
3 Ergonomics is derived from Greek “ergon” meaning work and “nomos” meaning natural laws, which when combined may be interpreted as law of work. This is a science concerning with adjustment of work conditions to suit the undertaker or a systematic adjustment of work conditions. 4 Life course here implies increase in one’s age or simply retirement.

Thammasat Review of Economic and Social Policy Volume 2, Number 1, January - June 2016
128
they are valuable to society, physical and mental wellbeing as they are required to exert an appropriate level of workload and increased social activity which prevents depression.
This article presents a simulation analysis with concrete policy implications to offer Thai society with alternatives to promote a desirable life after retirement. It is also crucial for all concerned parties to understand different policy choices and their mechanisms in order to create an appropriate employment scheme that is both suitable and beneficial for the physical and mental wellbeing of aged population. This research employs scenario analyzes by using two government “demo” policy tools namely; (1) labor laws and (2) tax incentives to stimulate appropriate employment scheme for the potential population aged 60-79 years, while maintaining the existing level of old age benefits provided by the government. The scope of this research includes analysis of economic growth, income of the elderly labor force and tax revenue accrued to the government based on Thailand’s demographic forecast in 2010 by Office of the National Economic and Social Development Board (NESDB) under medium-variant scenario. Economic parameters in the simulation are set as in the real situation, which varies according to the demographic conditions and average trends in the past. It is important to note that this simulation analysis does not include other social transfers, the macroeconomic multiplier effects that might occur in Thailand, and the effect of new taxes to be levied in the future.
The rest of this article is structured as follow; section 2 discusses statistical information and the conditions of Thai ageing society. Section 3 reviews related literature pertaining to the management of ageing society. Section 4 outlines the conceptual framework, methodology and scope of the research. Section 5 discusses the estimates from the simulation scenarios in which government tools are used to induce

Thammasat Review of Economic and Social Policy Volume 2, Number 1, January - June 2016
129
employment scheme for the potential elderly population aged 60-79 years. Section 6 concludes empirical evidence supporting policy implications that open up choices for the implementation of old age employment scheme for a better quality of life after retirement.
2. Statistical information and conditions of Thai ageing
society
This section discusses specific characteristics and working conditions of the elderly population in Thailand with the aim of supporting the implementation of alternative measures for the employment scheme to be discussed in Section 4. As for the overview, the data from NESDB indicates that population aged over 60 years is on an increasing trend in a significant way; from 11.9% of total population in 2010 to 25.2% in 2030. In other words, one-fourth of total population will be aged population. The main reason for this phenomenon owes to the reduction in fertility rate below a replacement level. At present, it is estimated that on average one woman of childbearing age gives birth to around 1.6 children in her whole life cycle, compared to a rate of 4.9 children 40 years ago. In addition, there is a tendency for the population to live longer. Life expectancy for Thai population has increased continuously and in the next 30 years, it is estimated that life expectancy for male and female will increase to 75.3 and 81.9 years, from the present levels of 71.6 and 78.4 years respectively.
If we specifically examine the demographic structure of Thai aged population, survey report of the older persons in Thailand in 2007 by the National Statistical Office points out that around 34.13% of aged population have an average monthly income of 1,250 Baht or lower, which is below a poverty line in 2007, set at 1,443 Baht per head per month. 83.51% of the aged population have an average monthly

Thammasat Review of Economic and Social Policy Volume 2, Number 1, January - June 2016
130
income of 6,250 Baht or lower, which is close to the sufficient level of 6,000 Baht per person per month. (Hempornwisan & Akarachanon, 2014).
Regarding sufficiency, 42% reported that their income is sufficient at times or insufficient. Table 1 reflects the fact that major portion of income for the elderly come from their children (which is in line with Chawla (2008) and United Nations (2013)) and working. A minor portion comes from pension and old age allowances. However, based on the reduction in potential old-age support ratio, which is the number of population aged 15-59 years to the number of aged population, from 5.08 in 2010 to 4.15 in 2015, together with the population estimate by Office of the National Economic and Social Development Board, the potential old-age support ratio in 2040 will be reduced to 1.71. Hence, the role of income from children as seen in the past will become subdued. Nevertheless, the role of old age allowance is becoming more significant. With no policy restructuring that corresponds with the fiscal conditions, these support measures will encounter limitations imposed by budget constraint.
Table 1. Sources of income for Thai aged population (%
of total aged population)
Sources of income 2007 2011 2014
Working 28.86% 35.10% 33.80%
Pension 4.36% 6.00% 4.80%
Old age allowance 2.79% 11.40% 14.90%
Interest 2.87% 2.60% 3.80%
Spouse 6.09% 3.10% 4.30%
Children 52.27% 40.10% 36.80%
Relatives 2.26% 1.50% 1.40%
Others 0.50% 0.20% 0.20%

Thammasat Review of Economic and Social Policy Volume 2, Number 1, January - June 2016
131
Source: The survey of the older persons in Thailand 2007, The National Statistical Office, Thailand; analysis for 2011 and 2014 from Suwanrada (2015) who referred to Knodel et al. (2013) and Knodel et al. (2015).
As for the working condition for Thai elderly, 2,636,083 elderly workers or 37.55% of total aged population want to work but only 2,509,444 persons or 35.74% of the total aged population are employed. Two main reasons for working owe to the need to earn income for family or personal consumption (56.81%) and maintain good health condition or employability at old age (30.72%). For those who are not working, two main reasons owe to agedness (55.51%) and the need to look after home or family (17.80%). If we consider the physical aspect of the elderly, Table 2 indicates that on average more than 76% of aged people evaluate their health status as moderate to good condition and Table 3 indicates that on average, most elders can see (78%) and hear (85%) clearly. Hence, if we consider the net potential elderly workforce in Thailand, excluding those who are disabled and in long-term care as estimated in Prasitsiriphon et al. (2013), it can be said that this group of workforce has the potential in driving the economy and relieve fiscal constraints in the future.
Table 2. Self-evaluation of health status by the elderly,
distributed in age groups.
Health status Total 60-69
years
70-79
years
80 years
and
above
Good to moderate
75.65% 81.44% 70.05% 58.58%
Bad 24.20% 18.35% 29.88% 41.35%
Cannot evaluate
0.15% 0.21% 0.07% 0.07%

Thammasat Review of Economic and Social Policy Volume 2, Number 1, January - June 2016
132
Source: The survey of the older persons in Thailand, 2007, The National Statistical Office, Thailand
Table 3. Ability to see and hear among the elderly,
distributed in age groups
Total 60-69
years
70-79
years
80
years
and
above
Seeing
Clear without the use of spectacles or lenses
53.57% 60.52% 46.68% 33.60%
Clear with the use of spectacles or lenses
25.34% 26.25% 25.07% 20.69%
Not clear - cannot see 20.89% 13.01% 28.04% 45.66%
Cannot evaluate 0.20% 0.22% 0.21% 0.05%
Hearing
Clear without the use of hearing aid
84.20% 91.48% 78.91% 56.94%
Clear with the use of hearing aid
1.19% 1.07% 1.33% 1.46%
Not clear - cannot hear
14.42% 7.26% 19.57% 41.39%
Cannot evaluate 0.19% 0.19% 0.19% 0.21% Source: The survey of the older persons in Thailand, 2007, The National Statistical Office, Thailand
With regards to working status of the working elderly, 63.19% operate business on their own without employee while 17.22% and 12.74% assist in household enterprise with no compensation and work for private company, respectively. Such employment structure suggests that people who are willing to work after the age of 60 have limited job opportunities, and thereby are compelled to conduct own business. This is in line with the case of self-employment due

Thammasat Review of Economic and Social Policy Volume 2, Number 1, January - June 2016
133
to “necessity” as seen in many other countries because they cannot continue their tenure in formal organization despite the desire to do so (Block & Koellinger, 2009). Moreover, investment of lifetime saving in business while lacking expertise further exposes old-age people to higher level of financial risk. Kilenthong and Rueanthip (2015) observed one fact from Thailand’s Socio-Economic Survey (SES) data during 2005-2012 which indicates that around 78% of business startups by entrepreneurs aged over 50 years are more likely to shut down within 6 years and this particular group who shuts down their business chooses to exit from the labor force altogether. Thus, policy restructuring, that creates more job opportunities for elderly workers so that they have alternatives to work in formal organizations (with a more flexible workload compared to young workers) instead of bearing risk from personal investment, can create financial flexibility for them to a great extent.
Furthermore, if we closely examine the “quality of life” from working or the working condition for Thai seniors based on work hours, Table 4 shows the average number of work hours per week for Thai labor by age group, indicating that active workers in 60-69 years, on average, work for 42 hours per week. In other words, if they work for 8 hours a day, it implies that they need to work 5 hours a week which requires them to live life the same way as they do during their working life. As for labor aged 70-79 years and above 80 years, the number of work hours decreased marginally to 40 and 38 hours per week respectively. However, the inflexibility in the reduction of work hours is significant when compared to the number of work hours for old age workers in other countries like UK (See Table 5). It can be observed that the actual work hours per week for old age workers in UK is between 17-33 hours which is significantly lower when compared to that of Thailand. Nevertheless, from the survey on desired number of

Thammasat Review of Economic and Social Policy Volume 2, Number 1, January - June 2016
134
work hours for old age workers in UK, it was found that senior workers still have the desire to reduce the number of work hours to around 7-21 hours per week. Put it differently, if they work for 7-8 hours a day, they will be working for 2-3 days a week, which would allow them to live life with more flexibility while giving them social space in organization with better physical and mental health. This is in line with the research by Wivatvanit et al. (2008) who found that when old age people engage in activities for supplementary income, they gain more pleasure from having friends of their own age, supporting each other through hard times which make them feel valuable and stay healthy.
Table 4. Number of working hours per week for Thai
labor, by age group Age group Average number of working hours per week
15-50 45.24
51-59 43.89
60-69 42.07
70-79 39.52
80+ 37.83 Source: Labor Force Survey, 2013, The National Statistical Office, Thailand and processed by researcher
Table 5. Number of actual working hours per week and
number of desired working hours per week of labor force
in UK, by age group and working status
Number of
actual working hours
Number of
desired working hours
Age group Employee Employer Employee Employer
50-64 31.60 32.80 20.90 19.30
65-69 22.00 22.80 10.70 8.90
70+ 17.20 19.50 6.90 8.40 Source: Bell and Rutherford (2013) Table 3 and Table 5b, processed from UK Labor Force Survey, 2012 and summarized tabulation by the author

Thammasat Review of Economic and Social Policy Volume 2, Number 1, January - June 2016
135
3. Literature review: Management of ageing society and
policy guidelines in Thailand
In the past, Thailand prepared the 1st National Plan on the Elderly (1982-2001) and the 2nd National Plan (2001-2021), based on the following basic principles namely; (1) creation of security for the elderly, which in turn creates stability for the society, (2) elders are valued, have potential and should be encouraged to contribute to the society, (3) elders have dignity and are capable of living in their own community in an appropriate manner as their age requires, and (4) most elders are not people who lack opportunities or are burden to the society despite the fact that some elderly encounter hardship and need support from society and government for certain period of old-age life (National Board of Promotion and Coordination for the Elderly, 2002).
On account of the preparation of the 2nd National Plan on the Elderly, Jitapunkul and Wivatvanit (2009) observed that the 2nd plan has more impact on society compared to the first because of two main reasons. The first reason is that pushing for the inclusion of old age issue in the constitution creates strong mobilization through political process. The second reason is the response to the request of United Nations in realizing the transition to a society with rising number of old people, which is how the current trend at the international level is used to increase additional awareness at a domestic level. These research suggested creation of an indicator which can be used by Thailand and, at the same time, other countries can learn from Thailand’s experience in choosing the model and management strategy for ageing society in the future. Suwanrada (2015), who cited the result of evaluation plan by Prajuabmoh et al. (2009), found that Thailand’s preparation for ageing society in accordance with the strategy to create quality old age population together with the creation of social security

Thammasat Review of Economic and Social Policy Volume 2, Number 1, January - June 2016
136
system for the elderly has not yet fulfilled the objective set by the indicator. Nevertheless, in the past 5 years, welfare for the elderly has been continuously mobilized through policy at national level. One example is the promotion of saving for old age by the National Saving Fund Act B.E. 2554, which officially came into force on 20th August 2015 (Suwanrada, 2015).
The fact that Thai society is transiting to an ageing one together with problems regarding income structure, opportunities, distribution and saving that have long plagued majority of old age population in the country who still lack subsistence for expenditure at old age has created widespread concerns as old-age dependency ratio has risen. As of now, population estimate by NESDB indicates the ratio to be around 1:4 with tendency to rise further. This phenomenon has created fiscal pressure in the form of old age expenditure, which is increasing with the growing number of old people, and also tax revenue, which is expected to decrease on account of the reduction in taxable incomes and taxable consumption as economic growth tends to slow down with lower number of working population.
Literature in the past made effort to offer guidelines to the contemporary questions; where do we get the money from and how? (Who will pay? How will government get the money?) and how to manage and distribute welfare provision? (Who gets the benefit and how?). Based on how the questions are answered, past literature can be divided into 2 categories. The first emphasized on analyzing the source of finance and method to raise money to be used during old age in terms of efficiency, fiscal impacts and fiscal sustainability in the implementation of various policy alternatives by considering exogenous factors which only focus on inactive current elderly contributions. On the other hand, the second group of literature brought factors that include active current elderly

Thammasat Review of Economic and Social Policy Volume 2, Number 1, January - June 2016
137
contributions, which are endogenous factors within ageing population, into consideration. There have already been studies that examined the feasibility and appropriateness of old-age provisions, change perception about old people, extend age of retirement and provide job opportunities for the elderly at both national and regional level with the aim of generating additional income and complementing physical and mental health for old people who are still capable of working. This can be thought of as a way to augment old age welfare under the existing fiscal pressure.
In the first group of literature, many studies examined various relief schemes to assist the elderly through cooperation with other concerned agencies (Department of Local Administration, 2005; Pukdeeamnut & Likitthammarot, 2014) and also the granting of basic rights for old people in the name of humanity such as old age pension (Suwanrada, 2007), healthcare provision under the national health security for which Sakunpanit (2012) concluded that the fiscal situation for the country can still support the health security system. According to Sakunpanit (2012), if the society believes that the nation health security is in need, an increase in tax imposition and contribution to the national health security is a suitable fiscal restructuring that will offer accessible healthcare provision for all. In addition, there are studies that examined the restructuring and management of pension funds and fiscal sustainability under different systems. Phananiramai (2003) analyzed the development of Thailand’s national health security. Suwanrada (2015) estimated the overall fiscal burden for the government under different pension schemes that have been employed so far and concluded that in 2017, accumulated fiscal burden will be around 266,760 million Baht which will increase to around 473,439 million Baht in 2040 (around 3.69% per annum on average). Moreover, there is also legal obligation in the form of subsidy that may arise in the case that

Thammasat Review of Economic and Social Policy Volume 2, Number 1, January - June 2016
138
the national health security is depleted. This is in line with the analysis by Phijaisanit (2011a) who estimated that the pension fund in the social security system is likely be used up in the year 2039.
On the other hand, the second group of literature which considered active current elderly contributions into account contributed to the modelling and appropriateness of old age employment promotion, development of skills among capable and quality seniors (See Phuangsaichai (2008); Soonthornchawakan & Cintakulchai (2009); Institute for Population and Social Research, Mahidol University. (2010); Sombat et al. (2011); Raksasub et al. (2010) for some examples). Growing number of old age population spawned new policy options that encourage the elderly to support themselves and live optimistically. Some examples are provision of assistive equipment, improvement in the environment and physical wellbeing of old people so that they can move on their own and provision of flexible work hours, etc. (United Nations Population Fund, 2009; Suwanrada & Chandoevwit, 2010).
Developing learning process to support ageing society in the long run is also another important aspect. A study by Advisory council on National Labor Development (2013) tried to point out that promotion of job opportunities for old people is to be considered by all concerned parties namely; employer, employee and the Ministry of Labor. Nevertheless, employment conditions, conditions related to benefits from national health security, potential of workforce and policies by government are factors that contribute to the success of creating job opportunities for the elderly. Thus, policy recommendations are to be classified according to potential and decision regarding various benefits. Moreover, Thailand Development Research Institute (2008) had once recommended that if the extension of retirement age from 60

Thammasat Review of Economic and Social Policy Volume 2, Number 1, January - June 2016
139
to 65 years had been implemented in 2008, expenditure pertaining to pension fund would have been reduced by around 32 billion Baht in the period of 5 years. However, extension of retirement age under the existing work structure without structural reform to create employment options for old workers calls for further argument in the Thai society.
It can, however, be concluded that policy recommendations in both groups of literature are in line with those abroad. Change in the demographic structure caused many countries around the world to enter an ageing society with a low level of fertility rate and higher life expectancy which in turn caused them to face problems regarding insufficient budget and economic slowdown at a macro level. Many measures have been undertaken to increase fiscal stability; for instance, increased tax to generate more revenue for the government, reduction in budget that covers unnecessary expenses, public debt management by limiting the borrowing power within the predetermined public debt ceiling or long-term budget management. Nevertheless, the change in demographic structure surrounding each country is surmounting and these measures, eventually, encounter with many practical limitations which further caused the budget to be insufficient to support all aged population in an appropriate manner. The fact that the number of ageing population is increasing indicates important policy implication that it is necessary to restructure the overall picture of welfare and undertake reforms concerning pension funds (Floden, 2001). Hence, in many countries like OECD (Organization for Economic Co-operation and Development), ageing and employment policies have been linked with the main objective of encouraging “greater labor market participation at an older age” through promoting job opportunities and increased flexibility in terms of employment (OECD, 2006; Sonnet et al., 2014).

Thammasat Review of Economic and Social Policy Volume 2, Number 1, January - June 2016
140
In the past decade, many countries have implemented policies to extend employment tenure and to encourage old workers to continue their tenure. Eichhorst (2011) found that Germany is the country that has succeeded in employing old age workers in the recent decade by eliminating incentive for early retirement, using various strategies to stimulate work participation, increasing skill training and reducing compensation for part-time job as early retirement imposes high cost for Germany’s pension fund (see also Borsch-Supan & Schnabel, 1998; Borsch-Supan & Schnabel, 2010). In Japan, around 34% of the total population, which is around 127.6 million people, is considered as old age population (above 65 years of age) in 2004. Japan had undertaken fiscal and financial reforms concerning old age population by creating balance with the decrease in the number of labor force and population that lives longer makes replacement rate fall from 60% to a minimum ceiling at 50% of salary before retirement. In addition, in 2013, law and regulations were amended which required employers to gradually extend the retirement age to 65 years with employment scheme after retirement (International Longevity Center, 2013). This policy corresponds with the recommendation by Gruber and Wise (2005) who used data from Japan and 11 OECD countries. They found that extension of retirement age by 3 years will help in reducing government expenditure regarding welfare by 27% of total expenditure or around 0.72% of GDP, depending on the adjustment of welfare in accordance with the actuarial calculation.
There are many reasons as to why old people exit labor market; for instance, belief that productivity has fallen with age, relationship between employer and employee, environment and working conditions (Myck, 2015). In many countries, old workers often have the feeling that they are unwanted in an organization, which makes them work from

Thammasat Review of Economic and Social Policy Volume 2, Number 1, January - June 2016
141
day to day (Meadows, 2003). This leads to involuntary resignation and for those who still want to continue working but face unemployment situation owing to work redundancy, they are forced to resign and work independently without other alternative (Block & Koellinger, 2009). The need to work independently is partly due to age discrimination and inflexible labor legislatives as employers do not want to risk hiring old workers with additional expenditure on employee welfare (Adams, 2004; Lahey, 2006). In many countries, there have been pressures to support employment scheme with work nature that is more suitable for old workers (Eurofound, 2012). Many studies such as Hellerstein et al. (1999), Mahlberg et al. (2013) Borsch-Supan and Weiss (2013), and Zwick and Gobel (2013) have shown some empirical evidence that old age does not always bring about lower productivity.
From an overview of literature in Thailand, many useful policy recommendations for ageing society have been made and are in line with those abroad. Majority of Thai society agree with the recommendations. However, there still lacks a research that explicitly presents government “demo” policies and the empirical analysis of the impact which is anticipated to occur as a result of the policies discussed. Such research has to also show the link between the measures implemented and the eventual impacts on the economy in general. Along this line, this article tries to fill the research gap between both groups of literature discussed by implementing two demo tools namely; labor laws and tax incentive, in order to create an employment scheme that is suitable for old workers that is in line with the objective that other research papers in the past have aimed at but have not yet exhibited the impact empirically.

Thammasat Review of Economic and Social Policy Volume 2, Number 1, January - June 2016
142
4. Conceptual framework, methodology and scope of this
research
In this simulated study, old age labor force implies workers aged 60-79 years while working age labor force implies workers aged 15-59 years.
Figure 1. Relational framework of different elements in
the simulation
Source: Author’s illustration
Figure 1 shows the conceptual framework and the
relational framework between different elements in the
simulation, consisting of participation rate ( tγ ) of the potential
elderly labor force which is stimulated by the “demo” measure
(with tλ being the ratio of productivity of old age labor
compared to that of working age labor and tL2 being
population aged 60-79 years that can work), economic growth
( tY∂ ), difference between income and expenditure for old age
( tΩ ), net marginal tax revenue accrued to the government due

Thammasat Review of Economic and Social Policy Volume 2, Number 1, January - June 2016
143
to increase in consumption and (in simulation 2) tax incentive
for employers ( tTR∂ ). In the end, we have the impact on the
welfare of elderly and society in general under sustainable fiscal condition, which is the ultimate goal of various policies.
The conceptual framework is based on the idea of Neoclassical Growth Model using Solow growth model with Cobb-Douglas production function as seen in Equation (1), which is appropriate for our analysis of the impact on economic growth due to changes in factors of production such as changes in capital goods or in the number of labor force for our preliminary analysis in the short run (Solow, 1956). Nonetheless, to consider other dynamics in the long run, the analysis should use Endogenous growth model which is appropriate when one wants to analyze the impact on economic growth as a result of changes in total factor productivity (TFP). Such analysis seeks to examine relationship between factors of production and TFP, which determines productivity per head in the long run. However, the scope of this article does not include TFP in our estimation but can be extended in the future.
αα γλ −+= 1
21 )( ttttt LLKAY (1)
With ttt sYKdK +−=+ )1(1
tY is country’s gross domestic product (GDP)
tA is technology
tK is level of capital
tL1 is economically active persons (EAP) which is
defined as the number of population aged 15-59 years in labor market

Thammasat Review of Economic and Social Policy Volume 2, Number 1, January - June 2016
144
tL2 is the number of potential population aged 60-79
years, excluding disabled and patients requiring long-term care
λ is ratio of productivity of tL2 to that of tL1 as a result
of different workloads
γ is participation rate in labor market by tL2
d is depreciation of capital s is saving
In the simulation, technological growth rate is set at 3.3%
with 352.0=α as in Pholphirul (2005) and 06.0=d as in Bosworth (2005). The estimation period is 2014-2040 with macroeconomic variables and the initial value of K set equal to the actual data provided by NESDB in 2014. Change in the demographic structure depends on the latest population estimate by NESDB in 2010. At glance, the result of evaluation of economic growth according to the model in equation (1) based on the unique characteristics of Thai labor market by adapting the International Labor Organization’s (ILO) Rapid Assessment Protocal (RAP) (Schmitt, 2011) is compared with the estimation of economic growth by IMF (2015) and TDRI in the case of moderate economic growth in Prasitsiriphon et al. (2013), in order to consider the appropriateness of the model in this research (See Figure 2). It can be said that the estimated result from the economic growth model in this research is consistent, with projected value lying in between the estimates forecasted by these two organizations and hence is acceptable for the purpose of our analysis.
The evaluation in the model aims to exhibit empirical impact on the country’s GDP, additional income to the elderly, and the government’s fiscal condition by comparing with the baseline scenario, which is the case where Thailand is transiting to an ageing society without any additional measures. This paper sets all old age welfare initiatives that are

Thammasat Review of Economic and Social Policy Volume 2, Number 1, January - June 2016
145
being currently provided by the government constant. In this regard, we examine whether we can encourage those who can
still work5 in 60-79 age group ( tL2 ), or the potential elderly
labor force, to participate more in the market (which implies a rise inγ ) with different stimulus packages by the government
depending on the scenario of the simulation. The detail of simulation scenarios is as follow:
Simulation 1: Old age welfare provided by the government is set equal to the present package irrespective of whether a person is employed or not. Adjustment with labor legislatives for employers is made to create more flexibility by reducing obligation regarding welfare for old age workers under the condition that the workload for old age workers must be lower than those in the working age. In this simulation, the maximum workload for old age workers is set at 3 working days per week, which has been calculated from the desired work hours for old age workers ranging between 7-21 hours per week (meaning that if one works for 7-8 hours per day, one has to work for 2-3 days per week) as in Bell and Rutherford (2013). The objective of this is to give elders, who decide to continue working, an old age life with flexibility while giving them social space in the organization with better physical and mental health.
5 Potential elderly labor force excludes disabled and patients in need of long-term care based on Prasitsirphon et al. (2013).

Thammasat Review of Economic and Social Policy Volume 2, Number 1, January - June 2016
146
F
igu
re 2
. E
stim
ate
s of
eco
nom
ic g
row
th (
Cu
rren
cy:
Ba
ht)
So
urc
e: I
MF
(2
01
5),
Pra
sits
irip
ho
n e
t al
. (2
01
3)
and
cal
cula
tio
n b
y t
he
auth
or.

Thammasat Review of Economic and Social Policy Volume 2, Number 1, January - June 2016
147
Simulation 2: The labor legislatives are same as in
Simulation 1. In addition, tax incentive for employers who hire old age workers is in place. In this research, employers can use additional expenditure incurred on hiring old age workers in deducting tax at the additional cost reduction of 50% for taxable corporate profit calculation6. For instance, before tax incentive is in place, employers can deduct expenditure incurred on hiring by 1 time. When the aforementioned tax incentive is in place, tax deduction from expenditure incurred on hiring the elderly is by 1.5 times. Consequently, as GDP changes according to the estimation of each period, the model evaluates the impact on the average income of the elderly (
tLw 2 ).
In the case that labor market functions effectively, marginal productivity of labor (MPL) is reflected in the wage rate for labor as in equation (2). Thus, wage rate for the elderly should follow equation (3).
α
α
γλ
γλα
)(
)1(
212 tt
tt
t
t
LL
KA
L
Y
+
−=
∂
∂ (2)
α
γλγλα
+−==
tt
t
ttLtLLL
KAMPw
21
22 )1( (3)
Subsistence level for old age labor can be shown as the difference between income and expenditure as in equation (4).
6 Owing to the fact that the recommendation has not been explicitly implemented in any country, future research can analyze for the optimal cost reduction rate to further the literature in this topic. Nonetheless, the rate of 50% as used in this study is a mere “demo” to depict a concrete scenario.

Thammasat Review of Economic and Social Policy Volume 2, Number 1, January - June 2016
148
ttt EB −=Ω (4)
With
tΩ = difference between all income and expenditure on
average
tE = all expenditures on average
[ ]),,,(),(, 22 ttLttttt LwrfB λγυηζ= , which is all
incomes on average
tζ = pension and other old age allowances
tη = interest from investment or savings before
retirement
tr = interest rate
tυ = income after retirement (for any income earned
from work)
If tζ , tη and tE are kept constant, equation (4) implies
that 0>∂
Ω∂
t
t
γ and if 0≥Ω for majority of the elderly, they are
said to be “beyond” subsistence level (See Figure 1). From the government’s point of view, there will be
marginal tax revenue from an increase in GDP. People’s
income increases as 0>∂
Ω∂
t
t
γ, which caused more tax to be
levied on marginal consumption. Following this, value-added tax (VAT) follow equation (5).
( )VATtVAT tsYfTR ),1(, −= (5)
where

Thammasat Review of Economic and Social Policy Volume 2, Number 1, January - June 2016
149
VATTR = Value Added Tax revenue
tY = GDP
s = saving rate
VATt = VAT rate
and 0>
∂
∂
∂
∂
γt
t
VAT Y
Y
TR.
In Simulation 2, where tax incentive for employers hiring
old age workers is implemented (additional cost reduction for
taxable corporate profit calculation, tρ ), the tax revenue from
corporate tax (CT) should follow equation (6).
( )tCTtCT tYfTR ρ,,= (6)
With
CTTR = revenue from corporate tax
CTt = rate for corporate tax
tρ = additional cost reduction for taxable corporate
profit calculation
From equation (6), it can be found that 0>∂
∂
t
CT
Y
TRand
0<∂
∂
t
CTTR
ρin practice. Government revenue from corporate

Thammasat Review of Economic and Social Policy Volume 2, Number 1, January - June 2016
150
tax tends to be positive 7 because marginal revenue from
corporate profit as a result of economic growth t
CT
Y
TR
∂
∂ is
more likely to be larger than revenue foregone from allowing business enterprises more cost reduction (only for the cost of
hiring old age workers) t
CTTR
ρ∂
∂which is smaller than other
costs in conducting business. Hence, net tax revenue ργ∂∂
∂TRin
the simulation is limited to the outcome of marginal revenue from VAT and the revenue lost from allowing more cost reduction for corporate tax (See equation 7), which is the “potential minimum marginal tax revenue”. This implies the possibility that net marginal tax revenue can be larger than this minimum threshold.
ργργ ∂
∂−
∂
∂
∂
∂=
∂∂
∂ CTt
t
VAT TRY
Y
TRTR (7)
5. The results of simulated scenarios
Statistical synthesis by the National Statistical office in section 2 reported 2,509,444 old age workers or around 35.74% of the total potential old age population in Thailand. This statistic is in accordance with cross-check calculation. This is done by taking the number of total elderly estimated by NESDB and deducting the number of disabled and patients requiring long-term care from Prasitsiriphon et al. (2013) which eventually yields the number of potential elderly labor
7 However, this figure can be negative in theory as well depending on the rate at which cost reduction for taxable corporate profit calculation is set.

Thammasat Review of Economic and Social Policy Volume 2, Number 1, January - June 2016
151
force. If we calculate the number of elderly workers (which is around 2.5 million according to the National Statistical office) as a ratio of potential elderly labor force, the figure comes to around 32% which implies that there are around 32-35% of potential elderly labor force who are working in the economic system but bear the same workload as labor force aged 15- 59 years. If the government can support the elderly labor force who are already in the market to continue working and promote the other 65% of elderly labor force who lack the opportunity or incentive to participate in the market, the government can increase the number of labor force to the fullest.
In the simulation, the elderly still receives basic old age welfare according to what the government is currently giving irrespective of employment status. The structure of labor law is adjusted, reducing the burden regarding welfare benefits for old age workers under the condition that workload of elderly workers must be lower than those in working age. Moreover, the maximum workload for the elderly is set at 3 days per week while working age person work for 5 days per week on average. Hence, in calculating productivity, it is assumed that 1 elderly person is equivalent to 3/5 of working age person. Figure 3 shows the number of potential labor force which varies according to the rate at which elderly workers participate in the labor market. Figure 4 shows the additional number of potential labor force that varies according to the rate at which elderly workers participate in the labor market.
Table 6 shows the impact on GDP as a result of an increase in the number of elderly population in the demographic structure compared with the baseline case where working population is constant. It should be noted that if no measure is undertaken to stimulate elderly labor force to participate in the market, the growth of elderly population will drag down the rate of economic growth.

Thammasat Review of Economic and Social Policy Volume 2, Number 1, January - June 2016
152
Fig
ure
3. E
stim
ate
d n
um
ber
of
eld
erly
lab
or
forc
e, w
hic
h v
ari
es a
ccord
ing t
o t
he
part
icip
ati
on
rate
()
in t
he
lab
or
ma
rket
(U
nit
: n
um
ber
of
work
ing a
ge
lab
or
forc
e
equ
ivale
nt
to 1
eld
erly
lab
or)
S
ourc
e: A
uth
or’
s ca
lcula
tio
n

Thammasat Review of Economic and Social Policy Volume 2, Number 1, January - June 2016
153
Fig
ure
4.
Est
ima
ted
nu
mb
er
of
ad
dit
ion
al
pote
nti
al
lab
or
forc
e, w
hic
h v
ari
es a
cco
rdin
g t
o
the
part
icip
ati
on
rate
of
eld
erly
lab
or
forc
e (U
nit
: P
erce
nta
ge)
S
ourc
e: A
uth
or’
s ca
lcula
tio
n

Thammasat Review of Economic and Social Policy Volume 2, Number 1, January - June 2016
154
Nonetheless, if measures are undertaken to increase participation rate among the elderly labor force, economic growth will be boosted when compared with the baseline case where participation in the market is not stimulated. From Table 7, it can be noted that if, at least, 50% of potential elderly labor force participate in the labor market, GDP can increase by around 4.74-9.35% from the present case where no elderly labor force is employed. Table 6. Estimated impact of ageing society on GDP,
compared to the baseline case with working population
constant at 2014. 2015 2020 2525 2030 2035 2040
Impact of ageing society
-0.32% -2.28% -4.97% -7.95% -10.19% -11.78%
Source: Author’s calculation
Table 7. Estimated increase in the growth of GDP from
that of the baseline case where elderly labor force is not
employed, according to variation in participation rate
among elderly labor force.
2015 2020 2525 2030 2035 2040
DGDP, gamma = 0.50
4.73% 5.88% 7.30% 8.83% 9.91% 10.63
%
DGDP, gamma = 0.75
7.05% 8.75% 10.85
% 13.11
% 14.68
% 15.74
%
DGDP, gamma = 1.00
9.35% 11.58
% 14.34
% 17.30
% 19.35
% 20.73
%
Source: Author’s calculation

Thammasat Review of Economic and Social Policy Volume 2, Number 1, January - June 2016
155
Fig
ure
5.
Est
ima
ted
ad
dit
ion
al
av
erag
e in
com
e fo
r el
der
ly l
ab
or
forc
e w
ho p
art
icip
ate
in
th
e
lab
or
ma
rket
(U
nit
: B
ah
t p
er p
erso
n p
er a
nn
um
)
S
ourc
e: A
uth
or’
s ca
lcula
tio
n

Thammasat Review of Economic and Social Policy Volume 2, Number 1, January - June 2016
156
As for the marginal income for elderly labor force (See Figure 5), if one participates in the labor market, one can earn additional income of 44,268 Baht per person per annum (in the case of minimum wage rate at 300 Baht adjusted according to 3/5 workload of working age person) to 165,294.74 Baht per person per annum (calculated according to equation (3) in the case of perfect market) or around 3,689-13,775 Baht per person per month. In the year 2040, additional income adjusted with inflation will be around 44,496-555,632.77 Baht per person per annum or around 3,708-44,061 Baht per person per month, which varies according to one’s ability and knowledge. This amount is an additional income after retirement, which can uplift the standard of living for the elderly above subsistence level as seen in Figure 1.
In Simulation 1, the increase in GDP growth as a result of stimulating participation in labor market among elderly labor force, coupled with an increase in the marginal income of elderly labor force cause consumption to increase. Fixing revenue from other taxes constant and VAT rate at 7%, revenue from VAT is estimated to increase significantly. Figure 6 shows marginal tax revenue which varies according to the participation rate among elderly labor force in the economy. Table 8 shows an increase from the estimated tax revenue in the case of upward adjustment of the past rates as in Thailand’s Budget in Brief ) Bureau of the Budget, 2004-2014(. If the government can encourage at least 50% of the potential elderly labor force to participate in the market, it will be able to generate marginal VAT revenue around 33,279 - 66,994 million Baht in the present and around 206,294 - 402,326 million Baht in 2040, which implies that marginal VAT revenue increases by about 1.38 – 2.73% from the estimated tax revenue in the present baseline case where no aforementioned incentive is implemented and around 1.57 – 3.06% in 2040.

Thammasat Review of Economic and Social Policy Volume 2, Number 1, January - June 2016
157
Fig
ure
6. E
stim
ate
d m
arg
ina
l V
AT
rev
enu
e w
hic
h v
ari
es a
ccord
ing t
o t
he
pa
rtic
ipati
on
rate
am
on
g e
lderl
y l
ab
or
forc
e (U
nit
: B
ah
t)
S
ourc
e: E
stim
ated
by A
uth
or
wit
h b
asel
ine
case
dat
a fr
om
Th
ail
an
d’s
Bu
dg
et i
n B
rief
(2
004
-20
14
), B
ure
au o
f
the
Bud
get
.

Thammasat Review of Economic and Social Policy Volume 2, Number 1, January - June 2016
158
Table 8. Estimated increase in marginal VAT revenue
from that of the baseline case where participation rate
among elderly labor force is not stimulated, which varies
according to the participation rate among elderly labor
force
2015 2020 2525 2030 2035 2040
gamma =0.50
1.38% 1.51% 1.64% 1.73% 1.68% 1.57%
gamma =0.75
2.06% 2.25% 2.44% 2.56% 2.49% 2.33%
gamma =1.00
2.73% 2.98% 3.23% 3.38% 3.29% 3.06%
Source: Estimated by Author with baseline case data from Thailand’s
Budget in Brief (2004-2014), Bureau of the Budget
In Simulation 2, labor legislative is assumed to be the
same as in Simulation 1, which is reinforced with tax incentive for employers who hire elderly labor force. This research assumes that employers can submit expenses incurred on hiring elderly workers as tax rebate at the additional rate of 50%8 cost reduction for taxable corporate profit calculation. For instance, before this tax incentive is implemented, employers deduct expenses incurred on hiring by 1 time but when the incentive scheme is implemented, employers can use the expenditure incurred on hiring elderly workers as rebate by 1.5 times. Tax rate which is used for the calculation is the effective tax rate (ETR) as employed in Phijaisanit (2011b). From the simulation, it is found that the aforementioned measure partly causes the increase in the marginal revenue from corporate tax to be negative9 (See Figure 7). However,
8 As explained in 7. 9 Only for the calculation of minimum marginal tax revenue in this study. Please see explanations in Equation (6) and (7).

Thammasat Review of Economic and Social Policy Volume 2, Number 1, January - June 2016
159
after considering the net tax revenue from Figure 6 and 7 (as shown in Figure 8), net marginal revenue from both taxes is still positive, which is around 18,061 – 35,322 million Baht in the present and around 177,863 – 345,463 million Baht in 2040.This increase in the marginal tax will eventually lead to a minimum increase in government revenue by around 0.75 – 1.46% in the present and 1.35 – 2.63% in 2040, when compared to the estimated tax revenue in the case of no stimulus measure (See Table 10). The government can use this marginal revenue to support budget for old age welfare, which accounts for around 4,000 Baht per person per annum on average in the present. This estimated figure for the year 2040 is around 22,000 Baht per person per annum on average (See Table 11). This amount of money is likely to play a role in uplifting the quality of life for the elderly, which also have other external impacts discussed in the literature review in section 2 and 3 such as good physical and mental health. And at the same time, the aforementioned mechanism will strengthen the financial and fiscal system which will further sustain the economic system. Nevertheless, this estimation has not included other governmental expenditures that will come along with the growth of the economy. Hence, it should be noted that this is only a potential “minimum” marginal tax revenue gain which fulfills the goal of this research; an endeavor to pioneer an integrated analysis to exhibit the impact empirically. In other words, if we look at the overall system, incentive measures to stimulate the elderly labor force to participate in the labor market is a self-funded model which is fiscally sustainable- a win-win scenario for all.

Thammasat Review of Economic and Social Policy Volume 2, Number 1, January - June 2016
160
Fig
ure
7. E
stim
ate
d m
arg
ina
l re
ven
ue
from
corp
ora
te t
ax (
excl
ud
ing m
arg
inal
reven
ue
fro
m i
ncr
ease
d c
orp
ora
te p
rofi
t), w
hic
h v
ari
es a
cco
rdin
g t
o p
art
icip
ati
on
rate
of
eld
erly
lab
or
forc
e in
th
e m
ark
et. (U
nit
: B
ah
t)
S
ourc
e: A
uth
or’
s ca
lcula
tio
n

Thammasat Review of Economic and Social Policy Volume 2, Number 1, January - June 2016
161
F
igu
re 8
Est
ima
ted
min
imu
m p
ote
nti
al
ma
rgin
al
tax r
even
ue
(VA
T a
nd
corp
ora
te
tax),
wh
ich
vari
es a
ccord
ing
to p
art
icip
ati
on
rate
of
the
eld
erly
lab
or
forc
e in
th
e
ma
rket
. (U
nit
: B
ah
t)
So
urc
e: A
uth
or’
s ca
lcula
tio
n

Thammasat Review of Economic and Social Policy Volume 2, Number 1, January - June 2016
162
Table 10. Estimated rate of increase in the minimum
marginal tax revenue from that of the baseline case where
no measure to stimulate the elderly labor force to
participate in the market is implemented, according to
variation in participation rate
2015 2020 2525 2030 2035 2040
gamma = 0.50
0.75% 0.96% 1.17% 1.34% 1.39% 1.35%
gamma = 0.75
1.11% 1.42% 1.73% 1.98% 2.05% 2.00%
gamma = 1.00
1.46% 1.87% 2.28% 2.60% 2.69% 2.63%
Source: Author’s calculation
Table 11. Estimated average net marginal revenue per
elderly labor force that enters the market.
2015 2020 2525 2030 2035 2040
gamma = 0.50
4,530.80
6,654.88
9,428.98
12,951.89
17,383.09
23,090.25
gamma = 0.75
4,479.84
6,576.57
9,308.10
12,770.20
17,128.91
22,746.75
gamma = 1.00
4,430.41
6,501.12
9,192.55
12,597.96
16,889.28
22,424.09
Source: Author’s calculation
6. Conclusions and further research implications
This research employs 2 “demo” policy tools for consideration; labor legislatives and tax incentive with the aim of creating a more flexible employment structure with more alternatives for elderly labor force in accordance with the policy that other papers in the literature have tried to propose but have not shown the impact empirically through simulated scenarios. If there is no measure to stimulate the elderly labor force to participate in the market, the impact of ageing society

Thammasat Review of Economic and Social Policy Volume 2, Number 1, January - June 2016
163
will deteriorate economic growth. In Simulation 1, with old age employment incentives, economic growth will be boosted when compared with that of the baseline case where there is no stimulus measure. If participation rate among the potential elderly labor force is raised by a minimum of 50%, GDP will grow at the rate of 4.74 – 9.35% compared with that of the baseline case. Regarding marginal income for the elderly participation in the market, an average marginal income of approximately 44,268 Baht to 165,294.74 Baht per person per annum or around 3,689 – 13,775 Baht per person per month can be earned at present, depending on one’s ability and knowledge. This amount of marginal income can be used to support income after retirement. With regards to the tax revenue for the government as a result of economic growth, combined with an increase in income among elderly workers, overall consumption is expected rise. Under the assumption that revenue from other taxes and 7% VAT rate fixed, if the stimulus measure is able to induce participation in the market by a minimum of 50% of the potential elderly labor force, marginal tax revenue for government will increase around 33,279 – 65,994 million Baht, which implies that marginal tax revenue increases by around 1.38 – 2.73% compared with that of the baseline scenario without any stimulus.
In Simulation 2, tax incentive for employers is implemented, which allows cost deduction using expenditures incurred on hiring elderly workers by 1.5 times in taxable corporate profit calculation. With implementation of this incentive scheme, minimum marginal revenue from both taxes (VAT and corporate tax) will be around 18,061 – 35,322 million Baht. This marginal tax revenue will increase the government revenue by a minimum of 0.75 – 1.46% when compared with that in the baseline scenario where no stimulus measure is implemented. The government can use this tax revenue in supporting expenditure related to basic old age

Thammasat Review of Economic and Social Policy Volume 2, Number 1, January - June 2016
164
welfare, which accounts for around an average minimum of 4,000 Baht per person per annum.
It can be preliminarily implied that by implementing the “demo” stimulus measures proposed in this article, the marginal income earned and the additional welfare benefits funded by the marginal tax revenue will play a significant role in the improvement of the quality of the elderly life. In addition, there can be other positive externalities generated from working at old age; for instance, good physical and mental well-being. Concerning fiscal sustainability, the simulated scenarios show that the aforementioned mechanism will strengthen the financial and fiscal system. It is to be noted that the government revenue in this study only reflects the potential “minimum” marginal tax revenue gain. This implies that it is possible for marginal revenue to be higher, taking other taxes into account in the future. Some examples for future research avenues include general equilibrium analysis for the policy discussed in this paper, sectoral analyses, preparation for long-term skills required for ageing society and infrastructure for ageing society. Nevertheless, presenting an overview of an empirical impact of demo measures on the economy achieved the major objective of this research paper. It can be said in general that appropriately stimulating elderly participation in the labor market is healthy, self-funded and fiscally sustainable, which is a win-win scenario for all. However, the success of these policies depends on the cooperation among government organizations and the mechanism that mobilize every sector in the society.

Thammasat Review of Economic and Social Policy Volume 2, Number 1, January - June 2016
165
References
Adams, S. J. (2004). Age discrimination legislation and the employment of older workers. Labour Economics, Vol. 11, No. 2, pp. 219-241.
Advisory Council on National Labor Development (2013). Research Project on the Promotion of Job Opportunities for the Elderly. Office of Permanent Secretary, Ministry of Labor. (in Thai)
Bell, D. N. F. & Rutherford A. C. (2013). Older workers and working time. Discussion Paper No.7546, Forschungsinstitut zur Zunkunft der Arbeit (Institute for the Study of Labor), August.
Block, J. & Koellinger, P. (2009). I can’t get no satisfaction- Necessity entrepreneurship and procedural utility. Kyklos, Issue 62, No. 2, pp. 191-209.
Borsch-Supan, A. & Schnabel, R. (1998). Social security and declining labour force participation in Germany. American Economic Review, Vol 88, No. 2, pp. 173-8.
Borsch-Supan, A. & Schnabel, R. (2010). Early retirement and employment of the young in Germany, In (Eds.) J. Gruber and D. A. Wise Social security and retirement
around the world: The Relationship to Youth
Employment, 147-166. Chicago: University of Chicago Press.
Borsch-Supan, A. & Weiss, M. (2013). Productivity and age: evidence from work teams at the assembly line. MEA Discussion Paper 07148, Munich Center for the Economics of Ageing (MEA), Max Planck Institute for Social Law and Social Policy.

Thammasat Review of Economic and Social Policy Volume 2, Number 1, January - June 2016
166
Bosworth, B. (2005). Economic Growth in Thailand: A Macroeconomic Context. Paper Prepared for a World Bank Project on Investment Climate, Firm Competitiveness and Growth.
Chawla, A. (2008). Macroeconomic aspects of demographic changes and intergenerational transfers in Thailand. Unpublished PhD dissertation, University of Hawaii at Manoa.
Department of Local Administration (2005). Guidelines for Standard Welfare of the Elderly. Bangkok: Department of Local Administration. (in Thai)
Eichhorst, W. (2011). The transition from work to retirement. Discussion Paper No. 5490, Forschungsinstitut zur Zunkunft der Arbeit (Institute for the Study of Labor), February.
Eurofound. (2012). Employment trends and policies for older workers in the recession. Publications Office of the European Union, Luxembourg.
Floden, M. (2001). Ageing populations and strategies for public debt in Europe. The scope and size of the public sector project. Stockholm: SNS (Center for Business and Policy Studies).
Fric, K. (2014). Interview with Serge Volkoff, Foundation
Focus. Sustainable work: Toward Better and longer working lives” Issue 16 (December). Publications Office of the European Union, Luxembourg.
Gruber, J. & Wise, D. A. (2005). Social security programs and retirement around the world: fiscal implications, introduction and summary. NBER Working Paper 11290, Massachusettes: National Bureau of Economic Research, April.

Thammasat Review of Economic and Social Policy Volume 2, Number 1, January - June 2016
167
Hellerstein, J. K., Neumark, D. & Troske, K. R. (1999). Wages, productivity and worker characteristics: evidence from plant-level production functions and wage equations. Journal of Labour Economics, Vol 12, pp. 409-446.
Hempornwisan W. & Akarachanon, P. (2014). Creating Financial Stability After Retirement for Thais. Research Division, The Securities and Exchange Commission. September. (in Thai)
Institute for Population and Social Research, Mahidol University. (2010). Research Project for Optimal Job Promotion for the Elderly in Rural Area. Presented to Office of Permanent Secretary, Ministry of Labor. November. (in Thai)
Kilenthong, W. & Rueanthip K. (2015). Comments on “Intertwining inequality and labor market under the New Normal” by Arayavechkit, T., Manprasert, S. and Pinthong, J. Presented at BOT Symposium 2015. (in Thai)
International Longevity Center. (2013). A Profile of Older
Japanese 2013. Tokyo: International Longevity Center (Japan), March.
Jitapunkul, S. & Wivatvanit, S. (2009). National policies and programs for the ageing population in Thailand. Ageing
International, Vol. 33 No. 1, pp. 62-74.
Knodel, J., Prachuabmoh, V. & Chayocan, N. (2013). The Changing Well-being of Thai Elderly: An update from the 2011 Survey of Older Persons in Thailand. College of Population Studies, Chulalongkorn University and HelpAge International.

Thammasat Review of Economic and Social Policy Volume 2, Number 1, January - June 2016
168
Knodel, J., Teerawichitchainan, B., Prachuabmoh, V. & Pothisiri, W. (2015). The Situation of Thailand’s Older Population: An Update based on the 2014 Survey of Older Persons in Thailand, forthcoming.
Lahey, J. (2006). State age protection laws and the age discrimination in employment act. Working Paper No. w12048. National Bureau of Economic Research.
Mahlberg, B., Freund, I., Cuaresma, J. C. & Prskawetz, A. (2013). Ageing, productivity and wages in Austria. Labour Economics, Vol 22, pp. 5-15.
Meadows, P. (2003). Retirement ages in the UK: A review of the literature, Employment Relations Research Series No. 18, London: Department of Trade and Industry.
Myck, M. (2015). Live longer, working longer: the need for a comprehensive approach to labour market reform in response to demographic changes. European Journal of
Ageing, Vol. 12, No. 1, pp. 3-5.
National Board of Promotion and Coordination for the Elderly (2002). The 2nd National Policy for Old Age (2002-2021). Bangkok: Office of the Prime Minister. (in Thai)
Organisation of Economic Co-operation and Development (2006). Live longer, work longer. OECD Report.
Phananiramai, M. (2003). Creating Income Security for the Elderly in Thailand through National Social Security and Quality of Life for Thais: Reflection of Economic Development and Society. Bangkok: Faculty of Economics, Thammasat University. (in Thai)
Phijaisanit, E. (2011a). Thai Social Security Pension Fund: An Analysis of Sustainability and Inter-generational. Applied Economics Journal, Vol. 18, No. 2 (December), 32-44. (in Thai)
Thammasat Review of Economic and Social Policy Volume 2, Number 1, January - June 2016
169
Phijaisanit, E. (2011b). Tax Treaties in Asia Pacific Economic Integration & Cross-Country Fiscal Implications. Final Report. Office of the Higher Education Commission and The Thai Research Fund. (in Thai)
Pholphirul, P. (2005). Competitiveness, income distribution and growth in Thailand: What does the long-run evidence show? International Relations Program, TDRI, May.
Phuangsaichai, S. (2008). Analysis of the Feasibility of Job Promotion and Income Generation for Seniors in the Pilot Area of Lampang Province: A Case Study of Hangchat District, Lampang. Research Center for Local Economic Development, Faculty of Economics, Chiang Mai University. (in Thai)
Prajuabmoh, V., Chayovan, N., Wongsith, M., Siriboon, S., Bangkaew, B. & Milintangul, C. (2009). Project Report on the Tracking and Evaluation System of the 2nd National Policy for Old Age (2002-2021). College of Population Studies, Chulalongkorn University. (in Thai)
Prasitsiriphon, O., Jeger, F., Tharachompoo, A. & Sakunphanit, T. (2013). Costing model for long-term care system in Thailand. Bangkok: Health System Research Office.
Pukdeeamnut, P. & Likitthammarot P. (2014). The Guideline of Development Social Welfare for Elderly of Katong Sub-District Administrative Organization, Yaha District,Yala Province. Journal of Management Science. Vol.31, No.2, July-December 2014. (in Thai)
Raksasub, S., Kangwanpornsiri, K. & Intarawiset, N. (2010). The Project of Suitable Occupation and Earned Income Opportunities in Accordance with Older Workers. Final

Thammasat Review of Economic and Social Policy Volume 2, Number 1, January - June 2016
170
Report. Faculty of Economics, Institute for Research and Development, Ramkhamhaeng University. (in Thai)
Sakunpanit, T. (2012). Financial Stability of Thai National Health Security System. In Suntorntham, S. et al. (Eds), Thai National Health Security System. 251-262. Bangkok: National Health Security Office. (in Thai)
Schmitt, V. (2011). Overview of the Rapid Assessment Protocol (Costing tool). Assessment National Dialogue No. 2, Bangkok: International Labour Organisation.
Solow, R. M. (1956). A contribution to the theory of economic growth. Quarterly Journal of Economics, Vol. 70, No. 1 (Feb) pp. 65-94.
Sonnet, A., Olsen, H. & Manfredi, T. (2014). Towards more inclusive ageing and employment policies: the lessons from France, The Netherlands, Norway and Switzerland. De Economist, December, Vol 162, pp. 315-339.
Soonthornchawakan N. & Cintakulchai S. (2009). Job Opportunities Creation for the Elderly. Thai Health Promotion Foundation. (in Thai)
Sombat, L., Yodpet, S. & Sakdaporn, T. (2011). Productive Ageing and Socio-Economic Development in Thailand. Final Report. Office of Permanent Secretary, Ministry of Social Development and Human Security. (in Thai)
Suwanrada, W. (2007). Current Situation of Welfare Allowance for the Elderly in Thailand. Final Report. Thailand Research Fund. (in Thai)
Suwanrada, W. (2015). Pension Reform and Fiscal Sustainability. Presented at BOT Symposium 2015. (in Thai)

Thammasat Review of Economic and Social Policy Volume 2, Number 1, January - June 2016
171
Suwanrada,W. & Chandoevwit, W. (2010). Old-age Welfare and National Pension. Bangkok: Kewpie Co. Ltd. (in Thai)
Tankulrat, S. (2015a). Lonesome Elderly’s life saved by 5,000 Baht? Post Today. 1 August 2015. A4. (in Thai)
Tankulrat, S. (2015b). Hasten Reform of Thai Pension System: A Way Out for Ageing Society. Post Today. 24 September 2015. A2. (in Thai)
Thailand Development Research Institute (2008). The Development and Enhancement of Reach of and Access to Basic Social Security of the Elderly: Analysis of the Extension of Working Age and Saving Scheme for Retirement Final Report, Office of Permanent Secretary, Ministry of Labor. (in Thai)
United Nations Population Fund (2009). Impact of Demographic Change in Thailand: Situation and Policy Response. Bangkok. (in Thai)
United Nations, Department of Economic and Social Affairs, Population Division (2013). World population ageing 2013. ST/ESA/SER.A/348.
Wivatvanit, S., Kespichayawattana, J. & Choiejit, R. (2008). Poverty Situation of the Elderly and Management Model to Quality of Life of the Thai Elderly. Final Report. Thailand Research Fund. (in Thai)
Zwick, T. & Gobel, C. (2013). Are personnel measures effective in increasing productivity of old workers? Labour Economics, Vol 22, pp. 80-93.

Thammasat Review of Economic and Social Policy Volume 2, Number 1, January - June 2016
172
Guideline for Contributors
Thammasat Review of Economic and Social Policy (TRESP) is a double-blind peer reviewed journal. To ensure the quality of the publication, all papers submitted for publication will be reviewed by the editorial team and the assigned reviewers. Submission of the manuscript should be sent to TRESP only via email at [email protected]. Authors must provide their full affiliation, postal address, email, telephone and mobile phone numbers. The manuscript must be sent in Microsoft Word file. The manuscript must be written in either British or American-styled English language. However, the style must be consistent throughout the entire paper, without grammatical errors or spelling mistakes. The work must be original, unpublished and not under publication consideration elsewhere. The journal strictly follows zero tolerance policy on plagiarism. The author should acknowledge that, upon the acceptance for publication, the Faculty of Economics, Thammasat University reserves the right to reproduce or distribute the published papers in the hard copy as well as electronic versions. Authors are reminded to adhere to the formatting guideline in www.tresp.econ.tu.ac.th. Failure of conformity may result in a rejection or an unexpected delay in processing the paper.
Review Procedure The review procedure takes a maximum of approximately 12-14 weeks, depending on the review results. The publishing procedure takes approximately 4-6 weeks. The review procedure can be divided into 2 stages:
Stage 1: The received manuscript is forwarded to the editorial team for preliminary screening. There are two possible outcomes during this phase, namely; (i) the manuscript may be sent to the reviewers or (ii) the manuscript may be rejected instantly. The author will be informed of this decision within 4 weeks after the initial submission.
Stage 2: The accepted manuscript is sent for double-blind peer review. At the end of this phase, the manuscript may be: (i) accepted unconditionally, (ii) accepted with minor revision (iii) accepted with major revision and/or required rewriting or (iv) rejected. The author(s) will be informed of the decision within 7 weeks from the day of the initial submission. In case (iii), the author is required to revise the paper according to the conditions specified and resubmit it for reviewing. The paper will, then, be sent to the editorial board for final consideration on publication. The author will be informed of the publication decision within

Thammasat Review of Economic and Social Policy Volume 2, Number 1, January - June 2016
173
3 weeks after the editorial board received the revised version of the manuscript.
Open Access Policy
TRESP is an open access journal, providing free contents to the user or his/her institution. Users are allowed to read, download, distribute, print, and search for the full texts without any prior permission from the author or the publisher. However, appropriate referencing is required upon citation of any work in this journal. The hardcopy of the journal can be requested (upon availability) from Mrs. Darawan Raksuntikul ([email protected]).

Faculty of Economics, Thammasat University
2 Prachan Road, Bangkok 10200
Thailand
Tel +66 2 696 5979
Fax +66 2 696 5987
THAMMASAT REVIEW OF
ECONOMIC AND SOCIAL POLICY www.tresp.econ.tu.ac.th
Volume 2, Number 1, January - June 2016