thalamocortical input onto layer 5 pyramidal neurons...
TRANSCRIPT

METHODS ARTICLEpublished: 12 November 2013doi: 10.3389/fncir.2013.00177
Thalamocortical input onto layer 5 pyramidal neuronsmeasured using quantitative large-scale array tomographyJong-Cheol Rah1,2*, Erhan Bas1†, Jennifer Colonell1, Yuriy Mishchenko3, Bill Karsh1,
Richard D. Fetter1, Eugene W. Myers1†, Dmitri B. Chklovskii1, Karel Svoboda1, Timothy D. Harris1 and
John T. R. Isaac2†
1 Howard Hughes Medical Institute, Janelia Farm Research Campus, Ashburn, VA, USA2 Developmental Synaptic Plasticity Section, National Institute of Neurological Disorders and Stroke, National Institutes of Health, Bethesda, MD, USA3 Department of Engineering, Toros University, Mersin, Turkey
Edited by:
Rodolfo R. Llinas, New YorkUniversity School of Medicine, USA
Reviewed by:
Gordon M. G. Shepherd,Northwestern University, USADavid J. Margolis, RutgersUniversity, USA
*Correspondence:
Jong-Cheol Rah, Janelia FarmResearch Campus, Howard HughesMedical Institute, 19700 Helix Dr.,Ashburn, VA 20147, USAe-mail: [email protected]†Present address:
Erhan Bas, Image Analytics Lab, GEGlobal Research, New York, USA;Eugene W. Myers, Max-PlanckInstitute of Cell Biology & Genetics,Dresden, Germany;John T. R. Isaac, Eli Lilly andCompany, Erl Wood Manor,Windlesham, Surrey, UK
The subcellular locations of synapses on pyramidal neurons strongly influences dendriticintegration and synaptic plasticity. Despite this, there is little quantitative data on spatialdistributions of specific types of synaptic input. Here we use array tomography (AT), ahigh-resolution optical microscopy method, to examine thalamocortical (TC) input ontolayer 5 pyramidal neurons. We first verified the ability of AT to identify synapses usingparallel electron microscopic analysis of TC synapses in layer 4. We then use large-scalearray tomography (LSAT) to measure TC synapse distribution on L5 pyramidal neuronsin a 1.00 × 0.83 × 0.21 mm3 volume of mouse somatosensory cortex. We found thatTC synapses primarily target basal dendrites in layer 5, but also make a considerableinput to proximal apical dendrites in L4, consistent with previous work. Our analysisfurther suggests that TC inputs are biased toward certain branches and, within branches,synapses show significant clustering with an excess of TC synapse nearest neighborswithin 5–15 µm compared to a random distribution. Thus, we show that AT is a sensitiveand quantitative method to map specific types of synaptic input on the dendrites ofentire neurons. We anticipate that this technique will be of wide utility for mappingfunctionally-relevant anatomical connectivity in neural circuits.
Keywords: array tomography, electron microscopy, thalamocortical synapse, dendritic integration, synapse
distribution, barrel cortex, neural circuits
INTRODUCTIONCortical pyramidal neurons receive input via thousands ofsynapses distributed over the entire dendritic tree. The func-tional efficacy of synapses is influenced by their electrotonicdistance from the soma, the presence of local active conduc-tances, biochemical compartmentalization and proximity to co-active synapses at the µm scale (Polsky et al., 2004; Londonand Hausser, 2005; Yasuda et al., 2006; Harvey and Svoboda,2007; Harvey et al., 2008). The subcellular location of synapsesis therefore a critical factor in shaping their functional impact.On thalamo-recipient dendrites in primary sensory cortex, tha-lamocortical input accounts for only a small fraction of thetotal synapses, yet, functionally, the input is strong (Benshalomand White, 1986; Peters and Payne, 1993; Ahmed et al., 1994;Douglas et al., 1995; Alonso et al., 1996; Stratford et al., 1996;Gil et al., 1999; Beierlein et al., 2002; Bruno and Sakmann,2006). The explanation for this anatomical-functional disparity isunclear. One prominent yet largely untested hypothesis (Larkumand Nevian, 2008) is that the dendritic location and clusteringof the input could be an important factor in determining itsstrength.
The current lack of knowledge about the subcellular distribu-tion of synapses is largely due to a lack of appropriate techniques.Calcium imaging can be used to detect active synapses; however,
this approach lacks single synapse resolution and large-scalecapacity (Petreanu et al., 2009; Richardson et al., 2009; Bagnallet al., 2011). Optogenetic approaches lack fine-scale resolution(Petreanu et al., 2009; see, however, Little and Carter, 2012).Another approach uses overexpressed GFP-fusions of interact-ing pre- and post-synaptic proteins such that fluorescence occursonly when they are in very close proximity (“GRASP”) (Feinberget al., 2008; Kim et al., 2012). Although promising, this approachrequires overexpression of synaptic proteins that may affectsynaptic and network function (Scheiffele et al., 2000; Graf et al.,2004). Furthermore, GRASP relies on molecular targeting tosynapses and thus may have to be redeveloped anew for differenttypes of neurons.
The ideal technique requires the necessary sensitivity to reli-ably detect individual synapses and to resolve individual synapses.The method should be applicable to a sufficiently large volumeof tissue to allow reconstruction of entire dendritic trees andneeds to be combined with labeling of specific input. Synapsesare easily resolved using electron microscopy (EM); however,this method is rarely used for reconstruction of very large vol-umes (Bock et al., 2011; Briggman et al., 2011; Takemura et al.,2013) and is not easily compatible with labeling methods whilepreserving ultrastructure. While conventional fluorescence lightmicroscopy allows large-scale imaging and is compatible with
Frontiers in Neural Circuits www.frontiersin.org November 2013 | Volume 7 | Article 177 | 1
NEURAL CIRCUITS

Rah et al. Thalamocortical synapses on L5 neurons
labeling of specific synaptic inputs, its Z-axis (depth) resolution isinsufficient for resolving synapses in tissue (Mishchenko, 2010).
We reasoned that array tomography (AT) has many of thesecritical attributes. AT is a high-resolution, wide-field fluores-cence imaging technique based on repeated imaging of arraysof ultrathin serial sections, followed by computational recon-struction into a three-dimensional volume (Micheva and Smith,2007; Micheva et al., 2010). The use of ultrathin sections enablesisotropic resolution and reliable and repeatable immunostainingof synaptic proteins. Moreover, this technique can be combinedwith the use of molecular-genetic approaches to express fluores-cent reporters in specified neuronal populations enabling labelingof synaptic inputs of specific origin. Finally, sufficiently large vol-umes can be imaged, potentially encompassing entire dendritictrees. It has not yet been determined if AT can reliably resolveindividual synapses.
Here we characterize large-scale AT (LSAT) for mapping spe-cific types of inputs within the dendritic arbors of individualneurons. We focus on TC input onto the dendritic trees of layer(L) 5 pyramidal neurons. We compare AT and EM 3D stacksto quantify the accuracy and reliability of AT synapse detection.We then perform LSAT (1.00 × 0.83 × 0.21 mm3 volume) on ablock of mouse somatosensory cortex and locate TC synapses onthe dendritic trees of a number of L5 pyramidal neurons. Thisdata set suggests that TC input exhibits clustering and dendriticbranch preference, and demonstrates the power and utility of thisapproach.
RESULTSTo study the subcellular distribution of TC synapses onto L5pyramidal neurons in primary somatosensory barrel cortex withLSAT, we labeled pre- and post-synaptic groups of neuronswith different fluorescent proteins (Figure 1A). Post-synapticneurons were labeled in Thy1-YFP (type H) mice in whichcortical L5 neurons sparsely express YFP (Feng et al., 2000).We labeled neurons in the ventral posteriomedial nucleus ofthalamus (VPm), which project to barrel cortex, with adeno-associated virus (AAV) expressing tdTomato. Adult mice werestereotaxically injected with AAV. After ∼4 weeks of expres-sion the brain was fixed by transcardial perfusion. The pri-mary somatosensory cortex was embedded in LR White resin.Serial ultrathin sections (200 nm) were made from the embeddedblock covering a volume of ∼0.2 mm3. Each section was stainedwith an anti-synaptophysin antibody to label pre-synaptic ter-minals, and DsRed and GFP antibodies to enhance the signalfrom the encoded expressed pre- and post-synaptic fluorophores(Figures 1B,C). Sections were then imaged and reconstructedin three dimensions (Figure 1D2). In a separate experimentwe quantified the accuracy and reliability of synapse identi-fication by AT. For this work we focused on L4 because ofthe higher density of TC synapses. L4 neurons were labeledwith GFP using an AAV expressing FLEX-reverse GFP (Atasoyet al., 2008) injected into primary somatosensory cortex of six3-CRE mice (which express CRE recombinase in L4, but notother neocortical layers, Liao and Xu, 2008). AT fluorescencemicroscopy and EM were performed on the same serial sections(Figure 1D1).
LARGE-SCALE ARRAY TOMOGRAPHY (LSAT) OF TC SYNAPSES ON L5PYRAMIDAL NEURONSFor LSAT we prepared 1074 serial ribbon sections (thickness,200 nm) of barrel cortex and immunostained each as above.Imaging was carried out on an automated Zeiss Observer invertedfluorescence microscope using a 100x, 1.45 N.A.objective andcustom autofocussing (see Experimental procedures). Each sec-tion (area, 1.00 × 0.83 mm2) was imaged as a series of 240overlapping tiles for a total of 257,760 images. The imaging timeper tile was ∼5.3 s and to image the entire volume required atotal of ∼877.5 h. The images were aligned in three dimensionsusing custom software and rendered in three-dimensions. Theimaged volume contained the somata of ∼56 labeled pyrami-dal neurons (Figures 2A–D; Supplementary movie 1). We choseeight neurons for manual reconstruction because large partsof their dendritic arbors were contained in the imaged vol-ume (Figure 2E). In some neurons the apical tufts were severed.However, TC inputs from the VPm innervate L1 and L2 onlysparsely (Jensen and Killackey, 1987; Zhang and Deschenes, 1998;Petreanu et al., 2009; Meyer et al., 2010; Oberlaender et al., 2012),suggesting that only a small fraction of TC input was missed.We also observed some enlargements of the TC axons, whichmay be result of overexpression of tdTomato. We identified puta-tive TC synapses on these eight pyramidal neurons by manuallyinspecting the three-color image stacks. We scored YFP-labeledspines (green) touching tdTomato positive TC terminals (red)that were stained for synaptophysin (blue; Figure 3; see Materialsand Methods). We reconstructed 4.7 ± 0.8 mm (mean ± stan-dard deviation) dendrites and counted 328.0 ± 31.2 TC synapsesper neuron (Figure 4).
ACCURACY OF SYNAPSE ASSIGNMENTA critical unresolved question concerns the accuracy and reliabil-ity of AT in assigning synapses to the correct dendrite because ofthe high density of synapses in the cortical neuropil (∼1/µm3).Although theoretical work predicts that AT can detect synapseswith a high degree of accuracy (Mishchenko, 2010), this hasnot been rigorously tested experimentally. Thus, it is currentlyunknown whether AT is a truly quantitative method for synapsesdetection in large volume reconstruction. To address this issue, wedirectly compared synapse detection by AT with detection usingEM on the same sections. We performed this experiment on TCinputs to L4 neurons in barrel cortex because of the higher TCsynapse density in this region. Traditional EM preparation tech-niques quench intrinsic fluorescence of GFP and greatly reduceantigenicity. Therefore we explored the parameter space for con-ditions that can sufficiently preserve intrinsic fluorescence andantigenicity to allow light imaging for AT while still retainingsufficient structure in EM to reliably detect synapses. We foundthat a low concentration of osmium (0.001%) provided enoughstructural preservation for transmission EM while preservingsynaptophysin antigenicity and GFP fluorescence. We comparedthe detection of synaptophysin punctae in this “correlative” EMcondition to L4 barrel cortex sections prepared using a moretraditional EM protocol (Figure 5). There was no difference inthe number of synaptophysin punctae between these conditions.We also compared the number of post-synaptic densities (PSDs)
Frontiers in Neural Circuits www.frontiersin.org November 2013 | Volume 7 | Article 177 | 2

Rah et al. Thalamocortical synapses on L5 neurons
FIGURE 1 | Labeling and imaging thalamocortical synapses on L4 or L5
barrel cortex neurons using array tomography and electron microscopy.
(A1) Low power fluorescence photomicrograph of tdTomato-expressing TCaxons and terminals in a fixed section of barrel cortex prepared from an 5–6month old mouse in which AAV-tdTomato was stereotaxically injected in VPm20–30 days earlier (inset left shows schematic of VPm injection). (A2) Lowpower fluorescence photomicrograph of GFP fluorescence in neurons in L4barrel cortex in a fixed section from adult six3-CRE mouse in whichAAV-FLEX-revGFP virus was injected into L4, 20-30 days earlier. (A3) Low
power fluorescence photomicrograph of GFP fluorescence in L5 pyramidalneurons in fixed section from a 5–6 month old Thy1-YFPh mouse. (B)
Schematic of LR white embedding and ultrathin serial sectioning procedure.(C) Schematic of immunostaining and light imaging of serial sections. (D1)
Schematic of light and electron microscopic imaging on the same sections toassess accuracy of synapse detection and annotation with array tomography(performed on VPm-L4 only). (D2) Reconstructed L5 pyramidal neuron andannotated TC synapses from large-scale array tomography experiment(VPm-L5 only).
detected in the same sections using EM. Although the ability toimage membranes was diminished under the correlative EM con-ditions, PSDs were reliably detected and we consistently foundno difference in the number of PSDs detected in L4 barrel cortexcompared to traditional EM processing. Therefore, our correla-tive EM conditions allowed us to directly quantify the numberof synapses detected both by AT and EM on the same ultrathinsections.
To directly compare synapse detection by AT and EM, weacquired light and electron microscopic images from the same
stacks of serial sections (Figure 6). Since mitochondria areeasily identified in EM and are GFP fluorescence-negative inlight microscopy, we aligned the light and EM images usingthe mitochondria as unambiguous and abundant landmarks(Figures 6A–D). TC synapses in the stacks of images were thenmanually assigned using the light microscopy images. Once com-pleted, the EM images of the same stacks of sections were thenexamined (blind to the light microscopy synapse assignment)and TC synapses assigned using this imaging modality. The com-bined light and EM image stacks were then examined together
Frontiers in Neural Circuits www.frontiersin.org November 2013 | Volume 7 | Article 177 | 3
Rah et al. Thalamocortical synapses on L5 neurons
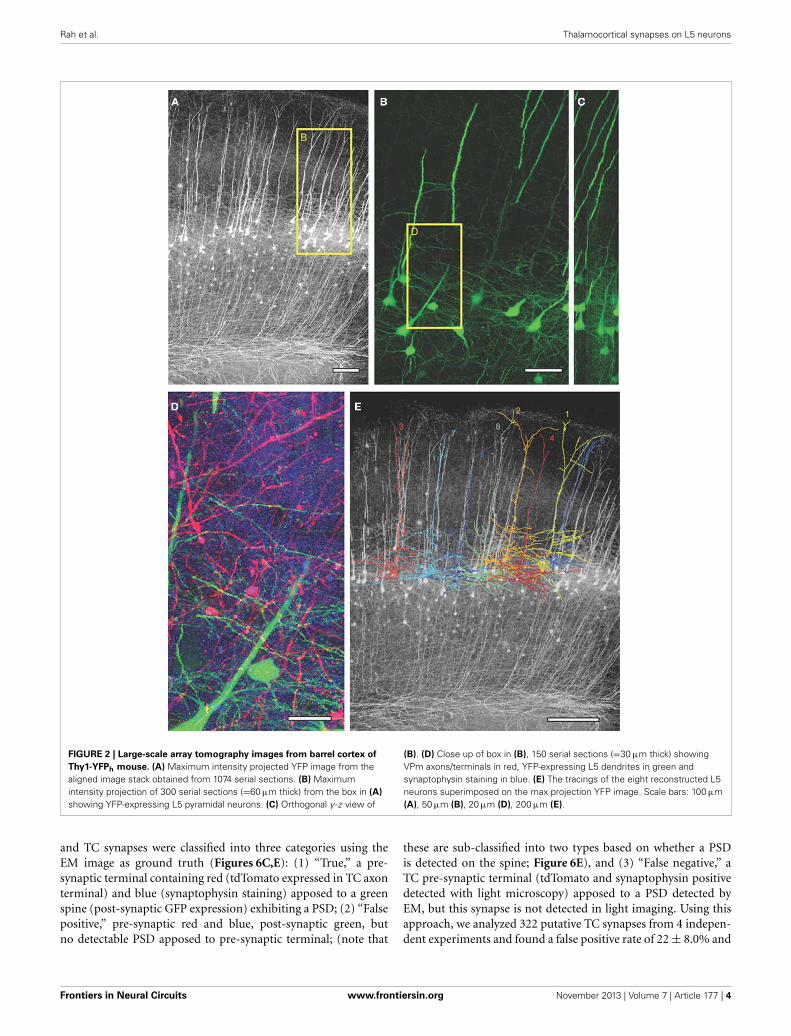
FIGURE 2 | Large-scale array tomography images from barrel cortex of
Thy1-YFPh mouse. (A) Maximum intensity projected YFP image from thealigned image stack obtained from 1074 serial sections. (B) Maximumintensity projection of 300 serial sections (=60 µm thick) from the box in (A)
showing YFP-expressing L5 pyramidal neurons. (C) Orthogonal y -z view of
(B). (D) Close up of box in (B), 150 serial sections (=30 µm thick) showingVPm axons/terminals in red, YFP-expressing L5 dendrites in green andsynaptophysin staining in blue. (E) The tracings of the eight reconstructed L5neurons superimposed on the max projection YFP image. Scale bars: 100 µm(A), 50 µm (B), 20 µm (D), 200 µm (E).
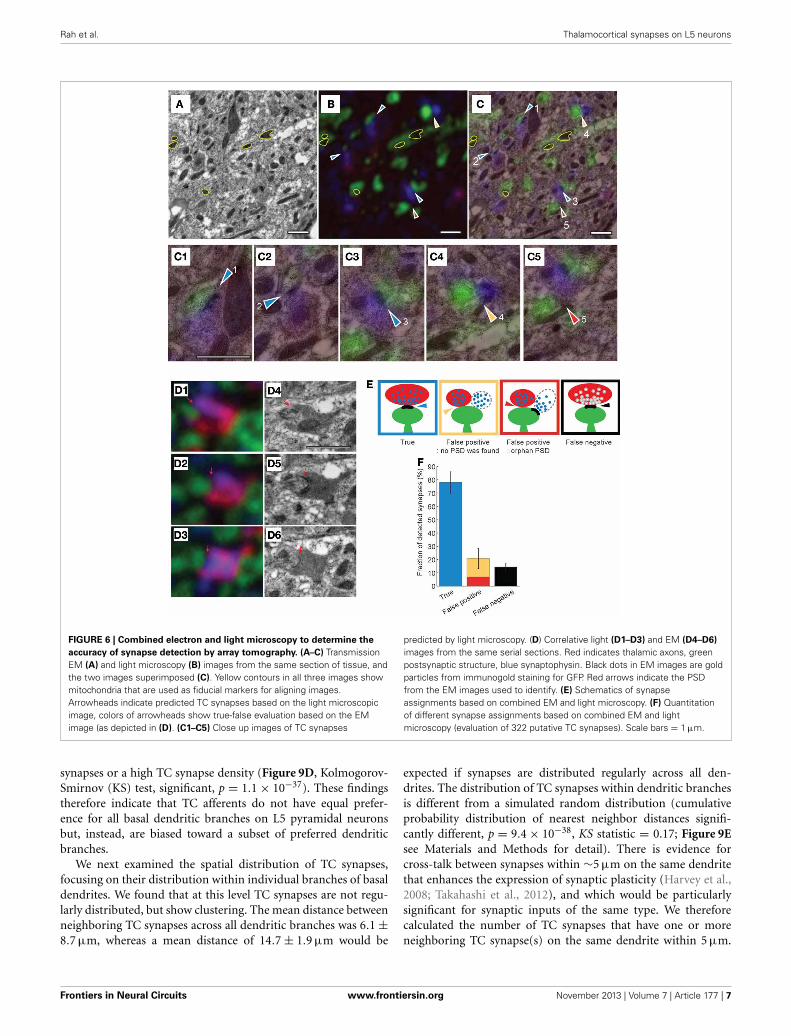
and TC synapses were classified into three categories using theEM image as ground truth (Figures 6C,E): (1) “True,” a pre-synaptic terminal containing red (tdTomato expressed in TC axonterminal) and blue (synaptophysin staining) apposed to a greenspine (post-synaptic GFP expression) exhibiting a PSD; (2) “Falsepositive,” pre-synaptic red and blue, post-synaptic green, butno detectable PSD apposed to pre-synaptic terminal; (note that
these are sub-classified into two types based on whether a PSDis detected on the spine; Figure 6E), and (3) “False negative,” aTC pre-synaptic terminal (tdTomato and synaptophysin positivedetected with light microscopy) apposed to a PSD detected byEM, but this synapse is not detected in light imaging. Using thisapproach, we analyzed 322 putative TC synapses from 4 indepen-dent experiments and found a false positive rate of 22 ± 8.0% and
Frontiers in Neural Circuits www.frontiersin.org November 2013 | Volume 7 | Article 177 | 4
Rah et al. Thalamocortical synapses on L5 neurons
a false negative rate of 14.2 ± 3.1% (Figure 6F). Therefore underour conditions, using AT alone at least 78% of TC synapses arecorrectly identified, and 14% are not detected.
We next compared the experimentally-determined accuracyto that obtained from a simulation of our staining and imag-ing conditions. We first took a stack of EM images that hadbeen segmented (Figure 7A1) (Mishchenko et al., 2010). Thesegmented volume was color coded as red (pre-synaptic struc-ture), green (post-synaptic structure) or white (synaptic contact)
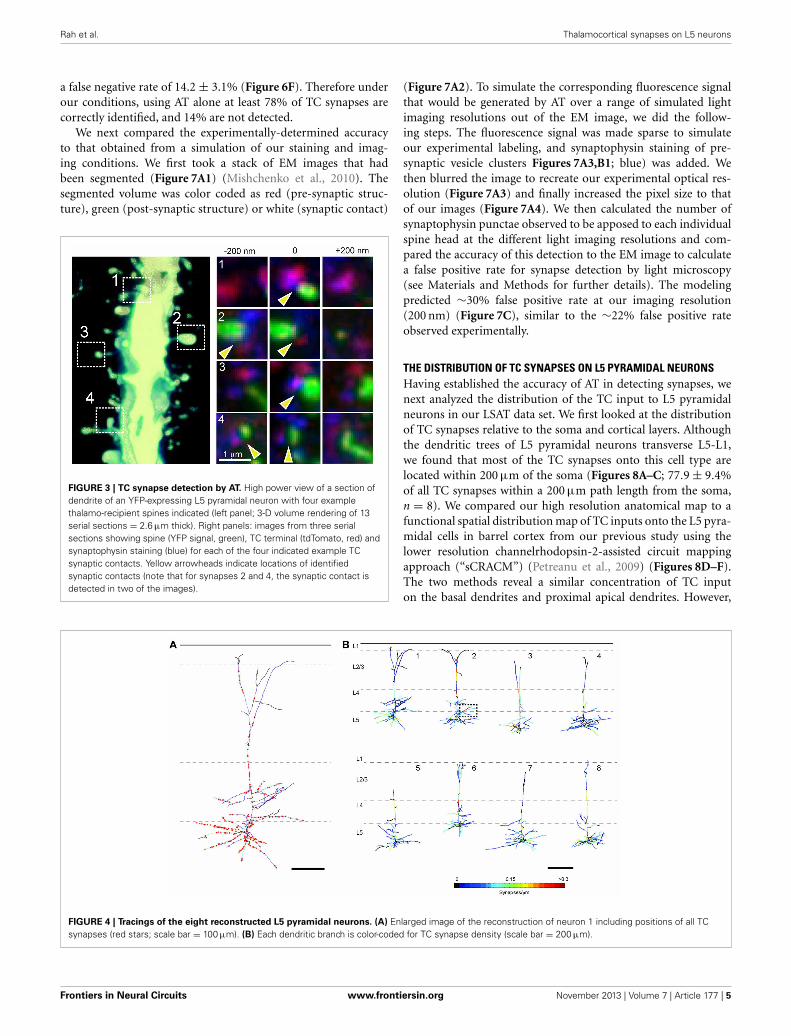
FIGURE 3 | TC synapse detection by AT. High power view of a section ofdendrite of an YFP-expressing L5 pyramidal neuron with four examplethalamo-recipient spines indicated (left panel; 3-D volume rendering of 13serial sections = 2.6 µm thick). Right panels: images from three serialsections showing spine (YFP signal, green), TC terminal (tdTomato, red) andsynaptophysin staining (blue) for each of the four indicated example TCsynaptic contacts. Yellow arrowheads indicate locations of identifiedsynaptic contacts (note that for synapses 2 and 4, the synaptic contact isdetected in two of the images).
(Figure 7A2). To simulate the corresponding fluorescence signalthat would be generated by AT over a range of simulated lightimaging resolutions out of the EM image, we did the follow-ing steps. The fluorescence signal was made sparse to simulateour experimental labeling, and synaptophysin staining of pre-synaptic vesicle clusters Figures 7A3,B1; blue) was added. Wethen blurred the image to recreate our experimental optical res-olution (Figure 7A3) and finally increased the pixel size to thatof our images (Figure 7A4). We then calculated the number ofsynaptophysin punctae observed to be apposed to each individualspine head at the different light imaging resolutions and com-pared the accuracy of this detection to the EM image to calculatea false positive rate for synapse detection by light microscopy(see Materials and Methods for further details). The modelingpredicted ∼30% false positive rate at our imaging resolution(200 nm) (Figure 7C), similar to the ∼22% false positive rateobserved experimentally.
THE DISTRIBUTION OF TC SYNAPSES ON L5 PYRAMIDAL NEURONSHaving established the accuracy of AT in detecting synapses, wenext analyzed the distribution of the TC input to L5 pyramidalneurons in our LSAT data set. We first looked at the distributionof TC synapses relative to the soma and cortical layers. Althoughthe dendritic trees of L5 pyramidal neurons transverse L5-L1,we found that most of the TC synapses onto this cell type arelocated within 200 µm of the soma (Figures 8A–C; 77.9 ± 9.4%of all TC synapses within a 200 µm path length from the soma,n = 8). We compared our high resolution anatomical map to afunctional spatial distribution map of TC inputs onto the L5 pyra-midal cells in barrel cortex from our previous study using thelower resolution channelrhodopsin-2-assisted circuit mappingapproach (“sCRACM”) (Petreanu et al., 2009) (Figures 8D–F).The two methods reveal a similar concentration of TC inputon the basal dendrites and proximal apical dendrites. However,
FIGURE 4 | Tracings of the eight reconstructed L5 pyramidal neurons. (A) Enlarged image of the reconstruction of neuron 1 including positions of all TCsynapses (red stars; scale bar = 100 µm). (B) Each dendritic branch is color-coded for TC synapse density (scale bar = 200 µm).
Frontiers in Neural Circuits www.frontiersin.org November 2013 | Volume 7 | Article 177 | 5

Rah et al. Thalamocortical synapses on L5 neurons
FIGURE 5 | Preparation conditions used for correlative electron
microscopy preserve antigenicity while allowing reliable EM detection
of synapses. (A–C) Comparison of number of synaptophysin-positivepunctae using different fixation protocols. Representative light microscopicimages of synaptophysin immunostaining in sections from brains fixedusing the LSAT protocol (A) and the correlative EM protocol (B).Quantification of synaptophysin-positive punctae in the two conditions (C).
(D–F) Comparison of the number of PSDs detected in EM images underthe two fixation conditions. Representative electron micrographs fromsections from brains fixed using a traditional EM fixation protocol (D) andthe correlative EM fixation protocol (E). Red arrows show identifiedsynapses. Quantifications of number of synapses detected PSD undertraditional EM conditions and from four independently prepared samplesusing the correlative EM conditions (F).
sCRACM shows that the TC input strength on the apical den-drites in L4 and L3 is stronger than would be predicted from theanatomy. This difference suggests that synapse strength and/ordendritic properties are additional contributors to functional TCsynaptic strength in L5 pyramids. For example, there is good evi-dence in cortical pyramidal neurons for synaptic strength changesnormalizing input along dendritic trees and active dendritic prop-erties regulating synaptic integration that could account for theanatomical and functional differences we observe (Magee, 2000).
We next evaluated whether there was preferential targeting ofcertain dendritic branches by TC input. Such clustering of inputon specific dendritic branches has important implications forintegration of synaptic input and synaptic plasticity (Wei, 2001;Ariav et al., 2003; Polsky et al., 2004; Losonczy and Magee, 2006),but has been difficult to evaluate because of a lack of availabletechniques. At a coarse level it was noticeable that L5 cells do notreceive TC input uniformly, with some branches receiving denserinput than others (see Figure 4). To study the uniformity of TCinput we compared the distribution of TC synapses on each neu-ron to simulated random distributions for the same neurons. Onepotential confound in this analysis, however, is differences in lam-inar distributions of TC synapses onto L5 pyramidal neurons.TC inputs from VPm onto L5 pyramidal cells occur primarilywithin L4, L5B, and L6 (Bernardo and Woolsey, 1987; Bureauet al., 2006; Oberlaender et al., 2012) and Figure 4. Therefore, itis possible that any apparent preference of TC synapses towarda subset of dendrites (compared to a random distribution across
the whole dendritic tree) could be due to this layer-specific distri-bution rather than being specific to the TC input per se. Therefore,to control for this, we compared TC input to simulated randominput onto basal dendrites only, which reside primarily within L5(Figure 9B). If all branches have an equal probability of receivingTC input then there will be a very close relationship between den-dritic branch length and TC synapse number. If not then “TC pre-ferring” or “non-preferring” branches (e.g., blue vs. red branchesin Figure 9A) will generate scatter away from the line of unity ina branch length vs. TC synapse number plot. To quantify this, weplotted the number of synapses vs. branch length from the eightreconstructed neurons (Figure 9C, closed circles) and overlaidthat with the confidence interval determined from a simulatedrandom distribution (Figure 9C, dotted lines and shaded area,95% confidence level). 15.0% of dendritic branches were found tohave a synaptic density outside the 95% confidence interval of therandom distribution. This analysis shows that the experimentaldata set contains branches with an excess of TC synapses (abovethe shaded area) and a fraction with a lack of TC synapses (belowshaded area) compared to the random distribution. We also eval-uated preferential dendrite targeting by the TC input by plottingthe normalized histogram for TC synapse density for individualdendritic branches, comparing the simulated data set for ran-domly distributed synapses with the experimental data set. Thisanalysis showed that compared with the randomly distributedsynapses, the experimental data exhibited a larger fraction ofbranches at the extremes of the distribution, i.e., that have no TC
Frontiers in Neural Circuits www.frontiersin.org November 2013 | Volume 7 | Article 177 | 6
Rah et al. Thalamocortical synapses on L5 neurons
FIGURE 6 | Combined electron and light microscopy to determine the
accuracy of synapse detection by array tomography. (A–C) TransmissionEM (A) and light microscopy (B) images from the same section of tissue, andthe two images superimposed (C). Yellow contours in all three images showmitochondria that are used as fiducial markers for aligning images.Arrowheads indicate predicted TC synapses based on the light microscopicimage, colors of arrowheads show true-false evaluation based on the EMimage (as depicted in (D). (C1–C5) Close up images of TC synapses
predicted by light microscopy. (D) Correlative light (D1–D3) and EM (D4–D6)
images from the same serial sections. Red indicates thalamic axons, greenpostsynaptic structure, blue synaptophysin. Black dots in EM images are goldparticles from immunogold staining for GFP. Red arrows indicate the PSDfrom the EM images used to identify. (E) Schematics of synapseassignments based on combined EM and light microscopy. (F) Quantitationof different synapse assignments based on combined EM and lightmicroscopy (evaluation of 322 putative TC synapses). Scale bars = 1 µm.
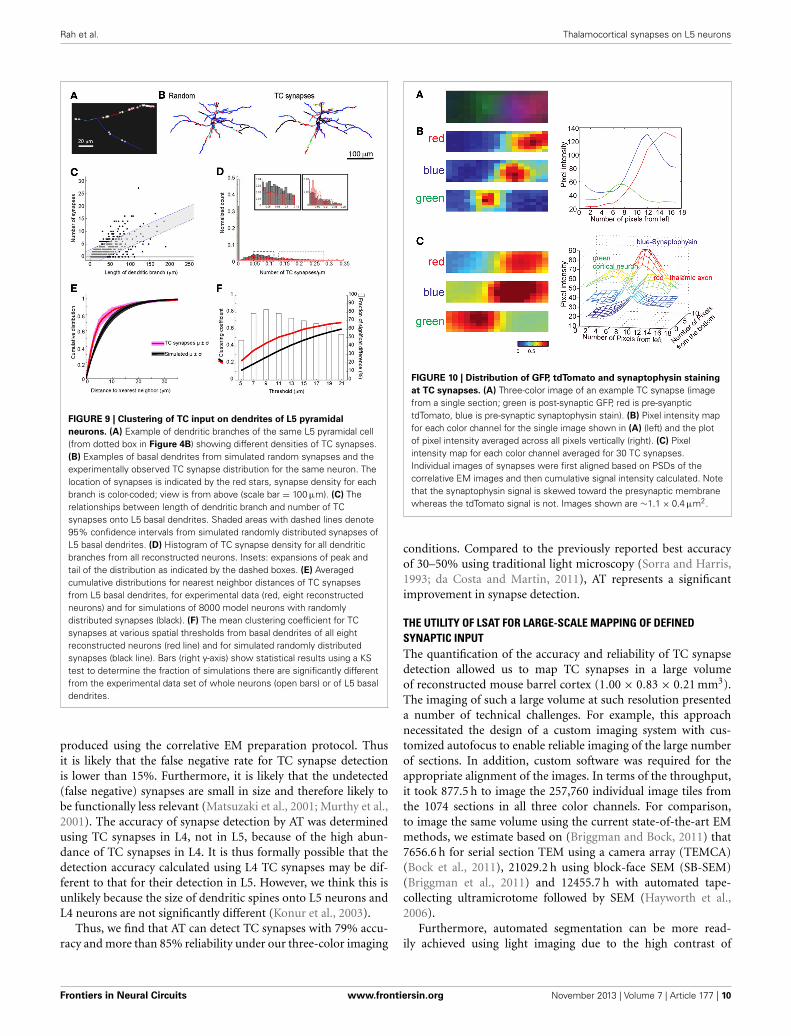
synapses or a high TC synapse density (Figure 9D, Kolmogorov-Smirnov (KS) test, significant, p = 1.1 × 10−37). These findingstherefore indicate that TC afferents do not have equal prefer-ence for all basal dendritic branches on L5 pyramidal neuronsbut, instead, are biased toward a subset of preferred dendriticbranches.
We next examined the spatial distribution of TC synapses,focusing on their distribution within individual branches of basaldendrites. We found that at this level TC synapses are not regu-larly distributed, but show clustering. The mean distance betweenneighboring TC synapses across all dendritic branches was 6.1 ±8.7 µm, whereas a mean distance of 14.7 ± 1.9 µm would be
expected if synapses are distributed regularly across all den-drites. The distribution of TC synapses within dendritic branchesis different from a simulated random distribution (cumulativeprobability distribution of nearest neighbor distances signifi-cantly different, p = 9.4 × 10−38, KS statistic = 0.17; Figure 9Esee Materials and Methods for detail). There is evidence forcross-talk between synapses within ∼5 µm on the same dendritethat enhances the expression of synaptic plasticity (Harvey et al.,2008; Takahashi et al., 2012), and which would be particularlysignificant for synaptic inputs of the same type. We thereforecalculated the number of TC synapses that have one or moreneighboring TC synapse(s) on the same dendrite within 5 µm.
Frontiers in Neural Circuits www.frontiersin.org November 2013 | Volume 7 | Article 177 | 7

Rah et al. Thalamocortical synapses on L5 neurons
FIGURE 7 | Simulation of accuracy of synapse detection by AT. (A)
Simulated AT images using a previously segmented EM image data set[from Mishchenko et al. (2010)]. (A1) an example EM image; (A2) sameimage segmented into pre- and post-synaptic structures; (A3) segmentedimage was blurred to produce the same resolution as in the lightmicroscopy of AT with 90% of structures removed to mimic thesparseness of fluorescent labeling of the AT images; (A4) The pixel size ofA3 was adjusted to produce the same image as in the light microscopy inAT. Red indicates presynaptic structures, green postsynaptic, blue
synaptophysin and red arrowheads indicates a synapse. Scale bar = 1 µm(B) Close-up of a simulated synapse showing postsynaptic structure(green) and simulated synaptophysin staining (blue). Note that thepredicted synaptophysin staining exhibits an increasing intensity gradienttoward the synaptic contact as found experimentally (Figure 10; Scale bar= 0.5 µm). (C) False positive rate in simulations of AT using different lightimaging isotropic spatial resolutions. Black dashed line indicates resolutionof the light imaging in the current study. Blue dotted line is anextrapolation of simulated data to infinite resolution.
We found that 67.7 ± 5.8% of TC synapses have at least oneneighboring TC synapse within 5 µm, whereas a value of 50.0 ±4.3% would be predicted for a random distribution. Thus, theclustering of TC input is predicted to enhance synaptic plastic-ity between TC synapses onto the same dendritic branches inL5 pyramidal neurons. To further quantify the spatial cluster-ing, we compared the clustering coefficient of TC synapses forthe experimental data set and the random distribution acrossa range of distances (see Materials and Methods). This anal-ysis shows that there is a consistently greater degree of clus-tering for the experimental data set at distances of 5–15 µm(Figure 9F).
Together, these analyses demonstrate significant clustering ofTC synapses within branches of basal dendrites of L5 pyramidalneurons, in addition to preferential targeting of certain branchesby the TC input.
DISCUSSIONHere we characterize the use of AT for the high-resolutionanalysis of the distribution of synaptic input from anidentified pre-synaptic source onto an identified populationof post-synaptic neurons. We define the accuracy of synapsedetection by AT using correlative EM imaging of the same serialsections. We go on to quantify the subcellular distribution of
TC inputs onto the dendritic tree of L5 pyramidal neurons inmouse barrel cortex using LSAT. This analysis suggests thatTC input targets specific dendritic branches and further thatwithin branches it is clustered in a manner predicted to enhanceplasticity and integration of TC input to L5.
ACCURACY OF SYNAPSE DETECTION BY ATPrevious work using AT (Micheva and Smith, 2007; Michevaet al., 2010) did not quantify the accuracy or the reliability ofthe technique for synapse detection. A recent theoretical study(Mishchenko, 2010) suggested that an accuracy of up to 80% canbe achieved using AT alone when using staining of two synapticmarkers (pre- and post-synaptic) in addition to labeling of pre-and post-synaptic neurons. To address this issue experimentally,we compared for the first time the accuracy of synapse detec-tion using AT with EM synapse detection on the same serialsections. We show, under our light imaging conditions of 200 nmisotropic resolution with three color labeling of synapses, that weachieve ∼78% accuracy of synapse assignment of TC inputs todendrites of L4 neurons. When we compared this value to thepredicted accuracy of TC synapse detection using simulations,we found it to be slightly better than the predicted 70% accu-racy. This difference is likely due to differences in the detectioncriteria used in the simulations. In the simulations we employed
Frontiers in Neural Circuits www.frontiersin.org November 2013 | Volume 7 | Article 177 | 8

Rah et al. Thalamocortical synapses on L5 neurons
FIGURE 8 | LSAT shows that TC synapses are concentrated on
proximal basal dendrites of L5 pyramidal neurons. (A) Threedimensional Scholl analysis of dendritic structure of reconstructed L5pyramidal neurons, and (B) Number of TC synapses as a function ofpath distance from center of soma. (C) Average density of TC synapsesfrom all annotated neurons (aligned relative to cell bodies; false colorscale) represented on top of all dendrites from all the traced neurons
(white lines, superimposed; scale bar 100 µm). (D,E) Spatial distributionof the functional TC input mapped using sCRACM (Petreanu et al., 2009)(D), false color scale; reduced to 80% of size to compensate for thetissue shrinkage during LSAT processing) and distribution of TC synapsesdetected by LSAT (E) average from all annotated neurons aligned relativeto pia; scale bar 100 µm). (F) Overlay of TC laminar distribution measuredby sCRACM and LSAT.
a simple and model-independent detection method for synapses,whereas in the experimental data synapses are detected as con-tacts between axons and spines, and this additional criterion haspreviously been shown to decrease the false-positive detectionof synapses by optical image-based methods (Mishchenko et al.,2010; da Costa and Martin, 2011). Also the relatively large size ofTC synapses likely further increases the accuracy of their detec-tion (da Costa and Martin, 2011). Finally, in contrast with theassumptions in the simulation, we also observed a consistent gra-dient of synaptophysin staining toward the post-synaptic spine(Figure 10), reflecting an increasing concentration of synapticvesicles with increasing proximity to the active zone. This fea-ture provides an additional improvement in the accuracy of TCsynapse detection.
We used synaptophysin immunostaining as our synapticmarker for synapse detection in AT, which labels all pre-synapticvesicles and is one of the most abundant synaptic vesicle-specificproteins (Takamori et al., 2006; Micheva et al., 2010) (Figure 6).An alternative would have been to use labeling by a synapse asso-ciated protein (e.g., PSD-95, piccolo, bassoon) because this mayincrease the accuracy of synapse detection by directly labelingthe pre- or post-synaptic membrane. However, immunostaining
against synapse-specific proteins such as PSD-95, piccolo andbassoon has been shown to produce a relatively high false neg-ative rate (Micheva et al., 2010). Furthermore, in our hands wewere unable to quantify the accuracy and reliability of PSD-95immunostaining with correlative EM because the antibodies wereunsuitable.
In addition to quantifying false positive rates for AT, we alsoprovide an estimate of the false negative rate for synapse detectionby AT. The use of correlative EM imaging on the same sectionsin which light imaging was performed, allowed us to determinethe number of TC synapses that we didn’t detect by AT alone.These were characterized by the presence of a tdTomato- andsynaptophysin-positive pre-synaptic terminal (detected by lightimaging) and a PSD detected in EM, but for which no post-synaptic spine GFP signal was detected by light imaging. Thisevaluation provided an estimate of ∼15% false negative rate.However, this is likely to be an overestimation because AT uses3D data from serial sections and a considerable proportion ofsynapses are detected in 2 adjacent sections when using AT (e.g.,Figure 3). Yet, in the analysis of false negatives only one sec-tion was used because of the difficulty in reconstructing the EMimages in 3D due to the relatively poor membrane preservation
Frontiers in Neural Circuits www.frontiersin.org November 2013 | Volume 7 | Article 177 | 9
Rah et al. Thalamocortical synapses on L5 neurons
FIGURE 9 | Clustering of TC input on dendrites of L5 pyramidal
neurons. (A) Example of dendritic branches of the same L5 pyramidal cell(from dotted box in Figure 4B) showing different densities of TC synapses.(B) Examples of basal dendrites from simulated random synapses and theexperimentally observed TC synapse distribution for the same neuron. Thelocation of synapses is indicated by the red stars, synapse density for eachbranch is color-coded; view is from above (scale bar = 100 µm). (C) Therelationships between length of dendritic branch and number of TCsynapses onto L5 basal dendrites. Shaded areas with dashed lines denote95% confidence intervals from simulated randomly distributed synapses ofL5 basal dendrites. (D) Histogram of TC synapse density for all dendriticbranches from all reconstructed neurons. Insets: expansions of peak andtail of the distribution as indicated by the dashed boxes. (E) Averagedcumulative distributions for nearest neighbor distances of TC synapsesfrom L5 basal dendrites, for experimental data (red, eight reconstructedneurons) and for simulations of 8000 model neurons with randomlydistributed synapses (black). (F) The mean clustering coefficient for TCsynapses at various spatial thresholds from basal dendrites of all eightreconstructed neurons (red line) and for simulated randomly distributedsynapses (black line). Bars (right y-axis) show statistical results using a KStest to determine the fraction of simulations there are significantly differentfrom the experimental data set of whole neurons (open bars) or of L5 basaldendrites.
produced using the correlative EM preparation protocol. Thusit is likely that the false negative rate for TC synapse detectionis lower than 15%. Furthermore, it is likely that the undetected(false negative) synapses are small in size and therefore likely tobe functionally less relevant (Matsuzaki et al., 2001; Murthy et al.,2001). The accuracy of synapse detection by AT was determinedusing TC synapses in L4, not in L5, because of the high abun-dance of TC synapses in L4. It is thus formally possible that thedetection accuracy calculated using L4 TC synapses may be dif-ferent to that for their detection in L5. However, we think this isunlikely because the size of dendritic spines onto L5 neurons andL4 neurons are not significantly different (Konur et al., 2003).
Thus, we find that AT can detect TC synapses with 79% accu-racy and more than 85% reliability under our three-color imaging
FIGURE 10 | Distribution of GFP, tdTomato and synaptophysin staining
at TC synapses. (A) Three-color image of an example TC synapse (imagefrom a single section; green is post-synaptic GFP, red is pre-syanptictdTomato, blue is pre-synaptic synaptophysin stain). (B) Pixel intensity mapfor each color channel for the single image shown in (A) (left) and the plotof pixel intensity averaged across all pixels vertically (right). (C) Pixelintensity map for each color channel averaged for 30 TC synapses.Individual images of synapses were first aligned based on PSDs of thecorrelative EM images and then cumulative signal intensity calculated. Notethat the synaptophysin signal is skewed toward the presynaptic membranewhereas the tdTomato signal is not. Images shown are ∼1.1 × 0.4 µm2.
conditions. Compared to the previously reported best accuracyof 30–50% using traditional light microscopy (Sorra and Harris,1993; da Costa and Martin, 2011), AT represents a significantimprovement in synapse detection.
THE UTILITY OF LSAT FOR LARGE-SCALE MAPPING OF DEFINEDSYNAPTIC INPUTThe quantification of the accuracy and reliability of TC synapsedetection allowed us to map TC synapses in a large volumeof reconstructed mouse barrel cortex (1.00 × 0.83 × 0.21 mm3).The imaging of such a large volume at such resolution presenteda number of technical challenges. For example, this approachnecessitated the design of a custom imaging system with cus-tomized autofocus to enable reliable imaging of the large numberof sections. In addition, custom software was required for theappropriate alignment of the images. In terms of the throughput,it took 877.5 h to image the 257,760 individual image tiles fromthe 1074 sections in all three color channels. For comparison,to image the same volume using the current state-of-the-art EMmethods, we estimate based on (Briggman and Bock, 2011) that7656.6 h for serial section TEM using a camera array (TEMCA)(Bock et al., 2011), 21029.2 h using block-face SEM (SB-SEM)(Briggman et al., 2011) and 12455.7 h with automated tape-collecting ultramicrotome followed by SEM (Hayworth et al.,2006).
Furthermore, automated segmentation can be more read-ily achieved using light imaging due to the high contrast of
Frontiers in Neural Circuits www.frontiersin.org November 2013 | Volume 7 | Article 177 | 10

Rah et al. Thalamocortical synapses on L5 neurons
fluorescence images. However, for AT one of the major chal-lenges not fully resolved is the full segmentation of images toenable automated tracing of individual neurons and the auto-mated detection of synapses. In the current study the trac-ing of neurons and detection and assignment of TC synapseswere performed manually. More work on these aspects ofimage analysis will be required to facilitate a higher through-put workflow for future projects. It should be noted, however,that fully automated segmentation of images in EM recon-struction techniques also has not been achieved, and thisrepresents one of the current biggest challenges to the practical-ity of any high density large-scale imaging and reconstructiontechnologies.
FUNCTIONAL CONSEQUENCES OF TC SYNAPSE CLUSTERING ON L5PYRAMIDAL NEURONSSpecialized spatial domains on dendrites preferentially targetedby certain inputs have been hypothesized to act as separatelyfunctional units for integration and plasticity (Poirazi et al.,2003a,b), providing a first layer of internal computation forneurons (Schiller et al., 2000). The consequence of such den-dritic branch-level processing is that individual branches cancoordinate its inputs using plasticity and can act as a compu-tational unit representing different input features in the net-work (Hausser and Mel, 2003; Losonczy et al., 2008). Althoughthere is some experimental support for this concept, it is notknown whether synapses from the same pre-synaptic inputcan participate in local dendritic interactions to produce func-tional dendritic computational units representing related infor-mation from the same pre-synaptic source. We show that TCinput may have appropriate anatomical features to participatein such local functionally related dendritic integration and plas-ticity. We show that TC inputs, carrying topographically orga-nized sensory input preferentially target certain L5 dendritesand cluster in a manner likely to increase their functional inte-gration and promote plasticity. Such input-specific clusteringis predicted to be a powerful mechanism for circuit develop-ment promoting topographical organization of ascending sensoryinput.
During development, functionally clustered units of TC inputwould likely be promoted by synaptic plasticity in response toexperience. TC axons during development are constantly editedat a high rate (35 µm/h) (Portera-Cailliau et al., 2005) to revisetheir synaptic connectivity in a mechanism depending on activity.Long-term synaptic plasticity during early postnatal developmenthas been proposed as a functional maturation cue at TC synapses(Isaac et al., 1997; Feldman et al., 1999; Kidd and Isaac, 1999;Cline, 2001). Induction of long-term potentiation (LTP) at onesynapse enhances the likelihood of LTP induction at neighbor-ing synapses within ∼5 µm (Govindarajan et al., 2006; Harveyand Svoboda, 2007; De Roo et al., 2008). This process providesa candidate mechanism to promote the clustering we observefor TC synapses in which there is a significant increase in theincidence of TC synapses located within 5 µm of each other(compared to a random distribution; see Figure 9D). Furthersupport for this idea comes from findings showing that synapsesare spatially organized on a fine scale to promote synchronized
activity, development of which relies on NMDA receptor acti-vation (Kleindienst et al., 2011; Makino and Malinow, 2011).In addition, a recent in vivo study shows that dendritic spinesnewly generated during learning form clusters (Fu et al., 2012).However, we cannot completely exclude the possibility thatpathological enlargement of axons found in the reconstructedTC axons might have somewhat affected the distribution of TCsynapses.
In addition to the local clustering, we also find that TC inputsonto L5 pyramidal neurons primarily target basal dendrites prox-imal to the soma (Figure 8). Together with spatial clustering,this proximal dendritic targeting likely further promotes a reli-able input-output function for the TC projection, making theTC input strong and driving in L5. We found that TC inputsalso target proximal apical dendrites of L5 pyramidal neuronswithin L4. Although these synapses are present at a somewhatmore distant location from the soma than the basal dendritictargeting inputs, the large diameter proximal apical dendritesexhibit reduced attenuation of these synaptic responses makingthis part if the TC input also relatively strong. This is borneout by functional mapping data using sCRACM (Petreanu et al.,2009), which shows a larger functional TC response mediatedby the TC input to L5 pyramidal cells onto the proximal apicaldendrites in L4 than expected by the anatomic distribution weobserve.
CONCLUSIONIn summary, we describe the use of AT for large-scale recon-struction of defined synaptic input onto defined post-synapticneurons. We quantify the accuracy and reliability of synapsedetection by AT for the first time and then show that it is suitablefor the high resolution mapping the TC input onto L5 pyrami-dal neurons in a large volume of reconstructed barrel cortex. Wefind that TC synapses preferentially target certain dendrites andthat TC synapses cluster in a manner predicted to enhance den-dritic integration and plasticity. We anticipate that LSAT will be ahighly useful tool for the quantitative mapping of connectivity inthe brain, a key activity necessary for understanding informationprocessing.
MATERIALS AND METHODSANIMALSAll experimental protocols were conducted according to theUnited States National Institutes of Health guidelines for ani-mal research and were approved by the Institutional AnimalCare and Use Committee at the Janelia Farm ResearchCampus.
POPULATION-SPECIFIC FLUORESCENT LABELING OF NEURONSFor the LSAT experiment we used Thy1-YFP (type H) trans-genic mice, in which L5 pyramidal neurons are sparsely labeledwith YFP (Feng et al., 2000). In these mice (∼5–6 months ofage) we labeled TC synapses in the barrel field of somatosen-sory cortex by transducing VPm neurons with tdTomato. Thiswas achieved by stereotaxic injection of adeno-associated virus(AAV; serotype II) expressing tdTomato under the CAG promoterand allowing ∼4 weeks to achieve high levels of expression, as
Frontiers in Neural Circuits www.frontiersin.org November 2013 | Volume 7 | Article 177 | 11

Rah et al. Thalamocortical synapses on L5 neurons
previously published (Petreanu et al., 2009; Hooks et al., 2011).In brief, after making a small incision in the scalp, we injectedvirus into the VPm of the thalamus through the thinned skull(1.45 mm posterior, 1.6 mm lateral to the Bregma and 3.1 mmdeep from the pial surface). About 100 nl of viral suspensionwas injected through a pulled glass micropipette (Drummond,Broomall, PA). Successful targeting of VPm was confirmed bythe distribution pattern of axons in S1 under low power fluores-cence imaging (MVX10, Olympus, Tokyo, Japan). As previouslydescribed, neurons in L4 and L5B are the main recipients ofascending input from VPm (Bureau et al., 2006; Petreanu et al.,2009).
For the correlative light and EM study we labeled L4 neu-rons with GFP and TC axons and terminals using AAV-tdTomatoinjected in VPm. To achieve L4 specific gene delivery, we stereo-taxically injected an AAV virus encoding FLEX-reversed GFP(Schnutgen et al., 2003; Atasoy et al., 2008) into L4 of a six3-CREtransgenic mouse line that expresses CRE in L4, but not otherneocortical layers (Liao and Xu, 2008).
TISSUE PREPARATION, RESIN EMBEDDING AND ULTRA-THINSECTIONINGFor correlative AT and EM, ultrathin sections had to be preparedwithout significant loss of fluorescence or immunoreactivity,yet with sufficient structural preservation to identify synapsesunambiguously. We found the following fixation and embeddingprotocol meets our requirements. ∼4 weeks after the stereo-taxic virus injection, animals were transcardially perfused with∼200 ml of fixative (4% paraformaldehyde, 0.2% glutaraldehydein 0.1 M sodium cacodylate buffer, pH7.2). Brains were furtherincubated in fixative for ∼2 h before being extracted (Knott et al.,2009). Brains were then rinsed overnight with sodium cacody-late buffer and 300 µm thick sections prepared by vibratome(Leica, VT1200). The sections were then washed in cacodylatebuffer and post-fixed with 0.001% osmium tetroxide in cacody-late buffer for 1 h at 4◦C for correlative EM. Samples werethen dehydrated by serial incubation in 30, 50, 70, and 95%ethanol series and then embedded and polymerized at −20◦Cin LR White using a chemical accelerator (Electron MicroscopySciences, Hartfield, PA) in a low temperature embedding sys-tem (Leica AFS2, Leica, Buffalo Grove, IL). Embedded tissueswere sectioned at 60 nm thicknesses with an ultramicrotome(Leica, Buffalo Grove, IL) and collected on Pioloform-coatedØ25-mm coverslips (Electron Microscopy Sciences, Hartfield,PA), so that the sections could be readily separated from thecoverslip for subsequent EM as described in Watanabe et al.(in press). Sections mounted on Pioloform film were sepa-rated from the coverslip with diluted hydrofluoric acid aque-ous solution, transferred to an EM grid and stained with 7.5%aqueous uranyl acetate followed by Sato’s lead solution (Sato,1968).
For LSAT imaging, brains were fixed by transcardial perfu-sion with 4% paraformaldehyde, sectioned at 300 µm, embeddedin LR White and 200 nm serial sections prepared and mountedon gelatin-coated 25 × 75 mm rectangular coverslips (ElectronMicroscopy Sciences, Hartfield, PA) using a Histo Jumbo knife(Diatome, Switzerland).
IMMUNOHISTOCHEMISTRYUltrathin sections were immunostained the following antibodies:synaptophysin (1:200, Synaptic System, Göttingen, Germany),DsRed (1:500, Clontech, Mountain View, CA), GFP (1:2000,abCam, Cambridge, MA) and visualized using fluorescence-tagged secondary antibodies. Immunohistochemistry was con-ducted essentially as previously described (Micheva and Smith,2007).
LIGHT AND ELECTRON MICROSCOPYFor light microscopy we used a Zeiss Observer microscope (Zeiss,Göttingen, Germany) modified with a custom-built autofocussystem. This system measures the distance between the objec-tive and the sample surface with an auxiliary IR beam, and thesample is positioned within 100 nm of a preset target distance.Sample variation can cause changes in the distance measure-ment, so the edge sharpness within each image is analyzed aftereach acquisition. If poor edge sharpness is detected, the sys-tem acquires a z-stack of 15 images, and analyzes these imagesto determine the position of best focus for the current samplearea; this newly determined target distance is used to reimage thefield. A 100x, 1.45 N.A., oil-immersion objective was used for allthe AT imaging. For LSAT, we collected 20 × 12 image tiles inthree colors, overlapping one another by 10%, from each of 1074sections.
For EM, samples were imaged using automated EM acqui-sition software, Leginon (Suloway et al., 2005) in a TecnaiSpirit transmission electron microscope (FEI, Hillsboro, OR)at 4,800x or 2,900x magnification. Images were registeredat a coarse level using translational and rotational transfor-mation in TrakEM2 (Cardona et al., 2010) and were thenaligned further using custom software. For image alignmentbetween light microscope and EM images, images were manu-ally aligned using mitochondria as common feature points inTrakEM2.
For LSAT, light microscopic images were aligned using cus-tom software. The custom alignment software assigns one affinetransform to each image in the stack using the following sequenceof operations. All images are histogram equalized to enhanceimage contrast. A set of image-to-image correspondence pointpairs is found for each pair of images that overlap in the sameor adjacent z-plane. These points are found by maximizingnormalized cross correlation in the overlap region using fastFourier transforms (FFTs) and then refining the matching usinga deformable mesh of triangles. The triangle centroids becomethe correspondence points. Next the set of all image-to-imagecorrespondence point pairs is scanned for mutual connectiv-ity, which determines the set of transforms {Ti} sought. A largesystem of linear equations is constructed to express that thecorrespondence point pairs should map to the same place inthe common global space. After solving the system using con-ventional matrix methods, the residual correspondence pointdisplacements can be used to express a fit accuracy. In thecurrent case, the R.M.S. error for the whole stack is roughly8 pixels. The shape of the error distribution is approximatelyPoisson, and much of the high error tail comes from verysparse regions at the periphery of the stack where matching is
Frontiers in Neural Circuits www.frontiersin.org November 2013 | Volume 7 | Article 177 | 12

Rah et al. Thalamocortical synapses on L5 neurons
poorer but precisely because content is lacking. The interest-ing and denser regions are sufficiently well aligned for manualtracing.
DENDRITE SEGMENTATION AND TC SYNAPSE ASSIGNMENTThe dendritic structure of 8 neurons was manually traced usingKnossos (Helmstaedter et al., 2011). Synapses were assigned inthe AT images based on the profiles of fluorescence: TC axonswere identified based on overlapping fluorescence of tdTomatoand synaptophysin immunolabeling, and the post-synaptic spineswere identified by YFP fluorescence. Thus, identified TC synapsesin AT were selected based on the three-color channels partiallyoverlapping. As shown in Figure 10, we used the gradient ofsynaptophysin signal toward the synapse as a further confirma-tion of the direction of synapses (Figure 10). The asymmetricalaccumulation of synaptic vesicles near the active zone pro-duces a gradient of blue synaptophysin immunostaining intensitythat increases toward the active zone. In addition, because ofthe increasing abundance of synaptic vesicles, there is a con-comitant reduction in the amount of the pre-synaptic cytosolicfluorescent label (tdTomato) with increasing proximity to theactive zone. These effects combine to produce a gradient ofincreasing synaptophysin staining (blue) and decreasing cytoso-lic fluorescent protein (red) with increasing proximity to thesynaptic contact enhancing TC synapse detection reliability. TCsynapses were assumed to be axo-spinous (White and Rock, 1980;Benshalom and White, 1986; da Costa and Martin, 2011), there-fore, thalamic afferents on large green structures, which are likelya part of dendritic shafts or soma, were not assigned as TCsynapses.
The accuracy of TC synapses assignment was evaluated withthe correlative EM images. The same stacks of serial sectionswere imaged using EM and AT, and synapses assigned indepen-dently using both imaging modalities. This analysis was per-formed in two experiments using stacks of 4 serial sections, inone experiment using stacks of 15 serial sections and in a fur-ther experiment using single sections. Since synaptic vesicles inpre-synaptic terminals were not visible under our correlativeEM conditions, synapses in these EM images were defined bythe presence of an electron dense post-synaptic density (PSD)structure. To avoid experimenter-based bias, the accuracy ofsynapses assignment both in light and EM was assessed indepen-dently by two scientists. Dendritic morphology was quantifiedusing 3-dimensional Sholl analysis. The number of intersectionsbetween dendrites and concentric spheres centered at the centerof the cell body were counted at various diameters using customsoftware.
SIMULATIONSFor the simulations of accuracy of detection using AT (shownin Figure 7) we used serial EM images from hippocampus(Mishchenko et al., 2010). In this data, all synapses, pre-synapticboutons, and post-synaptic spines were marked automaticallyand then verified manually as described in (Mishchenko, 2010).Only synapses between well defined spine heads and axonalboutons were kept for the calculation. These constituted adataset of 250 well defined synaptic contacts. For each individual
pre-synaptic bouton we constructed in Matlab (Mathwork, MA)the distance transform for the associated spine head using thefast anisotropic 3D distance transform Matlab function bwdistsc(Mishchenko, “3D Euclidean Distance Transform for VariableData Aspect Ratio,” Matlab Central Website, 2007). Thus, thedistance transform assigned the distance from each pre-synapticbouton to each reference spine head. Using these constructeddistance transforms we calculated, for each synaptic contactand each light imaging resolution, the total number of differ-ent vesicle clouds located within that resolution limit away fromassociated spine head. If the number of such “proximal” vesicleclouds is greater than one, that creates a possibility for incor-rectly assigning a pre-synaptic axon to a post-synaptic spinethus falsely identifying a synaptic contact. A vesicle cloud wasassumed to contribute to the fraction of false-positives at resolu-tion d if any of its vesicles were found to be within the distanced away from a spine head. Using this analysis, we calculatedthe probability of false-positive associations for each synapse atdifferent light imaging resolutions. Specifically, if the total num-ber of axonal boutons proximal to a reference spine at distanced was n_spn(d), then the probability of false-positive associa-tions in these settings was calculated using the following formula:p_spn(d) = (n_spn(d) − 1)/n_spn(d). The overall false-positiveerror rate was then evaluated as the average over all the individualsynapses.
To test whether the observed distribution pattern of detectedTC synapses can be generated by chance alone (data shownin Figure 9), we built model neurons that have a random dis-tribution of synapses on the same segmented basal dendriticstructure of the eight reconstructed L5 pyramidal neurons. Foreach of the eight neurons, we did this by randomly distribut-ing the same number of TC synapses as measured experimentallyon a line the length of the total dendritic path length of basaldendrites of the neurons. We used the random permutation func-tion of Matlab (randperm), which employs uniform distribution(rand) to get the permutation vector; we shuffled the seed ofthe random generator with the CPU clock before every simula-tion. The line was then reconstructed back into the real dendriticstructure of the neuron to produce a random distribution ofTC synapses. For each neuron this simulation was performed1000 times.
NEAREST NEIGHBOR DISTANCE AND CLUSTERING COEFFICIENTTo calculate distance to the nearest neighbor for each synapse, wefirst established the pairwise path length constrained by the shapeof neurons between all possible combinations of synapse pairs.Then for each synapses, we defined the nearest neighbor as thesynapse that has shortest path length out of all synapses.
Clustering coefficient was calculated using graph theory(Bullmore and Sporns, 2009), defining two synapses as “con-nected,” when they are within the defined neighboring dis-tance. The clustering coefficient of each synapse (Figure 9E)was then calculated as the ratio of the number of con-nected pairs between neighboring synapses to that of allpossible edges within the neighborhood in basal dendrites.Clustering coefficients were averaged across all basal den-drites of eight reconstructed neurons and compared to those
Frontiers in Neural Circuits www.frontiersin.org November 2013 | Volume 7 | Article 177 | 13

Rah et al. Thalamocortical synapses on L5 neurons
calculated for simulated neurons with random synapse dis-tributions. The difference in clustering coefficient betweenexperimental and simulated data sets was compared using aKS test.
STATISTICSTo compare the experimentally observed TC synapse distributionto the random distributions, a non-parametric distribution-freeKolmogorov-Smirnov test (KS test) was used. Paired t-tests wereused to examine whether the TC synapse distribution pattern issignificantly altered by restricting the analysis on the brancheswithin L5. p < 0.05 was considered as statistically significant. Allerrors shown in the text as well as in the figures are standarddeviation.
ACKNOWLEDGMENTSThe authors thank Dr. Thomas Reese for helpful discussion, Drs.Wei-Ping Li, Paul Gallant, Mehdi Bolorizadeh, Eric Trautman,Fernando Amat, and Albert Cardona for technical support, NCIeditors for review of the initial manuscript. The work was sup-ported by JFRC Visiting Scientist program (Jong-Cheol Rah) andthe NINDS intramural research program (Jong-Cheol Rah, JohnT. R. Isaac).
SUPPLEMENTARY MATERIALThe Supplementary Material for this article can be foundonline at: http://www.frontiersin.org/journal/10.3389/fncir.2013.00177/abstract
Supplementary movie 1. Three-dimensional volume rendering of LSAT
from Figure 2B.
https://docs.google.com/file/d/0Bz3vPKnEbwTZLS1URHV1M0M5Y1E/edit?usp=sharing
REFERENCESAhmed, B., Anderson, J. C., Douglas, R. J., Martin, K. A., and Nelson, J. C. (1994).
Polyneuronal innervation of spiny stellate neurons in cat visual cortex. J. Comp.Neurol. 341, 39–49. doi: 10.1002/cne.903410105
Alonso, J. M., Usrey, W. M., and Reid, R. C. (1996). Precisely correlated fir-ing in cells of the lateral geniculate nucleus. Nature 383, 815–819. doi:10.1038/383815a0
Ariav, G., Polsky, A., and Schiller, J. (2003). Submillisecond precision ofthe input-output transformation function mediated by fast sodium den-dritic spikes in basal dendrites of CA1 pyramidal neurons. J. Neurosci. 23,7750–7758.
Atasoy, D., Aponte, Y., Su, H. H., and Sternson, S. M. (2008). A FLEX switch tar-gets Channelrhodopsin-2 to multiple cell types for imaging and long-rangecircuit mapping. J. Neurosci. 28, 7025–7030. doi: 10.1523/JNEUROSCI.1954-08.2008
Bagnall, M. W., Hull, C., Bushong, E. A., Ellisman, M. H., and Scanziani, M. (2011).Multiple clusters of release sites formed by individual thalamic afferents ontocortical interneurons ensure reliable transmission. Neuron 71, 180–194. doi:10.1016/j.neuron.2011.05.032
Beierlein, M., Fall, C. P., Rinzel, J., and Yuste, R. (2002). Thalamocortical burststrigger recurrent activity in neocortical networks: layer 4 as a frequency-dependent gate. J. Neurosci. 22, 9885–9894.
Benshalom, G., and White, E. L. (1986). Quantification of thalamocortical synapseswith spiny stellate neurons in layer IV of mouse somatosensory cortex. J. Comp.Neurol. 253, 303–314. doi: 10.1002/cne.902530303
Bernardo, K. L., and Woolsey, T. A. (1987). Axonal trajectories between mousesomatosensory thalamus and cortex. J. Comp. Neurol. 258, 542–564. doi:10.1002/cne.902580406
Bock, D. D., Lee, W. C., Kerlin, A. M., Andermann, M. L., Hood, G., Wetzel, A. W.,et al. (2011). Network anatomy and in vivo physiology of visual cortical neurons.Nature 471, 177–182. doi: 10.1038/nature09802
Briggman, K. L., and Bock, D. D. (2011). Volume electron microscopy for neuronalcircuit reconstruction. Curr.Opin. Neurobiol. 22, 154–161. doi: 10.1016/j.conb.2011.10.022
Briggman, K. L., Helmstaedter, M., and Denk, W. (2011). Wiring specificityin the direction-selectivity circuit of the retina. Nature 471, 183–188. doi:10.1038/nature09818
Bruno, R. M., and Sakmann, B. (2006). Cortex is driven by weak but synchronouslyactive thalamocortical synapses. Science 312, 1622–1627. doi: 10.1126/sci-ence.1124593
Bullmore, E., and Sporns, O. (2009). Complex brain networks: graph theoreticalanalysis of structural and functional systems. Nat. Rev. Neurosci. 10, 186–198.doi: 10.1038/nrn2575
Bureau, I., Saint Paul, von, F., and Svoboda, K. (2006). Interdigitated paralemnis-cal and lemniscal pathways in the mouse barrel cortex. PLoS Biol. 4:e382. doi:10.1371/journal.pbio.0040382
Cardona, A., Saalfeld, S., Preibisch, S., Schmid, B., Cheng, A., Pulokas, J.,et al. (2010). An integrated micro- and macroarchitectural analysisof the drosophila brain by computer-assisted serial section elec-tron microscopy. PLoS Biol. 8:e1000502. doi: 10.1371/journal.pbio.1000502
Cline, H. T. (2001). Dendritic arbor development and synaptogenesis. Curr.Opin.Neurobiol. 11, 118–126. doi: 10.1016/S0959-4388(00)00182-3
da Costa, N. M., and Martin, K. A. (2011). How thalamus connects to spinystellate cells in the cat’s visual cortex. J. Neurosci. 31, 2925–2937. doi:10.1523/JNEUROSCI.5961-10.2011
De Roo, M., Klauser, P., and Muller, D. (2008). LTP promotes a selective long-term stabilization and clustering of dendritic spines. PLoS Biol. 6:e219. doi:10.1371/journal.pbio.0060219
Douglas, R. J., Koch, C., Mahowald, M., Martin, K. A., and Suarez, H. H.(1995). Recurrent excitation in neocortical circuits. Science 269, 981–985. doi:10.1126/science.7638624
Feinberg, E. H., Vanhoven, M. K., Bendesky, A., Wang, G., Fetter, R. D., Shen, K.,et al. (2008). GFP Reconstitution Across Synaptic Partners (GRASP) definescell contacts and synapses in living nervous systems. Neuron 57, 353–363. doi:10.1016/j.neuron.2007.11.030
Feldman, D. E., Nicoll, R. A., and Malenka, R. C. (1999). Synaptic plastic-ity at thalamocortical synapses in developing rat somatosensory cortex: LTP,LTD, and silent synapses. J. Neurobiol. 41, 92–101. doi: 10.1002/(SICI)1097-4695(41):1<92::AID-NEU12>3.0.CO;2-U
Feng, G., Mellor, R. H., Bernstein, M., Keller-Peck, C., Nguyen, Q. T., Wallace,M., et al. (2000). Imaging neuronal subsets in transgenic mice expressingmultiple spectral variants of GFP. Neuron 28, 41–51. doi: 10.1016/S0896-6273(00)00084-2
Fu, M., Yu, X., Lu, J., and Zuo, Y. (2012). Repetitive motor learning induces coor-dinated formation of clustered dendritic spines in vivo. Nature 482, 92–95. doi:10.1038/nature10844
Gil, Z., Connors, B. W., and Amitai, Y. (1999). Efficacy of thalamocortical and intra-cortical synaptic connections: quanta, innervation, and reliability. Neuron 23,385–397. doi: 10.1016/S0896-6273(00)80788-6
Govindarajan, A., Kelleher, R. J., and Tonegawa, S. (2006). A clustered plasticitymodel of long-term memory engrams. Nat. Rev. Neurosci. 7, 575–583. doi:10.1038/nrn1937
Graf, E. R., Zhang, X., Jin, S.-X., Linhoff, M. W., and Craig, A. M. (2004). Neurexinsinduce differentiation of GABA and glutamate postsynaptic specializations vianeuroligins. Cell 119, 1013–1026. doi: 10.1016/j.cell.2004.11.035
Harvey, C. D., and Svoboda, K. (2007). Locally dynamic synaptic learningrules in pyramidal neuron dendrites. Nature 450, 1195–1200. doi: 10.1038/nature06416
Harvey, C. D., Yasuda, R., Zhong, H., and Svoboda, K. (2008). The spread of Rasactivity triggered by activation of a single dendritic spine. Science 321, 136–140.doi: 10.1126/science.1159675
Hausser, M., and Mel, B. (2003). Dendrites: bug or feature? Curr.Opin. Neurobiol.13, 372–383. doi: 10.1016/S0959-4388(03)00075-8
Hayworth, K. J., Kasthuri, N., Schalek, R., and Lichtman, J. W. (2006). Automatingthe collection of ultrathin serial sections for large volume tem reconstructions.Microsc. Microanal. 12, 86. doi: 10.1017/S1431927606066268
Frontiers in Neural Circuits www.frontiersin.org November 2013 | Volume 7 | Article 177 | 14

Rah et al. Thalamocortical synapses on L5 neurons
Helmstaedter, M., Briggman, K. L., and Denk, W. (2011). High-accuracy neu-rite reconstruction for high-throughput neuroanatomy. Nat. Neurosci. 14,1081–1088. doi: 10.1038/nn.2868
Hooks, B. M., Hires, S. A., Zhang, Y. X., Huber, D., Petreanu, L., Svoboda, K.,et al. (2011). Laminar analysis of excitatory local circuits in vibrissal motor andsensory cortical areas. PLoS Biol. 9:e1000572. doi: 10.1371/journal.pbio.1000572
Isaac, J. T., Crair, M. C., Nicoll, R. A., and Malenka, R. C. (1997). Silentsynapses during development of thalamocortical inputs. Neuron 18, 269–280.doi: 10.1016/S0896-6273(00)80267-6
Jensen, K. F., and Killackey, H. P. (1987). Terminal arbors of axons projecting tothe somatosensory cortex of the adult rat. I. The normal morphology of specificthalamocortical afferents. J. Neurosci. 7, 3529–3543.
Kidd, F. L., and Isaac, J. T. (1999). Developmental and activity-dependent regula-tion of kainate receptors at thalamocortical synapses. Nature 400, 569–573. doi:10.1038/23040
Kim, J., Zhao, T., Petralia, R. S., Yu, Y., Peng, H., Myers, E., et al. (2012). mGRASPenables mapping mammalian synaptic connectivity with light microscopy. Nat.Methods 9, 96–102. doi: 10.1038/nmeth.1784
Kleindienst, T., Winnubst, J., Roth-Alpermann, C., Bonhoeffer, T., andLohmann, C. (2011). Activity-dependent clustering of functional synapticinputs on developing hippocampal dendrites. Neuron 72, 1012–1024. doi:10.1016/j.neuron.2011.10.015
Knott, G. W., Holtmaat, A., Trachtenberg, J. T., Svoboda, K., and Welker, E. (2009).A protocol for preparing GFP-labeled neurons previously imaged in vivo andin slice preparations for light and electron microscopic analysis. Nat. Protoc. 4,1145–1156. doi: 10.1038/nprot.2009.114
Konur, S. L., Rabinowitz, D., Fenstermaker, V. L., and Yuste, R. (2003). Systematicregulation of spine sizes and densities in pyramidal neurons. J. Neurobiol. 56,95–112. doi: 10.1002/neu.10229
Larkum, M. E., and Nevian, T. (2008). Synaptic clustering by den-dritic signalling mechanisms. Curr.Opin. Neurobiol. 18, 321–331. doi:10.1016/j.conb.2008.08.013
Liao, G. Y., and Xu, B. (2008). Cre recombinase-mediated gene deletion in layer 4of murine sensory cortical areas. Genesis 46, 289–293. doi: 10.1002/dvg.20393
Little, J. P., and Carter, A. G. (2012). Subcellular synaptic connectivity oflayer 2 pyramidal neurons in the medial prefrontal cortex. J. Neurosci. 32,12808–12819. doi: 10.1523/JNEUROSCI.1616-12.2012
London, M., and Hausser, M. (2005). Dendritic computation. Annu. Rev. Neurosci.28, 503–532. doi: 10.1146/annurev.neuro.28.061604.135703
Losonczy, A., and Magee, J. C. (2006). Integrative properties of radial obliquedendrites in hippocampal CA1 pyramidal neurons. Neuron 50, 291–307. doi:10.1016/j.neuron.2006.03.016
Losonczy, A., Makara, J. K., and Magee, J. C. (2008). Compartmentalized den-dritic plasticity and input feature storage in neurons. Nature 452, 436–441. doi:10.1038/nature06725
Magee, J. C. (2000). Dendritic integration of excitatory synaptic input. Nat. Rev.Neurosci. 1, 181–190. doi: 10.1038/35044552
Makino, H., and Malinow, R. (2011). Compartmentalized versus global synapticplasticity on dendrites controlled by experience. Neuron 72, 1001–1011. doi:10.1016/j.neuron.2011.09.036
Matsuzaki, M., Ellis-Davies, G. C., Nemoto, T., Miyashita, Y., Iino, M., and Kasai,H. (2001). Dendritic spine geometry is critical for AMPA receptor expressionin hippocampal CA1 pyramidal neurons. Nat. Neurosci. 4, 1086–1092. doi:10.1038/nn736
Meyer, H. S., Wimmer, V. C., Oberlaender, M., de Kock, C. P. J., Sakmann, B.,and Helmstaedter, M. (2010). Number and laminar distribution of neuronsin a thalamocortical projection column of rat vibrissal cortex. Cereb.Cortex 20,2277–2286. doi: 10.1093/cercor/bhq067
Micheva, K. D., Busse, B., Weiler, N. C., O’Rourke, N., and Smith, S. J.(2010). Single-synapse analysis of a diverse synapse population: proteomicimaging methods and markers. Neuron 68, 639–653. doi: 10.1016/j.neuron.2010.09.024
Micheva, K. D., and Smith, S. J. (2007). Array tomography: a new tool for imag-ing the molecular architecture and ultrastructure of neural circuits. Neuron 55,25–36. doi: 10.1016/j.neuron.2007.06.014
Mishchenko, Y. (2010). On optical detection of densely labeled synapses inneuropil and mapping connectivity with combinatorially multiplexed flu-orescent synaptic markers. PLoS ONE 5:e8853. doi: 10.1371/journal.pone.0008853
Mishchenko, Y., Hu, T., Spacek, J., Mendenhall, J., Harris, K. M., and Chklovskii,D. B. (2010). Ultrastructural analysis of hippocampal neuropil from the con-nectomics perspective. Neuron 67, 1009–1020. doi: 10.1016/j.neuron.2010.08.014
Murthy, V. N., Schikorski, T., Stevens, C. F., and Zhu, Y. (2001). Inactivity producesincreases in neurotransmitter release and synapse size. Neuron 32, 673–682. doi:10.1016/S0896-6273(01)00500-1
Oberlaender, M., de Kock, C. P. J., Bruno, R. M., Ramirez, A., Meyer, H. S.,Dercksen, V. J., et al. (2012). Cell type-specific three-dimensional structure ofthalamocortical circuits in a column of rat vibrissal cortex. Cereb. Cortex 22,2375–2391. doi: 10.1093/cercor/bhr317
Peters, A., and Payne, B. R. (1993). Numerical relationships between geniculocor-tical afferents and pyramidal cell modules in cat primary visual cortex. Cereb.Cortex 3, 69–78. doi: 10.1093/cercor/3.1.69
Petreanu, L., Mao, T., Sternson, S. M., and Svoboda, K. (2009). The subcellularorganization of neocortical excitatory connections. Nature 457, 1142–1145. doi:10.1038/nature07709
Poirazi, P., Brannon, T., and Mel, B. W. (2003a). Arithmetic of subthresholdsynaptic summation in a model CA1 pyramidal cell. Neuron 37, 977–987. doi:10.1016/S0896-6273(03)00148-X
Poirazi, P., Brannon, T., and Mel, B. W. (2003b). Pyramidal neuron as two-layerneural network. Neuron 37, 989–999. doi: 10.1016/S0896-6273(03)00149-1
Polsky, A., Mel, B. W., and Schiller, J. (2004). Computational subunits in thindendrites of pyramidal cells. Nat. Neurosci. 7, 621–627. doi: 10.1038/nn1253
Portera-Cailliau, C., Weimer, R. M., De Paola, V., Caroni, P., and Svoboda, K.(2005). Diverse modes of axon elaboration in the developing neocortex. PLoSBiol. 3:e272. doi: 10.1371/journal.pbio.0030272
Richardson, R. J., Blundon, J. A., Bayazitov, I. T., and Zakharenko, S. S. (2009).Connectivity patterns revealed by mapping of active inputs on dendrites of tha-lamorecipient neurons in the auditory cortex. J. Neurosci. 29, 6406–6417. doi:10.1523/JNEUROSCI.0258-09.2009
Sato, T. (1968). A modified method for lead staining of thin sections. J. ElectronMicrosc. (Tokyo) 17, 158–159.
Scheiffele, P., Fan, J., Choih, J., Fetter, R., and Serafini, T. (2000). Neuroliginexpressed in nonneuronal cells triggers presynaptic development in contactingaxons. Cell 101, 657–669. doi: 10.1016/S0092-8674(00)80877-6
Schiller, J., Major, G., Koester, H. J., and Schiller, Y. (2000). NMDA spikes inbasal dendrites of cortical pyramidal neurons. Nature 404, 285–289. doi:10.1038/35005094
Schnutgen, F., Doerflinger, N., Calleja, C., Wendling, O., Chambon, P., andGhyselinck, N. B. (2003). A directional strategy for monitoring Cre-mediatedrecombination at the cellular level in the mouse. Nat. Biotechnol. 21, 562–565.doi: 10.1038/nbt811
Sorra, K. E., and Harris, K. M. (1993). Occurrence and three-dimensionalstructure of multiple synapses between individual radiatum axons andtheir target pyramidal cells in hippocampal area CA1. J. Neurosci. 13,3736–3748.
Stratford, K. J., Tarczy-Hornoch, K., Martin, K. A., Bannister, N. J., and Jack, J.J. (1996). Excitatory synaptic inputs to spiny stellate cells in cat visual cortex.Nature 382, 258–261. doi: 10.1038/382258a0
Suloway, C., Pulokas, J., Fellmann, D., Cheng, A., Guerra, F., Quispe, J., et al. (2005).Automated molecular microscopy: the new Leginon system. J. Struct. Biol. 151,41–60. doi: 10.1016/j.jsb.2005.03.010
Takahashi, N., Kitamura, K., Matsuo, N., Mayford, M., Kano, M., Matsuki, N.,et al. (2012). Locally synchronized synaptic inputs. Science 335, 353–356. doi:10.1126/science.1210362
Takamori, S., Holt, M., Stenius, K., Lemke, E. A., Grønborg, M., Riedel, D., et al.(2006). Molecular anatomy of a trafficking organelle. Cell 127, 831–846. doi:10.1016/j.cell.2006.10.030
Takemura, S.-Y., Bharioke, A., Lu, Z., Nern, A., Vitaladevuni, S., Rivlin, P. K.,et al. (2013). A visual motion detection circuit suggested by Drosophila con-nectomics. Nature 500, 175–181. doi: 10.1038/nature12450
Watanabe, S., Lehmann, M., Hujber, E., Fetter, R. D., Richards, J., Söhl-Kielczynski,B., et al. (in press). “Nanometer-resolution fluorescence electron microscopy(nano-fEM) in cultured cells,” in Methods in Molecular Biology: ElectronMicrosopy, 3rd Edn. ed J. Kuo (Totowa, NJ: Humana Press).
Wei, D. S. (2001). Compartmentalized and binary behavior of terminal dendritesin hippocampal pyramidal neurons. Science 293, 2272–2275. doi: 10.1126/sci-ence.1061198
Frontiers in Neural Circuits www.frontiersin.org November 2013 | Volume 7 | Article 177 | 15

Rah et al. Thalamocortical synapses on L5 neurons
White, E. L., and Rock, M. P. (1980). Three-dimensional aspects and synaptic rela-tionships of a Golgi-impregnated spiny stellate cell reconstructed from serialthin sections. J. Neurocytol. 9, 615–636. doi: 10.1007/BF01205029
Yasuda, R., Harvey, C. D., Zhong, H., Sobczyk, A., van Aelst, L., and Svoboda,K. (2006). Supersensitive Ras activation in dendrites and spines revealed bytwo-photon fluorescence lifetime imaging. Nat. Neurosci. 9, 283–291. doi:10.1038/nn1635
Zhang, Z. W., and Deschenes, M. (1998). Projections to layer VI of the posterome-dial barrel field in the rat: a reappraisal of the role of corticothalamic pathways.Cereb. Cortex 8, 428–436. doi: 10.1093/cercor/8.5.428
Conflict of Interest Statement: The authors declare that the research was con-ducted in the absence of any commercial or financial relationships that could beconstrued as a potential conflict of interest.
Received: 08 March 2013; accepted: 16 October 2013; published online: 12 November2013.Citation: Rah J-C, Bas E, Colonell J, Mishchenko Y, Karsh B, Fetter RD, MyersEW, Chklovskii DB, Svoboda K, Harris TD and Isaac JTR (2013) Thalamocorticalinput onto layer 5 pyramidal neurons measured using quantitative large-scale arraytomography. Front. Neural Circuits 7:177. doi: 10.3389/fncir.2013.00177This article was submitted to the journal Frontiers in Neural Circuits.Copyright © 2013 Rah, Bas, Colonell, Mishchenko, Karsh, Fetter, Myers, Chklovskii,Svoboda, Harris and Isaac. This is an open-access article distributed under the termsof the Creative Commons Attribution License (CC BY). The use, distribution or repro-duction in other forums is permitted, provided the original author(s) or licensor arecredited and that the original publication in this journal is cited, in accordance withaccepted academic practice. No use, distribution or reproduction is permitted whichdoes not comply with these terms.
Frontiers in Neural Circuits www.frontiersin.org November 2013 | Volume 7 | Article 177 | 16