thalamic projections to sensorimotor cortex in the macaque monkey: use of multiple retrograde...
TRANSCRIPT

THE JOURNAL OF COMPARATIVE NEUROLOGY 299:1746 (1990)
Thalamic Projections to Sensorimotor Cortexin the Macaque Monkey Use of
Multiple Retrograde Fluorescent Tracers
CORINNA DARIAN-SMITH, IAN DARIAN-SMITH, AND SURINDAR S . CHEEMA Brain Research Laboratory, Department of Anatomy, University of Melbourne,
Parkville 3052, Victoria, Australia
ABSTRACT We used several fluorescent dyes (Fast Blue, Diamidino Yellow, Rhodamine Latex
Microspheres, Evans Blue, and Fluoro-Gold) in each of eight macaques, to examine the patterns of thalamic input to the sensorimotor cortex of macaques 12 months or older. Inputs to different zones of motor, premotor, and postarcuate cortex, supplementary motor area, and areas 3bil and 215 in the postcentral cortex, were examined. Coincident labeling of thalamocor- tical neuron populations with different dyes (1) increased the precision with which their soma distributions could be related within thalamic space, and (2) enabled the detection by double labeling, of individual thalamic neurons that were common to the thalamic soma distributions projecting to separate, dye-injected cortical zones.
Double-labeled thalamic neurons projecting to sensorimotor cortex were rarely seen in mature macaques, even when the injection sites were only 1-1.5 mm apart, implying that their terminal arborizations were quite restricted horizontally. By contrast, separate neuron populations in each thalamic nucleus with input to sensorimotor cortex projected to more than one cytoarchitecturally distinct cortical area. In ventral posterior lateral (oral) (VPLo), for example, separate populations of cells sent axons to precentral medial, and lateral area 4, medial premotor, and postarcuate cortex, as well as to supplementary motor area.
Extensive convergence of thalamic input even to the smallest zones of dye uptake in the cortex ( = 0.5 mm3) characterized the sensorimotor cortex. The complex forms of these projection territories were explored using 3-dimensional reconstructions from coronal maps. These projection territories, while highly ordered, were not contained by the cytoarchitectonic boundaries of individual thalamic nuclei. Their organization suggests that the integration of the diverse information from spinal cord, cerebellum, and basal ganglia that is needed in the execution of complex sensorimotor tasks begins in the thalamus.
Key words: primates, 3-D reconstruction, frontoparietal cortex, sensorimotor processing
The hand is a sensorimotor organ. We use it to grasp and handle objects within reach, but also to explore with the fingers the size, shape, and surface features of these objects. The planning of these movements, their execution, and their continuous adjustments and modification in response to the stream of sensory information actually generated by the movements of the arm and hand each depend on the coordinated functioning of a number of specific areas of the cerebral cortex (Darian-Smith et al., '84, '85; Evarts, '81; Mountcastle, '84; Roland et al., '80). The distribution to this sensorimotor cortex of all information relevant to the action of the limbhand that is relayed from somatic tissues, as well as from the cerebellum and basal ganglia, occurs through specific thalamic nuclei. This is so not only for hand functions, but also for all directed actions of the limbs, trunk, neck, and head. The role of these thalamic nuclei in
the systematic distribution of their inputs to different parts of the sensorimotor cortex will depend on the organization of their thalamocortical projections. Do individual thalamic nuclei project only to localized areas of sensorimotor cor- tex? Or, does each thalamic nucleus contain neuron popula- tions that project to two or more functionally distinctive areas of this cortex?
The most systematic and influential investigations of thalamic connections to precentral cortex of the primate have been those of Jones and colleagues (for reviews see Jones '83, '85, '86, '87a,b; Jones and Friedman, '82). They used mainly horseradish peroxidase (HRP) and autoradiog- raphy for axonal labeling. The model of connections pro- posed from these studies has the unifying idea that the
Accepted May 17,1990
Q 1990 WILEY-LISS. INC.

18
transmission of information through thalamic nuclei to the cortex occurs through spatially separate, non-overlapping channels. Such a model proposes that individual thalamic nuclei have input from a single subthalamic source (medial lemniscus, particular cerebellar nuclei, globus pallidus, or substantia nigra), and project to a single cortical territory, so that, for example, information relayed from the cerebel- lum is transmitted only to motor cortex. Expressed at the single neuron level this model implies that individual cells have an exclusive input only from functionally similar input neurons (say, from cerebellar nuclei) or peripheral recep- tors (in thalamic sensory relay nuclei). In turn, these single thalamocortical neurons have restricted axonal arboriza- tions, with input only to a circumscribed population of cortical neurons, each of which responds similarly to the thalamic input: collaterals are uncommon. This nucleus-to- cortical-area model is highly restrictive in its organization, and ". . . permits no thalamic or thalamocortical integra- tion . . ." (Jones, '87a). The appropriate distribution to each cortical module of information from the spinal cord, cerebel- lum, and basal ganglia would occur only through the corticocortical connections. However, it is recognized that in the primate some well-established, although infrequent, thalamocortical relays do not fit this model.
Most other studies of thalamocortical projections to the precentral cortex have focused on nuclear rather than cellular organization. Strick and colleagues (Schell and Strick, '84; Strick, '75, '76, '85) examined projections to precentral cortex, and their data supported the nucleus-to- cortical-area pattern described above. However, other inves- tigators (see Table 11, using HRP, reported a rather dif- ferent organization of these thalamocortical projections. Instead of a nucleus-to-cortical-field projection, Kievit and Kuypers ('77) reported a highly ordered projection, de- scribed in terms of roughly parasagittal strips of thalamus projecting to coronally oriented cortical strips. The projec- tion pattern correlated poorly with the nuclear pattern of the thalamus, so that one thalamic nucleus commonly projected to two or more cortical fields, while a particular area of cortex might be the target of more than one thalamic nucleus. Other investigators (Ghosh et al., '87; Leichnetz, '86; Matelli et al., '84, '86, '89; Miyata and Sasaki, '83, '84; Wiesendanger and Wiesendanger, '85; Wiesendanger et al., '87; see Table 1) have reported a somewhat similar divergence of thalamic nuclear projection to the precentral cortex.
Thalamic projections to the macaque postcentral cortex have also been examined in recent years (Jones, '85; Jones and Friedman, '821, in some studies using pairs of retro- grade and anterograde labels (Cusick et al., '85; Jones, '83). Combining axon tracer techniques with the electrophysio- logical mapping of body representation within thalamic nuclei that relay somatosensory information to the cortex
C. DARIAN-SMITH ET AL.
has greatly enhanced these investigations (Jones and Fried- man, '82). However, there is continuing uncertainty about the details of thalamic projections to the specific cortical areas 3a, 3b, 1, and 2 (Jones, '85; Pons and Kaas, '85).
In looking for the reasons for these conflicting reports, the immense advantages of the modern axon tracing tech- niques should not blind us to their limitations. Probably, the main reason for this uncertainty about the patterns of projection of thalamocortical neurons is that in most studies the thalamic input to only one cortical area (the injection site of the enzyme) could be mapped in each experimental animal. This procedure necessitates the use of many experimental animals in any systematic study of the projections to different cortical fields, and of course, this is not always possible with experiments using monkeys. Fur- thermore, the cumulative uncertainties that occur when comparing the distributions of labeled thalamocortical cells in different animals limit the spatial resolution achieved, and the confidence with which these distributions may be closely compared. The imprecision in defining the zone of uptake of the axon tracers used, and the efficacy of these different labeling agents, add to the variability in the data obtained.
The aim of the present experiments was to obtain a clearer picture of the pattern of thalamocortical projections to the sensorimotor cortex of the mature macaque monkey. To improve the spatial resolution of the mapping proce- dures, the experiments reported differed from those of most previous studies in the following ways:
1. Multiple retrogradely transported fluorescent tracers were used. Four or five distinguishable fluorescent dyes were injected into separate localized zones of cortex in each animal. The dyes used had similar retrograde transport rates, so that the differently labeled neuron somas could all be identified at the same time, 12-16 days after their cortical injection. This allowed the direct matching of the distributions of differently labeled thalamic cells in the same brain sections. Commonly these distributions over- lapped, and when this occurred, the presence or absence of two dyes in individual cells ("double labeling") indicated if these neurons projected to one or both injected cortical fields.
2. 2-D maps were constructed of the thalamic territories within which the somas of neurons projecting to each cortical injection site were located. These reconstructions greatly helped in visualizing the thalamocortical projec- tions, but their real value resulted from the fact that the information embedded in the extensive, coronal serial 2-D maps obtained in each animal could be effectively correlated and summarized.
TABLE 1. Survev: Thalamic Proiedions to Precentral Cortex
Ventral thalamic nuclei Precentral cortical target areas Subcurtical thalamic Olszewski Jones M d a l Lateral inputs (1952) (1985) Motor SMA premotor PoStLWCUdk premotor 7 Mi K K K Globus pallidus VLO VLa M , L K,W,G J,S K,W J K M K J M K
VA VA G K, W
Cerebellum !+ spinothdamic) VLc,VPLo, X,VLps VLp J, S M, L K, W, G K, W Mi K J,S M K M K Substanti n iga VLm VMP K J? W Mi K K
Abbrewdtions: G, Ghosh et aJ ('871; J, Jones ('86, '87); K. Kievet and Kuypers ('77); L, Leichnetz ('86); M, Matelli et d. ('89): Mi, Miyata and S a d ('84); S, Schell and Stnck (19841: W, Weisendanger et al. ('87); W, Wesendanger and Weisendanger, '85.

THALAMIC INPUT TO MACAQUE SENSORIMOTOR CORTEX 19
Abbreviations
Thalamic nuclei: c1 central lateral Cn.Md centre m d i a n LP lateral posterior MD mediodorsal Pen paracentral Pul.0 anterior pulvinar Pu1.m medial pulvinar Sub.Th subthalamic VA ventral anterior X area X Ventral lateral (VL) complex: VLC caudal VLm medial VLO oral K P S posterior Ventral posterior complex: VPI Ventral posterior (inferior) VPLO Ventral posterior lateral (oral) VPLC Ventral posterior lateral (caudal) VPM Ventral posterior (medial)
A parallel study of thalamocortical projections to the sensorimotor cortex of the newborn macaque is reported in the following paper (Darian-Smith et al., ’90). It was found that although there are important differences in the thalamocortical projection patterns of infant and adult macaques, all pathways in the adult that are reported in the present paper were already established at birth. Hence, the projection patterns reported here reflect the findings ob- tained in the thalamic maps of cells labeled by more than 80 cortical injections in 19 animals.
MATEXULSANDMETHODS Eight colony-bred male macaque monkeys (Macaca nem-
estrina), aged from 12 months to 7 years, were used (see Fig. 1 for details). In the text these monkeys are described as “mature,” in contrast to the newborn animals consid- ered in the following paper (Darian-Smith et al., ’90); this reference is to their sensorimotor behavior.
surgicalprocedures Each monkey was first anesthetized with an intramuscu-
lar injection of ketamine hydrochloride (10 mgkg body weight), and Xylazine (2 mgkg). An endotracheal tube was inserted and surgical anesthesia then maintained with a halothane/02/N,0 mixture. The sensorimotor cortex was exposed aseptically, and the central, intraparietal, and arcuate sulci identified. Following the intracortical injec- tion of the fluorescent dyes, the dura was sutured or repaired using thin silastic membrane, and the scalp wound closed. Postoperative recovery was rapid and uneventful, and, in particular, there was no apparent impairment of the use of the contralateral hand. Furthermore, at the time of perfusion there was no distortion of the brain adjacent to the craniotomy.
Fluorescent dyes Our use of the retrograde axon transport of up to five
fluorescent dyes as tracers simply extended the previous use of two or more such dyes in the one brain (Bentivoglio and Molinari, ’84; Bentivoglio et al., ’81; Keizer et al., ’83). The five fluorescent dyes used were: Fast Blue (FB, 2% aqueous, Illing GmbH), Rhodamine Latex Microspheres
(RLM, in solution as supplied, Lumafluor), Diamidino Yellow dihydrochloride (DY, 2% aqueous, Illing GmbH), Evans Blue (EB, 4% aqueous, Sigma), and Fluoro-Gold (FG, 8% aqueous, Fluorochrome; Schmued and Fallon, ’86). Each of these dyes is retrogradely transported within the axon from the injection site to the neuron soma, where it can be visualized 2 weeks following injection. Each dye was injected into the cortex, 1-1.5 mm below its surface, using a glass micropipette (tip diameter of 50--100 pm) attached to a Hamilton syringe. At 12-16 days following the cortical injection each monkey was deeply anesthetized with ketamine and perfused through the left cardiac ventri- cle, with the following solutions: (1) 0.9% sodium chloride in 0.1 M sodium phosphate buffer at pH 7.2, (2) 6% paraformaldehyde in the same buffer, and (3) a solution of 30% sucrose in the above buffered fixative. The brain was then photographed and stored in the 30% sucrose solution until the next day, when serial, 40 km frozen sections were cut in the coronal plane, mounted, and stored at 4°C for subsequent examination. Fluorescence in these sections was identified using a Leitz Ploemopack fluorescence micro- scope. An excitation wavelength of 360 nm was used for identifying FB-, DY- and FG-labeled structures, and of 550 nm for visualizing those labeled with RLM or EB.
The dye injection sites in each monkey are tabulated in Fig. 1, and typical histolog- ical sections shown in Fig. 2. Each dye injection site was reconstructed by plotting the appropriate fluorescence zone in every third serial section that traversed it (Fig. 3) . The central zone of each injection site for all five dyes was easily identified, either as necrotic or intensely fluorescent re- gions. Their boundaries [first zone of Keizer et al. (’8311, and those of the surrounding haloes of fluorescent tissue (second zone), were identified and mapped. The latter outer boundary at the just-visible limit of tissue fluorescence was used to define each injection zone. Since all injection volumes were small (Table 21, spread of the injected dye into the subcortical white matter was uncommon, and when it did happen the resulting retrograde transport of tracer was interpreted with caution. In a few experiments (Figs. 17 and 191, a row of these injections were made to extend the zone of uptake of dye. Adjacent cresyl-violet- stained sections of the cortex were used to identify the cyto-architectonic field(s) into which each dye was injected.
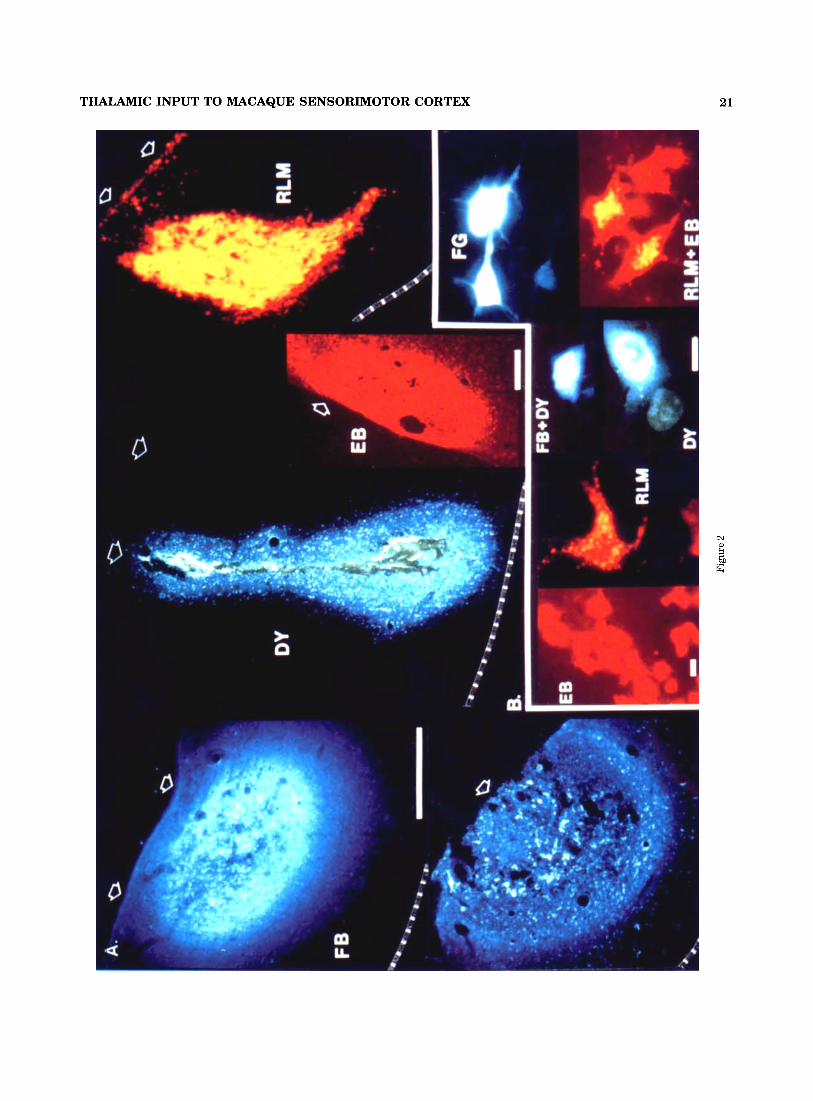
Distributions of retrogradely labeled thalamic neu- rons. Fluorescent neurons were identified in unstained sections using oil-immersion objectives. FB-labeled cells were identified by a blue fluorescence of the cytoplasm; DY-labeled cells by their yellowish fluorescent nuclei; RLM- labeled cells by a distinctive golden fluorescence of micro- spheres in the cytoplasm; EB-labeled cells by an even red fluorescence of the cytoplasm; and FG-labeled cells by an even white or gold fluorescence of the cytoplasm. Double- labeled neurons, uncommon in the present experiments, are described in the following paper (Darian-Smith et al., ’90). The outline of each section, the reference gridlines marked on each section, and the position of each labeled neuron were recorded using a computer-linked digitizing system. This comprised X- and Y-transducers mounted on the microscope stage, with output to analogue-to-digital converters, an Apple IIe microcomputer, and a digital plotter (Houston DMP40). Data were stored on floppy disks.
Intracortical injection sites.

20 C. DARIAN-SMITH ET AL.
Monkey
# Age
1 1.5yr
2 4
3 5
4 1
5 2
6 1.5
7 1.3
8 7
Injections
Postcent ral I Precentral
I 2 2 11 7 6
Fig. 1. Locations of the cortical dye injections in each of the eight mature macaques, plotted onto a dorsal view of the cerebrum. Two injection sites were used in supplementary motor cortex (SMA), one being labeled with the star. Dyes used in each monkey are tabulated, using the following abbreviations. D, Diamidino Yellow; B, Fast Blue; R, Rhodamine Latex Microspheres; E, Evans Blue; F, Fluoro-Gold. Column 2 lists the age of each monkey.
f k d y S ’ k of the spatid distributions of labeled neuronsomas
Fig. 2. A: Cross sections of injection sites within cortex, visualized by fluorescence microscopy. Cortical surface identified by short arrows and junction with underlying white matter by interrupted lines. FB (Fast Blue): sections through outer part of injection site (upper), and the necrotic central zone (lower). DY (Diadimo Yellow): injection site with central necrotic zone. EB (Evans Blue) and RLM (Rhodamine Latex Microspheres): injection sites that normally lack a necrotic core. Horizontal bar = 500 ,,m, B: Single thalamic neurons retrogfadely labeled with one or two fluorescent dyes (“double label”: FB + D Y RLM + EB). Horizontal bar = 15 pm.
The sequence of analysis was as follows:
The positions of fluorescent thalamic in every tenth section (i.e., at 400 !-Lm intervals) were mapped; this included both neurons containing one dye, and those labeled with two dyes. In most experiments the maps ex-
THALAMIC INPUT TO MACAQUE SENSORIMOTOR CORTEX 21

22 C. DARIAN-SMITH ET AL.
tended from planes +11.1 mm to +3.3 mm in Olszewski's ('52) atlas. This usually involved the preparation of 16-18 coronal maps to span the rostrocaudal extent of labeled neurons.
2. A section immediately adjacent to that mapped for fluorescent neurons was stained with cresyl violet and photographed, and the labeled-cell distributions correlated with the cytoarchitecture. Olszewski's ('52) classification of nuclei was used, subject to the modifications predicated by discrepancies in his maps (see below).
3. The number of fluorescent neurons within each iden- tified thalamic nucleus in each section was tabulated and further subdivided according to the particular labeling dye. When there was uncertainty about the boundary between adjacent nuclei, an intermediate zone was defined, and the cells within this area counted separately. 4. The rostrocaudal distribution of each population of
labeled somas was then determined by examining the completed series of coronal maps for each monkey. These soma distributions were then matched against the limits of the respective histologically identified thalamic nuclei within which they were located (Figs. 10 and 14). When a labeled- soma distribution extended beyond the histological limits of a particular nucleus, which was common, care was taken to identify any discontinuity in the cell distribution. The examination of sections at 200 bm intervals was sometimes necessary to determine this.
5 . The procedure for correlating the data obtained in different monkeys was to sum the total number of fluores- cent neuron somas within each thalamic nucleus that were labeled by the injection(s) made into a particular cortical field. This procedure is illustrated in Fig. 11 for thalamic projections to different areas of the precentral cortex, and for projections to postcentral cortex in Fig. 18. For any one cortical area, such as supplementary motor cortex (SMA), the resulting histogram provides a rough index of the relative inputs from the different thalamic nuclei.
6. Three-dimensional reconstructions of the separate distributions of labeled thalamic cells projecting to individ- ual dye injection sites (commonly about 1 mm3) in the sensorimotor cortex were made using VersaCAD 5.4 soft- ware (VersaCAD Corp., CAI, running on an Everex STEP 386120 (Everex Systems Inc., CAI. The display system was a Number Nine PEPPER Pro 1280 256 color graphics card (Number Nine Computer Corp., MA) and Hitachi CM2086A monitor. These reconstructions were based on maps spaced at 800 p,m intervals, simply because of the limitations of the software. Although not illustrating the full spatial resolu- tion apparent in the more complete stacks of coronal maps, we found these 3-D syntheses of great value. Extensive manipulation of the data was possible. Each soma distribu- tion or territory could be examined separately, from any selected viewpoint, and compared with any other popula- tion(s) of labeled thalamic neurons or with relevant tha- lamic nuclei that had been mapped for that animal (Figs. 7, 12).
Cy toa rch i t ec~ of thalamus and sensorimotorcortex
Thalamic nuclei. We used Olszewski's atlas ('52) as the reference for identifying all thalamic nuclei, but found some minor boundary inconsistencies in his maps that were relevant to the present work, and that needed some adjust- ment to match with our findings. Adjustments are apparent
in the boundaries of the following thalamic nuclei in the figures of this paper:
The caudal end of VLm in Olszewski's map (+8.7 mm) abruptly changes to VPI (8.1 mm). We were unable to demarcate these nuclei, or to detect discontinuity in labeled soma distributions in this zone. The region we called VLm extended caudally to the level of the rostral pole of VPLc (about + 7.0 mm).
In Olszewski's coronal map at +8.7 mm X has a substantial cross-section, but suddenly disappears from the next caudal map (+8.1 mm), to be replaced by a much expanded VPLo. We identified X as the most medial part of the "cell-sparse" region in the ventral nuclear complex in most animals for about 1 mm more caudally.
We were uncertain of the boundary between C1 and lateral MD in most sections (+6.9 mm - +4.5 mm in Olszewski's map).
The most rostral part of the pulvinar, posterome- dial to VPLc, was designated Pu1.o. Differentiating Pu1.0 from the more caudal Pu1.m was difficult (see also Asanuma et al., '83a).
VLo. Olszewski's delineation of this nucleus differs significantly from some recent descriptions (Asanuma et al., '83a; Schell and Strick, '84). This difference is consid- ered later.
As the experiments progressed it became clear that Jones' recent proposal ('85) for grouping VLc, VPLo, X, and VLps together (designated VLp) was compelling. We had great difficulty in demarcating these nuclei either in terms of cytoarchitecture or thalamocortical projections.
Defining the borders of areas 3b, 1 ,2 , and 5 has been considered and illustrated in Powell and Mountcastle ('59), Jones et al. ('781, and Pons and Kaas ('85). The uncertainties in defining both (1) these bound- aries from the cortical cytoarchitecture, and (2) the bound- ary of the zone of uptake of the dye limited the specification of the zone of uptake based on its 3-D reconstruction, to two categories, namely, areas 3b/l and 215. Parcellation of precentral cortex also has its problems and a long history (Barbas and Pandya, '87; Matelli et al., '89; Sessle and Wiesendanger, '82; Wise and Strick, '85). In the present experiments the location of each injection site is described in terms of relevant cytoarchitectural features, and of surface landmarks.
We used multi-unit electrophysiological mapping of the hand and finger representation in cortical area 3bll in a couple of the early experiments, with the aim of improving the definition of the sites of dye injection. However, this procedure was discontinued for the following reasons: (1) the procedure at best improves the specification of the injection site in the anesthetized macaque only for areas 3b and 1, and not for areas 2 and 5 , nor for any precentral injections, (2) experimentally useful maps of finger and hand representation in areas 3b and 1 require considerable detail (Nelson et al., ' 80) , and greatly prolong the surgical exposure of the cortex to be injected, and (3) even mapping areas 3b and 1 is not a reliable procedure in the anesthe- tized newborn or prematurely delivered macaques used in the following paper (Darian-Smith et al., '90). We decided that in the present experiments the additional information about dye injection sites that would be obtained by multi- unit mapping of the postcentral cortex was outweighed by the disadvantages of the procedure.
VLm.
X .
Cl.
PuZ.0.
Cortical fields.

THALAMIC INPUT TO MACAQUE SENSORIMOTOR CORTEX 23
Abbreviations used for thalamic nuclei Although Olszewski ('52) included VPLo in the ventral
posterior complex, Jones ('85) includes it in the ventral lateral complex (Jones's VLp). This reclassification is based mainly on (1) a common cerebellar input to VPLo and other nuclei of VL, and (2) a supposed common cortical projection of these same nuclei solely to the motor cortex. The experiments reported in this paper indicate that (2) is improbable.
RESULTS Fluorescent dyes as a retrograde axon tracer Five fluorescent dyes (FB, DY, RLM, EB, and FG) were
used in these experiments to map the thalamocortical projections to extensive areas of the sensorimotor cortex. Corticocortical projections were also examined in these macaques, but are not considered here. The unique appear- ance of neuron somas labeled with each of the five dyes has been well described (Bentivoglio and Molinari, '84; Bentivo- glio et al., '81; Conde, '87; Craig et al., '89; Keizer et al., '83; Payne and Peace, '89; Schmued and Fallon, '86), and matched with our experience. These dyes, when injected into the cortex at the one operation, proved to be reliable in labeling thalamic neuron somas 12-16 days later, although FG did fail to do so in a few experiments, for no obvious reason. FG and FB both sometimes produced some glial uptake 12-16 days following the injection, but this was readily differentiated from nearby primary neuronal up- take. Fading of the fluorescence in mounted sections was severe after 6 months for all the dyes used, and most rapid for EB. All our mapping was completed between 2 and 6 weeks after perfusing the brain.
Visualizing simultaneously the soma distributions of the neuron populations projecting to several different cortical fields in the one experimental animal has important advan- tages: (1) many fewer experimental animals are used, especially important when using primates, (2) neurons with axon projections to two of the injection sites can be identi- fied by "double labeling" of the neuron soma, and (3) the most important advantage relevant to this study-the increased precision with which the thalamic soma distribu- tions of the neuron populations projecting to different cortical fields could be correlated in the sections of one brain.
All cortical injection sites were reconstructed from serial sections, and their extent, vol- umes, and relations to the surrounding cortex and to adjacent injection sites were systematically measured. Fig. 3 illustrates one such reconstruction, and Table 2 summa- rizes the dimensions of cortical injection sites in this and the following paper (Darian-Smith et al., '90). The age of the animal did not seem to influence the intracortical spread of injected dye. Injection sites involving several separate dye injections have been omitted from the tabula- tion. The boundary of the injection sites illustrated and plotted in Figs. 2 and 3 corresponds to the just-visible outer limit of tissue fluorescence described by Keizer et al. ('83) as the second zone. In our study it is assumed that dye uptake by the axon can occur from any part within this boundary, although it has been argued (CondB, '87) that this uptake of dye may be restricted to the much smaller region (zone 1) within which tissue necrosis is observed. With 13 FB cortical injections the volumes of both the first and second
Dye injection sites.
Macaque #8
Fig. 3. Series of coronal sections through three fluorescent dye injections in motor cortex of macaque 8. Sections shown were 400 Fm apart. Inset at upper left shows the respective positions of these injections in the rostra1 lip of the central sulcus (CS). IPS, intraparietal sulcus. Dye abbreviations as in Fig. 2. Photograph is of section of whole injection site of DY. Volumes of mapped injection sites were: EB, 11.7 mm3; FB, 8.1 mm'; DY, 1.1 mm'. This estimate was based on the outmost boundary shown in photograph, and is likely to be substan- tially larger than the zone of uptake of dye by axon terminals (CondB, '87). The volume of the inner intensely fluorescent zone of each dye injection site was about one-third of the more conservative estimate that we report.
zones of Keizer et al. ('83) were estimated, the respective means being 6.60 and 1.76 mm3. The volume of the first zone, then, was about 27% of the outer second zone. If the dye uptake by axon terminals was limited to the first zone,

24 C. DARIAN-SMITH ET AL. TABLE 2. Dimensions ofvisible Cortical Injection Sites
Fluorescent dye
FB DY RLM EB FG
No. of injection
sites
15 17 18 15 6
Mean injected
volume dye
( k1)
0.42 0.82 0.70 0.40 0.47
Mean volume
of injection
site (mm’)
7 14 (SD = 4.98) 1.36 (1.14) 1.61 (1.201 5.67 (2.98)
15.44 16.71)
Mean diameter
of injection
site (mm)
1.9 1.1 1.2 18 2.5
then the convergence of thalamic input to the sensorimotor cortex was substantially greater than we describe.
We observed with FB and DY that retrograde labeling of neurons was always associated with necrosis within the injection site: with four injections (2 x FB, 2 x DY), not included in the present series, in which no such necrosis was observed, there was no retrograde labeling of neurons. With FG, necrosis was usually seen within the zone of injection, but was not essential for uptake. FG was the least satisfactory of the dyes we used, because even with small injection volumes the spread in the cortex was substantial (Table 21, and often difficult to define with confidence (see Fig. 13). Necrosis was not observed within cortical injection areas for EB and RLM. RLM injection sites were sharply demarcated from the surrounding tissue, and with compa- rable injection volumes were usually smaller than those of other dyes. The estimated volumes of injection sites are stated in the legend of each figure. With six experiments the cortical injection zone for a particular dye was designed to be an extended strip (Figs. 17 and 19), requiring several injections of the one dye. Only three injections reported here spread beyond the cerebral cortex into the underlying white matter. In each instance this spread was small, and no unusual thalamic labeling was observed. In the only experiment in the present series in which more than a few double-labeled individual neurons were observed, the injec- tion sites of the dyes involved were closely apposed, and visibly overlapped in histological sections of the cortex.
Thalamocortical projections to sensorimotor cor- tex In most experiments four fluorescent dyes were in- jected into particular localized zones of the sensorimotor cortex. Fig. 1 summarizes these injection sites in the eight macaques used in the study. The three main combinations of dye injection were (1) a series of injections of the four dyes extending across a particular cortical field, as in monkeys 5 and 6 (area 3b/l), and in monkey 8 (area 4), (2) a sequence of injections scanning the sensorimotor represen- tation of the handlforearm (monkeys 3 and 41, and (3) a series of precentral dye injections, either within the large premotor cortex (monkey 7), or near the midline, and including medial motor cortex, SMA, and anterior premotor cortex (monkeys 1 and 2 ) .
Before examining details of the thalamic projections to different cortical fields, some features common to their organization in macaques, 12 months or older, should be considered:
1. Individual thalamocortical neurons in all the thalamic nuclei examined projected to a circumscribed area of cortex, probably less than 1 mm in diameter. Excluding the experiment illustrated in Fig. 19, in which some cortical injection sites overlapped, two fluorescent, dyes were identi-
fied in fewer than 30 of 20,400 labeled neurons mapped in the present experiments. This absence of double labeling was striking in view of the fact that (1) with ten pairs of injections the separation of the boundaries of the injection sites was between 1.0 and 1.5 mm, and ( 2 ) double-labeled cells were often observed in newborn macaques, when the separation of injection sites was 4 mm or even more (Darian-Smith et al., ’90).
2. Each thalamic nucleus, whether defined by the cytoar- chitectonic criteria of Olszewski (’52), or by those recently proposed by Jones (’85), included within its boundaries two or more separate thalamocortical neuron populations that projected to different cortical fields.
3. Each area of the precentral cortex that was examined received input from more than one nucleus within the ventral complex of thalamic nuclei, and often also input from intralaminar and/or the mediodorsal nuclei. 4. Each area of the postcentral cortex examined received
input from VPLc and Pul.0, and a quite small input from the intralaminar nuclei.
5 . Rather than defining these projections in terms of the cluster of thalamic nuclei projecting to each cortical entity, a more realistic description of the soma distribution of thalamic neurons projecting from ventral thalamic nuclei to a particular cortical module, say 1 mm across, appears to be in terms of the 3-D envelope that contains this neuron population. For most areas of the macaque’s sensorimotor cortex this envelope or territory was found to be elongated rostrocaudally, and extended through two or more thalamic nuclei. As is apparent in all the maps illustrated in this and the following paper, thalamocortical neurons labeled with a particular dye were usually packed fairly closely, with few outlying, isolated cells. Constructing the envelope for each cell distribution was therefore straightforward: only the occasional outlying labeled neuron was excluded from the defined territory. The envelopes of adjacent soma distribu- tions projecting to quite different cortical fields often overlapped. To appreciate the extent of this overlap in the 3-D reconstructions the envelopes had first to be visualized singly, and then in combination.
6. A mediolateral lamellar somatotopy was identifiable within the soma distribution extending through VLo, VLc, VPLo, X, and VLm, which projected to motor cortex, and in that within VPLc that projected to somatosensory areas 3b, 1, and 2. In the other dorsal thalamic nuclei and MD, intralaminar and pulvinar nuclei, somatotopy was not apparent, but neuron populations with different cortical targets retained a fixed spatial relationship to each other.
A more detailed description of the thalamic projections to each major cortical area of the sensorimotor cortex follows. The important cortex surrounding the buried part of the central sulcus, including area 3a, however, was not system- atically analyzed because of the technical difficulty of obtaining a high “hit-rate’’ in correctly placing the dye injections. This key area of cortex has also been a blindspot in many previous studies of the connections of the sensori- motor cortex of the macaque. Experiments focused on this cortex are currently being done in our laboratory.
Projections to area 4 Seven dye injections were made within area 4, close to the
central sulcus (see Fig. 1). With all of these injections Betz cells could be identified in cresyl violet sections in the cortex rostra1 to the injection. Three of these injections were in
THALAMIC INPUT TO MACAQUE SENSORIMOTOR CORTEX 25
monkey 8, (Fig. 31, the most lateral of these approximating in location to the zone of representation of the hand (Darian-Smith et al., '85; Woolsey, '64) and the most medial within 7 mm of the medial surface of the cerebral hemi- sphere. The remaining injections in four different monkeys were either near the midline (monkeys 1 and 2), or lateral (monkeys 3 and 41, as in monkey 8. The goal was to locate the distribution of labeled somas in the thalamus that projects to the more caudal part of area 4, and to specify accurately the previously reported anatomical somatotopy (Jones et al., '79; Matelli et al., '89; Sessle and Wiesendan- ger, '82; Strick, '76) within this thalamic territory. Figs. 4-1 1 illustrate our findings.
Fig. 4 illustrates 6 of the 18 coronal maps of neurons labeled with the three fluorescent dyes injected into area 4 in monkey 8. Fig. 5 shows the cytoarchitecture of sections matching with these maps. The data demonstrated that (1) thalamic neurons projecting to motor cortex extended through the anterior 4.5 mm of the ventral nuclear com- plex, (2) this distribution extended through a succession of thalamic nuclei, including VLo, VLc, WLo, and VLm, (3) a somatotopic distribution of labeled thalamocortical neu- rons was present through the rostrocaudal extent of this projection territory, cells projecting laterally to the hand area being medially located, and those projecting to the medial part of the motor cortex forming a laterally posi- tioned lamella, and (4) the soma distributions of popula- tions of thalamic neurons projecting to adjacent areas of motor cortex overlapped substantially, but only rarely were individual cells in these populations double-labeled; segrega- tion of each projection from its neighbors was virtually complete.
Fig. 6 illustrates an important additional feature of the soma distributions of thalamocortical neurons projecting to area 4 in monkey 8. In this series the soma distribution of cells projecting to a single cortical zone, 1.0 mm in diameter (see Fig. 3 for reconstruction), and located in the medial part of area 4, is shown in each of 16 coronal maps of the thalamus; successive maps were 400 pm apart. DY was the labeling fluorescent dye. This soma distribution was contin- uous throughout its rostrocaudal extent. The envelope enclosing the whole soma distribution highlights several of its features, as is shown in Fig. 7.
Fig. 7 is a 3-D synthesis of the envelopes enclosing the three soma distributions of neuron populations projecting to area 4 of monkey 8. The upper left figure orients the viewer: the stack of coronal sections of the ventral thalamic complex on which the reconstruction is based are outlined in white, with the midline on the right-hand side. The viewer is anterior, lateral, and slightly above the rostra1 extent of the right thalamus. The colored solid form outlines the boundaries of the nuclear cluster VA, VLo, VLc, VPLo, X, VLm, VPLc and VPM, which are mapped in Fig. 3. Colors separate the successive maps. In the upper right figure the viewpoint is unchanged. The colored solid forms define the thalamic soma territories for projections to the injection sites in the motor cortex illustrated in Fig. 2. The green solid defines the neuronal territory projecting to a cortical module (1 mm in diameter, near the midline; dye is DY). Neurons within the blue territory project to a module whose position approximates to the representation of the proximal forelimb (dye is FB), and the small red caps identify the most dorsal part of the thalamic territory projecting to a module in the laterally placed hand represen-
tation in the motor cortex (dye is EB). In the lower left figure the same thalamic territories are shown, but now the viewpoint is anterior, near the midline, and its elevation has not been changed. The laminar, somatotopic arrange- ment of these three territories is now clear. What is not shown is the overlap of these territories, apparent in the coronal sections of Fig. 4, or if one or another of the territories is deleted from the 3-D representation. Such a dissection is illustrated in Fig. 12. The lower right figure shows the medial view of the three projection territories, the most ventral extension enveloping the thalamocortical neurons within VLm.
In Figs. 8 and 9 (monkey 21, the soma distribution of thalamocortical neurons projecting to the most medial part of area 4 is illustrated along with projections to premotor cortex. The envelope surrounding the distribution project- ing to the medial motor cortex was located in the most lateral part of the ventral nuclear complex, separated from the internal capsule only by the shell of the thalamic reticular nucleus.
Finally, in both monkeys 3 and 4 (Fig. 10, upper tabula- tion) the dye injections in area 4 were located more laterally than in the other experiments, and possibly extended into the head representation lateral to that of the hand. As expected from our findings above, the soma distributions were quite medially positioned in the ventrolateral nuclear complex, and their envelopes now traversed not only VLo, VPLo, VLc and VLm, but also X. The orderly change in the respective projections of each of these nuclei to successively more lateral areas of motor cortex simply reflected their somatotopic organization.
The thalamic nucleus VLo poses a problem in the present experiments, and in those on newborn monkeys reported in the following paper (Darian-Smith et al., '90). Olszewzki ('52) demarcated the VLo on the basis of large clusters of ". . . plump, dark, round or oval . . ." cells. These dense islands of neurons are surrounded by cell-sparse zones that are continuous with, and similar in appearance to, the adjacent cell-sparse VLc and VPLo. Asanuma et al. ('83a), and later, Schell and Strick ('84) have opted to label only the darkly staining cell clusters as VLo, and the enveloping spaces as extensions of VLc and VPLo. In practical terms, this cytoarchitectonic demarcation is sometimes difficult in the mature and infant brain (Darian-Smith et al., '90). For this reason we have used the more inclusive boundaries described by Olszewski ('521, a point to be remembered when relating our findings to those of Jones, Schell and Strick, and others. In our account above of the thalamic projections to motor cortex, a projection from VLm is described (see Figs. 4, 6, 8, 10, and 11). No such projection was reported by Jones and colleagues (see Jones's review, '86), nor by Schell and Strick ('84). In this instance the disparity is actual, and does not result from the different definitions of VLo that were used. We did regularly observe that clusters of labeled thalamic cells relaying to caudal area 4 matched well with the clusters of darkly staining neurons in cresyl violet sections. Commonly, however, there were also labeled cells (which we counted as being in VLo) that did not overly these cell clusters.
So far, only projections from the ventral thalamus to motor cortex have been addressed. However, it is apparent from the maps in Fig. 3, and the summarizing histogram in Fig. 11 that the intralaminar nuclei, central lateral (Cl), and centre median (Cn.Md) nuclei also have significantpro- jections to all parts of area 4 that we examined, con-

26 C. DARIAN-SMITH ET AL.
Macaque #8
X
MD
c
';vpM \ Cn.Md \
Fig. 4. Series of coronal sections through thalamus of macaque 8, illustrating the soma distributions of neurons labeled with EB, FB, and DY. These dyes were injected into motor cortex 16 days previous to perfusion of the brain, their locations, viewed from above, being shown in the upper left insert in A.; A, plane of section of map A,; CS, central
sulcus; IPS, intraparietal sulcus. Dye abbreviations as in Fig. 2 . The coronal sections extend from 2.4 mm to 6.8 mm caudal to the rostra1 boundary of VLo. Labels of thalamic nuclei are those of Olszewski ('52 1, and are listed in Materials and Methods.

THALAMIC INPUT TO MACAQUE SENSORIMOTOR CORTEX
A.
27
D.
F.
Fig. 5. Coronal sections (40 pm thick) of thalamus of macaque 8 stained with cresyl violet. These sections correspond to those labeled A, D, and F of Fig. 4.
firming earlier observations of Strick ('75). Finally, a small projection from the anterior pulvinar nucleus (Pu1.o) to the medial motor cortex was observed in mature macaques (Fig. 11). In the newborn macaque we regularly observed a widespread pulvinar projection to precentral cortex (Darian-
Smith et al., 'go), which apparently shrinks to this remnant in the medial motor cortex of the mature monkey.
Insummary: 1. Each part of cortical area 4 receives input from two
groups of thalamic nuclei: (1) the ventral group of thalamic

28 C. DARIAN-SMITH ET AL.
Fig. 6. Serial sequence of 16 coronal maps, 400 km apart, of the soma distribution of neurons labeled with DY injected into motor cortex of macaque 8. This rostrocaudal sequence demonstrates the continuity of the soma distribution, extending 6 mm and traversing VLo, VPLo, and VLc and reaching LP. These maps include those shown in Fig. 4 (labeled in upper left corner).
nuclei, which includes VLo, VLc, VPLo, VLm, X, and VLps, and ( 2 ) the intralaminar nuclei, including C1 and Cn.Md.
2 . The soma distribution within the ventral thalamic nuclei of neurons projecting to a localized region of area 4 is a continuous territory that extends rostrocaudally through most of the ventrolateral nuclear complex, as well as through VPLo. In coronal sections through VLo and VPLo each of these territories is lamellar, oriented approximately vertically, and spans the dorsoventral extent of these nuclei. In VLc somatotopy is still present but the distribu- tions are not lamellar, having expanded somewhat in the mediolateral direction. Although these adjacent territories overlap, they are somatotopically organized; their constitu- ent neurons are not shared, but project to only one localized zone of cortex.
3. Thalamocortical neurons projecting to motor cortex near the midline are located in the most lateral thalamic lamellae, which traverse VLo, VLm, VPLo, VLc, and possi- bly VLps. Cells projecting to lateral area 4, e.g., to the hand representation, are more medial, with some now being located in X.
4. The projections from intralaminar nuclei to area 4 appear not to be somatotopically organized.
Projections to medial premotor cortex The precentral cortex demarcated by the central sulcus,
the medial surface of the hemisphere, the arcuate sulcus anterolaterally and the spur of the arcuate sulcus laterally (Fig. 1) is quite large. Area 4 can be recognized histologi- cally by the presence of Betz cells, and approximates to the primary motor cortex characterized by its high electrical excitability (Sessle and Wiesendanger, ’82). However, both criteria prove to be uncertain when it comes to defining the boundary between primary motor cortex and “premotor” cortex. Barbas and Pandya (’87), in fact, identify a transi- tion field, which they designate 6DC. Similarly, identifying the boundary between premotor cortex and the medially located ShU (Woolsey, ’64) proves to be uncertain. In the present study we attempted to minimize these demarcation problems by placing the dye injections well away from the contentious boundary areas. This was possible when exam- ining the connections of area 4 and the rostra1 part of

THALAMIC INPUT TO MACAQUE SENSORIMOTOR CORTEX 29

30
B.
C. DARIAN-SMITH ET AL.
Fig. 8. Coronal maps (monkey 2) of soma distributions of thalamocortical neurons labeled with EB, DY, and FB, injected into rostral premotor cortex, SMA, and medial motor cortex, respectively. Inset at upper left shows the injection sites viewed from above. Dye abbreviations as in Fig. 2. Volumes of injection sites: EB, 3.4 mmJ; DY, 1.3 mm’; FB, 12.1 mm’. Distance of each coronal section behind the rostral boundary of VLo is indicated in upper right corner of each frame.

THALAMIC INPUT TO MACAQUE SENSORIMOTOR CORTEX 31
B.
D
F.
Fig. 9. Coronal sections, 40 km thick and stained with cresyl violet, of thalamus of macaque 2. These sections correspond to the maps labeled A, D, and F in Fig. 8.
premotor cortex (medial 6aa and 6ap of the Vogts, ’19; 6DR of Barbas and Pandya, ’87). However, what we term SMA is simply the most medial part of the premotor cortex extend- ing onto the medial hemispheric surface, which, in fact, did
prove to have a thalamocortical projection pattern differing from that of the more laterally placed premotor cortex.
In monkeys 1 and 2 one of the dye injections was placed in the anterolateral part of area 6aa (Figs. 8 and 9), the others being placed in medial area 4 and SMA, respectively. The findings in the 2 animals were similar. The thalamocortical projection patterns to each of the cortical injection sites were quite different, as can be seen from the coronal maps (Fig. 8 ) and the 3-D reconstruction in Fig. 12. The labeled soma distribution for cells projecting to premotor cortex was compact, continuous, and extended caudally and medi- ally from VA, through VLc, X, and possibly also VLm, but not in the more lateral VLo. This territory did not overlap with that of the projection to the medial motor area 4. There was also a separate thalamocortical projection from the mediodorsal nucleus (MD), but in monkey 2 this was caudal to the section in Fig. 8F.
Fig. 12 is a 3-D reconstruction of thalamic territories projecting to different areas of the right sensorimotor cortex. It differs from Fig. 7 in two respects. First, Fig. 12 includes the posterior thalamus, with the pulvinar: only the more rostral thalamus is illustrated in Fig. 7. Second, it is a summary figure based closely on maps from several mon- keys reported in either this or the following paper (Darian- Smith et al., ’90): Fig. 7 is based solely on the data from monkey 8. In Fig. 12 the thalamus is seen from the same location for both upper figures and also for the lower left figure; as with the two upper figures in Fig. 7, the viewer is anterior, somewhat lateral, and above the thalamus. The lower right figure is a lateral view of the thalamus, with the rostral pole to the right.
The red territory in Fig. 12 envelopes thalamic neurons projecting to a cortical module in the motor cortex near the midline, and corresponds to the green territory in Fig. 7. The spatial relations of this “motor” territory to those projecting to modules in premotor cortex (blue), SMA (yellow), and cortical area 3bil near the midline (purple) are illustrated in the different views of the ventral and medial thalamus.
Fig. 12 also illustrates the extensive medial (blue) tha- lamic territory within the ventral lateral complex that projected to a module in the premotor cortex. Rostrocau- dally this territory extended through about 6 mm of the thalamus, was rather flattened mediolaterally, and tra- versed several ventral thalamic nuclei, as described earlier. Separate distributions, largely contained within the me- diodorsal nucleus, outlined in green, also converged on cortical modules in the premotor cortex; one such territory (also blue) is shown in the lower left figure.
Further analysis of thalamic projections to premotor cortex (monkey 7) is presented in Figs. 13 and 14. In Fig. 14 the labeled neurons in each of 20 sections (successive sections were 400 km apart) have been tabulated, and correlated with the rostrocaudal extent of each thalamic nucleus. As in monkeys 1 and 2, each premotor cortical zone received input from VA, VLc, X, and MD, but again not VLo. In this experiment there were some differences in the thalamic inputs to the four premotor cortical zones, but the thalamic soma territories overlapped substantially, and were quite similar in their rostrocaudal, medial, and some- what dorsal location within the ventral nuclear complex. Whether the differences observed were regional, or due to variability in the labeling with different dyes, was not determinable from these data.

32 C. DARIAN-SMITH ET AL.
Nuclei
AFFERENTS TO LATERAL MOTOR CORTEX
CORONAL MAPS OF LABELED THALAMIC NEURONS
Serial sections 40pm Ihick: 400pm between successive maps
Total
labeled
caudal 6mm rostra1
Section 5
I
Section 5
Macaque #3
Nuclei
VA
VANLO VLO
VLm
VLoNPLo VPLO
VPLoNLc x
VLC
VLps
VPLoK
VPLC
PUl.0
LP
VLC/LP MD
Cn.Md Pcn CI
I AFFERENTS TO POST-ARCUATE CORTEX I
neurons
16
232 618
170
447 112
128
26
46
14
4 35 15
347 33 230
#4
Labeled neurons
4
82
28 5 343 55 548 9
22
2
10
a8
8 264
Figure 10

THALAMIC INPUT TO MACAQUE SENSORIMOTOR CORTEX
Precentral cortical target areas in mature macaques Thalarnic nuclei Lateral area 4 Medial area 4 Medial premotor (ma) SMA
33
Postarcuate
VLO VLm
VLoNPLo
0%
VPLO VPLONLC
X VLC
MD Pul.0 I
Cn.Md Pcn
Monkeys =
Injections =
Labeled cells =
3 4
3674
3 3 3 6
2097 3213
2 4
803
Fig. 1 Relative weightings of thalamic nuclear projections to different precentr; :ortical areas, based on the data from 19 fluorescent dye injections. Analysis used for each injection is set out in Fig. 10. Projection from each thalamic nucleus to a particular cortical area is expressed as a percent of total labeled cell sample projecting to that cortical target. Total sample of labeled thalamocortical neurons = 11,269. SMA, supplementary motor cortex.
In Fig. 12 the yellow territory illustrates the dorsally placed thalamic distribution of neurons projecting to a cortical module (= 1 mm across) in SMA. This distribution was within the ventral lateral thalamic complex; the projec- tion from MD is not shown.
Thalammrtical projections to supplementary motor area
Four fluorescent dye injections in macaques 1 and 2 were made in the most medial part of area 6aa, approximating to the zones designated SMA in published maps of Woolsey ('64) and Brinkman and Porter ('79). Each small injection site (0.9-1.5 mm diameter) was located in the dorsal part of the cingulate gyrus. Examples of reconstructions of these injections sites are illustrated in Fig. 15 (monkeys 1 and 2n, the latter a prematurely delivered infant considered in
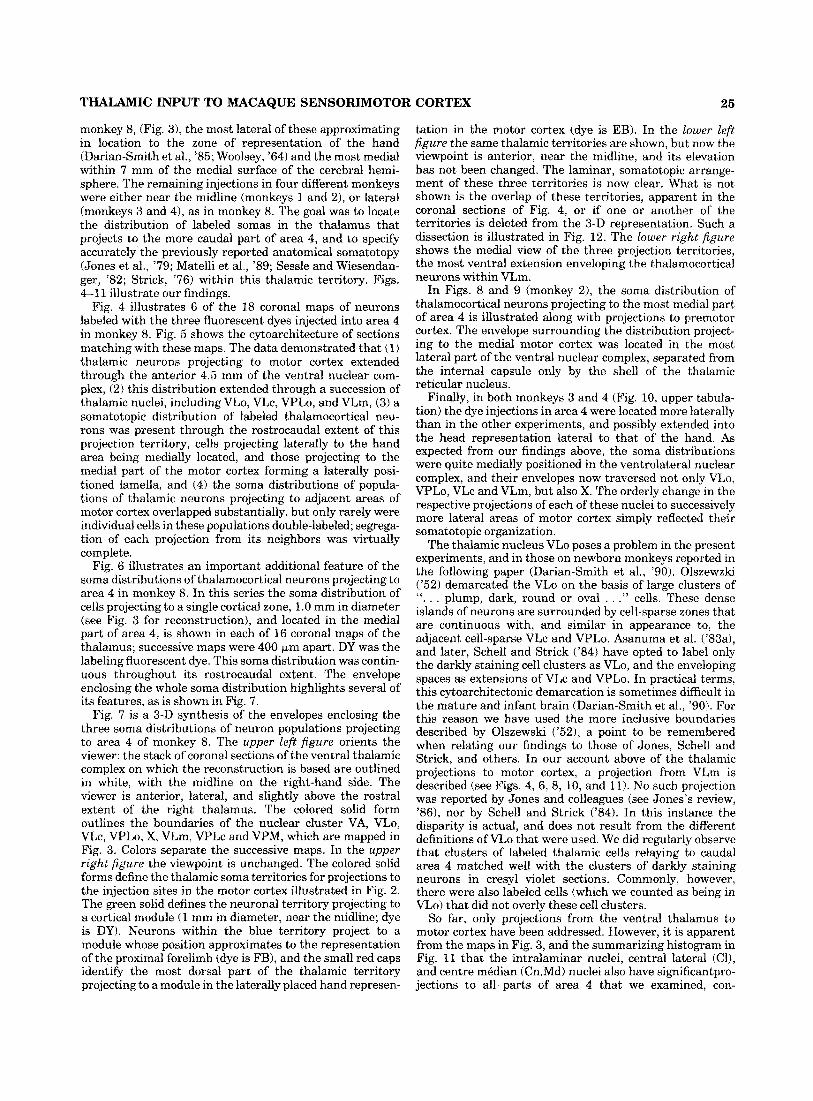
Fig. 10. Comparison of the rostrocaudal distributions of somas of thalamocortical neurons projecting to lateral motor cortex (top), and to adjacent postarcuate cortex (bottom). These distributions are illus- trated for two monkeys (3 on left; 4 on right). Columns (1, 2 . . . 16) correspond to serial maps 400 Fm apart, column 1 being the most rostral. Rows correspond to specific thalamic nuclei, e.g., VLm, or to boundary zones, e.g., WLoNLc. White boxes indicate the rostrocaudal extent of each thalamic nucleus, determined from cresyl violet sections. Boxed numbers are the actual counts of fluorescent labeled neurons in each section, within each thalamic nucleus in that section. The two coronal sections, (macaque 3 on left; 4 on right) illustrate the distribu- tions of somas labeled with EB (postarcuate) and RLM (lateral motor cortex), from which the tabulations for section 5 in each of the four tables were determined. Inset illustrates the cortical injection sites viewed from above. The rightmost column tabulates the total number of labeled cells mapped in each thalamic nucleus, which projected respectively to the lateral motor and postarcuate cortex. This column provides a summary profile of thalamic nuclear projections to motor (top) and postarcuate cortex (bottom) for the two animals. AS, arcuate sulcus, CS, central sulcus. Dye abbreviations as in Fig. 2.
2 2
1482
detail in the following paper by Darian-Smith et al., '90). No double labeling was seen, although the pairs of injections in each monkey were quite close (1.2 mm separation of margins of injections). In each monkey the two populations of labeled thalamic neuron somas were intermingled, and displayed no systematic separation, although somatotopy has been reported in physiological mapping of SMA (Brink- man and Porter, '79).
Figs. 8 and 9 illustrate the mainly dorsal location of the labeled soma distribution, which extends through VLo and VLc. A small separate projection from MD, somewhat less than that to the more laterally located medial premotor area, was also mapped. In the pooled data, shown in the histograms of Fig. 11, it is apparent that small projections arising from X and even the ventrally positioned VLm were observed in monkey 1 (but not monkey 2). Only very small projections from VPLo to SMA and the medial premotor cortex were observed in our experiments.
Thalamocorticalprajections topostarcuatecortex
Two entirely intracortical injections, each of EB, were made into the caudal lip of the arcuate sulcus in monkeys 3 and 4: their diameters were approximately 1.5 and 2.0 mm. The rostrocaudal distributions of labeled thalamic neurons are illustrated in Fig. 10 (lower diagram), along with representative coronal maps of these distributions. The concentration of labeled cells within the ventral nuclear complex was in W L o and X, but there were also small projections from VLo and even VLm. Separate populations of thalamic neurons within the intralaminar nuclei Cn.Md and C1 also projected to the postarcuate cortex. The mean profile of this projection is presented as a histogram in Fig. 11.

34 C. DARIAN-SMITH ET AL.
Since a much larger experimental series of postarcuate injections was completed in the infant macaque, further consideration of this controversial area of cortex is deferred to the following paper (Darian-Smith et al., ’90).
Thalamocortiical projections to postcentral cortex areas 3b/l and 2/5
In four monkeys (Fig. 1) fluorescent dyes were injected into 11 sites in area 3b/l, and 2 in area 215; the volumes of the intracortical uptake zones were 0.8-2.6 mm3. In an additional animal, not listed in Fig. I, a series of dye injections were made in the region of the hand representa- tion, to examine the projections to areas 3b, 1, and 2 in more detail.
Fig. 16 confirms yet again the somatotopic organization of the projection from VPLc to cortical areas 3b11, the best documented feature of somatosensory thalamocortical pro- jections (reviews by Jones, ’85; Mountcastle, ’84).
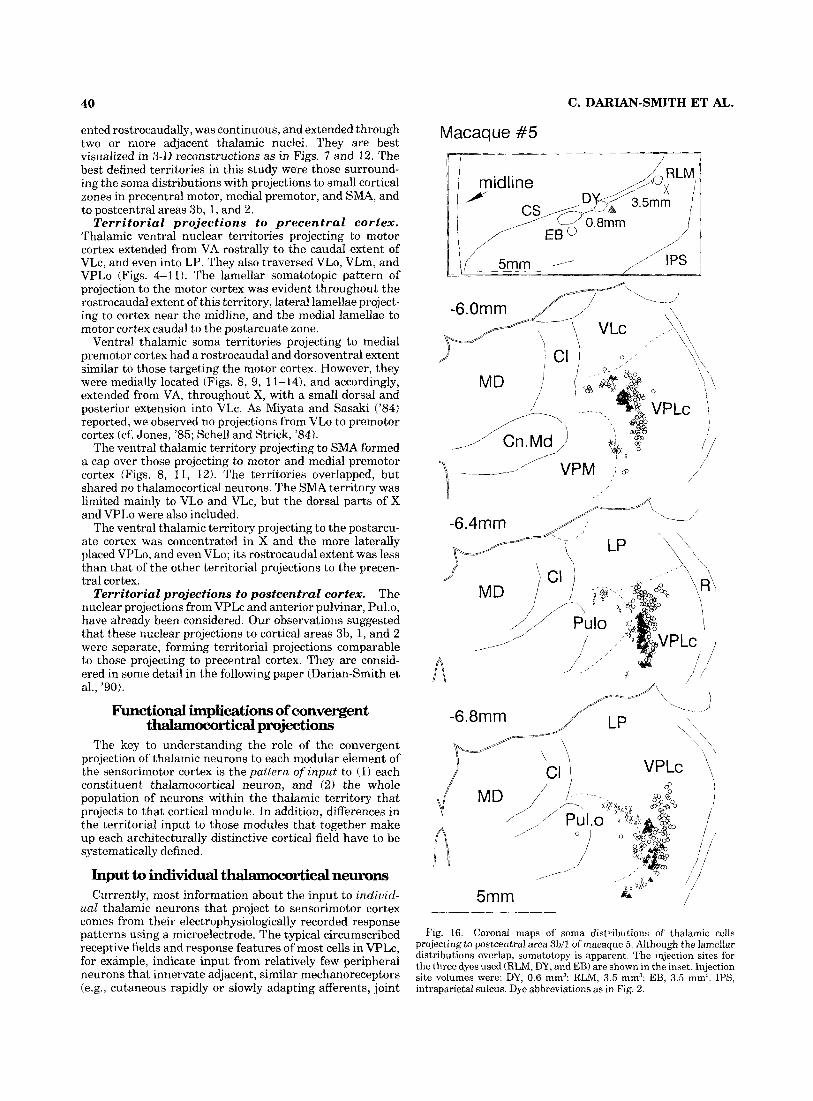
Less well-established features of the thalamic projections to postcentral cortex are (1) the projections of the pulvinar to areas 3b, 1, and 2, and (2) the distributions within VPLc of thalamic neurons that project to cortical areas 3b, 1, and 2. Concerning the first of these, Fig. 16 illustrates the soma distributions in and around the anterior pulvinar of tha- lamic neurons projecting to cortical areas 3bll and 215 in the region of the hand representation. The main projection to area 2 was from the most anterior part of Pul.0, medial to the caudal pole of VPLc, as has been recently described by Pons and Kaas (’85). However, we also observed just caudal to this projection in monkeys 3 and 4 (Fig. 17), and in several infants reported in the following paper (Darian- Smith et al., ’901, pulvinar projections to cortical area 3bil. Fig. 18 is a summary histogram of these findings.
The experiment illustrated in Figs. 19 and 20 was aimed at extending our observations on the thalamic projections to areas 3b, 1, and 2, respectively. The cortical region examined approximated to the region of hand representa- tion. The cytoarchitecture of each of these zones has been described in detail (Jones et al., ’78; Pons and Kaas, ’85; Powell and Mountcastle, ’59). Defining sharp boundaries between them has, however, not been possible. In the experiment reported (not listed in Fig. 1 because of the unique pattern of cortical dye injections) we looked for changes in the thalamocortical projections visualized by fluorescent dye injections into (1) the caudal lip of the central sulcus, ( 2 ) the crown of the postcentral gyrus, and (3) the rostra1 lip of the intraparietal sulcus. The inset in Fig. 19 shows the pattern of dye injections viewed from above.
The soma distributions of thalamocortical neurons la- beled with each of the four fluorescent dyes are plotted for five coronal sections (selected from a total of 13 maps) in Fig. 19. The soma distributions labeled with FB or RLM, which projected mainly to area 3b, each occupied a verti- cally oriented, continuous, lamellar territory extending throughout VPLc, and also extended into Pu1.0, as de- scribed earlier. The projection from VPLc to the crown of the gyrus (mainly area l), labeled with EB, was similar, except that there was a concentration of labeled neurons at the top and bottom of the “lamella” in each section. This polarization was also evident in Pu1.0. Finally, those cells labeled with DY, projecting to the anterior lip of the intraparietal sulcus (areas 2/5), were even more segregated into clusters at the dorsal and ventral borders of VPLc.
Again, there was a substantial projection from Pu1.0. Even with these experiments, however, we could not be quite sure of labeling thalamic neuron populations that project only to area 3b. More definitive experimenk have since been completed (Darian-Smith et al., companion paper) and these confirm a projection from Pu1.0. to area 3b.
Again, the 3-D reconstruction in Fig. 12 supplements one’s image of the thalamic projections from VPLc and Pu1.0 to the postcentral cortex. The two purple territories, most clearly seen in the upper right figure, specify the soma distributions within VPLc and Pu1.o of neurons projecting to a module located in cortical area 3bil near the midline. These territories, converging on the same cortical module, were separate.
Cortical projections from mediodod and in- * nuclei
In this last section it is convenient to consider particular thalamic nuclei with extensive cortical projections, rather than thalamic inputs to specific cortical fields.
Mediodorsal nucleus. The mediodorsal nucleus is large in the primate, extending through about % of the rostrocaudal length of the macaque’s thalamus. Tabular presentation in Fig. 11 illustrates that there are cortical projections from this nucleus to two adjacent cortical fields, the medial premotor cortex, and SMA. The rather compact soma distribution of this projection to medial premotor cortex is plotted in coronal sections in Fig. 13 and its rostrocaudal distribution extent tabulated in Fig. 14. A 3-D reconstruction of this projection is shown in Fig. 12. This distribution seems to be confined to the more lateral and caudal part of MD, leaving that part designated pars magnocellularis by Olszewski (’52) free of labeled neurons. We saw no projections from MD to the postcentral cortex.
Intralaminar nuclei. The two intralaminar nuclei that consistently projected to sensorimotor cortex in the present experiments were the centre median nucleus and the central lateral nucleus (Cn.Md and C1 of Olszewski, ’52). Again, as is apparent in Figs. 4, 8, and 10-14, the projection was mainly, but not solely, to precentral cortex. In our maps the only precentral cortical fields without input from intralaminar nuclei were those receiving input from MD, i.e., SMA and medial premotor cortex. This hiatus may be artifactual, since it has long been recognized that caudally the boundary between C1 and MD is somewhat arbitrarily defined (Jones, ’85; Olszewski, ’52).
We rarely observed double labeling of individual neuron somas in MD or in the intralaminar nuclei, in accord with other recent studies of comparable projections of intralami- nar nuclei in the cat and rat (Macchi and Bentivoglio, ’86).
DISCUSSION To define anatomically the thalamocortical projection to
a particular small cortical module [Mountcastle’s “column” (’84) or Rakic’s “radial unit” (’88) I, the following struc- tures need to be described systematically: (1) the constitu- ent thalamocortical neurons, (2) the populations of these cells within individual thalamic nuclei, (3) the total popula- tion of these cells that converge on this cortical module, and the thalamic territory(ies1 which encompasses its soma distribution, and (4) the inputs to this whole thalamocorti- cal array. In addition, each cortical area defined by a common architecture, such as areas 4 and 3b, will receive

THALAMIC INPUT TO MACAQUE SENSORIMOTOR CORTEX 35
input from many of these thalamic territories. A systematic description, as yet quite incomplete, of the profile of this thalamic input to each cortical module is essential to the analysis of the functional organization of sensorimotor cortex.
The experiments reported here relate to several of the levels of structural organization outlined above. They sug- gest a summary description of the thalamic projections to the macaque's sensorimotor cortex differing somewhat from those reviewed in the introduction to this paper (see Table 1).
Organization of thalamomrtical projections at the cellular level
The main finding in the present experiments concerning individual thalamic neurons projecting to the sensorimotor cortex was that their terminal branching was restricted, with a total lateral spread less, possibly considerably less, than 1,500 pm.
Double labeling of a neuron, useful in identifying widely dispersed branching of its axon, has limited value for measuring the extent of circumscribed arborizations. This is because (1) double labeling of a neuron soma will occur whenever the uptake zones of the two labels overlap (Fig. 19) regardless of the dimensions of the terminal branching, and (2) there is an uncertainty of about 1 mm in specifying the interval between the separated uptake zones of the two labeling dyes, which is larger than the total spread of many intracortical arborizations that have been directly visual- ized (Blasdel and Lund, '83; Jones, '86; Garraghty and Sur, '90). Notwithstanding, the virtual absence of double label- ing in thalamocortical populations when the minimal sepa- ration of the boundaries of the uptake zones in the cortex was 1-1.5 mm demonstrates the absence of extended lateral spread of terminal cortical arborizations throughout the whole sensorimotor cortex that we examined. Jones ('85) predicted this finding. By contrast, double labeling result- ing from comparably spaced dye injections was common with thalamocortical projections to sensorimotor cortex in the newborn macaque (Darian-Smith et al., '90).
Cusick et al. ('85) reported double labeling in different parts of VPLc (including what they term the ventroposte- rior superior nucleus, VPS, the dorsal part of Olszewski's VPLc), and also in Pu1.o. The finger pad representation in squirrel monkeys at (1) the rostral boundary of areas 3b and 3a, and (2) the caudal boundary of areas 1 and 2 were mapped electrophysiologically, and injections of a radiolabel and HRP made at these sites. Between 15 and 40% of labeled thalamic neurons were double-labeled, thought to indicate that many individual cells sent collaterals to either areas 3b and 1, or to areas 3a and 2.
In the macaque monkeys 3 and 4 (Figs. 17) of the present experiments, in which we observed no thalamic neurons double-labeled with dyes injected into the adjacent cortical fields 3b, 1, or 2, the injected labels had a similar disposition to those in the experiments of Cusick et al. ('85). The somatotopic mismatch of the injection sites, suggested by Cusick et al. ('85) as a possible reason for the failure to observe double labeling in earlier studies (Jones, '831, was unlikely in our experiment. Although no electrophysiologi- cal identification of the hand representation in areas 3b and 1 was attempted in this experiment, the two dye injections in areas 3bll and 215 each extended about 6 mm mediolater- ally (inset, Fig. 17a); it was therefore probable that at least
parts of somatotopically matching cortex were injected with the two dyes. Furthermore, such a mismatch does not explain the earlier findings of Jones et al. ('79). In these experiments area 3b was ablated several months before HRP was injected into areas 1 and 2. Only cells of normal appearance in VPLc were labeled; no HRP was found in those shrunken cells that had regressed following the ablation. Possibly there are differences in the thalamocorti- cal arborizations in the somatosensory cortical area in New and Old World monkeys; more probably the conflicting findings resulted from the current inadequacies in specify- ing the uptake zones of the different retrograde labels used.
Garraghty and Sur ('90) have used intracellular HRP to visualize a small number of functionally identified thalamo- cortical neurons projecting to area 3b. The terminal arbors varied in form, but most were 300-500 pm across. How- ever, one axon terminating in several such arbors, with a total span of 2 mm, was observed. Jones ('86) reported similar intracortical endings, thought to be the axons of thalamocortical neurons. In the primate visual pathways the terminal branching of physiologically identified genicu- lostriate neurons has been more extensively examined (Blasdel and Lund, '83; Fitzpatrick et al., '83). Several different branching patterns of the axon terminals of geniculostriate cells have been identified, and these have been shown to relate to the type of geniculate cell from which the axon arises. Distinguishing features of these arborizations were (1) the pattern of their horizontal spread, and (2) their radial laminar distribution. Clearly, the details of these terminal intracortical distributions, and of their synaptic relations with neighboring neurons, are essential for understanding the functions of any population of thalamocortical neurons, and need elucidation for the sensorimotor cortex.
Nuclear organization: divergence and convergence of thhocortical projections In the macaque the adult pattern of thalamic nuclei is
already clearly evident in cresyl violet sections by the 145th day of gestation (Darian-Smith et al., '90). Whatever its functional importance, this nuclear pattern provides an important spatial reference to which experimental ohserva- tions may be related. A large fraction of the total neuron population of the ventral thalamic nuclei, and a smaller but significant component of the pulvinar, medial, and intralam- inar nuclei project to the sensorimotor cortex.
Three general features of the nuclear pattern of thalamo- cortical projection to the sensorimotor cortex were appar- ent in the present data. First, within each thalamic nucleus there were separate neuron populations that projected to different cortical fields. This was so for nuclear projections to both precentral and postcentral cortical areas. Thus, both VPLc and Pu1.o. each had projections to cortical areas 3b, 1, and 2 (Figs. 16-19; Jones and Friedman, '82; Pons and Kaas, '85). The soma distributions of these popurations might overlap spatially, but they did not share neurons. With nuclei projecting to precentral cortical areas this divergence of cortical projections was even greater, evident from the summary histograms in Fig. 11, and in accord with some previous reports, tabulated in Table 1. Second, the separate thalamocortical populations projecting from one nucleus to one architecturally distinct cortical area were commonly spatially ordered; within some thalamic nuclei projecting to areas 4, and 3b, 1, and 2 this was

w
Q,
Fig.
12.
3-D
reco
nstr
ucti
on o
f th
alam
ic te
rrit
orie
s en
velo
ping
the
som
a di
stri
buti
ons
of n
euro
ns t
hat
proj
ect
to c
ortic
al m
odul
es [
= 1
mm
acr
oss)
in m
edia
l m
otor
cor
tex
(red
),
prem
otor
cor
tex
(blu
e), S
MA
(ye
llow
), an
d m
edia
l ar
ea 3
b/l
(pur
ple)
. In
uppe
r, a
nd l
ower
left
rec
onst
ruct
ions
the
thal
amus
is
view
ed f
rom
an
ant
erol
ater
al a
nd s
ligh
tly
elev
ated
pn
sitin
n. T
he lo
wer
righ
t im
age
is a
late
ral v
iew
of
the
thal
amus
. See
text
for d
etai
ls.

THALAMIC INPUT TO MACAQUE SENSORIMOTOR CORTEX
Macaque #7 9 \
A.
9.
c.
VPLO \
/VPM /jJ( A ,/
37
Fig. 13. Series of coronal maps of soma distributions of thalamic neurons projecting to four different areas of medial premotor cortex of macaque 7. The fluorescent labels used were RLM, FR, FG, and D Y the upper left inset shows the dye injection sites viewed from above. Rostrocaudal plane of maps as stated in Fig. 4. AS, arcuate sulcus. Dye abbreviations as in Fig. 2.

38 C. DARIAN-SMITH ET AL.
Nuclei AFFERENTS TO PREMOTOR CORTEX
CORONAL MAPS OF LABELED THALAMIC NEURONS
Serial sections 40pm thick: 40Opm between successive maps
Summed
labeled neurons
VA
VLO VLm
VPLO X
v Lc
VLps
VPLC Pul.0
LP MD
Pcn
CI caudal 8.0mm rostra1
297 8 67 23
195 1 17 46
247 27 7
169 92 182 214 67 6
453 65 69 40 55 2
5
Fig. 14. Rostrocaudal distributions of labeled thalamic neurons projecting to four target areas in the premotor cortex of monkey 7 (see Fig. 13 for sites). The analysis used was that shown in Fig. 10.
somatotopic, as reported in many previous studies (see Jones, '84; Mountcastle, '84 for reviews). Finally, a conse- quence of the divergent thalamic projections was that each cortical area received input from two or more thalamic nuclei, the specific patterns being displayed in Figs. 4, and 8-20.
Goldman-Rakic ('88) has recently discussed the conver- gentidivergent patterns of these thalamic projections to sensorimotor cortex, seeking some correlation with the relevant corticocortical connections. Such patterns are not unique, for while the primary cortical target of projections from the lateral geniculate body is the striate cortex, V1, it
also has a smaller projection to V2 (Kennedy and Bullier, '85). Furthermore, the pulvinar nuclear complex has projec- tions to both V1 and V2 (Tigges and Tigges, '85).
Thalamic territories projecting to individual cortical modules in Sensorimotor cortex
The most striking finding in the present experiments was the remarkable convergence of thalamic input to each small area, about 1 mm in diameter, of the sensorimotor cortex that was examined. The territory(ies1 enveloping each such population of thalamocortical neurons was typically ori-

THALAMIC INPUT TO MACAQUE SENSORIMOTOR CORTEX 39
Macaque #1
1 cm
5mm
+4.0rnm
+3.2mm
+2.4mm
+1.6rnrn
+0.8mm
Fig. 15. Cortical injection sites within SMA in macaque #1 and a prematurely delivered infant macaque (#2n) (see following paper, Darian-Smith et al., '90). In the mature monkey, two fluorescent dyes, FB and RLM, were separately injected into SMA. Only FB was injected into the SMA of the infant. Maps of dorsal view of cortex at top of figure
Macaque #2n
+9.2mm
+8.4mm
+7.6mm
+6.8mm
+6.0mm
illustrate sites of dye injections in relation to midline, central sulcus (CS), and arcuate sulcus (AS). Volumes of injection sites: #1, FB = 2.62 mm3, RLM = 0.71 mm'; #2n, FB = 15.1 mm3. Ordinates adjacent to the stacks of coronal sections of brain indicate the separation (mm) of the sections shown, the reference point being the rostra1 pole of VLo.
40 C . DARIAN-SMITH ET AL.
ented rostrocaudally, was continuous, and extended through two or more adjacent thalamic nuclei. They are best visualized in 3-D reconstructions as in Figs. 7 and 12. The best defined territories in this study were those surround- ing the soma distributions with projections to small cortical zones in precentral motor, medial premotor, and SMA, and to postcentral areas 3b, 1, and 2.
Territorial projections to precentral cortex. Thalamic ventral nuclear territories projecting to motor cortex extended from VA rostrally to the caudal extent of VLc, and even into LP. They also traversed VLo, VLm, and VPLo (Figs. 4-11). The lamellar somatotopic pattern of projection to the motor cortex was evident throughout the rostrocaudal extent of this territory, lateral lamellae project- ing to cortex near the midline, and the medial lamellae to motor cortex caudal to the postarcuate zone.
Ventral thalamic soma territories projecting to medial premotor cortex had a rostrocaudal and dorsoventral extent similar to those targeting the motor cortex. However, they were medially located (Figs. 8, 9, 11-14), and accordingly, extended from VA, throughout X, with a small dorsal and posterior extension into VLc. As Miyata and Sasaki ('84) reported, we observed no projections from VLo to premotor cortex (cf. Jones, '85; Schell and Strick, '84).
The ventral thalamic territory projecting to SMA formed a cap over those projecting to motor and medial premotor cortex (Figs. 8, 11, 12). The territories overlapped, but shared no thalamocortical neurons. The SMA territory was limited mainly to VLo and VLc, but the dorsal parts of X and VPLo were also included.
The ventral thalamic territory projecting to the postarcu- ate cortex was concentrated in X and the more laterally placed VPLo, and even VLo; its rostrocaudaI extent was Iess than that of the other territorial projections to the precen- tral cortex.
The nuclear projections from VPLc and anterior pulvinar, Pul.0, have already been considered. Our observations suggested that these nuclear projections to cortical areas 3b, 1, and 2 were separate, forming territorial projections comparable to those projecting to precentral cortex. They are consid- ered in some detail in the following paper (Darian-Smith et al., '90).
Functional implications of convergent thalammrtical projections
Territorial projections to postcentral cortex.
The key to understanding the role of the convergent projection of thalamic neurons to each modular element of the sensorimotor cortex is the pattern of input to (1) each constituent thalamocortical neuron, and (2) the whole population of neurons within the thalamic territory that projects to that cortical module. In addition, differences in the territorial input to those modules that together make up each architecturally distinctive cortical field have to be systematically defined,
Input to individual thhocortical neurons Currently, most information about the input to indiuid-
ual thalamic neurons that project to sensorimotor cortex comes from their electrophysiologically recorded response patterns using a microelectrode. The typical circumscribed receptive fields and response features of most cells in VPLc, for example, indicate input from relatively few peripheral neurons that innervate adjacent, similar mechanoreceptors (e.g., cutaneous rapidly or slowly adapting afferents, joint
Macaque #5
\ \ \ ' -= LP ' A
VPLc y
X Y A ,
5mm
Fig. 16. Coronal maps of soma distributions of thalamic cells projecting to postcentral area 3b/l of macaque 5. Although the lamellar distributions overlap, somatotopy is apparent. The injection sites for the three dyes used (RLM, DY, and EB) are shown in the inset. Injection site volumes were: DY, 0.6 mm'; RLM, 3.5 nun"; EB, 3.5 mm'. IPS, intraparietal sulcus. Dye abbreviations as in Fig. 2.
THALAMIC INPUT TO MACAQUE SENSORIMOTOR CORTEX 41
Fig. 17. A: Coronal maps of soma distributions of thalamic neurons projecting to the “hand” areas in cortical areas 3b1l and 215. These are selected from the serial thalamic maps of monkeys 4 (top) and 3 (bottom), to illustrate the cortical projections ofPu1.o. In both monkeys somas of projections to area 3b/l were caudal to those projecting to area
215. Dye injection volumes: monkey 4 FB = 19.3 mm3, DY = 2.1 mm?; monkey 3, FB = 14.2 mm3, DY = 4.1 mm3, CS, central sulcus. Dye abbreviations as in Fig. 2. B: Coronal sections, 40 pm thick, stained with cresyl violet matching with the maps in A.

42 C. DARIAN-SMITH ET AL.
Thalamic cells projecting to postcentral cortex
VPLc Pul.0
MD
P Monkey = 4 2
Injections = 10 2 Labeled cells = 8,203 902
Fig. 18. Thalamic nuclear projections to postcentral cortical areas 3b/l and 215, based on the mapping of soma distributions labeled with 12 dye injections. Projection from each thalamic nucleus is expressed as apercent of the total sample of neurons projecting to areas 3bil and 215, respectively.
or muscle afferents). Likewise, cortical neurons in areas 3b and 1, but not area 2 (Darian-Smith et al., '85; Iwamura and Tanaka, '78) have similar receptive fields and re- sponses. This implies that, whatever processing of input may occur within the spinal cord (and dorsal column and thalamic nuclei), a pathway is maintained from peripheral receptors to somatosensory cortex in which little spatial convergence occurs: a relatively "pure" line is maintained. This functional organization is maintained in spite of the fact that the population of thalamic neurons projecting to each cortical module in areas 3b and 1 is substantial and occupies a spatially extensive, vertically oriented sheet or lamella that reaches to the boundaries of VPLc. The cells within this lamella presumably all have similar receptive fields and response patterns, (Jones and Friedman, '82; Poggio and Mountcastle, '63). The lamellar distributions of cells projecting to neighboring cortical modules will overlap, and there may be orderly clustering of their somas within each territory, as seen in Fig. 19, and described in previous studies (Cusick et al., '85; Jones and Friedman, '82; Kaas et al., '84; Poggio and Mountcastle, '63). This precision of the connections of individual thalamic neurons projecting to areas 3b and 1, and of the extended soma distributions of cells with input to individual cortical neurons, is character- istic of primary sensory projections, and certainly evident in the projection patterns of geniculostriate neurons (Bishop, '84, for review).
Except in the sensory relay nuclei, such as VPLc, record- ing single thalamic neuron responses has provided limited information about the input to individual thalamic neu- rons. Our current knowledge of the input to most popula- tions of thalamic neurons therefore depends heavily on neuron labeling procedures, which do not provide the resolution needed to identify the input to single neurons.
Inputs to thalamic terribries that project to a cortical module
The major subthalamic inputs to the precentral cortex are from the deep cerebellar nuclei, the globus pallidus, the substantia nigra, and possibly the spinothalamic projection (reviewed by Jones, '85). In sev- eral recent studies the emphasis has been on the strict correspondence of the input from each major source to specific thalamic nuclei. Thus Asanuma et al. ('83b) found the cerebellar input to be confined to the "cell-sparse'' VPLo, X, VLc, and VLps, a cluster of nuclei difficult to differentiate histologically, and considered with good rea- son by Jones ('85) to constitute a single thalamic nucleus. Pallido-thalamic projections have been described (DeVito and Anderson, '82) as terminating mainly within VLo, and nigrothalamic fiber terminals as being confined to VLm (Carpenter et al., '76). Whether these inputs are strictly confined to particular thalamic nuclei, as described and advocated by Jones ('87b) and others (Thach, '87), needs confirmation using tracing procedures with a spatial resolu- tion greater than that achieved with the current antero- grade and retrograde tracing procedures. Nonetheless, it is probably correct that the major inputs from cerebellum, globus pallidus, and substantia nigra are to the thalamic nuclei described above.
With this pattern of inputs to the ventrolateral thalamic nuclei, the subthalamic input to each soma territory, which in turn funnels its input to a single precentral cortical module, is likely to be highly complex. With the extensive territorial convergence we have described, this will be so whether or not the cerebellar and other thalamic inputs have specific nuclear targets. For example, the soma distri- bution of thalamic neurons converging on a single cortical module in area 4 extends through VLo, VLc, VPLo, and VLm, and hence will receive input from one or more deep cerebellar nuclei, from the globus pallidus, from substantia nigra, and possibly from the spinal cord. Cortical modules in the medial premotor cortex will have input from the cerebellum, substantia nigra, and globus pallidus, through projections from VLc and X, VLm, and VA, respectively. Again SMA will receive information from these same subthalamic sources through the projections it receives from VLc, VLo, VLm, and even X and VPLo. However, there is a most important difference in the input to each cortical module, which is that each will be the target of a unique population of thalamic neurons, and accordingly, the combined information it receives from the cerebellum, globus pallidus, substantia nigra, and spinal cord will also be unique. Presumably, the inputs to adjacent cortical modules within a particular cortical area will change incre- mentally in a highly ordered way, but without sharing input from individual thalamic neurons.
With this organization of the thalamic input to cortical modules the integration of information so essential for directed voluntary movements of the limbs, and particu- larly of the hand, is already starting, and is not delayed until the needed information from different sources reaches the sensorimotor cortex.
Postcentral cortex. The nuclear projections from VPLc and anterior pulvinar, PuLo., to areas 3b, 1, and 2 have been previously described in much detail, although pulvinar projections to area 3b have not been reported previously (cf. Pons and Kaas, '85). Discussion of these projections is deferred to the following paper (Darian-Smith et al., '90).
Precentral cortex.

THALAMIC INPUT TO MACAQUE SENSORIMOTOR CORTEX 43
3b/l -FB 3b/l -RLM 1 -EB 215- DY
r i
- - - _ _
r r
- 1
L
FB RLM X EB o DY n
Fig. 19. Series of coronal maps of labeled neuron somas of thalamic neurons projecting to areas 3b, 1, and 2/5. The inset shows the complex pattern of cortical injections of four fluorescent dyes, viewed from above. Dye abbreviations as in Fig. 2. Rows of maps are of different soma distributions in the same section, which is shown in the leftmost column. Sections in successive rows are serial, 400 pm apart, with the top section being most rostral. In columns 2-5 the region including
VPLc and Pu1.o has been enlarged. Columns 2 and 3 show the soma distribution of cells projecting to area 3b, labeled with FB and RLM respectively. In column 4 the soma projection to area 1 from VPLc is seen to split into a dorsal and a ventral component, and this dispersion is even greater with the projection to cortical area 215, shown in column 5. This monkey is not listed in Fig. 1.
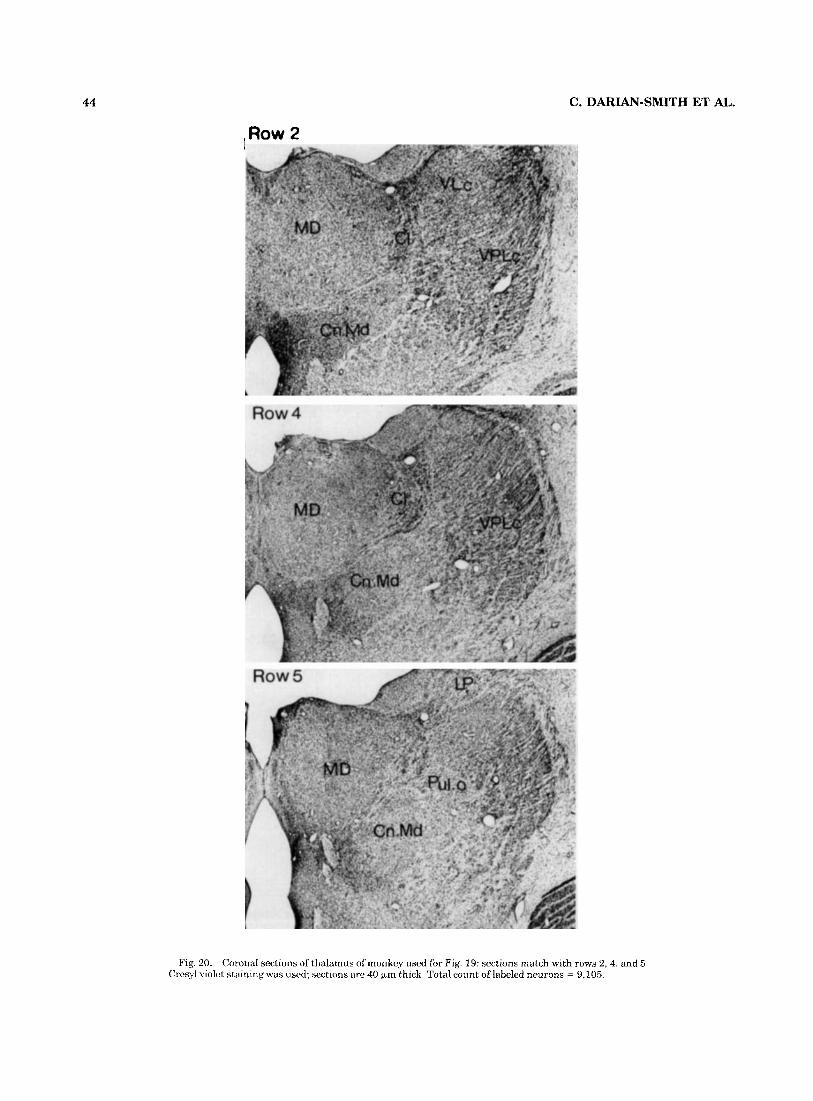
44 C. DARN-SMITH ET AL.
Row 2
Fig. 20. Coronal sections of thalamus of monkey used for Fig. 19: sections match with rows 2, 4, and 5 . Cresyl violet staining was used; sections are 40 pm thick. Total count of labeled neurons = 9,105.

THALAMIC INPUT TO MACAQUE SENSORIMOTOR CORTEX 45
Other thalamic input to sensorimotor cortex The selective projection of the posterior intralaminar
nuclei (Cn.Md and C1) to motor and postarcuate cortex, and also SMA, is well established (Jones et al., '79; Macchi et al., '77; Macchi and Bentivoglio, '86, for review). However, we did not label any projections to the medial premotor cortex. By contrast, the main projection of MD was to premotor cortex, with a smaller input to SMA. This matches with previous studies in which anterograde labeling methods were used (Akert and Hartmann-von-Monakow, '80; Giguere and Goldman-Rakic, '88). However, these latter procedures also visualized extensive thalamocortical projec- tions to the prefrontal cortex.
A C I ( " T S This work was supported by the University of Melbourne,
the National Health and Medical Research Council of Australia, the Ian Potter Foundation, and the Jack Brock- hoff Foundation. Neil Ratcliffe set up and maintained the computer graphics facility.
Akert, K., and K. Hartmann-von Monakow (1980) Relationships of precen- tral, premotor and prefrontal cortex to the mediodorsal and intralaminar nuclei of the monkey thalamus. Acta Neurobiol. Exp. 40:7-25.
Asanuma, C., W.T. Thach, and E.G. Jones (1983a) Cytoarchitectonic delineation of the ventral lateral thalamic region in the monkey. Brain Res. Rev. 5.219435.
Asanuma, C., W.T. Thach, and E.G. Jones (1983b) Anatomical evidence for segregated focal groupings of efferent cells and their terminal ramifica- tions in the cerebellothalamic pathway of the monkey. Brain Res. Rev. 5.267-298.
Barbas, H., and D.N. Pandya (1987) Architecture and frontal cortical connections of the premotor cortex (area 6) in the rhesus monkey. J. Comp. Neurol. 256t211-228.
Bentivoglio, M., and M. Molinari (1984) Fluorescent retrograde triple labeling of brainstem reticular neurons. Neurosci. Lett. 46.121-126.
Bentivoglio, M., G. Macchi, and A. Albenese (1981) The cortical projections of the thalamic intralaminar nuclei, as studied in cat and rat with the multiple fluorescent retrograde tracing technique. Neurosci. Lett. 26.5- 10.
Bishop, P.O. (1984) Processing of information within the retinostriate system. In I. Darian-Smith, J.M. Brookhart, and V.B. Mountcastle (eds): Handbook of Physiology. Section 1: The Nervous System. Sensory Processes. Bethesda: American Physiological Society, pp. 341-424.
Blasdel, G.G., and J.S. Lund (1983) Terminations of afferent axons in macaque striate cortex. J. Neurosci. 311389-1413.
Brinkman, C., and P. Porter (1979) Supplementary motor area in the monkey: Activity of neurons during a performed task. J. Neurophysiol. 42t681-709.
Carpenter, M.B., K. Nakano, and R. Kim (1976) Nigrothalamic projections in the monkey demonstrated by autoradiographic technics. J. Comp. Neurol. 1651401-4 15.
Conde, F. (1987) Further studies on the use of the fluorescent tracers Fast Blue and Diamidino Yellow: Effective uptake area and cellular storage sites. J. Neurosci. Methods 2113144.
Craig, A.D., Jr., A.J. Linington, and K.-D. Knifki (1989) Significant differences in the retrograde labeling of spinothalamic tract cells by horseradish peroxidase and the fluorescent tracers fast blue and diami- din0 yellow. Exp. Brain Res. 74.431436.
Cusick, C.G., D.A. Steindler, and K.H. Kaas (1985) Corticocortical and collateral thalamocortical connections of postcentral somatosensory cortical areas in squirrel monkeys: A double-labeling study with radiola- beled wheatgerm agglutinin and wheatgerm agglutinin conjugated with horseradish peroxidase. Somatosensory Res. 3: 1-31.
Darian-Smith, I., A. Goodwin, M. Sugitani, and J. Heywood (1984) The tangible features of textured surfaces: their representation in the monkey's somatosensory cortex. In: G.M. Edelman, W.E. Gall, and W.M. Cowan (eds): Dynamic Aspects of Neocortical Function. New York: John Wiley & Sons, pp. 475-500.
Darian-Smith, I., A. Goodwin, M. Sugitani, and J. Heywood (1985) Scanning a textured surface with the fingers: Events in sensorimotor cortex. In A.W. Goodwin, and I. Darian-Smith (eds): Hand Function and the Neocortex. Heidelherg: Springer-Verlag, pp. 17-43.
Darian-Smith, C., I. Darian-Smith, and S.S. Cheema (1990) Thalamic projections to sensorimotor cortex in the newborn macaque. J. Comp. Neurol. 299:47-63.
De Vito, J.L., and M.E. Anderson (1982) An autoradiographic study of efferent connections of the globus pallidus in Macaca mulatta. Exp. Brain Res. 46t107-117.
Evarts, E.V. (1981) Role of motor cortex in voluntary movements in primates. In V.B. Brooks, J.M. Brookhart, and V.B. Mountcastle (eds): Handbook of Physiology. Section 1: The Nervous System. Motor Control. Bethesda: American Physiological Society, pp. 1083-1 120.
Fitzpatrick, D., K. Itoh, and I.T. Diamond (1983) The laminar organization of the lateral geniculate body and the striate cortex in the squirrel monkey (Saimiri sciureus). J. Neurosci. 3:673-702.
Garraghty, P.E., and M. Sur (1990) Morphology of single intracellularly stained axons terminating in area 3b of macaque monkeys. J. Comp. Neurol. 294.583-593.
Ghosh, S., C. Brinkman, and R. Porter (1987) A quantitative study of the distribution of neurons projecting to the precentral motor cortex in the monkey ( M . fascicularis). J. Comp. Neurol. 259t424-444.
Giguere, M., and P.S. Goldman-Rakic (1988) Mediodorsal nucleus: Areal, laminar, and tangential distribution of afferents and efferents in the frontal lobe of rhesus monkeys. J. Comp. Neurol. 277:195-213.
Goldman-Rakic, P.S. (1988) Changing concepts of cortical connectivity: Parallel distributed cortical networks. In P. Rakic, and W. Singer (eds): Neurobiology of Neocortex. Chichester: Wiley, pp. 177-202.
Iwamura, Y., and M. Tanaka (1978) Postcentral neurons in hand region of area 2: Their possible role in the form discrimination of tactile objects. Brain Res. 15Ot662-666.
Jones, E.G., S.P. Wise, and J.D. Coulter (1979) Differential thalamic relationships of sensory-motor and parietal cortical fields in monkeys. J. Comp. Neurol. 183r833-882.
Jones, E.G. (1983) Lack of collateral thalamocortical projections to fields of the first somatic sensory cortex in monkeys. Exp. Brain Res. 52.375-384.
Jones, E.G. (1985) The Thalamus New York: Plenum Press. Jones, E.G. (1986) Connectivity of the primate sensory-motor cortex. In E.G.
Jones, and A. Peters (eds): Cerebral Cortex, Vol. 5. New York Plenum Press, pp. 113-184.
Jones, E.G. (1987a) New insights into old concepts of thalamic function. In J.-M. Besson, G. Guilbaud, and M. Peschanski (eds): Thalamw and Pain. New York: Elsevier, pp. 1-19.
Jones, E.G. (1987b) Ascending inputs to, and internal organization of, cortical motor areas. In: Motor Areas of the Cerebral Cortex (Ciba Foundation Symposium 132). Chichester: Wiley, pp. 21-35.
Jones, E.G., and D.P. Friedman (1982) Projection pattern of functional components of thalamic ventrobasal complex on monkey somatosensory cortex. J. Neurophysiol. 48t521-544.
Jones, E.G., J.D. Coulter, and S.H.C. Hendry (1978) Intracortical connectiv- ity of architectonic fields in the somatic sensory, motor and parietal cortex of monkeys. J. Comp. Neurol. 181:291-347.
Kaas, J.H., R.J. Nelson, M. Sur, C.S. Lyn, and M.M. Merzenich (L984) The somatotopic organization of the ventroposterior thalamus of the squirrel monkey, Saimirz sciureus. J. Comp. Neurol. 226: 111-140.
Keizer, K., H.G.J.M. Kuypers, A.M. Huisman, and 0. Dann (1983) Diami- din0 yellow dihyrochloride (DY:BHCl): A fluorescent retrograde neuronal tracer which migrates only very slowly out of the cell and can be used in combination with TB and FB in double labeling experiments. Exp. Brain Res. 51:179-191.
Kennedy, H., and Bullier, J. (1985) A double-labeling investigation of the afferent connectivity to cortical areas V l and V2 of the macaque monkey. J. Neurosci. 52815-2830.
Kievit, J., and H.G.J.M. Kuypers (1977) Organization of the thalamo- cortical connexions to the frontal lobe in the rhesus monkey. Exp. Brain Res. 29:299-322.
Leichnetz, G.R. (1986) Afferent and efferent connections of the dorsolateral precentral gy rus (area 4, handiarm region) in the macaque monkey, with comparisons to area 8. J. Comp. Neurol. 254:460492.
Macchi, G., and M. Bentivoglio (1986) The thalamic intralaminar nuclei and the cerebral cortex. In E.G. Jones and A. Peters (eds): Cerebral Cortex, Vol. 5. New York: Plenum, pp. 355-401.

46 C. DARN-SMITH ET AL.
Macchi, G., M. Bentivoglio, C. D’Atena, P. Rossini, and E. Tempesta (1977) The cortical projections of the thalamic intralaminar nuclei restudied by means of HRP retrograde axonal transport. Neurosci. Lett. 4t121-126.
Matelli, M., R. Camarda, M. Glickstein, and G. Rizzolatti (1984) Interconnec- tions within the postarcuate cortex (area 6) of the macaque monkey. Brain Res. 310:388-392.
Matelli, M., R. Camarda, M. Glickstein, and G. Rizzolatti (1986) Merent and efferent projections of the inferior area 6 in the macaque monkey. J. Comp. Neurol. 251:281-298.
Matelli, M., G. Luppino, L. Fogassi, and G. Rizzolatti (1989) Thalamic input to inferior area 6 and area 4 in the macaque monkey. J. Comp. Neurol. 280:468488.
Miyata, M., and K. Sasaki (1983) HRP studies on thalamocortical neurons related to the cerebellocerebral projection in the monkey. Brain Res. 274t213-224.
Miyata, M., and K. Sasaki (1984) Horseradish peroxidase studies on thalamic and striatal connections of the mesial part of area 6 in the monkey. Neurosci. Lett. 49t127-133.
Mountcastle, V.B. (1984) Central nervous mechanisms in mechanoreceptive sensibility. In I. Darian-Smith, J.M. Brookhart, and V.B. Mountcastle (eds): Handbook of Physiology, Section 1: The Nervous System. Vol. 111, Sensory Processes. Bethesda: American Physiological Society, pp. 789- 878.
Nelson, R.J., M. Sur, D.J. Felleman, and J.H. Kaas (1980) Representation of the body surface in postcentral parietal cortex (S1) of Macaca fascicu- lams. J. Comp. Neurol. 192.611-643,
Olszewski, J. (1952) The Thalamus of theMacnca Mulatta. Basel: Karger. Payne, J.N., and J.M. Peace (1989) Fluorometric comparisons of the
retrograde axonal transport of true blue and diamidino yellow from the rat caudate-putamen. Exp. Brain Res. 75169-182.
Poggio, G., and V.B. Mountcastle (1963) The functional properties of ventrobasal thalamic neurons studied in unanesthetized monkeys. J. Neurophysiol. 26: 775-806.
Pons, T.P., and J.H. Kaas (1985) Connections of area 2 of somatosensory cortex with the anterior pulvinar and subdivisions of the ventroposterior complex in macaque monkeys. J. Comp. Neurol. 240:16-36.
Powell, T.P.S., and V.B. Mountcastle (1959) The cytoarchitecture of the postcentral gyrus of the monkey Macaca mulatta. Bull. Johns Hopkins
Rakic, P. (1988) Intrinsic and extrinsic determinants of neocortical parcella- tion: A radial unit model. In P. Rakic and W. Singer (eds): Neurobiology of Neocortex. Chichester: Wiley, pp. 5-27.
HOSP. 105:108-131.
Roland, P.E., E. Skinhoj, N.A. Lassen, and B. Larsen (1980) Different cortical areas in man in organization of voluntary movements in extrapersonal space. J. Neurophysiol. 4.3: 137-150.
Schmued, L.C., and J.H. Fallon (1986) Fluoro-Gold: A new fluorescent retrograde axonal tracer with numerous unique properties. Brain Res. 377:147-154.
Schell, G.R., and P.L. Strick (1984) The origin of thalamic inputs to the arcuate premotor and supplementary motor areas. d. Neurosci. 4t539- 560.
Sessle, B.J., and M. Wiesendanger (1982) Structural and functional defini- tion of the motor cortex in the monkey iMacaca fasczcularis). J. Physiol. (Lond.) 323r245-265.
Strick, P.L. (1975) Multiple sources of thalamic input to the primate motor cortex. Brain Res. 88:372-377.
Strick, P.L. (1976) Anatomical analysis of ventrolateral thalamic input to primate motor cortex. J. Neurophysiol. 39:1020-1031.
Strick, P.L. (1985) How do the basal ganglia and cerebellum gain access to the cortical motor areas? Exp. Brain Res. 28:107-123.
Tigges, J., and M. Tigges (1985) Subcortical sources of direct projections to visual cortex. In A. Peters and E.G. Jones (eds): Cerebral Cortex, Vol. 3. New York: Wiley pp. 351-378.
Thach, W.F. i 1987) Cerebellar inputs to motor cortex. In: Motor Areas of the Motor Cortex (Ciha Foundation Symposium 132). Chichester: Wiley, pp. 201-215.
Vogt, C., and 0. Vogt (1919) Allgemeinere Ergebnisse unserer Hirnfors- chung. J. Psychol. Neurol. (Lpz) 25:277-462.
Wiesendanger, R., and M. Wiesendanger i 1985) The thalamic connections with medial area 6 (supplementary motor cortex) in the monkey tMacaca fascicularis). Exp. Brain Res. 599-104.
Wiesendanger, M., H. Hummelsheim, M. Bianchetti, D.F. Chen, B. Hyland, V. Maier, and R. Wiesendanger (1987) Input and output organization of the supplementary motor area. In: Motor Areas of the Cerebral Cortex (Ciba Foundation Symposium 132). Chichester: Wiley, pp. 40-53.
Wise, S.P., and P.L. Strick (1985) Anatomical and physiological organization of the non-primary motor cortex. In E.V. Evarts, S.P. Wise, and D. Bousfield (eds): The Motor System in Neurobioloa. Amsterdam: Elsevier, pp. 315-324.
Woolsey, C.N. (1964) Cortical localization as defined by evoked potential and electrical stimulation studies. In G. Schaltenbrand, and C.N. Woolsey ieds): Cerebral Localization and Organization. Madison: University of Wisconsin Press, pp. 17-26.