thailand grain and feed annual annual 2012
TRANSCRIPT
THIS REPORT CONTAINS ASSESSMENTS OF COMMODITY AND TRADE ISSUES MADE BY
USDA STAFF AND NOT NECESSARILY STATEMENTS OF OFFICIAL U.S. GOVERNMENT
POLICY
Date:
GAIN Report Number:
Approved By:
Prepared By:
Report Highlights:
TH2027 The anticipated large supplies of rice from the MY2011/12 and MY2012/13 crops, driven by
the aggressive Paddy Pledging Program, will hardly be exported in 2012 as Thai rice prices remain far
above its’ competitors. Thus, Thailand will see its rice exports reduced by 39 percent from
MY2010/2011 to 6.5 million metric tons (MMT). Imported feed wheat and flour are increasingly
substituting corn in feed rations as domestic corn supplies remain tight, as such feed wheat
consumption will increase by 50 percent to 900 thousand metric tons (TMT) in 2011/2012. In
2011/2012, imports of U.S. wheat are expected to increase by one percent from 2010/2011 to 500 TMT,
all of it to meet milling wheat demand.
Ponnarong Prasertsri Agricultural Specialist
John Wade Agricultural Counselor Orestes Vasquez Agricultural
Attaché
Annual 2012
Grain and Feed Annual
Thailand
TH2027
3/20/2012
Required Report - public distribution

Executive Summary:
The change in the government’s domestic support program from the Price Insurance Program to the
Pledging Program is making Thai rice uncompetitive. The anticipated excessive supplies of rice in
MY2011/12 and MY2012/13, driven by the aggressive Paddy Pledging Program, will hardly be
exported in 2012 as Indian and Vietnamese rice are over $100/MT cheaper. The Government will likely
release large portions of its MY2011/12 white rice intervention stocks in 2013 as these are expected to
increase to 8-9 million tons by the end of 2012, and most likely the release will be contingent on
exports. Consequently, international rice prices will likely be under downward pressure throughout
2012 – 2013. Under the Paddy Pledging Program, Thailand’s status as the world’s largest rice exporter
will be challenged by India and Vietnam, at the same time this program is fraught with potential WTO
domestic support and export subsidy inconsistencies.
A spillover effect of the Paddy Pledging Program is the increasing costs of feed production amid the
growing livestock industry. Despite anticipated better-than-expected corn production in MY2011/12
and MY2012/13, corn prices remain under upward pressure due to its tight supplies and the high prices
of substitutable feedstocks such as tapioca and rice a direct result of the aggressive Pledging Program.
Consequently, imported feed wheat and wheat flour are increasingly substituting corn in the feed rations
of poultry and swine as corn prices are currently 15-20 percent higher than imported feed wheat.
Import demand for milling wheat will likely continue its upward trend in 2013 – 2014 after a slowdown
in MY2011/12 when the food processing industry was affected by the flooding in the last quarter of
2011. The food processing industry is expected to fully recover from the flood damage in MY2012/13.
The Government expects the economy will grow 5.5-6.5 percent in 2012, up from a slowdown of 0.1
percent in the previous year. In MY 2011/2012, U.S. exports of milling wheat will increase one
percent to 500 TMT from the previous year.
Commodities:
Author Defined:
1. Rice
1.1 Production
Rice, Milled Thailand 2010/2011 2011/2012 2012/2013
Market Year Begin: Jan 2011
Market Year Begin: Jan 2012
Market Year Begin: Jan 2013
USDA Official
New Post
USDA Official
New Post
USDA Official New Post
Area Harvested 10,667 10,667 10,960 11,000 11,116 (1000 HA)
Wheat
Corn
Rice, Milled
Beginning Stocks 6,100 6,100 5,562 5,615 9,375 (1000 MT)
Milled Production 20,262 20,262 20,300 20,460 21,054 (1000 MT)
Rough Production 30,700 30,700 30,758 31,000 31,900 (1000 MT)
Milling Rate (.9999) 6,600 6,600 6,600 6,600 6,600 (1000 MT)
MY Imports 200 200 100 200 300 (1000 MT)
TY Imports 200 200 100 200 300 (1000 MT)
TY Imp. from U.S. 0 0 0 0 0 (1000 MT)
Total Supply 26,562 26,562 25,962 26,275 30,729 (1000 MT)
MY Exports 10,500 10,647 6,500 6,500 8,000 (1000 MT)
TY Exports 10,500 10,647 6,500 6,500 8,000 (1000 MT)
Consumption and Residual 10,500 10,300 11,500 10,400 10,600 (1000 MT)
Ending Stocks 5,562 5,615 7,962 9,375 12,129 (1000 MT)
Total Distribution 26,562 26,562 25,962 26,275 30,729 (1000 MT)
Yield (Rough) 3. 2.878 3. 2.8182 2.8697 (MT/HA)
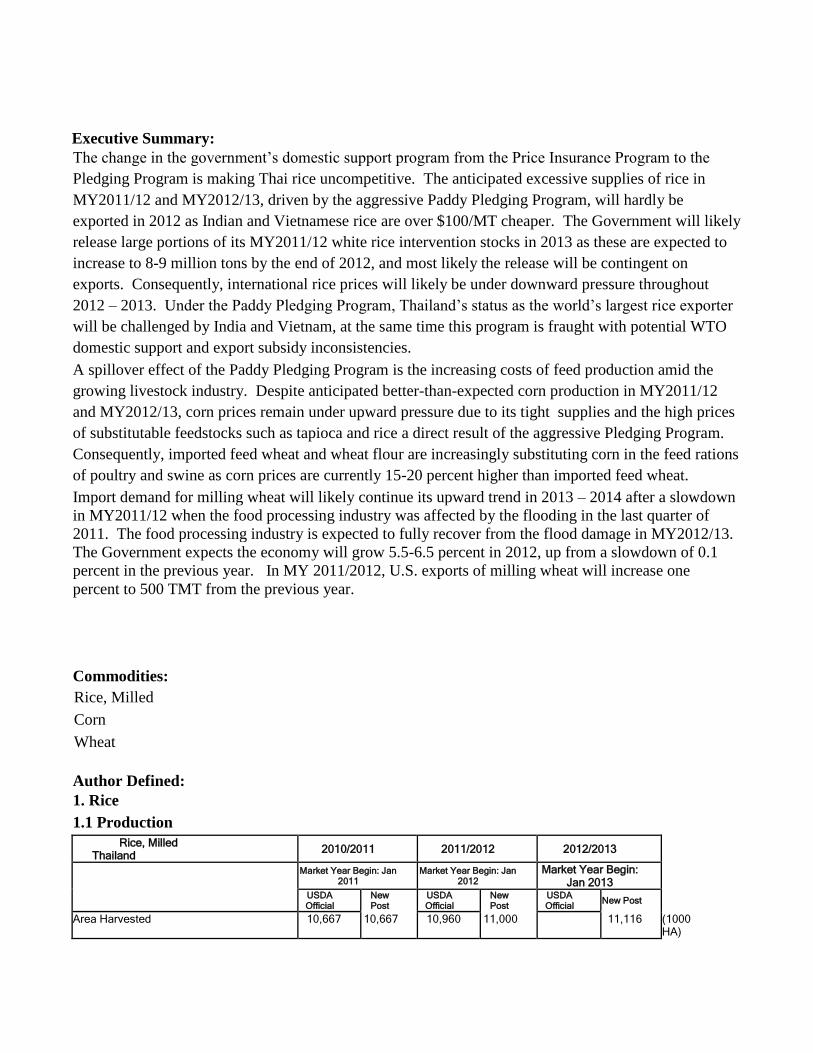
MY2011/12 rice production will likely increase to 31.0 million tons (20.5 million tons milled
equivalent) due to acreage expansion of the off-season crop driven by the government’s Paddy Pledging
Program and good reservoir levels from last year’s historical flooding. The Paddy Mortgage Program’s
attractive prices have driven farmers to increase their rice plantings as the government’s intervention
price of 15,000 baht/tons ($500/MT) is currently 46 percent above market prices.
The increased reservoirs levels have prompted the Government to allow for an expanded cultivation
area of the off-season crop that can be irrigated to10.9 million rai (1.7 million hectares) compared to 8.9
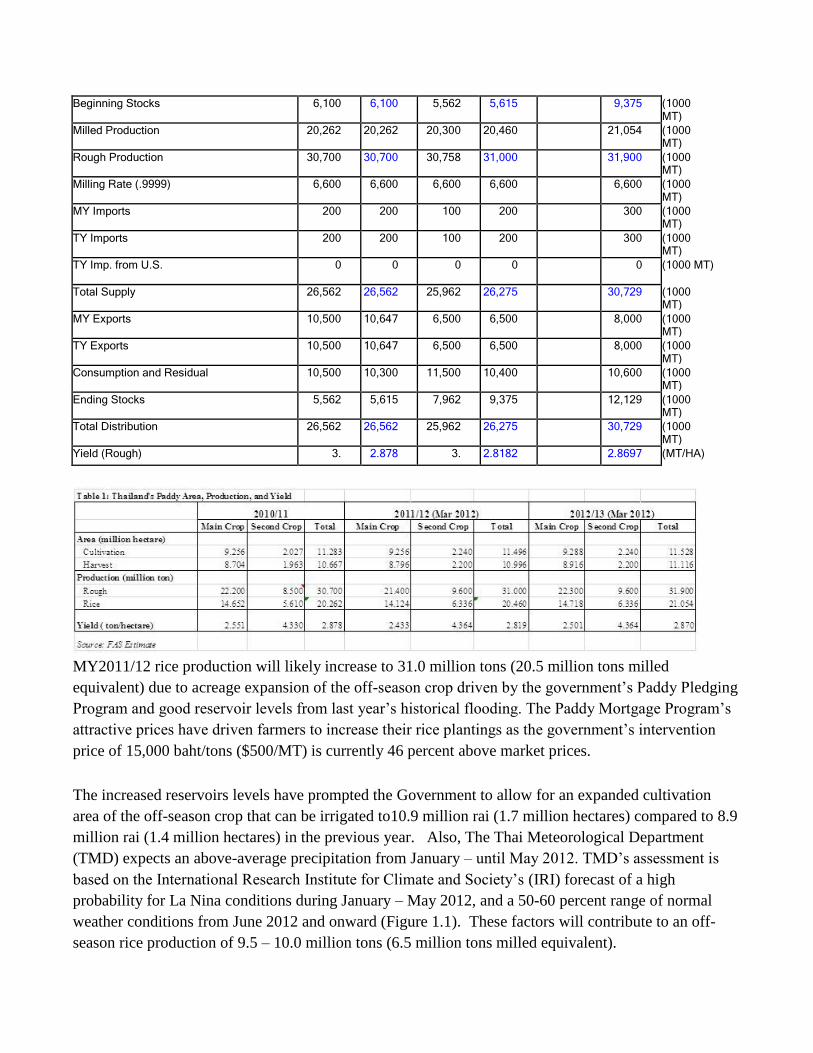
million rai (1.4 million hectares) in the previous year. Also, The Thai Meteorological Department
(TMD) expects an above-average precipitation from January – until May 2012. TMD’s assessment is
based on the International Research Institute for Climate and Society’s (IRI) forecast of a high
probability for La Nina conditions during January – May 2012, and a 50-60 percent range of normal
weather conditions from June 2012 and onward (Figure 1.1). These factors will contribute to an off-
season rice production of 9.5 – 10.0 million tons (6.5 million tons milled equivalent).
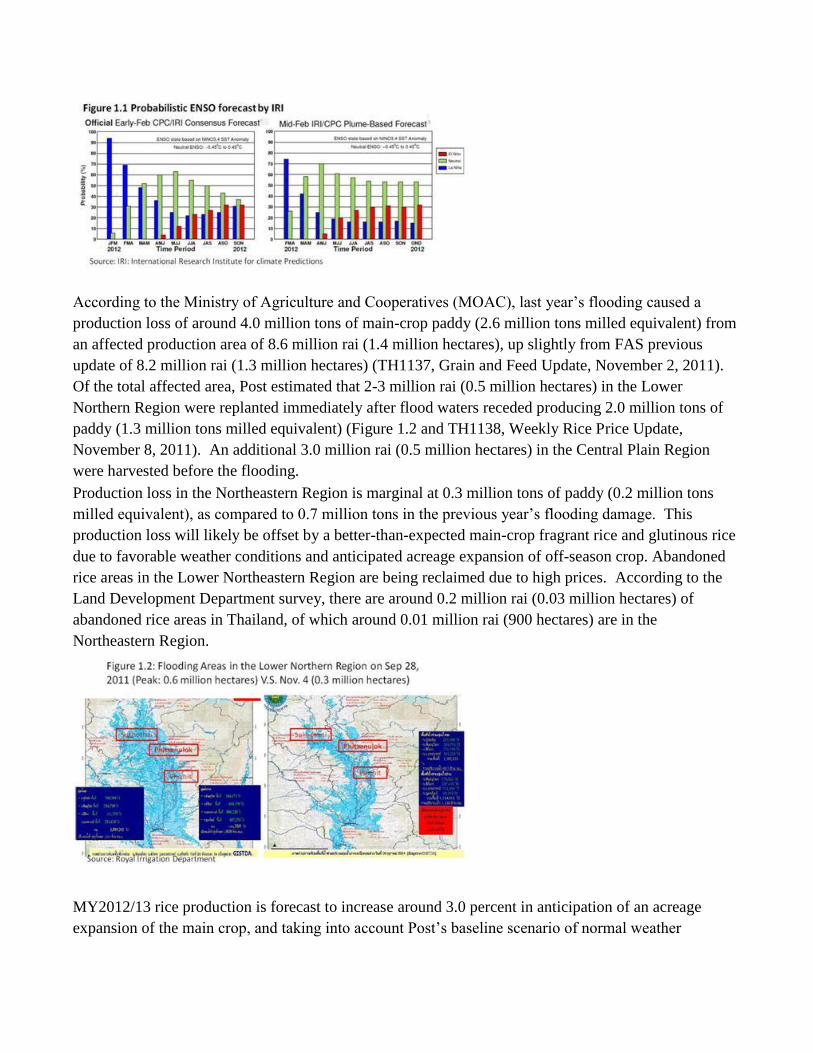
According to the Ministry of Agriculture and Cooperatives (MOAC), last year’s flooding caused a
production loss of around 4.0 million tons of main-crop paddy (2.6 million tons milled equivalent) from
an affected production area of 8.6 million rai (1.4 million hectares), up slightly from FAS previous
update of 8.2 million rai (1.3 million hectares) (TH1137, Grain and Feed Update, November 2, 2011).
Of the total affected area, Post estimated that 2-3 million rai (0.5 million hectares) in the Lower
Northern Region were replanted immediately after flood waters receded producing 2.0 million tons of
paddy (1.3 million tons milled equivalent) (Figure 1.2 and TH1138, Weekly Rice Price Update,
November 8, 2011). An additional 3.0 million rai (0.5 million hectares) in the Central Plain Region
were harvested before the flooding.
Production loss in the Northeastern Region is marginal at 0.3 million tons of paddy (0.2 million tons
milled equivalent), as compared to 0.7 million tons in the previous year’s flooding damage. This
production loss will likely be offset by a better-than-expected main-crop fragrant rice and glutinous rice
due to favorable weather conditions and anticipated acreage expansion of off-season crop. Abandoned
rice areas in the Lower Northeastern Region are being reclaimed due to high prices. According to the
Land Development Department survey, there are around 0.2 million rai (0.03 million hectares) of
abandoned rice areas in Thailand, of which around 0.01 million rai (900 hectares) are in the
Northeastern Region.
MY2012/13 rice production is forecast to increase around 3.0 percent in anticipation of an acreage
expansion of the main crop, and taking into account Post’s baseline scenario of normal weather
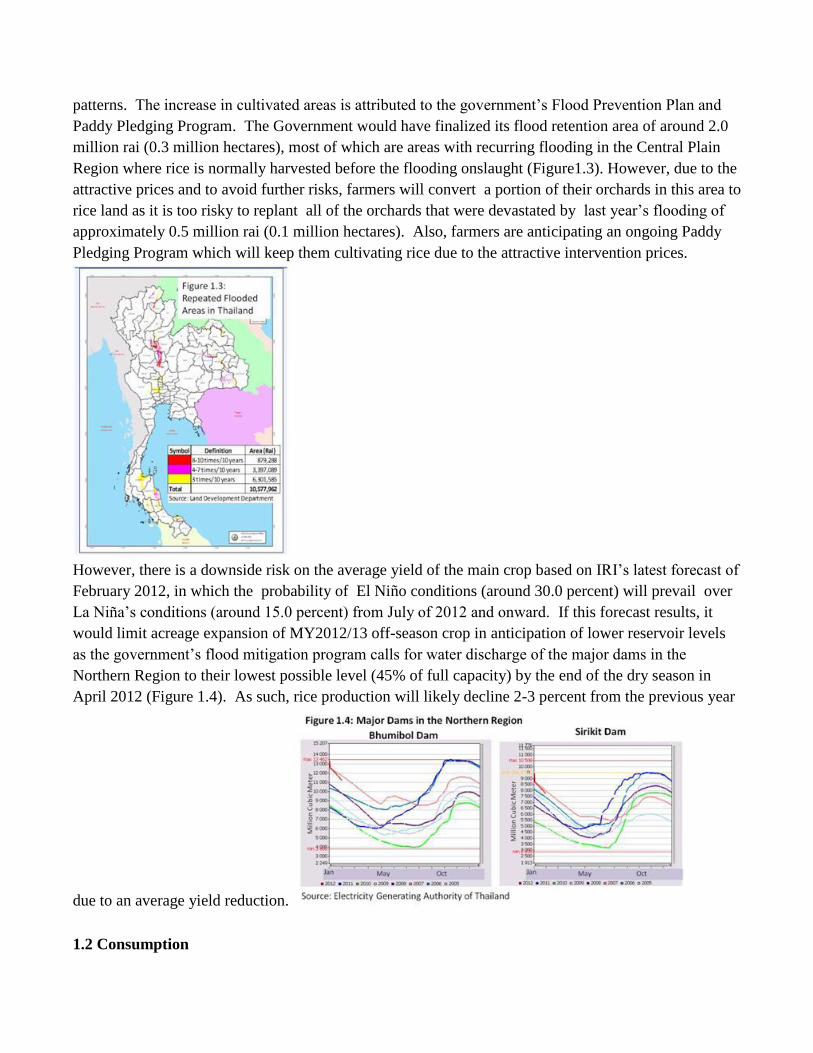
patterns. The increase in cultivated areas is attributed to the government’s Flood Prevention Plan and
Paddy Pledging Program. The Government would have finalized its flood retention area of around 2.0
million rai (0.3 million hectares), most of which are areas with recurring flooding in the Central Plain
Region where rice is normally harvested before the flooding onslaught (Figure1.3). However, due to the
attractive prices and to avoid further risks, farmers will convert a portion of their orchards in this area to
rice land as it is too risky to replant all of the orchards that were devastated by last year’s flooding of
approximately 0.5 million rai (0.1 million hectares). Also, farmers are anticipating an ongoing Paddy
Pledging Program which will keep them cultivating rice due to the attractive intervention prices.
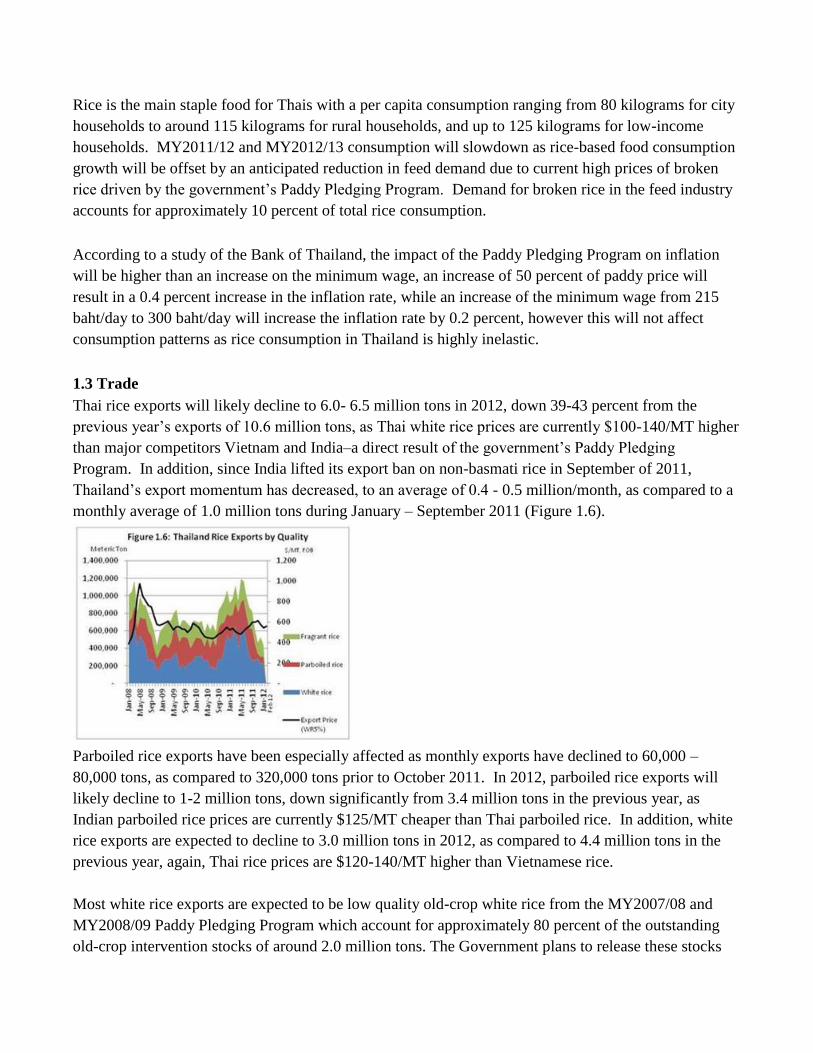
However, there is a downside risk on the average yield of the main crop based on IRI’s latest forecast of
February 2012, in which the probability of El Niño conditions (around 30.0 percent) will prevail over
La Niña’s conditions (around 15.0 percent) from July of 2012 and onward. If this forecast results, it
would limit acreage expansion of MY2012/13 off-season crop in anticipation of lower reservoir levels
as the government’s flood mitigation program calls for water discharge of the major dams in the
Northern Region to their lowest possible level (45% of full capacity) by the end of the dry season in
April 2012 (Figure 1.4). As such, rice production will likely decline 2-3 percent from the previous year
due to an average yield reduction.
1.2 Consumption
Rice is the main staple food for Thais with a per capita consumption ranging from 80 kilograms for city
households to around 115 kilograms for rural households, and up to 125 kilograms for low-income
households. MY2011/12 and MY2012/13 consumption will slowdown as rice-based food consumption
growth will be offset by an anticipated reduction in feed demand due to current high prices of broken
rice driven by the government’s Paddy Pledging Program. Demand for broken rice in the feed industry
accounts for approximately 10 percent of total rice consumption.
According to a study of the Bank of Thailand, the impact of the Paddy Pledging Program on inflation
will be higher than an increase on the minimum wage, an increase of 50 percent of paddy price will
result in a 0.4 percent increase in the inflation rate, while an increase of the minimum wage from 215
baht/day to 300 baht/day will increase the inflation rate by 0.2 percent, however this will not affect
consumption patterns as rice consumption in Thailand is highly inelastic.
1.3 Trade
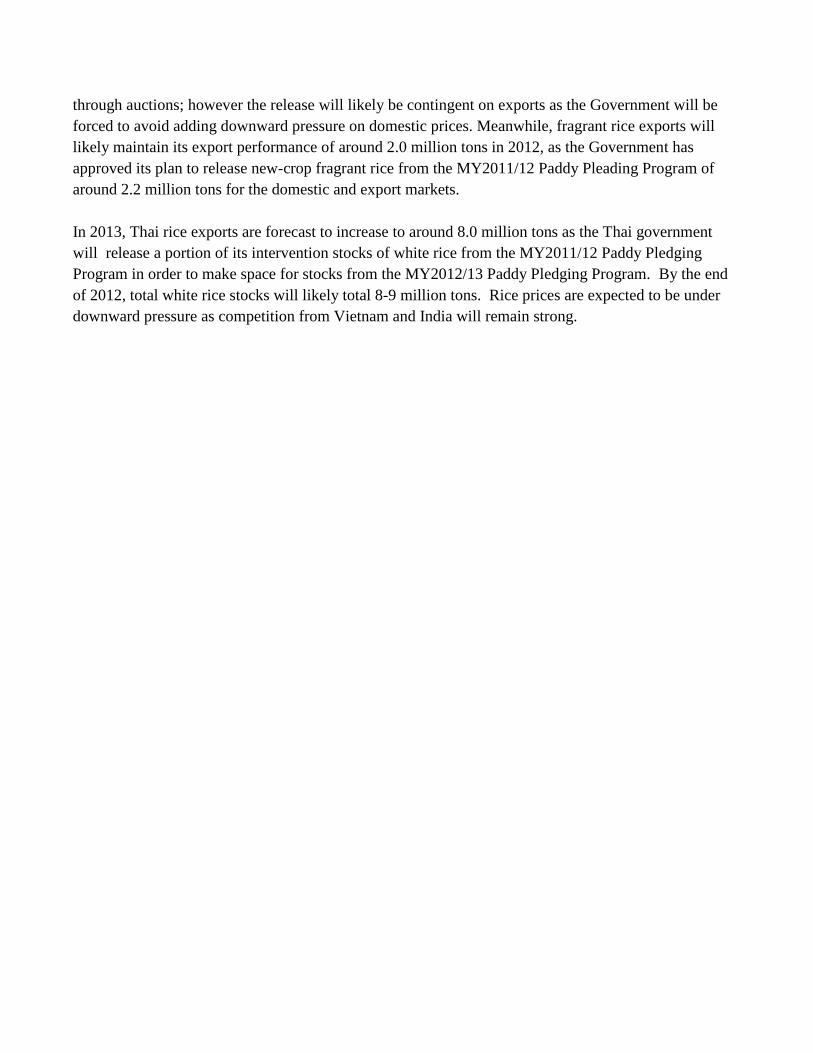
Thai rice exports will likely decline to 6.0- 6.5 million tons in 2012, down 39-43 percent from the
previous year’s exports of 10.6 million tons, as Thai white rice prices are currently $100-140/MT higher
than major competitors Vietnam and India–a direct result of the government’s Paddy Pledging
Program. In addition, since India lifted its export ban on non-basmati rice in September of 2011,
Thailand’s export momentum has decreased, to an average of 0.4 - 0.5 million/month, as compared to a
monthly average of 1.0 million tons during January – September 2011 (Figure 1.6).
Parboiled rice exports have been especially affected as monthly exports have declined to 60,000 –
80,000 tons, as compared to 320,000 tons prior to October 2011. In 2012, parboiled rice exports will
likely decline to 1-2 million tons, down significantly from 3.4 million tons in the previous year, as
Indian parboiled rice prices are currently $125/MT cheaper than Thai parboiled rice. In addition, white
rice exports are expected to decline to 3.0 million tons in 2012, as compared to 4.4 million tons in the
previous year, again, Thai rice prices are $120-140/MT higher than Vietnamese rice.
Most white rice exports are expected to be low quality old-crop white rice from the MY2007/08 and
MY2008/09 Paddy Pledging Program which account for approximately 80 percent of the outstanding
old-crop intervention stocks of around 2.0 million tons. The Government plans to release these stocks
through auctions; however the release will likely be contingent on exports as the Government will be
forced to avoid adding downward pressure on domestic prices. Meanwhile, fragrant rice exports will
likely maintain its export performance of around 2.0 million tons in 2012, as the Government has
approved its plan to release new-crop fragrant rice from the MY2011/12 Paddy Pleading Program of
around 2.2 million tons for the domestic and export markets.
In 2013, Thai rice exports are forecast to increase to around 8.0 million tons as the Thai government
will release a portion of its intervention stocks of white rice from the MY2011/12 Paddy Pledging
Program in order to make space for stocks from the MY2012/13 Paddy Pledging Program. By the end
of 2012, total white rice stocks will likely total 8-9 million tons. Rice prices are expected to be under
downward pressure as competition from Vietnam and India will remain strong.
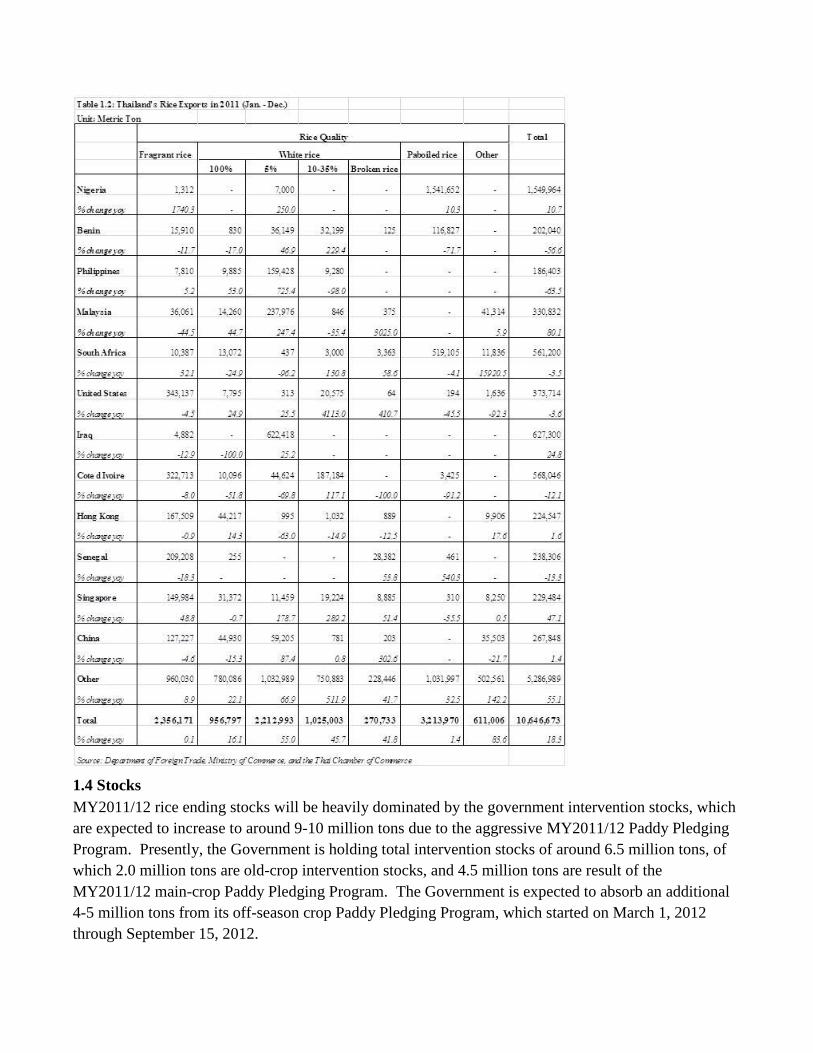
1.4 Stocks
MY2011/12 rice ending stocks will be heavily dominated by the government intervention stocks, which
are expected to increase to around 9-10 million tons due to the aggressive MY2011/12 Paddy Pledging
Program. Presently, the Government is holding total intervention stocks of around 6.5 million tons, of
which 2.0 million tons are old-crop intervention stocks, and 4.5 million tons are result of the
MY2011/12 main-crop Paddy Pledging Program. The Government is expected to absorb an additional
4-5 million tons from its off-season crop Paddy Pledging Program, which started on March 1, 2012
through September 15, 2012.
In addition, the Paddy Pledging Program will likely continue for the MY2012/13 main crop that and is
expected to absorb another 3.0 million tons by the end of 2012. However, Post expects an intervention
stock release of approximately 4-5 million tons in 2012, of which 2.0 million tons will be old-crop
intervention stocks (mostly white rice) and around 2-3 million tons will be MY2011/12 main crop,
especially fragrant rice.
In MY2012/13, ending stocks of rice will likely remain high at around 12.0 million tons as the
government’s Paddy Pledging Program is expected to be as aggressive as the previous year’s program.
The Government is expected to release a portion of white rice stocks accumulated from MY2011/12
Paddy Pleading Program of around 6-7 million tons at or below market prices which will probably be
lower than the prices that the Government acquired the stocks for.
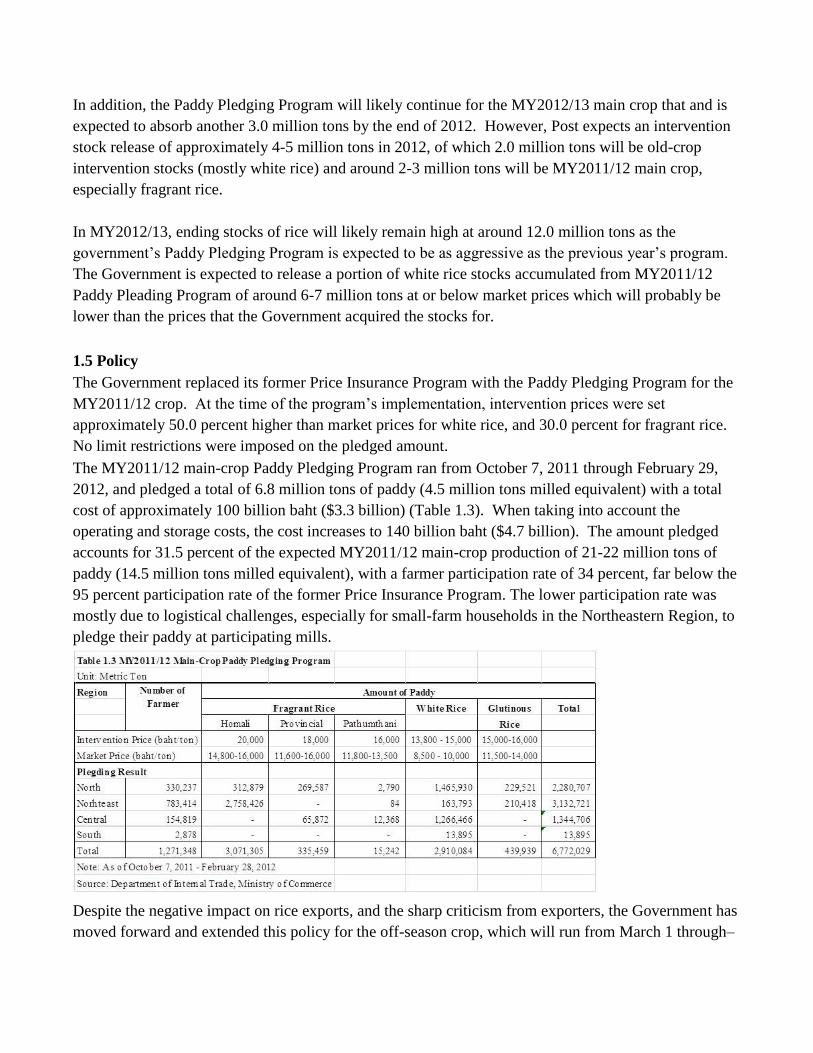
1.5 Policy
The Government replaced its former Price Insurance Program with the Paddy Pledging Program for the
MY2011/12 crop. At the time of the program’s implementation, intervention prices were set
approximately 50.0 percent higher than market prices for white rice, and 30.0 percent for fragrant rice.
No limit restrictions were imposed on the pledged amount.
The MY2011/12 main-crop Paddy Pledging Program ran from October 7, 2011 through February 29,
2012, and pledged a total of 6.8 million tons of paddy (4.5 million tons milled equivalent) with a total
cost of approximately 100 billion baht ($3.3 billion) (Table 1.3). When taking into account the
operating and storage costs, the cost increases to 140 billion baht ($4.7 billion). The amount pledged
accounts for 31.5 percent of the expected MY2011/12 main-crop production of 21-22 million tons of
paddy (14.5 million tons milled equivalent), with a farmer participation rate of 34 percent, far below the
95 percent participation rate of the former Price Insurance Program. The lower participation rate was
mostly due to logistical challenges, especially for small-farm households in the Northeastern Region, to
pledge their paddy at participating mills.
Despite the negative impact on rice exports, and the sharp criticism from exporters, the Government has
moved forward and extended this policy for the off-season crop, which will run from March 1 through–
September 15, 2012. Post expects that this program will pledge 7.0 million tons of white rice paddy
(4.6 million tons milled equivalent) which will account for around 70 percent of the anticipated off-
season production, as the intervention prices will remain attractive at 13,800 – 15,000 baht/tons, or 50-
60 percent above current market prices.
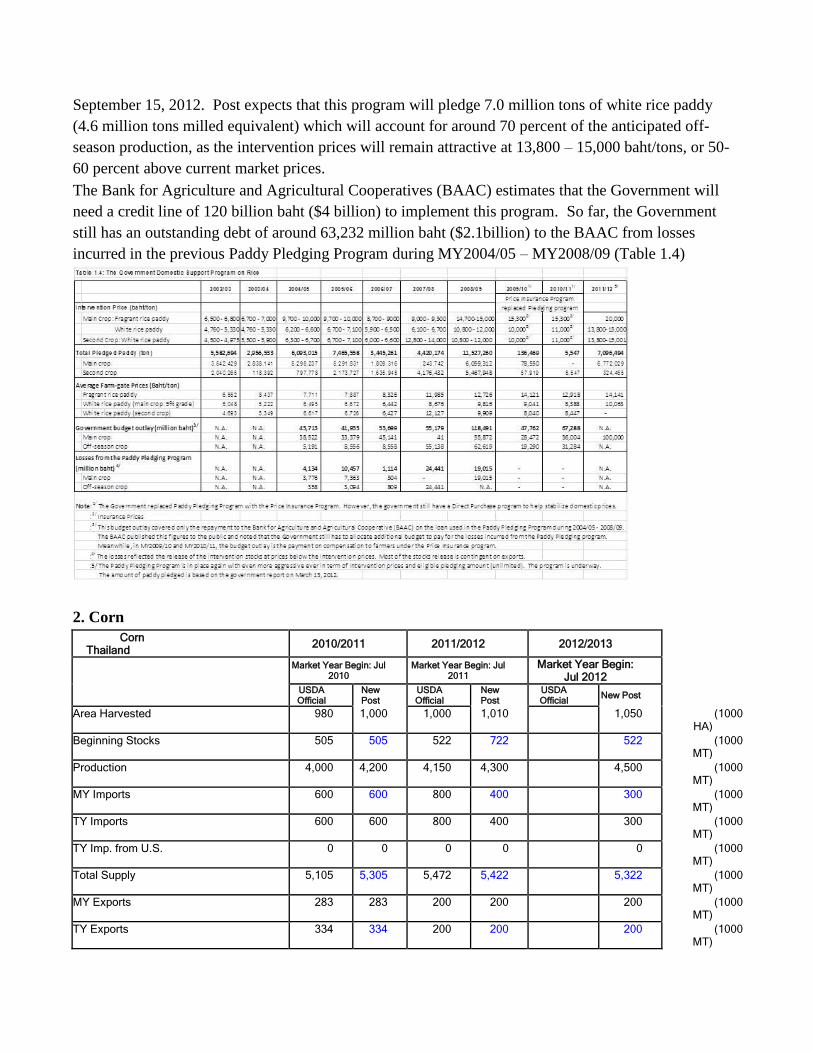
The Bank for Agriculture and Agricultural Cooperatives (BAAC) estimates that the Government will
need a credit line of 120 billion baht ($4 billion) to implement this program. So far, the Government
still has an outstanding debt of around 63,232 million baht ($2.1billion) to the BAAC from losses
incurred in the previous Paddy Pledging Program during MY2004/05 – MY2008/09 (Table 1.4)
2. Corn
Corn Thailand 2010/2011 2011/2012 2012/2013
Market Year Begin: Jul 2010
Market Year Begin: Jul 2011
Market Year Begin: Jul 2012
USDA Official
New Post
USDA Official
New Post
USDA Official New Post
Area Harvested 980 1,000 1,000 1,010 1,050 (1000 HA)
Beginning Stocks 505 505 522 722 522 (1000 MT)
Production 4,000 4,200 4,150 4,300 4,500 (1000 MT)
MY Imports 600 600 800 400 300 (1000 MT)
TY Imports 600 600 800 400 300 (1000 MT)
TY Imp. from U.S. 0 0 0 0 0 (1000 MT)
Total Supply 5,105 5,305 5,472 5,422 5,322 (1000 MT)
MY Exports 283 283 200 200 200 (1000 MT)
TY Exports 334 334 200 200 200 (1000 MT)
Feed and Residual 4,200 4,200 4,600 4,600 4,800 (1000 MT)
FSI Consumption 100 100 100 100 100 (1000 MT)
Total Consumption 4,300 4,300 4,700 4,700 4,900 (1000 MT)
Ending Stocks 522 722 572 522 222 (1000 MT)
Total Distribution 5,105 5,305 5,472 5,422 5,322 (1000 MT)
Yield 4. 4.2 4. 4.2574 4.2857 (MT/HA)
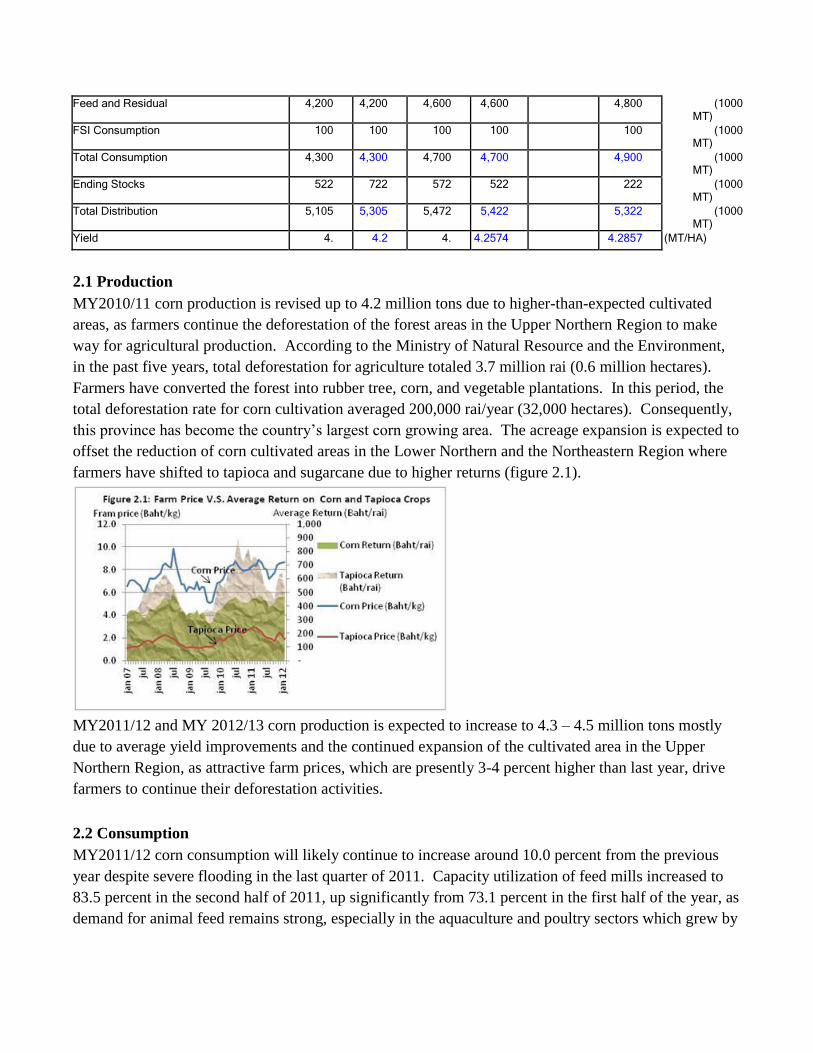
2.1 Production
MY2010/11 corn production is revised up to 4.2 million tons due to higher-than-expected cultivated
areas, as farmers continue the deforestation of the forest areas in the Upper Northern Region to make
way for agricultural production. According to the Ministry of Natural Resource and the Environment,
in the past five years, total deforestation for agriculture totaled 3.7 million rai (0.6 million hectares).
Farmers have converted the forest into rubber tree, corn, and vegetable plantations. In this period, the
total deforestation rate for corn cultivation averaged 200,000 rai/year (32,000 hectares). Consequently,
this province has become the country’s largest corn growing area. The acreage expansion is expected to
offset the reduction of corn cultivated areas in the Lower Northern and the Northeastern Region where
farmers have shifted to tapioca and sugarcane due to higher returns (figure 2.1).
MY2011/12 and MY 2012/13 corn production is expected to increase to 4.3 – 4.5 million tons mostly
due to average yield improvements and the continued expansion of the cultivated area in the Upper
Northern Region, as attractive farm prices, which are presently 3-4 percent higher than last year, drive
farmers to continue their deforestation activities.
2.2 Consumption
MY2011/12 corn consumption will likely continue to increase around 10.0 percent from the previous
year despite severe flooding in the last quarter of 2011. Capacity utilization of feed mills increased to
83.5 percent in the second half of 2011, up significantly from 73.1 percent in the first half of the year, as
demand for animal feed remains strong, especially in the aquaculture and poultry sectors which grew by
double digits in 2011, and were marginally impacted by the flooding. This trend continued in January
of 2012, as capacity utilization remained high at around 82-83 percent.
In Thailand broiler and swine feed production use approximately 60-65 percent of corn in their
rations. Meanwhile, feed wheat is increasingly substituting corn in the feed rations of poultry and swine
feed due to high domestic corn prices and corn import constraints. Presently, domestic corn prices are
15-20 percent higher than imported feed wheat prices. In addition, the substitution of tapioca for corn is
currently limited due to high domestic tapioca prices driven by the government’s Tapioca Mortgage
Program. Cost of feed production will likely increase 5-10 percent in 2012 due to the government’s
aggressive pledging programs for both rice and tapioca.
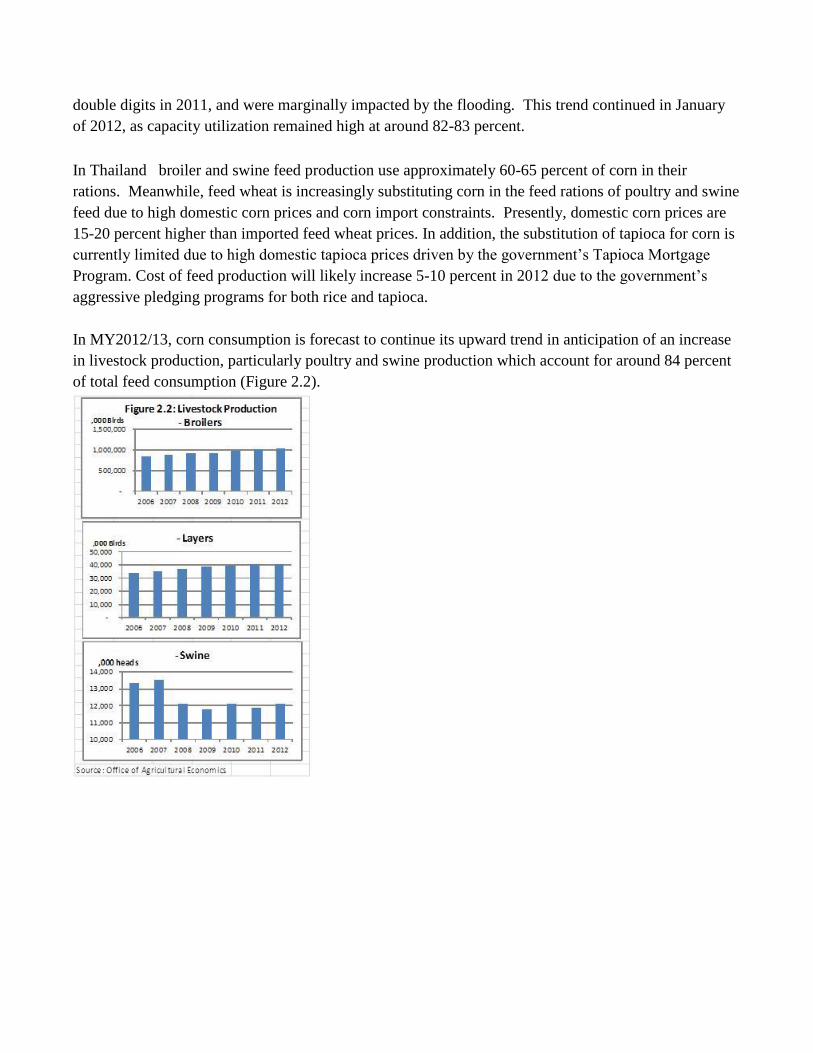
In MY2012/13, corn consumption is forecast to continue its upward trend in anticipation of an increase
in livestock production, particularly poultry and swine production which account for around 84 percent
of total feed consumption (Figure 2.2).
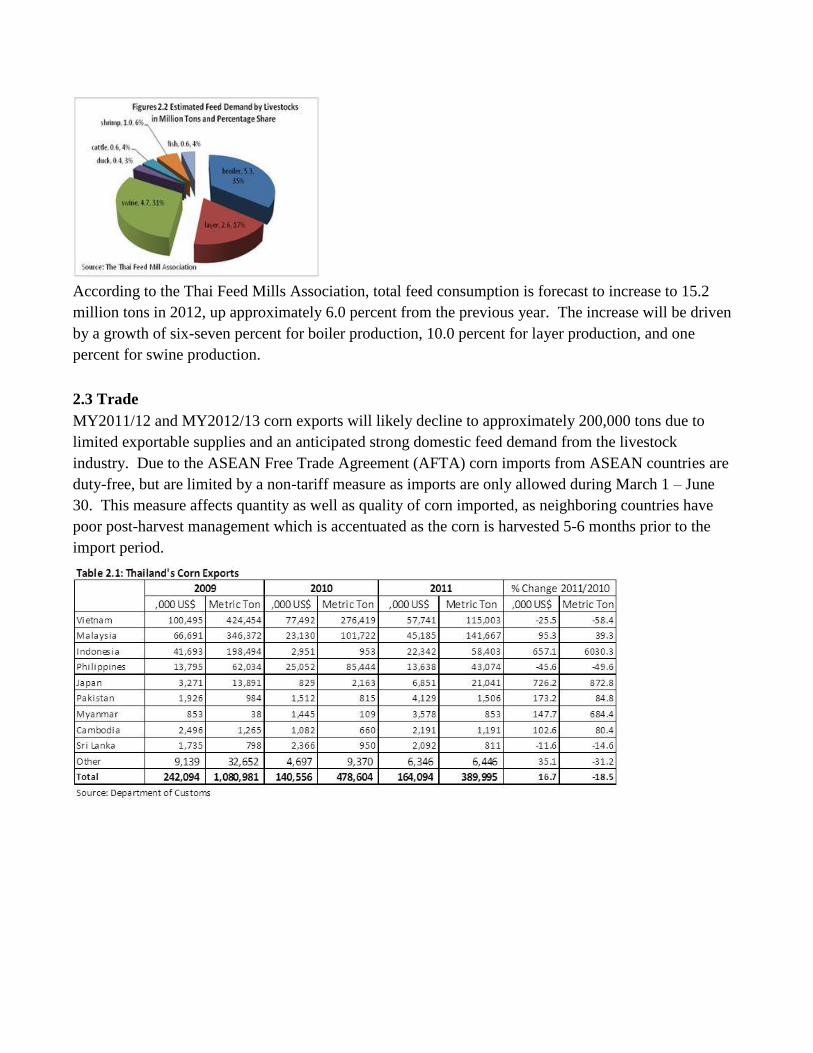
According to the Thai Feed Mills Association, total feed consumption is forecast to increase to 15.2
million tons in 2012, up approximately 6.0 percent from the previous year. The increase will be driven
by a growth of six-seven percent for boiler production, 10.0 percent for layer production, and one
percent for swine production.
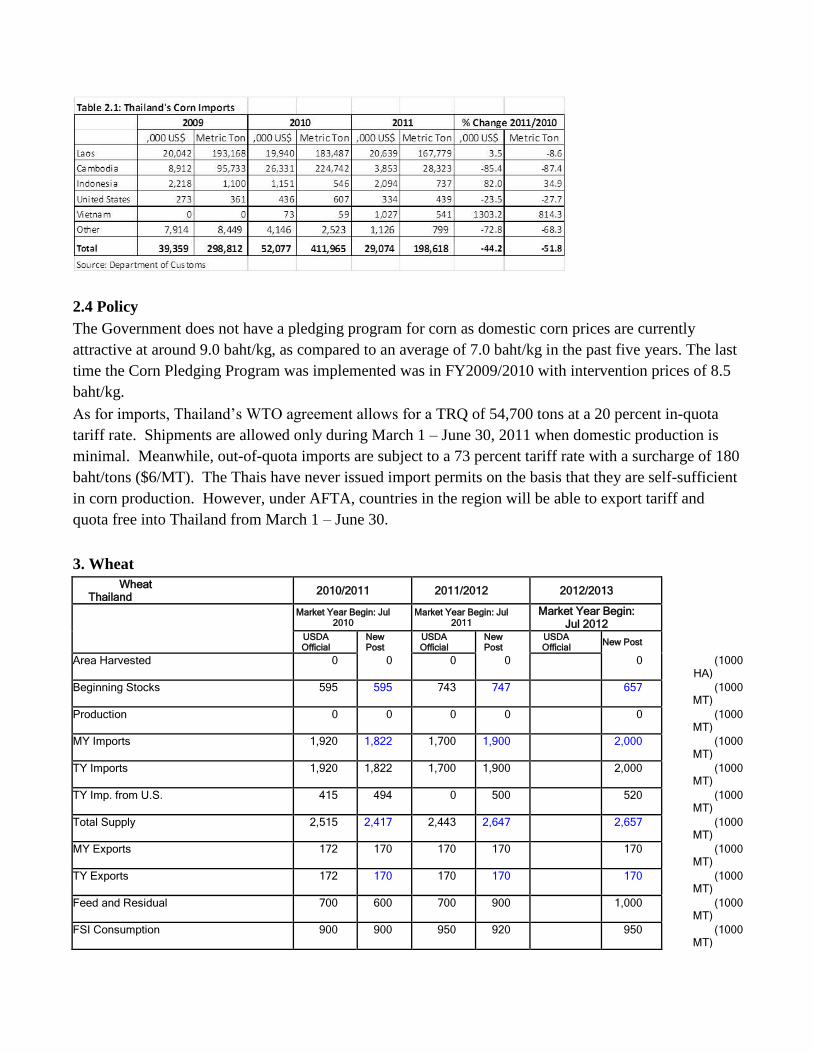
2.3 Trade
MY2011/12 and MY2012/13 corn exports will likely decline to approximately 200,000 tons due to
limited exportable supplies and an anticipated strong domestic feed demand from the livestock
industry. Due to the ASEAN Free Trade Agreement (AFTA) corn imports from ASEAN countries are
duty-free, but are limited by a non-tariff measure as imports are only allowed during March 1 – June
30. This measure affects quantity as well as quality of corn imported, as neighboring countries have
poor post-harvest management which is accentuated as the corn is harvested 5-6 months prior to the
import period.
2.4 Policy
The Government does not have a pledging program for corn as domestic corn prices are currently
attractive at around 9.0 baht/kg, as compared to an average of 7.0 baht/kg in the past five years. The last
time the Corn Pledging Program was implemented was in FY2009/2010 with intervention prices of 8.5
baht/kg.
As for imports, Thailand’s WTO agreement allows for a TRQ of 54,700 tons at a 20 percent in-quota
tariff rate. Shipments are allowed only during March 1 – June 30, 2011 when domestic production is
minimal. Meanwhile, out-of-quota imports are subject to a 73 percent tariff rate with a surcharge of 180
baht/tons ($6/MT). The Thais have never issued import permits on the basis that they are self-sufficient
in corn production. However, under AFTA, countries in the region will be able to export tariff and
quota free into Thailand from March 1 – June 30.
3. Wheat
Wheat Thailand 2010/2011 2011/2012 2012/2013
Market Year Begin: Jul 2010
Market Year Begin: Jul 2011
Market Year Begin: Jul 2012
USDA Official
New Post
USDA Official
New Post
USDA Official New Post
Area Harvested 0 0 0 0 0 (1000 HA)
Beginning Stocks 595 595 743 747 657 (1000 MT)
Production 0 0 0 0 0 (1000 MT)
MY Imports 1,920 1,822 1,700 1,900 2,000 (1000 MT)
TY Imports 1,920 1,822 1,700 1,900 2,000 (1000 MT)
TY Imp. from U.S. 415 494 0 500 520 (1000 MT)
Total Supply 2,515 2,417 2,443 2,647 2,657 (1000 MT)
MY Exports 172 170 170 170 170 (1000 MT)
TY Exports 172 170 170 170 170 (1000 MT)
Feed and Residual 700 600 700 900 1,000 (1000 MT)
FSI Consumption 900 900 950 920 950 (1000 MT)
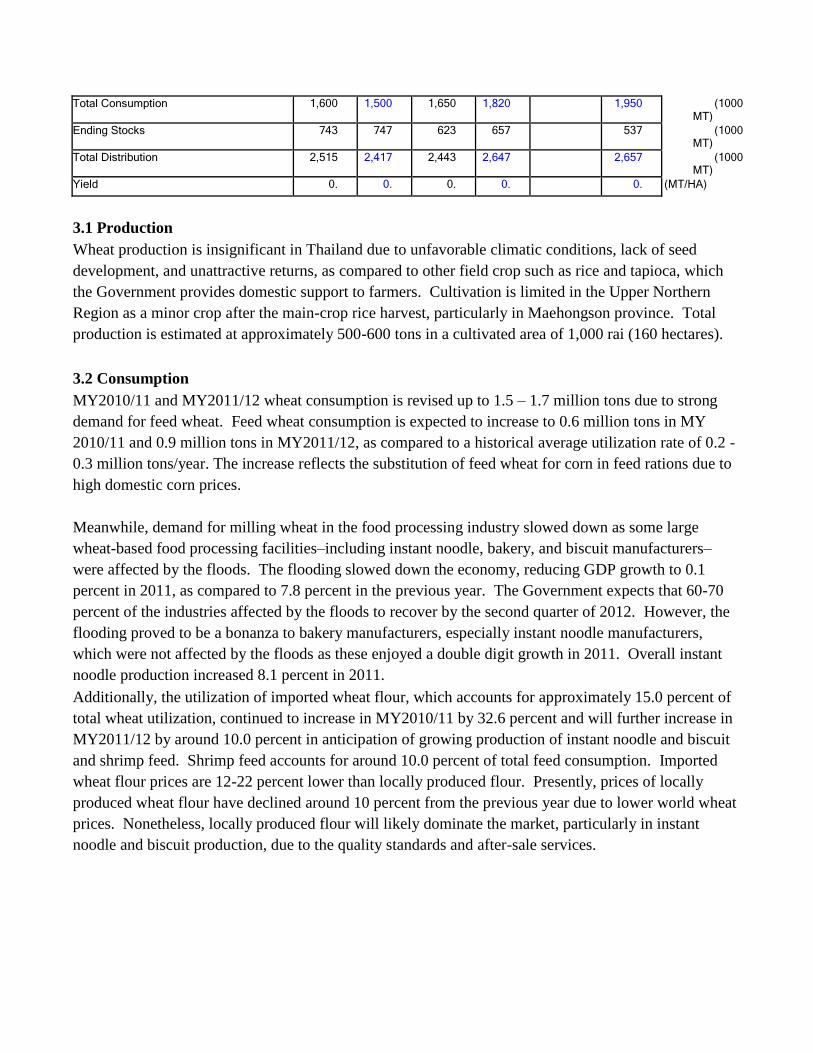
Total Consumption 1,600 1,500 1,650 1,820 1,950 (1000 MT)
Ending Stocks 743 747 623 657 537 (1000 MT)
Total Distribution 2,515 2,417 2,443 2,647 2,657 (1000 MT)
Yield 0. 0. 0. 0. 0. (MT/HA)
3.1 Production
Wheat production is insignificant in Thailand due to unfavorable climatic conditions, lack of seed
development, and unattractive returns, as compared to other field crop such as rice and tapioca, which
the Government provides domestic support to farmers. Cultivation is limited in the Upper Northern
Region as a minor crop after the main-crop rice harvest, particularly in Maehongson province. Total
production is estimated at approximately 500-600 tons in a cultivated area of 1,000 rai (160 hectares).
3.2 Consumption
MY2010/11 and MY2011/12 wheat consumption is revised up to 1.5 – 1.7 million tons due to strong
demand for feed wheat. Feed wheat consumption is expected to increase to 0.6 million tons in MY
2010/11 and 0.9 million tons in MY2011/12, as compared to a historical average utilization rate of 0.2 -
0.3 million tons/year. The increase reflects the substitution of feed wheat for corn in feed rations due to
high domestic corn prices.
Meanwhile, demand for milling wheat in the food processing industry slowed down as some large
wheat-based food processing facilities–including instant noodle, bakery, and biscuit manufacturers–
were affected by the floods. The flooding slowed down the economy, reducing GDP growth to 0.1
percent in 2011, as compared to 7.8 percent in the previous year. The Government expects that 60-70
percent of the industries affected by the floods to recover by the second quarter of 2012. However, the
flooding proved to be a bonanza to bakery manufacturers, especially instant noodle manufacturers,
which were not affected by the floods as these enjoyed a double digit growth in 2011. Overall instant
noodle production increased 8.1 percent in 2011.
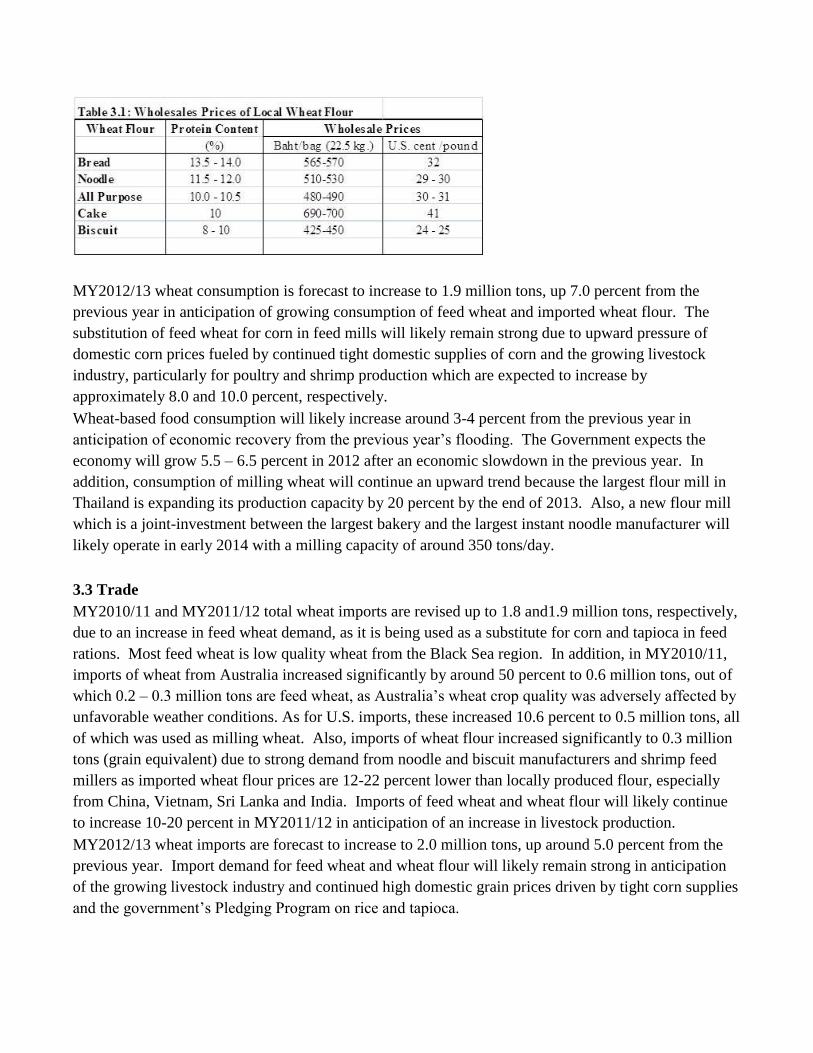
Additionally, the utilization of imported wheat flour, which accounts for approximately 15.0 percent of
total wheat utilization, continued to increase in MY2010/11 by 32.6 percent and will further increase in
MY2011/12 by around 10.0 percent in anticipation of growing production of instant noodle and biscuit
and shrimp feed. Shrimp feed accounts for around 10.0 percent of total feed consumption. Imported
wheat flour prices are 12-22 percent lower than locally produced flour. Presently, prices of locally
produced wheat flour have declined around 10 percent from the previous year due to lower world wheat
prices. Nonetheless, locally produced flour will likely dominate the market, particularly in instant
noodle and biscuit production, due to the quality standards and after-sale services.
MY2012/13 wheat consumption is forecast to increase to 1.9 million tons, up 7.0 percent from the
previous year in anticipation of growing consumption of feed wheat and imported wheat flour. The
substitution of feed wheat for corn in feed mills will likely remain strong due to upward pressure of
domestic corn prices fueled by continued tight domestic supplies of corn and the growing livestock
industry, particularly for poultry and shrimp production which are expected to increase by
approximately 8.0 and 10.0 percent, respectively.
Wheat-based food consumption will likely increase around 3-4 percent from the previous year in
anticipation of economic recovery from the previous year’s flooding. The Government expects the
economy will grow 5.5 – 6.5 percent in 2012 after an economic slowdown in the previous year. In
addition, consumption of milling wheat will continue an upward trend because the largest flour mill in
Thailand is expanding its production capacity by 20 percent by the end of 2013. Also, a new flour mill
which is a joint-investment between the largest bakery and the largest instant noodle manufacturer will
likely operate in early 2014 with a milling capacity of around 350 tons/day.
3.3 Trade
MY2010/11 and MY2011/12 total wheat imports are revised up to 1.8 and1.9 million tons, respectively,
due to an increase in feed wheat demand, as it is being used as a substitute for corn and tapioca in feed
rations. Most feed wheat is low quality wheat from the Black Sea region. In addition, in MY2010/11,
imports of wheat from Australia increased significantly by around 50 percent to 0.6 million tons, out of
which 0.2 – 0.3 million tons are feed wheat, as Australia’s wheat crop quality was adversely affected by
unfavorable weather conditions. As for U.S. imports, these increased 10.6 percent to 0.5 million tons, all
of which was used as milling wheat. Also, imports of wheat flour increased significantly to 0.3 million
tons (grain equivalent) due to strong demand from noodle and biscuit manufacturers and shrimp feed
millers as imported wheat flour prices are 12-22 percent lower than locally produced flour, especially
from China, Vietnam, Sri Lanka and India. Imports of feed wheat and wheat flour will likely continue
to increase 10-20 percent in MY2011/12 in anticipation of an increase in livestock production.
MY2012/13 wheat imports are forecast to increase to 2.0 million tons, up around 5.0 percent from the
previous year. Import demand for feed wheat and wheat flour will likely remain strong in anticipation
of the growing livestock industry and continued high domestic grain prices driven by tight corn supplies
and the government’s Pledging Program on rice and tapioca.
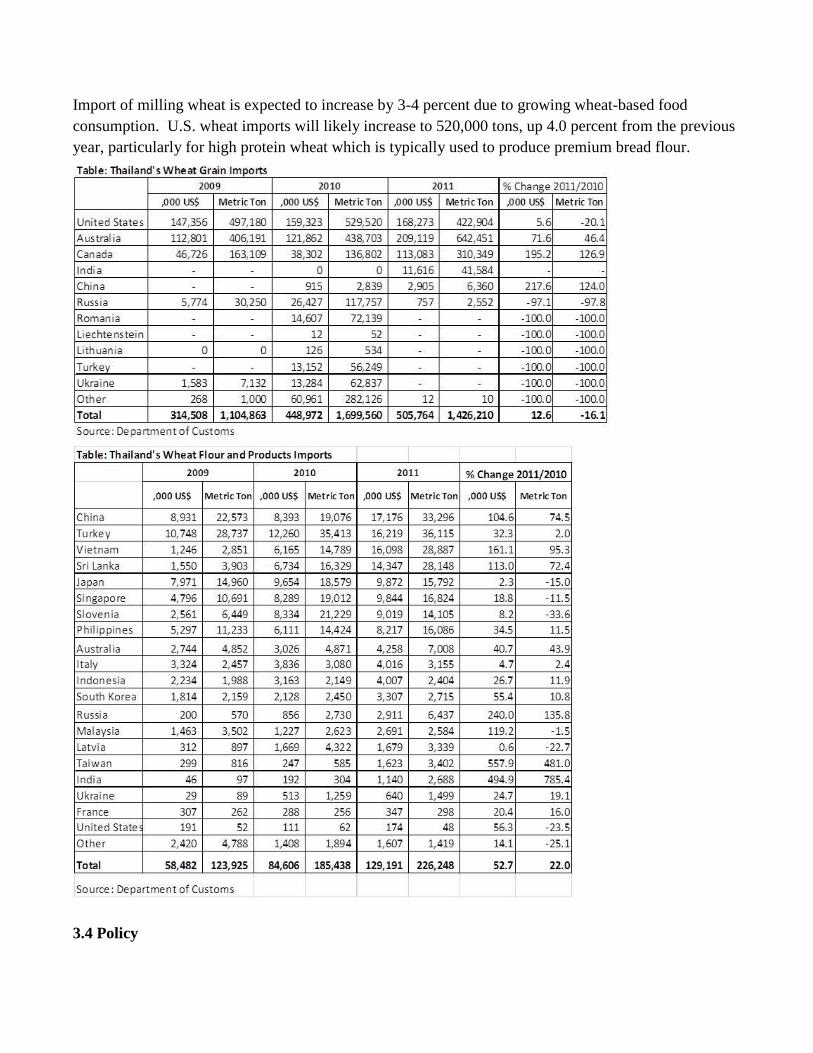
Import of milling wheat is expected to increase by 3-4 percent due to growing wheat-based food
consumption. U.S. wheat imports will likely increase to 520,000 tons, up 4.0 percent from the previous
year, particularly for high protein wheat which is typically used to produce premium bread flour.
3.4 Policy
The tariff rate on imported wheat has been zero since September 2007. Meanwhile, the applied tariff on
wheat flour is 5 percent, or 0.5 baht/kg (whichever is higher), except within AFTA (Brunei, Indonesia,
Malaysia, Philippines, and Singapore) and ASEAN-Australia-New Zealand which is duty free since
January 2010, however 40 percent of the content has to originate from the exporting country. (TH1035,
Grain and Feed Annual 2011, March 22, 2011). Wheat flour imports from Vietnam which is a new
member of ASEAN will be duty free in 2015 under AFTA. The imported wheat quality is low as such
the US is not competitive in this market.
4. Beans
4.1 Production
Bean Thailand/Unit: 1,000 HA; 1,000 MT
2010 2011 2012 2010/2011 2011/2012 2012/2013
Market Year Begin: Jan 2010
Market Year Begin: Jan 2011
Market Year Begin: Jan 2012
USDA Official Data Jan
USDA Official Data Jan
USDA Official Data
Jan
Data Data Data Area Harvested 270 270 272 272 260
Beginning Stocks 3 3 3 3 3
Production 310 306 310 312 295
MY Imports 10 25 30 19 25
TY Imports 10 25 30 19 25
TY Imp. from U.S. 0 0 0 0 0
Total Supply 323 334 343 334 323
MY Exports 55 25 20 35 20
TY Exports 55 25 20 35 20
Feed and Residual 5 5 5 5 5
FSI Consumption 260 301 315 291 295
Total Consumption 265 306 320 296 300
Ending Stocks 3 3 3 3 3
Total Distribution 323 334 343 334 323
Yield 1.1481 1.1333 1.1397 1.1471 1.1346
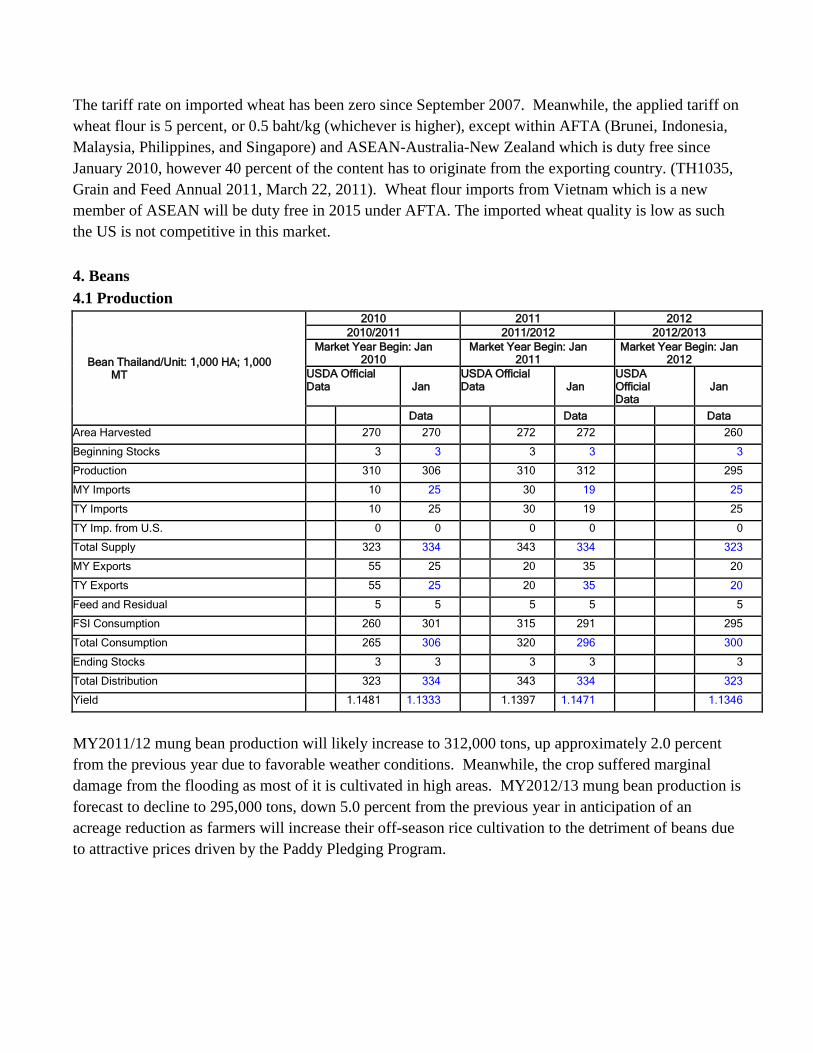
MY2011/12 mung bean production will likely increase to 312,000 tons, up approximately 2.0 percent
from the previous year due to favorable weather conditions. Meanwhile, the crop suffered marginal
damage from the flooding as most of it is cultivated in high areas. MY2012/13 mung bean production is
forecast to decline to 295,000 tons, down 5.0 percent from the previous year in anticipation of an
acreage reduction as farmers will increase their off-season rice cultivation to the detriment of beans due
to attractive prices driven by the Paddy Pledging Program.
4.2 Consumption
MY2011/12 mung bean consumption will likely decline to 296,000 tons, down approximately 3.0
percent from the previous year as food processing manufacturers were adversely affected by the
flooding in the last quarter of 2011. According to the National Food Institute’s estimate, food industry
affected by the flooding accounted for approximately 15.0 percent of total food manufacturers. In
addition, food processing manufacturers whose facilities were not located in the flooded areas had to
reduce their capacity utilization by 10-30 percent due to the shortage of raw material caused by
logistical difficulties.
MY 2012/13 mung bean consumption will likely recover in anticipation of growing domestic and export
demand, especially in the second half of 2012 when food processing manufacturers will fully recover.
Also, the food industry will continue to expand their production capacity to meet the growing demand
of diversified products such as vermicelli, bean flour, bean sprouts and cake, and various confectionary
items. However, the use of mung beans in the feed industry remains marginal as prices are much higher
than other grains.
4.3 Trade
MY2011/12 mung beans exports increased to 35,252 tons, up 42.5 percent from the previous year, due
to large exportable supplies resulting from a reduction in domestic consumption. In MY2012/13, mung
beans exports will likely drop to around 20,000 tons in anticipation of a growing domestic demand. The
increase in domestic consumption will also result in import demand, particularly from Burma and
Australia, of 19, 000 tons.
4.4 Policy
Mung bean is a minor crop without any government support. The crop is normally promoted by
government extensionists as a rotation crop to improve the soil quality, after the main-crop paddy has
been harvested. As for imports, the tariff rate on imported mung beans is 5.0 percent, except from
AFTA which is duty free.
End of Report
