thailand flood v1
TRANSCRIPT

Flooding in Thailand
Veerachai Tanpipat, D.Eng. ([email protected])
Surajate B. Aroonnet, PhD. ([email protected])
August 18 – 22, 2014 at Hoa Binh Hotel and NASATI head office, in
Hanoi, Vietnam
Cyberinfrastrucure and Water Resources in the Lower Mekong Region
Visualization and communications of derived knowledge to policy support at different levels

Table of Contents
•Flooding in Thailand
•Spatial Data for Control and Management
used in 2011 Flood
•Communication problems
•Post 2011 Flood Water Management Tools
Development
•APAN Network Utilization and Test Results
•Conclusions

Flooding in Thailand
Flood is an annual natural phenomenon in Thailand
especially the Central Thailand is on the flat terrain
(Chao Phraya River Basin).
The worst in the last 5 decades recently occurred in
the year 2011 (an estimated $46.5 billion in
economic loss was incurred, effected 6 million ha,
13 million people and almost 1,000 related deaths).
Source: Thailand Flood 2011; Rapid Assessment
for Resilient Recovery and Reconstruction
Planning, World Bank 2012
(www.worldbank.org/th)

Flooding in Thailand
Source: http://www.unigang.comArticle8795

Flooding in Thailand
Source: http://album.sanook.com/files/1837002

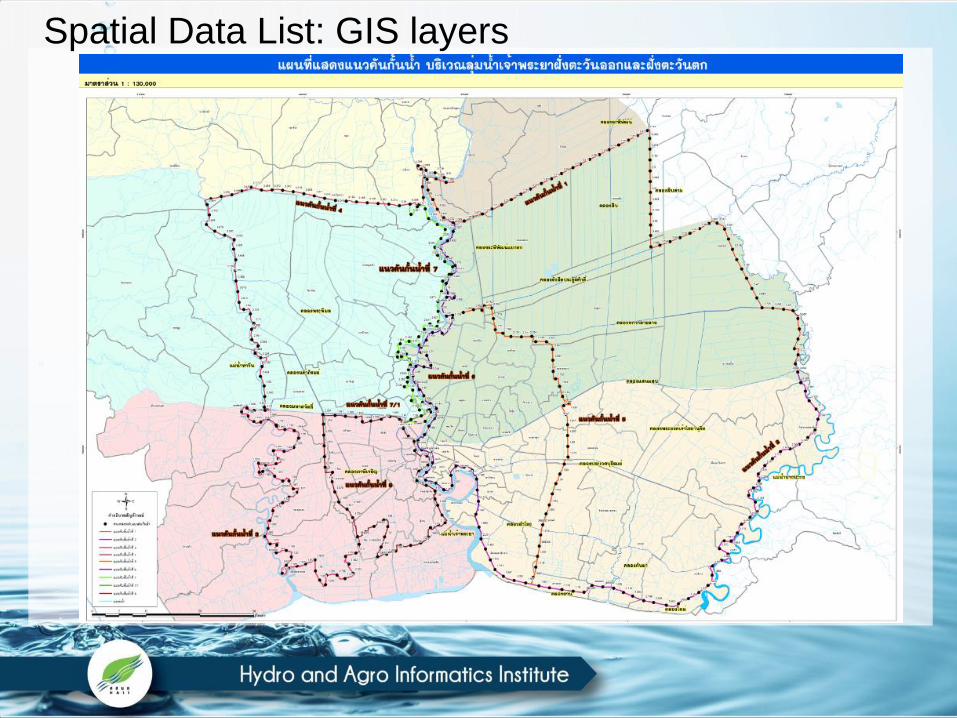
Spatial Data List: GIS layers
1. Flood maps
2. Flood Dikes
3. Locations of flood control gates
4. Information from Telemeters
5. Precipitation data from telemeters and Thai
Meteorological Department
6. Roads and water ways
7. Administration boundaries
8. Digital Elevation Model
Spatial Data for Control and Management used in
2011 Flood
7
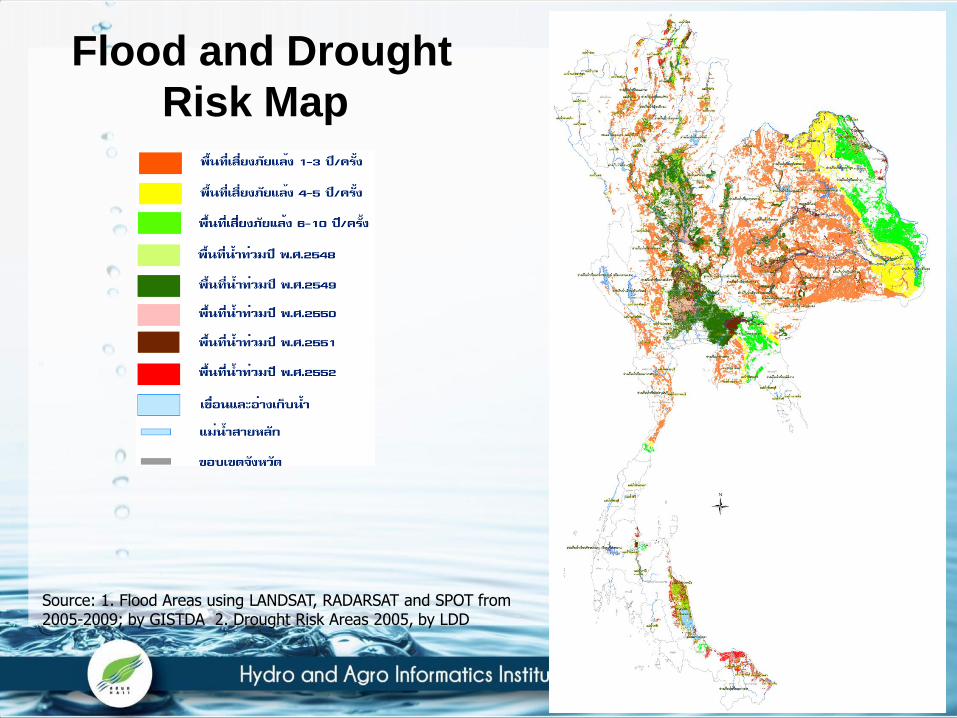
Flood and Drought
Risk Map
Source: 1. Flood Areas using LANDSAT, RADARSAT and SPOT from 2005-2009; by GISTDA 2. Drought Risk Areas 2005, by LDD

Spatial Data List: GIS layers

Spatial Data List: GIS layers

Spatial Data List: GIS layers
Phoompanich, S., GISTDA
Spatial Data List: GIS layers

Spatial Data List: GIS layers

Spatial Data List: Remote sensing images and
products
NASA LANCE/EOSDIS MODIS Rapid Response
Team
1. Terra/Aqua – MODIS images and Flood products
Sensorweb-NASA-JPL
1. Terra/Aqua- MODIS
2. Earth Observing One, Advance Land Imager (ALI)
3. WorldView-2
4. LANDSAT ETM+


Source: http://eo1.gsfc.nasa.gov/new/sensorWebExp/index.html
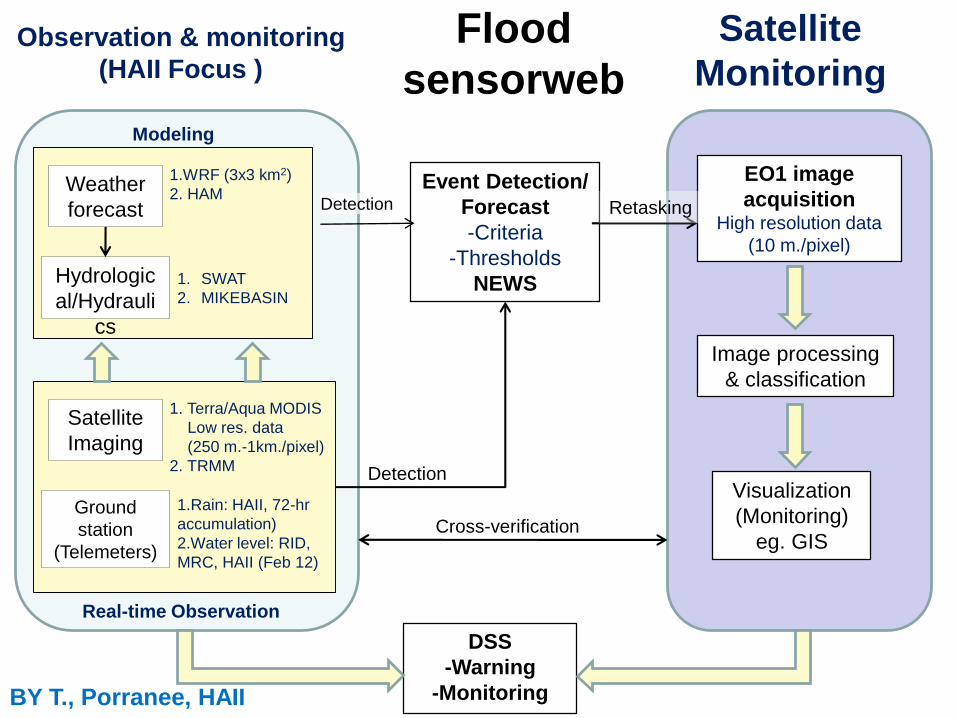
Flood
sensorweb
Real-time Observation
Event Detection/
Forecast
-Criteria
-Thresholds
NEWS
1. Terra/Aqua MODIS
Low res. data
(250 m.-1km./pixel)
2. TRMM
Satellite
Imaging
Ground
station
(Telemeters)
1.Rain: HAII, 72-hr
accumulation)
2.Water level: RID,
MRC, HAII (Feb 12)
DSS
-Warning
-Monitoring
EO1 image
acquisitionHigh resolution data
(10 m./pixel)
Retasking
Image processing
& classification
Visualization
(Monitoring)
eg. GIS
Modeling
1.WRF (3x3 km2)
2. HAMWeather
forecast
Hydrologic
al/Hydrauli
cs
1. SWAT
2. MIKEBASIN
Observation & monitoring
(HAII Focus )
Satellite
Monitoring
Detection
Detection
Cross-verification
BY T., Porranee, HAII
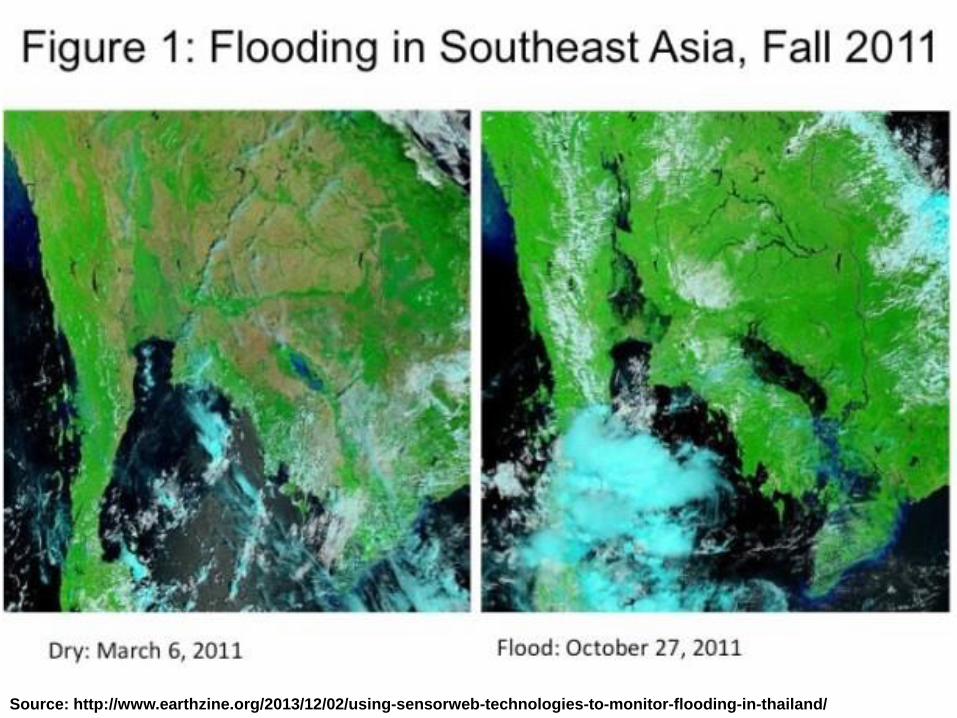
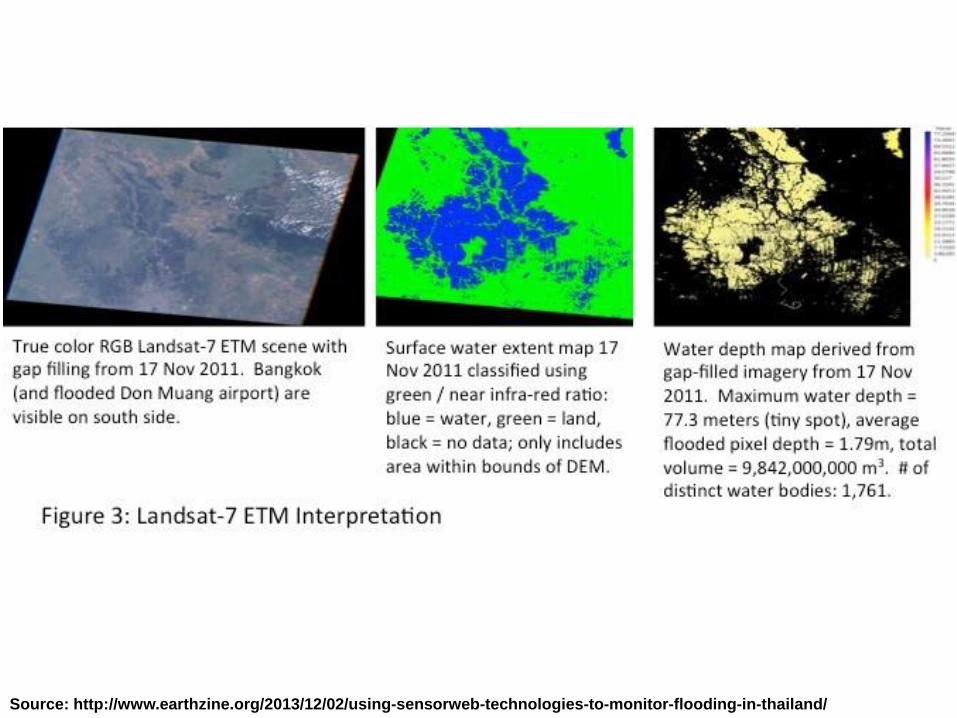
Source: http://www.earthzine.org/2013/12/02/using-sensorweb-technologies-to-monitor-flooding-in-thailand/

Locations
where
EO-1 were
triggered
for flood monitoring

Bang Pra Ma, Supanburi
Province, ALI quick look;
Acquired 14 Feb 2012 where water inundated still remained.
Email alert from ASE Operation at NASA JPL

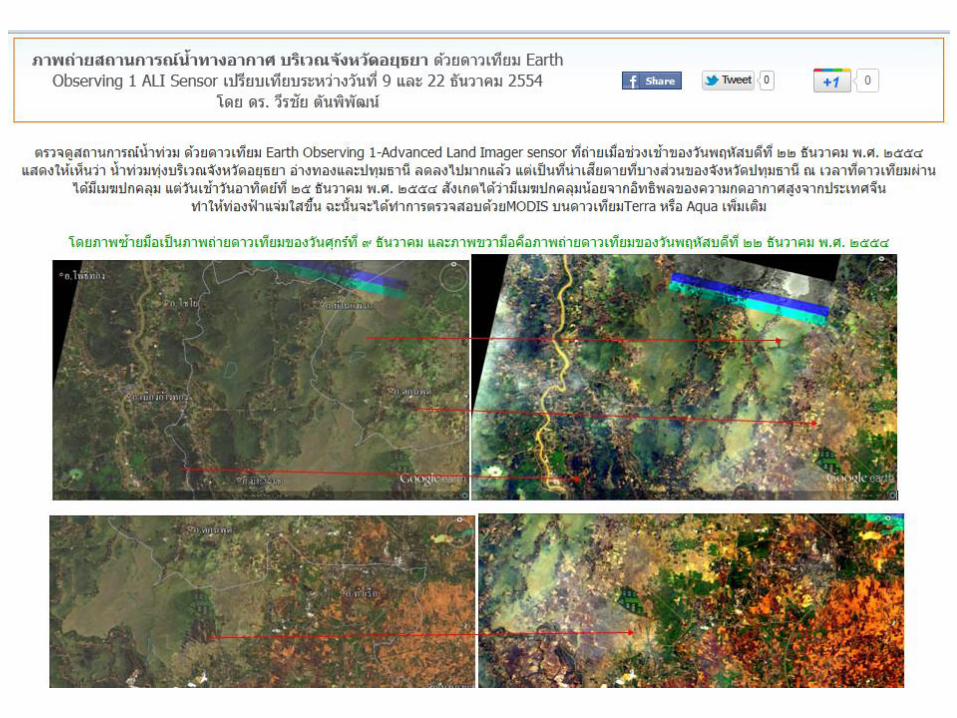
ALI, Ayutthaya 9 DEC 2012

8 DEC 20115 NOV 2011
EO-1-ALI
1 NOV 2011
29 OCT 2011
The Don Muang Airport (also
Don Mueang) started to flood
on October 25, 2011
Over 30 EO-1 acquisitions,
during the flood event.
18 NOV 2011

EO-1-ALI
29 OCT 2011
http://earthobservatory.nasa.gov/IOTD/view.php?id=76282


Source: http://www.earthzine.org/2013/12/02/using-sensorweb-technologies-to-monitor-flooding-in-thailand/
Source: http://www.earthzine.org/2013/12/02/using-sensorweb-technologies-to-monitor-flooding-in-thailand/

Source: http://www.earthzine.org/2013/12/02/using-sensorweb-technologies-to-monitor-flooding-in-thailand/
The field validation during
the flood 2011 event shown
that the water depth was not
correct. This error due to
the DEM’s dimension which
used to calculate was 5
meter resolution. From
validation result, we then
need to have a much better
DEM resolution in order to
get the correct water depth
calculation.

The "International
Symposium on
Artificial Intelligence,
Robotics and
Automation in Space
(i-SAIRAS)“ 2012,
ESA, 4-6 September 2012, Turin, Italy

Spatial Data List (Con’t) Remote sensing
GISTDA
1. THEOS (Thaichot)
2. RADARSAT
JAXA
1. PiSAR-L Arial images onboard airplane
HAII-ThaiFlood
1. Arial photographs from UAV
2. Digital Elevation Model (5 meter)
3. Model outputs
Google Earth as a reference!!!

Phoompanich, S., GISTDA


Sobue, S., JAXA

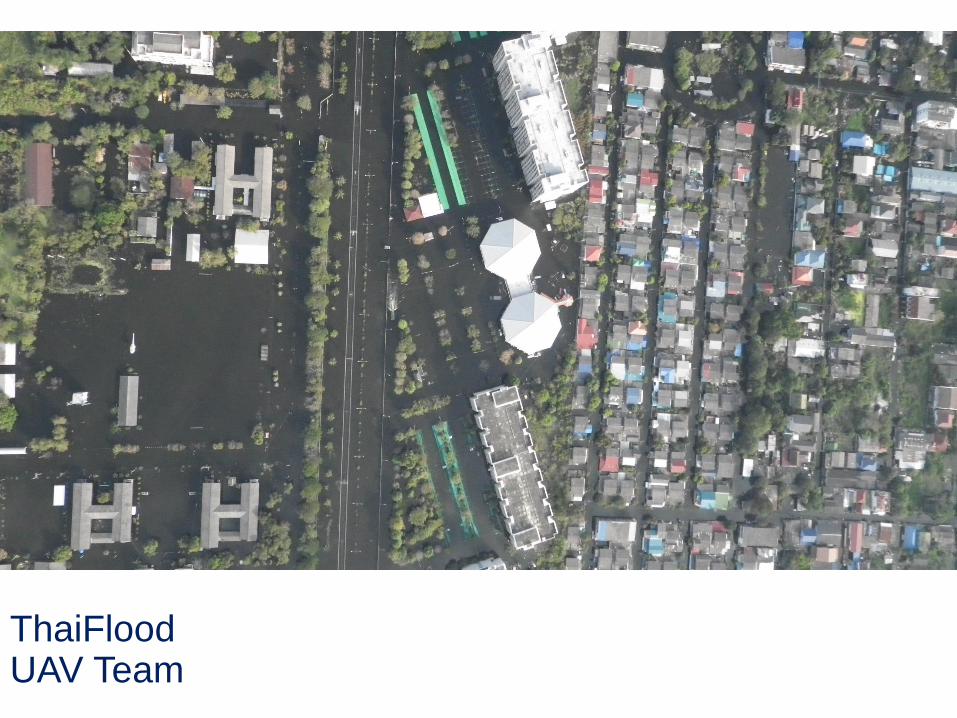
ThaiFloodUAV Team

ThaiFloodUAV Team

ThaiFloodUAV Team

ThaiFloodUAV Team

ThaiFloodUAV Team

ThaiFloodUAV Team

ThaiFloodUAV Team

ThaiFloodUAV Team

ThaiFloodUAV Team

ThaiFlood UAV Team

Big Bags
ThaiFloodUAV Team

Model Outputs from Mike 11, Mike Basin and Mike Flood

Spatial Data List (Con’t) Remote sensing
International Charter Space and Major Disasters
1. WorldView 1 and 2
2. IKONOS 1 and 2
3. GeoEye-1
4. TerraSAR-X
5. Disaster Monitoring Constellation (DMC), Survey
Satellite Technology Ltd. (SSTL)
6. Terra-ASTER
7. LANDSAT 5 ETM and LANDSAT 7 ETM+
8. SPOT-5
9. IRS-R2

http://www.disasterscharter.org/web/charter/activation_details?p_r_p_1415474252_assetId=ACT-376
WorldView 1

WorldView 2

IKONOS

IKONOS 2

http://www.disasterscharter.org/web/charter/activation_details?p_r_p_1415474252_assetId=ACT-376
IKONOS 2

http://www.disasterscharter.org/web/charter/activation_details?p_r_p_1415474252_assetId=ACT-376
GeoEye

http://www.disasterscharter.org/web/charter/activation_details?p_r_p_1415474252_assetId=ACT-376

http://www.disasterscharter.org/web/charter/activation_details?p_r_p_1415474252_assetId=ACT-376
IKONOS 2
DMC

http://www.disasterscharter.org/web/charter/activation_details?p_r_p_1415474252_assetId=ACT-376
ASTER

http://www.disasterscharter.org/web/charter/activation_details?p_r_p_1415474252_assetId=ACT-376
SPOT-5

http://www.disasterscharter.org/web/charter/activation_details?p_r_p_1415474252_assetId=ACT-376
IRS-R2

Communication Problems
• During the 2011 flood event regarding a lot in
coming information to decision makers the out
going messages to the public did not clear and
create a lot of confusion and misunderstanding
• Decision makers did not really understand the
information they get well enough
• Too many not correct official announcements
• The necessary information did not deliver to the
public well enough
• Later, even correct messages were sent to the
public, people started not to believe those
messages and warning anymore.

Post 2011 Flood Water Management Tools
Development
Monitoring and Warning
• Centralize related hydro and climate data so
Better user friendly of monitoring and warning
information web interface have been developed
and deployed.
• National HydroInformatics and Climate Data
Center

• Developing of Decision Support System
(DSS)
• Chao Phraya River Basin
• Chi and Mun River Basins
• Mobile applications have been developed and
deployed.
• Simple flood control management scheme.
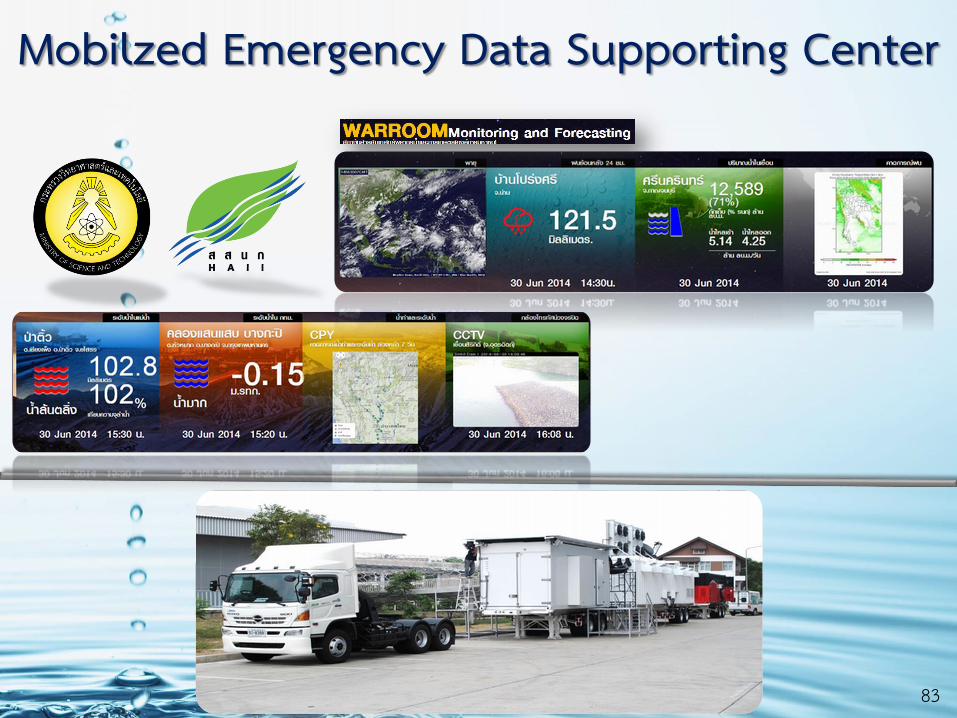
• Mobilized Emergency Data Supporting Center
• NOAA-NGDC Collaboration

National Hydroinformatics
and Climate Data Center
http://www.nhc.in.th/web/

Main Function of NHC
Forecasting and Warning System
• สภาพอากาศระยะ สั้น-กลาง-ยาว• สมดุลน้้า ความเสี่ยงน้้าท่วม-น้้าแล้ง• บริหารโครงสร้าง/เขื่อน/ฝาย/ปตร./สูบ
Development
and
Adaptation
Crisis
Managemen
t
Forecast for Water
Management
Normal
Management
Short, Medium and Long range Weather
Forecast
Water Balance: Chance for Flood and
Drought
Structure/Dam/Dyke/Weir/Watergate/
Pump Management
4
3
National
Hydroinformati
cs and Climate
Data Center
(NHC)
Monitoring
Water and flood
situation
21

National Hydroinformatics and Climate Data Center
Rainfalls, Strom
and dam inflow
Warning System
Report System
Map
Data Center
High Performance
Computers
Related Agencies
Table / ChartCCTVCollaboration
Research
Mobile Center (Mirror Site)
Modeling
UAV
Social Sensors
National Disaster Warning Center
Equipment
GIN/MOI-Net
Network
Meteorology Hydrology
Utility
SystemGeography
Economy
SocietyStatistic
Data
Data
Linkage
System
Telemeterin
g
63
Internet
Mirror Site
Internet GIS System
Autonomous
RobotBoat
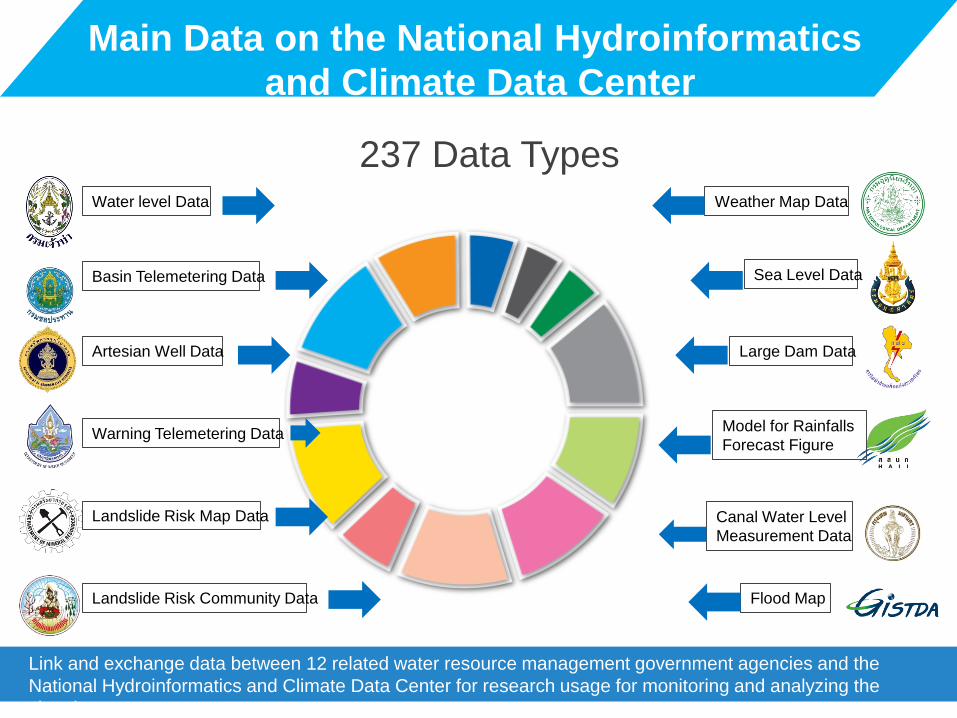
Main Data on the National Hydroinformatics
and Climate Data Center
Link and exchange data between 12 related water resource management government agencies and the
National Hydroinformatics and Climate Data Center for research usage for monitoring and analyzing the
situation.
237 Data TypesWater level Data
Basin Telemetering Data
Artesian Well Data
Warning Telemetering Data
Landslide Risk Map Data
Landslide Risk Community Data
Weather Map Data
Sea Level Data
Large Dam Data
Model for Rainfalls
Forecast Figure
Canal Water Level
Measurement Data
Flood Map

Telemetering
Autonomous Robot Boat
CCTV
UAV
Mobile Vehicle
IMU
Data from monitoring situation equipment
http://www.haii.or.th/
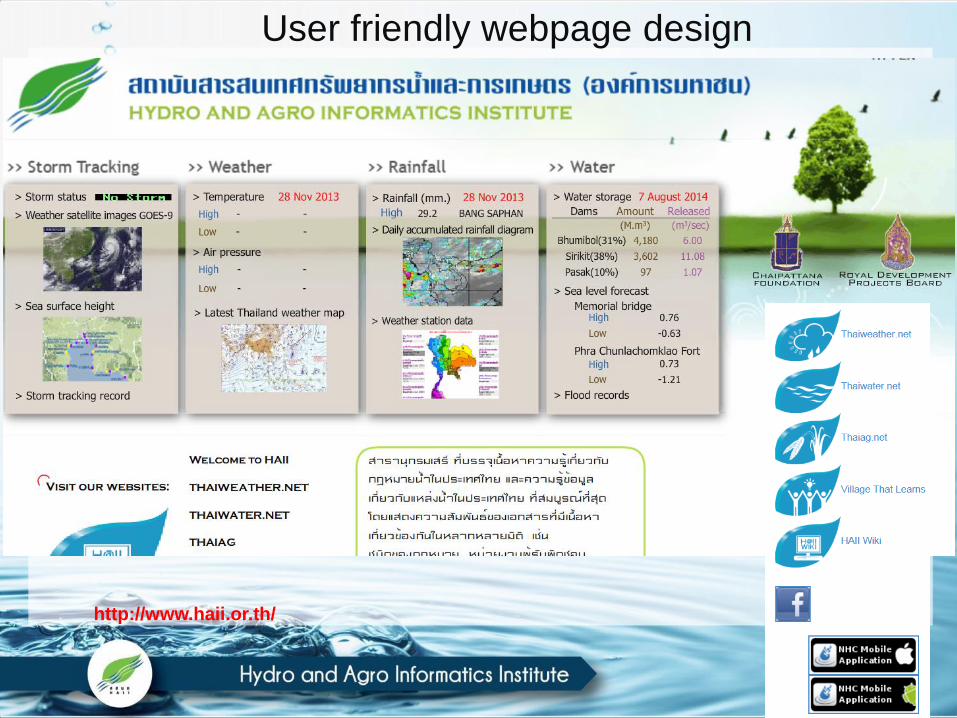
User friendly webpage design

http://www.thaiwater.net/web/
User friendly webpage design

www.thaiwater.net:Thailand's Wind and Precipitation Forecast (WRF)
68

69
Precipitation Comparison in Thailand

National Hydroinformatics and Climate Data Center
• Storm direction• Rainfall information• Sea surface height/temperature• Water diagram• Dam water level• Water model and warning system in
flood and drought for water management
Automatic real-time data:
• Solar intensity
• Temperature
• Humidity
• Air pressure
• Rainfall
• Water level
Thailand's Wind and Precipitation
Forecast (WRF)
Use a high resolutions topography
Deploy fine computational grid 3x3 km (3 nested domains)
Run twice a day – 7-day forecasts (9x9 km)
Use NCEP’s Global Forecast System (GFS) inputs
Verify with Local weather stations

National Hydroinformatics and Climate Data Center

National Hydroinformatics and Climate Data Center

http://nhc.haii.or.th/databank/index.php?model=warroom
User friendly webpage design
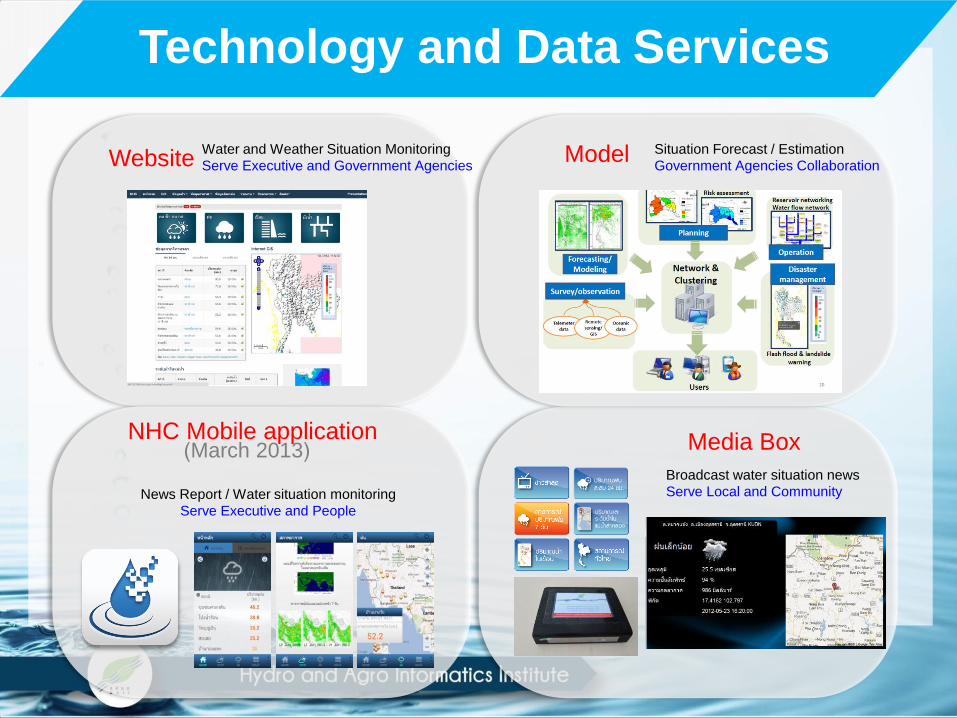
Technology and Data Services
Website Model
NHC Mobile application (March 2013)
News Report / Water situation monitoring
Serve Executive and People
Broadcast water situation news
Serve Local and Community
Water and Weather Situation Monitoring
Serve Executive and Government Agencies
Situation Forecast / Estimation
Government Agencies Collaboration
Media Box

7575
Decision support system (DSS)
National Hydroinformatics Data Center
Multiple Data Sources
GIS Water user
Base Data
WRF
Forecast DataReal-time Data
Rainfall Discharge Water level Reservoir
Data Management
Flood Forecasting
System
Analysis
Output
Real-time Data Flood Forecast Water Balance Flood Management
Multi-user Interfaces
DSS
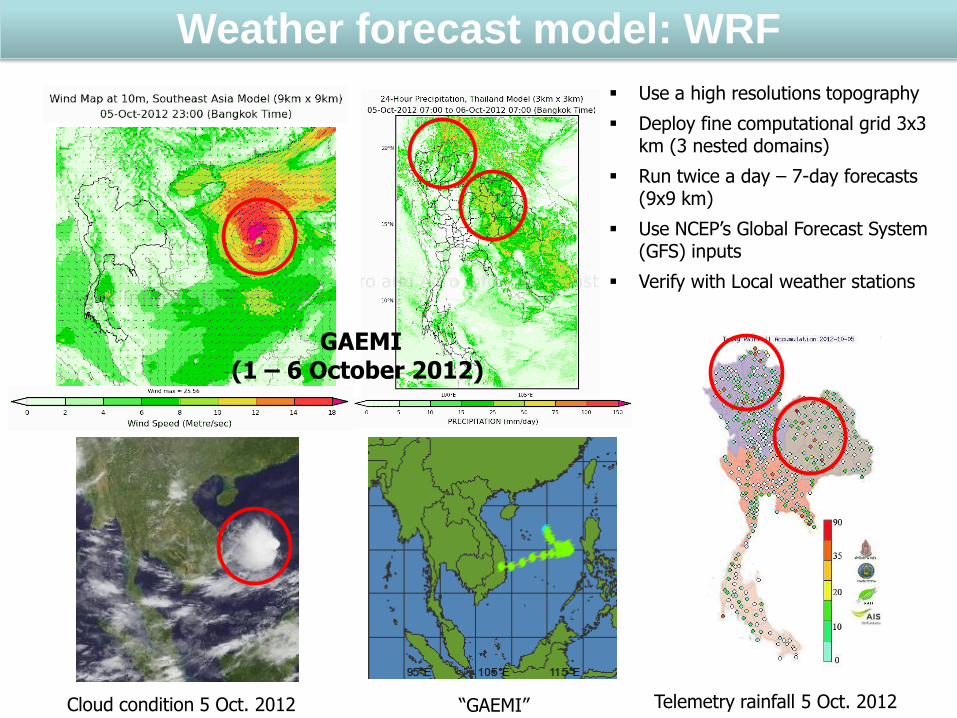
“GAEMI”
GAEMI(1 – 6 October 2012)
Cloud condition 5 Oct. 2012 Telemetry rainfall 5 Oct. 2012
Weather forecast model: WRF
Use a high resolutions topography
Deploy fine computational grid 3x3 km (3 nested domains)
Run twice a day – 7-day forecasts (9x9 km)
Use NCEP’s Global Forecast System (GFS) inputs
Verify with Local weather stations
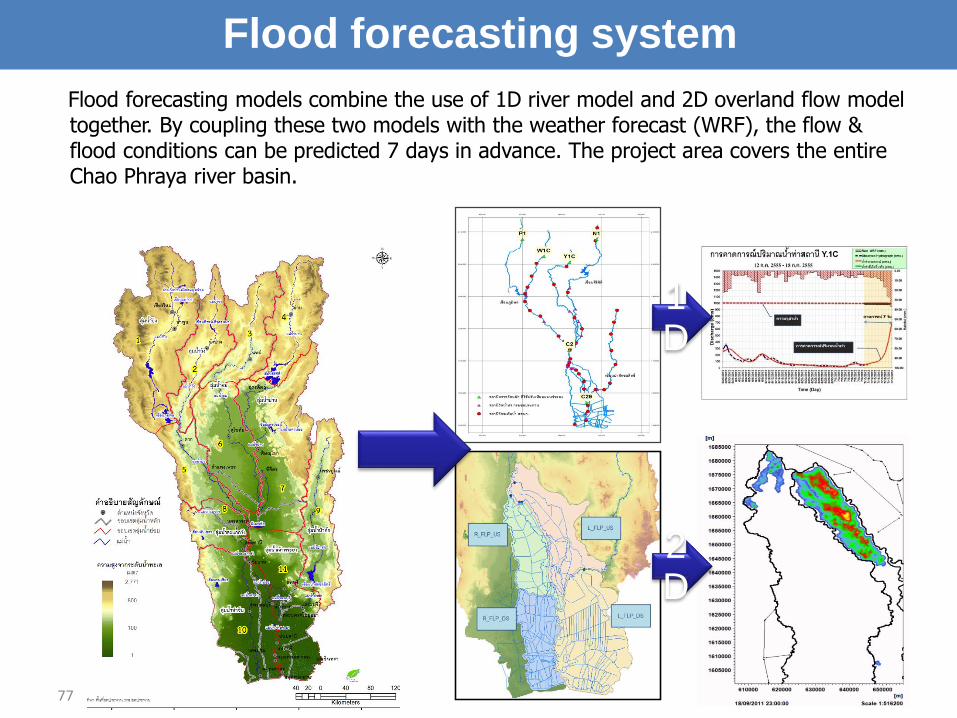
Flood forecasting models combine the use of 1D river model and 2D overland flow model together. By coupling these two models with the weather forecast (WRF), the flow & flood conditions can be predicted 7 days in advance. The project area covers the entire Chao Phraya river basin.
77
Flood forecasting system
77
1D
2D

Real time monitoring system
Real-time mode Scenario mode
• Direct data connection
• Flexible data presentation
• Overview of water situation
• Support decision making
• Support scenario design in real time mode
• Fast and easy
• Risk analysis and possible flood impact
• Scenario of control structures eg. reservoirs

Scenario mode
Rainfall
forecast
model
Flood probability
Forecastedrainfall
NAM/MIKE11
WRF
Earl
y w
arn
ing
Real timeflood forecasting
De
cisi
on
mak
ing
Accurateflood information
Bet
ter
and
ear
lier
de
cisi
on
s
Forecasted discharge/water level
Imp
act
asse
ssm
en
ts
Act
ion
s/R
ep
on
ses
Decision support
GFS
Possible flood impact analysis

80
DSS for Chao Phraya River Basin

81
DSS for Chi and Mun River Basins

Water Management and the National Flood
Problem Solution
Warning Announcement
Monitor and inform the disaster
information
National Hydroinformatics and Climate Data Center
NHC
83
Mobilzed Emergency Data Supporting Center
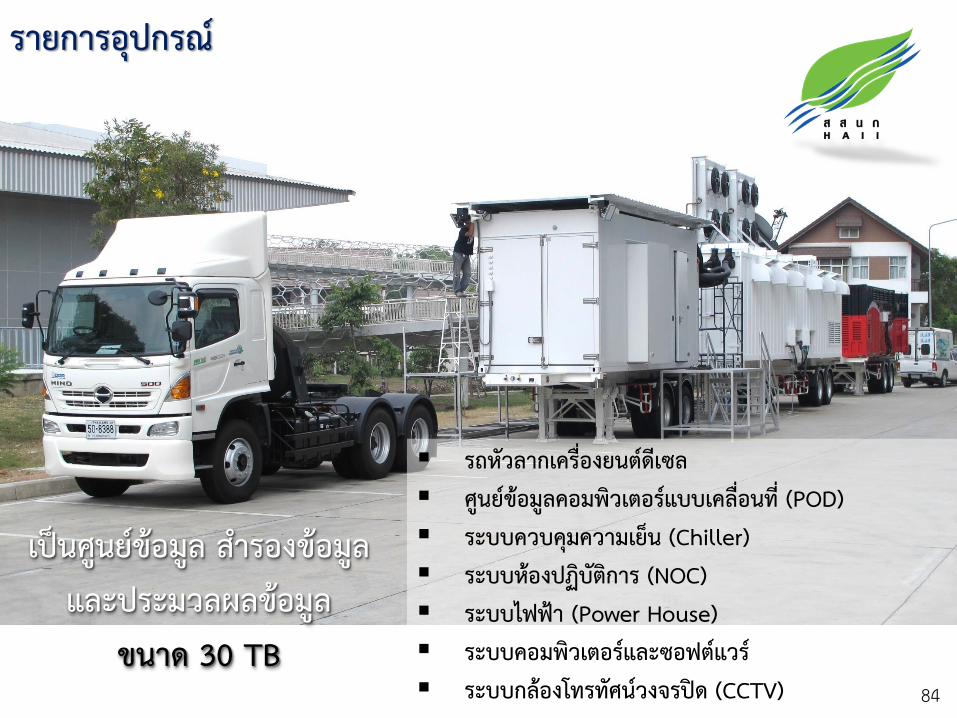
รถหัวลากเครื่องยนต์ดีเซล ศูนย์ข้อมูลคอมพิวเตอร์แบบเคลื่อนที่ (POD) ระบบควบคมุความเย็น (Chiller) ระบบห้องปฏิบัติการ (NOC) ระบบไฟฟ้า (Power House) ระบบคอมพิวเตอร์และซอฟต์แวร์ ระบบกล้องโทรทัศน์วงจรปิด (CCTV)
รายการอุปกรณ์
84
เป็นศูนย์ข้อมูล ส้ารองข้อมูล และประมวลผลข้อมูล
ขนาด 30 TB

ศูนย์ข้อมูลคอมพิวเตอร์แบบเคลื่อนที่ในรูปแบบตู้เหล็ก (POD)
เป็นศูนย์ข้อมูลคอมพิวเตอร์ ขนาด 20 ฟุต ติดตั้งตู้ Rack 10 ตู้ พร้อมระบบคอมพิวเตอร์และอุปกรณ์ของโครงการ ทีเ่ชื่อมต่อกับระบบคอมพิวเตอร์แม่ข่ายของ สสนก. ซึ่งสามารถบริหารจัดการและดูแลระบบคอมพิวเตอร์ได้โดยไม่ต้องมีเจ้าหน้าที่ประจ้าการตลอดเวลาพร้อมด้วยระบบปรับอากาศ ระบบดับเพลิง ระบบรักษาความปลอดภัย และกล้องโทรทัศน์วงจรปิด 85

ระบบควบคุมความเย็น (Chiller) : ขนาดความเย็น 80 kW จ้านวน 2 ชุด เพื่อเป็นระบบท้าความเย็นให้กับศูนย์ฯ (POD)ระบบห้องปฏิบัติการ (NOC) : ห้องปฏิบัติการส้าหรับเจ้าหน้าที่ ดูแลระบบ จ้านวน 3 คน
ระบบสนับสนุนการท้างานของศูนย์ข้อมูลคอมพิวเตอร์แบบเคลื่อนที่
86

ระบบผลิตกระแสไฟฟ้าส้าหรับศูนย์ข้อมูลเคลื่อนที่ (Power House)
ส้าหรับผลิตกระแสไฟฟ้าเพื่อจ่ายให้กับศูนย์ข้อมูลฯ โดยใช้เทคโนโลยี Flywheel พร้อมเครื่องก้าเนิดไฟฟ้าขนาด 320 kWสามารถผลิตกระแสไฟฟ้าจากเครื่องก้าเนิดไฟฟ้าได้ต่อเนื่องนาน 8 ชั่วโมง 87

88
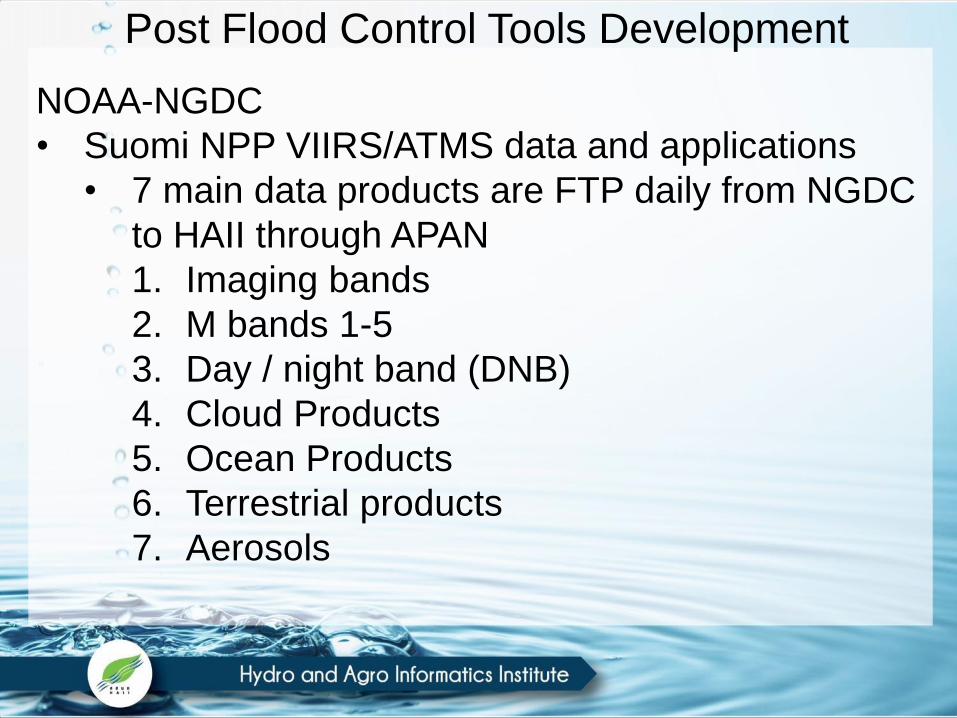
NOAA-NGDC
• Suomi NPP VIIRS/ATMS data and applications
• 7 main data products are FTP daily from NGDC
to HAII through APAN
1. Imaging bands
2. M bands 1-5
3. Day / night band (DNB)
4. Cloud Products
5. Ocean Products
6. Terrestrial products
7. Aerosols
Post Flood Control Tools Development

NOAA-NGDC-Suomi NPP-VIIRS/ATMS

NOAA-NGDC-Suomi NPP-VIIRS/ATMS
Interactive
Map System
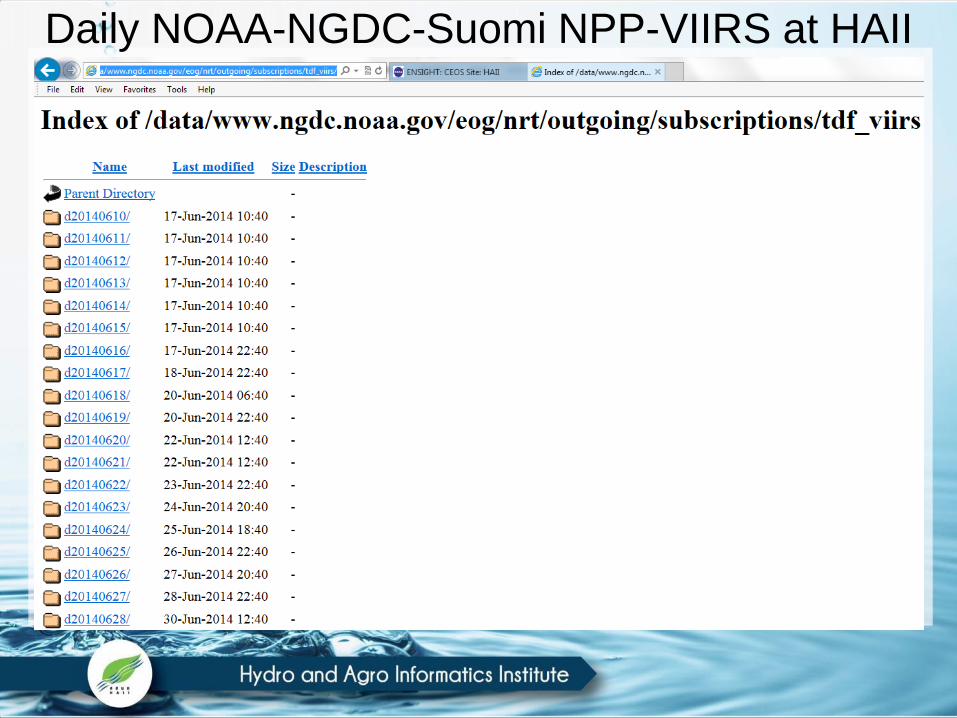
Daily NOAA-NGDC-Suomi NPP-VIIRS at HAII

Daily NOAA-NGDC-Suomi NPP-VIIRS at HAII

18 Gb of Data have been downloading
through APAN everyday and increasing.
From:
1. ftpprd.ncep.noaa.gov 6.7 Gb
2. rda.ucar.edu 4.4 Gb
3. ftp.hycom.org 2.0 Gb
4. www.ngdc.noaa.gov 4.9 Gb
APAN Network Utilization and Test Results
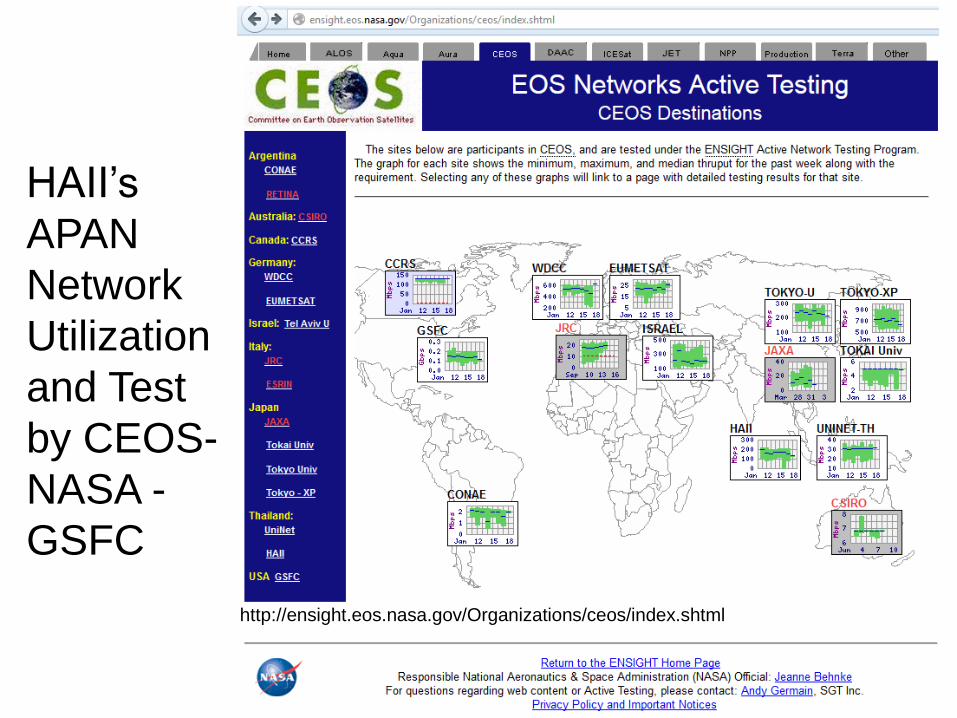
http://ensight.eos.nasa.gov/Organizations/ceos/index.shtml
HAII’s
APAN
Network
Utilization
and Test
by CEOS-
NASA -
GSFC

APAN Network Utilization and Test

APAN Network Utilization and Test

APAN Network Utilization and Test

APAN Network Utilization and Test

Conclusions• Variety of spatial data and information have
been utilized for flooding management in
Thailand.
• Previous management could not put rich
information in a good appropriate practical
usage.
• Development of user friendly web interface
and tools for water control have been
developed.
• Establishment of National HydroInfomatics
and Climate Data Center

Conclusions
• Establishment of Climate Change
Understanding and Adaptation Technology
Center
• Establishment of Mobilized Emergency Data
Supporting Center
• Utilization of APAN’s bandwidth dramatically
increases and need stable routing in Japan’s
hub to the USA and others.
• Increasing International collaborations.

Thank you very much for your
attention.
Questions??