thailand capital markets - data.bloomberglp.com · bloomberg preliminary thailand capital markets |...
TRANSCRIPT
THAILANDCAPITALMARKETSLEAGUE TABLESQ1 2019 PreliminaryAs of 22 March 2019
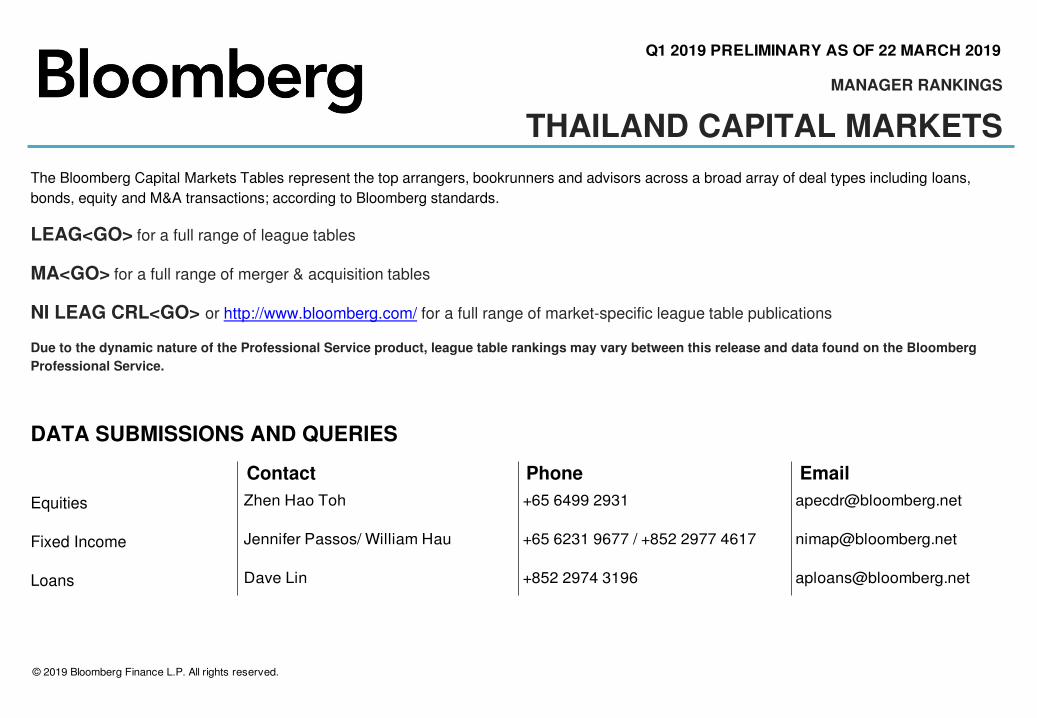
The Bloomberg Capital Markets Tables represent the top arrangers, bookrunners and advisors across a broad array of deal types including loans, bonds, equity and M&A transactions; according to Bloomberg standards.
LEAG<GO> for a full range of league tables
MA<GO> for a full range of merger & acquisition tables
NI LEAG CRL<GO> or http://www.bloomberg.com/ for a full range of market-specific league table publications
Due to the dynamic nature of the Professional Service product, league table rankings may vary between this release and data found on the Bloomberg Professional Service.
MANAGER RANKINGS
THAILAND CAPITAL MARKETS
DATA SUBMISSIONS AND QUERIES
Equities
Fixed Income
Loans
Contact EmailPhone
Q1 2019 PRELIMINARY AS OF 22 MARCH 2019
© 2019 Bloomberg Finance L.P. All rights reserved.
Zhen Hao Toh
Jennifer Passos/ William Hau
Dave Lin
+65 6499 2931
+65 6231 9677 / +852 2977 4617
+852 2974 3196
Bloomberg PreliminaryThailandCapitalMarkets|Q12019
BloombergLeagueTableReports Page1
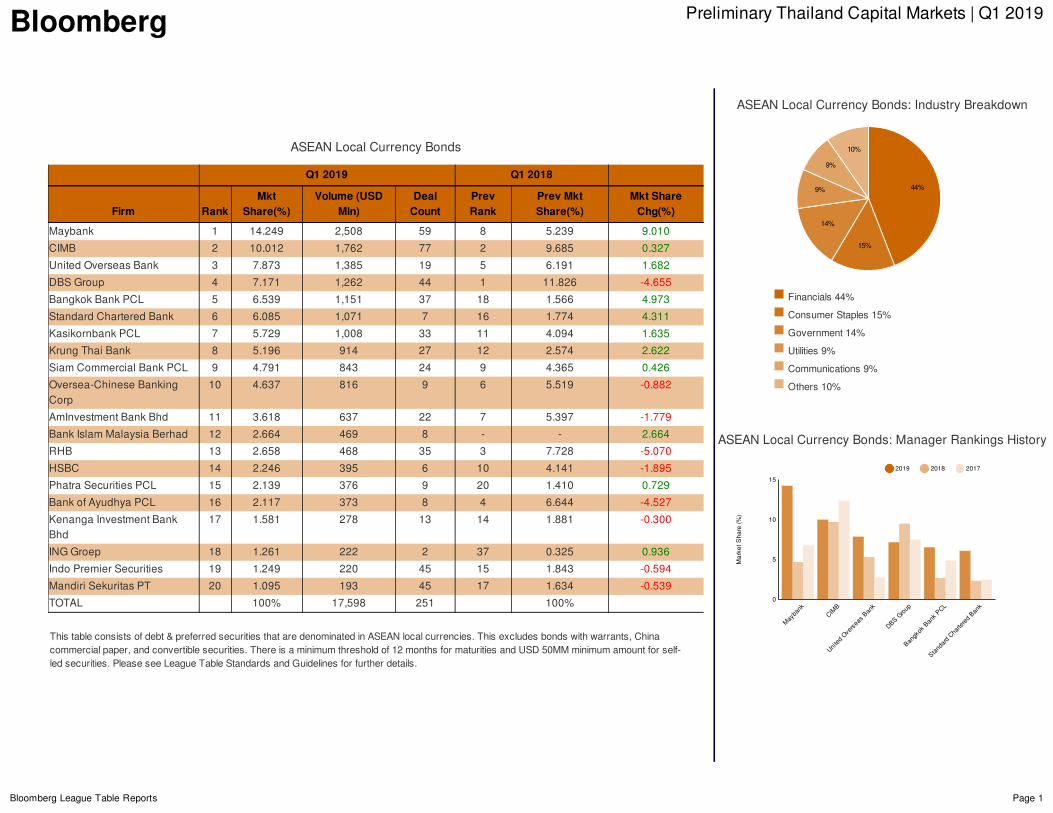
ASEANLocalCurrencyBonds
Q12019 Q12018
Firm RankMkt
Share(%)Volume(USD
Mln)DealCount
PrevRank
PrevMktShare(%)
MktShareChg(%)
Maybank 1 14.249 2,508 59 8 5.239 9.010
CIMB 2 10.012 1,762 77 2 9.685 0.327
UnitedOverseasBank 3 7.873 1,385 19 5 6.191 1.682
DBSGroup 4 7.171 1,262 44 1 11.826 -4.655
BangkokBankPCL 5 6.539 1,151 37 18 1.566 4.973
StandardCharteredBank 6 6.085 1,071 7 16 1.774 4.311
KasikornbankPCL 7 5.729 1,008 33 11 4.094 1.635
KrungThaiBank 8 5.196 914 27 12 2.574 2.622
SiamCommercialBankPCL 9 4.791 843 24 9 4.365 0.426
Oversea-ChineseBankingCorp
10 4.637 816 9 6 5.519 -0.882
AmInvestmentBankBhd 11 3.618 637 22 7 5.397 -1.779
BankIslamMalaysiaBerhad 12 2.664 469 8 - - 2.664
RHB 13 2.658 468 35 3 7.728 -5.070
HSBC 14 2.246 395 6 10 4.141 -1.895
PhatraSecuritiesPCL 15 2.139 376 9 20 1.410 0.729
BankofAyudhyaPCL 16 2.117 373 8 4 6.644 -4.527
KenangaInvestmentBankBhd
17 1.581 278 13 14 1.881 -0.300
INGGroep 18 1.261 222 2 37 0.325 0.936
IndoPremierSecurities 19 1.249 220 45 15 1.843 -0.594
MandiriSekuritasPT 20 1.095 193 45 17 1.634 -0.539
TOTAL 100% 17,598 251 100%
Thistableconsistsofdebt&preferredsecuritiesthataredenominatedinASEANlocalcurrencies.Thisexcludesbondswithwarrants,Chinacommercialpaper,andconvertiblesecurities.Thereisaminimumthresholdof12monthsformaturitiesandUSD50MMminimumamountforself-ledsecurities.PleaseseeLeagueTableStandardsandGuidelinesforfurtherdetails.
Financials44%
ConsumerStaples15%
Government14%
Utilities9%
Communications9%
Others10%
ASEANLocalCurrencyBonds:ManagerRankingsHistory
ASEANLocalCurrencyBonds:IndustryBreakdown
44%
15%
14%
9%
9%
10%
Maybank
CIMB
UnitedOverseasBank
DBSGroup
BangkokBankPCL
StandardCharteredBank
5
10
MarketShare(%)
0
15
2019 2018 2017
Bloomberg PreliminaryThailandCapitalMarkets|Q12019
BloombergLeagueTableReports Page2
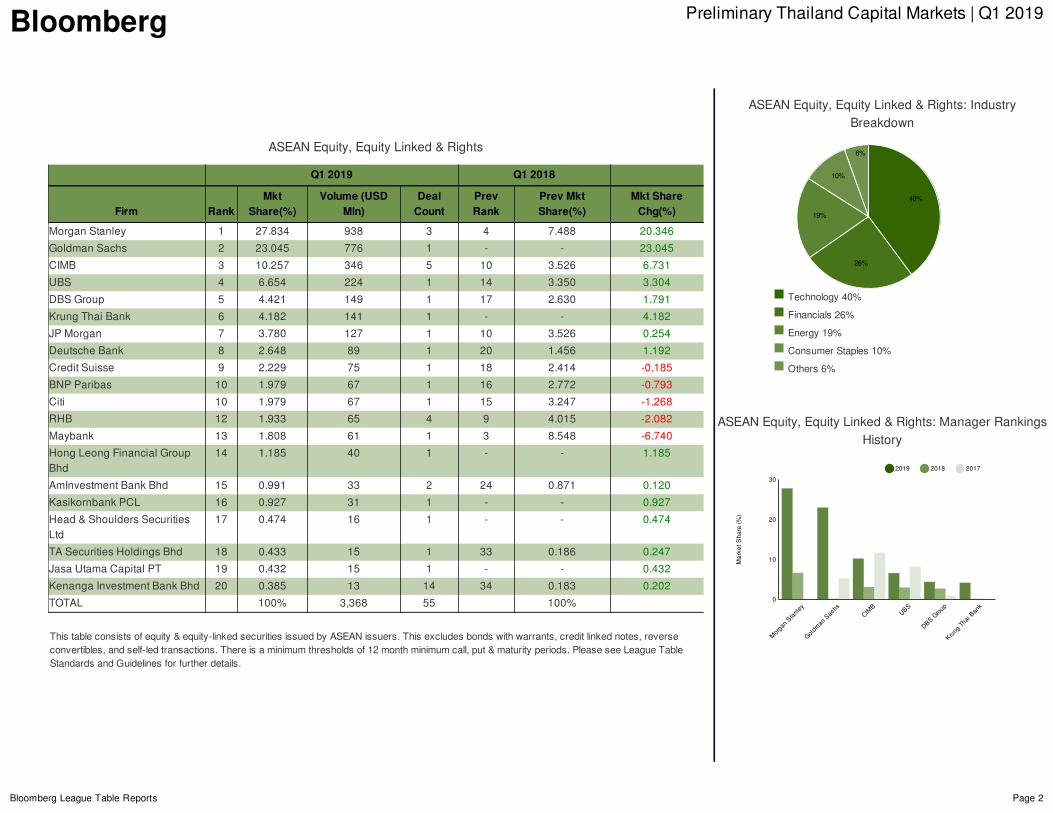
ASEANEquity,EquityLinked&Rights
Q12019 Q12018
Firm RankMkt
Share(%)Volume(USD
Mln)DealCount
PrevRank
PrevMktShare(%)
MktShareChg(%)
MorganStanley 1 27.834 938 3 4 7.488 20.346
GoldmanSachs 2 23.045 776 1 - - 23.045
CIMB 3 10.257 346 5 10 3.526 6.731
UBS 4 6.654 224 1 14 3.350 3.304
DBSGroup 5 4.421 149 1 17 2.630 1.791
KrungThaiBank 6 4.182 141 1 - - 4.182
JPMorgan 7 3.780 127 1 10 3.526 0.254
DeutscheBank 8 2.648 89 1 20 1.456 1.192
CreditSuisse 9 2.229 75 1 18 2.414 -0.185
BNPParibas 10 1.979 67 1 16 2.772 -0.793
Citi 10 1.979 67 1 15 3.247 -1.268
RHB 12 1.933 65 4 9 4.015 -2.082
Maybank 13 1.808 61 1 3 8.548 -6.740
HongLeongFinancialGroupBhd
14 1.185 40 1 - - 1.185
AmInvestmentBankBhd 15 0.991 33 2 24 0.871 0.120
KasikornbankPCL 16 0.927 31 1 - - 0.927
Head&ShouldersSecuritiesLtd
17 0.474 16 1 - - 0.474
TASecuritiesHoldingsBhd 18 0.433 15 1 33 0.186 0.247
JasaUtamaCapitalPT 19 0.432 15 1 - - 0.432
KenangaInvestmentBankBhd 20 0.385 13 14 34 0.183 0.202
TOTAL 100% 3,368 55 100%
Thistableconsistsofequity&equity-linkedsecuritiesissuedbyASEANissuers.Thisexcludesbondswithwarrants,creditlinkednotes,reverseconvertibles,andself-ledtransactions.Thereisaminimumthresholdsof12monthminimumcall,put&maturityperiods.PleaseseeLeagueTableStandardsandGuidelinesforfurtherdetails.
Technology40%
Financials26%
Energy19%
ConsumerStaples10%
Others6%
ASEANEquity,EquityLinked&Rights:ManagerRankingsHistory
ASEANEquity,EquityLinked&Rights:IndustryBreakdown
40%
26%
19%
10%
6%
MorganStanley
GoldmanSachs
CIMB UB
S
DBSGroup
KrungThaiBank
10
20
MarketShare(%)
0
30
2019 2018 2017
Bloomberg PreliminaryThailandCapitalMarkets|Q12019
BloombergLeagueTableReports Page3
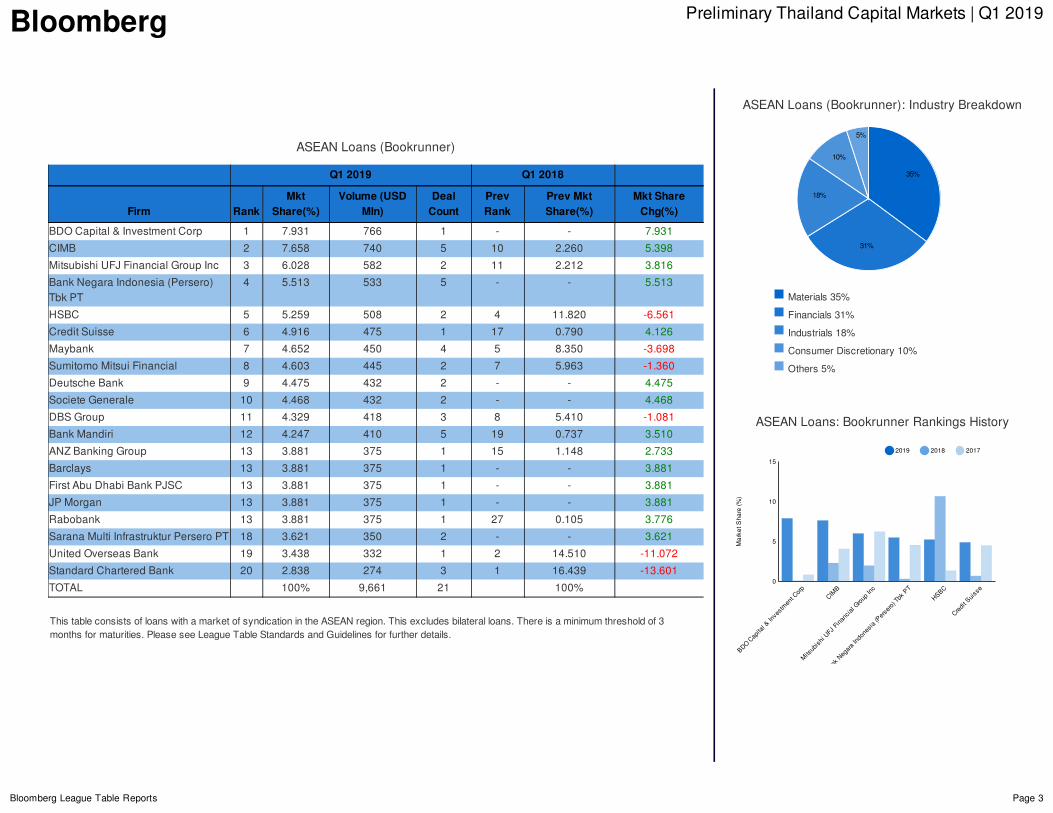
ASEANLoans(Bookrunner)
Q12019 Q12018
Firm RankMkt
Share(%)Volume(USD
Mln)DealCount
PrevRank
PrevMktShare(%)
MktShareChg(%)
BDOCapital&InvestmentCorp 1 7.931 766 1 - - 7.931
CIMB 2 7.658 740 5 10 2.260 5.398
MitsubishiUFJFinancialGroupInc 3 6.028 582 2 11 2.212 3.816
BankNegaraIndonesia(Persero)TbkPT
4 5.513 533 5 - - 5.513
HSBC 5 5.259 508 2 4 11.820 -6.561
CreditSuisse 6 4.916 475 1 17 0.790 4.126
Maybank 7 4.652 450 4 5 8.350 -3.698
SumitomoMitsuiFinancial 8 4.603 445 2 7 5.963 -1.360
DeutscheBank 9 4.475 432 2 - - 4.475
SocieteGenerale 10 4.468 432 2 - - 4.468
DBSGroup 11 4.329 418 3 8 5.410 -1.081
BankMandiri 12 4.247 410 5 19 0.737 3.510
ANZBankingGroup 13 3.881 375 1 15 1.148 2.733
Barclays 13 3.881 375 1 - - 3.881
FirstAbuDhabiBankPJSC 13 3.881 375 1 - - 3.881
JPMorgan 13 3.881 375 1 - - 3.881
Rabobank 13 3.881 375 1 27 0.105 3.776
SaranaMultiInfrastrukturPerseroPT 18 3.621 350 2 - - 3.621
UnitedOverseasBank 19 3.438 332 1 2 14.510 -11.072
StandardCharteredBank 20 2.838 274 3 1 16.439 -13.601
TOTAL 100% 9,661 21 100%
ThistableconsistsofloanswithamarketofsyndicationintheASEANregion.Thisexcludesbilateralloans.Thereisaminimumthresholdof3monthsformaturities.PleaseseeLeagueTableStandardsandGuidelinesforfurtherdetails.
Materials35%
Financials31%
Industrials18%
ConsumerDiscretionary10%
Others5%
ASEANLoans:BookrunnerRankingsHistory
ASEANLoans(Bookrunner):IndustryBreakdown
35%
31%
18%
10%
5%
BDOCapital&InvestmentCorp
CIMB
MitsubishiUFJFinancialGroupInc
BankNegaraIndonesia(Persero)TbkPT
HSBC
CreditSuisse
5
10
MarketShare(%)
0
15
2019 2018 2017
Bloomberg PreliminaryThailandCapitalMarkets|Q12019
BloombergLeagueTableReports Page4
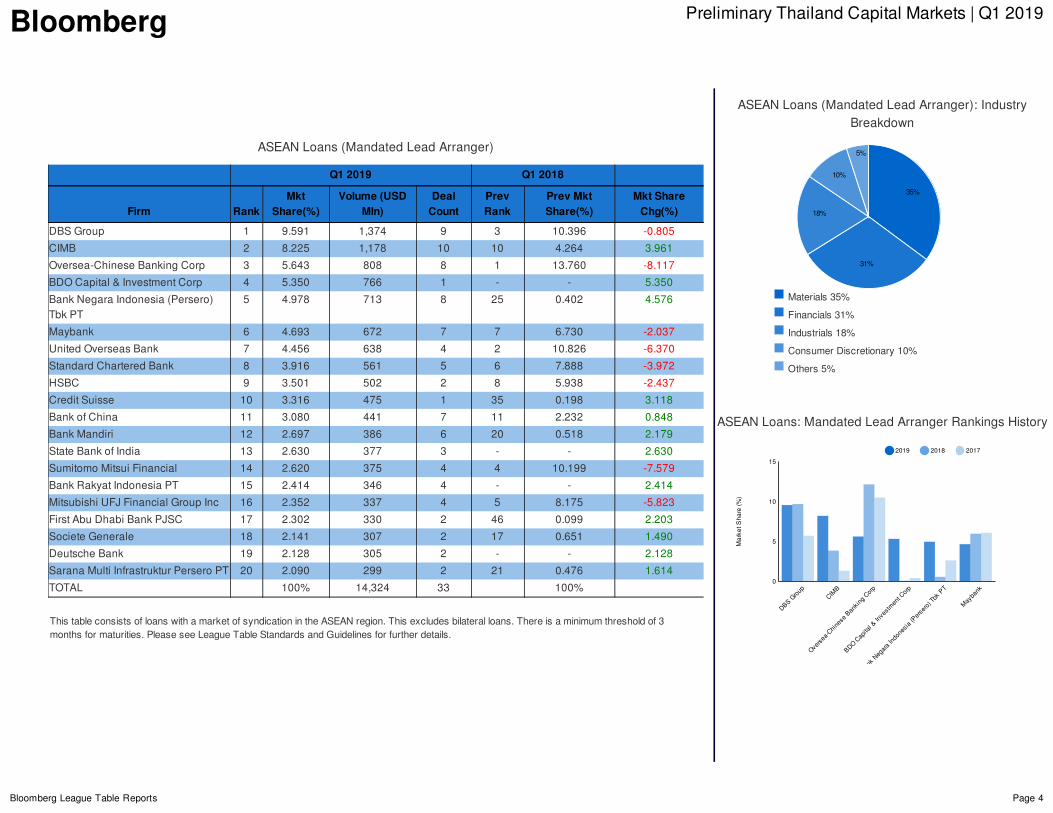
ASEANLoans(MandatedLeadArranger)
Q12019 Q12018
Firm RankMkt
Share(%)Volume(USD
Mln)DealCount
PrevRank
PrevMktShare(%)
MktShareChg(%)
DBSGroup 1 9.591 1,374 9 3 10.396 -0.805
CIMB 2 8.225 1,178 10 10 4.264 3.961
Oversea-ChineseBankingCorp 3 5.643 808 8 1 13.760 -8.117
BDOCapital&InvestmentCorp 4 5.350 766 1 - - 5.350
BankNegaraIndonesia(Persero)TbkPT
5 4.978 713 8 25 0.402 4.576
Maybank 6 4.693 672 7 7 6.730 -2.037
UnitedOverseasBank 7 4.456 638 4 2 10.826 -6.370
StandardCharteredBank 8 3.916 561 5 6 7.888 -3.972
HSBC 9 3.501 502 2 8 5.938 -2.437
CreditSuisse 10 3.316 475 1 35 0.198 3.118
BankofChina 11 3.080 441 7 11 2.232 0.848
BankMandiri 12 2.697 386 6 20 0.518 2.179
StateBankofIndia 13 2.630 377 3 - - 2.630
SumitomoMitsuiFinancial 14 2.620 375 4 4 10.199 -7.579
BankRakyatIndonesiaPT 15 2.414 346 4 - - 2.414
MitsubishiUFJFinancialGroupInc 16 2.352 337 4 5 8.175 -5.823
FirstAbuDhabiBankPJSC 17 2.302 330 2 46 0.099 2.203
SocieteGenerale 18 2.141 307 2 17 0.651 1.490
DeutscheBank 19 2.128 305 2 - - 2.128
SaranaMultiInfrastrukturPerseroPT 20 2.090 299 2 21 0.476 1.614
TOTAL 100% 14,324 33 100%
ThistableconsistsofloanswithamarketofsyndicationintheASEANregion.Thisexcludesbilateralloans.Thereisaminimumthresholdof3monthsformaturities.PleaseseeLeagueTableStandardsandGuidelinesforfurtherdetails.
Materials35%
Financials31%
Industrials18%
ConsumerDiscretionary10%
Others5%
ASEANLoans:MandatedLeadArrangerRankingsHistory
ASEANLoans(MandatedLeadArranger):IndustryBreakdown
35%
31%
18%
10%
5%
DBSGroup
CIMB
Oversea-ChineseBankingCorp
BDOCapital&InvestmentCorp
BankNegaraIndonesia(Persero)TbkPT
Maybank
5
10
MarketShare(%)
0
15
2019 2018 2017
Bloomberg PreliminaryThailandCapitalMarkets|Q12019
BloombergLeagueTableReports Page5
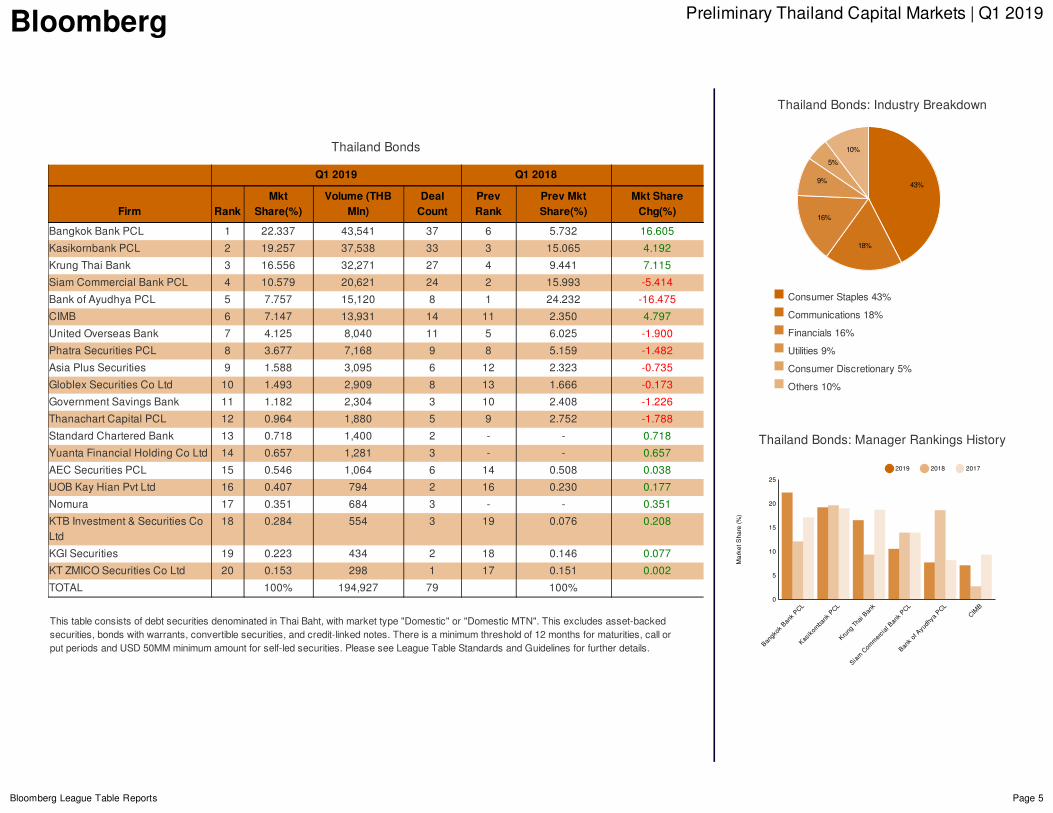
ThailandBonds
Q12019 Q12018
Firm RankMkt
Share(%)Volume(THB
Mln)DealCount
PrevRank
PrevMktShare(%)
MktShareChg(%)
BangkokBankPCL 1 22.337 43,541 37 6 5.732 16.605
KasikornbankPCL 2 19.257 37,538 33 3 15.065 4.192
KrungThaiBank 3 16.556 32,271 27 4 9.441 7.115
SiamCommercialBankPCL 4 10.579 20,621 24 2 15.993 -5.414
BankofAyudhyaPCL 5 7.757 15,120 8 1 24.232 -16.475
CIMB 6 7.147 13,931 14 11 2.350 4.797
UnitedOverseasBank 7 4.125 8,040 11 5 6.025 -1.900
PhatraSecuritiesPCL 8 3.677 7,168 9 8 5.159 -1.482
AsiaPlusSecurities 9 1.588 3,095 6 12 2.323 -0.735
GloblexSecuritiesCoLtd 10 1.493 2,909 8 13 1.666 -0.173
GovernmentSavingsBank 11 1.182 2,304 3 10 2.408 -1.226
ThanachartCapitalPCL 12 0.964 1,880 5 9 2.752 -1.788
StandardCharteredBank 13 0.718 1,400 2 - - 0.718
YuantaFinancialHoldingCoLtd 14 0.657 1,281 3 - - 0.657
AECSecuritiesPCL 15 0.546 1,064 6 14 0.508 0.038
UOBKayHianPvtLtd 16 0.407 794 2 16 0.230 0.177
Nomura 17 0.351 684 3 - - 0.351
KTBInvestment&SecuritiesCoLtd
18 0.284 554 3 19 0.076 0.208
KGISecurities 19 0.223 434 2 18 0.146 0.077
KTZMICOSecuritiesCoLtd 20 0.153 298 1 17 0.151 0.002
TOTAL 100% 194,927 79 100%
ThistableconsistsofdebtsecuritiesdenominatedinThaiBaht,withmarkettype"Domestic"or"DomesticMTN".Thisexcludesasset-backedsecurities,bondswithwarrants,convertiblesecurities,andcredit-linkednotes.Thereisaminimumthresholdof12monthsformaturities,callorputperiodsandUSD50MMminimumamountforself-ledsecurities.PleaseseeLeagueTableStandardsandGuidelinesforfurtherdetails.
ConsumerStaples43%
Communications18%
Financials16%
Utilities9%
ConsumerDiscretionary5%
Others10%
ThailandBonds:ManagerRankingsHistory
ThailandBonds:IndustryBreakdown
43%
18%
16%
9%
5%
10%
BangkokBankPCL
KasikornbankPCL
KrungThaiBank
SiamCommercialBankPCL
BankofAyudhyaPCL
CIMB
5
10
15
20
MarketShare(%)
0
25
2019 2018 2017
Bloomberg PreliminaryThailandCapitalMarkets|Q12019
BloombergLeagueTableReports Page6
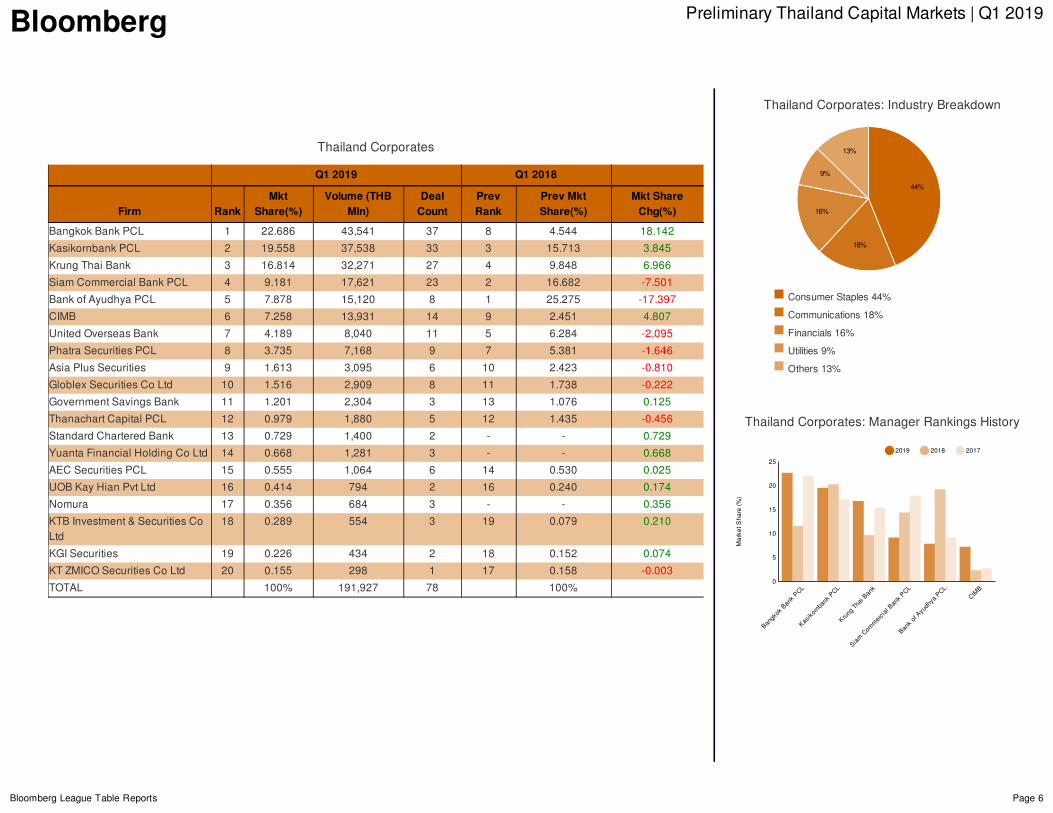
ThailandCorporates
Q12019 Q12018
Firm RankMkt
Share(%)Volume(THB
Mln)DealCount
PrevRank
PrevMktShare(%)
MktShareChg(%)
BangkokBankPCL 1 22.686 43,541 37 8 4.544 18.142
KasikornbankPCL 2 19.558 37,538 33 3 15.713 3.845
KrungThaiBank 3 16.814 32,271 27 4 9.848 6.966
SiamCommercialBankPCL 4 9.181 17,621 23 2 16.682 -7.501
BankofAyudhyaPCL 5 7.878 15,120 8 1 25.275 -17.397
CIMB 6 7.258 13,931 14 9 2.451 4.807
UnitedOverseasBank 7 4.189 8,040 11 5 6.284 -2.095
PhatraSecuritiesPCL 8 3.735 7,168 9 7 5.381 -1.646
AsiaPlusSecurities 9 1.613 3,095 6 10 2.423 -0.810
GloblexSecuritiesCoLtd 10 1.516 2,909 8 11 1.738 -0.222
GovernmentSavingsBank 11 1.201 2,304 3 13 1.076 0.125
ThanachartCapitalPCL 12 0.979 1,880 5 12 1.435 -0.456
StandardCharteredBank 13 0.729 1,400 2 - - 0.729
YuantaFinancialHoldingCoLtd 14 0.668 1,281 3 - - 0.668
AECSecuritiesPCL 15 0.555 1,064 6 14 0.530 0.025
UOBKayHianPvtLtd 16 0.414 794 2 16 0.240 0.174
Nomura 17 0.356 684 3 - - 0.356
KTBInvestment&SecuritiesCoLtd
18 0.289 554 3 19 0.079 0.210
KGISecurities 19 0.226 434 2 18 0.152 0.074
KTZMICOSecuritiesCoLtd 20 0.155 298 1 17 0.158 -0.003
TOTAL 100% 191,927 78 100%
ConsumerStaples44%
Communications18%
Financials16%
Utilities9%
Others13%
ThailandCorporates:ManagerRankingsHistory
ThailandCorporates:IndustryBreakdown
44%
18%
16%
9%
13%
BangkokBankPCL
KasikornbankPCL
KrungThaiBank
SiamCommercialBankPCL
BankofAyudhyaPCL
CIMB
5
10
15
20
MarketShare(%)
0
25
2019 2018 2017
Bloomberg PreliminaryThailandCapitalMarkets|Q12019
BloombergLeagueTableReports Page7
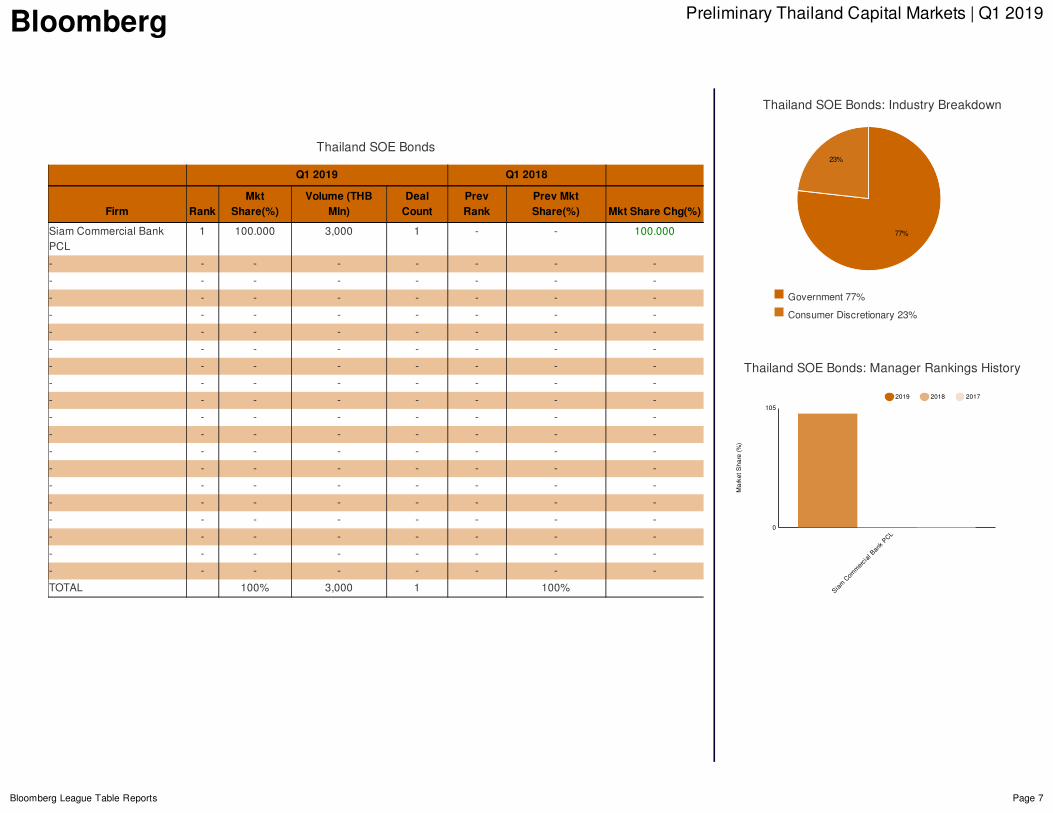
ThailandSOEBonds
Q12019 Q12018
Firm RankMkt
Share(%)Volume(THB
Mln)DealCount
PrevRank
PrevMktShare(%) MktShareChg(%)
SiamCommercialBankPCL
1 100.000 3,000 1 - - 100.000
- - - - - - - -
- - - - - - - -
- - - - - - - -
- - - - - - - -
- - - - - - - -
- - - - - - - -
- - - - - - - -
- - - - - - - -
- - - - - - - -
- - - - - - - -
- - - - - - - -
- - - - - - - -
- - - - - - - -
- - - - - - - -
- - - - - - - -
- - - - - - - -
- - - - - - - -
- - - - - - - -
- - - - - - - -
TOTAL 100% 3,000 1 100%
Government77%
ConsumerDiscretionary23%
ThailandSOEBonds:ManagerRankingsHistory
ThailandSOEBonds:IndustryBreakdown
77%
23%
SiamCommercialBankPCL
MarketShare(%)
0
105
2019 2018 2017
Bloomberg PreliminaryThailandCapitalMarkets|Q12019
BloombergLeagueTableReports Page8
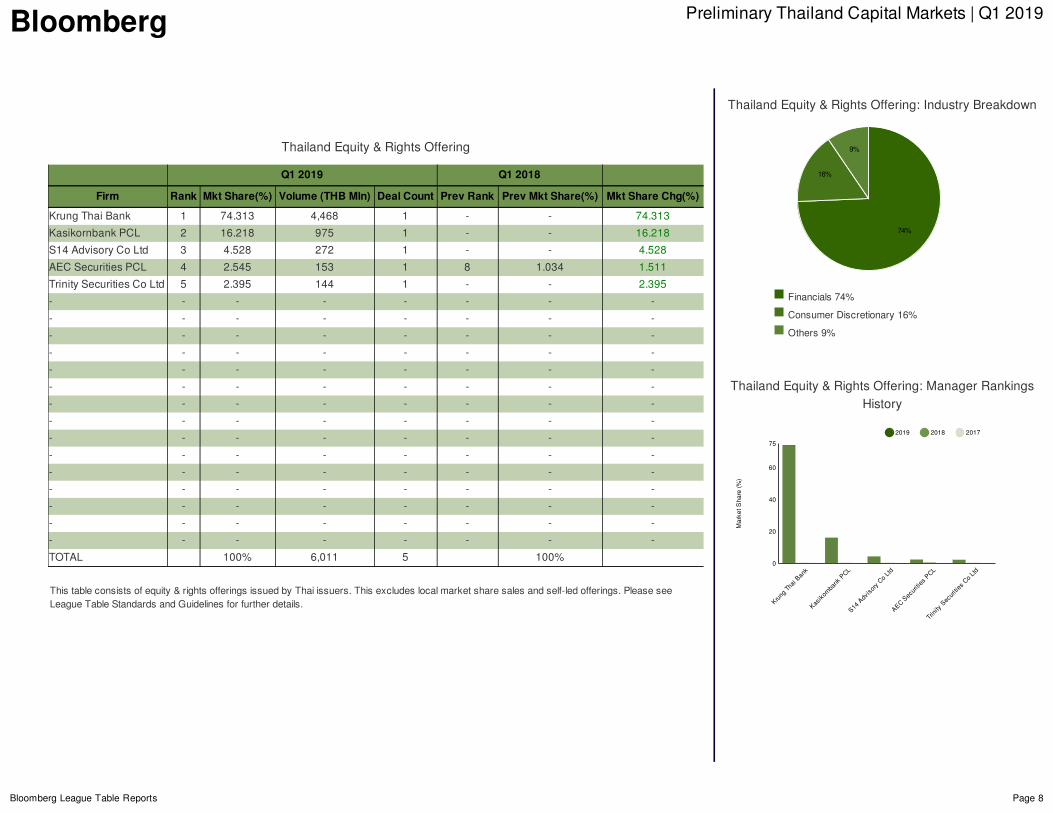
ThailandEquity&RightsOffering
Q12019 Q12018
Firm Rank MktShare(%) Volume(THBMln) DealCount PrevRank PrevMktShare(%) MktShareChg(%)
KrungThaiBank 1 74.313 4,468 1 - - 74.313
KasikornbankPCL 2 16.218 975 1 - - 16.218
S14AdvisoryCoLtd 3 4.528 272 1 - - 4.528
AECSecuritiesPCL 4 2.545 153 1 8 1.034 1.511
TrinitySecuritiesCoLtd 5 2.395 144 1 - - 2.395
- - - - - - - -
- - - - - - - -
- - - - - - - -
- - - - - - - -
- - - - - - - -
- - - - - - - -
- - - - - - - -
- - - - - - - -
- - - - - - - -
- - - - - - - -
- - - - - - - -
- - - - - - - -
- - - - - - - -
- - - - - - - -
- - - - - - - -
TOTAL 100% 6,011 5 100%
Thistableconsistsofequity&rightsofferingsissuedbyThaiissuers.Thisexcludeslocalmarketsharesalesandself-ledofferings.PleaseseeLeagueTableStandardsandGuidelinesforfurtherdetails.
Financials74%
ConsumerDiscretionary16%
Others9%
ThailandEquity&RightsOffering:ManagerRankingsHistory
ThailandEquity&RightsOffering:IndustryBreakdown
74%
16%
9%
KrungThaiBank
KasikornbankPCL
S14AdvisoryCoLtd
AECSecuritiesPCL
TrinitySecuritiesCoLtd
20
40
60
MarketShare(%)
0
75
2019 2018 2017
Bloomberg PreliminaryThailandCapitalMarkets|Q12019
BloombergLeagueTableReports Page9
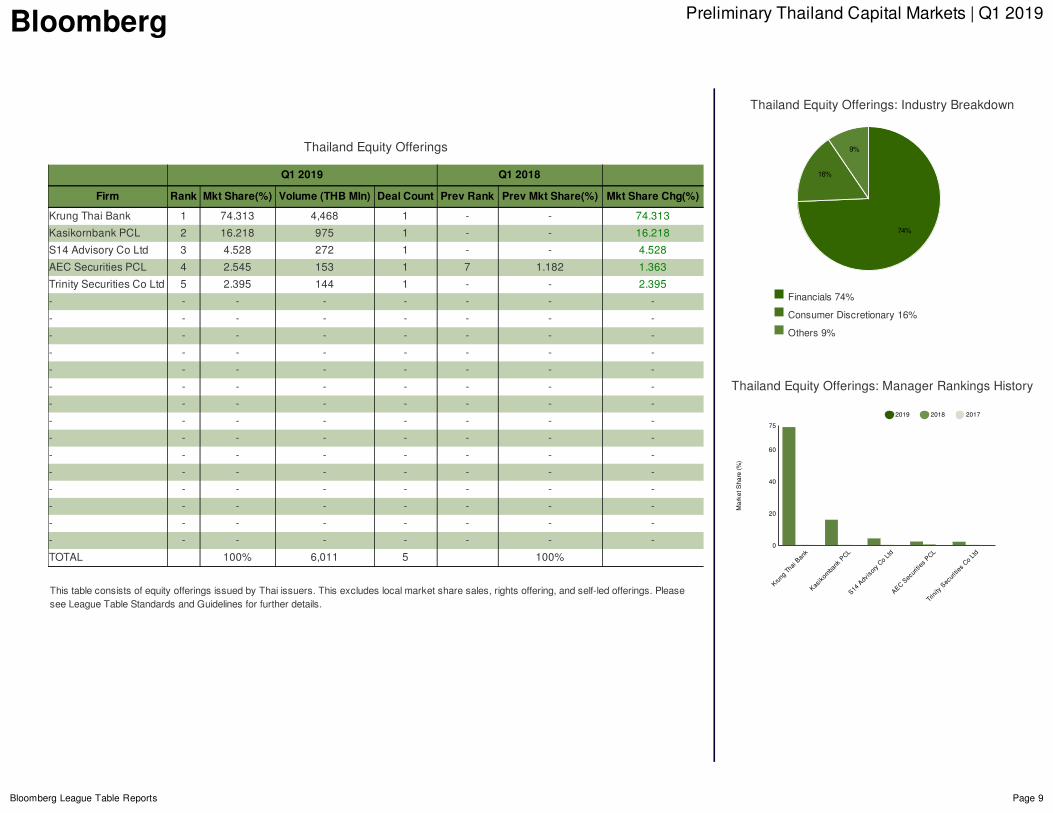
ThailandEquityOfferings
Q12019 Q12018
Firm Rank MktShare(%) Volume(THBMln) DealCount PrevRank PrevMktShare(%) MktShareChg(%)
KrungThaiBank 1 74.313 4,468 1 - - 74.313
KasikornbankPCL 2 16.218 975 1 - - 16.218
S14AdvisoryCoLtd 3 4.528 272 1 - - 4.528
AECSecuritiesPCL 4 2.545 153 1 7 1.182 1.363
TrinitySecuritiesCoLtd 5 2.395 144 1 - - 2.395
- - - - - - - -
- - - - - - - -
- - - - - - - -
- - - - - - - -
- - - - - - - -
- - - - - - - -
- - - - - - - -
- - - - - - - -
- - - - - - - -
- - - - - - - -
- - - - - - - -
- - - - - - - -
- - - - - - - -
- - - - - - - -
- - - - - - - -
TOTAL 100% 6,011 5 100%
ThistableconsistsofequityofferingsissuedbyThaiissuers.Thisexcludeslocalmarketsharesales,rightsoffering,andself-ledofferings.PleaseseeLeagueTableStandardsandGuidelinesforfurtherdetails.
Financials74%
ConsumerDiscretionary16%
Others9%
ThailandEquityOfferings:ManagerRankingsHistory
ThailandEquityOfferings:IndustryBreakdown
74%
16%
9%
KrungThaiBank
KasikornbankPCL
S14AdvisoryCoLtd
AECSecuritiesPCL
TrinitySecuritiesCoLtd
20
40
60
MarketShare(%)
0
75
2019 2018 2017
Bloomberg PreliminaryThailandCapitalMarkets|Q12019
BloombergLeagueTableReports Page10
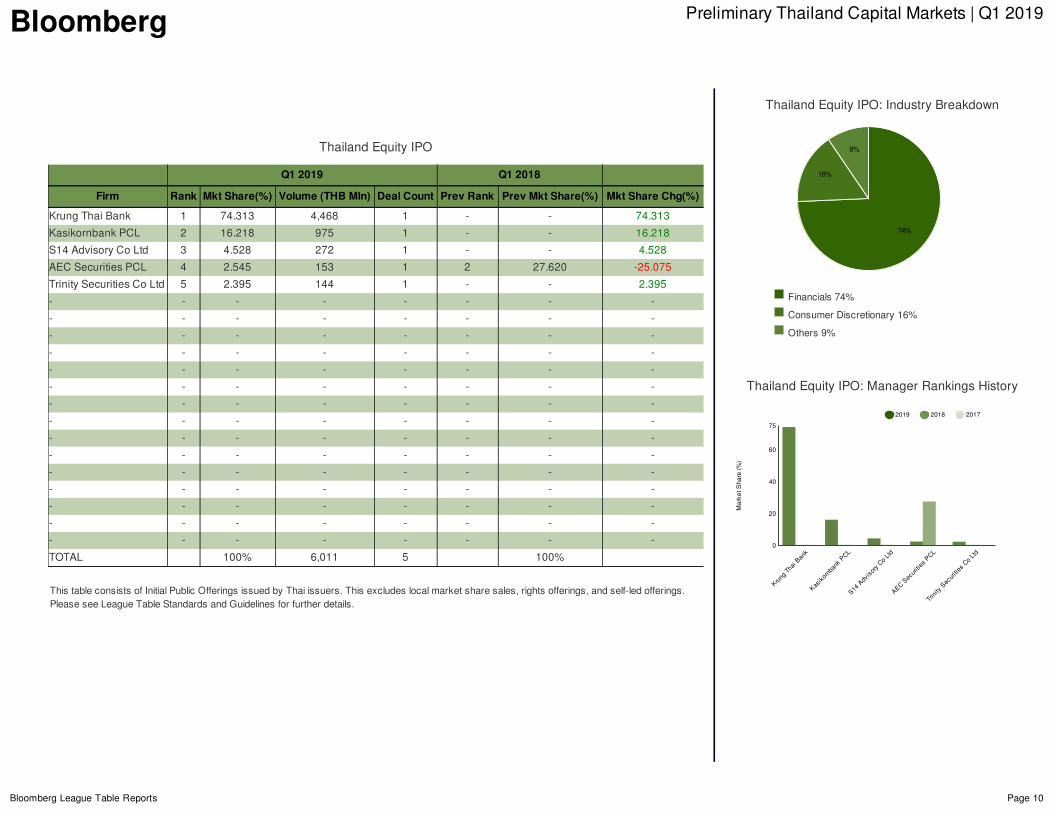
ThailandEquityIPO
Q12019 Q12018
Firm Rank MktShare(%) Volume(THBMln) DealCount PrevRank PrevMktShare(%) MktShareChg(%)
KrungThaiBank 1 74.313 4,468 1 - - 74.313
KasikornbankPCL 2 16.218 975 1 - - 16.218
S14AdvisoryCoLtd 3 4.528 272 1 - - 4.528
AECSecuritiesPCL 4 2.545 153 1 2 27.620 -25.075
TrinitySecuritiesCoLtd 5 2.395 144 1 - - 2.395
- - - - - - - -
- - - - - - - -
- - - - - - - -
- - - - - - - -
- - - - - - - -
- - - - - - - -
- - - - - - - -
- - - - - - - -
- - - - - - - -
- - - - - - - -
- - - - - - - -
- - - - - - - -
- - - - - - - -
- - - - - - - -
- - - - - - - -
TOTAL 100% 6,011 5 100%
ThistableconsistsofInitialPublicOfferingsissuedbyThaiissuers.Thisexcludeslocalmarketsharesales,rightsofferings,andself-ledofferings.PleaseseeLeagueTableStandardsandGuidelinesforfurtherdetails.
Financials74%
ConsumerDiscretionary16%
Others9%
ThailandEquityIPO:ManagerRankingsHistory
ThailandEquityIPO:IndustryBreakdown
74%
16%
9%
KrungThaiBank
KasikornbankPCL
S14AdvisoryCoLtd
AECSecuritiesPCL
TrinitySecuritiesCoLtd
20
40
60
MarketShare(%)
0
75
2019 2018 2017
Bloomberg PreliminaryThailandCapitalMarkets|Q12019
BloombergLeagueTableReports Page11
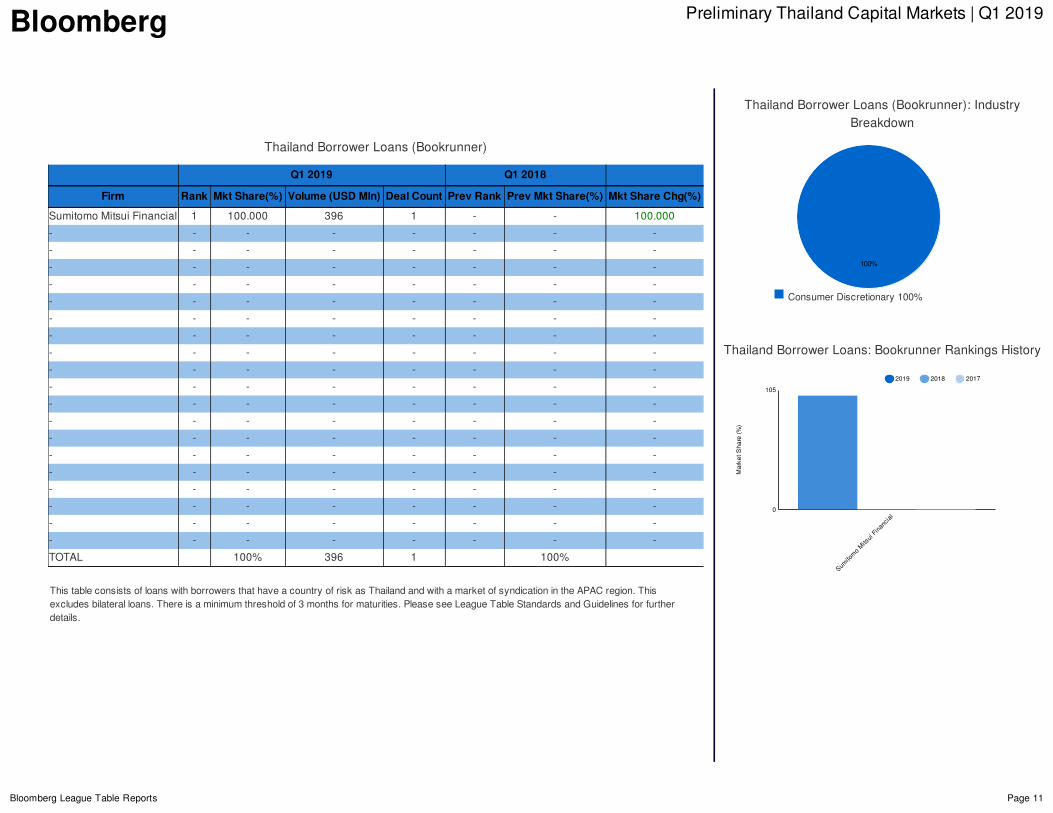
ThailandBorrowerLoans(Bookrunner)
Q12019 Q12018
Firm Rank MktShare(%) Volume(USDMln) DealCount PrevRank PrevMktShare(%) MktShareChg(%)
SumitomoMitsuiFinancial 1 100.000 396 1 - - 100.000
- - - - - - - -
- - - - - - - -
- - - - - - - -
- - - - - - - -
- - - - - - - -
- - - - - - - -
- - - - - - - -
- - - - - - - -
- - - - - - - -
- - - - - - - -
- - - - - - - -
- - - - - - - -
- - - - - - - -
- - - - - - - -
- - - - - - - -
- - - - - - - -
- - - - - - - -
- - - - - - - -
- - - - - - - -
TOTAL 100% 396 1 100%
ThistableconsistsofloanswithborrowersthathaveacountryofriskasThailandandwithamarketofsyndicationintheAPACregion.Thisexcludesbilateralloans.Thereisaminimumthresholdof3monthsformaturities.PleaseseeLeagueTableStandardsandGuidelinesforfurtherdetails.
ConsumerDiscretionary100%
ThailandBorrowerLoans:BookrunnerRankingsHistory
ThailandBorrowerLoans(Bookrunner):IndustryBreakdown
100%
SumitomoMitsuiFinancial
MarketShare(%)
0
105
2019 2018 2017
Bloomberg PreliminaryThailandCapitalMarkets|Q12019
BloombergLeagueTableReports Page12
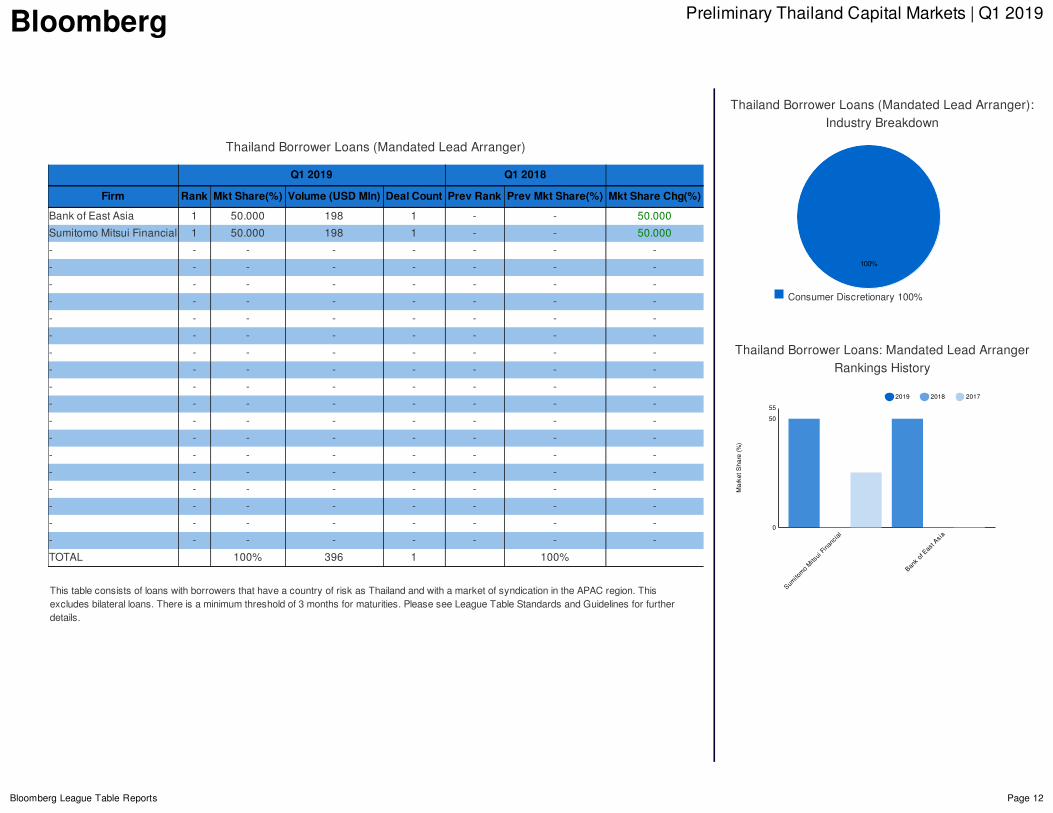
ThailandBorrowerLoans(MandatedLeadArranger)
Q12019 Q12018
Firm Rank MktShare(%) Volume(USDMln) DealCount PrevRank PrevMktShare(%) MktShareChg(%)
BankofEastAsia 1 50.000 198 1 - - 50.000
SumitomoMitsuiFinancial 1 50.000 198 1 - - 50.000
- - - - - - - -
- - - - - - - -
- - - - - - - -
- - - - - - - -
- - - - - - - -
- - - - - - - -
- - - - - - - -
- - - - - - - -
- - - - - - - -
- - - - - - - -
- - - - - - - -
- - - - - - - -
- - - - - - - -
- - - - - - - -
- - - - - - - -
- - - - - - - -
- - - - - - - -
- - - - - - - -
TOTAL 100% 396 1 100%
ThistableconsistsofloanswithborrowersthathaveacountryofriskasThailandandwithamarketofsyndicationintheAPACregion.Thisexcludesbilateralloans.Thereisaminimumthresholdof3monthsformaturities.PleaseseeLeagueTableStandardsandGuidelinesforfurtherdetails.
ConsumerDiscretionary100%
ThailandBorrowerLoans:MandatedLeadArrangerRankingsHistory
ThailandBorrowerLoans(MandatedLeadArranger):IndustryBreakdown
100%
SumitomoMitsuiFinancial
BankofEastAsia
50
MarketShare(%)
0
55
2019 2018 2017
Bloomberg – League Tables Criteria
Bloomberg L.P. reserves the right of final decision concerning league eligibility and requires adequate documentation for the same. Bloomberg L.P. and its suppliers believe the information herein was obtained from reliable sources, but they do not guarantee its accuracy. Neither the information nor the opinion expressed constitutes a solicitation of the purchase or sale of securities or commodities. Due to the dynamic nature of the Professional Service product, League Table rankings may vary between the quarterly/year-end publications and data found on the Bloomberg Professional Service.
General Guidelines
Credit is based on the total amount of the offering sold to the public. Full credit is awarded to the sole bookrunning manager or split equally among joint bookrunning managers; unless full, explicit breakdown of bookrunning is provided by an involved party. Regional and local tables are identified based on factors such as currency, market of issuer and/or country of risk/incorporation.
Fixed Income
All transactions must have a maturity/call/put option of minimum 18 months. Make-whole call and provisional call/put are exempted from this rule. Note: Criteria may vary for some local and/or regional tables. USD denominated 144A/REG S issues are credited 100% to the 144A tranche and 0% to the REG S tranche. Non-USD denominated 144A/REG S issues are credited 100% to the REG S tranche and 0% to the 144A tranche. Self-led transactions are included. New money portions of exchange offers are eligible for credit.
Exclusions: Accredited investor tranches, asset-backed issues, auction note agencies, collateralized bond obligations, collateralized loan obligations, commercial paper, municipal bonds, mortgage-backed issues, remarketed issues, repackaged bonds, government borrowing scheme retained bonds, variable principal redemption issues, variable interest equity-linked issues, and credit linked notes, selling group agency issues, strips, units, warrants, self-led under USD 50 million. Note: Criteria may vary for some local and/or regional tables.
Equities-Linked
Equity-linked transactions: Convertible bonds, convertible preferred stock and exchangeable bonds. Only issues that mature and are callable/puttable in 12 months or longer are included. Make-whole call, provisional call and provisional put are exempted from this rule. Convertible bonds with attached warrants are included. These are defined as synthetic convertibles with the combination of a fixed income instrument and warrants which can be converted into shares. The embedded warrant can be detachable or non-detachable but the bond and the warrant must be sold as a unit, i.e. there cannot be separate book building for the warrant and the bond.
Exclusions: Redemption-linked instruments, reverse convertibles or similar instruments, synthetics convertibles, issues convertible into participation in an underlying fund or investment trust, pre-IPO convertible instruments, certain lower hierarchy titles, i.e. Jr Bookrunner.
Equities
Equity market transactions: Initial public offerings, additional offerings of common stocks, units, and depositary receipts (ADRs, GDRs, etc) and rights offerings.
Exclusions: Non-underwritten/best efforts, privately placed transactions, funds, self-led, preferred offerings, pre-negotiated offerings, certain lower hierarchy titles, i.e. Jr Bookrunner. Note: Criteria may vary for some local and/or regional tables.
Bloomberg – League Tables Criteria
Bloomberg L.P. reserves the right of final decision concerning league eligibility and requires adequate documentation for the same. Bloomberg L.P. and its suppliers believe the information herein was obtained from reliable sources, but they do not guarantee its accuracy. Neither the information nor the opinion expressed constitutes a solicitation of the purchase or sale of securities or commodities. Due to the dynamic nature of the Professional Service product, League Table rankings may vary between the quarterly/year-end publications and data found on the Bloomberg Professional Service.
Loans
Includes executed syndicated loans transactions. Full credit is awarded to the banks satisfying the highest of the titles. Full credit is awarded to the sole bookrunning manager or split equally among joint bookrunning managers. Credit is allocated to amended or amended and restated transactions, where each modification is 100% at the lender’s option and not as a result of events already built into the original credit agreement. Credit is awarded for the following structural changes only: maturity extensions of three months or more, incremental basis for increased in deal size, reduction in pricing, full release of security.
Exclusions: Bilateral transactions, transactions with a maturity of less than three months, loans withdrawn prior to signing, amended or restated securitizations, receivable and guarantee facilities.
US Municipals
Standard published tables will award deal credit based on true economic credit as reported by the issuer or the bookrunner. In absence of reported economic credit, 100% will be assigned to the bookrunner.
Dollar value of credit will be assigned based on the percentage allocation reported for economic credit (or designated by the user in a custom table) and applied against the total par value of the bonds issued. Zero coupon bonds (CABS) or intermediate appreciation bonds (convertible CABs) will be included at the market value (accreted value) on the interest accrual date.
All debt issued by municipal issuers will be eligible for league credit. Taxable and tax-exempt debt is eligible for league credit unless a table includes specific tax type criteria. “Tax-exempt” is defined as federally tax-exempt and includes bonds subject to AMT and bonds designated as Bank Qualified.
Each table is provided in three formats. “Economic Credit” displays rankings based on true economic credit allocations of applicable deals. “Left Lead” assigns 100% credit to the bookrunner and 0% to all other syndicate participants. “Deal Count” displays rankings based on deal quantity rather than aggregate economic credit amounts. A “deal” refers to the aggregate series within an issuance led by a particular underwriter or syndicate. For example: a $50 million issuance is split into three series- a $10 million Series A, a $20 million Series B, and a $20 million Series C. Bank 1 is the underwriter of Series A & B, while Bank 2 is the underwriter of Series C. Bank 1 would have one “deal” worth $30 million, and Bank 2 would have one “deal” worth $20 million.
Exclusions: Derivatives, private placements, variable rate preferred securities, municipal commercial paper, and remarketings are excluded from municipal league table eligibility.
The full version of Bloomberg’s League table Standards & Guidelines can be accessed and subscribed to on the Reports tab on
LEAG<GO>.