th raymond ltd… · 2018. 12. 21. · raymond ltd consolidated net profit jumps to rs. 652.00...
TRANSCRIPT

Document code: FOTL_201220184_2 Copyright © 2016 Firstobject Technologies Ltd. All rights reserved
RAYMOND LTDResult Update (CONSOLIDATED BASIS): Q2 FY19
CMP: 852.70 DEC 20th, 2018
Overweight ISIN:INE301A01014
Index Details SYNOPSISRaymond Limited is an Indian lifestyle, textile andbranded apparel company. The Company is engagedin Wool and Wool Blended Fabric, and ShirtingFabric.Consolidated revenue for the quarter increased by15.81% at Rs. 18477.50 mn as compared to Rs.15954.50 mn, when compared with the prior yearperiod.During Q2 FY19, consolidated EBIDTA is Rs.2143.90 mn as against Rs. 1582.30 mn in Q2 FY18,grew by 35.49%.During Q2 FY19, consolidated PBT increased by8.88% to Rs. 1033.20 mn from Rs. 948.90 mn in Q2FY18.During Q2 FY19, consolidated net profit stood atRs. 652.00 mn from Rs. 622.40 mn in Q2 FY18, anincrease of 4.76%.EPS of the company stood at Rs. 10.62 a shareduring the quarter, as against Rs. 10.14 per shareover previous year period.Revenue of the company rose by 10.96% at Rs.30984.10 mn in H1 FY19 as against Rs. 27923.30mn in H1 FY18.During H1 FY19, PAT of the company stood at Rs.671.20 mn as compared to Rs. 511.10 mn in H1FY18, up by 31.32%.Net Worth of the company increased to Rs. 19120mn in Q2 FY19 as against Rs. 17990 mn in Q2FY18.Net Debt of the company stood at Rs. 22800 mn inQ2 FY19 as compared to Rs. 20180 mn in Q2 FY18.The company has totaling to 139 Mini TRS stores asat Sep’18.5 Stores opened in Q2FY19; totaling to 11 stores asat Sep’18 under Style Play.3 tailoring hubs added in Q2, totaling to 33 hubs ason Sep’18.Net Sales and PAT of the company are expected togrow at a CAGR of 9% and 27% over 2017 to2020E, respectively.
Stock DataSector TextilesBSE Code 500330Face Value 10.0052wk. High / Low (Rs.) 1151.70/593.55Volume (2wk. Avg.) 56000Market Cap (Rs. in mn.) 52338.73
Annual Estimated Results(A*: Actual / E*: Estimated)Years (Rs. in mn) FY18A FY19E FY20ENet Sales 59064.10 66151.79 73428.49EBITDA 5464.00 6943.49 7973.03Net Profit 1415.50 1642.22 1877.72EPS 23.06 26.75 30.59P/E 36.98 31.87 27.87
Shareholding Pattern (%)
As on Sep 2018 As on Dec 2018
Promoter 43.92 43.68
Public 56.08 56.32
Others -- --
1 Year Comparative Graph
RAYMOND LTD S&P BSE SENSEX
PEER GROUPS CMP MARKET CAP EPS(TTM) P/E (X)(TTM) P/BV(X) DIVIDEND
Company Name (Rs.) Rs. in mn. (Rs.) Ratio Ratio (%)
Raymond Ltd 852.70 52338.73 24.81 34.36 2.89 30.00Ambika Cotton Mills Ltd 1172.10 6710.30 114.57 10.23 1.56 350.00Arvind Ltd 100.90 26094.50 12.45 7.98 0.64 24.00RSWM Ltd 258.55 6089.10 14.15 18.27 0.68 20.00

Document code: FOTL_201220184_2 Copyright © 2016 Firstobject Technologies Ltd. All rights reserved
QUARTERLY HIGHLIGHTS (CONSOLIDATED BASIS)
Results updates- Q2 FY19,
(Rs. in millions) Sep-18 Sep-17 % Change
Revenue 18477.50 15954.50 15.81%
Net Profit 652.00 622.40 4.76%
EPS 10.62 10.14 4.76%
EBIDTA 2143.90 1582.30 35.49%
Raymond Ltd consolidated net profit jumps to Rs. 652.00 million from Rs. 622.40 million in the corresponding quarter
ending of previous year, an increase of 4.76%. Revenue for the quarter up by 15.81% and stood at Rs. 18477.50 million as
against Rs. 15954.50 million, increased by 15.81% when compared with the prior year period. Reported earnings per
share of the company stood at Rs. 10.62 a share during the quarter, as against Rs. 10.14 per share over previous year
period. Profit before interest, depreciation and tax is Rs. 2143.90 million as against Rs. 1582.30 million in the
corresponding period of the previous year.
Break up of Expenditure
Break up ofExpenditure
Value in Rs. Million
Q2 FY19 Q2 FY18 %Change
Cost of MaterialsConsumed 3359.00 3321.00 1%
Purchases of Stock-in-Trade 5338.90 4516.80 18%
Employee Benefits 2430.60 2088.60 16%
Depreciation andAmortization 502.00 385.90 30%
Manufacturing andOperating 2171.70 1837.70 18%
Costs towardsDevelopment ofProperty
76.50 0.00 --
Others 3658.40 3235.60 13%

Document code: FOTL_201220184_2 Copyright © 2016 Firstobject Technologies Ltd. All rights reserved
Segment Revenue
Result Highlights:
Revenue of the company rose by 10.96% at Rs. 30984.10 mn in H1 FY19 as against Rs. 27923.30 mn in H1 FY18.
During H1 FY19, PAT of the company stood at Rs. 671.20 mn as compared to Rs. 511.10 mn in H1 FY18, up by
31.32%.
Initiatives:
The company has totaling to 139 Mini TRS stores as at Sep’18.
5 Stores opened in Q2FY19; totaling to 11 stores as at Sep’18 under Style Play.
3 tailoring hubs added in Q2, totaling to 33 hubs as on Sep’18.
Balance Sheet & Cash Flow Performance Indicators:
Net Worth of the company increased to Rs. 19120 mn in Q2 FY19 as against Rs. 17990 mn in Q2 FY18.
Net Debet of the company stood at Rs. 22800 mn in Q2 FY19 as compared to Rs. 20180 mn in Q2 FY18.
Segment Revenue:
Branded Textile Segment sales at Rs. 8844.7 mn, higher by 15% over previous year led by 14% growth in the suiting
business and 17% in the shirting business. Revenue driven by volume growth in domestic business mainly due to
distribution expansion & growth in trade channels.
Like to Like EBITDA margins at 15.9% as compared to 16.4% in the previous year impacted largely on account of
increase in raw-material cost and higher A&SP spends.

Document code: FOTL_201220184_2 Copyright © 2016 Firstobject Technologies Ltd. All rights reserved
Branded Apparel Segment sales at Rs. 4835.0 mn, up by 15% over previous year. The growth was driven by strong
performance in MBO channel along with growth in Raymond (RPA) and Parx brands supported by new customer
segments.
Retail Stores count as on Sep 30, 2018 stood at 1,282 across all formats covering about 2.2 million square feet of retail
space. In-line with stated asset light network expansion strategy, the company opened 38 mini TRS stores in Q2 taking
total count of mini TRS to 139 stores.
Garmenting Segment sales at Rs. 2185.7 mn, higher by 19% over previous year led by exports growth in US. LTL
EBITDA margins improved to 7.8% vs. 3.6% in previous year mainly due to operational efficiencies.
Luxury Cotton Shirting Fabric Segment sales at Rs. 1755.7 mn, grew by 17% on account of better offtake by the
customers and yarn sales from Amravati plant.
Tools and Hardware Segment sales at Rs. 1039.6 mn, up by 15% over previous year, mainly driven by better
performance in domestic markets. The turnaround strategy of building operational efficiency and product rationalization
helped in improving EBITDA margin to 14.4% as compared to 9.0% in the previous year.
Auto Components Segment sales at Rs. 640 mn, higher by 21 % over previous year, driven by strong demand from both
domestic and international customers. EBITDA margins at 22.6%, impacted mainly due to higher raw material prices.
Overall, the business is maintaining its profitable sales growth momentum.
Real Estate Segment is are currently in the process of seeking requisite approvals from the authorities pertaining to
commencement of the project.
COMPANY PROFILE
Raymond offers end-to-end solutions for fabrics and garmenting. It has some of the leading brands in its portfolio
including Raymond, Park Avenue, Raymond Premium Apparel, Parx, and Color Plus amongst others. Raymond has one
of the largest exclusive retail network ks in the textile and fashion space in India. As a part of the diversified Group, it also
has business interests in men's accessories, personal grooming & toiletries, prophylactics, files & tools and auto
components.

Document code: FOTL_201220184_2 Copyright © 2016 Firstobject Technologies Ltd. All rights reserved
FINANCIAL HIGHLIGHT (CONSOLIDATED BASIS) (A*- Actual, E* -Estimations & Rs. In Millions)Balance Sheet as of March 31, 2017 -2020E
FY17A FY18A FY19E FY20EASSETS1) Non-Current Assets
a) Property, plant and equipment 11553.10 16772.40 18785.09 20663.60b) Capital Work in Progress 4121.50 2702.10 614.45 442.40c) Goodwill 115.00 115.00 120.75 124.37d) Other Intangible Assets 18.70 519.80 545.79 567.62e) Intangible Assets under Development 0.00 10.90 11.45 11.90f) Investment Accounted for using Equity Method 1323.10 1251.70 1189.12 1153.44g) Financial Assets
i) Investments 1200.30 1374.70 1209.74 1137.15ii) Loans 681.60 756.90 825.02 882.77iii) Other Financial Assets 1118.20 731.80 768.39 799.13
h) Deferred Tax Assets 805.90 723.70 665.80 632.51i) Non-Current Tax Assets (Net) 978.60 741.20 652.26 600.08j) Other Non -Current Assets 990.70 1068.60 1154.09 1223.33Sub - Total Non- Current Assets 22906.70 26768.80 26541.93 28238.31
2) Current Assetsa) Inventories 12886.70 16113.10 18046.67 19851.34b) Financial Assets
i) Investments 3881.60 3728.90 2983.12 2535.65ii) Trade Receivables 10506.70 10859.10 14334.01 17917.52iii) Cash and Cash Equivalents 376.50 455.00 614.25 786.24iv) Other Bank Balances 320.50 412.90 433.55 459.56v) Loans 51.60 47.60 94.25 120.64vi) Other Financial Assets 260.40 285.10 421.95 569.63
c) Other Current Assets 1247.30 2418.60 3676.27 4962.97d) Assets Classified as Held for Sale 85.00 0.70 0.53 0.42Sub - Total Current Assets 29616.30 34321.00 40604.59 47203.96
Total Assets (1+2) 52523.00 61089.80 67146.53 75442.27EQUITY AND LIABILITIES1) EQUITY
a) Equity Share Capital 613.80 613.80 613.80 613.80b) Other Equity 16117.40 17506.50 19148.72 21026.44
Total Equity 16731.20 18120.30 19762.52 21640.242) Non-Controlling Interest 693.10 762.50 808.25 856.753) Non Current Liabilities
a) Financial Liabilitiesi) Borrowings 6349.10 6639.90 5311.92 4515.13
ii) Other Financial Liabilities 25.50 454.10 476.81 505.41b) Deferred Tax Liabilities (Net) 147.30 186.70 196.04 203.88c) Other Non-Current Liabilities 519.90 482.00 443.44 425.70Sub - Total Non Current Liabilities 7041.80 7762.70 6428.21 5650.13
3) Current Liabilitiesa)Financial Liabilities
i) Borrowings 11324.60 11501.30 16118.81 21664.16ii) Trade Payables 7734.30 11258.80 13304.95 15300.69iii) Other Financial Liabilities 7040.30 9607.90 8647.11 8214.75
b) Provisions 589.90 594.60 713.52 820.55c) Current Tax Liabilities 32.50 0.00 0.00 0.00d) Other Current Liabilities 1335.30 1481.70 1363.16 1295.01Sub - Total Current Liabilities 28056.90 34444.30 40147.55 47295.16
Total Equity and Liabilities (1+2+3) 52523.00 61089.80 67146.53 75442.27

Document code: FOTL_201220184_2 Copyright © 2016 Firstobject Technologies Ltd. All rights reserved
Annual Profit & Loss Statement for the period of 2017 to 2020E
Value(Rs.in.mn) FY17A FY18A FY19E FY20E
Description 12m 12m 12m 12mNet Sales 53913.20 59064.10 66151.79 73428.49Other Income 1179.40 1185.00 1327.20 1459.92Total Income 55092.60 60249.10 67478.99 74888.41Expenditure -50865.20 -54785.10 -60535.50 -66915.38Operating Profit 4227.40 5464.00 6943.49 7973.03Interest -1780.30 -1838.00 -2297.50 -2711.05Gross profit 2447.10 3626.00 4645.99 5261.98Depreciation -1568.80 -1703.40 -2044.08 -2350.69Exceptional Items -100.50 209.50 -52.38 -37.71Profit Before Tax 777.80 2132.10 2549.53 2873.57Tax -218.40 -666.30 -846.95 -926.44Profit After Tax 559.40 1465.80 1702.58 1947.13Share of Profit & Loss Assoc. -259.20 -50.30 -60.36 -69.41Net Profit 300.20 1415.50 1642.22 1877.72Equity capital 613.80 613.80 613.80 613.80Reserves 16117.40 17506.50 19148.72 21026.44Face value 10.00 10.00 10.00 10.00EPS 4.89 23.06 26.75 30.59
Quarterly Profit & Loss Statement for the period of 31st Mar, 2017 to 31st Dec, 2018E
Value(Rs.in.mn) 31- Mar-18 30- June-18 30- Sep-18 31-Dec-18EDescription 3m 3m 3m 3mNet sales 16298.40 12506.60 18477.50 17184.08Other income 252.80 385.00 279.50 329.81Total Income 16551.20 12891.60 18757.00 17513.89Expenditure -14791.70 -11818.30 -16613.10 -15589.39Operating profit 1759.50 1073.30 2143.90 1924.49Interest -489.40 -525.60 -602.60 -638.76Gross profit 1270.10 547.70 1541.30 1285.74Depreciation -508.50 -466.20 -502.00 -557.22Exceptional Items 0.00 -19.30 -6.10 -4.58Profit Before Tax 761.60 62.20 1033.20 723.94Tax -241.00 -33.10 -367.40 -234.99Profit After Tax 520.60 29.10 665.80 488.95Share of Profit & Loss of Assoc. 24.20 -9.90 -13.80 -17.66Net Profit 544.80 19.20 652.00 471.29Equity capital 613.80 613.80 613.80 613.80Face value 10.00 10.00 10.00 10.00EPS 8.88 0.31 10.62 7.68

Document code: FOTL_201220184_2 Copyright © 2016 Firstobject Technologies Ltd. All rights reserved
Ratio Analysis
Particulars FY17A FY18A FY19E FY20E
EPS (Rs.) 4.89 23.06 26.75 30.59EBITDA Margin (%) 7.84% 9.25% 10.50% 10.86%PBT Margin (%) 1.44% 3.61% 3.85% 3.91%PAT Margin (%) 1.04% 2.48% 2.57% 2.65%P/E Ratio (x) 174.35 36.98 31.87 27.87ROE (%) 3.34% 8.09% 8.62% 9.00%ROCE (%) 7.73% 10.37% 11.89% 11.76%Debt Equity Ratio 1.06 1.00 1.08 1.21EV/EBITDA (x) 15.48 12.06 10.04 9.37Book Value (Rs.) 272.58 295.22 321.97 352.56P/BV 3.13 2.89 2.65 2.42
Charts

Document code: FOTL_201220184_2 Copyright © 2016 Firstobject Technologies Ltd. All rights reserved
OUTLOOK AND CONCLUSION
At the current market price of Rs. 852.70, the stock P/E ratio is at 31.87 x FY19E and 27.87 x FY20E respectively.
Earnings per share (EPS) of the company for the earnings for FY19E and FY20E are seen at Rs. 26.75 and Rs. 30.59
respectively.
Net Sales and PAT of the company are expected to grow at a CAGR of 9% and 27% over 2017 to 2020E,
respectively.
On the basis of EV/EBITDA, the stock trades at 10.04 x for FY19E and 9.37 x for FY20E.
Price to Book Value of the stock is expected to be at 2.65 x and 2.42 x for FY19E and FY20E respectively.
Hence, we say that, we are Overweight in this particular scrip for Medium to Long term investment.
INDUSTRY OVERVIEW
Textile Industry:
The Indian textiles industry is one of the oldest industries of the country. The textile industry has two broad segments.
First, the unorganized sector consisting of handloom, handicrafts and sericulture and the second is the organized sector
consisting of spinning, weaving, knitting, garments and home textiles segment. The industry has a major contribution to
the national economy in terms of direct and indirect employment generation and net foreign exchange earnings. The
sector contributes 14% to industrial production, 4% to India’s Gross Domestic Product (GDP) and 15% to the country’s
export earnings. It is the second largest employment provider in the country employing nearly 51 million people directly
and 68 million people indirectly in 2015-16.
Exports have been a core feature of India’s textile sector. The Indian textiles export market estimated at $18 billion is
expected to grow at a CAGR of 4% as compared to the global CAGR of 3% over 2016-26.
Document code: FOTL_201220184_2 Copyright © 2016 Firstobject Technologies Ltd. All rights reserved
The company holds a dominant position in the Indian textiles market as a B2C branded player for suiting and shirting
fabrics. In the Suiting, category, the company has been a prominent player since nine decades whereas in the Shirting
business, it has become the largest OTC player in the organized shirting segment within two years of its launch.
Apparel Industry:
The domestic apparel market which is estimated at $46 billion is expected to grow at a CAGR of 9.7% over 2016-26
driven by increase in both the per capita consumption and the average spends on apparel. Currently, at 41% Men’s wear is
the biggest category in the Indian apparel market; however the rate of growth in women’s wear and kid’s wear has been
rapid. It is estimated that, within another decade, the Women’s wear category will rival the Men’s wear.
On the exports front, the apparel exports estimated at $17 billion is expected to grow at 10% (2x the global CAGR of 5%)
over 2016-26.
The company is among the top three branded players in the menswear apparel industry in India with portfolio of four
power brands namely Raymond Ready to Wear, Park Avenue, Color Plus and Parx. These four power brands cater to the
entire spectrum of men’s wardrobe across various price points.
The up-gradation of technology in the industry has led to emergence of new trend of “Smart Garments”. Currently, the
wearable technology market mainly consists of wearable devices such as fitness bands, smart watches. But, recently there
has been a shift towards smart garments among premium and luxury customers.
The company is focusing on product innovations to make its products more relevant to today’s consumer market. In last
couple of years, it has launched many new and innovative products such as Techno-smart, Techno-stretch, light weight
jackets, auto fit shirts and others.
Overall, the government has been supportive in encouraging textile industry in India. Many incentives and schemes have
been announced in the Union Budget to promote the sector. Further, introduction of GST is seen as positive step as it will
result in ‘Fibre-neutrality effect’ on the sector. With the right government policies, we believe that the Indian Textile
Industry is well poised to benefit from the large opportunity offered in the domestic and export market.
Retail, e-commerce and Omni channel:
India’s retail market, estimated at $63 billion, is dominated by traditional retail. The retail market is expected to grow at
CAGR of 11.1% over 2016-20 aided by growth in organized retail and e-commerce.
India’s organized retail segment is expected to continue to grow mainly due to the following factors:
Rapidly changing fashion industry which is driving the shift from un-organized to organized retail
Increased fashion awareness along with rising disposable incomes
Organised retail is no longer just limited to only metro and Tier-1 cities and is rapidly growing in suburban areas
India’s online retail market which is estimated at ~2% of retail is expected to grow to 4-6% of retail by 2020 and to 8-9%
of retail by 2025. Rise in smart-phone use due to higher affordability will be an integral driver of e-commerce. From the

Document code: FOTL_201220184_2 Copyright © 2016 Firstobject Technologies Ltd. All rights reserved
current 35%, smart-phone penetration is expected to be 80% by 2020. At present, apparel and lifestyle segments (lifestyle
includes footwear, bags, belts, wallets, watches, jewellery among others) form ~ 25% of the e-retailing market. The
leading contributor is the electronics category with a share of ~50%.
Retail industry is gradually shifting towards Omni channel retailing, which is an integrated multi-channel approach that
seeks to provide the customer with a seamless shopping experience, whether via online or brick-and-mortar stores.
With launch of “Store of Future”, opening up of converged stores and renovation of old stores the company endeavours to
provide the consumers with best in class shopping experience. Further, keeping in view with the changing trends in
consumer buying behaviour and to gain from the rapid growth of e-commerce as a sales channel, it revamped and
launched www.raymondnext.com as a one-stop fashion solution for all brands under the Raymond umbrella. The
company is setting up processes to being an Omni-channel player that will provide the customer with a seamless shopping
experience both offline as well as online.
Document code: FOTL_201220184_2 Copyright © 2016 Firstobject Technologies Ltd. All rights reserved
Disclosure Section
The information and opinions in Firstcall Research was prepared by our analysts and it does not constitute an offer orsolicitation for the purchase or sale of any financial instrument including any companies scrips or this is not an officialconfirmation of any transaction. The information contained herein is from publicly available secondary sources and dataor other secondary sources believed to be reliable but we do not represent that it is accurate or complete and it should notbe relied on as such. Firstcall Research or any of its affiliates shall not be in any way responsible for any loss or damagethat may arise to any person from any inadvertent error in the information contained in this report. Firstcall Research and/or its affiliates and/or employees will not be liable for the recipients’ investment decision based on this document.
Analyst Certification
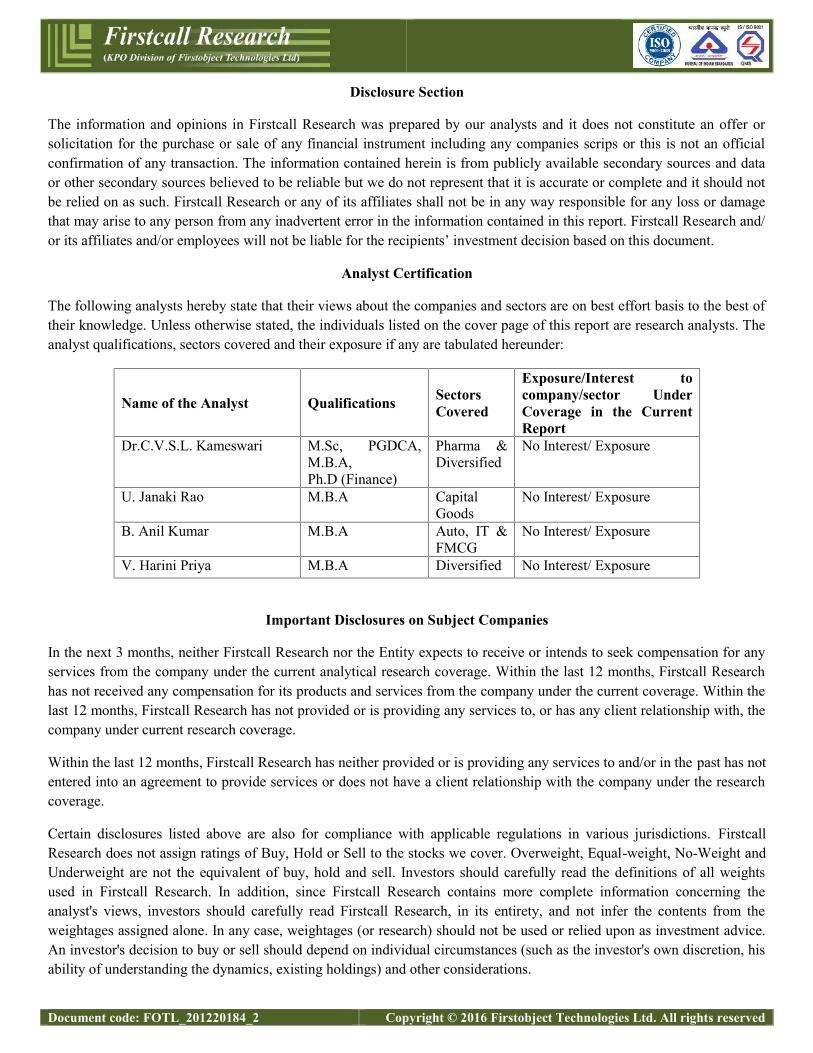
The following analysts hereby state that their views about the companies and sectors are on best effort basis to the best oftheir knowledge. Unless otherwise stated, the individuals listed on the cover page of this report are research analysts. Theanalyst qualifications, sectors covered and their exposure if any are tabulated hereunder:
Name of the Analyst Qualifications SectorsCovered
Exposure/Interest tocompany/sector UnderCoverage in the CurrentReport
Dr.C.V.S.L. Kameswari M.Sc, PGDCA,M.B.A,Ph.D (Finance)
Pharma &Diversified
No Interest/ Exposure
U. Janaki Rao M.B.A CapitalGoods
No Interest/ Exposure
B. Anil Kumar M.B.A Auto, IT &FMCG
No Interest/ Exposure
V. Harini Priya M.B.A Diversified No Interest/ Exposure
Important Disclosures on Subject Companies
In the next 3 months, neither Firstcall Research nor the Entity expects to receive or intends to seek compensation for anyservices from the company under the current analytical research coverage. Within the last 12 months, Firstcall Researchhas not received any compensation for its products and services from the company under the current coverage. Within thelast 12 months, Firstcall Research has not provided or is providing any services to, or has any client relationship with, thecompany under current research coverage.
Within the last 12 months, Firstcall Research has neither provided or is providing any services to and/or in the past has notentered into an agreement to provide services or does not have a client relationship with the company under the researchcoverage.
Certain disclosures listed above are also for compliance with applicable regulations in various jurisdictions. FirstcallResearch does not assign ratings of Buy, Hold or Sell to the stocks we cover. Overweight, Equal-weight, No-Weight andUnderweight are not the equivalent of buy, hold and sell. Investors should carefully read the definitions of all weightsused in Firstcall Research. In addition, since Firstcall Research contains more complete information concerning theanalyst's views, investors should carefully read Firstcall Research, in its entirety, and not infer the contents from theweightages assigned alone. In any case, weightages (or research) should not be used or relied upon as investment advice.An investor's decision to buy or sell should depend on individual circumstances (such as the investor's own discretion, hisability of understanding the dynamics, existing holdings) and other considerations.

Document code: FOTL_201220184_2 Copyright © 2016 Firstobject Technologies Ltd. All rights reserved
Analyst Stock Weights
Overweight (O): The stock's total return is expected to exceed the average total return of the analyst's industry (orindustry team's) coverage universe, on a risk-adjusted basis, over the next 12-18 months.
Equal-weight (E): The stock's total return is expected to be in line with the average total return of the analyst's industry(or industry team's) coverage universe, on a risk-adjusted basis, over the next 12-18 months.
No-weight (NR): Currently the analyst does not have adequate conviction about the stock's total return relative to theaverage total return of the analyst's industry (or industry team's) coverage universe, on a risk-adjusted basis, over the next12-18 months.
Underweight (U): The stock's total return is expected to be below the average total return of the analyst's industry (orindustry team's) coverage universe, on a risk-adjusted basis, over the next 12-18 months.
Unless otherwise specified, the weights included in Firstcall Research does not indicate any price targets. The statisticalsummaries of Firstcall Research will only indicate the direction of the industry perception of the analyst and theinterpretations of analysts should be seen as statistical summaries of financial data of the companies with perceivedindustry direction in terms of weights.
Firstcall Research may not be distributed to the public media or quoted or used by the public media without the expresswritten consent of Firstcall Research. The reports of Firstcall Research are for Information purposes only and is not to beconstrued as a recommendation or a solicitation to trade in any securities/instruments. Firstcall Research is not abrokerage and does not execute transactions for clients in the securities/instruments.
Firstcall Research - Overall StatementS. No Particulars Remarks1 Comments on general trends in the securities market Full Compliance in Place2 Discussion is broad based and also broad based indices Full Compliance in Place3 Commentaries on economic, political or market conditions Full Compliance in Place4
Periodic reports or other communications not for public appearanceFull Compliance in Place
5 The reports are statistical summaries of financial data of the companies as and whereapplicable
Full Compliance in Place
6 Analysis relating to the sector concerned Full Compliance in Place7 No material is for public appearance Full Compliance in Place8 We are no intermediaries for anyone and neither our entity nor our analysts have any
interests in the reportsFull Compliance in Place
9 Our reports are password protected and contain all the required applicabledisclosures
Full Compliance in Place
10 Analysts as per the policy of the company are not entitled to take positions either fortrading or long term in the analytical view that they form as a part of their work
Full Compliance in Place
11 No conflict of interest and analysts are expected to maintain strict adherence to thecompany rules and regulations.
Full Compliance in Place
12As a matter of policy no analyst will be allowed to do personal trading or deal andeven if they do so they have to disclose the same to the company and take priorapproval of the company
Full Compliance in Place
13Our entity or any analyst shall not provide any promise or assurance of any favorableoutcome based on their reports on industry, company or sector or group
Full Compliance in Place

Document code: FOTL_201220184_2 Copyright © 2016 Firstobject Technologies Ltd. All rights reserved
14 Researchers maintain arms length/ Chinese wall distance from other employees ofthe entity
Full Compliance in Place
15No analyst will be allowed to cover or do any research where he has financial interest
Full Compliance in Place
16 Our entity does not do any reports upon receiving any compensation from anycompany
Full Compliance in Place
Firstcall Research Provides
Industry Research on all the Sectors and Equity Research on Major Companiesforming part of Listed and Unlisted Segments
For Further Details Contact:Mobile No: 09959010555
E-mail: [email protected]@firstcallresearch.comwww.firstcallresearch.com