th august 2017 to 12th september 2017 southampton to leith
TRANSCRIPT
i
Cruise Report - RRS James Cook JC152
CHIMNEY – Characterisation of major overburden pathways above sub-seafloor CO2
storage reservoirs in the North Sea.
Scanner and Challenger Pockmark Complexes
25th August 2017 to 12th September 2017
Southampton to Leith
Jonathan Bull, University of Southampton

i
Table of Contents
1 Executive Summary
1
2 Scientific Background
2
2.1 CHIMNEY Programme
2
2.2 Geophysical Field Programme
4
2.3 JC152 Objectives
5
3 Personnel
6
4 Pre-cruise planning
7
5 Cruise Narrative
9
6 Data Acquisition and Equipment Performance
30
7 Recommendations
42
8 Acknowledgements
43
9 References
44
10 Appendices
44
A. Ocean Bottom Seismometer (OBS) deployment and recovery details for Leg 1 (OBS stations 1- 25) and Leg 2 (OBS stations 26-32)
B. Songmeter acoustic recorder configuration
C. Summary of seismic lines acquired during JC152
D. OBS Data QC

ii
List of Figures
Figure 1 Location of all instruments deployed during JC152.
1
Figure 2 Position of the Scanner Pockmark within the UK Sector of the North Sea.
3
Figure 3 Deep tow sparker line collected across the western Scanner pockmark
4
Figure 4 Far-field source signatures of six seismic sources used during JC152.
5
Figure 5 EK60 images which capture the deployment of OBS1 and OBS2 within the western Scanner pockmark.
10
Figure 6 EK60 images of methane flares within the eastern Scanner pockmark at the location of OBS3.
10
Figure 7 Map showing positions of 25 OBS deployed during Leg 1
12
Figure 8 Map showing position of Bolt Asterisk airgun lines.
13
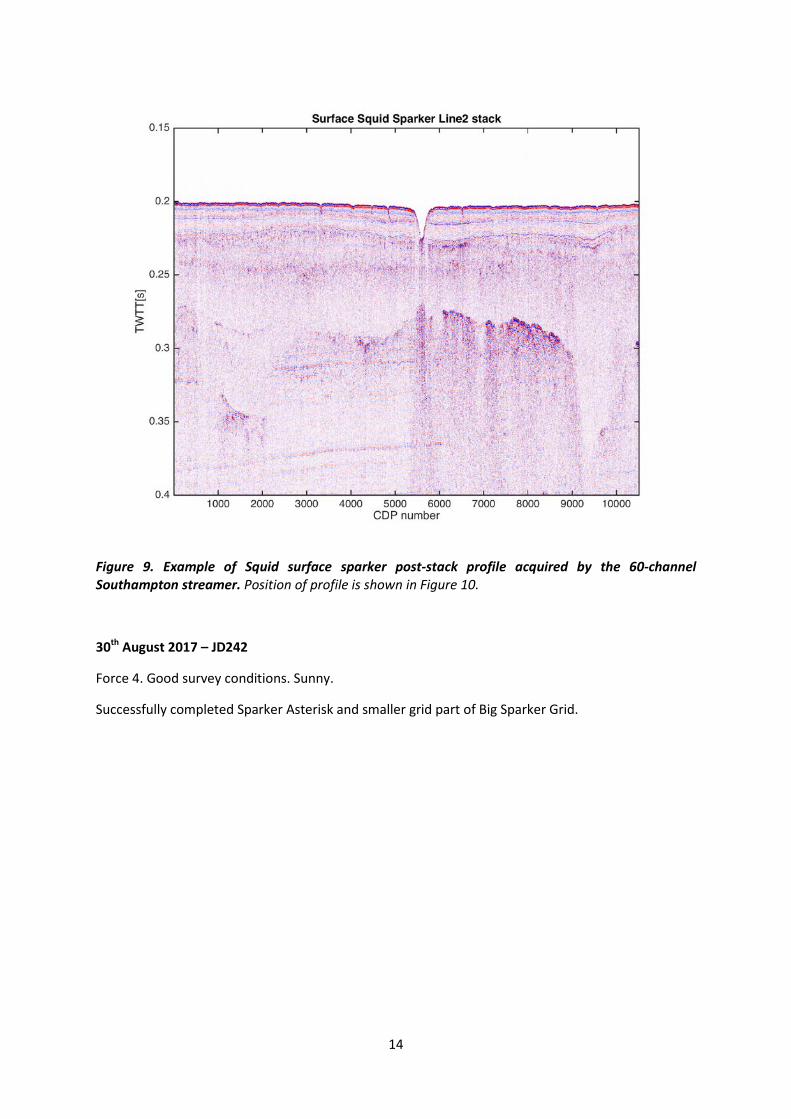
Figure 9 Example of Squid surface sparker post-stack profile acquired by the 60-channel Southampton streamer.
14
Figure 10 Map showing the position of Squid surface sparker asterisk survey
15
Figure 11 Map showing the position of Duraspark surface sparker asterisk survey lines
16
Figure 12 Example of GI-gun pre-stack time migrated profile acquired by the 60-channel Southampton streamer.
17
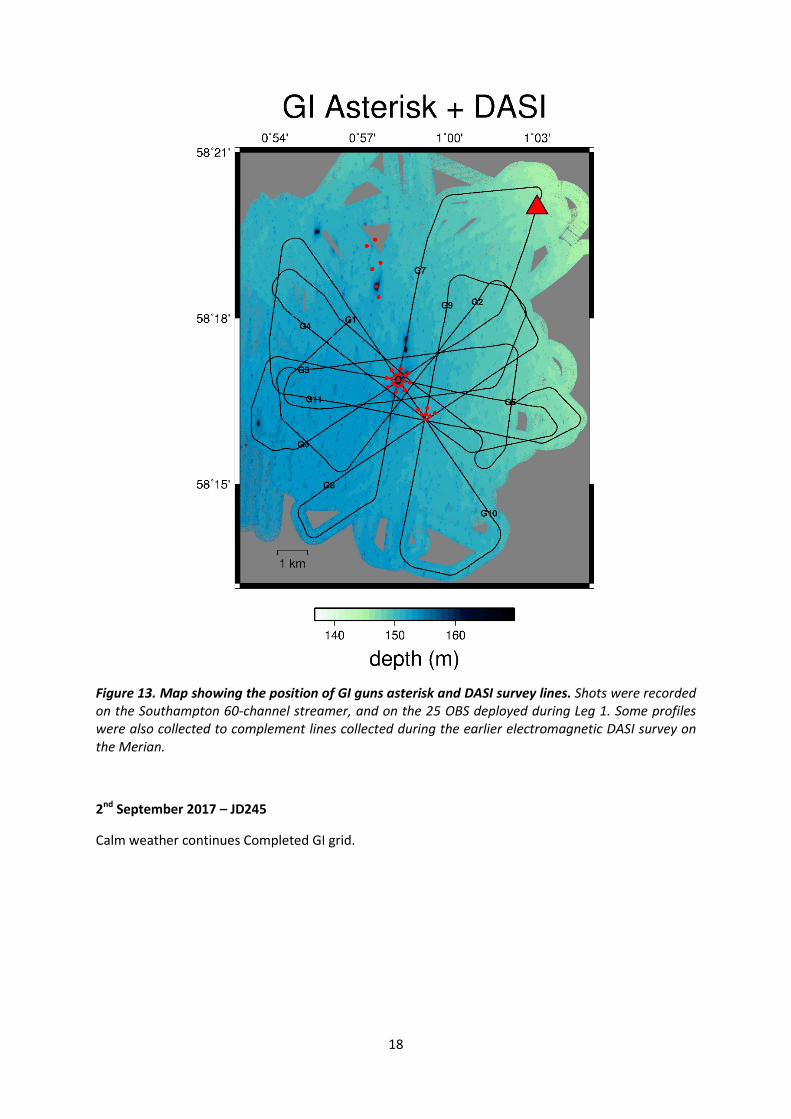
Figure 13 Map showing the position of GI guns asterisk and DASI survey lines
18
Figure 14 Map showing the position of GI guns grid survey lines.
19
Figure 15 Map showing the position of Deep-tow sparker (DTS) asterisk survey lines.
20
Figure 16 Example of Deep Towed Sparker single-channel line.
21
Figure 17 Map showing surface squid sparker grid profiles.
22
Figure 18 Map showing the location of the Bolt airgun grid
23
Figure 19 Graphs showing the sound velocity profiles (SVP) collected during JC152.
25
Figure 20 Map showing location of OBS 25-32 deployed during the second leg of JC152 around Challenger pockmark.
26
Figure 21 Intersecting post-stack GI-gun lines within the pseudo-3D volume.
27
Figure 22 Map showing position of pseudo-3d grid of closely spaced GI gun profiles.
28

iii
Figure 23 Overall acquisition geometry for seismic sources and multichannel streamers during JC152.
30
Figure 24 Triggering configuration for airguns used during JC152.
32
Figure 25 Source signature of each GI gun (above) and far field hydrophone (below).
34
Figure 26 Summary of triggering configuration for sparker seismic sources used during JC152.
35
Figure 27 EM710 transducer locations drop keel flush
38
Figure 28 EM710 transducer locations drop keel lowered
38
Figure 29 EM710 transducer offsets.
39
Figure 30 Sub Bottom Profiler Installation Parameters
40
Figure 31 Sub Bottom Profiler Runtime Parameters.
40
Figure 32 Sub Bottom Profiler Echogram display settings.
40
Figure 33 Sub Bottom Profiler Legend display settings.
40
Figure 34 EK60 datum shift
41
Figure 35 James Cook 152 shipboard scientific party 43
List of Tables
Table 1 RRS James Cook vessel specification
7
Table 2 Summary of the 25 OBS deployments at Scanner Pockmark
11
Table 3 Summary of 7 OBS deployments at Challenger Pockmark
25
Table 4 Key acquisition parameters seismic sources and recording systems
31
Table 5 Positions of Sound Velocity Profiles collected during JC152.
42

1
1. Executive Summary
Cruise JC152 collected the major data sets for the CHIMNEY (Characterisation of major overburden leakage pathways above sub-seafloor CO2 storage reservoirs in the North Sea) NERC highlight topics research programme. The cruise investigated the Scanner and Challenger pock marks in the northern North Sea, which were previously known to be the locations of vigorous Methane venting. The cruise objectives were to collect data that could be used to constrain the geometry and internal structures of fluid flow, “Chimney” structures, with the eventual aim of determining the current permeability of the sub-surface. The cruise successfully completed two anisotropy experiments over the Scanner and Challenger pock marks by shooting various seismic sources into a grid of 25 and 7 ocean bottom seismometers respectively. Five different seismic sources (Bolt airguns, GI guns, Squid surface sparker, Duraspark surface sparker, and Deep Tow Sparker) were recorded by the ocean bottom seismometers, and an acoustic recorder deployed c. 25 m above the seabed. Multichannel seismic reflection profiles were collected with GI guns and both surface sparker sources, and single channel seismic reflection profiles were collected with the Deep Tow Sparker source. Single and multibeam echo sounder data were collected along all seismic profiles.
Figure 1. Location of all instruments deployed during JC152. The red circles show the position of the 25 ocean bottom seismometers (OBS) deployed at the Scanner pock mark and a reference site during the first part of the cruise, and the position of a further 7 OBS deployed around and north of the Challenger pock mark after a port call to Aberdeen. The white crosses show the position of sound velocity profiles taken in the water column, while the yellow triangles show the position of acoustic recorders deployed to the north east of the study area during the first part of the cruise (to record source signatures), and within the Scanner pockmark toward the end of JC152.

2
2. Scientific Background
Cruise JC152 forms part of NERC NE/NO16130/1 highlight topic grant CHIMNEY (Characterisation of major overburden leakage pathways above sub-seafloor CO2 storage reservoirs in the North Sea). CHIMNEY focusses on determining the distribution and permeability of fluid pathways related to gas escape structures in the North Sea. Understanding these pathways is important for the development of Carbon Capture and Storage sites, as the location and potential intensity of any possible CO2 leakage at the seafloor are critically dependent on the distribution and permeability of fluid pathways in the sediment overburden overlying any putative storage reservoir.
Evaluation of seismic reflection data, as part of a recently completed EU project (ECO2), has revealed structures cross-cutting the overburden within the North Sea and Norwegian Sea (Karstens and Berndt, 2015). These seismically-imaged pipes and chimneys are considered to be possible pathways for fluid flow. Natural fluids from deeper strata have migrated through these structures at some point in geological time. If CO2 leaking from sub-seafloor storage reservoirs reaches the base of these structures, and if their permeability is sufficiently high, they could act as CO2 leakage pathways towards the seafloor and overlying water column. To provide a reliable prediction of potential seafloor seep sites, the hydraulic continuity, and especially the permeability of these pathways, needs to be better constrained and quantified.
CHIMNEY will test the hypothesis that many chimney and pipe structures imaged on seismic reflection profiles in the North Sea are the consequence of: (1) a fracture network that has been reactivated by pore fluid pressure which facilitates the migration of fluids upwards; and (2) shallow sub-seafloor lateral migration of fluids along stratigraphic interfaces and near-surface fractures. We will address the critical questions: what is their in-situ permeability now; and could a CO2 fluid use these structures as a conduit for leakage?
We chose to target the Scanner pockmark complex as: (1) existing 3D seismic data demonstrated that there are circular anomalies at depth beneath the pockmark that are unlikely to be seismic artefacts; and (2) there is vigorous and sustained methane venting from the Scanner pockmark.
2.1 CHIMNEY Programme and Scanner Pockmark
CHIMNEY combines a marine geophysical fieldwork programme, and associated rock physics experiments, geochemical characterization and modelling, to constrain chimney physical properties including permeability, potential flow rates and CO2-fluid-rock reactions. CHIMNEY is divided into four work packages. WP1 is the marine geophysical experiment and centrally involves a unique broad-band seismic anisotropy experiment over the Scanner pockmark complex in order to understand its structure and origin, derive fracture geometry and topology and ascertain if fractures are open or closed. The second work package (WP2) will constrain chimney and surrounding rock permeability by rock physics experiments on synthetic samples. The chemical composition of sediments and their pore waters collected from core samples from the Scanner pockmark (WP3) will be used to assess hydraulic connectivity, water-rock reactions that affect permeability and the longevity of fluid flow, and to constrain reactive transport modelling. We will input the parameters derived from WPs 1-3 into the TOUGH 2 fluid flow simulator to compute (WP4) and investigate different scenarios relevant to North Sea carbon capture and storage. To minimize costs and

3
optimize scientific opportunities, the CHIMNEY programme was designed to piggy-back an experiment that was conducted during Horizon 2020 project STEMM-CCS.
The Scanner pockmark complex is located in UK License Block 15/25 (Figure 2), around 190 km east of Scotland within the Witch Ground Basin close to a number of oil and gas condensate fields. The closest field to Scanner is the decommissioned Blenheim Oil Field, which is a heavily faulted Palaeocene sandstone play on the flank of the Fladen Ground Spur (Figure 2). Within the Blenheim field, structure maps of the Late Palaeocene Top Mey Sandstone (Dickinson et al. 2001) show a dominant NW-SE normal fault set.
Figure 2. Position of the Scanner Pockmark within the UK Sector of the North Sea. The Scanner pockmark complex is within the Witch Ground Graben.
The Witch Ground Basin was the locus of rapid fine-grained sediment deposition between 15 and 13 ka after the end of the last glacial period. The soft muds of this formation are affected by large numbers of pockmarks (Gafeira and Long, 2015). Following the stabilisation of sea level after the last glaciation, the Witch Ground has been little affected by erosion or sedimentation, and hence pockmarks at the current seabed show the effects of gas escape over at least the last 6000 years. Although most pock marks are small, less than 2 – 3 m, several studies have identified the presence of large pockmarks within Block 15/25 with very active methane venting (Hovland and Sommerville, 1985; Dando et al., 1991; Judd et al., 1994).
The Scanner pockmark is a Special Area of Conservation (JNCC website, 2018) and has been approved as a Site of Community Importance (SCI) by the European Commission under European Habitats Directive 118. This SCI covers 3.4 km2 and two pairs of pockmarks (the Scanner and Scotia pockmark complexes). In addition further north there are further large pockmarks, the Challenger and Alkor pockmarks. The pockmarks were the focus of a recent desk study (Gaferia and Long, 2015) by the British Geological Survey for the Joint Nature Conservation Committee, which utilised a JNCC 2012 multibeam bathymetry and sidescan datasets. We are grateful to the JNCC for making available the 2012 data for JC152 planning purposes.

4
Within the pockmarks samples of methane-derived authigenic carbonate (MDAC) have been recovered (summarised in Judd and Hovland, 2009). These MDAC deposits are formed by the anaerobic oxidation of escaping methane, cementing sediment grains just beneath the sea-bed, which with the process of continued gas movement across the seabed, become a hard ground. Dando et al. 1991 report that these habitats support specialised fauna which can exploit the methane gas, as well as species of fish which are concentrated within these seabed depressions.
There have been some previous seismic reflection investigations of these pock marks and an analogue example collected in 1983 is shown in Figure 3. However the sources of the gas and relationship to the pockmarks was not well constrained prior to JC152.
Figure 3. Deep tow sparker line collected across the western Scanner pockmark in 1983 (after Hovland and Sommerville (1985) and Gafeira and Long (2015). Methane gas in the water column and within the sub-surface are clearly imaged.
2.2 Geophysical Field Programme
The central aim of JC152 was to measure frequency-dependent anisotropic properties of the Scanner pockmark. This was completed by using ocean bottom seismometers (OBS) to measure the converted shear waves which are known to be essential for characterizing fracture systems. A key component of the technique will be to use five different seismic systems with different source frequencies, in the range 15 Hz to 6 kHz (bolt airguns, GI guns, surface-towed Squid2000 sparker, surface-towed Duraspark sparker and a Deep-Tow Sparker (DTS) source). This approach will provide a unique opportunity to study the frequency-dependence of anisotropy over a much wider frequency range than has been used in previous studies. We deployed 25 OBS centred on the Scanner pockmark and at a reference site that is not affected by the presence of gas. These instruments recorded, with a sampling rate of 4 kHz, every shot from our range of seismic sources, using a hydrophone and three orthogonal geophones. Due to excellent weather we deployed an additional 7 OBS around the Challenger Pockmark.

5
In order that we could fully resolve the geometry of sub-surface fluid flow features we collected normal-incidence seismic reflection profiles using GI guns, two surface-towed sparker sources, and the DTS. The NMEP does not include a multichannel streamer suitable for high-resolution work. We had two multichannel streamers available to us, a 60-channel Southampton streamer, and a 120 channel GeoEel streamer which we hired in from TTS Ltd. Unfortunately significant problems were experienced in operating the GeoEel streamer.
2.3 JC152 Cruise Objectives
The aims of the JC152 were as follows:
1. Deploy 25 Ocean Bottom Seismometers around Scanner pockmark and shoot five different sources on an asterisk and grid of lines into the OBS network. The sources were Bolt airgun array, GI gun array, Squid surface sparker, Duraspark surface sparker and Deep Tow Sparker (DTS). These data would be analysed for S-wave anisotropy, and the broad frequency range would allow determination of fracture properties and permeability.
2. Collect multichannel seismic reflection profiles using GI, Squid and Duraspark sparkers and single channel seismic profiles with the DTS system. These data would allow the geometry of fluid escape structures within the sedimentary overburden to be constrained.
Figure 4. Far-field source signatures of six seismic sources used during JC152. Signatures as measured on a Song meter acoustic recorder deployed c. 30 m above the seabed in 140 m water depth: 1. Bolt Airgun array with frequency spectrum between 5 – 150 Hz, 2. GI Gun array (105/105) with frequency spectrum between 30-200 Hz, 3. Dura-Spark surface sparker with frequency spectrum between 200-1100 Hz, 4. Squid surface sparker with a frequency spectrum from 10 - 1500 Hz, 5. Deep Tow Sparker (DTS) with frequency spectrum between 1000 – 3000 Hz. 6. Hull mounted Chirp sub-bottom profiler, here auto-correlated zero phase Klauder wavelet, frequency spectrum is between 2.5 kHz- 6.2 kHz. Figure courtesy: Ed Jones (2018).
105/105
Deep Tow Sparker (DTS)

6
3. Collect along-track sub-bottom profiler, EK60 and EM710 bathymetry. These data would be analysed to understand the seabed relief and distribution of gas within near-surface sediments and the water column.
4. Collect passive acoustic data using a Songmeter system to (a) record seismic source signatures and (b) the sounds associated with methane bubbles escaping from the seabed.
Due to excellent weather and little equipment down-time we were also able to: 5. Deploy 7 Ocean Bottom Seismometers around Challenger pockmark and shot GI gun array
and surface Squid sparker into them. 6. Collect a pseudo-3D grid of GI gun and Squid sparker profiles over both the Scanner and
Challenger pockmarks, and a tunnel valley complex north of the pockmarks.
3. Personnel 3.1 Ship’s Officers and Crew
John Leask (Captain) Stewart MacKay (First Officer) Malcolm Graves (2nd Officer) Sean Hoxby (3rd Officer) Robert Doyle (Chief Engineer) Lawrence Porrelli (2nd Engineer) Noel Doherty (3rd Engineer) Edin Silajdzic (3rd Engineer) Christopher Howard (ETO) Paula McDougall (Purser) Martin Harrison (Chief PO, Scientific) Thomas Gregory (Chief PO, Deck)
Emlyn Williams (Engine Room PO) Stephen Day (Seaman) Ronald MacDonald (Seaman) Kevin Riley (Seaman) Jason Reynolds (Seamen) Darren Caines (Head Chef) Christopher Keighley (Chef) Peter Robinson (Steward) Kevin Mason (Assistant Steward) Charley Jess (Cadet) Thomas Quinn (Cadet) Paul McLaughlin (Cadet)
3.2 Science Party
Jonathan Bull (PSO, Southampton) Tim Henstock (Southampton) Gaye Bayrakci (Southampton) Mark Chapman (Edinburgh) Hector Moreno (NOC) Bhargav Boddupalli (PhD, Southampton) Phil Cilli (PhD student, Edinburgh) Dan Ellis (Undergraduate, Southampton) Zhaoyo Jin (PhD student, Edinburgh) Vanessa Monteleone (PhD, Southampton) Ben Ollington (Undergraduate, Southampton) Ben Owen (Undergraduate, Southampton) Giuseppe Provenzano (PhD, Southampton)
Anna Bird (OBIC) Andrew Clegg (OBIC) Ben Pitcairn (OBIC) Martin Weeks (OBIC) Joshua Hancock (Eel Gun Technician) Iain Miller (Eel Gun Technician) Matt Poxon (Applied Acoustics Ltd) Andrew Leadbetter (NMF) Mark Maltby (Sea systems) Ian Murdoch (NMF) Thomas Roberts (NMF) Matthew Smith (NMF) Matt Poxon (Applied Acoustics Ltd)

7
3.3 Vessel Specification
An overview of the particulars of the vessel are given below.
Name: RRS James Cook Type/Class: Lloyds +100 A1 Ice Class C1 + LMC, UMS, DP
(AM), “Research Vessel” Nationality (Flag State): British Identification Number (IMO/Lloyds No.): 9338242 Owner: Natural Environment Research Council Operator: National Marine Facilities Sea Systems Overall length (metres) 89.2 m Maximum draft 6.32 m Displacement/Gross tonnage Net tonnage – 1620; Gross tonnage 5401 Propulsion: Wartsila Diesel Electric Cruising and maximum speed: 10 Knots Call sign MLRM6 INMARSAT number and method and capability of communication (including emergency frequencies)
773238783 – Voice 783255430 – Fax 423501712;jame x - Telex
Table 1. RRS James Cook vessel specification
4. Pre-cruise Planning
4.1 Permissions
Whilst for working in territorial waters of other nations, there is a standardised process managed by National Marine Facilities, this is not currently the case in UK waters. We therefore describe here briefly the process that was followed. For UK water one would normally expect to consult the Marine Management Organisation (MMO) regarding permissions required. However, the MMO deals only with England and Wales. Permissions for Scottish waters are administered by Marine Scotland, and the process is different and more involved than that required by the MMO. A seismic experiment such as that conducted during cruise JC152 requires two different licenses: a Marine License and an EPS license (permission to disturb European Protected Species). License applications should normally be submitted at least 14 weeks before the start of the cruise. However, we only became aware of these requirements in early July 2017, about six weeks before the start of the cruise. Forms for licensing applications can be found on Marine Scotland’s website, but advice is needed regarding which licenses must be applied for – this is not obvious from the website.
A Marine License is required for any activity that will leave materials on the seabed, and therefore is required for deployments of seabed instrumentation if an anchor weight is left behind at the end of the experiment. The application process involves a short form and a fee that is determined by the “value” of the associated activity. Assessment of value involves some degree of subjectivity, but for a scientific research application, this value can be taken as the value of the consumables involved. The application specifies the number of deployments; a revised application was therefore required when further deployments were added to the original plan.
An EPS License is required for any work involving acoustic or seismic sources operating at frequencies below 100 kHz. The EPS License application is a more substantial form that requires

8
details of all seismic and acoustic sources, including estimates of sound levels. A full environmental impact assessment must be attached, and proposed acoustic and seismic work must also be entered in the “Noise Registry”. The license applications were completed about five weeks before the cruise and submitted together to Marine Scotland, along with “notifications” which are required for any equipment deployment of more than six months, and for sediment coring. The latter two activities were originally planned as part of the cruise but later cancelled. Following submission, Marine Scotland consult various other organisations that can specify conditions on the licenses. We were given an opportunity to respond to these conditions before the license was finalised.
4.2 Environmental Considerations
We gave careful consideration to minimise the environmental impact on marine mammals. We followed JNCC’s 2017 guidelines and used the following procedures/mitigation measures in accordance with EPS License 23/2017:
1. All marine mammal observation was conducted by observers who had completed a JNCC-approved training course. Observations were conducted from the vessel’s bridge deck, which was the highest area normally accessible at sea, and had unobstructed visibility in all directions.
2. The EM710 swath bathymetric system, SBP120 sub-bottom profiler and EK60 were switched on during the final approach to the survey area, which is all in water depths of less than 200m. The systems were started up in daylight hours and a 30-minute pre-shooting survey was conducted by qualified marine mammal observers. These systems then remained in operation throughout the survey period. During 4th-6th September, the vessel had to leave the survey area in order to pick up spare parts in Aberdeen; the above process was repeated on return to the survey area. The various sparker sources used during the survey operated at similar (or lower) source levels and similar frequencies to the sub-bottom profiler.
3. Additional pre-survey searches (30 minutes) and soft starts (30 minutes) were used for both the GI and Bolt airgun sources. Configurations of the GI gun source on the first part of the survey was two guns in harmonic mode with 105 cu. in. generator and 105 cu. in. injector volumes (2x210 cu. In.) . After the reducer inserts were picked up in Aberdeen, the guns were used as 2 x 150 cu in GI true mode (Generator 45 cu. in./Injector 105 cu. in.). The final configuration of the Bolt airgun source involved chamber sizes of 400 cu. In., 200 cu. In. and 100 cu. in., to give a total of 700 cu. in. Both sources were operated at a pressure of 2000 psi. Airgun shooting was only started during daylight hours.
4. Although not a JNCC requirement, marine mammal observation was continued during all daylight hours when airguns were being fired, in order to provide a more complete record of any sensitive species. Individual observers worked one-hour shifts to mitigate fatigue. Because of the nature of the surveys (shooting at regular time intervals into fixed seabed receivers), shooting continued throughout the active period for each source.
5. For the Bolt airgun source, the soft start involved shooting first the 100 cu. in. gun on its own for 15 minutes, then the 100 cu. in. and 200 cu. in. gun for a further 15 minutes, and then the full array of three guns.
6. For the GI gun source, the soft start involved shooting a single gun for 30 minutes and then shooting both guns.
There was only one marine mammal sighting during JC152 at 15:35 UTC on 8th September at 53° 19’ 40’’N, 00° 58’ 46’’ E.

9
5. Cruise Narrative (all times GMT)
Thursday 24th August 2017 – JD236
The JC152 CHIMNEY mobilisation in Southampton was managed by Jon Short and Jez Evans, and went without incident. The hired STR winch for the deep tow sparker was welded to the deck during the afternoon. The Science Party boarded RRS James Cook in the late afternoon.
Friday 25th August – Departure and Transit – JD237
The ship departed Empress Dock, Southampton into a calm sea at 10:00. The rest of the day was devoted to setting up systems on board.
Saturday 26th August – Transit – JD238
Flat calm sea. The science team were briefed in the morning by the PSO. Pressure tests on gun cabling done completed in the afternoon. A watchkeepers brief was completed at 13:00 including the approach to Marine Mammal Observation. Preparatory works continued.
Sunday 27th August – Transit, start of work – JD239
Calm. The mini-lander was rigged with programmed acoustic recorder. The surface sparker cables were run across the deck to the surface catamaran. Various seismic trigger combinations were tested. 14:00 Scientific Watches start
14:30 OBIF dip tests. En route when > 100 m water depth.
16:00 Marine Mammal Observation started before main ship’s acoustic systems switched on.
17:00 Switched on bathymetry and profiler
21:06 Sound Velocity Profiles collected at OBS 1 and OBS 25 positions
21:47 Multibeam EM710 Swath patch started
Monday 28th August – JD240
Fair weather, but swell grew through the day to 2 m.
01:05 OBS deployments commence at Scanner Pockmark. OBS 1 and OBS 2 were within the western Scanner pockmark, OBS 3 in the eastern Scanner pockmark.

10
Figure 5. EK60 images which capture the deployment of OBS1 and OBS2 within the western Scanner pockmark. Vessel is stationery and the lower axis is time – note the clear linear return from the instrument as it sinks, and the release of trapped air around 60 m depth.
06:47 All OBS deployments complete. Notable gas flares seen on EK60 18 kHz at OBS3.
Figure 6. EK60 images of methane flares within the eastern Scanner pockmark at the location of OBS3.

11
Deployed acoustic recorder (Songmeter) at 1° 03.018’ E, 58°20.011’N, in 143 m of water. We set gains on two channels as 0 dB (left channel) and 6 dB (right channel). 12 D-cells. Total height of deployment 25 m. 44 kHz sampling. 5 mins on, 5 mins off. Time synched to GPS clock. Recording set to start at 12.00 on 28th August. Memory capacity good until 12.00 on 6th September. See appendix for more information on configuration of the acoustic recorder.
site_id deployed_latitude deployed_longitude deployed_depth (m) datalogger_id 1 58.2812 0.9708 167.3 129 2 58.2815 0.9709 167.1 113 3 58.2827 0.9749 165.7 135 4 58.2833 0.9769 152 115 5 58.2816 0.9671 150.9 111 6 58.2809 0.9742 152 136 7 58.2797 0.9727 152.2 107 8 58.2794 0.9701 153.9 125 9 58.2802 0.9679 152.6 122
10 58.2827 0.9689 153 126 11 58.283 0.9715 156.1 110 12 58.2805 0.9774 150.5 123 13 58.2782 0.9746 151.1 131 14 58.2778 0.9695 151.7 138 15 58.2793 0.9649 151.5 124 16 58.2819 0.964 151.2 108 17 58.2842 0.9669 151 119 18 58.2847 0.972 151.8 139 19 58.2693 0.986 149.6 128 20 58.2708 0.9841 149.9 112 21 58.271 0.9868 150 109 22 58.2703 0.9889 149.2 137 23 58.2723 0.9822 150.1 117 24 58.2731 0.9874 149.5 121 25 58.2713 0.9917 149.6 130
Table 2. Summary of the 25 OBS deployments at Scanner Pockmark

12
Figure 7. Map showing positions of 25 OBS deployed during Leg 1. 18 of the OBS locations surround the Scanner pockmark complex, while 7 are deployed south-east of the Scanner pockmark at a reference site not affected by fluid flow.
09:33 Deployed deep-tow sparker (DTS) and let out sufficient wire to be at 110 m water depth.
10:10 Issues with powering DTS… Does not come up to 100 V. Bring Deep-tow back onto ship for inspection. Conclusion that the winch requires a new termination.
c. 11:00 Decision to move to deploy surface Sparker with TTS streamer.
12:00 – 13:00 preparing TTS streamer, however became apparent that there was a problem with connecting to the streamer.
Weather building to 2 m swell and short period, too rough for streamer surveys. Uncomfortable.
13:00 Decision made to move to do Bolt Airgun survey without streamers. Marine Mammal observation started.
13:45 Bolt Airguns deployed with the array comprising three guns of capacity 100, 200 and 400 ci.
14:05 Soft start over 30 minutes after MMO completed for 1 hour.
14:52 Starting with Line B1. Heading south, turning to mover vertically above passive acoustic recorder, then moving to Point I which will start B2. Completed Bolt Asterisk survey

13
Tuesday 29th August 2017 – JD241
Sea state improved over night. Calmer. Sea state improved throughout the day.
Figure 8. Map showing position of Bolt Asterisk airgun lines. These lines were collected without a surface streamer, with shots recorded on the OBS deployed during the first leg. The second leg OBS were not deployed during the bolt airgun deployments.
Bolt airguns had no misfires overnight and timing was within 0.1 ms. Started Bolt grid survey. Decision taken to suspend this survey and bring in guns, and commence streamer surveys.
08:30 End of Line B11. Bring in Bolt guns.
Deployed Squid Surface Sparker and Southampton streamer. Sparker energy 2000 J, 2 second shot interval, into 60 channel Southampton system. Data quality is good.
11:07 successfully collecting multichannel sparker data. Sparker Asterisk survey followed by Sparker grid survey.
14
Figure 9. Example of Squid surface sparker post-stack profile acquired by the 60-channel Southampton streamer. Position of profile is shown in Figure 10.
30th August 2017 – JD242
Force 4. Good survey conditions. Sunny.
Successfully completed Sparker Asterisk and smaller grid part of Big Sparker Grid.

15
Figure 10. Map showing the position of Squid surface sparker asterisk survey. Shots recorded on the Southampton 60-channel streamer, and on the 25 OBS deployed during Leg 1.
08:15 Recovered squid sparker. Toolbox talk Duraspark. The system is very similar to Squid sparker but catamaran is substantially heavier.
09:03 Deploy DuraSpark surface sparker. 2000 J at every 2 seconds. 30 m behind stern. Recording into Southampton Streamer. (NB Squid was 33 m behind).
9:08 Soft start 500 J, 1000 J then to 2000 J.
9:15 start line on full power. All good. Clean data.
13:47 surveyed over passive acoustic recorder position

16
Squid sparker tips cut back.
31st August 2017 JD243
Calm overnight with continuous Duraspark profiles. Sunny today.
Figure 11. Map showing the position of Duraspark surface sparker asterisk survey lines. Shots were recorded on the Southampton 60-channel streamer, and on the 25 OBS deployed during Leg 1.
10:01 Over acoustic recorder position with Duraspark
10:04 End of Duraspark survey
Deploy two GI guns.
9:43 Soft start
10:14 Full power. Line G1
GI guns as 2*105/105 (not as requested 45/105). @ 2 m depth, 38 m to front of beam. Deep tow block retermination completed in the afternoon.

17
1st September 2017 - JD244
Very good weather. GI guns and Southampton streamer working well.
09:30 Decision taken on basis of promax analysis to put back streamer 8 – 10 m to increase far offset.
Completed GI asterisk survey now on GI grid.
Figure 12. Example of GI-gun pre-stack time migrated profile acquired by the 60-channel Southampton streamer. Position of profile shown in Figure 13.
18
Figure 13. Map showing the position of GI guns asterisk and DASI survey lines. Shots were recorded on the Southampton 60-channel streamer, and on the 25 OBS deployed during Leg 1. Some profiles were also collected to complement lines collected during the earlier electromagnetic DASI survey on the Merian.
2nd September 2017 – JD245
Calm weather continues Completed GI grid.

19
Figure 14. Map showing the position of GI guns grid survey lines. Shots were recorded on the Southampton 60-channel streamer, and on the 25 OBS deployed during Leg 1.
12:19 Recovered GI guns
12.57 Deploy deeptow with new termination. Collecting high-quality deeptow data.
Deep tow working well but in line turns the cable interfered with Southampton streamer cable. Decision made to bring in Southampton streamer. During this time a problem was found with the STR winch – the smaller power unit was not able to pull in the Deep Tow. This was fixed by switching Winch power units to the larger supplied unit.
17:30 bring in multichannel streamer.
19:00 collecting deep tow. Watchkeepers instructed how to collect DTS data with the CODA recording system. Acquiring small deeptow Asterisk survey.

20
Figure 15. Map showing the position of Deep-tow sparker (DTS) asterisk survey lines. Data was recorded on a deep-tow single-channel streamer, and on the 25 OBS deployed during Leg 1. Note several DTS lines were shot multiple times due to various issues encountered with winch terminations and weather.
22:11 to 22:13: Deep tow over passive acoustic recorder.

21
Figure 16. Example of Deep Towed Sparker single-channel line. (Figure courtesy: David Norris)
3rd September 2017 - JD246
Wind picking up noticeably. Sunny. Finished Deep tow asterisk and starting detailed sparker grid. 20 minutes line plus 1 hour line turns.
Succeeded getting tow fish depth in as “water depth” on DTS18 into Coda system. DTS19 excellent line with depth information in CODA segy over pockmark.
12:30 End of detailed DTS grid
12:45 Recovered Deep tow

22
Figure 17. Map showing surface squid sparker grid profiles. These lines were collected with the Southampton streamer, with shots recorded in the Leg 1 OBS around the Scanner pockmark. Note the leg 2 OBS were not deployed during this survey.
12:55 Deployed surface squid sparker to ensure that we had successfully travelled across songmeter acoustic recorder location.
14:51 Above passive acoustic recorder with Surface sparker
15:03 Recovered surface sparker
15:30 Popped mini-lander.
15:48 Mini-lander on board
Started MMO observation
16:30 Deployed Bolt airguns. Soft Start

23
4th September 2017 - JD247
Gusting 25 knots, choppy seas. Bolt airgun grid continuing fine overnight.
08:45 Big shot controller PC (not big shot) has crashed. Some break in knowledge of SPs.
09:30 workaround found for controller PC issue.
13:55 Sea state had deteriorated to such a degree that Captain determined we should bring in airguns. 18 lines in Bolt grid completed out of 26. Overall good representative coverage completed.
Figure 18. Map showing the location of the Bolt airgun grid. This grid was shot without a streamer into the 25 OBS around the Scanner pockmark and the reference location. Note that the northern OBS around the Challenger pockmark were only deployed after the bolt grid was completed.
Hove-to to ride out gale.
5th September 2017 – JD248
Rough weather till c. 3 am. Improving weather thereafter.
02:38 Sound Velocity Profile at OBS11 position.
03:23 First OBS recovery.
11:30 Final OBS recovery.

24
12:30 – 18:30 Regional bathymetry and sub-bottom profiling in improving seastate, but still rough seas.
18:30 Break off survey to go to Aberdeen for TTS streamer part.
6th September 2017
Calm, sunny day.
06:30 arrived Aberdeen. Awaiting replacement parts for TTS streamer deck unit and deck cable.
08:00 Replacement parts on board. Crew member gone ashore for medical treatment.
11:30 All onboard returning to survey area.
c. 16:00 news that a personal emergency for a crew member meant we had to return to Aberdeen to offload that person.
c. 21:00 Aberdeen again.
21:30 Leave Aberdeen for second time after offloading crew member.
7th September 2017 – JD 250
06:30 Sound Velocity Profile at OBS30 location. This is the second OBS area investigating the Challenger Pockmark, channel system and fault structure.

25
Figure 19. Graphs showing the sound velocity profiles (SVP) collected during JC152. The red line is the average depth profile.
07:00 Start deploying 7 OBS.
site_id deployed_latitude deployed_longitude deployed_depth (m) datalogger_id 26 58.3093 0.958 165.8 129 27 58.3147 0.956 149.2 138 29 58.3165 0.9607 149.7 107 30 58.3217 0.9527 150.7 126
31A 58.3236 0.9573 149.1 139 31B 58.3237 0.9575 149 113 32 58.3063 0.9597 150.2 110
Table 3. Summary of 7 OBS deployments at Challenger Pockmark
08:40 Last OBS deployed.

26
Figure 20. Map showing location of OBS 25-32 deployed during the second leg of JC152 around Challenger pockmark.
8:45 Deployed TTS streamer with tailbuoy. GeoEel set at 1 second record length and 0.125 second sampling.
09:16 Deployed Squid Surface Sparker.
09:29 Sparker on full power
10:00 Recovered front of streamer and weighted down front.
10:42 Started Sparker line 101 (I-J, Asterisk), but streamer towing very close to surface
11:35 End of line 101. Bring in streamer completely. All flotation removed.
12:30 Redeployed streamer to complete surface asterisk lines, before starting new grid lines through both Scanner and Challenger pockmarks.
13:08 Started Line S102. Streamer is now much deeper and data looks cleaner.
15:30 Collected data at 1750J squid sparker as keeps on cutting out at 2000 J. Doing asterisk lines through the main pock mark then some east-west and key north south lines
Friday 8th September – JD251
Winds dropped overnight. Slight swell, low winds.
Collected good TTS streamer data with sparker overnight. Tail buoy communications failed, have not managed to restart. Not worth bring in streamer.

27
05:50 sparker off.
05:55 Sparker recovered
MMO started
06:05 GI guns in. Soft start. Shooting every 6 seconds using GI reducers so volumes are 2* 45/105.
3 second recording on GeoEel. Watchkeepers and PSO going to cover for missing gun tech during 12 noon to midnight watch.
09:00 Deployed second “Southampton” streamer. Going to do 25 m GI grid with 4 E-W crossing strike lines.
Figure 21. Intersecting post-stack GI-gun lines within the pseudo-3D volume. (Figure courtesy: H. Birinci)

28
Figure 22. Map showing position of pseudo-3d grid of closely spaced GI gun profiles. These profiles were collected with two streamers, with line spacing c. 25 m. Note that only the northern OBS grid was down during the pseudo-3D grid survey. Lines were designed to cover both the Scanner and Challenger pockmark complexes, as well as northern tunnel valley, and possible position of a buried fault.

29
Saturday 9th September – JD252
Calm sea conditions, very slight swell. Continued GI guns with both streamers overnight and throughout day.
10th September 2017 – JD253
Continued with GI guns with both streamers. Calm sea conditions. However weather deteriorated in the evening. Have completed centre of 3D grid with 25 m spacing, 50 m to east of centre, and c. 100 m to west. Completing one line to complement DASI survey where seismic data from Merian was not complete.
15:30 Bring in both streamers and then GI guns.
16:00-16:45. Choosing deployment position of passive acoustic recorder on the Mini-lander (second deployment) with Songmeter 1 m above its base. We had chosen a line based on multibeam bathymetry water column data (looked through all data in Caris). Ship went along c. 50 m line and we chose co-ordinates where the flare was most intense. These co-ordinates were then used by the Bridge to dynamically position the stern of the vessel over the position. 16:41 Lander deployed @ 58° 16.901’N; 0° 58.237’ E
17:15 Preparing to recover OBS.
17:52 First OBS recovered.
19:50 Last OBS recovered.
19:30 Deployed Deep-Tow. Going to do some regional profiles
21:30 Seastate building considerably: 2 – 3 m swell. During a turn ships speed varied a lot and during this turn the power to the Deep Tow was lost. We thought that it was likely that the termination had failed again, and we brought the deep-tow in. During the recovery of the Deep Tow there were major problems with the winch, with spooling of the winch broken.
Monday - 11th September 2017 – Recovered mini-lander, transit - JD254
2-m swell and uncomfortable overnight.
06:00 Ship more than 5 km away from acoustic recorder (on the mini-lander).
06:20 All acoustic systems turned off for 10 minutes and ship still.
c. 07:15 Recover minilander
08:00 Depart survey area for Leith. Packing up commenced on Main Deck
Tuesday 12th September 2017 – JD255
7:45 Arrived Leith. Demobilisation mostly completed on 12th September, including sending back the hired in winch to Great Yarmouth.

30
6. Data Acquisition and Equipment Performance
6.1 Overall seismic data acquisition geometry during JC152
Figure 23. Overall acquisition geometry for seismic sources and multichannel streamers during JC152.

31
Table 4. Key acquisition parameters seismic sources and recording systems
6.2 Summary of Ocean Bottom Seismometer Deployments
OBIC deployed 32 LJ1 Ocean Bottom Seismometers spread over two deployments. The OBS were configured with metal anchor weights, a 3-axis gimballed geophone pack consisting of Sercel L28 geophones, and a Hi-Tech HTI-90-U hydrophone. The data was recording using an LJ1-type datalogger, configured to record at 4000 samples per second, and using geophone gains of x64 and a hydrophone gain of x2. The first 25 instruments were deployed for approximately 8 days and recorded approximately 50 GB of raw data each. The raw data was processed to SEG-Y, using a trace length of 8 s for the Bolt/GI shooting, limited by the total number of samples available in a SEG-Y record. The sparker data was processed using 3 s traces for the Duraspark and Squid Sparker (50% overlap), and 2 s traces for the Deep Tow Sparker (100% overlap). When processed to SEG-Y, this
Key Acquisition Parameters Seismic Sources and Recording SystemsTow position
Seismic Sources Firing Interval Depth behind stern Bolt Airguns 700 ci (100, 200 and 400 ci guns) 10 seconds 10 - 12 m 48 m
GI gunsMain Survey 420 ci (2x10⁵/105) 8 seconds 2 m 38 m3D Grid 300 ci (2x45/105)) 6 seconds 2 m 38 m
Surface SparkerSquid 2000 or 1750J 2 seconds Surface 33 mDuraspark 2000 J 2 seconds Surface 30 m
Deep Tow SparkerDTS 300J 1 second 100 - 130 m Variable
Source Recording ParametersBolt Airguns Only recorded on OBS
GI Guns Strataview: 0.5m s sample interval, 3 second record lengthGeoeel: 0.25ms sample interval, 3 second record length
Surface Sparker Strataview 0.125 ms Sample interval, 0.5 second record lengthGeoeel:0.125 ms Sample interval, 1 second record length
Deep Tow Sparker Strataview: 0.125 ms sample interval, 0.225 record length, 0.1 s delayCoda:0.052 ms samle interval 0.2 second window length
Seismic acquisition system and streamer detailsStrataview: 60 channels recording, 1-m group interval; 36 or 44 m from tow point to front of first groupGeoEel : 120 channels, 1.56 m group interval; 75 m from tow point to front of first group,

32
yielded 43 GB of SEG-Y data consisting of a total of 810,692 traces over the four channels. All instruments recorded without errors. The instruments were deployed using a Seacatch TR-5 drop mechanism, rigged from the starboard parallelogram. During the first leg, 25 OBS were deployed between 01:28 and 06:50 on 28/08/17 around or close to Scanner pockmark. The recovery took an average of 8 minutes to rise from seabed to surface, and were brought on board by grappling the stray line attached to the instrument and winching it onboard. The overall pace of recovery was one instrument every 20 minutes, and took place between 03:24 and 11:21 on 05/09/17. During the second leg 7 OBS were deployed around and north of Challenger pockmark between 06:53 and 08:38 on 07/09/2017 and these instruments were recovered between 18:30 and 19:49 on 10/09/2017.
6.3 Seismic Air gun report
During JC152 two different types of airgun sources were used: Bolt Airguns and GI guns. The Bolt airguns were not used in conjunction with a streamer during JC152, these shots were recorded in the OBS deployed during Leg 1. The GI guns, as well as being recorded by the OBS, were recorded on two different multichannel streamers. There were no gun breakdowns with either type of source during the survey.
Figure 24. Triggering configuration for airguns used during JC152. The Big Shot and Avalon systems responded passively to the OBIC clock and the output time from these units was the time that should have driven the gun firing time.
Bolt Airgun
During JC152 an array of 3 x Bolt airguns was used comprising: (gun 1) 400 cu. in. furthest aft, (gun 2) 100 cu.in. in the middle of the array and (gun 3) 200 cu.in. forward and were operated at a nominal pressure of 2000 psi. These were towed on a steel beam gun frame at 48 m behind the vessel (to

33
centre) and at a tow depth of 10 m. A large buoy was shackled onto the aft of the frame to keep them at the desired depth. The guns were fixed with 1m of chain that secured to the frame. On this system, 2 depth sensors were installed on the frame at gun 1 and gun 3. This was to ensure that keep the guns were at a good depth at all times. For most part of the survey they stayed constant at the appropriate target depth of 10 m. Over the duration of the survey, depending on weather, current direction and vessel speed, the depth sensors gave readings between 9 m - 12 m. The guns were fired at a rate once every 10 seconds.
The gun controller used for the Bolt airgun operations was Bigshot (manufactured by Real Time Systems, RTS). The Bigshot system was set up in the Deck Lab and connected to the PC hydrophone recording system in the Main Lab by Ethernet cable using the ships switch ports. The system comprises two components: the controller module and power supply unit. The connections we used for our operations to the controller module consist of 2 BNC trigger cables, one sending a TTL 5v pulse, from the GPS master clock, the other from the CTB output to the GPS clock that was logging shot instants. To communicate between the controller unit and the PSU is a serial cable, each PSU can handle up to 4 airguns. Into the PSU are the cables coming from gun umbilical, via a junction box. Sensors, solenoids, hydrophones and depth sensors connect into here.
During survey, a total of 4 logs were recorded each line: a seg-y file, dat file and 2 log files. Each log provides different information and statistical analysis of the gun along with data recorded from the near field hydrophone.
During the first Bolt survey it became clear that no signal was being recorded for the near field phone due to incorrect wiring in a junction box. This was rectified for the second set of Bolt Airgun firing. The Bolt Airguns worked reliably during the cruise, although the source signature is mediocre. The PC for the Bigshot completely failed and died in the later stages of the survey. A work around was found using the Bigshot DOS operating system by connecting a monitor and keyboard directly into the controller module. No data files and logs could be recorded and taken off at this point. Due to this hardware failure, some log files were irretrievable.
GI guns
The majority of the airgun shooting used two Sercel GI guns. For the first part of the survey, prior to the port call in Aberdeen, the guns were set up as 2 x 210 cu.in. GI harmonic mode, Generator 105 cu.in./Injector 105 cu.in. fired at a nominal pressure of 2000 psi, with 8 second firing interval. The guns were towed on a 3 m steel beam gun frame, with 39.5 m from the stern of the vessel to the centre of the beam at a tow depth of 2 m. Gun separation on the beam was 2.1 m. The frame was held at depth by a large A5 buoy with a 1 m strop onto the aft of the frame. From the frame to the guns there was a 1 m length of chain attached to source.
After the reducer inserts were picked up in Aberdeen, the guns were used as 2 x 150 cu.in GI harmonic true mode Generator 45 cu.in./Injector 105 cu.in. at a pressure of 2000 psi, with 6 second firing interval. When shooting the 3D site, the SPI was reduced to 6 s. Modelling of source signatures before the cruise had suggested that a broader frequency spectrum could be produced using the 45/105 cu.in. combination.

34
For the GI guns, the recording system used was RSS2 (manufactured by Avalon Sciences). Gun signatures are shown on the acquisition screen (see Fig 25), as well as the peak voltage for each gun and the timing error in ms. Throughout the survey the near field bottle hydrophone (AGH-7100T ) displayed a stable and impressively temporally short overall gun array source signature. A GPS timestamp was run from the RSS2 system and synced with the GPS clock. The RSS2 sent triggers to both the guns and also a timebreak (TB) pulse which went from our trigger junction box to the streamer recording systems. The gun timing had a 50 ms aim point delay for the correct firing of the GI guns, with the Injector having a +57 ms delay.
A total of 3 files for each line were saved, a seg-y file of the near field hydrophone, a .txt file which displayed the statistics of the line, misfires, timing errors etc. and an Excel spreadsheet which summarised the number of shots along each line, GPS start times, and corresponding record number for the multichannel seismic acquisition systems (Strataview and/or GeoEel).
Figure 25. Source signature of each GI gun (above) and far field hydrophone (below). Image as shown on board the RSS2 unit.
6.4 High Frequency seismic systems – Sparkers
A central component of JC152 was the use of three different high frequency sparker seismic sources. manufactured by Applied Acoustics Ltd: Deeptow DTS-500, Duraspark 400 and the Squid 2000 system. The DeepTow and Duraspark systems were supplied by Applied Acoustics ltd, together with a technical staff member, Matt Poxon. The Squid 2000 system is owned by the University of Southampton. JC152 was part of a collaboration between the University of Southampton and Applied Acoustics Ltd. All three systems worked well during the cruise, and the only issues were with the winch system used to deploy the Deep Tow sparker.

35
Figure 26. Summary of triggering configuration for sparker seismic sources used during JC152.
Squid 2000 Surface Sparker system
Squid 2000 catamaran was used in conjunction with the Applied Acoustics supplied CSP-D 2400 energy source which produced up to 2000 J per shot with a maximum load of 6000 A being placed on the CSP unit. Triggering for this system was provided by a free running clock provided by TTS, this was then sent via BNC at 5 volts on rising pulse to a Geo-acoustics junction box to “boost” the voltage before being sent for the CSP-D for triggering. The trigger was then timestamped via a GPS string input. This occurred on a 2 second interval. Earthing of the unit was done via cable to an external point on the port aft crane pedestal, a sea-earth was also deployed. Connection between the energy source and the Squid 2000 system was achieved via the university HV2000 cable and a HV junction box supplied by Applied Acoustics. During JC152 the system operated in the range of 1750 to 2000 J. From our past experience there is a delay of ~0.7-0.8 ms between the shot trigger and the sparker discharge.
Duraspark 400 Surface Sparker system
The Duraspark 400 system consisted a catamaran and a CSP-NV 2400 energy source. Unlike the Squid 2000 system, the Duraspark uses specially coated tips covered in plastic and the negative discharge of the CSP-NV unit to create the spark at the tips on the catamaran, increasing the endurance of the sparker tips. Its operating output of 10,000 A is greater than the Squid system. For the JC152 cruise the maximum shot output was 2000 J. Triggering was identical as for the Squid 2000, via a boosted rising time pulse every second sourced from an OBIC free running clock every 2 seconds. Earthing also remained unchanged. The connection between the towed Duraspark array was provided by a HVC 3500HV cable with connected to the CSP-NV via a HVJ-3004 junction box.

36
DTS-2000 Deep Tow Sparker system and associated winch system
The DTS-2000 system comprises a DTS-2000-7300 Towfish and CSP DTS 500 energy source. Unlike traditional CSP systems, where energy is transferred from a surface energy source via tow wire and emitted via a source towed behind a vessel, the CSP sends a DC voltage via a connected winch to the DTS towfish, where power modulation converts this to a useable form to power a small sparker array outputting a maximum of 300 J. Reflected signals are detected on a small towed hydrophone array towed behind the towfish. This then sends the data via BNC connection to a display unit (in this case the University of Southampton CODA system). Depth and layback was provided by the installation of an Applied Acoustics 1015 directional beacon and the vessel USBL system. Depth data was then brought in later to the CODA trace headers directly from the inbuilt depth sensor. The triggering in this instance was also provided by the CODA, and timestamped via GPS every 2 seconds. The earthing of the unit was the same as for the surface sparker sources (vessel and Sea-Earth) with the addition of the DTS tow fish being earthed to the tow wire.
For JC152 we hired in a winch with 11 mm cable from STR Ltd. The system supplied was deficient in a number of regards. First of all, the general condition of the wire was poor, it looked worn and well-used. Secondly, although the mechanical termination is sound, the overall design is not suitable as it fails offshore. The potting of the electrical connection within the mechanical termination effectively forces a full re-termination whenever there are issues. For future surveys a better design would be to bring the electrical connection further through the termination and allow a smaller amount of central core to be cut. Thirdly, and most importantly, the supplied termination failed on the first dive, and on inspection looked like it had not been carefully done. Finally, all the controllers provided for the winch had their control wiring the wrong way round, meaning that pay out ended up heaving in and vice versa.
During mobilisation for JC152 the smaller control box was fitted, rather than the larger one. We had to hastily attach the larger control unit, as the smaller one was not powerful enough to drive the winch when we needed to haul in.
6.4 Multichannel hydrophone streamers
During JC152 two different multichannel streamers were used, both specifically designed for high-frequency use in relatively shallow water. These were a 60-channel analogue streamer owned by University of Southampton (“Strataview”), and a 120-channel digital streamer rented from TTS (“Geoeel”).
The Strataview streamer consists of 60 groups, each with 7 hydrophone elements equally spaced over 1 m. There is a 10 m head stretch section, and a 50 m lead-in/deck cable. The analogue signals are digitised and time-stamped on a Geometrics Strataview R60 which was positioned in a container on the rear of the deck. The data are logged on a PC in the main lab running Geometrics CNT1 Marine Controller software in SEGD format connected to the R60 over a dedicated 100baseT Ethernet link; for each line there is also a single-channel monitor SEGY file, and an ASCII logfile that records the shot times for each FFID and system status. The PC used the NMF NTP server to keep synchronised to UTC, and the time on the R60 was automatically synchronised at the start of each

37
line, but then drifts freely. Data security during acquisition was maintained by mirrored internal disks within the PC, and files were copied over to the Southampton NAS at regular intervals. A BNC cable to the container provided the shot trigger. Recording parameters varied according to the sources in use: For the surface sparker sources 0.125 ms sample interval and 0.5 s record length, for the DTS 0.125 ms sample interval and 0.225 s record length, for the GI guns 0.25 ms sample interval and 3 s record length.
The Geoeel streamer consists of 120 groups, at 1.56 m spacing. There is a 25 m stretch section, 100 m tow lead, and additional 50 m deck lead. This is a digital streamer, with digitising cans every 8 channels in the water, a 60 V power supply runs down the streamer with Ethernet used to transmit data back to the deck unit/power supply in the deck lab. Each channel has 4 hydrophones; for the first 6 sections (48 channels) the hydrophones are spaced at 10 cm, and for the remainder of the streamer at 20 cm, around the middle of the section. Data were logged on a PC in the main lab running Geometrics CNT2 Marine Controller Software; as with the Strataview this records a SEGY single-trace file and an ASCII logfile along with the SEGD shot records. A self-contained active tailbuoy was attached to the streamer, with a GPS and a radio modem that transmitted a GGA position stream to the main lab. The GGA string received most closely to the shot time is recorded in the logfile, containing both the tailbuoy position and the UTC time. Unfortunately during the deployment the tailbuoy battery compartment leaked, and so the positions are only available for lines 100-107. Subsequently we reconfigured the CNT2 software to listen to the UDP strings transmitted on the NMF network once per second, and the ZDA string received most closely to the shot time is recorded in the logfile. The Geoeel recorded Squid2000 lines at 0.125 ms sample interval and 1 s record length, and GI gun lines at 0.25 ms sample interval and 3 s record length.
6.5 NMF Scientific Ship Systems
Position and Attitude
GPS and attitude measurement systems were provided by the Applanix POSMV system (the vessel's primary GPS system, outputting the position of the ship's common reference point in the gravity meter room). The position fixes attitude and gyro data are logged to the Techsas system. True Heave is logged by the Kongsberg EM710 systems. The vessel’s secondary GPS system is the Kongsberg Seapath 300+ system. This was the position and attitude source that was used by the EM710 due to its superior real-time heave data. Position fixes and attitude data were logged to the Techsas system. The CNav 3050 GPS system is the vessel’s differential correction service. It provides the Applanix POSMV and Seapath330+ system with RTCM DGPS corrections (greater than 1 m accuracy). The position fixes data are logged to the Techsas system.
Throughout JC152 the heading accuracy of the Applanix POSMV system was degraded to ~ 0.8 of a degree while underway due to the failure of the systems secondary antenna. The accuracy decreased further while on station.
Meteorology and sea surface monitoring
The NMF Surfmet system was run throughout the cruise, excepting times for cleaning, entering and leaving port and alongside.

38
Kongsberg EA600 12 kHz single-beam
The EA600 single-beam echo-sounder was run throughout the cruise triggered via K-sync with the exception of times during which it was disabled whilst communication was undertaken with OBS releases. It was used with a constant sound velocity of 1500 ms-1 throughout the water column to allow it to be corrected for sound velocity in post processing. Kongsberg Raw files and History BMP files are logged and depths were logged to Techsas and Level-C. The transducer locations were altered each time the drop keel was moved.
Kongsberg EM710 Shallow multi-beam echo sounder
The EM710 multibeam echo-sounder was run mounted on the port drop keel, which was lowered to 2.270 m below the hull for the duration of operation in the work area, this is for lines 53 – 482 & 509 - 699 all other lines are with the drop keel flush with the hull. The position and attitude data was supplied from the Seapath 300+ due to its superior real-time heave. Note that the receive transducer is installed backwards.
The following figures show the system installation configuration.
Figure 27 – EM710 transducer locations drop keel flush

39
Figure 28 – EM710 transducer locations drop keel lowered
Figure 29 – EM710 transducer offsets
Post processing of the EM710 was undertaken with CARIS HIPS & SIPS 10.3. A file structure was created for the cruise and two projects created, JC152_patch_test and JC152. The initial lines in the work area 53, 55, 57, 59, 61, 63 where used in project JC152_patch_test to establish the attitude Angular Offsets for the attitude system, Attitude 2. It was decided by the science party not to enter these into the EM710 system but to have them in the CARIS vessel file so they are only applied in post processing. Lines 53 – 482 & 509 - 699 were then imported daily by the technician into the project JC152, predicted tide from POLPRED software was applied and initial cleaning was undertaken by removing some of the outer beams and removing major spikes. The scientific party then undertook additional cleaning.
In addition to the standard depth and backscatter data we recorded the water column amplitudes for later identification of bubble plumes.
Kongsberg SBP120 Sub Bottom Profiler
The SBP120 Sub Bottom Profiler was run throughout JC152. There are breaks in the data due to the acoustic instrumentation being isolated for OBS deployment and recovery operations. Uncorrelated data was recorded in Kongsberg raw format and processed data in Seg-Y format.
The SBP120 runtime parameters used are shown in figure 5, the echogram display settings are shown in figure 6, and the legend settings for the display are shown in figure 7. The only processing

40
options enabled were in the following order below. These were the suggested settings from the Kongsberg training notes. The SBP120 software is included with the data for replay and reprocessing.
Gain correction Attribute processing
Transmission loss: 0.7 dB/km Attributes: Inst. amplitude
Filters Gain Filter type: Matched Filter coefficient 0.5 Corner frequencies: Auto Replica shaping: enabled
Figure 30 - Sub Bottom Profiler Installation Parameters
Figure 31 - Sub Bottom Profiler Runtime Parameters.
Figure 32 - Sub Bottom Profiler Echogram display settings.
Figure 33 - Sub Bottom Profiler Legend display settings.
SIMRAD EK60 Scientific Echosounder
The Simrad EK60 Scientific Echosounder is a fish finder with several frequencies. The setup was as follows:
Frequency kHz Power W Pulse Length μs Record Range m 18 2000 2048 0 - 200 38 2000 1024 0 - 200 70 300 512 0 – 200 120 250 256 0 – 200 200 150 256 0 - 200

41
During operation it was noted that there were linear shifts in the data with the initial pulse, which should have been seen at 6.9 m ranging from 0 m to 15 m. Investigations into the triggering and synchronisation systems found no errors. A sample of the shifts is shown in figure 8 below. Data was saved in the raw format, which can be replayed in the software provided.
Figure 34 - EK60 datum shift
Sonardyne Ranger 2 USBL
The Sonardyne Ranger 2 USBL system was used to determine the position of the deep tow sparker system. The Applied Acoustics beacon setting were input into the Ranger 2 system with the beacon given the ID “DTS WsA1”. During the first test deployment one of NMF’s Sonardyne WMS beacons was also attached to the cable but wasn’t required as tracking was reliable using the Applied acoustics beacon. Data was acquired by Techsas but there are gaps in the data for the period 14:31:29 – 23:31:20 on 2nd September due to the module in Techsas repeatedly crashing and requiring resetting by the watch keepers. Due to the losses in Techsas of the USBL data, files from the Ranger 2 system are available.

42
Sound Velocity Profiles
Four sound velocity profiles were collected during JC152 using a MIDAS Valeport SVP (SN:22355).
Time Profile Location 27/08/17 21:31
JC152_OBS1_sorted_extended_thinned.asvp N 58° 16.878’ E 000° 58.236’
27/08/17 22:57
JC152_OBS25_sorted_extended_thinned.asvp
N 58° 16.284’ E 000° 59.496’
05/09/17 03:07
JC152_OBS11_sorted_extended_thinned.asvp
N 58° 16.986’ E 000° 58.578
06/09/07 JC152_OBS30_sorted_extended_thinned.asvp
N 58° 19.30’ E 000° 57.156’
Table 5. Positions of Sound Velocity Profiles collected during JC152.
7. Recommendations
Overall JC152 was a very successful cruise with the science enabled by the excellent platform, RRS James Cook, and well-motivated and skilled ships company and scientific party. However the following are recommendations for improvement.
1. For all airgun systems used from the RRS James Cook it is important that air pressure can be logged to check system performance and ensure efficient operation.
2. The main portable scientific equipment from NMEP comprised an array of GI guns and an array of Bolt airguns. The GI guns worked well, but no depth sensors were fitted to the array, so no depth information is available; analysis of the seismic data suggests they were deeper than the 2 m requested. The Bolt guns were also deeper than the depth requested and the beam was not horizontal, so the resulting waveform bears little resemblance to the waveform designed for the experiment. The near-field hydrophones were not fitted for the first deployment. The automatically logging pressure recorders for the guns were not mobilised and therefore we have no information about gun pressures. Overall it is clear that the NERC Bolt airgun source (more than 20 years old) is no longer fit for purpose. The containerised compressors are unable to deliver a sufficiently stable air supply to operate them according to their specification; the array cannot be towed at a controlled depth. There needs to be a rethink as to how to deploy a better-tuned (ie. more guns, low frequency source).
3. Calibrated depth sensors are required for the GI guns as well as the Bolt airguns. GI guns should never be mobilised without their volume reducers.
4. Proper logging and timestamping of shot instants by NMF for their sources (Bolt and GI) with a serial string provided to recording systems is needed.
5. NMF should advise PI’s on requirements and timescales for permissions processes for UK waters as they do for other coastal states. Please read Section 4.1 for our experience of the permissions process.
6. The hired in winch from STR Ltd did not perform well and was problematic for the PSO to negotiate and get installed. Much better that NMF have the requisite winches.

43
8. Acknowledgements
The professionalism and hard work of the entire ship’s company helped to makes JC152 highly successful. We thank the captain John Leask for his positive approach to ensuring that the science got completed. We are grateful to the catering staff for excellent food throughout, and the pursar Paula MacDougall for ensuring that JC152 ran smoothly.
We received valuable advice about the licensing process from Dr Barbara Berx of Marine Scotland. We thank Lylian Burke of Marine Scotland for dealing very rapidly with our application, such that the licenses arrived in time despite our very late application. We are grateful to Professor Tim Minshull (University of Southampton) for logistical support prior to, and for advice during JC152.
We thank Applied Acoustics Ltd for their support of JC152, in particular for the provision of three different sparker seismic systems, and expert technical support during the voyage.
Figure 35. James Cook 152 shipboard scientific party.

44
9. References
Dando, P.R., et al., 1991. Ecology of a North Sea pockmark with an active methane seep. Marine Ecology Progress Series, 70, 49-63.
Dickinson, B., Waterhouse, M., Goodall, J., and Holmes, N., 2001. Blenheim Field: the appraisal of a small oil field with a horizontal well. Petroleum Geoscience. 7: 81-95.
Gafeira, J. & Long, D. 2015. Geological investigation of pockmarks in the Scanner Pockmark SCI area. JNCC Report No 570. JNCC Peterborough
Hovland, M. and Sommerville, 1985. Characteristics of Two Natural Gas Seepages in the North Sea. Marine and Petroleum Geology, 2, 319-326.
Judd, A., and Hovland, M., 2009. Seabed Fluid Flow: the impact on geology, biology and the marine environment. Cambridge University Press.
JNCC Website (2018). Scanner Pockmark Special Area of Conservation http://jncc.defra.gov.uk/protectedsites/sacselection/sac.asp?EUcode=UK0030354
Judd, A.G., Long, D., and Sankey, M., 1994. Pockmark formation and activity, UK block 15/25, North Sea. Bulletin of the Geological Survey of Denmark, 41, 34-49.
Karstens, J., and Berndt, C., 2015. Seismic chimneys in the Southern Viking Graben – Implications for palaeo fluid migration and overpressure evolution. Earth and Planetary Science Letters, 412: 88-100.
10. Appendices

Appendix A - JC152_OBS_Deployments_Leg1 ID raw split-tracesreceiver-gathers
site_id Lat Long depth(m) deployed_time recovered_time logger data_start_time data_end_time data_size data_size data_size datalogger_sync_time datalogger_timetag datalogger_drift_rate
1 58.2812 0.9708 167.3 2017:240:06:49 2017:248:03:24 129 2017:239:05:59:59.0000002017:248:03:33:43.000000 52.53 49.21 45.48 2017:237:15:41:00 2017:248:03:34:59.9976765 -2.56E-09
10 58.2827 0.9689 153 2017:240:05:51 2017:248:05:43 126 2017:239:05:59:59.0000002017:248:05:50:16.000000 53.1 49.73 45.48 2017:237:16:03:00 2017:248:05:50:00.0720836 7.89E-08
11 58.283 0.9715 156.1 2017:240:06:01 2017:248:05:25 110 2017:239:05:59:59.0000002017:248:05:31:20.000000 52.99 49.66 45.48 2017:237:11:37:00 2017:248:05:31:59.9688721 -3.35E-08
12 58.2805 0.9774 150.5 2017:240:04:39 2017:248:07:50 123 2017:239:05:59:59.0000002017:248:07:54:37.000000 53.61 50.21 45.48 2017:237:13:50:00 2017:248:07:55:59.9390881 -6.56E-08
13 58.2782 0.9746 151.1 2017:240:04:53 2017:248:07:27 131 2017:239:05:59:59.0000002017:248:07:32:11.000000 53.51 50.12 45.48 2017:237:13:32:00 2017:248:07:33:00.0736085 7.92E-08
14 58.2778 0.9695 151.7 2017:240:05:08 2017:248:07:09 138 2017:239:05:59:59.0000002017:248:07:17:21.000000 53.45 50.06 45.48 2017:237:15:58:00 2017:248:07:18:00.0054857 0.000000006
15 58.2793 0.9649 151.5 2017:240:03:22 2017:248:09:14 124 2017:239:05:59:59.0000002017:248:09:18:43.000000 53.91 50.53 45.48 2017:237:14:23:00 2017:248:09:20:00.1528799 0.000000164
16 58.2819 0.964 151.2 2017:240:03:38 2017:248:08:59 108 2017:239:05:59:59.0000002017:248:09:06:49.000000 53.86 50.48 45.48 2017:237:14:05:00 2017:248:09:07:59.9888686 -1.19E-08
17 58.2842 0.9669 151 2017:240:03:50 2017:248:08:43 119 2017:239:05:59:59.0000002017:248:08:56:28.000000 53.86 50.44 45.48 2017:237:12:36:00 2017:248:08:55:59.9080663 -9.81E-08
18 58.2847 0.972 151.8 2017:240:04:09 2017:248:08:24 139 2017:239:05:59:59.0000002017:248:08:33:19.000000 53.76 50.35 45.48 2017:237:15:44:00 2017:248:08:32:59.9788571 -2.29E-08
19 58.2693 0.986 149.6 2017:240:01:28 2017:248:11:21 128 2017:239:05:59:59.0000002017:248:11:25:42.000000 54.43 51.02 45.48 2017:237:14:44:00 2017:248:11:26:59.9791272 -2.22E-08
2 58.2815 0.9709 167.1 2017:240:06:45 2017:248:03:47 113 2017:239:05:59:59.0000002017:248:03:52:01.000000 52.58 49.28 45.48 2017:237:14:33:00 2017:248:03:52:59.9907350 -1.02E-08
20 58.2708 0.9841 149.9 2017:240:02:43 2017:248:09:54 112 2017:239:05:59:59.0000002017:248:10:01:46.000000 54.12 50.7 45.48 2017:237:16:34:00 2017:248:10:03:00.0472437 0.000000051
21 58.271 0.9868 150 2017:240:02:31 2017:248:10:12 109 2017:239:05:59:59.0000002017:248:10:18:21.000000 54.22 50.76 45.48 2017:237:13:21:00 2017:248:10:17:59.9809948 -2.02E-08
22 58.2703 0.9889 149.2 2017:240:01:45 2017:248:10:56 137 2017:239:05:59:59.0000002017:248:11:01:50.000000 54.32 50.93 45.48 2017:237:14:45:00 2017:248:11:02:59.9437744 -0.00000006
23 58.2723 0.9822 150.1 2017:240:02:56 2017:248:09:38 117 2017:239:05:59:59.0000002017:248:09:43:42.000000 54.02 50.63 45.48 2017:237:14:19:00 2017:248:09:45:00.0349309 3.74E-08
24 58.2731 0.9874 149.5 2017:240:02:16 2017:248:10:29 121 2017:239:05:59:59.0000002017:248:10:36:06.000000 54.22 50.83 45.48 2017:237:16:20:00 2017:248:10:36:59.9026708 -1.05E-07
25 58.2713 0.9917 149.6 2017:240:01:57 2017:248:10:43 130 2017:239:05:59:59.0000002017:248:10:51:14.000000 54.38 50.88 45.48 2017:237:14:33:00 2017:248:10:51:00.0030481 3.25E-09
3 58.2827 0.9749 165.7 2017:240:06:13 2017:248:05:06 135 2017:239:05:59:59.0000002017:248:05:13:24.000000 52.94 49.59 45.48 2017:237:16:13:00 2017:248:05:12:59.9384678 -6.76E-08
4 58.2833 0.9769 152 2017:240:04:27 2017:248:08:06 115 2017:239:05:59:59.0000002017:248:08:11:14.000000 53.66 50.27 45.48 2017:237:14:05:00 2017:248:08:11:59.9836751 -1.76E-08
5 58.2816 0.9671 150.9 2017:240:05:41 2017:248:06:11 111 2017:239:05:59:59.0000002017:248:06:18:22.000000 53.25 49.83 45.48 2017:237:15:52:00 2017:248:06:17:59.9609084 -4.27E-08
6 58.2809 0.9742 152 2017:240:06:24 2017:248:04:39 136 2017:239:05:59:59.0000002017:248:04:44:51.000000 52.79 49.48 45.48 2017:237:16:26:00 2017:248:04:45:59.9614662 -4.24E-08
7 58.2797 0.9727 152.2 2017:240:06:34 2017:248:04:10 107 2017:239:05:59:59.0000002017:248:04:14:34.000000 52.69 49.36 45.48 2017:237:12:22:00 2017:248:04:15:59.9893433 -1.16E-08
8 58.2794 0.9701 153.9 2017:240:05:18 2017:248:06:48 125 2017:239:05:59:59.0000002017:248:06:56:49.000000 53.4 49.98 45.48 2017:237:16:09:00 2017:248:06:56:00.0003648 3.98E-10
9 58.2802 0.9679 152.6 2017:240:05:30 2017:248:06:29 122 2017:239:05:59:59.0000002017:248:06:36:36.000000 53.3 49.9 45.48 2017:237:12:03:00 2017:248:06:36:00.0162014 1.74E-08
channel_mapping for all OBS
Ch0 = Horizontal Geophone 1, Ch1 = Horizontal Geophone 2, Ch2 = Vertical Geophone, Ch3 = Hydrophone/DPG
Data Logger Type for all OBS - LJ1
Sample Rate for all OBS - 4000

Appendix A - JC152 OBS Deployments Leg 2 ID raw split_tracesreciever gathers
site_id Lat Long Depth (m)deployed_time recovered_time logger data_start_time data_end_time data_size data_sizedata_size_receiverdatalogger_sync_time datalogger_timetag datalogger_drift_rate
26 58.3093 0.958 165.8 2017:250:08:19 2017:253:10:32 129 2017:249:23:59:59.000000 2017:253:19:38:23.000000 22.53 21.11 27.61 2017:249:14:00:00 2017:253:19:38:59.9996240 -0.000000001
27 58.3147 0.956 149.2 2017:250:07:42 2017:253:19:11 138 2017:249:23:59:59.000000 2017:253:19:18:18.000000 22.53 21.03 27.61 2017:249:14:38:00 2017:253:19:18:00.0023420 6.46E-09
29 58.3165 0.9607 149.7 2017:250:07:57 2017:253:18:52 107 2017:249:23:59:59.000000 2017:253:18:56:51.000000 22.43 20.95 27.61 2017:249:13:17:00 2017:253:18:57:59.9954844 -1.23E-08
30 58.3217 0.9527 150.7 2017:250:06:53 2017:253:18:30 126 2017:249:23:59:59.000000 2017:253:18:36:18.000000 22.32 20.87 27.61 2017:249:14:22:00 2017:253:18:36:00.0312145 8.65E-08
31A 58.3236 0.9573 149.1 2017:250:07:09 2017:253:18:12 139 2017:249:23:59:59.000000 2017:253:18:19:31.000000 22.27 20.81 27.61 2017:249:14:33:00 2017:253:18:18:59.9910911 -2.48E-08
31B 58.3237 0.9575 149 2017:250:07:23 2017:253:17:51 113 2017:249:23:59:59.000000 2017:253:17:56:58.000000 22.12 20.72 27.61 2017:249:14:04:00 2017:253:18:02:59.9955934 -1.22E-08
32 58.3063 0.9597 150.2 2017:250:08:38 2017:253:19:49 110 2017:249:23:59:59.000000 2017:253:19:54:27.000000 22.63 21.18 27.61 2017:249:14:18:00 2017:253:19:54:59.9864674 -0.000000037
channel_mapping for all OBS
Ch0 = Horizontal Geophone 1, Ch1 = Horizontal Geophone 2, Ch2 = Vertical Geophone, Ch3 = Hydrophone/DPG
Data logger type - LJ1
Data sample rate - 4000

Appendix B Song Meter SM2M Passive Acoustic Recorder Summary
During JC152, two deployments were made of a passive acoustic recorder (Song Meter SM2M) using a mini-lander and associated mooring buoys. In the first deployment the acoustic recorder was placed c. 28 m above the seabed on a mooring rope above the mini-lander with the aim of recording far-field seismic source signatures from all the different seismic systems used. In the second deployment the acoustic recorder was mounted directly on the mini-lander c. 1 m above the seabed within the western Scanner pockmark in a methane bubble flare. The aim in the second deployment was to record and determine the methane gas flux.
Parameters - Deployment (1)
Location: 1° 03.018’ E, 58°20.011’N, in 143 m of water. Northwest of the Scanner Pockmark, uniform seabed.
Program: To record every other 5 minutes from GMT 12:00 on 28/8/17 (such that data will be collected from 12:00 to 12:05, 12:10 to 12:15, 12:20 to 12:25…) until collection of device at GMT 15:50 on 3/9/17.
Sample Rate: 44,100 Hz (44.1 kHz). C hannels: 2 (Left & Right).
Digital Gain: ± 0 dB (Left Channel), + 6 dB (Right Channel). Filtering: No filters applied.
File Format: WAV. Filename Prefix: CD152DEP1
Parameters - Deployment (2) in Scanner Pockmark
10th September 2018 16:41 Lander deployed @ 58° 16.901’N; 0° 58.237’ E in Scanner pockmark
Program: To record every other 5 minutes
Sample Rate: 44,100 Hz (44.1 kHz).
Channels: 2 (Left & Right). Digital Gain: 6 dB (Left Channel), 36 dB (Right Channel).
Filtering: None applied File Format: WAV.
Filename Prefix: CD152DEP2

Type Type SOL EOL GeoEel/Strataviewfile
Source Survey JD Start Lat Long Shot Shot JD End Lat Long Shot Shot Area Line start end Source CodaLogFile
1 1 240 14:52 5815.913 058.828 1 240 17:09 5818.443 12.469 880 Bolt_Asterisk B1 Nostreamer test Boltlandershot555
1 1 240 17:18 5818.443 12.469 882 240 18:37 5815.018 055.92 1355 Bolt_Asterisk B2 Nostreamer I J Bolt700ci10s
1 1 240 18:38 5815.018 055.92 1356 240 20:20 5816.506 12.885 1970 Bolt_Asterisk B3 Nostreamer R Q Bolt700ci10s
1 1 240 20:20 5816.506 12.885 1971 240 21:55 5816.564 055.321 2538 Bolt_Asterisk B4 Nostreamer K L Bolt700ci10s
1 1 240 21:55 5816.564 055.321 2539 241 00:15 5818.129 059.889 3372 Bolt_Asterisk B5 Nostreamer T S Bolt700ci10s
1 1 241 00:14 5818.129 059.889 3373 241 01:47 5819.895 057.523 3928 Bolt_Asterisk B6 Nostreamer V U Bolt700ci10s
1 1 241 01:47 5819.895 057.523 3929 241 03:44 5819.236 055.157 4633 Bolt_Asterisk B7 Nostreamer O P Bolt700ci10s
1 1 241 03:44 5819.236 055.157 4634 241 05:36 5815.247 059.566 5302 Bolt_Asterisk B8 Nostreamer N M Bolt700ci10s
1 2 241 05:36 5815.247 059.566 5303 241 06:44 5818.024 057.534 5709 Bolt_Grid B9 Nostreamer AY AZ Bolt700ci10s
1 2 241 06:44 5818.024 057.534 5710 241 07:50 5815.07 059.033 6106 Bolt_Grid B10 Nostreamer BJ BI Bolt700ci10s
1 2 241 07:50 5815.07 059.033 6107 241 08:31 5817.542 055.995 6363 Bolt_Grid B11 Nostreamer BX DU Bolt700ci10s
2 3 241 11:07 5817.909 11.149 989 241 13:03 5814.382 11.575 3656 Sparker_Asterisk S1 1 I J Squid2000J2s
2 3 241 13:03 5814.382 11.575 3657 241 16:25 5816.889 058.242 9429 Sparker_Asterisk S2 2 M N SquidlanderShot7654
2 3 241 16:25 5816.889 058.242 9430 241 17:08 5815.746 058.006 10740 Sparker_Asterisk S3 3 BY BZ Squid2000J2s
2 3 241 17:08 5815.746 058.006 10741 241 18:01 5816.855 059.405 12292 Sparker_Asterisk S4 4 CB CA Squid2000J2s
2 3 241 18:01 5816.855 059.405 12293 241 19:04 5816.269 058.115 14169 Sparker_Asterisk S5 5 CF CE Squid2000J2s
2 3 241 19:04 5816.269 058.115 14170 241 19:56 5816.752 059.55 15721 Sparker_Asterisk S6 6 CD CC Squid2000J2s
2 3 241 19:56 5816.752 059.55 15722 241 20:55 5817.65 058.487 17476 Sparker_Asterisk S7 7 BX BW Squid2000J2s
2 3 241 20:55 5817.65 058.487 17477 241 21:39 5816.386 057.338 18804 Sparker_Asterisk S8 8 BZ BY Squid2000J2s
2 3 241 21:39 5816.386 057.338 18805 241 22:12 5816.501 059.705 19766 Sparker_Asterisk S9 9 CR CQ Squid2000J2s
2 3 241 22:12 5816.501 059.705 19767 241 22:48 5816.603 057.937 20841 Sparker_Asterisk S10 10 CW CX Squid2000J2s
2 3 241 22:48 5816.603 057.937 20842 241 23:36 5816.26 059.802 22266 Sparker_Asterisk S11 11 CN CM Squid2000J2s
2 3 241 23:36 5816.26 059.802 22267 242 00:21 5816.206 058.177 23605 Sparker_Asterisk S12 12 CY CZ Squid2000J2s
2 3 242 00:21 5816.206 058.177 23606 242 01:05 5817.169 058.683 24902 Sparker_Asterisk S13 13 CT CS Squid2000J2s
2 3 242 01:05 5817.169 058.683 24903 242 01:58 5816.631 059.753 26520 Sparker_Asterisk S14 14 CK CL Squid2000J2s
2 3 242 01:58 5816.631 059.753 26521 242 02:33 5816.911 059.056 27526 Sparker_Asterisk S15 15 CV CU Squid2000J2s
2 3 242 02:33 5816.911 059.056 27527 242 03:03 5816.44 056.231 28456 Sparker_Asterisk S16 16 CO CP Squid2000J2s
2 3 242 03:03 5816.44 056.231 28457 242 04:10 5816.521 059.442 30433 Sparker_Asterisk S17 17 CJ CL Squid2000J2s
2 4 242 04:10 5816.521 059.442 30434 242 04:57 5816.925 057.923 31816 Sparker_Grid S18 18 DL DK Squid2000J2s
2 4 242 04:57 5816.925 057.923 31817 242 05:53 5816.179 059.424 33504 Sparker_Grid S19 19 DE DF Squid2000J2s
2 4 242 05:53 5816.179 059.424 33505 242 06:18 5815.807 058.888 34220 Sparker_Grid S20 20 DH DG Squid2000J2s
2 4 242 06:18 5815.807 058.888 34221 242 07:24 5816.913 057.225 35046 Sparker_Grid S21 21 DA DB Squid2000J2s
2 4 242 07:24 5816.913 057.225 35047 242 07:57 5817.012 059.027 37168 Sparker_Grid S22 22 CH CG Squid2000J2s
2 4 242 07:57 5817.012 059.027 37169 242 09:12 5919.285 058.013 37538 Sparker_Grid S23 23 CM CN Squid2000J2s
3 3 242 09:12 5919.285 058.013 37539 242 10:07 5819.18 055.287 39311 Sparker_Asterisk S24 24 testline Duraspark2000J2s
3 3 242 10:07 5819.18 055.287 39312 242 12:28 5818.799 055.028 43504 Sparker_Asterisk S25 25 N M Duraspark2000J2s
3 3 242 12:28 5818.799 055.028 43505 242 14:44 5817.572 058.992 47504 Sparker_Asterisk S26 26 J I Durasparklander-45839-45944
3 3 242 14:44 5817.572 058.992 47585 242 15:34 5815.439 058.886 49066 Sparker_Asterisk S27 27 BZ BY Duraspark2000J2s
3 3 242 15:34 5815.439 058.886 49067 242 16:24 5816.545 10.238 50584 Sparker_Asterisk S28 28 CE CF Duraspark2000J2s
3 3 242 16:24 5816.545 10.238 50585 242 17:18 5816.288 057.859 52147 Sparker_Asterisk S29 29 CA CB Duraspark2000J2s
3 3 242 17:18 5816.288 057.859 52148 242 18:06 5816.753 059.473 53588 Sparker_Asterisk S30 30 CD CC Duraspark2000J2s
3 3 242 18:06 5816.753 059.473 53588 242 19:21 5815.477 058.061 55828 Sparker_Asterisk S31 31 BW BX Duraspark2000J2s
3 4 242 19:21 5815.477 058.061 55829 242 20:41 5819.342 055.555 58231 Sparker_Grid S32 32 DO DP Duraspark2000J2s
3 4 242 20:41 5819.342 055.555 58232 242 21:58 5816.447 10.783 60527 Sparker_Grid S33 33 DN ? Duraspark2000J2s
3 4 242 21:58 5816.447 10.783 60528 242 23:23 5819.038 054.978 63007 Sparker_Grid S34 34AND35 DQ DR Duraspark2000J2s
3 4 242 23:23 5819.038 054.978 63008 243 00:43 5816.34 059.475 65447 Sparker_Grid S35 36 DM DC Duraspark2000J2s
3 5 243 00:43 5816.34 059.475 65448 243 01:36 5817.456 057.163 67000 Sparker_OBS S36 37 ? Duraspark2000J2s
3 5 243 01:36 5817.456 057.163 67001 243 02:29 5816.198 059.31 68572 Sparker_OBS S37 38 JA JB Duraspark2000J2s
AppendixC JC152Surveylinesstartandendtimesandcoordinatesshotnumbers

Type Type SOL EOL GeoEel/Strataviewfile
Source Survey JD Start Lat Long Shot Shot JD End Lat Long Shot Shot Area Line start end Source CodaLogFile
3 5 243 02:29 5816.198 059.31 68573 243 03:25 5817.361 057.452 70242 Sparker_OBS S38 39 IV IU Duraspark2000J2s
3 5 243 03:25 5817.361 057.452 70243 243 04:20 5816.284 059.093 71906 Sparker_OBS S39 40 IY IZ Duraspark2000J2s
3 5 243 04:20 5816.284 059.093 71907 243 05:18 5817.292 057.881 73591 Sparker_OBS S40 41 JF JE Duraspark2000J2s
3 5 243 05:18 5817.292 057.881 73592 243 06:09 5816.061 058.524 75128 Sparker_OBS S41 42 IW IX Duraspark2000J2s
3 5 243 06:09 5816.061 058.524 75129 243 07:19 5816.881 10.011 77178 Sparker_OBS S42 43 JH JG Duraspark (DS)
3 5 243 07:19 5816.881 10.011 77179 243 09:16 5820.195 12.461 80302 Sparker_OBS S43 44 JL JK DSlander80217-80254
4 6 243 10:14 5817.904 056.437 171 243 12:08 5817.961 10.452 1009 GI_DASI G1 45 F E 2*GI105/1058sec
4 6 243 12:08 5817.961 10.452 1010 243 13:35 5817.076 055.279 1659 GI_DASI G2 46 A B 2*GI105/1058sec
4 6 243 13:35 5817.076 055.279 1660 243 16:24 5817.79 055.207 2888 GI_DASI G3 47 H G 2*GI105/1058sec
4 6 243 16:24 5817.79 055.207 2889 243 17:54 5816.505 11.841 3591 GI_DASI G4 48 C D 2*GI105/1058sec
4 7 243 17:54 5816.505 11.841 3592 243 19:24 5815.779 055.088 4264 GI_Asterisk G5 49 L L 2*GI105/1058sec
4 7 243 19:24 5815.779 055.088 4265 243 21:48 5818.805 058.955 5331 GI_Asterisk G6 50 G L GIlander4979-4989
4 7 243 21:48 5818.805 058.955 5332 243 23:27 5815.05 056.065 6080 GI_Asterisk G7 51 P O 2*GI105/1058sec
4 7 243 23:27 5815.05 056.065 6081 244 01:02 5818.095 059.875 6790 GI_Asterisk G8 52 R Q 2*GI105/1058sec
4 7 244 01:02 5818.095 059.875 6791 244 02:39 5819.934 11.242 7509 GI_Asterisk G9 53 V U 2*GI105/1058sec
4 7 244 02:39 5819.934 11.242 7510 244 04:45 5816.529 055.561 8451 GI_Asterisk G10 54 M N 2*GI105/1058sec
4 7 244 04:45 5816.529 055.561 8452 244 06:14 5816.396 12.018 9115 GI_Asterisk G11 55 T S 2*GI105/1058sec
4 8 244 06:14 5816.396 12.018 9116 244 07:37 5814.767 058.314 9735 GI_Grid G12 56 AW AX 2*GI105/1058sec
4 8 244 07:37 5814.767 058.314 9735 244 09:26 5819.501 056.209 10552 GI_Grid G13 57 BO BP 2*GI105/1058sec
4 8 244 09:26 5819.501 056.209 10552 244 10:55 5815.084 059.213 11216 GI_Grid G14 58 BR BQ 2*GI105/1058sec
4 8 244 10:55 5815.084 059.213 11217 244 11:52 5817.962 057.14 11640 GI_Grid G15 59 BK BU 2*GI105/1058sec
4 8 244 11:52 5817.962 057.14 11641 244 12:54 5815.235 059.618 12096 GI_Grid G16 60 BF BE 2*GI105/1058sec
4 8 244 12:54 5815.235 059.618 12097 244 13:52 5817.412 055.561 12525 GI_Grid G17 61 AY AZ 2*GI105/1058sec
4 8 244 13:52 5817.412 055.561 12526 244 14:55 5815.356 059.675 12987 GI_Grid G18 62 BN BM 2*GI105/1058sec
4 8 244 14:55 5815.356 059.675 12988 244 15:58 5818.3 058.411 13454 GI_Grid G19 63 BA DS 2*GI105/1058sec
4 8 244 15:58 5818.3 058.411 13455 244 17:01 5815.437 059.831 13930 GI_Grid G20 64 BT BS 2*GI105/1058sec
4 8 244 17:01 5815.437 059.831 13931 244 18:13 5817.961 057.586 14368 GI_Grid G21 65 BC BD 2*GI105/1058sec
4 8 244 18:13 5817.961 057.586 14369 244 19:14 5816.087 11.845 14921 GI_Grid G22 66 BJ BL 2*GI105/1058sec
4 8 244 19:14 5816.087 11.845 14922 244 20:29 5817.86 057.413 15485 GI_Grid G23 67 DU DX 2*GI105/1058sec
4 8 244 20:29 5817.86 057.413 15486 244 22:07 5816.673 11.856 16218 GI_Grid G24 68 DT BG 2*GI105/1058sec
4 8 244 22:08 5816.673 11.856 16219 244 23:21 5815.426 056.712 16767 GI_Grid G25 69 AU AV 2*GI105/1058sec
4 8 244 23:21 5815.426 056.712 16768 245 00:29 5817.425 10.869 17271 GI_Grid G26 70 Al AK 2*GI105/1058sec
4 8 245 00:29 5817.425 10.869 17272 245 01:36 5816.181 055.909 17774 GI_Grid G27 71 AE AF 2*GI105/1058sec
4 8 245 01:36 5816.181 055.909 17775 245 02:39 5818.149 059.837 18246 GI_Grid G28 72 Z Y 2*GI105/1058sec
4 8 245 02:39 5818.149 059.837 18247 245 03:48 5816.763 054.974 18753 GI_Grid G29 73 AQ AR 2*GI105/1058sec
4 8 245 03:48 5816.763 054.974 18754 245 04:51 5817.952 10.153 19224 GI_Grid G30 74 AT AS 2*GI105/1058sec
4 8 245 04:51 5817.952 10.153 19225 245 05:53 5815.864 056.098 19686 GI_Grid G31 75 AO AP 2*GI105/1058sec
4 8 245 05:53 5815.864 056.098 19687 245 07:02 5817.84 10.247 20201 GI_Grid G32 76 AD AC 2*GI105/1058sec
4 8 245 07:02 5817.84 10.247 20202 245 08:08 5815.526 056.639 20637 GI_Grid G33 77 W X 2*GI105/1058sec
4 8 245 08:08 5815.526 056.639 20638 245 09:22 5817.688 10.618 21246 GI_Grid G34 78 AJ AI 2*GI105/1058sec
4 8 245 09:22 5817.688 10.618 21247 245 10:30 5815.267 057.001 21755 GI_Grid G35 79 AA AB 2*GI105/1058sec
4 8 245 10:30 5815.267 057.001 21756 245 11:40 5817.235 11.079 22281 GI_Grid G36 80 AN AM 2*GI105/1058sec
4 8 245 11:40 5817.235 11.079 22282 245 12:19 5815.588 056.424 22567 GI_Grid G37 81 AG AH 2*GI105/1058sec CodaLogFile Fishmin.dep.(m) Fishmax.dep.(m)
5 9 245 13:01 5817.738 055.46 1227 245 14:20 5817.627 058.317 3217 DTS-asterisk DTS1 jc152--dts test Deeptow300J1s 20917.13473 107 117
5 9 245 14:20 5817.627 058.317 3218 245 15:19 5815.739 057.984 6743 DTS-asterisk DTS2 jc152--dts BZ BY DTS300J1s200ms 20917.14204 106 117
5 9 245 15:19 5815.739 057.984 6744 245 17:22 5816.1 057.947 8151 DTS-asterisk DTS3 Nolngstream. CB CA DTS300J1s 20917.15192 115 98
5 9 245 17:22 5816.1 057.947 72 245 18:20 5817.526 057.414 1473 DTS-asterisk DTS4 Nolngstream. BY BZ DTS300J1s 20917.17572 105 108
5 9 245 18:20 5817.526 057.414 1483 245 19:43 5816.728 059.903 6456 DTS-asterisk DTS5 Nolngstream. JL JM DTS300J1s 20917.18205 106 120
5 9 245 19:43 5816.728 059.903 6465 245 20:55 5815.389 058.868 10746 DTS-asterisk DTS6 Nolngstream. BW BX DTS300J1s 20917.19435 113 120
5 9 245 20:55 5815.389 058.868 10754 245 23:57 5816.317 057.654 21689 DTS-asterisk DTS7 Nolngstream. CE CF DTSlander:22:13 20917.20552 102 121

Type Type SOL EOL GeoEel/Strataviewfile
Source Survey JD Start Lat Long Shot Shot JD End Lat Long Shot Shot Area Line start end Source CodaLogFile
5 9 245 23:57 5816.317 057.654 21690 246 01:07 5817.325 059.425 25868 DTS-asterisk DTS8 Nolngstream. CC CD DTS300J1s 20917.23567 102 121
5 10 246 01:07 5817.325 059.425 25869 246 02:26 5816.639 057.695 30588 DTS-grid DTS9 Nolngstream. JO JN DTS300J1s 30917.01071 111 113
5 10 246 02:26 5816.639 057.695 30589 246 03:15 5817.132 057.452 33662 DTS-grid DTS10 Nolngstream. KP KQ DTS300J1s 30917.02255 119 116
5 10 246 03:15 5817.132 057.452 33663 246 04:01 5816.496 059.496 36353 DTS-grid DTS11 Nolngstream. JX JZ DTS300J1s 30917.03171 116 114
5 10 246 04:01 5816.496 059.496 36354 246 05:06 5817.295 057.598 40233 DTS-grid DTS12 Nolngstream. KS KR DTS300J1s 30917.04016 112 114
5 10 246 05:06 5817.295 057.598 40234 246 05:58 5816.59 057.891 43373 DTS-grid DTS13 Nolngstream. KE KF DTS300J1s 30917.05064 109 113
5 10 246 05:58 5816.59 057.891 43374 246 06:56 5817.249 057.541 46835 DTS-grid DTS14 Nolngstream. KN KO DTS300J1s 30917.05586 125 114
5 10 246 06:56 5817.249 057.541 46836 246 07:46 5816.688 059.52 49852 DTS-grid DTS15 Nolngstream. KC KD DTS300J1s 30917.06564 114 113
5 10 246 07:46 5816.688 059.52 49853 246 08:41 5817.335 057.658 53123 DTS-grid DTS16 Nolngstream. KW KB DTS300J1s 30917.07466 110 114
5 10 246 08:41 5817.335 057.658 53124 246 09:26 5816.637 059.413 55839 DTS-grid DTS17 Nolngstream. KG KH DTS300J1s 30917.08413 113 115
5 10 246 09:26 5816.637 059.413 55840 246 10:19 5817.166 057.997 59115 DTS-grid DTS18 Nolngstream. KU KT DTS300J1s
5 10 246 10:19 5817.166 057.997 59116 246 11:08 5816.552 059.012 61943 DTS-grid DTS19 Nolngstream. KI KJ DTS300J1s 30917.10212 Inheader
5 10 246 11:08 5816.552 059.012 61944 246 12:29 5817.4 057.823 65893 DTS-grid DTS20 Nolngstream. KM' KM DTS300J1s 30917.11083 Inheader
5 10 246 12:29 5817.4 057.823 65894 246 12:29 5816.462 059.022 66880 DTS-grid DTS21 Nolngstream. KK KL DTS300J1s 30917.12142 Inheader
2 3 246 13:29 5815.426 10.015 246 14:53 5820.043 13.043 Sparker_Asterisk S44 Nolngstream. JM JL Squid2000J2s lander@14:53
1 2 246 16:22 16:45 5818.022 11.119 6353 Bolt_Grid B12A Nolngstream. test Bolt,700ci,10s
1 2 246 16:46 5818.022 11.119 6354 246 18:42 5815.522 056.611 7025 Bolt_Grid B12 Nolngstream. Y Z Bolt,700ci,10s
1 2 246 18:42 5815.522 056.611 7026 246 19:50 5816.488 12.081 7431 Bolt_Grid B13 Nolngstream. AJ AI Bolt,700ci,10s
1 2 246 19:50 5816.448 12.081 7432 246 20:57 5815.611 056.49 7830 Bolt_Grid B14 Nolngstream. AW AX Bolt,700ci,10s
1 2 246 20:57 5815.611 056.49 7831 246 22:00 5816.657 11.85 Bolt_Grid B15 Nolngstream. AH AG Bolt,700ci,10s
1 2 246 22:00 5816.657 11.85 246 23:10 5815.939 055.976 Bolt_Grid B16 Nolngstream. AU AV Bolt,700ci,10s
1 2 246 23:10 5815.939 055.976 247 00:21 5817.982 10.266 Bolt_Grid B17 Nolngstream. AB AA Bolt,700ci,10s
1 2 247 00:21:00 5817.982 10.266 247 01:30 5816.794 055.049 Bolt_Grid B18 Nolngstream. AO AP Bolt,700ci,10s
1 2 247 01:30 5816.794 055.049 247 02:36 5818.21 059.947 Bolt_Grid B19 Nolngstream. AT AS Bolt,700ci,10s
1 2 247 02:36 5818.21 059.947 247 03:36 5816.244 055.743 Bolt_Grid B20 Nolngstream. AQ AR Bolt,700ci,10s
1 2 247 03:56 5816.244 055.743 247 05:00 5817.466 10.948 Bolt_Grid B21 Nolngstream. X W Bolt,700ci,10s
1 2 247 05:00 5817.466 10.948 10761 247 06:16 5815.288 055.021 11176 Bolt_Grid B22 Nolngstream. AE AF Bolt,700ci,10s
1 2 247 06:16 5815.288 055.021 11177 247 07:28 5817.526 10.791 11609 Bolt_Grid B23 Nolngstream. AN AM Bolt,700ci,10s
1 2 247 07:28 5817.526 00.791 11610 247 09:12 5816.709 10.369 Bolt_Grid B24 Nolngstream. AC AD Bolt,700ci,10s
1 2 247 09:12 5816.709 10.369 247 09:59 5815.985 11.417 12469 Bolt_Grid B25 Nolngstream. AL AK Bolt,700ci,10s
1 2 247 09:59 5815.985 11.417 12470 247 11:17 5817.802 056.787 12946 Bolt_Grid B26 Nolngstream. BS BT Bolt,700ci,10s
1 2 247 11:17 5817.802 056.787 12947 247 12:34 5815.57 10.414 13412 Bolt_Grid B27 Nolngstream. BD BC Bolt,700ci,10s
1 2 247 12:34 5815.57 10.414 13413 247 13:49 5818.218 057.919 13848 Bolt_Grid B28 Nolngstream. BG DT Bolt,700ci,10s
1 2 247 13:49 5818.218 057.919 13849 247 13:58 5817.815 058.408 13912 Bolt_Grid B29 Nolngstream. DW NaN Bolt,700ci,10s
2 3 250 09:22 5819.14 11.343 250 10:42 5810.015 11.445 1696 Sparker_Asterisk test Squid1750J2s GeoEelStreamer
2 3 250 10:42 5810.015 11.445 1697 250 13:07 5816.22 057.98 4618 Sparker_Asterisk S101 GE-101 I J Squid1750J2s GeoEelStreamer
2 3 250 13:07 5816.22 057.98 4619 250 14:18 5817.034 056.782 Sparker_Asterisk S103 GE-103 BY BZ Squid1750J2s GeoEelStreamer
2 3 250 14:18 5817.034 056.782 250 15:54 5814.78 10.938 Sparker_Asterisk S104 GE-104 BX BW Squid1750J2s GeoEelStreamer
2 3 250 15:54 5814.78 10.938 250 18:00 5818.123 056.488 13359 Sparker_Asterisk S105 GE-105 M N Squid1750J2s GeoEelStreamer
2 11 250 18:00 5818.123 056.488 13360 250 18:59 5819.88 058.514 15097 3D_Sparker S106 GE-106 PC PD Squid1750J2s GeoEelStreamer
2 11 250 18:59 5819.88 058.514 15098 250 19:52 5818.45 056.29 16688 3D_Sparker S107 GE-107 OZ OY Squid1750J2s GeoEelStreamer
2 11 250 19:52 5818.45 056.29 16688 58 3D_Sparker S108 GE-108 Squid1750J2s GeoEelStreamer
2 11 ? 58 58 3D_Sparker S109 GE-109 Squid1750J2s GeoEelStreamer
2 11 250 20:51 5819.88 056.93 18364 250 22:14 5816.439 057.105 2860? 3D_Sparker S110 GE-110 MM MN Squid1750J2s GeoEelStreamer
2 11 250 22:14 5816.439 057.105 2860? 250 23:32 5816.526 058.657 23155 3D_Sparker S111 GE-111 PE PF Squid1750J2s GeoEelStreamer
2 11 250 23:32 5816.526 058.657 23156 251 01:15 5819.914 056.861 26216 3D_Sparker S112 GE-112 NJ NI Squid1750J2s GeoEelStreamer
2 11 251 01:15 5819.914 056.861 26217 251 02:34 5816.41 058.702 28580 3D_Sparker S113 GE113 MI MJ Squid1750J2s GeoEelStreamer
2 11 251 02:34 5816.41 058.702 28581 251 04:08 5819.856 056.387 31387 3D_Sparker S114 GE_114 NF NE Squid1750J2s GeoEelStreamer
2 11 251 04:08 5819.856 056.387 31388 251 05:37 5816.362 058.986 34111 3D_Sparker S115 GE_115 KY KZ Squid1750J2s GeoEelStreamer
TransittoAberdeentopickupspareparts.
30917.0926-30917.0950

Type Type SOL EOL GeoEel/Strataviewfile
Source Survey JD Start Lat Long Shot Shot JD End Lat Long Shot Shot Area Line start end Source CodaLogFile
2 11 251 05:37 5816.362 058.986 34111 251 05:51 5817.37 058.022 34464 3D_Sparker S116 GE_116 MM MN Squid1750J2s GeoEelStreamer
4 11 251 06:15 5818.985 057.311 1 251 07:09 5813.33 056.351 290 3D-GI G117 GE_117 test 2*GI45/1056sec GeoEelStreamer
4 11 251 07:09 5813.33 056.351 291 251 08:17 5816.72 058.67 951 3D-GI G118 GE_118 KY KZ 2*GI45/1056sec GeoEelStreamer
4 11 251 08:17 5816.72 058.67 952 251 08:37 5816.57 059.16 1144 3D-GI G119 GE_119 turning 2*GI45/1056sec GeoEelStreamer
4 11 251 08:37 5816.57 059.16 1145 251 10:02 5819.784 058.354 1978 3D-GI G120 GE_120 OT OS 2*GI45/1056sec GeoEelStreamer
# # # # # # # # ## ## # # # # # # # # # #
GI3DSURVEY
SOLtts SOL EOLtts EOL ttsfile Stratafile
4 11 251 10:02 5819.784 058.354 1979 10308 251 11:24 5819.8 057.25 2809 11137 3D-GI G121 G121 121 OZ OY 2*GI45/1056sec BothStreamers
4 11 251 11:24 5819.8 057.25 2810 11138 251 12:50 5816.37 057.039 3667 11985 3D-GI G122 G122 122 NI NJ 2*GI45/1056sec BothStreamers
4 11 251 12:50 5816.37 057.039 3668 11986 251 14:09 5816.522 059.193 4994 13349 3D-GI G123 G123 123 PE PF 2*GI45/1056sec BothStreamers
4 11 251 14:09 5816.522 059.193 4995 13350 251 15:39 5819.4 058.576 5303 13661 3D-GI G124 G124 124 OV OU 2*GI45/1056sec BothStreamers
4 11 251 15:39 5819.4 058.576 5304 13662 251 17:13 5819.952 057.106 6233 14592 3D-GI G125 G125 125 PB PA 2*GI45/1056sec BothStreamers
4 11 251 17:13 5819.952 057.106 6234 14593 251 18:52 5816.425 058.658 7209 15567 3D-GI G126 G126 126 NA NB 2*GI45/1056sec BothStreamers
4 11 251 18:52 5816.425 058.658 7210 15568 251 20:11 5819.99 056.851 7939 16350 3D-GI G127 G127 127 NH NG 2*GI45/1056sec BothStreamers
4 11 251 20:11 5819.99 056.851 7939 16350 251 21:37 5816.444 058.85 8792 17202 3D-GI G128 G128 128-129 MK ML 2*GI45/1056sec BothStreamers
4 11 251 21:37 5816.444 058.85 8793 17203 251 23:08 5819.861 057.008 9681 18091 3D-GI G129 G129 130 NQ NR 2*GI45/1056sec BothStreamers
4 11 251 23:08 5819.861 057.008 9682 18092 252 00:34 5816.62 058.835 10533 18950 3D-GI G130 G130 131 MS MT 2*GI45/1056sec BothStreamers
4 11 252 00:34 5816.62 058.835 10534 18951 252 02:16 5819.86 056.987 11544 19949 3D-GI G131 G131 132 NZ NY 2*GI45/1056sec BothStreamers
4 11 252 02:16 5819.86 056.987 11545 19950 252 03:43 5816.49 058.285 12438 20884 3D-GI G132 G132 133 MR MQ 2*GI45/1056sec BothStreamers
4 11 252 03:43 5816.49 058.285 12439 20885 252 05:14 5819.872 059.984 13347 21754 3D-GI G133 G133 134 NP NO 2*GI45/1056sec BothStreamers
4 11 252 05:14 5819.872 059.984 13348 21755 252 06:51 5816.592 058.71 14270 22693 3D-GI G134 G134 135 MO MP 2*GI45/1056sec BothStreamers
4 11 252 06:51 5816.592 058.71 14271 22694 252 08:24 5819.87 057.26 15208 23618 3D-GI G135 G135 136 NN NM 2*GI45/1056sec BothStreamers
4 11 252 08:24 5819.87 057.26 15209 23619 252 09:53 5816.345 058.381 16098 24510 3D-GI G136 G136 137 NK NL 2*GI45/1056sec BothStreamers
4 11 252 09:53 5816.345 058.381 16099 24511 252 11:20 5819.94 057.104 16951 25363 3D-GI G137 G137 138 MH MG 2*GI45/1056sec BothStreamers
4 11 252 11:20 5819.94 057.104 16952 25364 252 12:50 5816.45 058.31 17853 26261 3D-GI G138 G138 139 NE NF 2*GI45/1056sec BothStreamers
4 11 252 12:50 5816.45 058.31 17854 26262 252 14:28 5819.105 058.689 19193 27605 3D-GI G139 G139 140 MF ME 2*GI45/1056sec BothStreamers
4 11 252 14:28 5819.105 058.689 19194 27606 252 15:51 5816.533 058.593 19688 28046 3D-GI G140 G140 141 PD PC 2*GI45/1056sec BothStreamers
4 11 252 15:51 5816.533 058.593 19689 28047 252 17:16 5819.325 058.84 20494 28904 3D-GI G141 G141 142 ND NC 2*GI45/1056sec BothStreamers
4 11 252 17:16 5819.325 058.84 20495 28905 252 18:39 5816.398 058.622 21299 29729 3D-GI G142 G142 143 PL PK 2*GI45/1056sec BothStreamers
4 11 252 18:39 5816.398 058.622 21300 29730 252 20:15 5819.688 058.648 22250 30673 3D-GI G143 G143 144 MZ MY 2*GI45/1056sec BothStreamers
4 11 252 20:15 5819.688 058.648 22251 30674 252 21:38 5820.041 056.326 23077 31502 3D-GI G144 G144 145 PH PG 2*GI45/1056sec BothStreamers
4 11 252 21:38 5820.041 056.326 23078 31503 252 23:42 5814.035 055.924 24318 32745 3D-GI G145 G145 146 MW MX 2*GI45/1056sec BothStreamers
4 11 252 23:42 5814.035 055.924 24319 32746 253 00:39 5819.94 057.04 24878 33289 3D-GI G146 G146 147 PI PJ 2*GI45/1056sec BothStreamers
4 11 253 00:39 5819.94 057.04 24879 33290 253 02:04 5816.39 059.16 25727 34140 3D-GI G147 G147 148 MU MV 2*GI45/1056sec BothStreamers
4 11 253 02:04 5816.39 059.16 25728 34141 253 03:29 5820.034 058.88 26559 34958 3D-GI G148 G148 149 OP OO 2*GI45/1056sec BothStreamers
4 11 253 03:29 5820.034 058.88 26560 34959 253 04:48 5816.471 059.083 27350 35766 3D-GI G149 G149 150 MM MN 2*GI45/1056sec BothStreamers
4 11 253 04:48 5816.471 059.083 27351 35767 253 06:07 5819.864 056.754 28122 36352 3D-GI G150 G150 151 OL OK 2*GI45/1056sec BothStreamers
4 11 253 06:07 5819.864 056.754 28123 36353 253 07:34 5816.431 059.03 28997 37416 3D-GI G151 G151 152 LX LW 2*GI45/1056sec BothStreamers
4 11 253 07:34 5816.431 059.03 28998 37417 253 08:55 5819.996 056.574 29808 38222 3D-GI G152 G152 153 OH OG 2*GI45/1056sec BothStreamers
4 11 253 08:55 5819.996 056.574 29809 38223 253 10:22 5816.328 058.015 30656 39069 3D-GI G153 G153 154 LO LP 2*GI45/1056sec BothStreamers
4 11 253 10:22 5816.328 058.015 30657 39070 253 11:35 5820.024 056.46 31397 39823 3D-GI G154 G154 155 OD OC 2*GI45/1056sec BothStreamers
4 11 253 11:35 5820.024 056.46 31398 39824 253 12:57 5816.48 058.84 32191 40617 3D-GI G155 G155 156 LH LG 2*GI45/1056sec BothStreamers
4 11 253 12:57 5816.48 058.84 32192 40618 253 14:34 5818.935 10.602 33159 41582 3D-GI G156 G156 157 NV NU 2*GI45/1056sec BothStreamers
4 11 253 14:34 5818.935 10.602 33160 41583 253 15:22 5815.906 056.149 33630 42056 3D-GI G157 G157 158 PN PM 2*GI45/1056sec BothStreamers
5 10 253 20:09 5818.293 057.96 253 21:01 5815.063 057.985 Initial_line DTS300J1s 100917.200902
Collectedminilander
DepartedsurveyareaforLeith
DeployedMinilanderandretrievedOBS.
DeepTowsparkerconnectorfailed.Endofseismicsurvey
headingtoPM-PN