th annual baml summer bus tour – houston, tx
TRANSCRIPT
5TH ANNUAL BAML SUMMER BUS TOUR – HOUSTON, TX AUGUST 27, 2014
Forward Looking Statements
Some of the information included herein may contain forward-looking statements within the meaning of the federal securities laws.
Forward-looking statements give our current expectations and may contain projections of results of operations or of financial
condition, or forecasts of future events. Words such as “may,” “assume,” “forecast,” “position,” “predict,” “strategy,” “expect,”
“intend,” “plan,” “estimate,” “anticipate,” “could,” “believe,” “project,” “budget,” “potential,” or “continue,” and similar expressions are
used to identify forward-looking statements. They can be affected by assumptions used or by known or unknown risks or
uncertainties. Consequently, no expected results of operations or financial condition or other forward-looking statements can be
guaranteed. When considering these forward-looking statements, you should keep in mind the risk factors and other cautionary
statements in Hi-Crush Partners LP’s (“Hi-Crush”) reports filed with the Securities and Exchange Commission (“SEC”), including
those described under Item 1A, “Risk Factors” of Hi-Crush’s Annual Report on Form 10-K for the fiscal year ended December 31,
2013 and any subsequently filed Quarterly Report on Form 10-Q. Actual results may vary materially. You are cautioned not to
place undue reliance on any forward-looking statements. You should also understand that it is not possible to predict or identify all
such factors and should not consider the risk factors in our reports filed with the SEC or the following list to be a complete
statement of all potential risks and uncertainties. Factors that could cause our actual results to differ materially from the results
contemplated by such forward-looking statements include: the volume of frac sand we are able to sell; the price at which we are
able to sell frac sand; the outcome of any pending litigation; changes in the price and availability of natural gas or electricity;
changes in prevailing economic conditions; and difficulty collecting receivables. All forward-looking statements are expressly
qualified in their entirety by the foregoing cautionary statements. Hi-Crush’s forward-looking statements speak only as of the date
made and Hi-Crush undertakes no obligation to update or revise its forward-looking statements, whether as a result of new
information, future events or otherwise.
2
A Portfolio of Opportunity
3
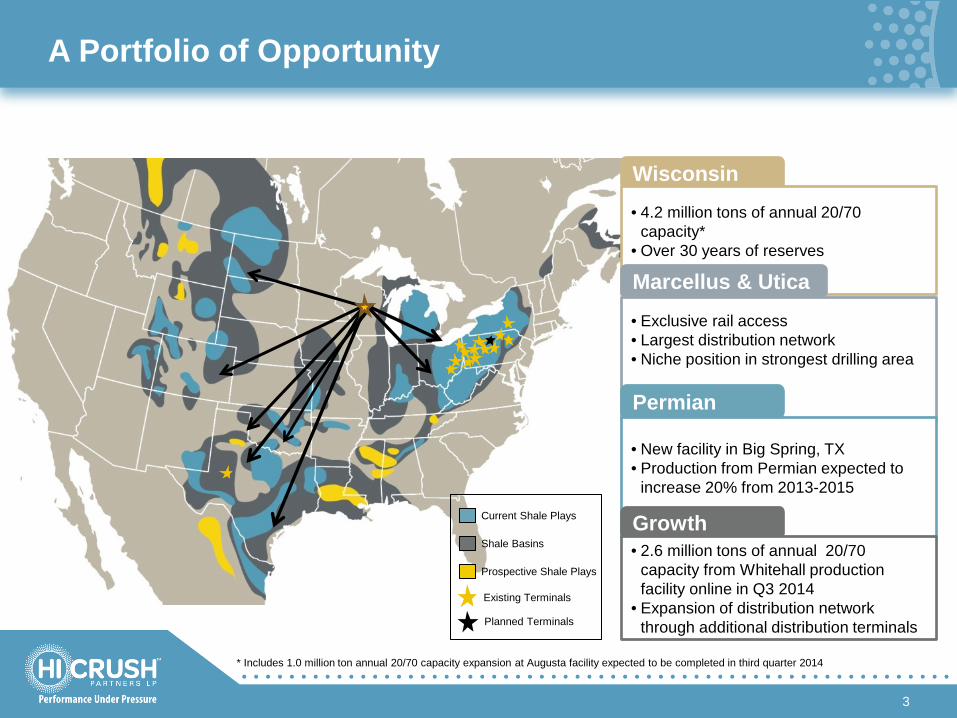
Wisconsin • 4.2 million tons of annual 20/70
capacity* • Over 30 years of reserves Marcellus & Utica
• Exclusive rail access • Largest distribution network • Niche position in strongest drilling area
Permian
• New facility in Big Spring, TX • Production from Permian expected to
increase 20% from 2013-2015
Growth • 2.6 million tons of annual 20/70
capacity from Whitehall production facility online in Q3 2014
• Expansion of distribution network through additional distribution terminals
Current Shale Plays
Shale Basins
Prospective Shale Plays
Existing Terminals
Planned Terminals
* Includes 1.0 million ton annual 20/70 capacity expansion at Augusta facility expected to be completed in third quarter 2014
Hi-Crush’s Competitive Advantages
4
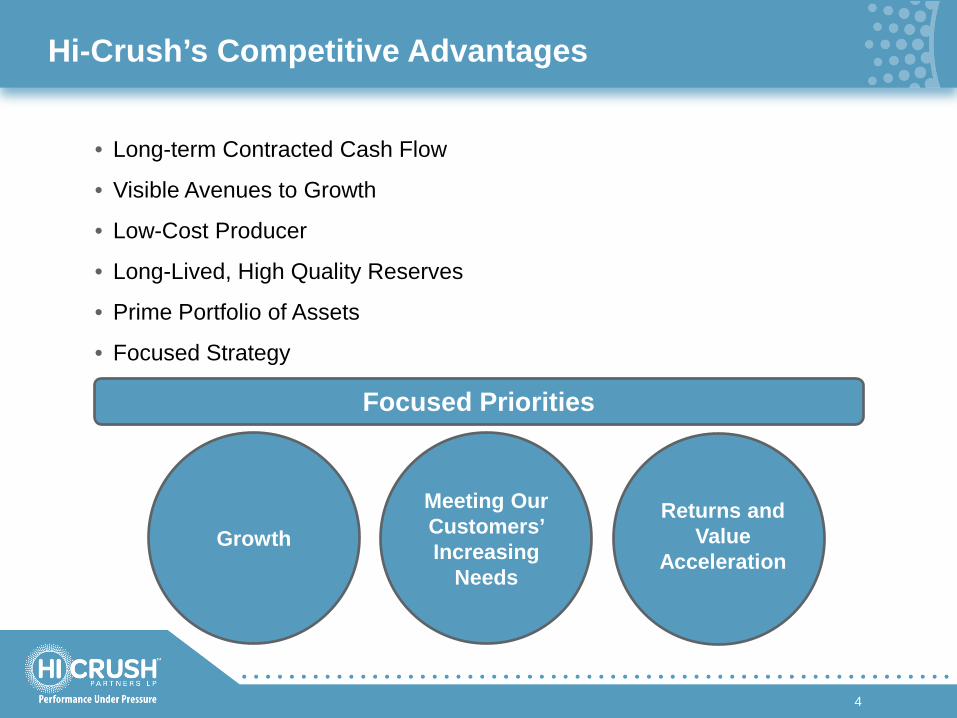
• Long-term Contracted Cash Flow
• Visible Avenues to Growth
• Low-Cost Producer
• Long-Lived, High Quality Reserves
• Prime Portfolio of Assets
• Focused Strategy
Focused Priorities
Growth
Meeting Our Customers’ Increasing
Needs
Returns and Value
Acceleration
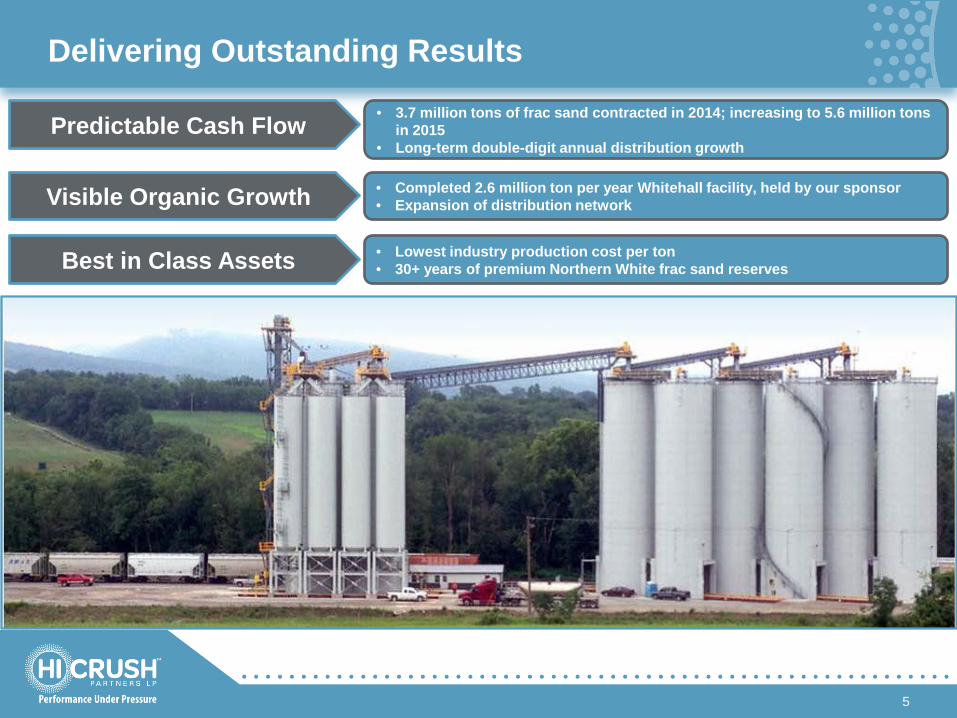
Delivering Outstanding Results
5
Predictable Cash Flow
Visible Organic Growth
Best in Class Assets
• Completed 2.6 million ton per year Whitehall facility, held by our sponsor • Expansion of distribution network
• Lowest industry production cost per ton • 30+ years of premium Northern White frac sand reserves
• 3.7 million tons of frac sand contracted in 2014; increasing to 5.6 million tons in 2015
• Long-term double-digit annual distribution growth
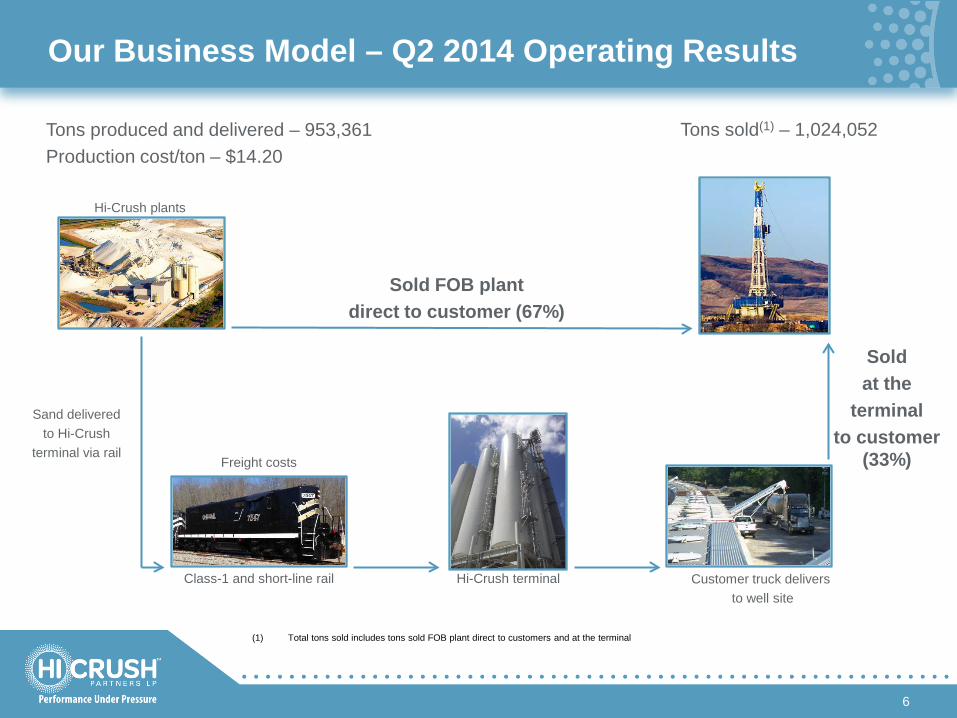
Our Business Model – Q2 2014 Operating Results
6
Sold FOB plant direct to customer (67%)
Hi-Crush terminal
Freight costs
Hi-Crush plants
Tons produced and delivered – 953,361 Production cost/ton – $14.20
Sold at the
terminal to customer
(33%)
Sand delivered to Hi-Crush
terminal via rail
Tons sold(1) – 1,024,052
Class-1 and short-line rail Customer truck delivers to well site
(1) Total tons sold includes tons sold FOB plant direct to customers and at the terminal
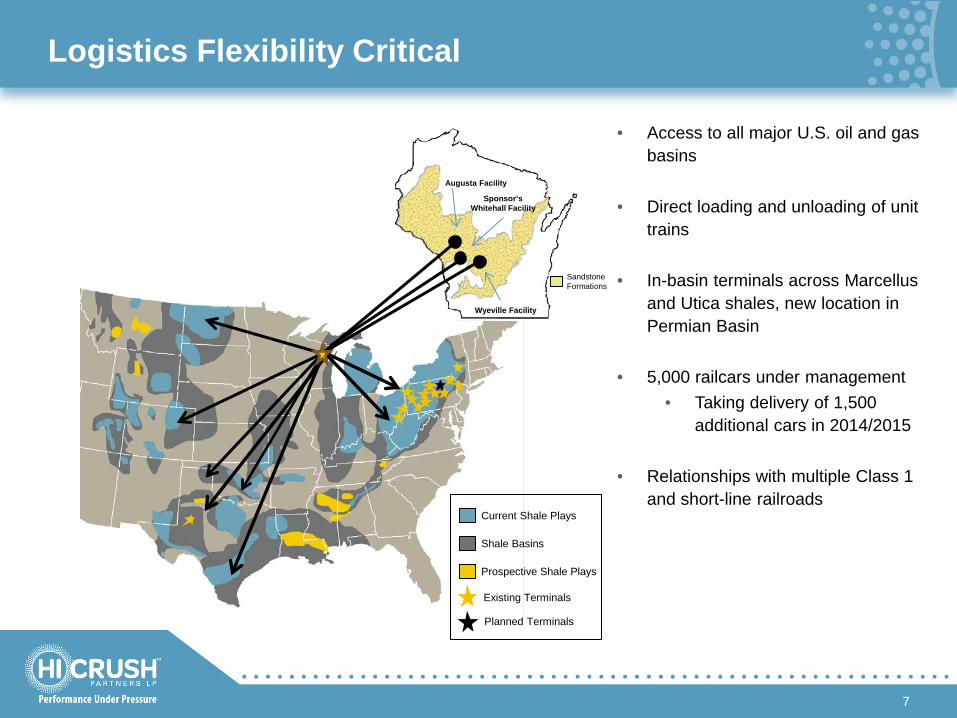
Logistics Flexibility Critical
Augusta Facility
Wyeville Facility
Sandstone Formations
• Access to all major U.S. oil and gas basins
• Direct loading and unloading of unit trains
• In-basin terminals across Marcellus and Utica shales, new location in Permian Basin
• 5,000 railcars under management • Taking delivery of 1,500
additional cars in 2014/2015
• Relationships with multiple Class 1 and short-line railroads
Current Shale Plays
Shale Basins
Prospective Shale Plays
Existing Terminals
Sponsor’s Whitehall Facility
7
Planned Terminals
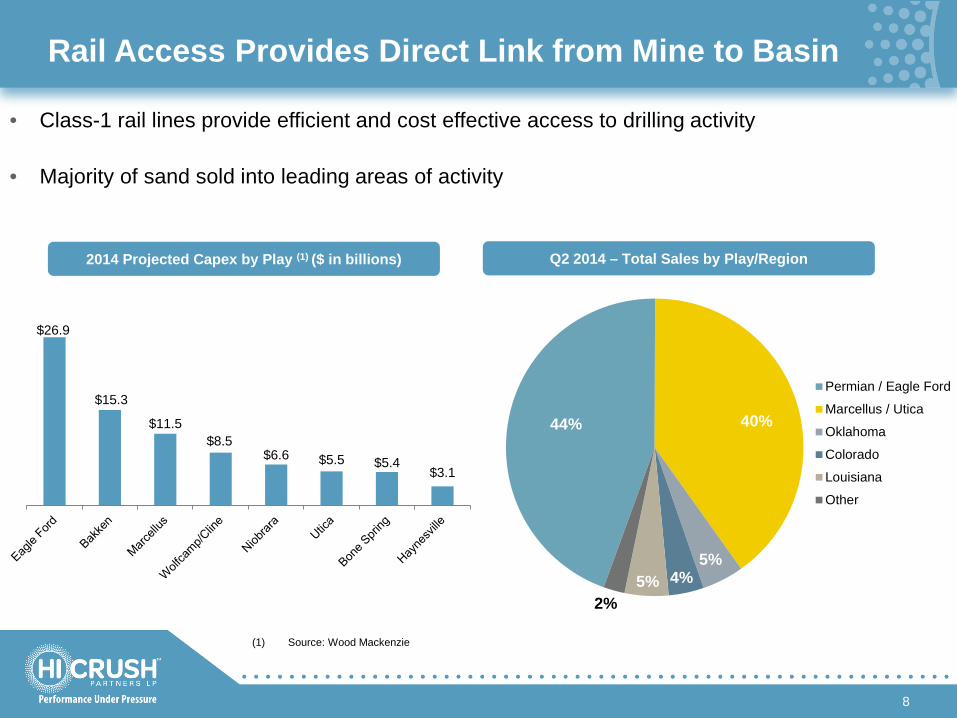
Rail Access Provides Direct Link from Mine to Basin
8
44% 40%
5% 4% 5%
2%
Permian / Eagle Ford
Marcellus / Utica
Oklahoma
Colorado
Louisiana
Other
• Class-1 rail lines provide efficient and cost effective access to drilling activity
• Majority of sand sold into leading areas of activity
Q2 2014 – Total Sales by Play/Region
$26.9
$15.3
$11.5 $8.5
$6.6 $5.5 $5.4 $3.1
2014 Projected Capex by Play (1) ($ in billions)
(1) Source: Wood Mackenzie
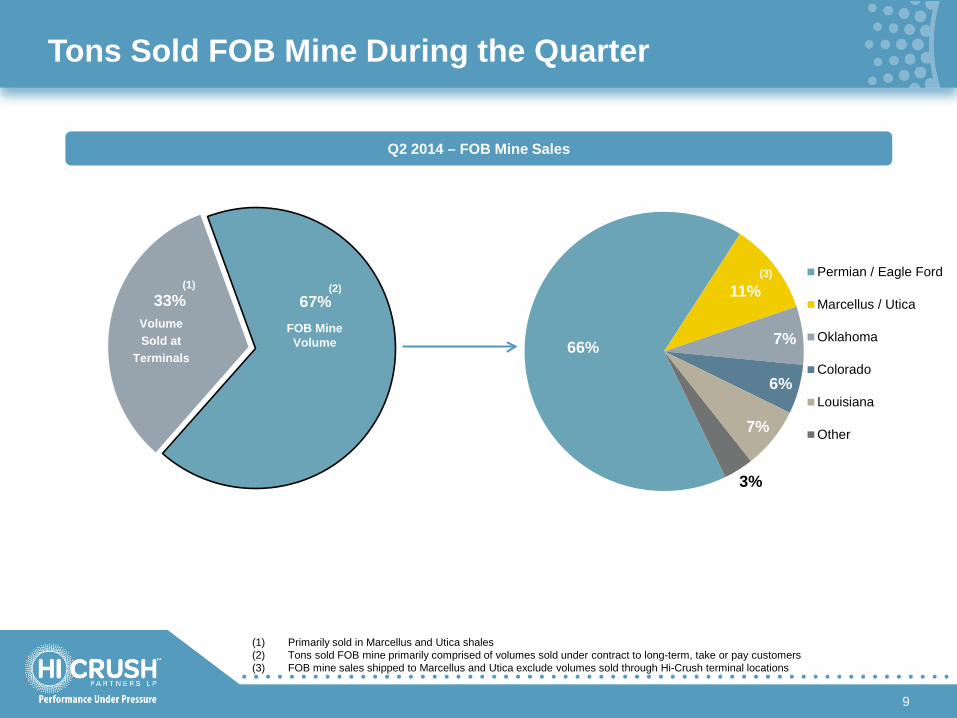
67% 33%
Tons Sold FOB Mine During the Quarter
9
FOB Mine Volume
(1) Primarily sold in Marcellus and Utica shales (2) Tons sold FOB mine primarily comprised of volumes sold under contract to long-term, take or pay customers (3) FOB mine sales shipped to Marcellus and Utica exclude volumes sold through Hi-Crush terminal locations
(2)
66%
11%
7%
6%
7%
3%
Permian / Eagle Ford
Marcellus / Utica
Oklahoma
Colorado
Louisiana
Other
(3)
Q2 2014 – FOB Mine Sales
Volume Sold at
Terminals
(1)
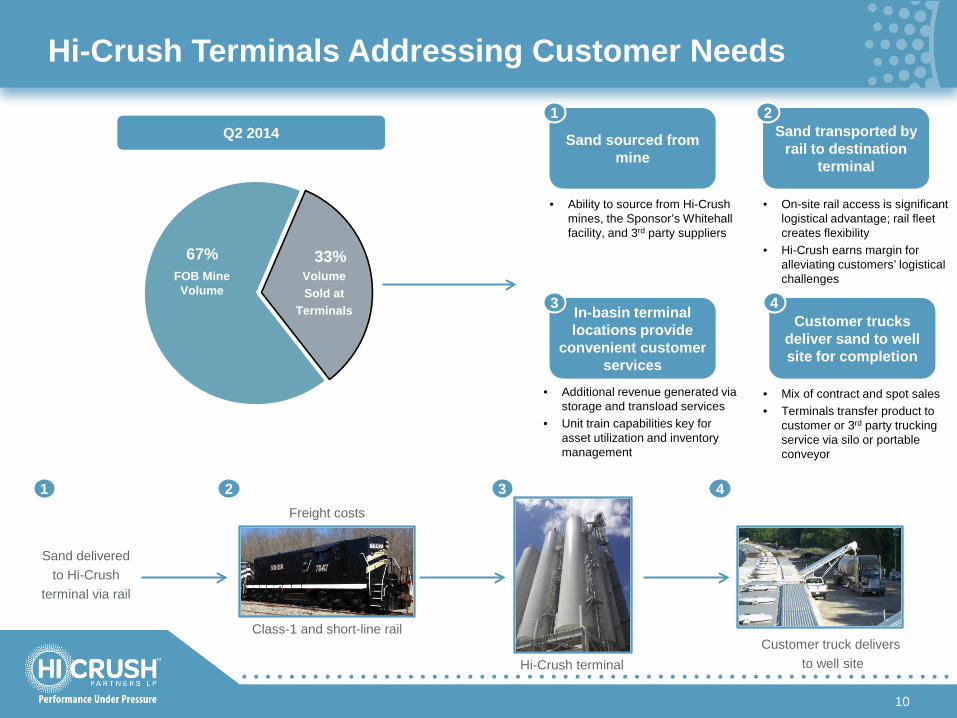
67% 33%
Hi-Crush Terminals Addressing Customer Needs
10
Hi-Crush terminal
Freight costs
Sand delivered to Hi-Crush
terminal via rail
Class-1 and short-line rail Customer truck delivers
to well site
Volume Sold at
Terminals
Sand sourced from mine
1
1 2 3 4
Sand transported by rail to destination
terminal
2
In-basin terminal locations provide
convenient customer services
3 Customer trucks
deliver sand to well site for completion
4
• Ability to source from Hi-Crush mines, the Sponsor’s Whitehall facility, and 3rd party suppliers
• On-site rail access is significant logistical advantage; rail fleet creates flexibility
• Hi-Crush earns margin for alleviating customers’ logistical challenges
• Additional revenue generated via storage and transload services
• Unit train capabilities key for asset utilization and inventory management
• Mix of contract and spot sales • Terminals transfer product to
customer or 3rd party trucking service via silo or portable conveyor
Q2 2014
FOB Mine Volume
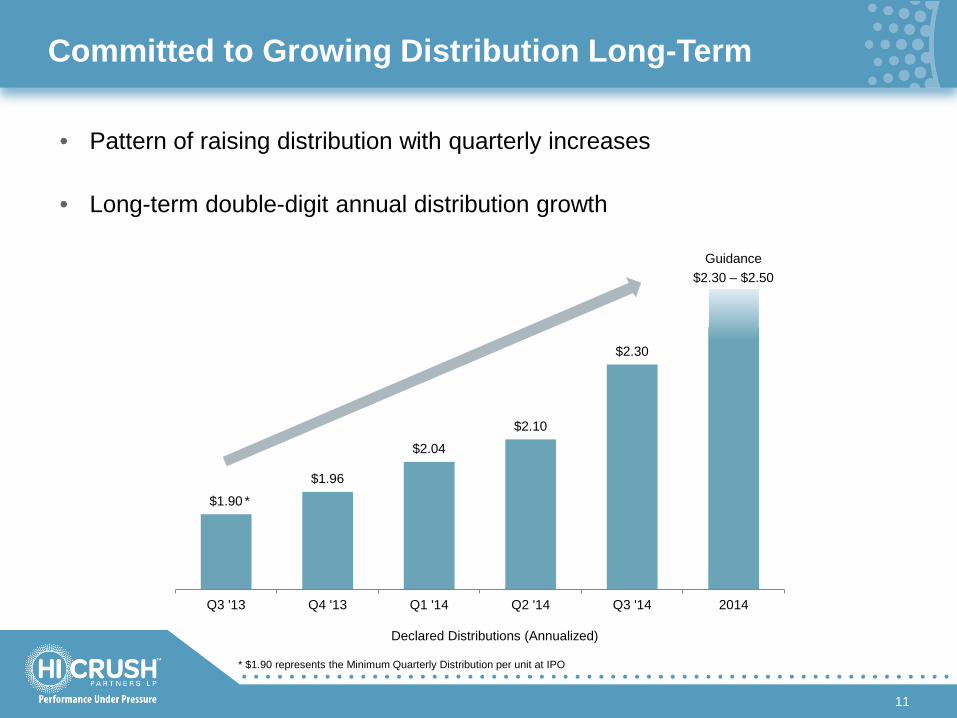
Committed to Growing Distribution Long-Term
11
• Pattern of raising distribution with quarterly increases
• Long-term double-digit annual distribution growth
Declared Distributions (Annualized)
$1.90
$1.96
$2.04
$2.10
$2.30
Q3 '13 Q4 '13 Q1 '14 Q2 '14 Q3 '14 2014
Guidance $2.30 – $2.50
*
* $1.90 represents the Minimum Quarterly Distribution per unit at IPO
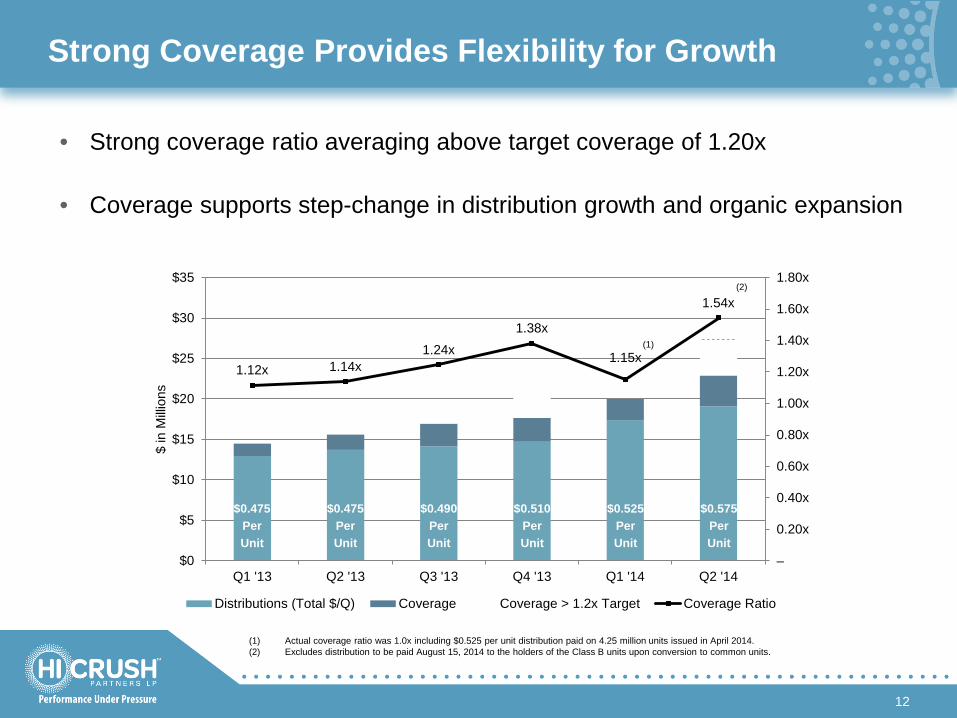
1.12x 1.14x 1.24x
1.38x
1.15x
1.54x
–
0.20x
0.40x
0.60x
0.80x
1.00x
1.20x
1.40x
1.60x
1.80x
$0
$5
$10
$15
$20
$25
$30
$35
Q1 '13 Q2 '13 Q3 '13 Q4 '13 Q1 '14 Q2 '14
$ in
Milli
ons
Distributions (Total $/Q) Coverage Coverage > 1.2x Target Coverage Ratio
Strong Coverage Provides Flexibility for Growth
12
• Strong coverage ratio averaging above target coverage of 1.20x
• Coverage supports step-change in distribution growth and organic expansion
$0.475 Per Unit
$0.475 Per Unit
$0.490 Per Unit
$0.510 Per Unit
$0.525 Per Unit
$0.575 Per Unit
(1) Actual coverage ratio was 1.0x including $0.525 per unit distribution paid on 4.25 million units issued in April 2014. (2) Excludes distribution to be paid August 15, 2014 to the holders of the Class B units upon conversion to common units.
(1)
(2)
Positioned to Meet Demand Growth
13
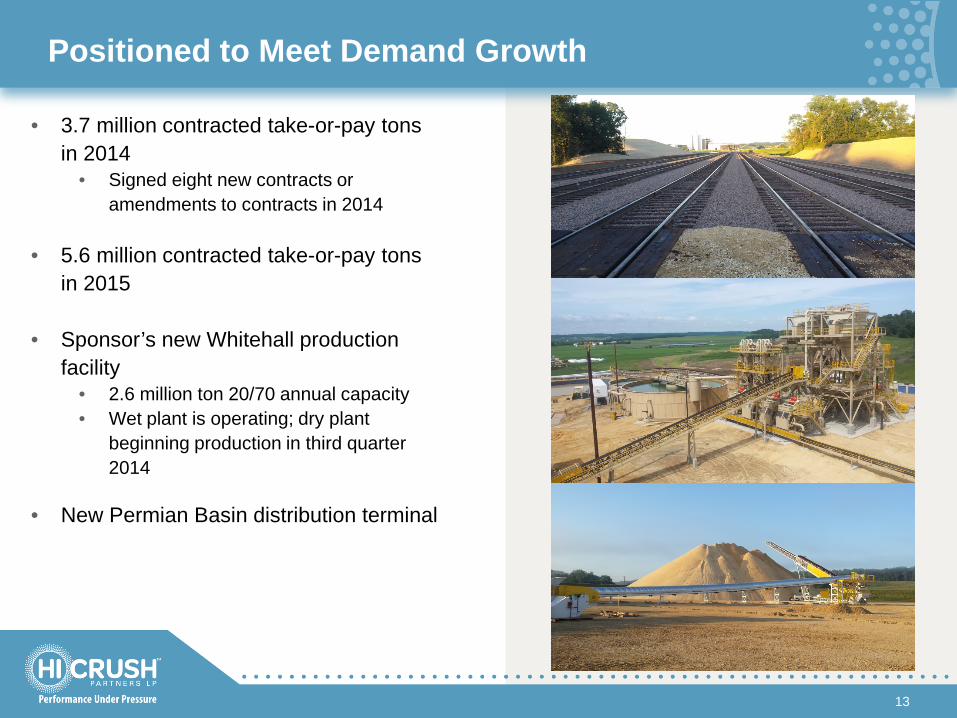
• 3.7 million contracted take-or-pay tons in 2014
• Signed eight new contracts or amendments to contracts in 2014
• 5.6 million contracted take-or-pay tons
in 2015
• Sponsor’s new Whitehall production facility
• 2.6 million ton 20/70 annual capacity • Wet plant is operating; dry plant
beginning production in third quarter 2014
• New Permian Basin distribution terminal

Industry Backdrop
Operator Activity Driving Frac Sand Demand Growth
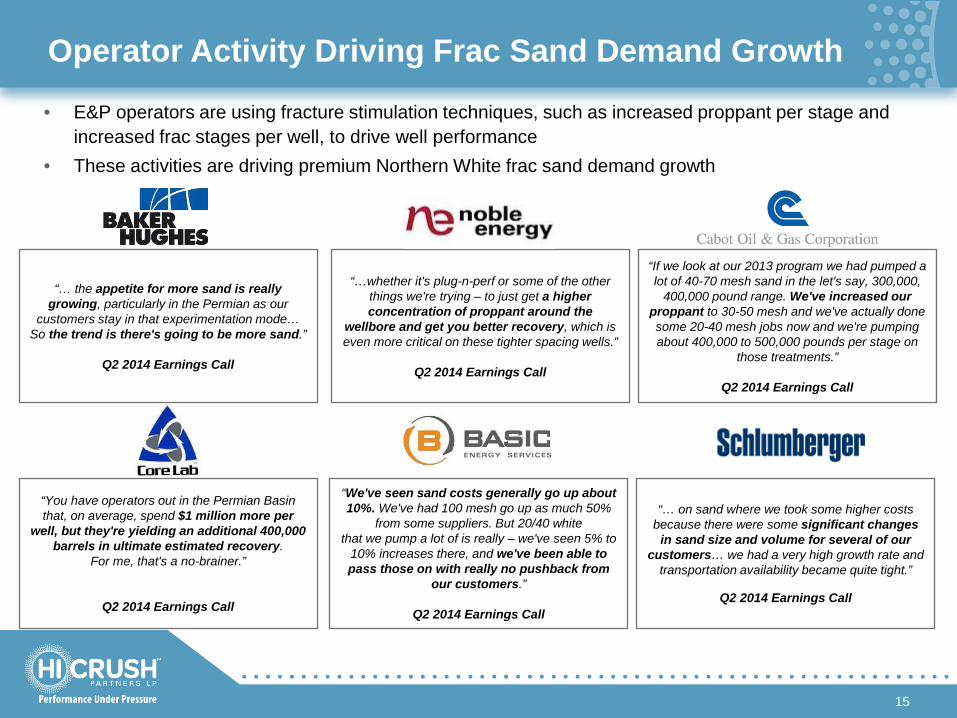
“… the appetite for more sand is really growing, particularly in the Permian as our
customers stay in that experimentation mode… So the trend is there's going to be more sand.”
Q2 2014 Earnings Call
“If we look at our 2013 program we had pumped a lot of 40-70 mesh sand in the let's say, 300,000,
400,000 pound range. We've increased our proppant to 30-50 mesh and we've actually done some 20-40 mesh jobs now and we're pumping about 400,000 to 500,000 pounds per stage on
those treatments.”
Q2 2014 Earnings Call
“You have operators out in the Permian Basin that, on average, spend $1 million more per
well, but they're yielding an additional 400,000 barrels in ultimate estimated recovery.
For me, that's a no-brainer.”
Q2 2014 Earnings Call
“We've seen sand costs generally go up about 10%. We've had 100 mesh go up as much 50%
from some suppliers. But 20/40 white that we pump a lot of is really – we've seen 5% to
10% increases there, and we've been able to pass those on with really no pushback from
our customers.”
Q2 2014 Earnings Call
“…whether it's plug-n-perf or some of the other things we're trying – to just get a higher concentration of proppant around the
wellbore and get you better recovery, which is even more critical on these tighter spacing wells.”
Q2 2014 Earnings Call
“… on sand where we took some higher costs because there were some significant changes
in sand size and volume for several of our customers… we had a very high growth rate and
transportation availability became quite tight.”
Q2 2014 Earnings Call
• E&P operators are using fracture stimulation techniques, such as increased proppant per stage and increased frac stages per well, to drive well performance
• These activities are driving premium Northern White frac sand demand growth
15
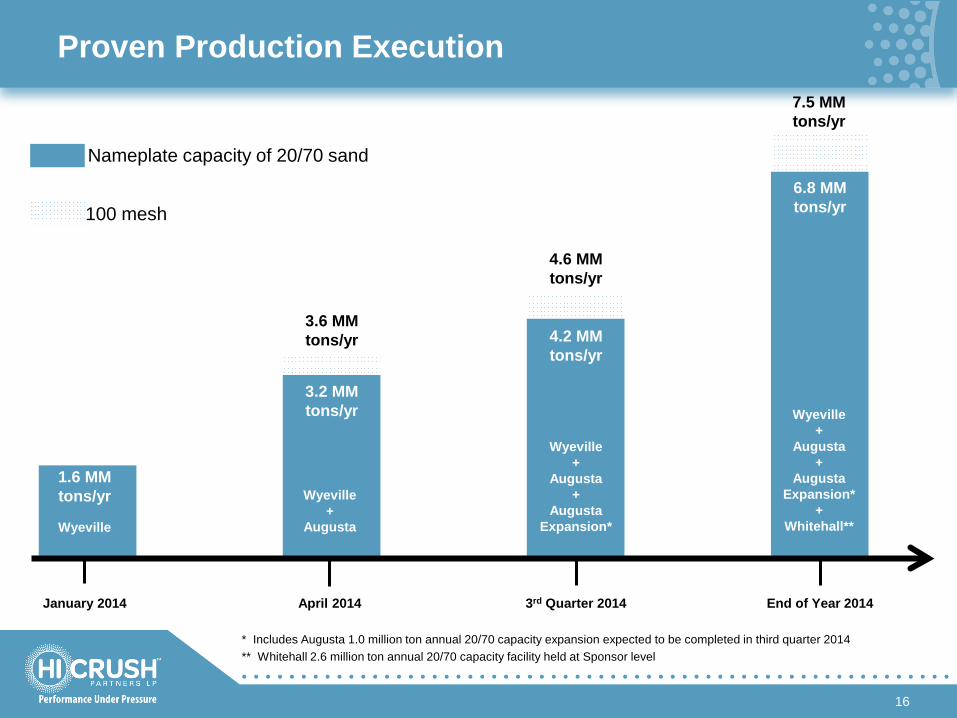
Proven Production Execution
* Includes Augusta 1.0 million ton annual 20/70 capacity expansion expected to be completed in third quarter 2014 ** Whitehall 2.6 million ton annual 20/70 capacity facility held at Sponsor level
January 2014 April 2014 3rd Quarter 2014 End of Year 2014
16
Wyeville
Wyeville +
Augusta
Wyeville +
Augusta +
Augusta Expansion*
Wyeville +
Augusta +
Augusta Expansion*
+ Whitehall**
3.2 MM tons/yr
4.2 MM tons/yr
6.8 MM tons/yr
1.6 MM tons/yr
3.6 MM tons/yr
4.6 MM tons/yr
7.5 MM tons/yr
Nameplate capacity of 20/70 sand
100 mesh
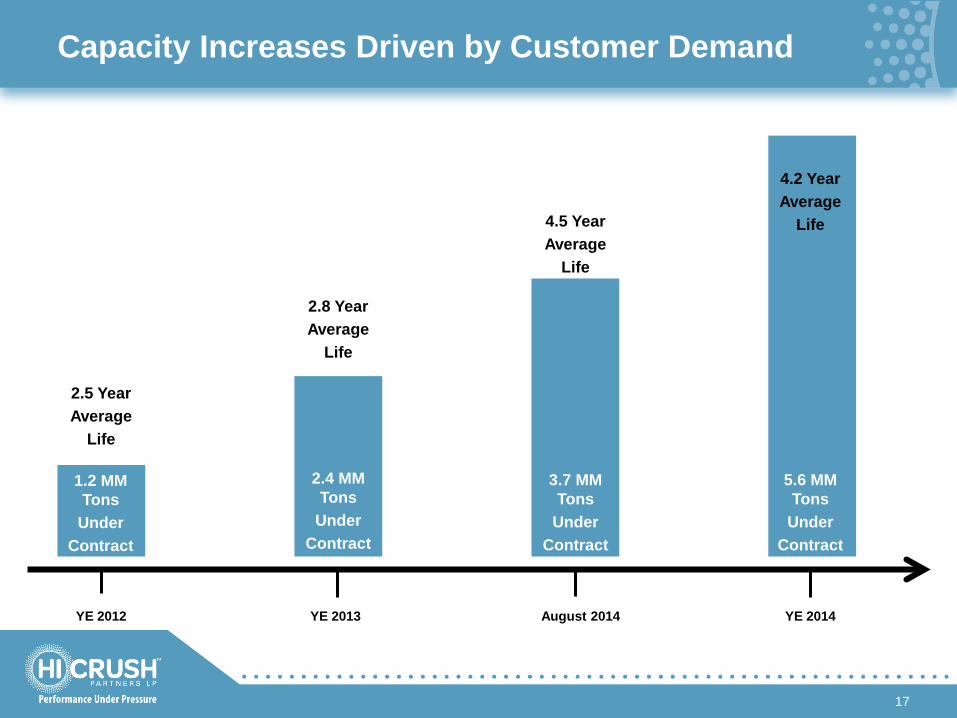
Capacity Increases Driven by Customer Demand
YE 2012 YE 2013 August 2014
17
1.2 MM Tons
Under Contract
2.4 MM Tons
Under Contract
3.7 MM Tons
Under Contract
5.6 MM Tons
Under Contract
2.8 Year Average
Life
4.5 Year Average
Life
2.5 Year Average
Life
4.2 Year Average
Life
YE 2014
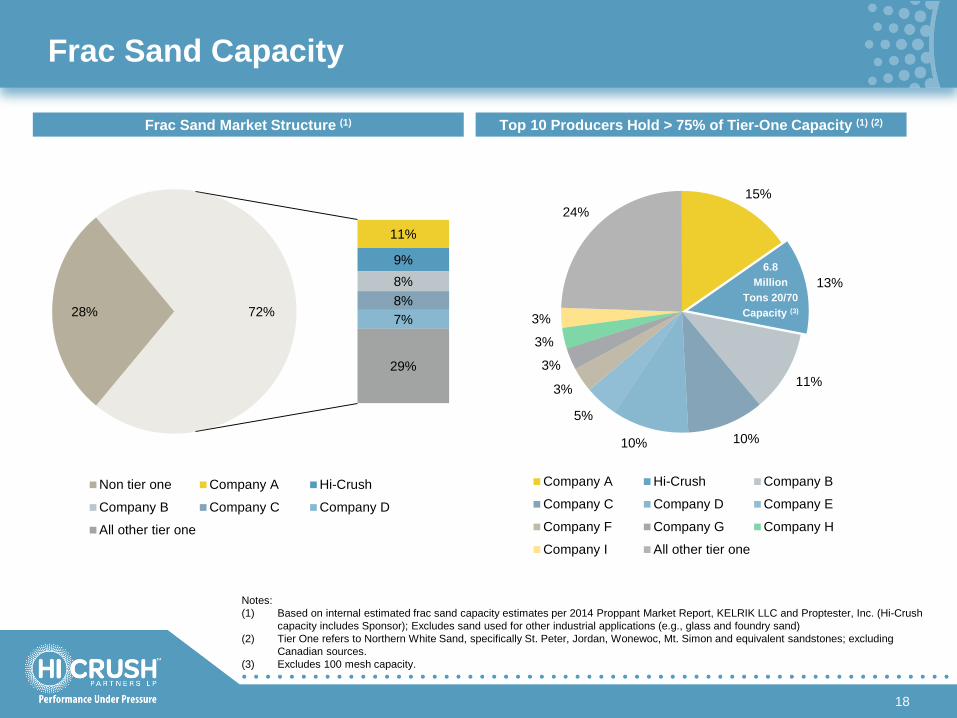
Frac Sand Capacity
18
Frac Sand Market Structure (1) Top 10 Producers Hold > 75% of Tier-One Capacity (1) (2)
Notes: (1) Based on internal estimated frac sand capacity estimates per 2014 Proppant Market Report, KELRIK LLC and Proptester, Inc. (Hi-Crush
capacity includes Sponsor); Excludes sand used for other industrial applications (e.g., glass and foundry sand) (2) Tier One refers to Northern White Sand, specifically St. Peter, Jordan, Wonewoc, Mt. Simon and equivalent sandstones; excluding
Canadian sources. (3) Excludes 100 mesh capacity.
15%
13%
11%
10% 10%
5%
3%
3%
3%
3%
24%
Company A Hi-Crush Company B
Company C Company D Company E
Company F Company G Company H
Company I All other tier one
6.8 Million
Tons 20/70 Capacity (3) 28%
11%
9% 8% 8% 7%
29%
72%
Non tier one Company A Hi-Crush
Company B Company C Company D
All other tier one
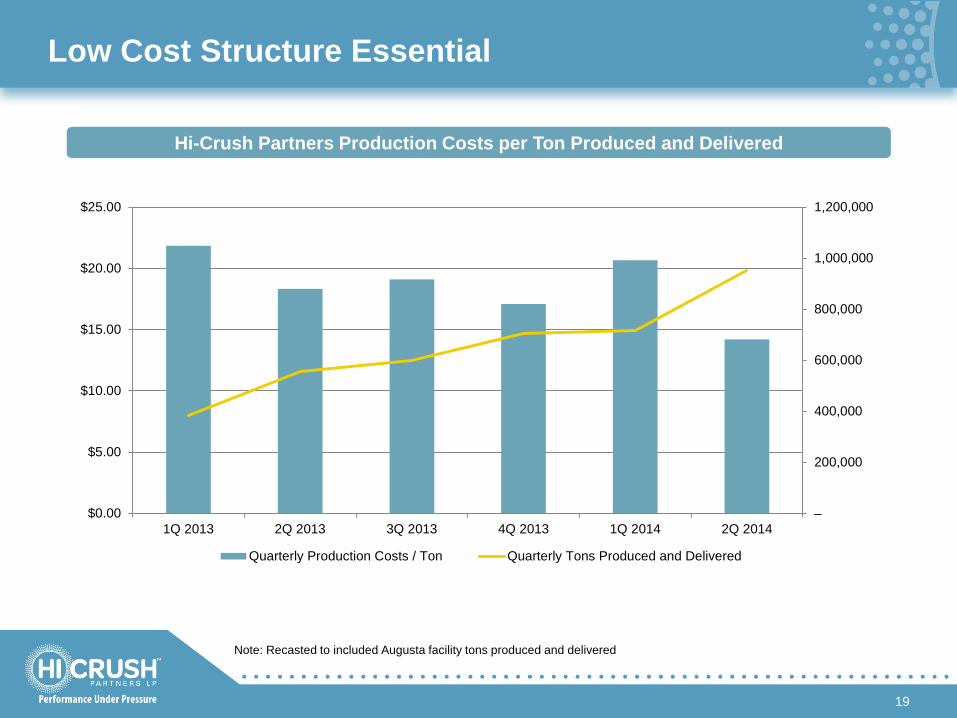
Low Cost Structure Essential
19
Hi-Crush Partners Production Costs per Ton Produced and Delivered
Note: Recasted to included Augusta facility tons produced and delivered
–
200,000
400,000
600,000
800,000
1,000,000
1,200,000
$0.00
$5.00
$10.00
$15.00
$20.00
$25.00
1Q 2013 2Q 2013 3Q 2013 4Q 2013 1Q 2014 2Q 2014
Quarterly Production Costs / Ton Quarterly Tons Produced and Delivered
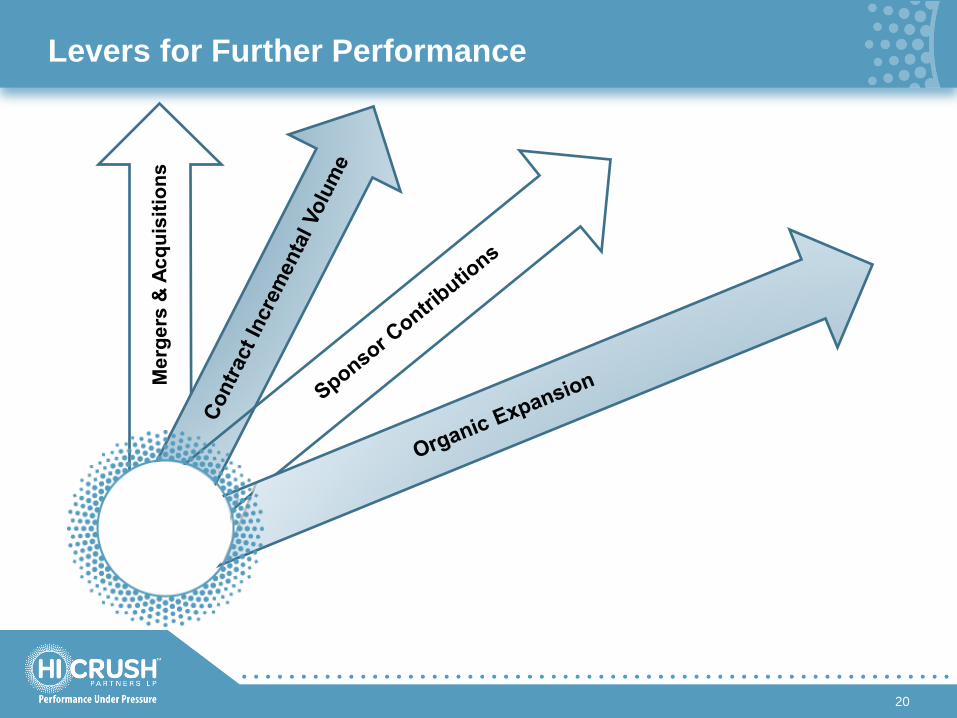
Levers for Further Performance
20
Appendix
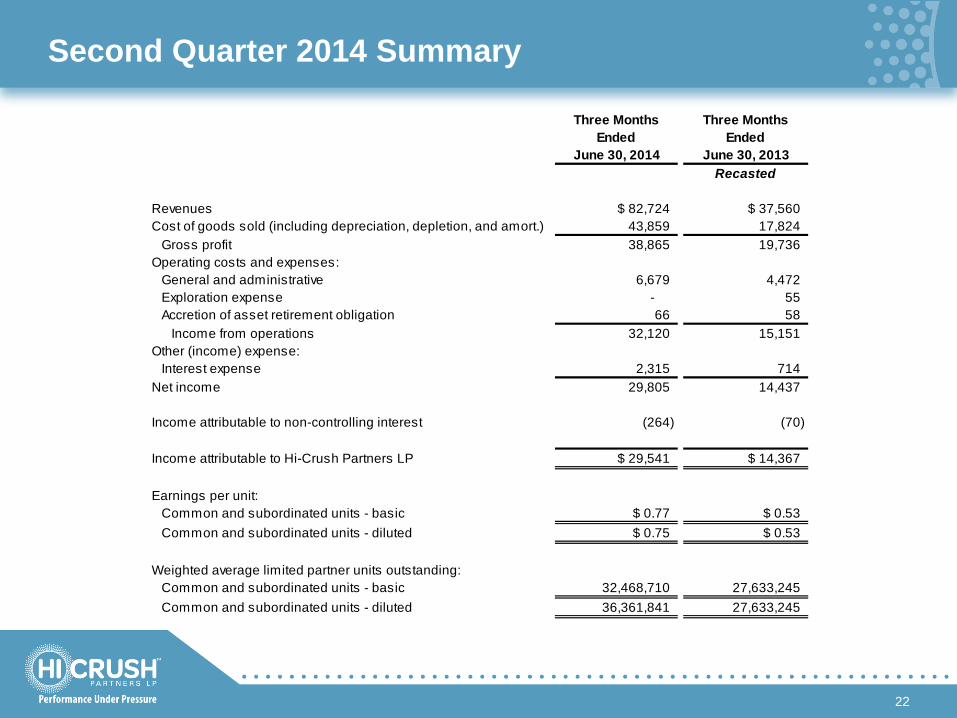
Second Quarter 2014 Summary
22
Three Months Three MonthsEnded Ended
June 30, 2014 June 30, 2013Recasted
Revenues $ 82,724 $ 37,560 Cost of goods sold (including depreciation, depletion, and amort.) 43,859 17,824
Gross profit 38,865 19,736 Operating costs and expenses:
General and administrative 6,679 4,472 Exploration expense - 55 Accretion of asset retirement obligation 66 58
Income from operations 32,120 15,151 Other (income) expense:
Interest expense 2,315 714 Net income 29,805 14,437
Income attributable to non-controlling interest (264) (70)
Income attributable to Hi-Crush Partners LP $ 29,541 $ 14,367
Earnings per unit:Common and subordinated units - basic $ 0.77 $ 0.53 Common and subordinated units - diluted $ 0.75 $ 0.53
Weighted average limited partner units outstanding:Common and subordinated units - basic 32,468,710 27,633,245 Common and subordinated units - diluted 36,361,841 27,633,245
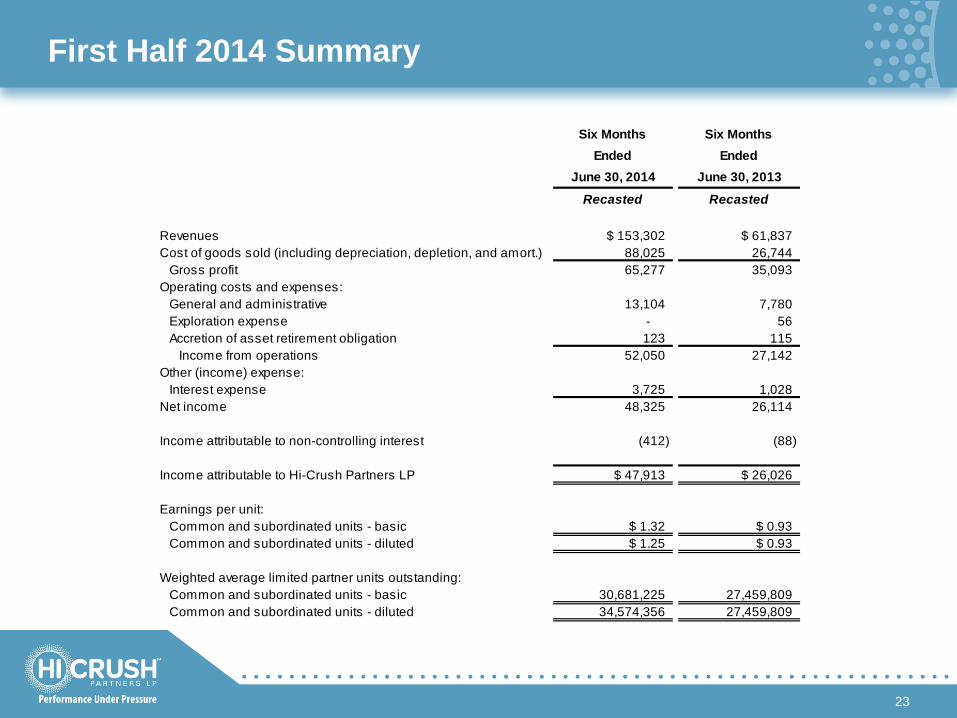
First Half 2014 Summary
23
Six Months Six MonthsEnded Ended
June 30, 2014 June 30, 2013
Recasted Recasted
Revenues $ 153,302 $ 61,837 Cost of goods sold (including depreciation, depletion, and amort.) 88,025 26,744
Gross profit 65,277 35,093 Operating costs and expenses:
General and administrative 13,104 7,780 Exploration expense - 56 Accretion of asset retirement obligation 123 115
Income from operations 52,050 27,142 Other (income) expense:
Interest expense 3,725 1,028 Net income 48,325 26,114
Income attributable to non-controlling interest (412) (88)
Income attributable to Hi-Crush Partners LP $ 47,913 $ 26,026
Earnings per unit:Common and subordinated units - basic $ 1.32 $ 0.93 Common and subordinated units - diluted $ 1.25 $ 0.93
Weighted average limited partner units outstanding:Common and subordinated units - basic 30,681,225 27,459,809 Common and subordinated units - diluted 34,574,356 27,459,809
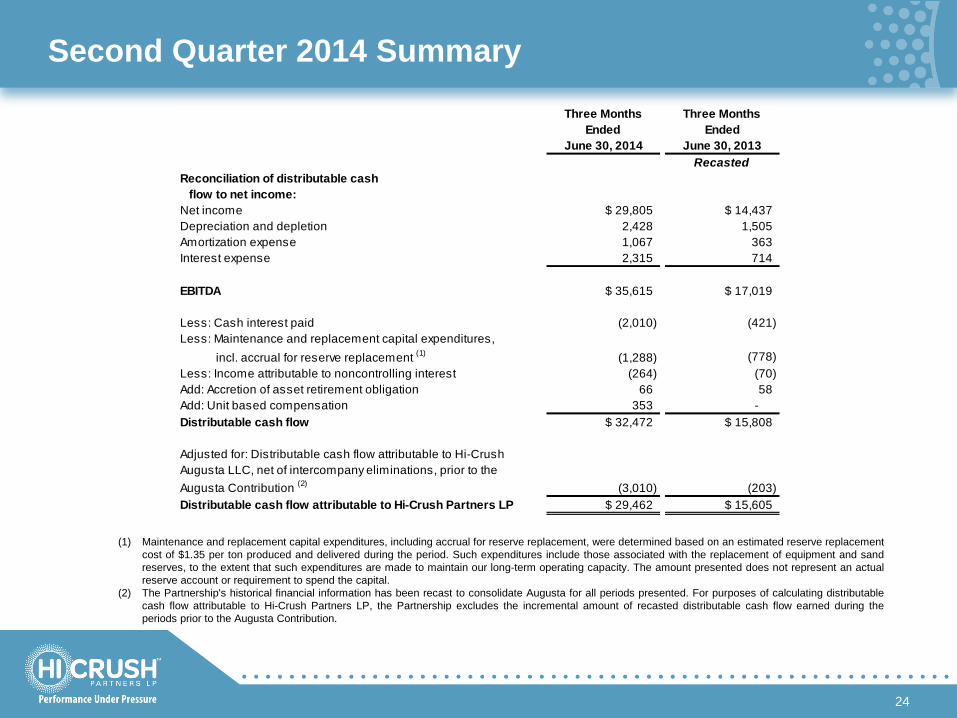
Second Quarter 2014 Summary
(1) Maintenance and replacement capital expenditures, including accrual for reserve replacement, were determined based on an estimated reserve replacement cost of $1.35 per ton produced and delivered during the period. Such expenditures include those associated with the replacement of equipment and sand reserves, to the extent that such expenditures are made to maintain our long-term operating capacity. The amount presented does not represent an actual reserve account or requirement to spend the capital.
(2) The Partnership's historical financial information has been recast to consolidate Augusta for all periods presented. For purposes of calculating distributable cash flow attributable to Hi-Crush Partners LP, the Partnership excludes the incremental amount of recasted distributable cash flow earned during the periods prior to the Augusta Contribution.
24
Three Months Three MonthsEnded Ended
June 30, 2014 June 30, 2013Recasted
Reconciliation of distributable cash flow to net income:Net income $ 29,805 $ 14,437 Depreciation and depletion 2,428 1,505 Amortization expense 1,067 363 Interest expense 2,315 714
EBITDA $ 35,615 $ 17,019
Less: Cash interest paid (2,010) (421) Less: Maintenance and replacement capital expenditures, incl. accrual for reserve replacement (1) (1,288) (778) Less: Income attributable to noncontrolling interest (264) (70) Add: Accretion of asset retirement obligation 66 58 Add: Unit based compensation 353 - Distributable cash flow $ 32,472 $ 15,808
Adjusted for: Distributable cash flow attributable to Hi-Crush Augusta LLC, net of intercompany eliminations, prior to the Augusta Contribution (2) (3,010) (203) Distributable cash flow attributable to Hi-Crush Partners LP $ 29,462 $ 15,605
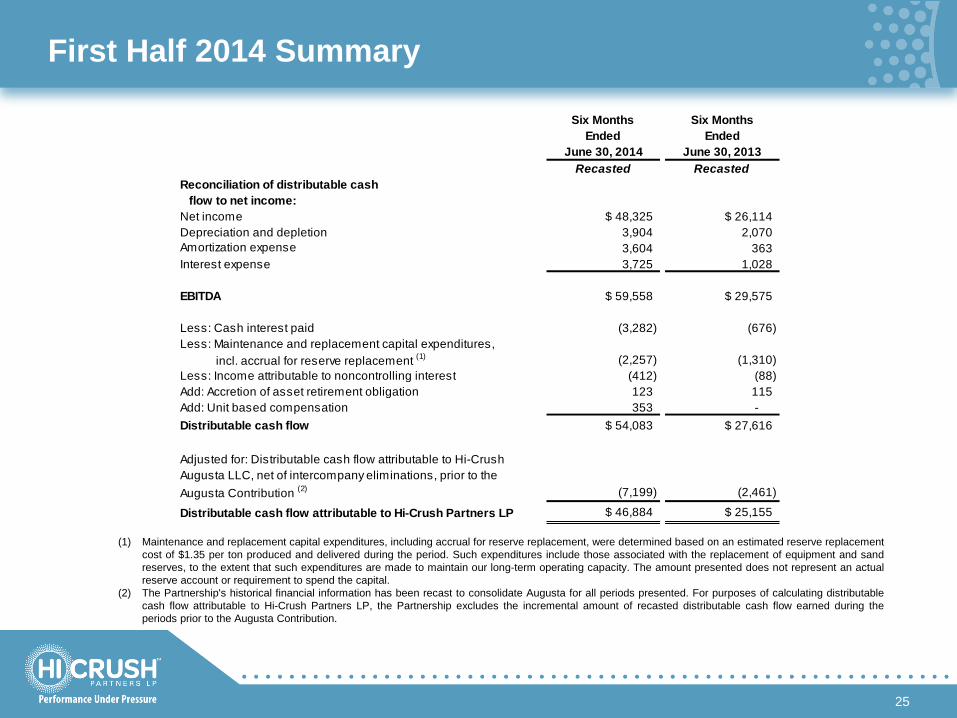
First Half 2014 Summary
(1) Maintenance and replacement capital expenditures, including accrual for reserve replacement, were determined based on an estimated reserve replacement cost of $1.35 per ton produced and delivered during the period. Such expenditures include those associated with the replacement of equipment and sand reserves, to the extent that such expenditures are made to maintain our long-term operating capacity. The amount presented does not represent an actual reserve account or requirement to spend the capital.
(2) The Partnership's historical financial information has been recast to consolidate Augusta for all periods presented. For purposes of calculating distributable cash flow attributable to Hi-Crush Partners LP, the Partnership excludes the incremental amount of recasted distributable cash flow earned during the periods prior to the Augusta Contribution.
25
Six Months Six MonthsEnded Ended
June 30, 2014 June 30, 2013Recasted Recasted
Reconciliation of distributable cash flow to net income:Net income $ 48,325 $ 26,114 Depreciation and depletion 3,904 2,070 Amortization expense 3,604 363 Interest expense 3,725 1,028
EBITDA $ 59,558 $ 29,575
Less: Cash interest paid (3,282) (676) Less: Maintenance and replacement capital expenditures, incl. accrual for reserve replacement (1) (2,257) (1,310) Less: Income attributable to noncontrolling interest (412) (88) Add: Accretion of asset retirement obligation 123 115 Add: Unit based compensation 353 - Distributable cash flow $ 54,083 $ 27,616
Adjusted for: Distributable cash flow attributable to Hi-Crush Augusta LLC, net of intercompany eliminations, prior to the Augusta Contribution (2) (7,199) (2,461)
Distributable cash flow attributable to Hi-Crush Partners LP $ 46,884 $ 25,155
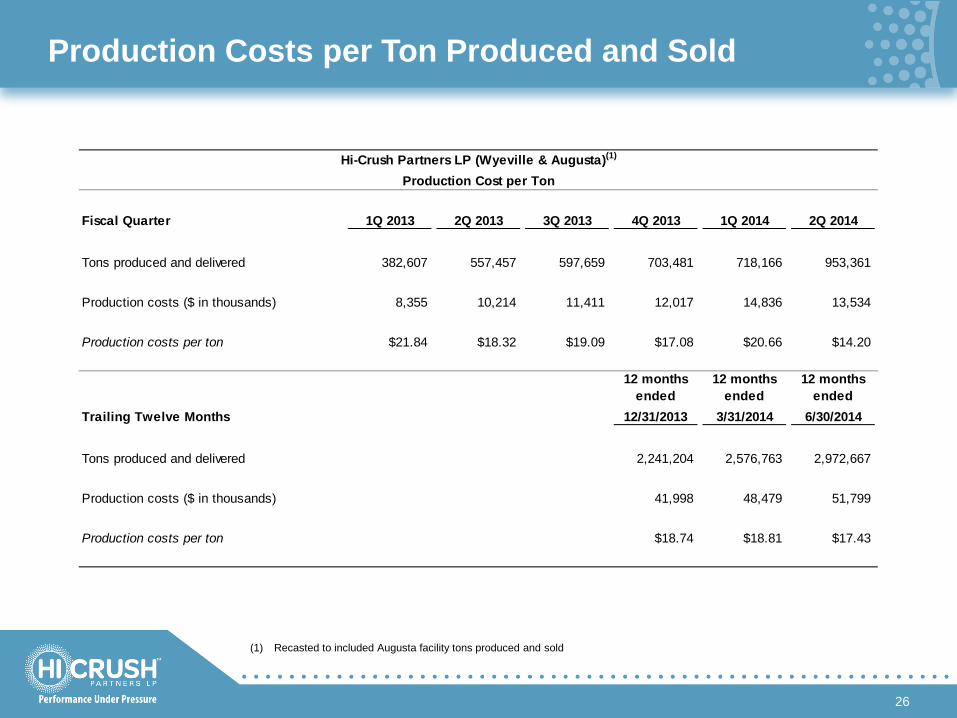
Production Costs per Ton Produced and Sold
26
(1) Recasted to included Augusta facility tons produced and sold
Hi-Crush Partners LP (Wyeville & Augusta)(1)
Production Cost per Ton
Fiscal Quarter 1Q 2013 2Q 2013 3Q 2013 4Q 2013 1Q 2014 2Q 2014
Tons produced and delivered 382,607 557,457 597,659 703,481 718,166 953,361
Production costs ($ in thousands) 8,355 10,214 11,411 12,017 14,836 13,534
Production costs per ton $21.84 $18.32 $19.09 $17.08 $20.66 $14.20
12 months ended
12 months ended
12 months ended
Trailing Twelve Months 12/31/2013 3/31/2014 6/30/2014
Tons produced and delivered 2,241,204 2,576,763 2,972,667
Production costs ($ in thousands) 41,998 48,479 51,799
Production costs per ton $18.74 $18.81 $17.43
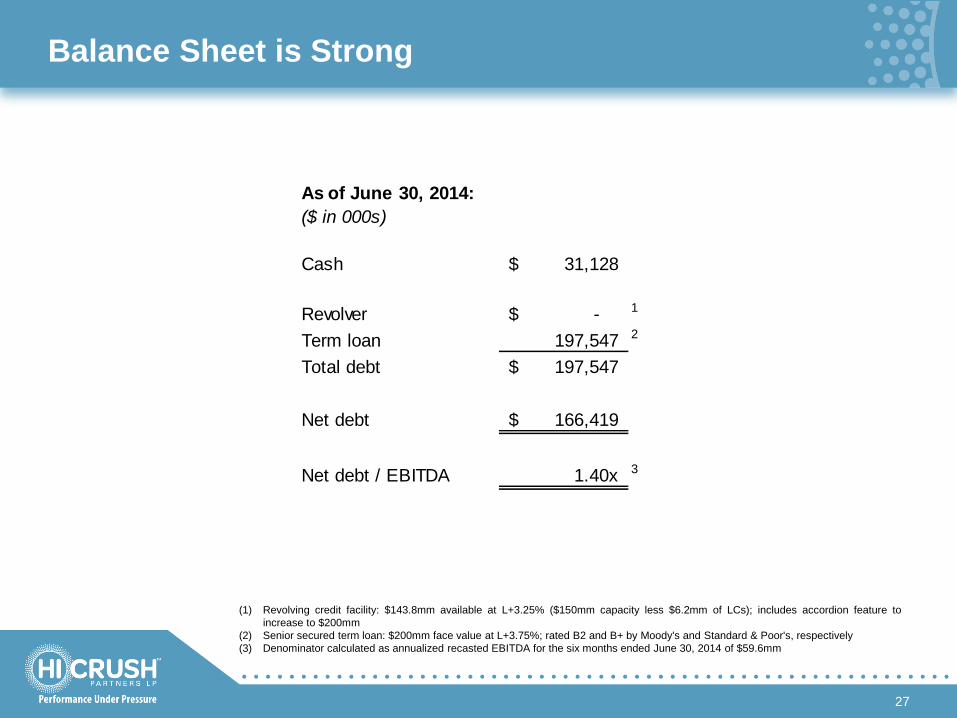
Balance Sheet is Strong
27
(1) Revolving credit facility: $143.8mm available at L+3.25% ($150mm capacity less $6.2mm of LCs); includes accordion feature to increase to $200mm
(2) Senior secured term loan: $200mm face value at L+3.75%; rated B2 and B+ by Moody's and Standard & Poor's, respectively (3) Denominator calculated as annualized recasted EBITDA for the six months ended June 30, 2014 of $59.6mm
As of June 30, 2014:($ in 000s)
Cash 31,128$
Revolver -$ 1
Term loan 197,547 2
Total debt 197,547$
Net debt 166,419$
Net debt / EBITDA 1.40x 3