tft-lcd key components market update q4-2012. quarterly... · tft-lcd key components market update...
TRANSCRIPT

14 January 2013 | Page 1 ALL RIGHTS RESERVED. REPRODUCTION PROHIBITED WITHOUT WRITTEN PERMISSION.
Boyce Fan, Caroline Chen
TFT-LCD Key Components Market Update
Q4-2012
Display Division, Research Manager
Nov, 2012
Display Division, Analyst
14 January 2013 | Page 2 ALL RIGHTS RESERVED. REPRODUCTION PROHIBITED WITHOUT WRITTEN PERMISSION.
Outline
I. Summary
II. Key Component Status
IV. Mainstream Size Panel Cost
V. Panel Cost Analysis &
Financial Performance Analysis
VI. Large Size LCD Panel Supply
VII. Conclusion
III. Key Component Technical Trend

14 January 2013 | Page 3 ALL RIGHTS RESERVED. REPRODUCTION PROHIBITED WITHOUT WRITTEN PERMISSION.
Outline
I. Summary
14 January 2013 | Page 4 ALL RIGHTS RESERVED. REPRODUCTION PROHIBITED WITHOUT WRITTEN PERMISSION.
Summary
Key Components Status
Key Components Technical Trend
Mainstream Size Panel Cost Analysis
WW Large Size LCD Panel Supply
Component price decline – glass substrate: around 3~5%; polarizer: 1~2% on IT products and 2~3% on TV; BLU: 1~1.5% on CCFL
products and 1~5% on LED products.
As the demand for small & middle sized panels emerges, certain color filter(CF) makers have started to adopt Gen6 CF production lines
with new equipments to cut 4 pieces on large substrates to supply CFs of small generation in order meet high ppi requirement.
Meanwhile, the demand for large-sized panels recently heats up, slightly squeezing CF capacity in Gen6.
Affected by the rise of tablet demand, polarizers and driver ICs see capacity squeezed between large-sized and small mid-sized
products. Along with no expansion plans for polarizers and driver ICs in the near future, the balanced to slightly tight situation between
demand and supply would likely to extend to 2013.
After the CCFL models gradually disappear, the low-cost direct type model would possibly take the position of the entry-level model.
While manufacturers actively develop thin direct-type models, which is expected to be launched in 2013, attack the mainstream market,
and compete with the edge type.
Encouraged by tablets and smartphones, high resolution products have built the firm footstep in the small & middle sized product market
and moves toward the NB market. In the TV market, as the bottleneck of AMOLED TV development remains, 4K2K model development
and promotion in the immediate future would be a major point.
4K2K model development speed still depends on hardware makers’ activeness, in the condition of content and standard being immature
in the short term, the 4K2K models, touted with the price 1.2-1.3 times that of standard FHD models and providing low-cost
transformation solution, would be still appealing to certain manufacturers.
In 2012, the large-sized panel glass substrate input is expected to total 167.9Mn m2, growing 14.8% YoY from 2011.
Stirred by the demands for large-sized and new-sized products, the overall Q4 utilization in the industry remains above 80%, and panel
makers show an aggressive attitude on financial performances to swing from losses to profits, as a result, the utilization wouldn’t show
noticeable decline easily in the short term.
As makers are devoted actively to the developments of new technologies and new processes which consume the capacity to a certain
degree, the available glass substrate input area is projected to decline 5.2%.
In 4Q12, panel cost decline in mainstream sizes – NB is 3~4%; monitor is 2~3%; TV is around 3~5%.
The material cost and price ratio in mainstream sizes is around 66~86% in 4Q12. Since Monitor & TV panel price stopped dropping and
rebounded, the ratio of Monitor application decreases by 2% QoQ; TV application decreases by 2~3% QoQ.
15.6W NB are of the worst profitability level. The panel price has almost approached the cash cost level of that size.

14 January 2013 | Page 5 ALL RIGHTS RESERVED. REPRODUCTION PROHIBITED WITHOUT WRITTEN PERMISSION.
Outline
II. Key Component Status
14 January 2013 | Page 6 ALL RIGHTS RESERVED. REPRODUCTION PROHIBITED WITHOUT WRITTEN PERMISSION.
QoQ changes
Glass Substrate – ASP Trend
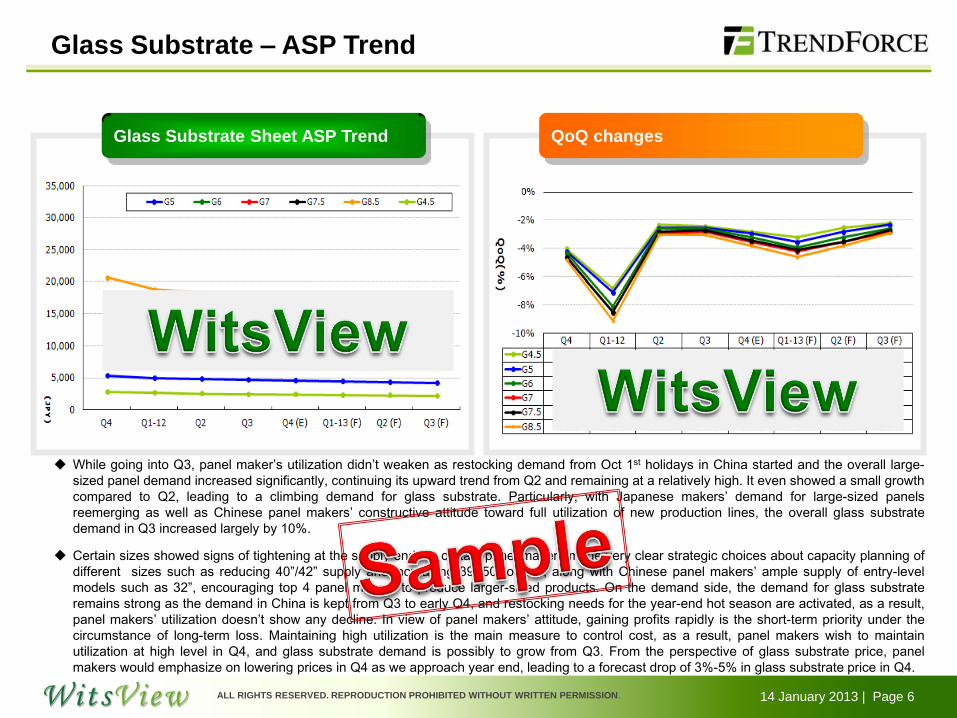
While going into Q3, panel maker’s utilization didn’t weaken as restocking demand from Oct 1st holidays in China started and the overall large-
sized panel demand increased significantly, continuing its upward trend from Q2 and remaining at a relatively high. It even showed a small growth
compared to Q2, leading to a climbing demand for glass substrate. Particularly, with Japanese makers’ demand for large-sized panels
reemerging as well as Chinese panel makers’ constructive attitude toward full utilization of new production lines, the overall glass substrate
demand in Q3 increased largely by 10%.
Certain sizes showed signs of tightening at the supply end, as certain panel makers made very clear strategic choices about capacity planning of
different sizes such as reducing 40”/42” supply and increasing 39”/50” output, along with Chinese panel makers’ ample supply of entry-level
models such as 32”, encouraging top 4 panel makers to produce larger-sized products. On the demand side, the demand for glass substrate
remains strong as the demand in China is kept from Q3 to early Q4, and restocking needs for the year-end hot season are activated, as a result,
panel makers’ utilization doesn’t show any decline. In view of panel makers’ attitude, gaining profits rapidly is the short-term priority under the
circumstance of long-term loss. Maintaining high utilization is the main measure to control cost, as a result, panel makers wish to maintain
utilization at high level in Q4, and glass substrate demand is possibly to grow from Q3. From the perspective of glass substrate price, panel
makers would emphasize on lowering prices in Q4 as we approach year end, leading to a forecast drop of 3%-5% in glass substrate price in Q4.
Glass Substrate Sheet ASP Trend
14 January 2013 | Page 7 ALL RIGHTS RESERVED. REPRODUCTION PROHIBITED WITHOUT WRITTEN PERMISSION.
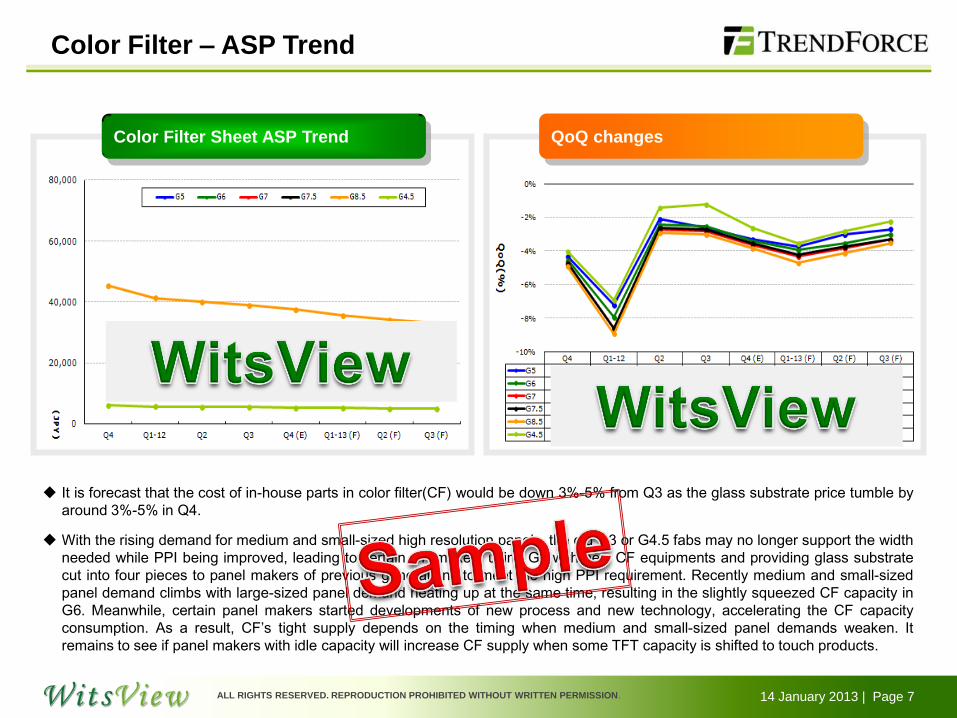
Color Filter Sheet ASP Trend QoQ changes
Color Filter – ASP Trend
It is forecast that the cost of in-house parts in color filter(CF) would be down 3%-5% from Q3 as the glass substrate price tumble by
around 3%-5% in Q4.
With the rising demand for medium and small-sized high resolution panels, the old G3 or G4.5 fabs may no longer support the width
needed while PPI being improved, leading to certain CF makers using G6 with new CF equipments and providing glass substrate
cut into four pieces to panel makers of previous generations to meet the high PPI requirement. Recently medium and small-sized
panel demand climbs with large-sized panel demand heating up at the same time, resulting in the slightly squeezed CF capacity in
G6. Meanwhile, certain panel makers started developments of new process and new technology, accelerating the CF capacity
consumption. As a result, CF’s tight supply depends on the timing when medium and small-sized panel demands weaken. It
remains to see if panel makers with idle capacity will increase CF supply when some TFT capacity is shifted to touch products.

14 January 2013 | Page 8 ALL RIGHTS RESERVED. REPRODUCTION PROHIBITED WITHOUT WRITTEN PERMISSION.
Polarizer ASP Trend QoQ changes
Polarizer – ASP Trend
In addition to 39” and 50”, the demands for new sizes developed by panel makers surge, including 58” and 28”. Along with the large-sized panel
demand heating up, the polarizer demand continues from Q3 to Q4. Based on makers’ estimations, the shipment peak would be in October, the
overall shipment in Q4 would grow by 5%-10% from Q3. The price decline would be 1%-3% due to demand growing recently and significant price
drops of certain sizes in previous quarters.
While going into the 2nd half of the year, the demand for the new generation of tablet surges. The film touch module, previously regarded as losing
its market, is revived on the concepts of thinness design and cost-saving. Of which ITO film materials and polarizer materials can share polarizer
capacity, with tablets also demanding for polarizers. As polarizer and ITO films used in tablets generate higher profits, makers would choose to
supply these items as priority, squeezing polarizer capacity globally. In addition to capacity squeezing effect, demands for large-sized and new
sized panel accelerate obviously the consumption of polarizer area. As different panel makers have distinct requirements for polarizer structure,
the higher complexity they demand causes higher capacity consumption. Besides, new size products have cutting efficiency concern in
accordance with the production width of polarizer capacity, leading to a polarizer supply-demand balance in the 2nd half of the year. For polarizer
makers, in consideration of the rising of AMOLED products, the polarizer demand would trim dramatically, causing polarizer makers’ relatively
conservative attitude toward expanding capacity in the short term. It is also foreseen the polarizer supply-demand balance could continue into
2013.
14 January 2013 | Page 9 ALL RIGHTS RESERVED. REPRODUCTION PROHIBITED WITHOUT WRITTEN PERMISSION.
Driver IC – ASP Trend
Driver IC ASP Trend QoQ change
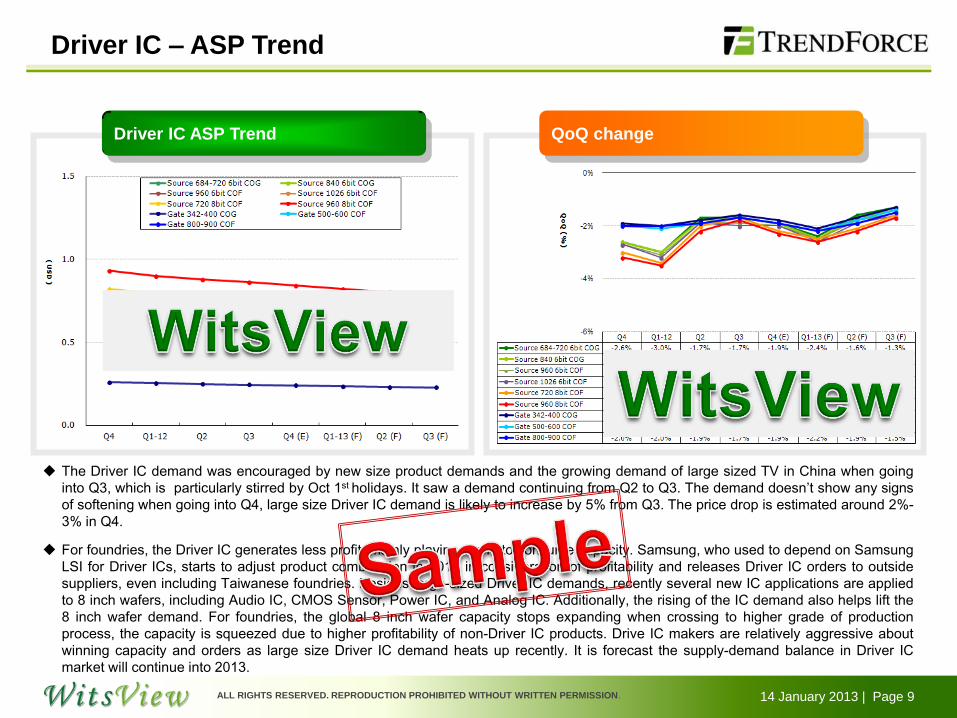
The Driver IC demand was encouraged by new size product demands and the growing demand of large sized TV in China when going
into Q3, which is particularly stirred by Oct 1st holidays. It saw a demand continuing from Q2 to Q3. The demand doesn’t show any signs
of softening when going into Q4, large size Driver IC demand is likely to increase by 5% from Q3. The price drop is estimated around 2%-
3% in Q4.
For foundries, the Driver IC generates less profit, mainly playing a role to consume capacity. Samsung, who used to depend on Samsung
LSI for Driver ICs, starts to adjust product combination in 2012 in consideration of profitability and releases Driver IC orders to outside
suppliers, even including Taiwanese foundries. Besides large-sized Driver IC demands, recently several new IC applications are applied
to 8 inch wafers, including Audio IC, CMOS Sensor, Power IC, and Analog IC. Additionally, the rising of the IC demand also helps lift the
8 inch wafer demand. For foundries, the global 8 inch wafer capacity stops expanding when crossing to higher grade of production
process, the capacity is squeezed due to higher profitability of non-Driver IC products. Drive IC makers are relatively aggressive about
winning capacity and orders as large size Driver IC demand heats up recently. It is forecast the supply-demand balance in Driver IC
market will continue into 2013.
14 January 2013 | Page 10 ALL RIGHTS RESERVED. REPRODUCTION PROHIBITED WITHOUT WRITTEN PERMISSION.
Backlight Unit ASP Trend QoQ changes
LED Backlight Unit – ASP Trend
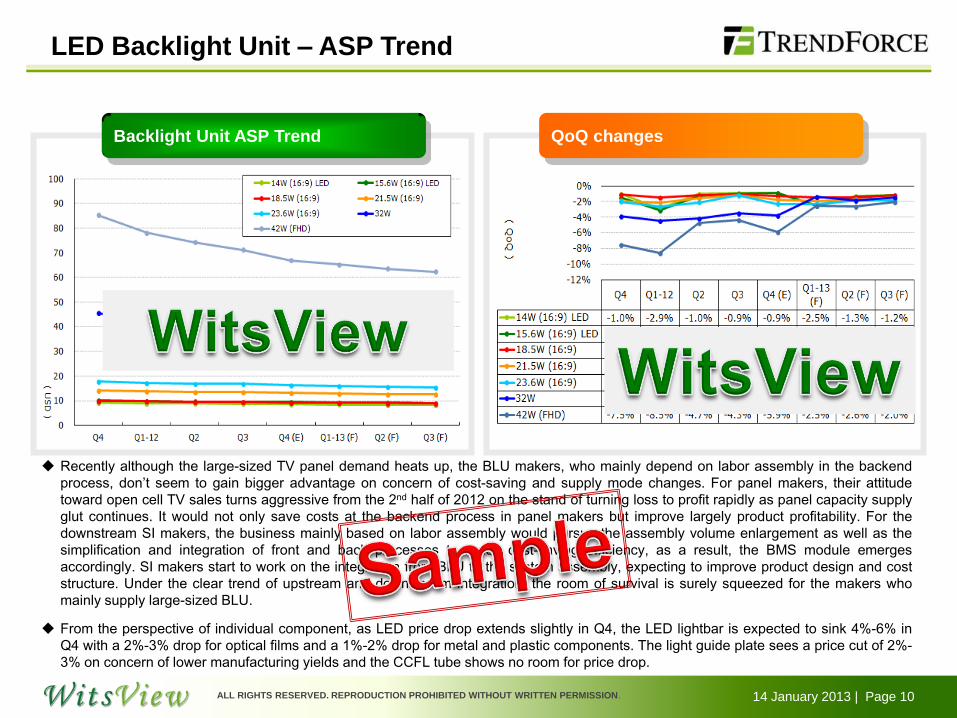
Recently although the large-sized TV panel demand heats up, the BLU makers, who mainly depend on labor assembly in the backend
process, don’t seem to gain bigger advantage on concern of cost-saving and supply mode changes. For panel makers, their attitude
toward open cell TV sales turns aggressive from the 2nd half of 2012 on the stand of turning loss to profit rapidly as panel capacity supply
glut continues. It would not only save costs at the backend process in panel makers but improve largely product profitability. For the
downstream SI makers, the business mainly based on labor assembly would pursue the assembly volume enlargement as well as the
simplification and integration of front and back processes to reach cost-saving efficiency, as a result, the BMS module emerges
accordingly. SI makers start to work on the integration from BLU to the system assembly, expecting to improve product design and cost
structure. Under the clear trend of upstream and downstream integration, the room of survival is surely squeezed for the makers who
mainly supply large-sized BLU.
From the perspective of individual component, as LED price drop extends slightly in Q4, the LED lightbar is expected to sink 4%-6% in
Q4 with a 2%-3% drop for optical films and a 1%-2% drop for metal and plastic components. The light guide plate sees a price cut of 2%-
3% on concern of lower manufacturing yields and the CCFL tube shows no room for price drop.

14 January 2013 | Page 11 ALL RIGHTS RESERVED. REPRODUCTION PROHIBITED WITHOUT WRITTEN PERMISSION.
Outline
III. Key Component Technical Trend
14 January 2013 | Page 12 ALL RIGHTS RESERVED. REPRODUCTION PROHIBITED WITHOUT WRITTEN PERMISSION.
TV BLU SPEC Development Trend
TV BLU SPEC Development Trend
?
LED TV Model Penetration Rate
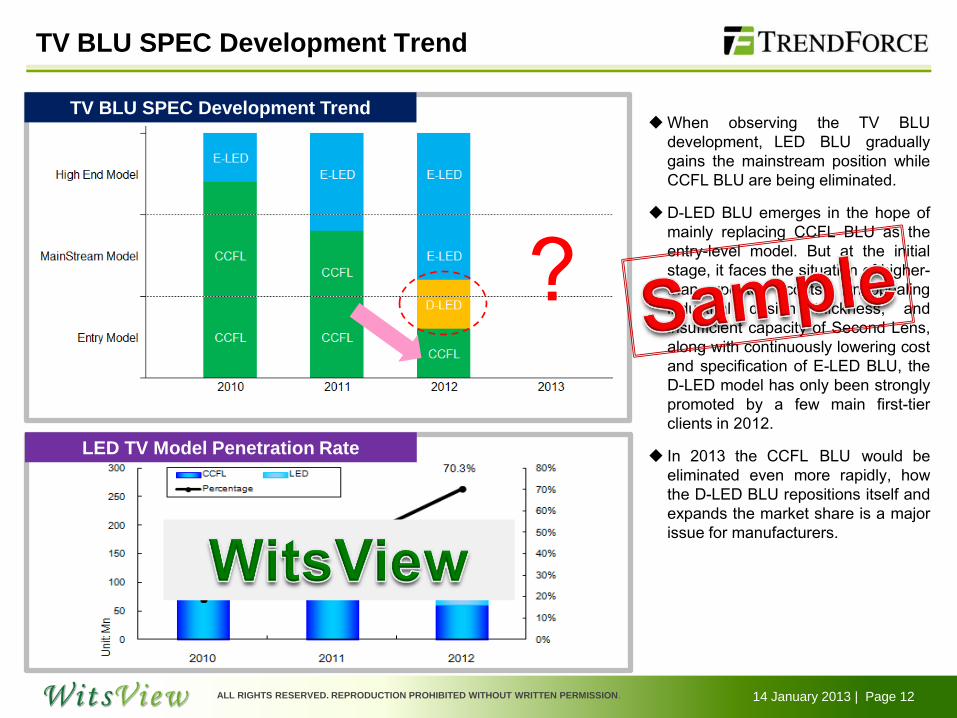
When observing the TV BLU
development, LED BLU gradually
gains the mainstream position while
CCFL BLU are being eliminated.
D-LED BLU emerges in the hope of
mainly replacing CCFL BLU as the
entry-level model. But at the initial
stage, it faces the situation of higher-
than-expected costs, unappealing
industrial design thickness, and
insufficient capacity of Second Lens,
along with continuously lowering cost
and specification of E-LED BLU, the
D-LED model has only been strongly
promoted by a few main first-tier
clients in 2012.
In 2013 the CCFL BLU would be
eliminated even more rapidly, how
the D-LED BLU repositions itself and
expands the market share is a major
issue for manufacturers.
14 January 2013 | Page 13 ALL RIGHTS RESERVED. REPRODUCTION PROHIBITED WITHOUT WRITTEN PERMISSION.
Challenge of D-LED Model : Thickness
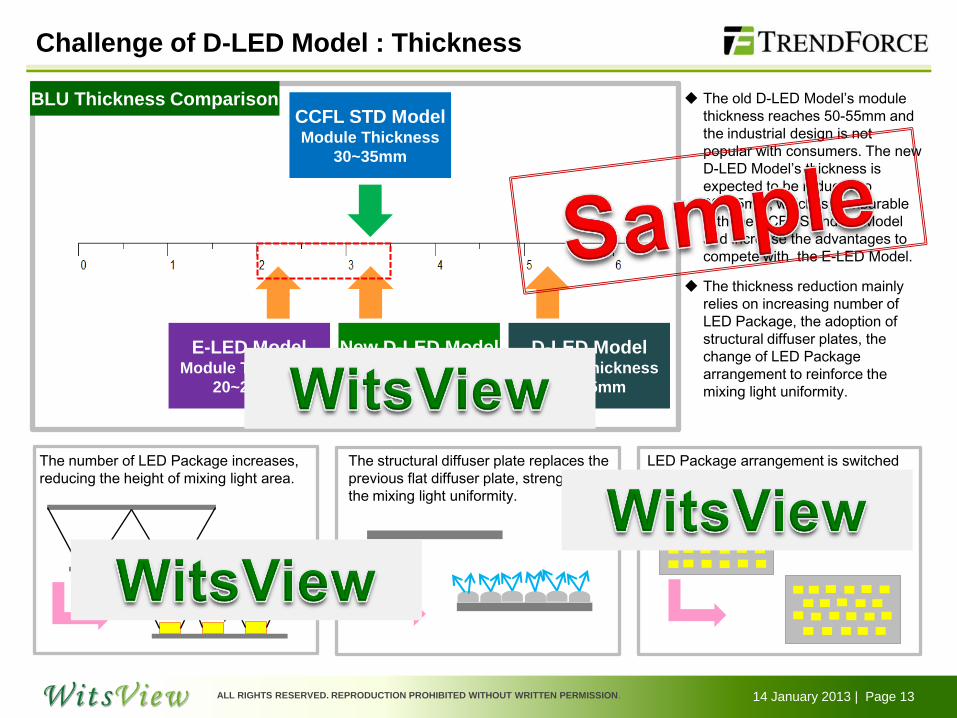
CCFL STD Model Module Thickness
30~35mm
E-LED Model Module Thickness
20~25mm
D-LED Model Module Thickness
50~55mm
New D-LED Model Module Thickness
30~35mm
The number of LED Package increases,
reducing the height of mixing light area.
The structural diffuser plate replaces the
previous flat diffuser plate, strengthening
the mixing light uniformity.
LED Package arrangement is switched
from strip to diamond type, enforcing the
light mixing effect.
The old D-LED Model’s module
thickness reaches 50-55mm and
the industrial design is not
popular with consumers. The new
D-LED Model’s thickness is
expected to be reduced to
30~35mm, which is comparable
with the CCFL Standard Model
and increase the advantages to
compete with the E-LED Model.
The thickness reduction mainly
relies on increasing number of
LED Package, the adoption of
structural diffuser plates, the
change of LED Package
arrangement to reinforce the
mixing light uniformity.
BLU Thickness Comparison

14 January 2013 | Page 14 ALL RIGHTS RESERVED. REPRODUCTION PROHIBITED WITHOUT WRITTEN PERMISSION.
Challenge of D-LED Model: LED Package
Old LED Qty.
32” 30~36
39”/42” 60~70
46” 70~75
50” 85~90
55” 95~100
New LED Qty.
32” 40~50
39”/42” 65~70
46” 80~85
50” 100~105
55” 120~130
In 2013, certain makers would highly anticipate the D-
LED models in the hope that it can entirely replace CCFL
Model in the Entry Market and extend to the Mainstream
Market to compete with the E-LED Model.
It is projected that makers would attack the Entry Market
with the thicker D-LED Model while the cost declines Q
by Q and possibly reaches that of the CCFL Model.
Manufacturers have developed the thinner D-LED Model,
likely to be positioned in the Mainstream Market with the
increasing number of LED Packages and improving
industrial design and specification.
14 January 2013 | Page 15 ALL RIGHTS RESERVED. REPRODUCTION PROHIBITED WITHOUT WRITTEN PERMISSION.
Challenge of D-LED Model: Second Lens
60~70 °
80~85°
Function of Second Lens Difference between old and new D-LED BLU Structure
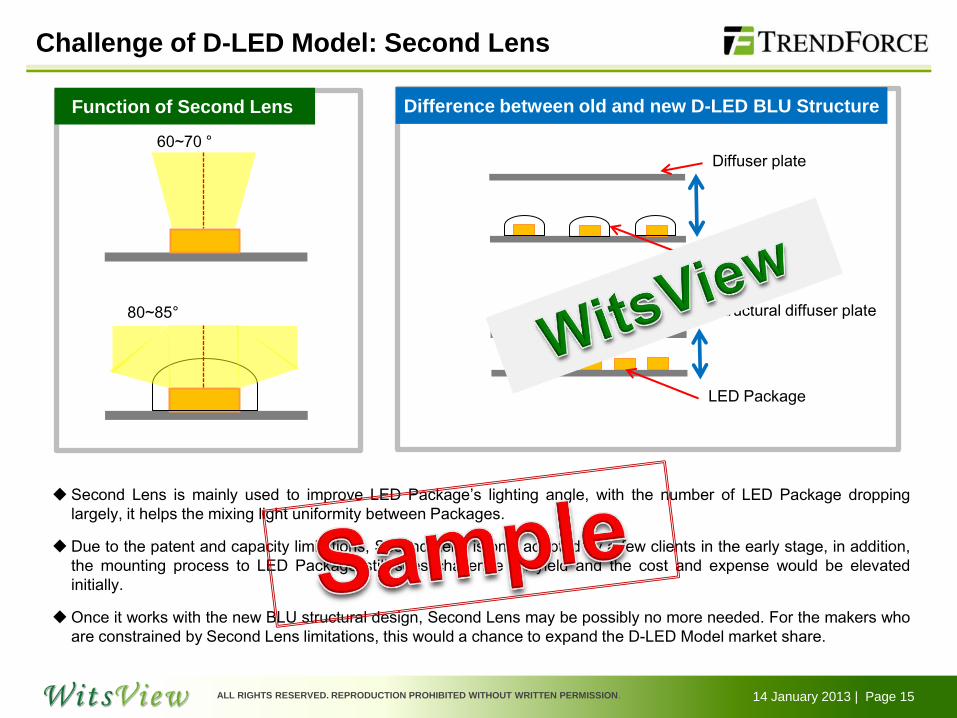
Second Lens is mainly used to improve LED Package’s lighting angle, with the number of LED Package dropping
largely, it helps the mixing light uniformity between Packages.
Due to the patent and capacity limitations, Second Lens is only adopted by a few clients in the early stage, in addition,
the mounting process to LED Package still sees challenge on yield and the cost and expense would be elevated
initially.
Once it works with the new BLU structural design, Second Lens may be possibly no more needed. For the makers who
are constrained by Second Lens limitations, this would a chance to expand the D-LED Model market share.
Diffuser plate
Second Lens
Structural diffuser plate
LED Package
14 January 2013 | Page 16 ALL RIGHTS RESERVED. REPRODUCTION PROHIBITED WITHOUT WRITTEN PERMISSION.
Penetration Rate of Different LED TV BLU
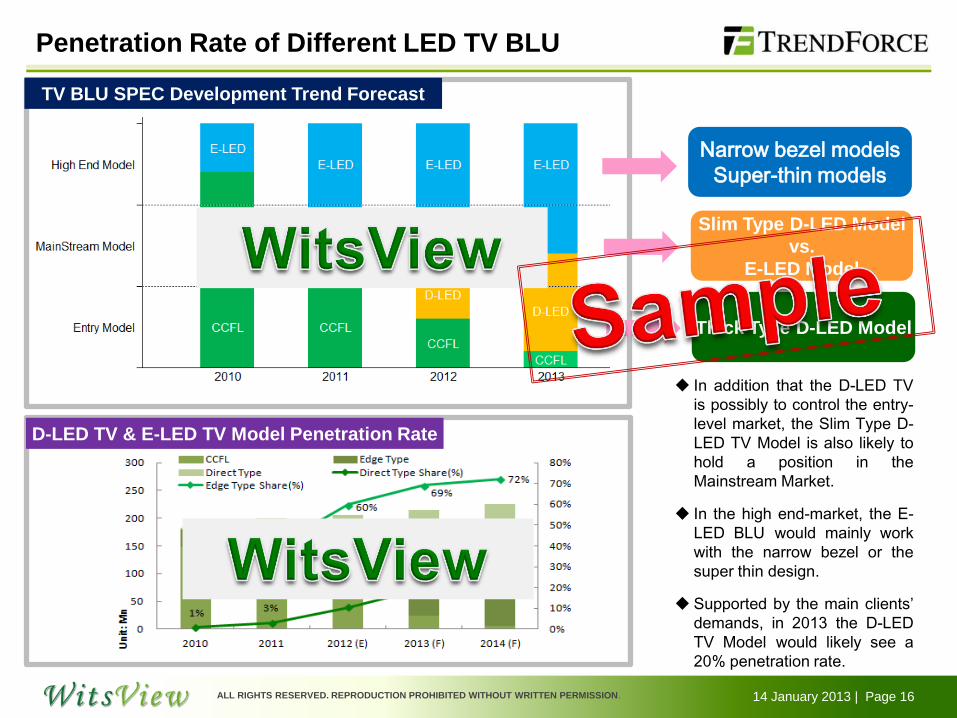
TV BLU SPEC Development Trend Forecast
Narrow bezel models
Super-thin models
Slim Type D-LED Model
vs.
E-LED Model
Thick Type D-LED Model
D-LED TV & E-LED TV Model Penetration Rate
In addition that the D-LED TV
is possibly to control the entry-
level market, the Slim Type D-
LED TV Model is also likely to
hold a position in the
Mainstream Market.
In the high end-market, the E-
LED BLU would mainly work
with the narrow bezel or the
super thin design.
Supported by the main clients’
demands, in 2013 the D-LED
TV Model would likely see a
20% penetration rate.
14 January 2013 | Page 17 ALL RIGHTS RESERVED. REPRODUCTION PROHIBITED WITHOUT WRITTEN PERMISSION.
Cost Gap between CCFL & LED TV BLU
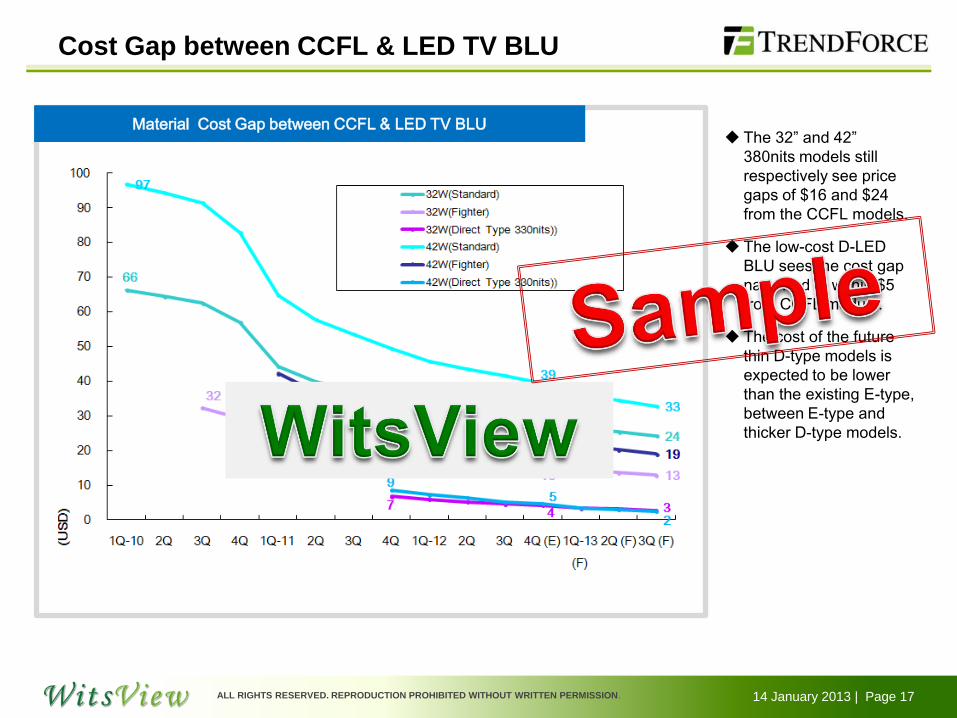
Material Cost Gap between CCFL & LED TV BLU The 32” and 42”
380nits models still
respectively see price
gaps of $16 and $24
from the CCFL models.
The low-cost D-LED
BLU sees the cost gap
narrowed to within $5
from CCFL module.
The cost of the future
thin D-type models is
expected to be lower
than the existing E-type,
between E-type and
thicker D-type models.

14 January 2013 | Page 18 ALL RIGHTS RESERVED. REPRODUCTION PROHIBITED WITHOUT WRITTEN PERMISSION.
QoQ changes
LED Lightbar – ASP Trend
LED Lightbar ASP Trend
From the perspective of individual components, LED’s price decline slightly enlarge in Q4, leading to an overall LED
Lightbar price decline of 4~6% expectedly in Q4.
As the Lightbar placement structure has reached maturity, the future main changes would be LED Package, shifted
from mid-power single chip 5630 or mid-power dual chip 7030 to mid-power dual chip 7020, to meet the LGP thickness
requirement developing toward 2mm from 3mm.

14 January 2013 | Page 19 ALL RIGHTS RESERVED. REPRODUCTION PROHIBITED WITHOUT WRITTEN PERMISSION.
Light Guide Plate ASP Trend
Diffuser Plate & Light Guide Plate – ASP Trend
Diffuser Plate ASP Trend
The diffuser plate demand is expected to decline along with the trimming CCFL model proportion, the diffuser plate
price decline is projected to be 1~2% in Q4.
The expectedly growing D-type model volume would compensate the loss from trimming CCFL models, and
manufacturers have chances to develop toward structural diffuser plates with high added values.
At the early stage of LED development, PMMA light guide plate once faced tight supply, leading to makers’ capacity
expansion. But along with LED model penetration rate raising slowly and the showcase of the new D-LED model,
PMMA light guide plate capacity sees risks of oversupply, and the Q4’12 PMMA light guide plate sees price drop
around 2~3%.
14 January 2013 | Page 20 ALL RIGHTS RESERVED. REPRODUCTION PROHIBITED WITHOUT WRITTEN PERMISSION.
Tablet PC Resolution Trend
Keep
Keep
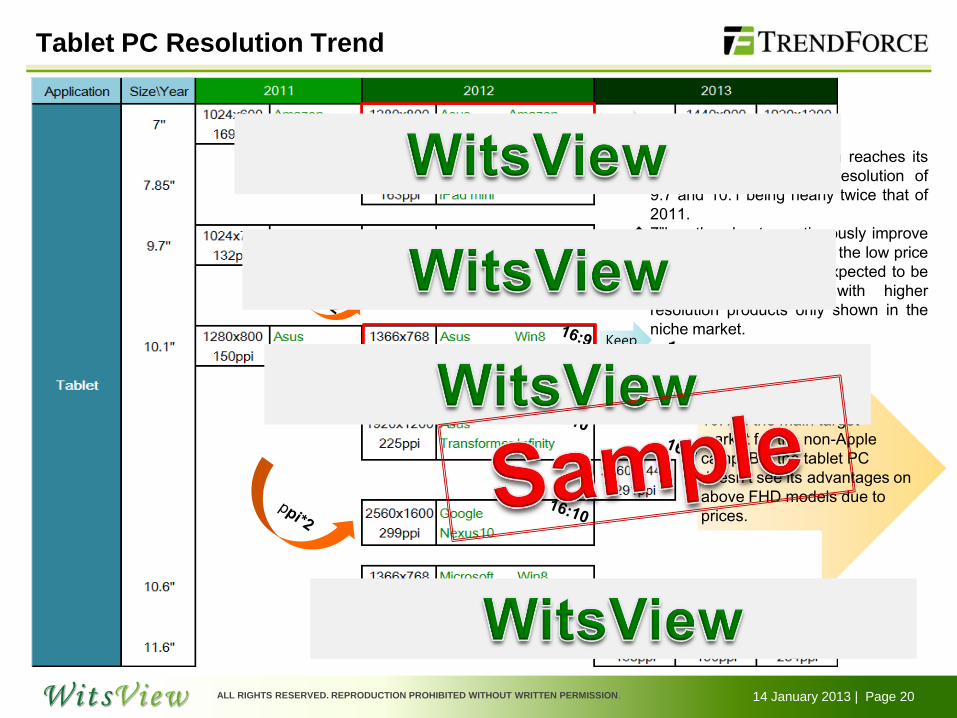
The lift of tablet resolution reaches its
peak in 2012 with the resolution of
9.7”and 10.1”being nearly twice that of
2011.
7”has the plan to continuously improve
resolution but is limited by the low price
trend. The 1280x800 is expected to be
mainstream in 2013 with higher
resolution products only shown in the
niche market.
10.1”is the main target
market for the non-Apple
camp. But the tablet PC
doesn’t see its advantages on
above FHD models due to
prices.

14 January 2013 | Page 21 ALL RIGHTS RESERVED. REPRODUCTION PROHIBITED WITHOUT WRITTEN PERMISSION.
Notebook Resolution Trend
NB doesn’t see many changes on resolution but mainly the changes on thickness, weight, power-consumption under the
same resolution.
The lifted resolution brings challenges to panel makers’ yields and costs, in the condition that NB prices see increases
difficultly , QHD high resolution is only expected on a few high-end NB models in 2013.
Panels carrying above
FHD resolutions are
developed only by
a few makers and didn’t
stimulate the market.
Macbook pro 13.3”2560x1600 16:10 227ppi
15.6”2880x1800 16:10 217ppi
Apple has extended the high resolution issue to the
NB market , launching the Retina display NB at
relatively high price.

14 January 2013 | Page 22 ALL RIGHTS RESERVED. REPRODUCTION PROHIBITED WITHOUT WRITTEN PERMISSION.
MNT & TV Resolution Trend
High resolution trend is
extended to TV market.
iMac FHD remains the
mainstream resolution.
Currently the monitor market
shows stagnant growth. Since
higher specification equals
higher price, the monitor lacks
the incentive to lift resolution.
14 January 2013 | Page 23 ALL RIGHTS RESERVED. REPRODUCTION PROHIBITED WITHOUT WRITTEN PERMISSION.
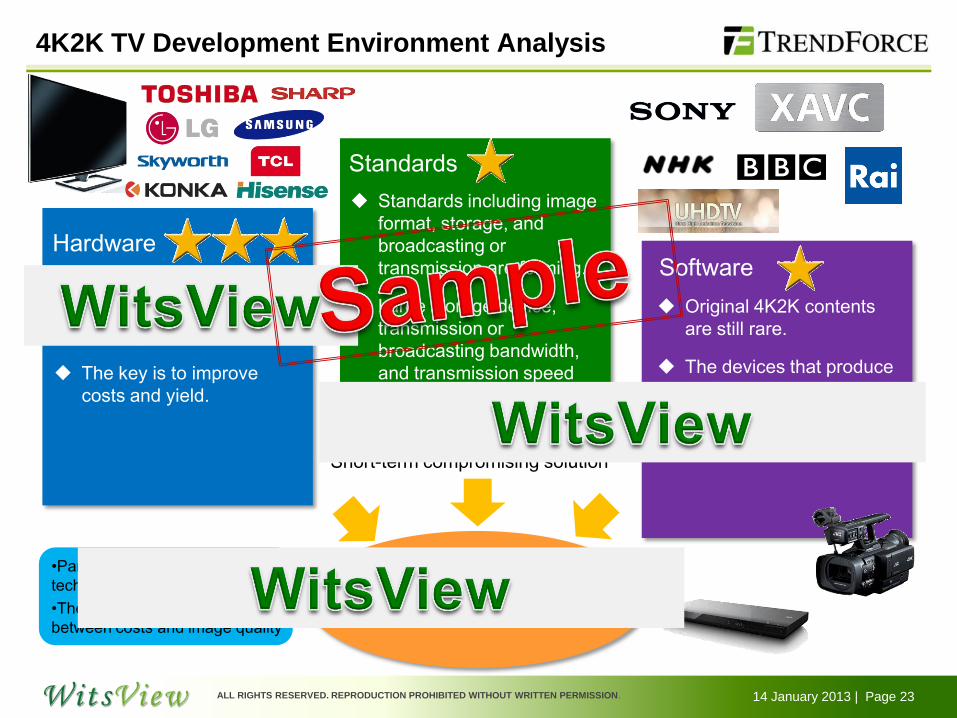
4K2K TV Development Environment Analysis
Hardware
Standards
Software Panels: makers are active
on 4K2K product
development.
The key is to improve
costs and yield.
Original 4K2K contents
are still rare.
The devices that produce
4K2K contents such as
cameras must be
common.
4K2K image transformation solution
built at system end or panel end??
Standards including image
format, storage, and
broadcasting or
transmission are forming.
Large storage device,
transmission or
broadcasting bandwidth,
and transmission speed
would be the future keys
to developments.
•Panel makers hold key
technologies
•There will be some trade-off
between costs and image quality
Short-term compromising solution
14 January 2013 | Page 24 ALL RIGHTS RESERVED. REPRODUCTION PROHIBITED WITHOUT WRITTEN PERMISSION.
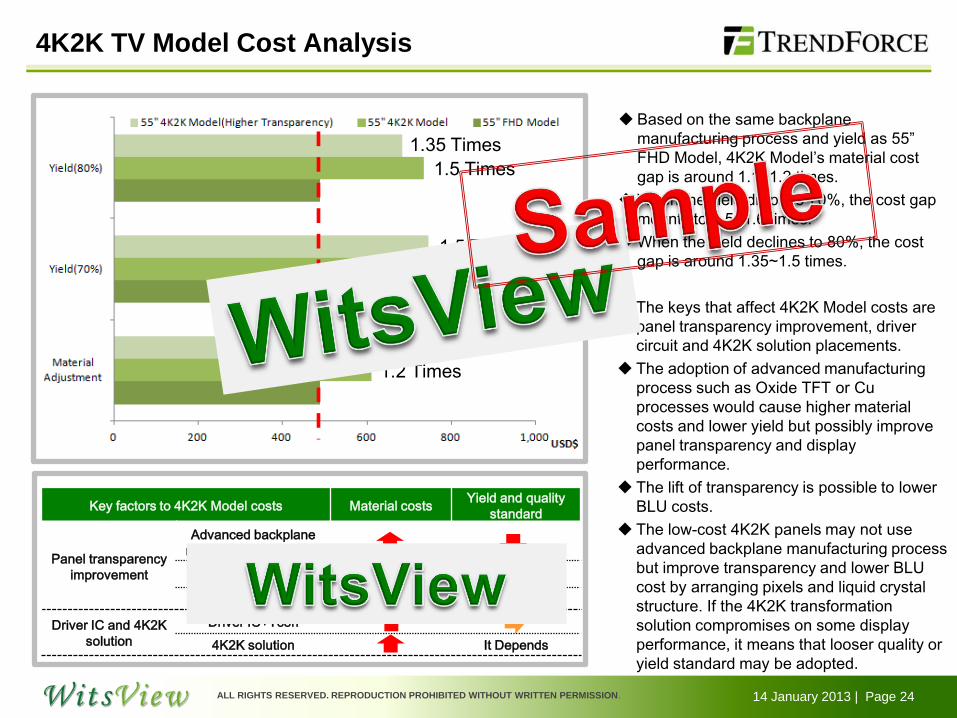
4K2K TV Model Cost Analysis
1.2 Times
1.1 Times
1.6 Times
1.5 Times
1.5 Times
1.35 Times
Based on the same backplane
manufacturing process and yield as 55”
FHD Model, 4K2K Model’s material cost
gap is around 1.1~1.2 times.
When the yield drops to 70%, the cost gap
mounts to 1.5~1.6 times.
When the yield declines to 80%, the cost
gap is around 1.35~1.5 times.
Key factors to 4K2K Model costs Material costs Yield and quality
standard
Panel transparency
improvement
Advanced backplane
manufacturing process
Pixel and LC structure
BLU cost
Driver IC and 4K2K
solution
Driver IC+Tcon
4K2K solution It Depends
The keys that affect 4K2K Model costs are
panel transparency improvement, driver
circuit and 4K2K solution placements.
The adoption of advanced manufacturing
process such as Oxide TFT or Cu
processes would cause higher material
costs and lower yield but possibly improve
panel transparency and display
performance.
The lift of transparency is possible to lower
BLU costs.
The low-cost 4K2K panels may not use
advanced backplane manufacturing process
but improve transparency and lower BLU
cost by arranging pixels and liquid crystal
structure. If the 4K2K transformation
solution compromises on some display
performance, it means that looser quality or
yield standard may be adopted.
14 January 2013 | Page 25 ALL RIGHTS RESERVED. REPRODUCTION PROHIBITED WITHOUT WRITTEN PERMISSION.
Outline
IV. Mainstream Size Panel Cost
14 January 2013 | Page 26 ALL RIGHTS RESERVED. REPRODUCTION PROHIBITED WITHOUT WRITTEN PERMISSION.
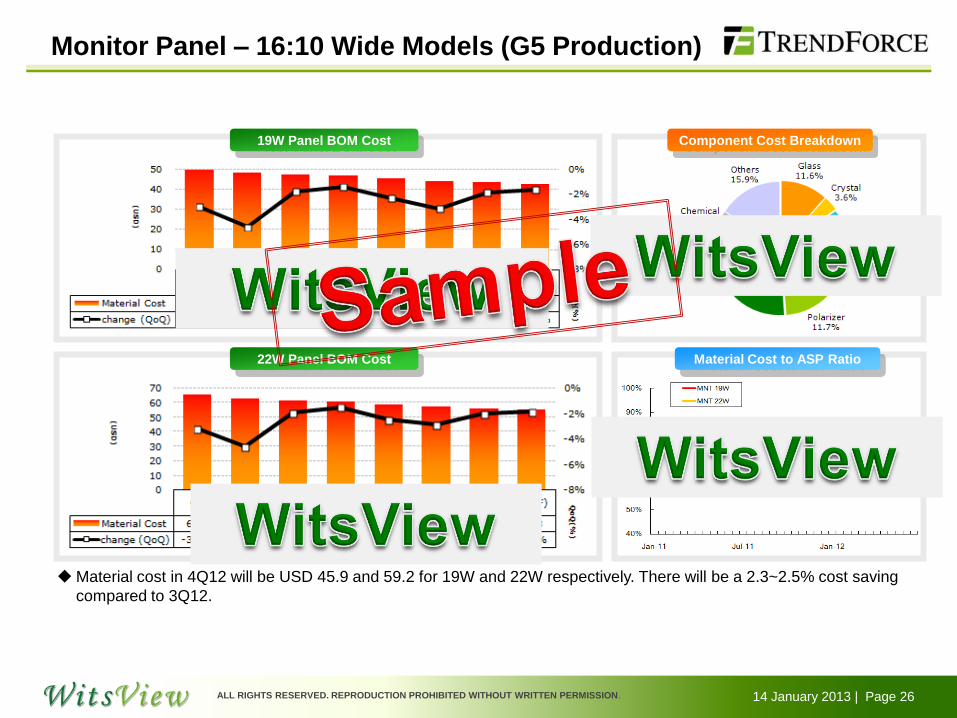
Monitor Panel – 16:10 Wide Models (G5 Production)
Component Cost Breakdown 19W Panel BOM Cost
22W Panel BOM Cost Material Cost to ASP Ratio
Material cost in 4Q12 will be USD 45.9 and 59.2 for 19W and 22W respectively. There will be a 2.3~2.5% cost saving
compared to 3Q12.
14 January 2013 | Page 27 ALL RIGHTS RESERVED. REPRODUCTION PROHIBITED WITHOUT WRITTEN PERMISSION.
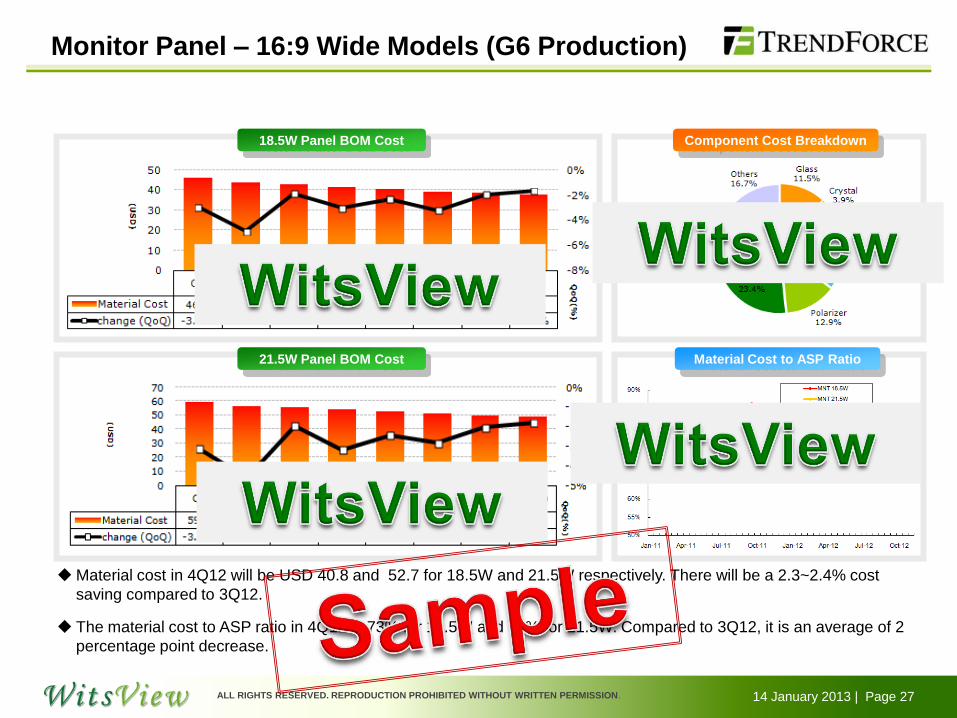
Monitor Panel – 16:9 Wide Models (G6 Production)
Component Cost Breakdown 18.5W Panel BOM Cost
21.5W Panel BOM Cost Material Cost to ASP Ratio
Material cost in 4Q12 will be USD 40.8 and 52.7 for 18.5W and 21.5W respectively. There will be a 2.3~2.4% cost
saving compared to 3Q12.
The material cost to ASP ratio in 4Q12 is 73% for 18.5W and 70% for 21.5W. Compared to 3Q12, it is an average of 2
percentage point decrease.
14 January 2013 | Page 28 ALL RIGHTS RESERVED. REPRODUCTION PROHIBITED WITHOUT WRITTEN PERMISSION.
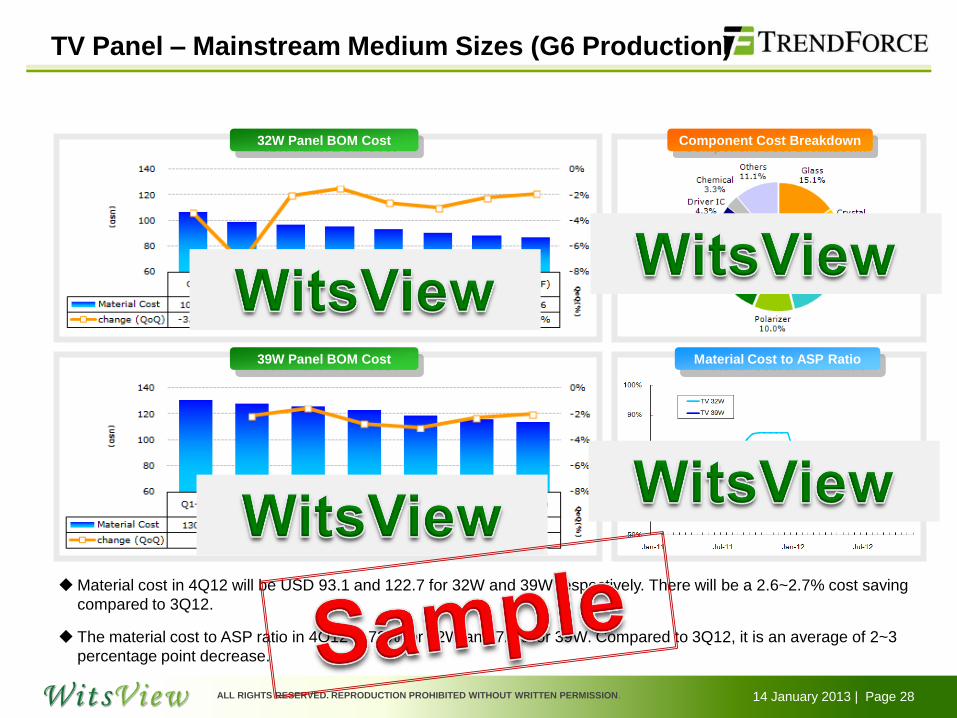
TV Panel – Mainstream Medium Sizes (G6 Production)
Component Cost Breakdown 32W Panel BOM Cost
39W Panel BOM Cost Material Cost to ASP Ratio
Material cost in 4Q12 will be USD 93.1 and 122.7 for 32W and 39W respectively. There will be a 2.6~2.7% cost saving
compared to 3Q12.
The material cost to ASP ratio in 4Q12 is 72% for 32W and 72% for 39W. Compared to 3Q12, it is an average of 2~3
percentage point decrease.
14 January 2013 | Page 29 ALL RIGHTS RESERVED. REPRODUCTION PROHIBITED WITHOUT WRITTEN PERMISSION.
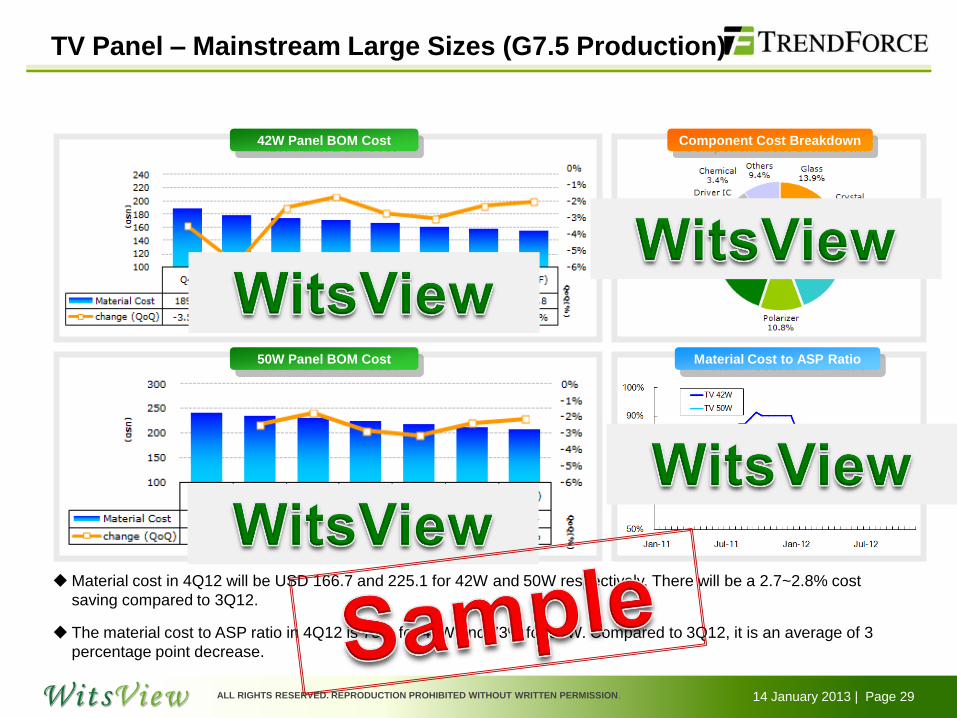
TV Panel – Mainstream Large Sizes (G7.5 Production)
Component Cost Breakdown
50W Panel BOM Cost
42W Panel BOM Cost
Material Cost to ASP Ratio
Material cost in 4Q12 will be USD 166.7 and 225.1 for 42W and 50W respectively. There will be a 2.7~2.8% cost
saving compared to 3Q12.
The material cost to ASP ratio in 4Q12 is 75% for 42W and 73% for 50W. Compared to 3Q12, it is an average of 3
percentage point decrease.
14 January 2013 | Page 30 ALL RIGHTS RESERVED. REPRODUCTION PROHIBITED WITHOUT WRITTEN PERMISSION.
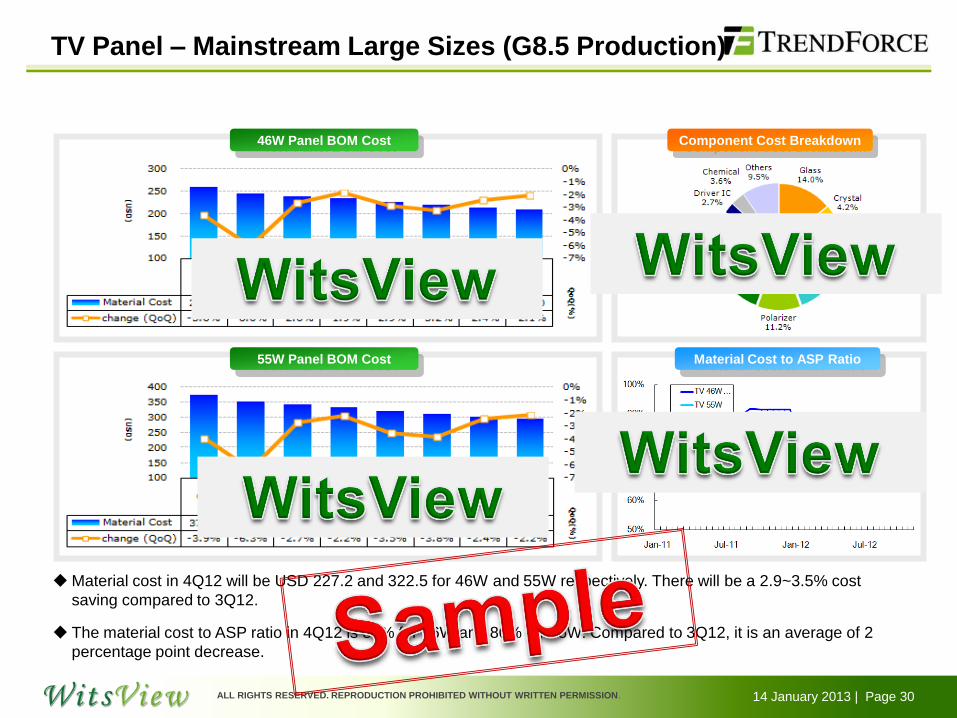
TV Panel – Mainstream Large Sizes (G8.5 Production)
Component Cost Breakdown
55W Panel BOM Cost
46W Panel BOM Cost
Material Cost to ASP Ratio
Material cost in 4Q12 will be USD 227.2 and 322.5 for 46W and 55W respectively. There will be a 2.9~3.5% cost
saving compared to 3Q12.
The material cost to ASP ratio in 4Q12 is 81% for 46W and 80% for 55W. Compared to 3Q12, it is an average of 2
percentage point decrease.
14 January 2013 | Page 31 ALL RIGHTS RESERVED. REPRODUCTION PROHIBITED WITHOUT WRITTEN PERMISSION.
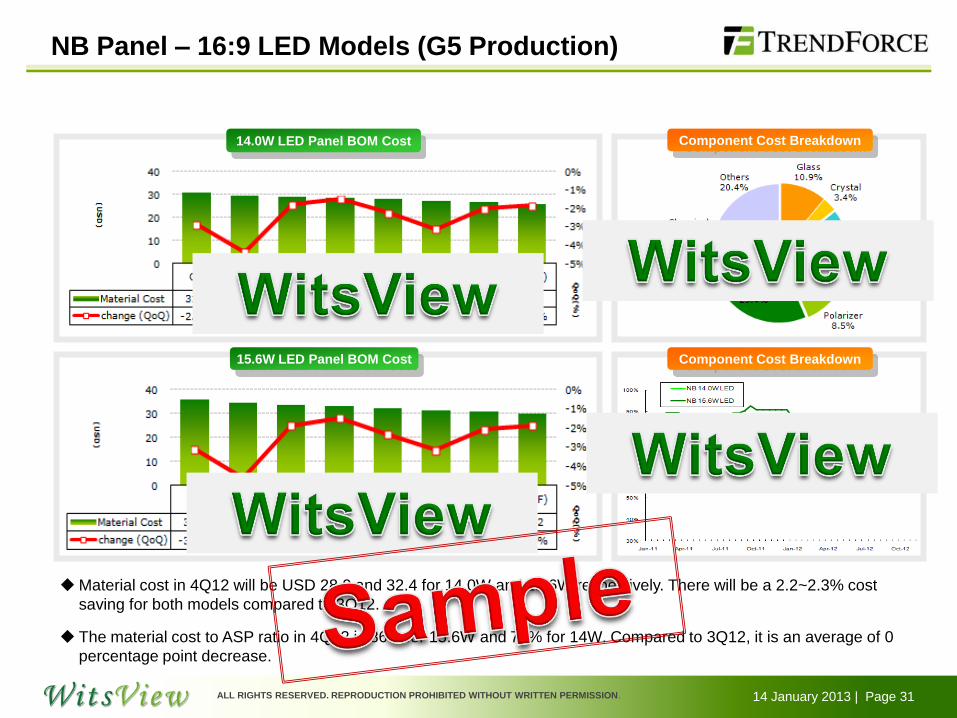
NB Panel – 16:9 LED Models (G5 Production)
Component Cost Breakdown 14.0W LED Panel BOM Cost
15.6W LED Panel BOM Cost Component Cost Breakdown
Material cost in 4Q12 will be USD 28.0 and 32.4 for 14.0W and 15.6W respectively. There will be a 2.2~2.3% cost
saving for both models compared to 3Q12.
The material cost to ASP ratio in 4Q12 is 86% for 15.6W and 77% for 14W. Compared to 3Q12, it is an average of 0
percentage point decrease.
14 January 2013 | Page 32 ALL RIGHTS RESERVED. REPRODUCTION PROHIBITED WITHOUT WRITTEN PERMISSION.
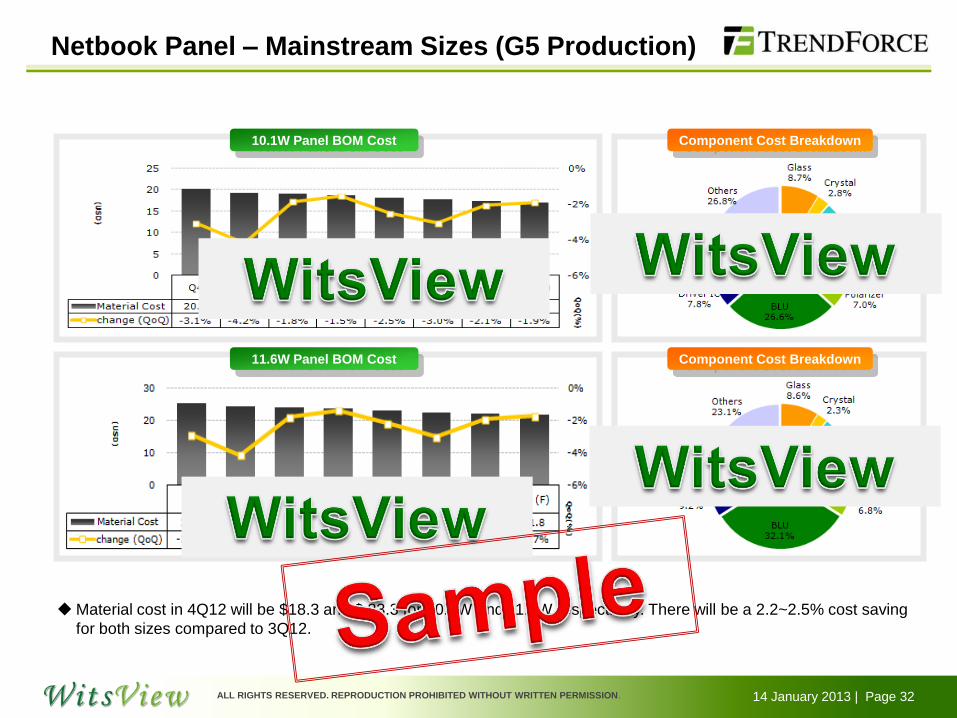
Netbook Panel – Mainstream Sizes (G5 Production)
Component Cost Breakdown
11.6W Panel BOM Cost Component Cost Breakdown
10.1W Panel BOM Cost
Material cost in 4Q12 will be $18.3 and $ 23.3 for 10.1W and 11.6W respectively. There will be a 2.2~2.5% cost saving
for both sizes compared to 3Q12.

14 January 2013 | Page 33 ALL RIGHTS RESERVED. REPRODUCTION PROHIBITED WITHOUT WRITTEN PERMISSION.
Outline
V. Panel Cost Analysis &
Financial Performance Analysis
14 January 2013 | Page 34 ALL RIGHTS RESERVED. REPRODUCTION PROHIBITED WITHOUT WRITTEN PERMISSION.
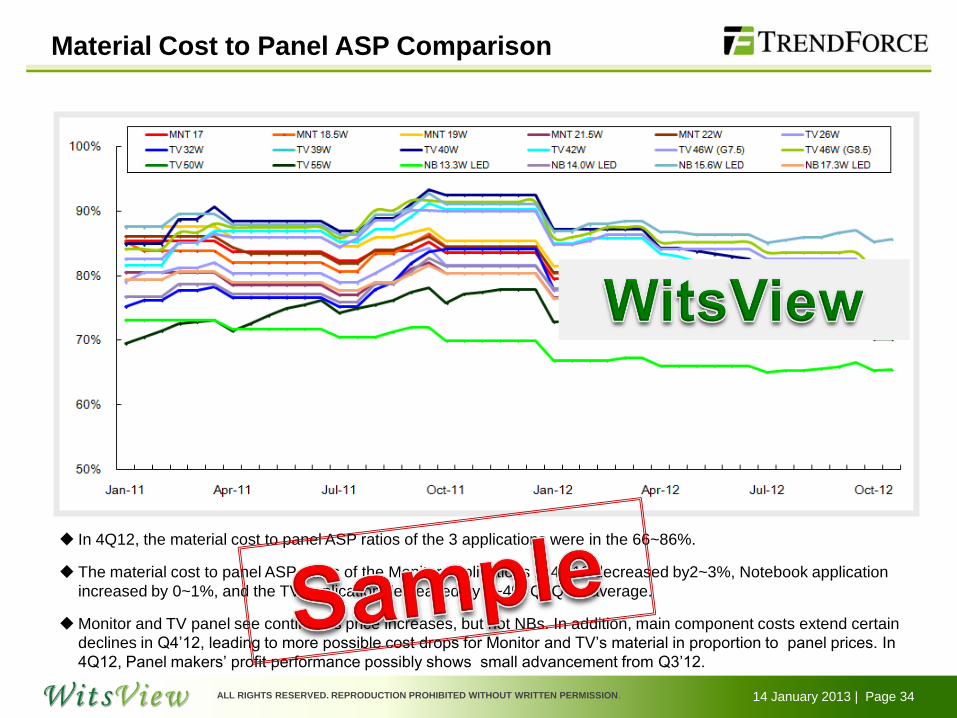
Material Cost to Panel ASP Comparison
In 4Q12, the material cost to panel ASP ratios of the 3 applications were in the 66~86%.
The material cost to panel ASP ratios of the Monitor applications in 4Q12 decreased by2~3%, Notebook application
increased by 0~1%, and the TV application decreased by 2~4% QoQ on average.
Monitor and TV panel see continuous price increases, but not NBs. In addition, main component costs extend certain
declines in Q4’12, leading to more possible cost drops for Monitor and TV’s material in proportion to panel prices. In
4Q12, Panel makers’ profit performance possibly shows small advancement from Q3’12.
14 January 2013 | Page 35 ALL RIGHTS RESERVED. REPRODUCTION PROHIBITED WITHOUT WRITTEN PERMISSION.
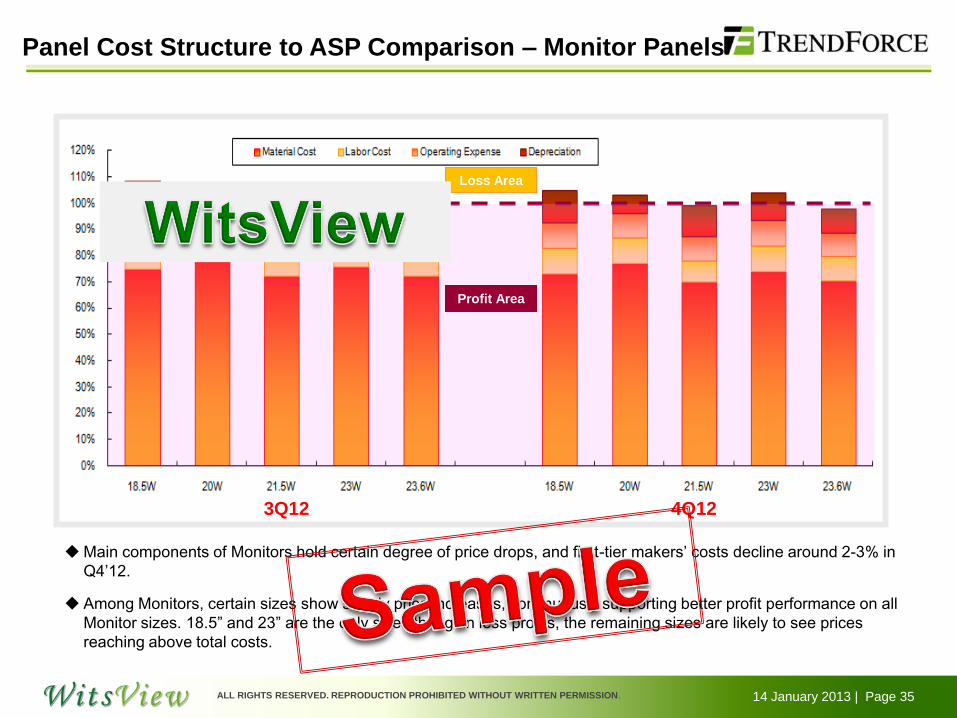
Panel Cost Structure to ASP Comparison – Monitor Panels
3Q12 4Q12
Profit Area
Loss Area
Main components of Monitors hold certain degree of price drops, and first-tier makers’ costs decline around 2-3% in
Q4’12.
Among Monitors, certain sizes show steady price increases, continuously supporting better profit performance on all
Monitor sizes. 18.5” and 23” are the only sizes that gain less profits, the remaining sizes are likely to see prices
reaching above total costs.

14 January 2013 | Page 36 ALL RIGHTS RESERVED. REPRODUCTION PROHIBITED WITHOUT WRITTEN PERMISSION.
Panel Cost Structure to ASP Comparison – TV Panels
3Q12 4Q12
Profit Area
Loss Area
In 4Q12, the TV panel cost is expected to decline by 3%-5%, as the price drop of LED BLU component starts to trim,
the decline gaps between LED and CCFL models are small.
TV panel price begins to stabilize from Q2’12, and certain sizes such as 32” and 42” see prices lifting, leading to a
further profit improvement on TV products with main sizes’ prices climbing back above cash costs.
14 January 2013 | Page 37 ALL RIGHTS RESERVED. REPRODUCTION PROHIBITED WITHOUT WRITTEN PERMISSION.
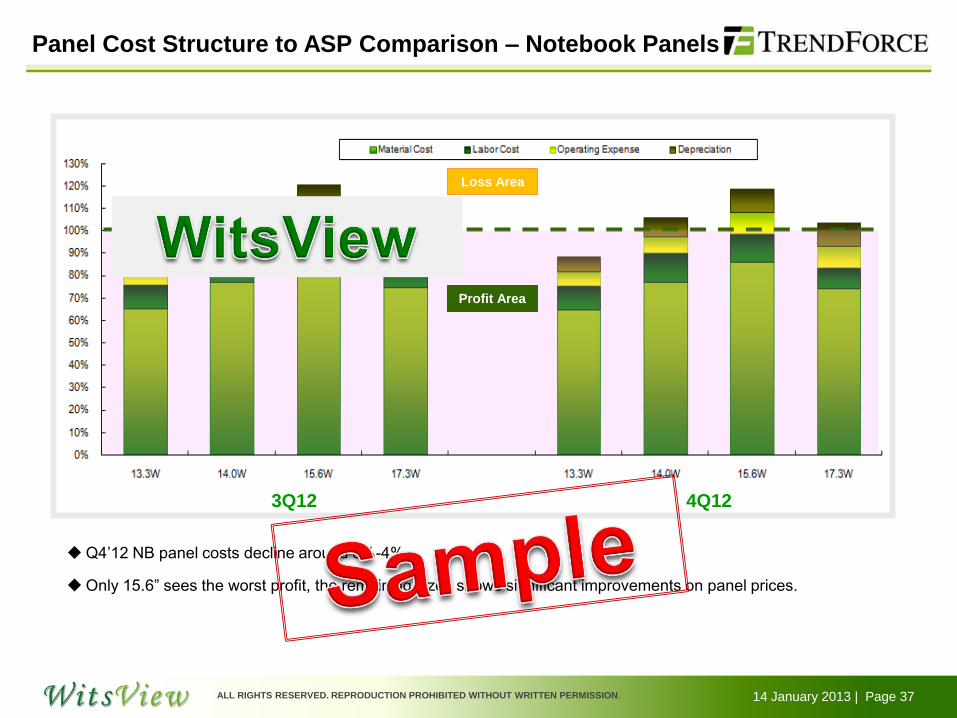
Panel Cost Structure to ASP Comparison – Notebook Panels
3Q12 4Q12
Profit Area
Loss Area
Q4’12 NB panel costs decline around 3%-4%.
Only 15.6” sees the worst profit, the remaining sizes shows significant improvements on panel prices.

14 January 2013 | Page 38 ALL RIGHTS RESERVED. REPRODUCTION PROHIBITED WITHOUT WRITTEN PERMISSION.
Outline
VI. Large Size LCD Panel Supply
14 January 2013 | Page 39 ALL RIGHTS RESERVED. REPRODUCTION PROHIBITED WITHOUT WRITTEN PERMISSION.
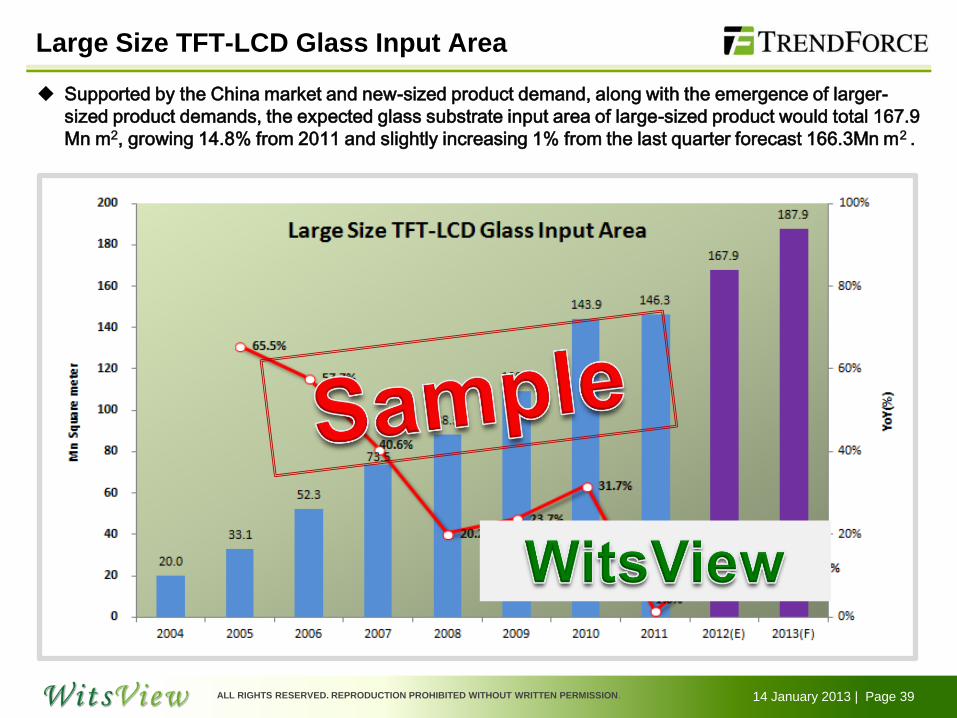
Supported by the China market and new-sized product demand, along with the emergence of larger-
sized product demands, the expected glass substrate input area of large-sized product would total 167.9
Mn m2, growing 14.8% from 2011 and slightly increasing 1% from the last quarter forecast 166.3Mn m2 .
Large Size TFT-LCD Glass Input Area
14 January 2013 | Page 40 ALL RIGHTS RESERVED. REPRODUCTION PROHIBITED WITHOUT WRITTEN PERMISSION.
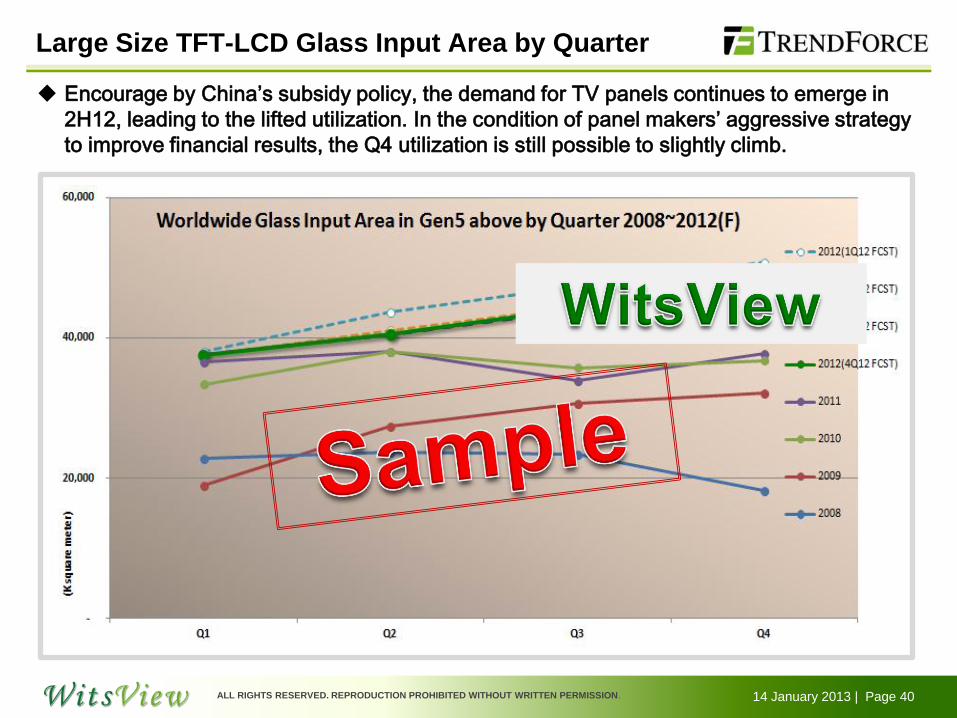
Encourage by China’s subsidy policy, the demand for TV panels continues to emerge in
2H12, leading to the lifted utilization. In the condition of panel makers’ aggressive strategy
to improve financial results, the Q4 utilization is still possible to slightly climb.
Large Size TFT-LCD Glass Input Area by Quarter

14 January 2013 | Page 41 ALL RIGHTS RESERVED. REPRODUCTION PROHIBITED WITHOUT WRITTEN PERMISSION.
Glass Input Area Trend
-22%
+4%
+5%
+4%
+3% -0.5% +11% -0.4%
+3%
Based on the observation of Q4’s growing tend from Q3, Q1 would show small decline.
From the view of largely rising input area in 2H12, the Q1’13 demand would noticeably weaken.
If panel makers wish to maintain high utilization to gain cost advantages, utilization drops may not be
obvious.
14 January 2013 | Page 42 ALL RIGHTS RESERVED. REPRODUCTION PROHIBITED WITHOUT WRITTEN PERMISSION.
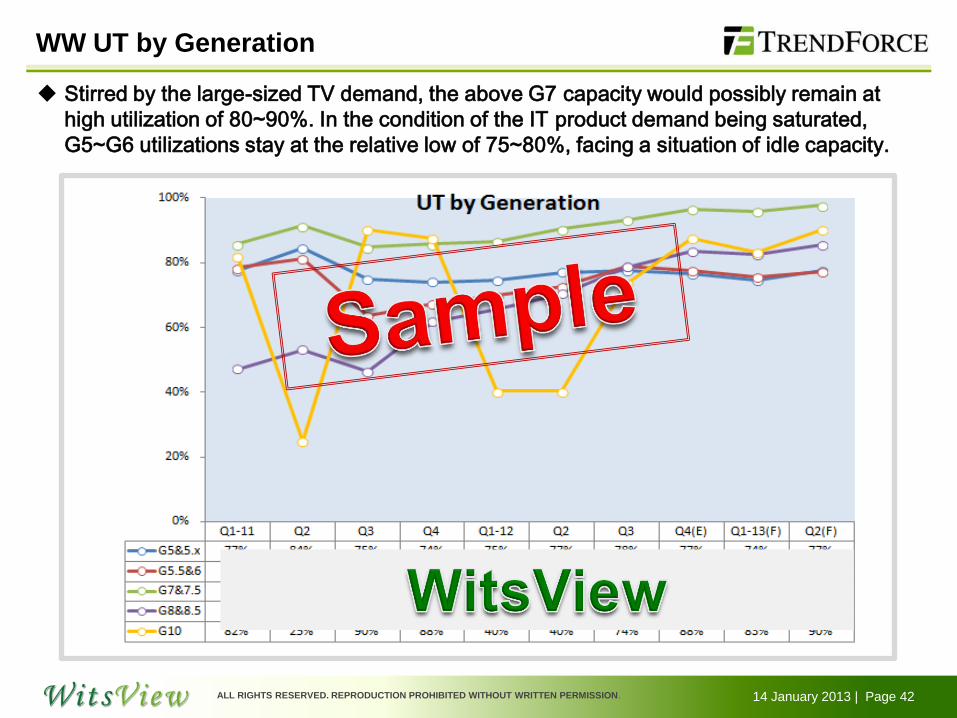
WW UT by Generation
Stirred by the large-sized TV demand, the above G7 capacity would possibly remain at
high utilization of 80~90%. In the condition of the IT product demand being saturated,
G5~G6 utilizations stay at the relative low of 75~80%, facing a situation of idle capacity.
14 January 2013 | Page 43 ALL RIGHTS RESERVED. REPRODUCTION PROHIBITED WITHOUT WRITTEN PERMISSION.
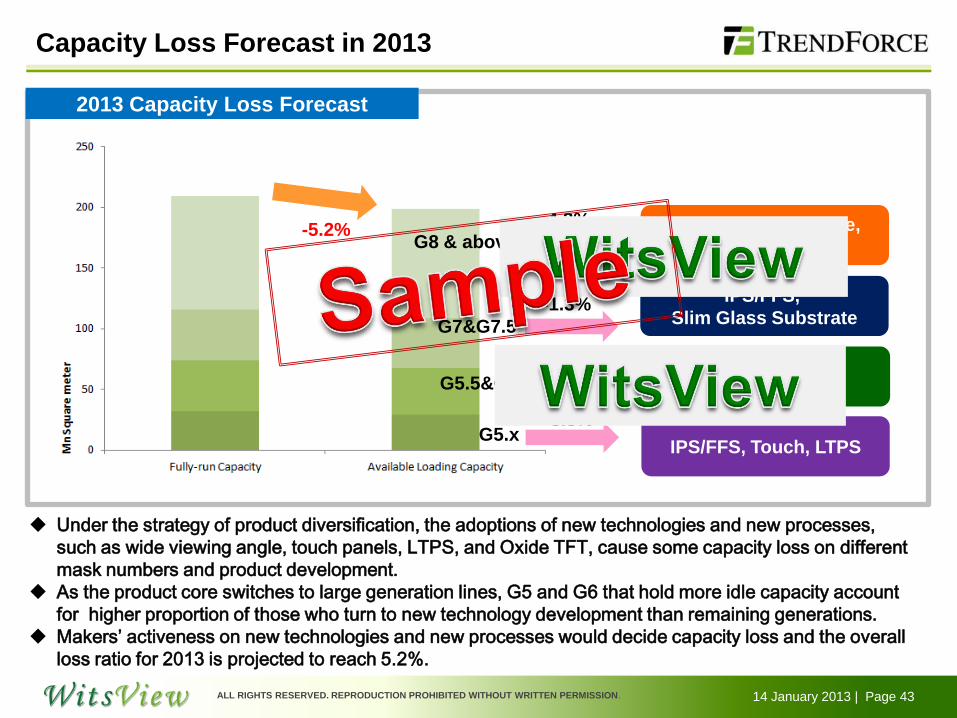
Capacity Loss Forecast in 2013
IPS/FFS, Touch, LTPS
IPS/FFS, LTPS
IPS/FFS,
Slim Glass Substrate
Slim Glass Substrate,
Oxide TFT
-8.8%
-8.7%
-1.3%
-4.3% -5.2%
G5.x
G5.5&G6
G7&G7.5
G8 & above
2013 Capacity Loss Forecast
Under the strategy of product diversification, the adoptions of new technologies and new processes,
such as wide viewing angle, touch panels, LTPS, and Oxide TFT, cause some capacity loss on different
mask numbers and product development.
As the product core switches to large generation lines, G5 and G6 that hold more idle capacity account
for higher proportion of those who turn to new technology development than remaining generations.
Makers’ activeness on new technologies and new processes would decide capacity loss and the overall
loss ratio for 2013 is projected to reach 5.2%.
14 January 2013 | Page 44 ALL RIGHTS RESERVED. REPRODUCTION PROHIBITED WITHOUT WRITTEN PERMISSION.
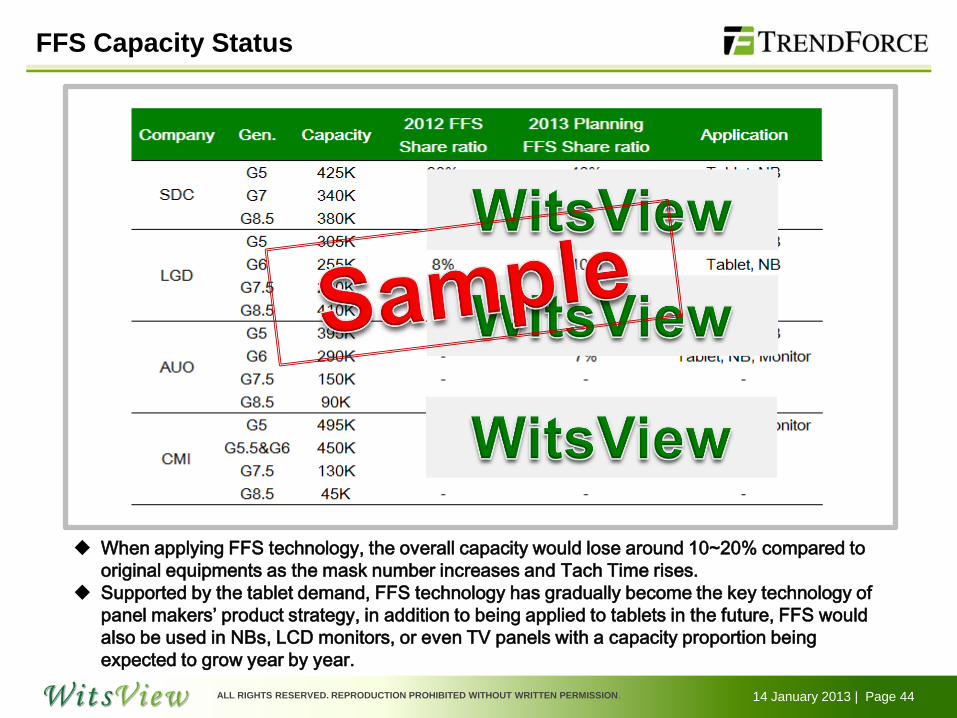
FFS Capacity Status
When applying FFS technology, the overall capacity would lose around 10~20% compared to
original equipments as the mask number increases and Tach Time rises.
Supported by the tablet demand, FFS technology has gradually become the key technology of
panel makers’ product strategy, in addition to being applied to tablets in the future, FFS would
also be used in NBs, LCD monitors, or even TV panels with a capacity proportion being
expected to grow year by year.
14 January 2013 | Page 45 ALL RIGHTS RESERVED. REPRODUCTION PROHIBITED WITHOUT WRITTEN PERMISSION.
Outline
VII. Conclusion
14 January 2013 | Page 46 ALL RIGHTS RESERVED. REPRODUCTION PROHIBITED WITHOUT WRITTEN PERMISSION.
Conclusion
As the demand for large-sized product increasingly grows, the area demand rises at the same time. For certain main
component suppliers that have no capacity expansion plans, they feel the gap between demand and supply obviously
trimming, and once the demand heats up, the demand and supply situation for some components is expected to be tight in
2013. Besides, how the adoptions of new materials such as new polarizer, structural diffuser plates help quotation to gain
cost advantages or change the upstream supply chain is also a key point to be observed on main component development
in 2013.
Due to the capacity limitation on key materials, the low-cost D-LED model development is not as good as expected in 2012,
only strongly promoted by the first-tier makers. Currently E-LED models show cost advantages with lower specifications.
Looking ahead to 2013, the successful launch of thin D-LED model depends not only on the industrial design that is close
to the E-LED Model but also if the quotation and price are appealing enough to compete with E-LED Model for the
mainstream position. This would be a key point to decide if the D-LED Model has chances to enlarge the market share.
As the hardware key technology is at the panel end, and 4K2K model development depends on panel makers’ activeness,
it may be the short term development direction for 4K2K model that panel end applies the solution of 4K2K signal
transformation which show lower display performance and cheaper prices.
As prices and shipments grow, panel makers’ profit performances improved largely in Q3’12. The utilization would remain
elevated with the Q4’12 demand remaining strong, in addition, panel makers tend to maintain utilization as high as possible
to improve profits. As a result, the utilization wouldn’t show noticeable decline through Q4’12 to Q1’13.
To lift the utilization continuously means to increase capacity and that implies a rising level of panel makers and clients’
inventory. When observing 2H12, the input area grew largely and clients’ overstocking was obvious, leading to a
reasonable expectation that the Q1’13 utilization must be obviously revised. If panel makers’ operation remains unchanged,
clients would need more time to digest the inventory and the panel demand would trim largely in 2H13.
Panel makers devote actively to the developments of new processes and new technologies and use the existing capacity
for transformation, meaning a certain degree of capacity loss. When observing conditions of all generation lines, G5-G6 see
idle capacity with weaker IT product demand, and G7-G8 see tighter capacity with strong TV product demand. But large-
sized panel demand cannot be shifted to G5-G6, and G5-G6 must make products with higher values such as high
resolution panels, wide viewing angle panels. How panel makers make good use of G5-G6 capacity is a key point to
observe in 2013.