texture and noise features for road … · [email protected]} 2. caps - instituto superior...
TRANSCRIPT

1
TEXTURE AND NOISE FEATURES FOR ROAD PAVEMENT IDENTIFICATION AND CLASSIFICATION
Joel Preto Paulo1,2, Elisabete Freitas3, J. L. Bento Coelho2
1 Instituto Superior de Engenharia de Lisboa – ISEL, Lisboa, Portugal {[email protected]}
2 CAPS - Instituto Superior Técnico, TULisbon, Lisboa, Portugal {[email protected]}
3 University of Minho, Guimarães, Portugal {[email protected]}
Abstract Road planners and road administrators frequently face the problem of insufficient knowledge of the correlation between the type of road surface and the resulting noise emission. The aim of this research is to establish the relationship between road surface characteristics, such as macrotexture, and tire/pavement noise emission, in order to identify and classify road surfaces by using statistical learning methods, which is a non-destructive approach. For this purpose, several road sections with different pavement types were selected and tested. The Close-Proximity (CPX) method was adopted, as it is commonly used to register the traffic noise in near field conditions. In its turn, macrotexture of each surface was provided by a high speed profilometer, which is one of the parameters required for the assessment of the performance and conformity of road pavements. The set of features extracted from the noise emission profile and from the surface texture was applied to a statistical classifier for evaluation. A correct identification of the road pavement leads to better data, thus enhancing the accuracy of road noise predictions. Results are presented and discussed.
Keywords: Tire/road noise; Road texture and noise features; Statistical classification, CPX method.
1 Introduction
Measures aiming at reducing environmental noise usually consider acoustic barriers alongside the road. However, the cost associated to these measures is usually considerably high and its applicability in urban areas is reduced. The problem of the visual impact
Invite
d Paper

INTERNOISE 2010 │ JUNE 13-16 │ LISBON │ PORTUGAL
2
introduced by applying these measures is another issue affecting the acceptance of the communities. Nowadays, road planners are considering low noise surfaces as an alternative. The design of this type of surfaces optimizes texture and porosity, by controlling aggregate gradding of the mixtures. Therefore, a considerable variety of different surfaces is available. In some conditions, noise level abatements up to 15 dB can be achieved [1-2]. Nevertheless, road planners, road administrators and contractors frequently face the problem of not knowing exactly the correlation between the texture of surfaces and the noise emission profiles, along the time of the road operation. The purpose of this research is to establish a first approach to relate road surface characteristics, such as macrotexture, and tire/pavement noise emission, in order to identify and classify road surfaces by using statistical learning methods, with a non-destructive approach. Furthermore, a available database for the enumeration of the characteristics for the different types of road surfaces is also a helpful tool to provide guidelines for the road decision-makers.
2 Methodology
In order to relate texture and noise, five road surfaces with different characteristics were selected. Then, macrotexture and noise were acquired together in all the extension of the road tracks. The macrotexture was acquired with a High Speed Profilometer (HSP) following the ISO 13473-1 standard [3]. Therefore the indicator used for comparing macrotexture and noise was the Mean Profile Depth (MPD). The acoustical signal was acquired along the road trial using the Close Proximity procedure (CPX) as described in the ISO CD 11819-2 standard [4]. This procedure was developed to measure the influence of road surfaces on traffic noise under near field conditions, where tire/road noise dominates (i.e., where engine noise, intake noise, and exhaust noise can be discarded), which is known to happen for speeds above 50km/h, for light vehicles [5]. For model validation purposes, the speed of 80km/h was used throughout this study, which was chosen among the reference speeds mentioned in the ISO CD 11819-2 standard. The audio signals acquired by this procedure were stored and processed using a dedicated Matlab-based platform. Aiming to determine the features that best describe data acquired, the macrotexture and the corresponding audio signal of each road surface were then subjected to analysis. The relation macrotexture/noise was determined through the set of features which in its turn was applied to a statistical classifier for evaluation and assessment [6].
2.1 Pavement types
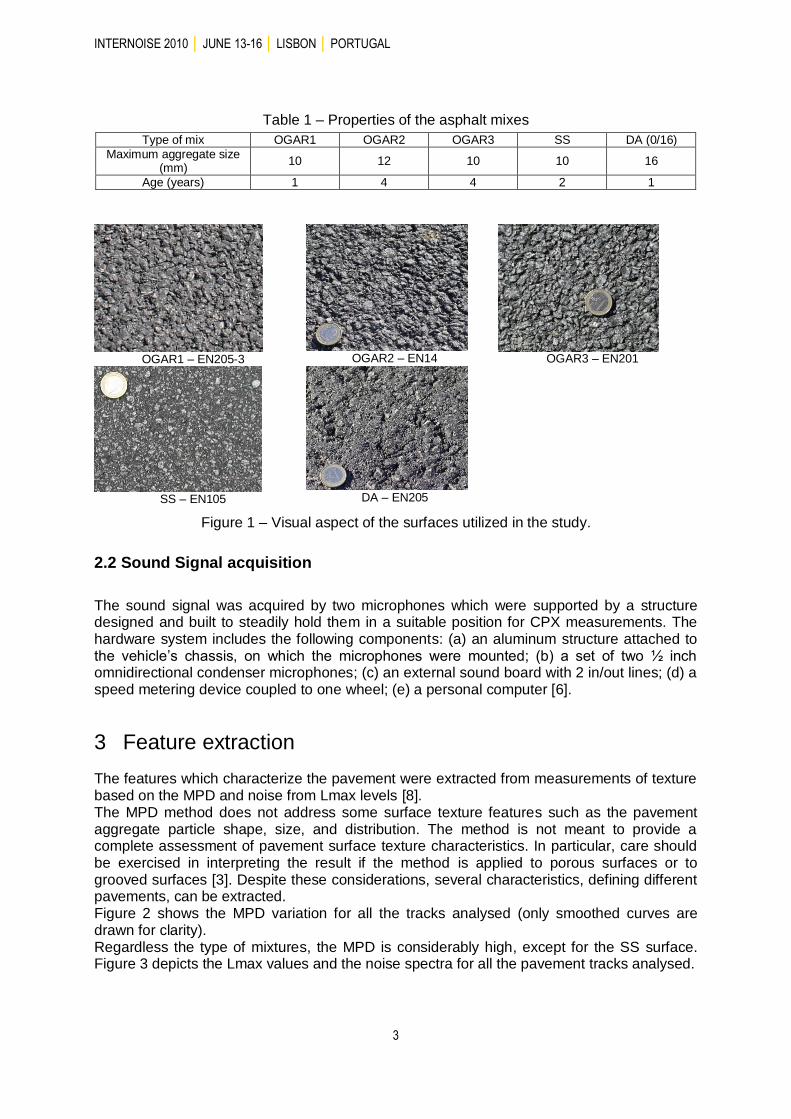
The set of the five road surfaces chosen for this study include the most commonly ones used in Portugal: one of Dense Asphalt (DA), one of Slurry Surfacing (SS) and three surfaces of Open Graded Asphalt Rubber (OGAR), which at the present time are used extensively. Table 1 presents the maximum aggregate size and the age of each surface. The maximum aggregate size together with the texture and the porosity and the age of the surface were reported in literature as the main parameters affecting tyre/surface noise [7]. Figure 1 shows the visual aspect of these pavement surfaces.
INTERNOISE 2010 │ JUNE 13-16 │ LISBON │ PORTUGAL
3
Table 1 – Properties of the asphalt mixes
Type of mix OGAR1 OGAR2 OGAR3 SS DA (0/16)
Maximum aggregate size (mm)
10 12 10 10 16
Age (years) 1 4 4 2 1
OGAR1 – EN205-3
OGAR2 – EN14
OGAR3 – EN201
SS – EN105
DA – EN205
Figure 1 – Visual aspect of the surfaces utilized in the study.
2.2 Sound Signal acquisition
The sound signal was acquired by two microphones which were supported by a structure designed and built to steadily hold them in a suitable position for CPX measurements. The hardware system includes the following components: (a) an aluminum structure attached to the vehicle’s chassis, on which the microphones were mounted; (b) a set of two ½ inch omnidirectional condenser microphones; (c) an external sound board with 2 in/out lines; (d) a speed metering device coupled to one wheel; (e) a personal computer [6].
3 Feature extraction
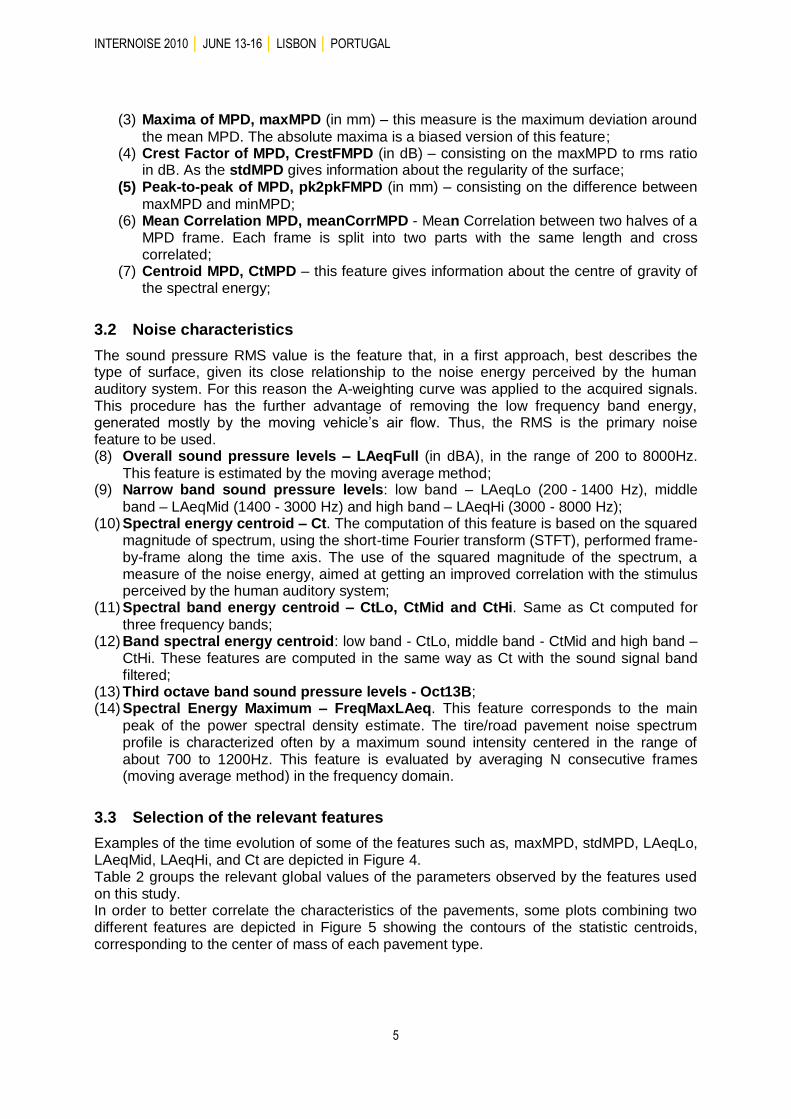
The features which characterize the pavement were extracted from measurements of texture based on the MPD and noise from Lmax levels [8]. The MPD method does not address some surface texture features such as the pavement aggregate particle shape, size, and distribution. The method is not meant to provide a complete assessment of pavement surface texture characteristics. In particular, care should be exercised in interpreting the result if the method is applied to porous surfaces or to grooved surfaces [3]. Despite these considerations, several characteristics, defining different pavements, can be extracted. Figure 2 shows the MPD variation for all the tracks analysed (only smoothed curves are drawn for clarity). Regardless the type of mixtures, the MPD is considerably high, except for the SS surface. Figure 3 depicts the Lmax values and the noise spectra for all the pavement tracks analysed.

INTERNOISE 2010 │ JUNE 13-16 │ LISBON │ PORTUGAL
4
0 20 40 60 80 100 120 140 160 180
0.4
0.6
0.8
1
1.2
1.4
Distance (m)
(mm
)MPD
EN205-3
EN105
EN14
EN201
EN205
0 1 2 3 4 5 6 7 80.04
0.06
0.08
0.1
0.12
0.14
0.16
0.18
0.2
Time (s)
Texture - MPD Standard Deviation
EN205-3
EN105
EN14
EN201
EN205
Figure 2 – Mean Profile Depth, MPD, and Standard deviation of MPD of the road tracks analysed.
1 2 3 4 5 6 7 886
88
90
92
94
96
98
100
Noise Level - Full band
Time (sec)
SP
L (
dB
A)
EN205-3
EN105
EN14
EN201
EN205
102
103
104
50
55
60
65
70
75
80
85
90
95
(Hz)
Ma
g. (d
BA
)
CPX Noise - 1/3 Octave Bands
EN205-3
EN105
EN14
EN201
EN205
Figure 3 – Noise Lmax values evolution and noise spectra of the road tracks analysed for a
speed of 80km/h. The following sections describe the vector of features adopted in this work. It includes a set of characteristics which are the most appropriated to relate noise and texture. The features were obtained for frames of length equal to 2048 samples using rectangular or Hanning sliding windows, depending on the analysis. The sliding factor was 12.5% of the window length (hop-size of 256 samples), with sampling frequency equal to 32 kHz. The use of this sliding factor (lower than 50%) allows a better identification of the variability of the pavement texture and location of any surface irregularities. In order to make equal the rate of samples for texture and noise data measurements, the resampling technique was applied to the texture data (the data provided by the MPD measurements is 40000 samples/km (one sample for each 2.5 cm) for a vehicle speed of 80 km/h (R= 36). The feature selection procedure has several goals: to remove any redundant characteristics; to decrease the dimensionality of the feature vector; and to decrease the computational cost of the classifier. Nevertheless, the vector of selected features has to include all the fundamental characteristics of the road surface that are relevant to the classification task.
3.1 Texture characteristics
The criteria adopted for choosing the set of texture features was based on the physical meaning of the data given by the MPD. Once the MPD is itself a mean measure, all the parameters extracted are mean values. The parameters analysed are:
(1) Mean of MPD, meanMPD (in mm) – this feature represents the mean value of the
MPD using the moving average method; (2) Standard Deviation of MPD, stdMPD (in mm) – gives information about the
regularity of the surface;
INTERNOISE 2010 │ JUNE 13-16 │ LISBON │ PORTUGAL
5
(3) Maxima of MPD, maxMPD (in mm) – this measure is the maximum deviation around
the mean MPD. The absolute maxima is a biased version of this feature; (4) Crest Factor of MPD, CrestFMPD (in dB) – consisting on the maxMPD to rms ratio
in dB. As the stdMPD gives information about the regularity of the surface; (5) Peak-to-peak of MPD, pk2pkFMPD (in mm) – consisting on the difference between
maxMPD and minMPD; (6) Mean Correlation MPD, meanCorrMPD - Mean Correlation between two halves of a
MPD frame. Each frame is split into two parts with the same length and cross correlated;
(7) Centroid MPD, CtMPD – this feature gives information about the centre of gravity of the spectral energy;
3.2 Noise characteristics
The sound pressure RMS value is the feature that, in a first approach, best describes the type of surface, given its close relationship to the noise energy perceived by the human auditory system. For this reason the A-weighting curve was applied to the acquired signals. This procedure has the further advantage of removing the low frequency band energy, generated mostly by the moving vehicle’s air flow. Thus, the RMS is the primary noise feature to be used. (8) Overall sound pressure levels – LAeqFull (in dBA), in the range of 200 to 8000Hz.
This feature is estimated by the moving average method; (9) Narrow band sound pressure levels: low band – LAeqLo (200 - 1400 Hz), middle
band – LAeqMid (1400 - 3000 Hz) and high band – LAeqHi (3000 - 8000 Hz); (10) Spectral energy centroid – Ct. The computation of this feature is based on the squared
magnitude of spectrum, using the short-time Fourier transform (STFT), performed frame-by-frame along the time axis. The use of the squared magnitude of the spectrum, a measure of the noise energy, aimed at getting an improved correlation with the stimulus perceived by the human auditory system;
(11) Spectral band energy centroid – CtLo, CtMid and CtHi. Same as Ct computed for
three frequency bands; (12) Band spectral energy centroid: low band - CtLo, middle band - CtMid and high band –
CtHi. These features are computed in the same way as Ct with the sound signal band filtered;
(13) Third octave band sound pressure levels - Oct13B; (14) Spectral Energy Maximum – FreqMaxLAeq. This feature corresponds to the main
peak of the power spectral density estimate. The tire/road pavement noise spectrum profile is characterized often by a maximum sound intensity centered in the range of about 700 to 1200Hz. This feature is evaluated by averaging N consecutive frames (moving average method) in the frequency domain.
3.3 Selection of the relevant features
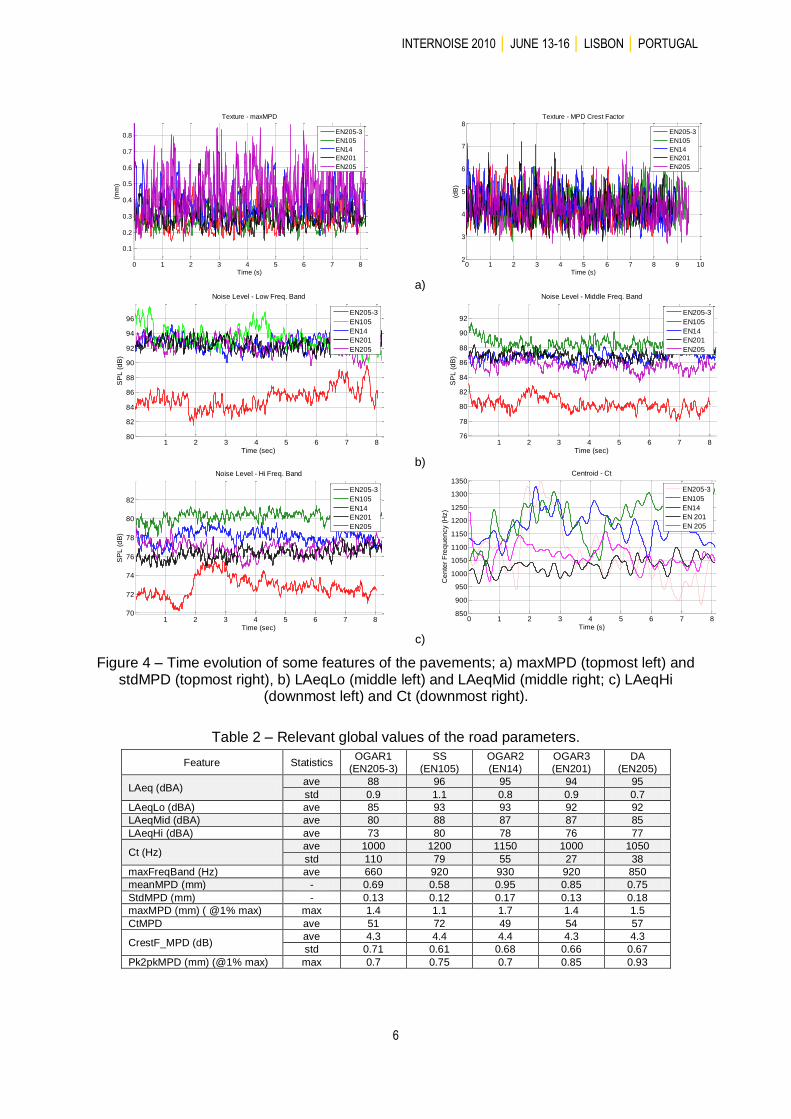
Examples of the time evolution of some of the features such as, maxMPD, stdMPD, LAeqLo, LAeqMid, LAeqHi, and Ct are depicted in Figure 4. Table 2 groups the relevant global values of the parameters observed by the features used on this study. In order to better correlate the characteristics of the pavements, some plots combining two different features are depicted in Figure 5 showing the contours of the statistic centroids, corresponding to the center of mass of each pavement type.
INTERNOISE 2010 │ JUNE 13-16 │ LISBON │ PORTUGAL
6
0 1 2 3 4 5 6 7 8
0.1
0.2
0.3
0.4
0.5
0.6
0.7
0.8
Time (s)
(mm
)Texture - maxMPD
EN205-3
EN105
EN14
EN201
EN205
0 1 2 3 4 5 6 7 8 9 10
2
3
4
5
6
7
8
Time (s)
(dB
)
Texture - MPD Crest Factor
EN205-3
EN105
EN14
EN201
EN205
a)
1 2 3 4 5 6 7 880
82
84
86
88
90
92
94
96
Noise Level - Low Freq. Band
Time (sec)
SP
L (
dB
)
EN205-3
EN105
EN14
EN201
EN205
1 2 3 4 5 6 7 8
76
78
80
82
84
86
88
90
92
Noise Level - Middle Freq. Band
Time (sec)S
PL
(d
B)
EN205-3
EN105
EN14
EN201
EN205
b)
1 2 3 4 5 6 7 870
72
74
76
78
80
82
Noise Level - Hi Freq. Band
Time (sec)
SP
L (
dB
)
EN205-3
EN105
EN14
EN201
EN205
0 1 2 3 4 5 6 7 8
850
900
950
1000
1050
1100
1150
1200
1250
1300
1350Centroid - Ct
Time (s)
Ce
nte
r F
req
ue
ncy (
Hz)
EN205-3
EN105
EN14
EN 201
EN 205
c)
Figure 4 – Time evolution of some features of the pavements; a) maxMPD (topmost left) and stdMPD (topmost right), b) LAeqLo (middle left) and LAeqMid (middle right; c) LAeqHi
(downmost left) and Ct (downmost right).
Table 2 – Relevant global values of the road parameters.
Feature Statistics OGAR1
(EN205-3)
SS
(EN105)
OGAR2
(EN14)
OGAR3
(EN201)
DA
(EN205)
LAeq (dBA) ave 88 96 95 94 95
std 0.9 1.1 0.8 0.9 0.7
LAeqLo (dBA) ave 85 93 93 92 92
LAeqMid (dBA) ave 80 88 87 87 85
LAeqHi (dBA) ave 73 80 78 76 77
Ct (Hz) ave 1000 1200 1150 1000 1050
std 110 79 55 27 38
maxFreqBand (Hz) ave 660 920 930 920 850
meanMPD (mm) - 0.69 0.58 0.95 0.85 0.75
StdMPD (mm) - 0.13 0.12 0.17 0.13 0.18
maxMPD (mm) ( @1% max) max 1.4 1.1 1.7 1.4 1.5
CtMPD ave 51 72 49 54 57
CrestF_MPD (dB) ave 4.3 4.4 4.4 4.3 4.3
std 0.71 0.61 0.68 0.66 0.67
Pk2pkMPD (mm) (@1% max) max 0.7 0.75 0.7 0.85 0.93

INTERNOISE 2010 │ JUNE 13-16 │ LISBON │ PORTUGAL
7
0.4 0.5 0.6 0.7 0.8 0.9 1 1.1 1.2
50
60
70
80
90
100
(mm)
2D Feature Space (meanMPD vs. CtMPD)
OGAR1 (10%)
SS
OGAR2 (20%)
OGAR3 (20%)
DA
0.4 0.5 0.6 0.7 0.8 0.9 1 1.1 1.2
0.05
0.1
0.15
0.2
0.25
(mm)
2D Feature Space (meanMPD vs. stdMPD)
OGAR1 (10%)
SS
OGAR2 (20%)
OGAR3 (20%)
DA
88 90 92 94 96 98 100800
1000
1200
1400
1600
1800
2000
Freq (dBA)
(Hz)
2D Feature Space (LAeqFull vs. Ct)
OGAR1 (10%)
SS
OGAR2 (20%)
OGAR3 (20%)
DA
0.4 0.5 0.6 0.7 0.8 0.9 1 1.1 1.2
70
72
74
76
78
80
82
Deph (mm)
(dB
A)
2D Feature Space (meanMPD vs. LAeqHi)
OGAR1 (10%)
SS
OGAR2 (20%)
OGAR3 (20%)
DA
Figure 5 – 2D plots of pairs of different features; meanMPD vs. CtMPD (topmost left), meanMPD vs. StdMPD (topmost right), LAeq vs. Ct (downmost left) and meanMPD vs.
LAeqHi (downmost right). Some conclusions can be stated from the figures and tables above:
1- The pavement OGAR1 exhibits the lowest global noise emission (a difference of about 7dBA compared with the other pavements) and the lowest frequency for the maximum LAeq (feature maxFreqBand). However, the LAeq and Ct samples are considerably spread and with some level of dependency. It means that the spectral energy has a non-stationary behavior (it changes very often along the track) and they depend inversely (for an increase of the noise levels a decrease of the centroid is viewed, and vice versa). This characteristic was already found in other layers [2];
2- The pavements OGAR2, OGAR3, SS and DA almost generate the same global noise. However, a number of differences are observed, such as: (i) although some differences are observed on the meanMPD (specially for the OGAR2, OGAR3 and DA) little difference is notice on the global noise levels, (ii) The pavement OGAR2 and DA show the highest deviation of the meanMPD, however, little correlation with the noise levels is observed;
3- Some features, such as the StdMPD, maxMPD, CrestFMPD and maxCorrMPD, have little relevance to the correlation because their similarity. This finding is related to the fact the MPD is itself a mean parameter, estimated by averaging methods, thus, giving less significance to the features estimated from the maximum values.
4 Analysis of the Results
The vector of features extracted was applied to a statistical classifier as a first approach to correlate texture and noise data. The density functions of each feature were analyzed in order to verify in advance the level of success on the separation of the pavement surfaces. With this procedure, named feature selection method, the features maxMPD, CrestFMPD,

INTERNOISE 2010 │ JUNE 13-16 │ LISBON │ PORTUGAL
8
pk2pkMPD and maxCorrMPD were excluded because they were notindependent from each other. Moreover, little difference was observed on the density functions for the different road pavements. This permits reducing the dimension of the feature vector, increasing the classification process without reducing the accuracy of the results.
4.1 Classifier processing
The classifier system is trained by using the MPD and sound signal for each type of pavement. Therefore, the module used for classification was the result of a supervised learning approach. A database populated by entries describing different types of surfaces was built beforehand [9]. The road pavement classification framework consists mainly of two stages: (i) feature extraction, and (ii) classification. The data samples are classified in a specific class depending on its location on the feature space. In this study, 14 features were considered initially for testing. Classifier Learning – The feature vectors from each pavement class were divided into two
sets: a training set and a test set. A randomly chosen subset of 30% of the vectors is assigned to the training set and the remaining 70% correspond to the test set. An N-dimensional Gaussian density model (where N is the length of the feature vector) is then
adjusted to each class, based on the training set, assuming that each road surface class comprises a single centroid (in a statistic sense) with its own mean and co-variance. The assumption of normal distribution for the selected features is supported by the observation of the distribution function of the majority of features.
4.2 Experimental results
In order to provide some insight into the classifier obtained, the corresponding decision boundaries have been plotted. Ten features were used, after feature selection procedure. Since it is impossible to graphically represent the N-dimensional decision boundaries, 2D
projections of these boundaries for the pair of features LAeqFull – meanMPD, which are the most important relating noise and texture, are depicted in Figure 6.
88 90 92 94 96 98 100
0.4
0.5
0.6
0.7
0.8
0.9
1
1.1
1.2
(dBA)
(mm
)
2D Feature Space (LAeqFull vs. meanMPD)
OGAR1 (10%)
SS
OGAR2 (20%)
OGAR3 (20%)
DA
Figure 6 - Feature space in 2D showing for LAeq and meanMPD with indication of decision
boundaries of the classifier.
The observation of the figure reveals that for these features some classes of pavement types are similar. However, considering the use of the rest set of features the classes can be practically separated. Each sub-feature space provides information on the best separation between the classes using the statistical classifier.

INTERNOISE 2010 │ JUNE 13-16 │ LISBON │ PORTUGAL
9
The result of the classification is assessed by means of the related confusion matrix. This matrix yields the error committed by the classifier. The principal diagonal of the confusion matrix corresponds to the right pavement classification. The confusion matrix for the ideal classifier consists only of a diagonal matrix. The numeric values in each cell give the result of classification in percentage.
All Noise Features
Estimated Pavement
Tru
e P
ave
me
nt
1000
0
0
0
0
10010.3
0.2
0
0
66.721.68.1
0
0
20.572.45.6
0
0
11.85.786.1
1 2 3 4 5
2
4
All Texture Features
Estimated Pavement
Tru
e P
ave
me
nt
76.73.80.19.923.4
8.493.60
0
19
0.20
64.13.24.5
10.40
33.785.215
4.42.62.11.838.2
1 2 3 4 5
2
4
All Noise and Texture Features
Estimated Pavement
Tru
e P
ave
me
nt
100
0
0
0
0
0
99.9
0
0
0.1
0
0.1
88.8
2.8
1.4
0
0
10.5
95
3.4
0
0
0.7
2.2
95.1
1 2 3 4 5
1
2
3
4
5
All Noise Features + meanMPD, stdMPD and CtMPD
Estimated Pavement
Tru
e P
ave
me
nt
1000
0
0
0
0
1000
0
0.3
0
0
93.2
9.5
1.9
0
0
6.3
86.6
2.5
0
0
0.5
4
95.4
1 2 3 4 5
1
2
3
4
5
Figure 7 - Confusion matrices using the Bayesian classifier. Topmost left – noise features only; Topmost right – texture features only; downmost left – all the features suggested and
downmost right – all noise plus the selected texture features.
As a trail for evaluating the importance of the noise and textures related features on the classification, several tests were carried out. The first attempt consisted of the classification with only noise features. The result showed that, for only to the OGAR1 and SS pavements, the classification error is insignificant, the rest of the pavements are identified with a degree of confidence ranging from about 60% to 80%. The test with only texture features reveals unsatisfactory on the identification of the correct road surface, however, for the pavement OGAR3 (pavement 4 in the table) the results are better than for noise features only. In general, the noise features are more robust, more independent, than texture features. The principal reason for this finding is because only features based on macrotexture are used, whose reveal insufficient to characterize the road texture completely. The use of all features leads to a good accuracy with the true pavement, excepting for the OGAR2 pavement. A remarkable finding is the fact that the same results are achieved with only three textures features (statement already mentioned before), having the advantage of reducing the computational load. Obviously, the increase of the amount of different road pavements types could alter this conclusion.
5 Conclusions
A new approach for the classification and identification of different types of road pavements, comprising an array of procedures to acquire and pre-process road noise near a test tire and texture was presented. The method uses statistical classification techniques over features extracted from the noise and texture resulting from the circulation of motor light vehicles. The tests were conducted with a set of fourteen types of pavements, including currently used asphalt concrete, porous and gap graded asphalts. The results of road surface classification provided by the method showed a good agreement with the true road pavements. The error corresponding to a mismatch classification, i.e. classifying an unknown road pavement in a

INTERNOISE 2010 │ JUNE 13-16 │ LISBON │ PORTUGAL
10
wrong pavement type, is found to be in the range of 1 to 10%, which can be considered quite well given the similarity of some road surfaces characteristics. Due to the discrepancy of measurement data of some types of pavements, care must be taken on the pre-processing of the data, excluding, as much as possible, discrepancies related with problems of the construction process of the roads (unless the goal of the study is conformity road assessment). As a final remark, the correct correlation between noise and texture characteristics should take into account not only on the level of macrotexture but also the on micro and megatexture in order to deliver more information to correlate texture and noise conveniently, thus, achieving better results on the classification. Since the speed of the vehicle is related to the generated noise levels, the correct surface classification should be carried out with measurements at several speeds and at constant velocity. The assumption of Gaussian distribution of the features extracted from the texture and noise measurements is not always true. Thus, other types of classifiers should be considered for evaluation.
Acknowledgments
Research was partially supported by the FCT-CAPS/IST plurianual funding through the POS_C Program that includes FEDER funds and by the FCT grant to the project NOISELESS referenced PTDC/TRA/67859/2006.
References [1] Descornet, G.; and Goubert, L., Noise Classification of Road Pavements, Task 1:
technical background information 1, Draft Report 05, Directorate-General Environment, European Commission, 2006.
[2] Freitas, E.; Paulo J. Preto; and Bento Coelho, J. L., Silent Surfaces: An Experience in Portugal, SURF Proceedings, Portoroz, Slovenia, 2008, In CD-ROM.
[3] ISO 13473-1. Characterization of pavement texture by use of surface profiles – Part 1: Determination of Mean Profile Depth. International Organisation for Standardisation (ISO), Geneve, Switzerland, 1997.
[4] ISO CD 11819-2. Acoustics – Method for Measuring the Influence of Road Surfaces on Traffic Noise – Part 1: The Close Proximity Method. International Organisation for Standardisation (ISO), Geneve, Switzerland, 2000.
[5] Sandberg, U.; and Ejsmont, J. A., Tyre/Road Noise Reference Book, INFORMEX, 2002.
[6] Paulo, J.; Bento Coelho, J. L., Road pavement classification based on noise emission characteristics. Acoustics’08- Euronoise2008, Paris, France, 29 June – 4 July, 2008. Proceedings Euronoise2008, In CD-ROM.
[7] SILVIA. Guidance manual for the implementation of low-noise road surfaces. FEHRL report 2006/02, Forum of European National Highway Research Laboratories, Brussels, Belgium, 2006.
[8] Sayers M.; and Karamihas S., The Little Book of Profiling, University of Michigan, 1998.
[9] Duda, R. O.; and Hart, P. E., Pattern classification and scene analysis, Wiley, New York, 1973.