textile industry in bangladesh: an analysis of...
TRANSCRIPT

Management Studies and Economic Systems (MSES), 2 (4), 287-298, Spring 2016 © ZARSMI
Textile Industry in Bangladesh: An Analysis of CVP
1 Md. Rostam Ali,
*2 Syed Moudud-Ul-Huq
1,2 Department of Business Administration, Mawlana Bhashani Science and Technology University,
Santosh, Bangladesh
Received 30 December 2015, Accepted 21 June 2016
ABSTRACT: The primary attempt of this paper is to evaluate the performance of manufacturing companies based on CVP (Cost-Volume-Profit) analysis in Bangladesh. To attain this purpose, 14 manufacturing companies have been surveyed from Textile Industry. This study has also been attempted to examine the influence of key indicators of CVP analysis in performance evaluation in textile industry. The study finds that the average contribution margin ratios are 16.13% in the year 2013 and 15.57% in the year 2012. So, average contribution margin ratio has increased by 0.56% in the year 2013. Again the average margin of safety percentage (MS %) are 53.59% in the year 2013 and 51.46% in the year 2012. So, average margin of safety percentage has increased by 2.13% in the year 2013. This indicators represent textile industry is increasing operating profit with contribution margin. Finally, findings inform that the other indicators of CVP techniques such as contribution margin, break-even-sales, and margin of safety have changed positively where the degree of operation leverage (DOL) and earnings per share (EPS) have changed negatively in the year 2013 than the year 2012. This study also provides some suggestions against precincts in applying CVP as a measure of performance. Keywords: CVP (Cost-Volume-Profit) Analysis, Manufacturing industry, Break Even Point, Contribution
margin, Margin of safety, Earnings per Share (EPS), Degree of Operating Leverage (DOL)
INTRODUCTION
Performance evaluation of a company is to measuring the employees’ contribution to the company to know how well a company is operated in business arena and how effectively and efficiently a company is using its resources and opportunities. CVP (Cost-Volume-Profit) analysis is essential tool to evaluate the performance and to appraise managerial performance in different segments of an organization particularly in manufacturing organizations. Manager use Cost-Volume-Profit (CVP) analysis to identify the levels of operating activity needed to avoid losses, achieve targeted profits, plan future operations, and monitor organizational performance. Manufacturing
industry refers to any business that transforms raw materials into finished or semi-finished goods using machines, tools and labors. These industries involve in the manufacturing and processing of items and indulge in either creation of new commodities or in value addition. Manufacturing sectors include production of food, chemicals, textiles, machines and equipment. The CVP analysis is the abbreviation for the relationship analysis of cost-volume-profit, it refers to a quantitative analysis method which is based on cost behavior analysis, and uses mathematical model of accounting to reveal the internal laws of fixed costs, variable costs, sales price, sales volume,
*Corresponding Author, Email: [email protected]
Md. Rostam Ali; Syed Moudud-Ul-Huq
288
profits and other related variables, it can provide the necessary financial information for accounting prediction, decision-making and planning. With this approach, enterprises can predict the only amount of sales of their products to the break-even, or forecast how much profit can be got in a certain amount of sales, or forecast the amount of products must be solved in order to obtain a certain profit, as well as the amount of price of products must be reduced in order to expand sales volume to determine the current position of manufacturing company and to make a judgment of how well manufacturing company performs its operation and how well the company has been able to utilize its assets and earn profit. A business entity now-a-days, has to be efficient in order to perform and stay in business. Efficiency measurement is one aspect of a company’s performance. Efficiency can be measured with respect to maximization of output, minimization of cost or maximization of profits. In order to compete with other firms in international market, business organizations such as manufacturing companies, banks, private companies whether big or small organizations must reach to their optimal performance. Therefore, one of the major objectives in today’s world of business is to improve the performance. The objective of this study is to analyses the performance of manufacturing companies using CVP analysis. This study has focused on textile industries. The textile industry is primarily concerned with the production of yarn, and cloth and the subsequent design or manufacture of clothing and their distribution. The textile industry is regarded as one of the most important and promising industry in manufacturing sector. The textile industry has played an important role in Bangladesh’s economy for a long time. The textile industry in Bangladesh is one of the most important sectors. It is the largest employer in the country. The export earnings from readymade garments (RMG), knit products and other textile items constitutes about 80% of the total export products of the country. About 90% of the domestic requirements of cloth are met by local production.
Currently, the textile industry in Bangladesh accounts for 45 percent of all industrial employment and contributes 5 percent to the total national income. The industry employs nearly 4 million people, mostly women.
Recently 78 percent of the country’s export earnings come from textiles and apparel, according to the latest figures available (Textile World Asia, 2006). The textile industry provides the single source of economic growth in Bangladesh’s rapidly developing economy. Exports of textiles and garments are the principal source of foreign earnings. The tremendous success of readymade garment exports from Bangladesh over the last two decades has surpassed the most optimistic expectations. So it is very necessary to evaluate the performance of textile industry. CVP approach is applied in textile sector for measuring the current situation of this industry. Background of Textile Industry
Textiles the history of power driven modern textiles in Bengal dates back to the beginning of the twentieth century. Before 1947, modern textiles were only the composite textile mills having spinning and weaving facilities. Added later were activities like specialized textile weaving, knitting and hosiery, and dyeing-printing-finishing. At Partition of 1947, there were about 11 composite textile mills in East Pakistan with 1.1million spindles and 2.7 thousand looms. Spindles grew to 3.2 million in 1956 but declined to 0.8 million in 1972 as worn-out obsolete spindles went out of operation. In 1972 large-scale manufacturing units including textile mills were nationalized. After 1982, state owned spinning mills were gradually denationalized. By 1999, spindles installed were 2.4 million in the private sector as compared to 0.4 million in the public sector. The total demand-supply gaps of fabric and yarn for 1996-97 were 2,433 million meters and 429 million kg respectively. These gaps would increase to 3,717 million meters and 639 million kg respectively by 2002. Bangladeshis a member of the World Trade Organization and its exports of RMG products are benefiting from the most Favored Nation status including the Post-Uruguay Round tariff rates and reductions in them made by all major developed nations. Bangladesh is favored partner in the Generalized System of Preferences of the EU. Current Scenario of Textile Industry
Bangladesh is the second largest exporter of readymade garment products trailing China

Manag. Stud. Econ. Syst., 2 (4), 287-298, Spring 2016
289
Manyika, James et al. (2011). Bangladesh’s garment exports during July-June 2012-13 period climbed by about 12.7 percent to US $21.515 billion over exports of US $19.089 billion made during the corresponding period of 2011-12. In 2012-13, the top three export destinations for Bangladesh garments were Europe, which accounted for US$ 12.56 billion, followed by the US and Canada, which accounted for US $4.99 billion and US $980 million, respectively. But now it has received bad news. Recent incidents like fire in the Tazreen Fashions factory in November last year that killed more than 110 and the collapse of the Rana Plaza garment factory building in April that killed over 1,100 people and more than 2,500 were injured in the disaster. It may be the second biggest industrial accident in recent history. As a result, The President Barack Obama-led US government in June suspended Bangladesh from the Generalized System of Preferences (GSP), which allows duty-free entry of over 5000 goods to the US market from least developed countries. Now, RMG products (which make up most of the US import from Bangladesh) are not included in the list of duty-free products in GSP, there will an export fall of about $40 million .At present, Bangladesh exports about $5 billion worth of goods (mostly RMG products) to the USA every year and hence, the suspension from US GSP will account for a fall in export of about 0.8 %.Losing the GSP facility will cost Bangladesh millions of dollars in taxes. It is also influence the European Union to take similar action, which would have a much bigger impact on Bangladesh and its garment sector.
Literature Review
Manufacturing performance is critical to the success of many firms. Superior performance leads to the competitiveness. In order to stay competitive, manufacturing companies must regularly evaluate their performance. Thus, it is vital for manufacturing companies to identify and ensure good performance in the global competition. Performance appraisal represents a central function of human resource management and has remained an important topic of investigation among organizational researchers (Dulebohn and Ferris, 1999). Because the usefulness of performance appraisal as a
managerial decision tool depends partly on whether or not the performance appraisal system is able to provide accurate data on employee performance, rating accuracy is a critical aspect of the appraisal process. In addition to allocating rewards, organizations use appraisals to provide (Kundu and Arora, 2012) developmental advice to employees, as well as obtain their perspectives and justice perceptions about their jobs, departments, managers and organizations. Performance appraisal is viewed as part of a much broader picture and it is argued that it has its origins in management by objectives. It constitutes a continual cyclical process of determining performance expectations, supporting performance, reviewing and appraising performance and, finally, managing performance standards. Success is determined by a display of commitment to performance improvement based on the benefits derived from the developmental outcomes of which they are a part of determining.
Lebas (1995), performance management is an organizational philosophy, supported by performance measurement. There is an interactive process between the two issues. The approaches are different, however, performance management is concerned with issues such as training, incentives, communication, as performance measurement, assesses the potential, entries, results and variances. Where, Dennis and Joseph (1984) defined performance appraisal is a systematic, periodic evaluation of the worth of an individual to an organization, usually made by a supervisor or someone in a position to observe his performance. It is involving of the establishment of standards of performance. Comparing the actual performance against the established standards of performance in order to determine any areas of appraiser’s weaknesses where it is the basis of developing or identifying programs to overcome those weaknesses.
Gopinathan Thachappilly (2009) uses the Financial Ratios for Performance evaluation. It analysis is typically done to make sense of the massive amount of numbers presented in company financial statements. It helps evaluate the performance of a company, so that investors can decide whether to invest in that company.
Martin (1998), the process of performance management is a means used for the organization

Md. Rostam Ali; Syed Moudud-Ul-Huq
290
to manage its performance, along with corporate and functional strategies and objectives.
Mehran and Mohd Tahir (2012) conclude that higher expenses incurred in highlighted companies are as a result of Expense Preference Behavior Theory and low productivity growth.
Kundu and Arora (2012), tested performance appraisal system and designing of PA systems and are not found significant predictors for differentiating between manufacturing companies and service companies.
Andy Neely, Mike Gregory and Ken Platts (1995) reviewed Performance measurement is the process of quantifying action, where measurement is the process of quantification and action leads to performance.
Mehran and Mohd Tahir (2012) showed, Performance is a quality of any company or firm which can be achieved by valuable results. For example, a firm having high return on assets (ROA) is said to be performing well. But having high ROA is not a sign of good performance: there are some other variables to be considered such as sales, profit and expenses which we will highlight in this paper.
Denizli in Turkey, 30 companies out of 86 (35 percent) use process costing, 23 companies (27 percent) use job costing, and 17 companies (20 percent) use both methods (Uyar, 2008). The same study showed that most widely used overhead allocation base is units produced (45 companies out of 86), followed by direct material costs (14 companies out of 86), direct machine hours (7 companies out of 86), and direct labor costs (7 companies out of 86). Another important finding of this study is that the largest share in manufacturing costs belongs to direct materials costs.
Performance appraisal may be defined as an organized formal interaction between a subordinate and supervisor that usually takes the form of a periodic interview, in which the work performance of the subordinate is examined and discussed, for identifying weaknesses and strengths as well as opportunities for improvement and skills development (Archer, 2002). In other words, Performance appraisal is a formal system of measuring, evaluating, and influencing an employee’s job-related attributes, behaviors and outcomes to determine how productive an employee is, and to determine if an employee’s
productivity can be improved (Kanobear, 2002). Appraisal results are used in many
organizations, either directly or indirectly, to help identifying the better performing employees who should get the majority of available merit pay increases, bonuses, and promotions. There are rapid appraisal methods for quick, low cost ways to gather data for manager’s information. This paper is to review common performance appraisal methods and identify the best approach for manufacturing industries (Mahesh and Lee, 2003).
The research a group of Greek scientists (Cohen, et.al, 2008) concludes that companies, which ROA and ROE have increased during 3 years, have invested more in innovations, modern technologies, cooperation of companies and information exchange in comparison with the companies, which ROA and ROE have decreased. It can be concluded that the non-financial performance indicators positively influence financial performance indicators.
Objective of the Study
The objective of this study is to explore CVP practices utilized by manufacturing companies operating in Bangladesh. The paper’s aim is to ensure appropriate measurement for the company in the area of costs, output and margin. So, the study has a general objective to make familiarize CVP (cost-volume-profit) analysis technique for their extensive use by the managers in manufacturing industries of Bangladesh along with the following specific objectives: � to evaluate performance of industry using
the key indicators of CVP technique; � to identify the problems those are arisen in
applying CVP analysis technique in selected company;
� to make policy recommendations on how to improve the practices of CVP analysis in manufacturing industry.
RESEARCH METHOD Sample Size
In this paper, 14 manufacturing companies are selected based on the availability of their financial variables and consider two consecutive years 2012 and 2013 for comparative analysis. The list of randomly selected companies is shown in table 1.
Manag. Stud. Econ. Syst., 2 (4), 287-298, Spring 2016
291
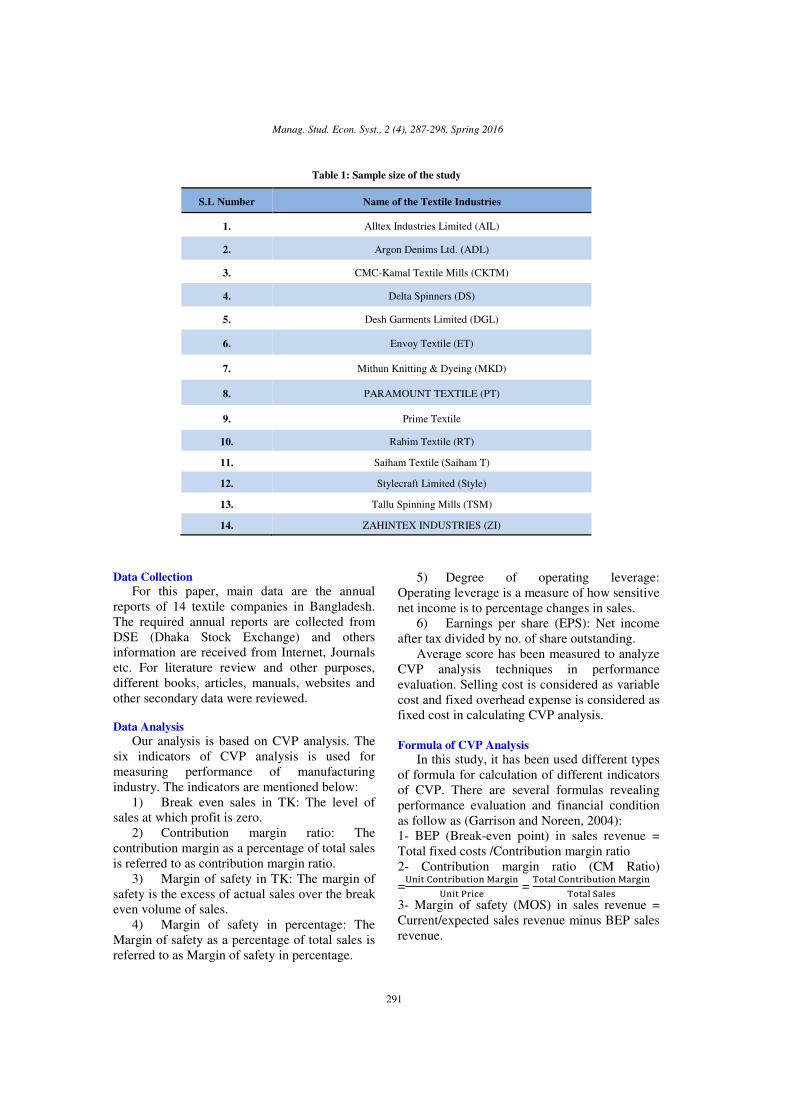
Table 1: Sample size of the study
Data Collection
For this paper, main data are the annual reports of 14 textile companies in Bangladesh. The required annual reports are collected from DSE (Dhaka Stock Exchange) and others information are received from Internet, Journals etc. For literature review and other purposes, different books, articles, manuals, websites and other secondary data were reviewed.
Data Analysis
Our analysis is based on CVP analysis. The six indicators of CVP analysis is used for measuring performance of manufacturing industry. The indicators are mentioned below:
1) Break even sales in TK: The level of sales at which profit is zero.
2) Contribution margin ratio: The contribution margin as a percentage of total sales is referred to as contribution margin ratio.
3) Margin of safety in TK: The margin of safety is the excess of actual sales over the break even volume of sales.
4) Margin of safety in percentage: The Margin of safety as a percentage of total sales is referred to as Margin of safety in percentage.
5) Degree of operating leverage: Operating leverage is a measure of how sensitive net income is to percentage changes in sales.
6) Earnings per share (EPS): Net income after tax divided by no. of share outstanding.
Average score has been measured to analyze CVP analysis techniques in performance evaluation. Selling cost is considered as variable cost and fixed overhead expense is considered as fixed cost in calculating CVP analysis. Formula of CVP Analysis
In this study, it has been used different types of formula for calculation of different indicators of CVP. There are several formulas revealing performance evaluation and financial condition as follow as (Garrison and Noreen, 2004): 1- BEP (Break-even point) in sales revenue = Total fixed costs /Contribution margin ratio 2- Contribution margin ratio (CM Ratio)
=���� ���������� ��� ��
���� ����� =
����� ���������� ��� ��
����� �����
3- Margin of safety (MOS) in sales revenue = Current/expected sales revenue minus BEP sales revenue.
S.L Number Name of the Textile Industries
1. Alltex Industries Limited (AIL)
2. Argon Denims Ltd. (ADL)
3. CMC-Kamal Textile Mills (CKTM)
4. Delta Spinners (DS)
5. Desh Garments Limited (DGL)
6. Envoy Textile (ET)
7. Mithun Knitting & Dyeing (MKD)
8. PARAMOUNT TEXTILE (PT)
9. Prime Textile
10. Rahim Textile (RT)
11. Saiham Textile (Saiham T)
12. Stylecraft Limited (Style)
13. Tallu Spinning Mills (TSM)
14. ZAHINTEX INDUSTRIES (ZI)

Md. Rostam Ali; Syed Moudud-Ul-Huq
292
4- Margin of safety in percentage = Margin of safety in sales revenue/Total sales revenue 5- Degree of operating leverage=contribution margin/operating income 6- EPS (Earnings Per Share)=Net income after tax/No. of share outstanding Analysis and Finding
This study has exposed the influence of 6 CVP techniques in measuring performance in manufacturing organizations. At first mean score has been measured to analyze the relative significant of CVP analysis technique in evaluating performance and decision making (Appendix-table 2).
Among the average score of 6 quantitative indicators of CVP analysis such as break even sales, contribution margin ratio, margin of safety, margin of safety in percentage, degree of operating leverage and earnings per share are shown in this report (Appendix-table 2). After calculating break even sale it is known that every company’s net sales in is greater than break sale. If the actual sale is greater than break-even sale, then the larger part operates profit. This means company generates profit.
It is found that the each company has positive of CM ratio in the both years and industry average CM ratio changes positively in the year 2013 from the year 2012. Margin of safety and Margin of safety Percentage are positive in every company of this textile industry in the both years and industry average of Margin of safety and Margin of safety Percentage change positively in the year 2013 from the year 2012.The earnings per share is also indicator of successful performance evaluation. The EPS varies from company to company. But the industry average EPS is 3.37 and 4.36 in the years 1013 and 2012 respectively and industry average EPS changes negatively in the year 2013 from the year 2012 (Appendix-table 2). After examining CVP analysis, Overall performance of textile industry is satisfactory although the performance could have been higher had the various adverse business conditions not occurred such as high inflation rate, scarcity of power, fluctuations in the raw material price, high utility costs and political unrest.
Comparative Analysis of the Performance between
the Years of 2013 and 2012
Contribution margin (CM) is the amount by which sales revenue exceeds variable costs. It can be calculated as contribution margin per unit as well as total contribution margin, using the following formulas:
Unit CM = Unit Price − Variable Cost per Unit and Total CM = Total Sales − Total Variable Costs.
Contribution margin ratio is contribution margin as percentage of sales. Contribution margin and contribution margin ratio are used in the breakeven analysis. CM goes to cover fixed costs after covering fixed costs any remaining CM contributes to income.
The higher contribution margin ratio indicates the higher performance that means the cost of goods sold is relatively lower than the other companies in the industry. Here, the average CM ratio of the textile industry is 16.13% in the year 2013 and 15.57% in the year 2012 and the change in the year 2013 is .56% from the year 2012 (figure 1). So, it can see that after break even sale if the sale volume increases by Tk. 100 then operating income will increase by Tk. 16.13 and Tk. 15.57 in case of the year 2013 and 2012 respectively. It is shown that the 7 companies have the higher CM ratio than the industry average CM ratio where Tallu Spinning Mills (TSM) has the highest and Stylecraft Limited (Style) has the lowest CM ratio in the year 2013. 10 companies’ CM ratio change positively and 4 companies’ CM ratio change negatively (figure 1).
Sales with no profit or loss, is called breakeven point. It is the sales volume where total sales revenue equals total costs. Thus, profit is zero. The revenue from sales is necessary to cover costs and prevent a firm from operating at a loss (Garrison and Noreen, 2004). The breakeven sales may be relatively stable or may fluctuate, depending on the company or industry. Companies with high breakeven sales points tend to have large fluctuations in earnings from year to year. Calculation of break-even point is important for every business because it tells business owners and managers how much sales are needed to cover all fixed as well as variable expenses of the business or the sales volume after which the business will start generating profit.

Manag. Stud. Econ. Syst., 2 (
Figure1
If CM ratio is same for all companies then the higher amount of Break-even Sale of any company indicates that the company has the higher amount of fixed cost. On the other hand if fixed cost is same for all companies then the higher amount of Break-even Sacompany indicates that the company’s cost of goods sold is higher and CM ratio is lower than the other companies. It can be said that the 6 companies have the higher Breakthe industry average Break-even Sale where Stylecraft Limited (Style) has the highest Breakeven Sale as its CM ratio is lowest in the both years. 10 companies’ CM ratio change positively and 4 companies’ CM ratio change negatively (figure 2). Again, Rahim Textile (RT)lowest Break-even Sale in the year 2013. The industry average Break-even Sale increases in the year 2013 from the year 2012. Break
-5.00%
0.00%
5.00%
10.00%
15.00%
20.00%
25.00%
-500,000,000
0
500,000,000
1,000,000,000
1,500,000,000
2,000,000,000
2,500,000,000
Manag. Stud. Econ. Syst., 2 (4), 287-298, Spring 2016
293
Figure1: Contribution margin ratio (CM Ratio)
Figure 2: Break-even Sales in Tk.
If CM ratio is same for all companies then even Sale of any
company indicates that the company has the higher amount of fixed cost. On the other hand if fixed cost is same for all companies then the
even Sale of any company indicates that the company’s cost of goods sold is higher and CM ratio is lower than the other companies. It can be said that the 6 companies have the higher Break-even Sale than
even Sale where ed (Style) has the highest Break-
even Sale as its CM ratio is lowest in the both years. 10 companies’ CM ratio change positively and 4 companies’ CM ratio change negatively
Again, Rahim Textile (RT) has the even Sale in the year 2013. The
even Sale increases in the year 2013 from the year 2012. Break-even
analysis is a supply-side analysis; that is, it only analyzes the costs of the sales. It does not analyze how demand may be afdifferent price levels.
Margin of safety is the excess of budgeted (or actual) sales over the break-sales. The margin of safety concept is especially useful when a significant proportion of sales are at risk of decline or elimination, as may be the case when a sales contract is coming to an end. By knowing the amount of the margin of safety, management can gain a better understanding of the risk of loss to which a business is subjected by changes in sales. A minimal margin of safetmight trigger action to reduce expenses. The opposite situation may also arise, where the margin of safety is so large that a business is well-protected from sales variations.
CM Ratio 2013
CM Ratio 2012
CM Ratio Change
side analysis; that is, it only analyzes the costs of the sales. It does not analyze how demand may be affected at
Margin of safety is the excess of budgeted -even volume of
sales. The margin of safety concept is especially when a significant proportion of sales are
ion, as may be the case when a sales contract is coming to an end. By knowing the amount of the margin of safety, management can gain a better understanding of the risk of loss to which a business is subjected by changes in sales. A minimal margin of safety might trigger action to reduce expenses. The opposite situation may also arise, where the margin of safety is so large that a business is
protected from sales variations.
CM Ratio 2013
CM Ratio 2012
CM Ratio Change
B/E 2,013
B/E 2,012
B/E Change
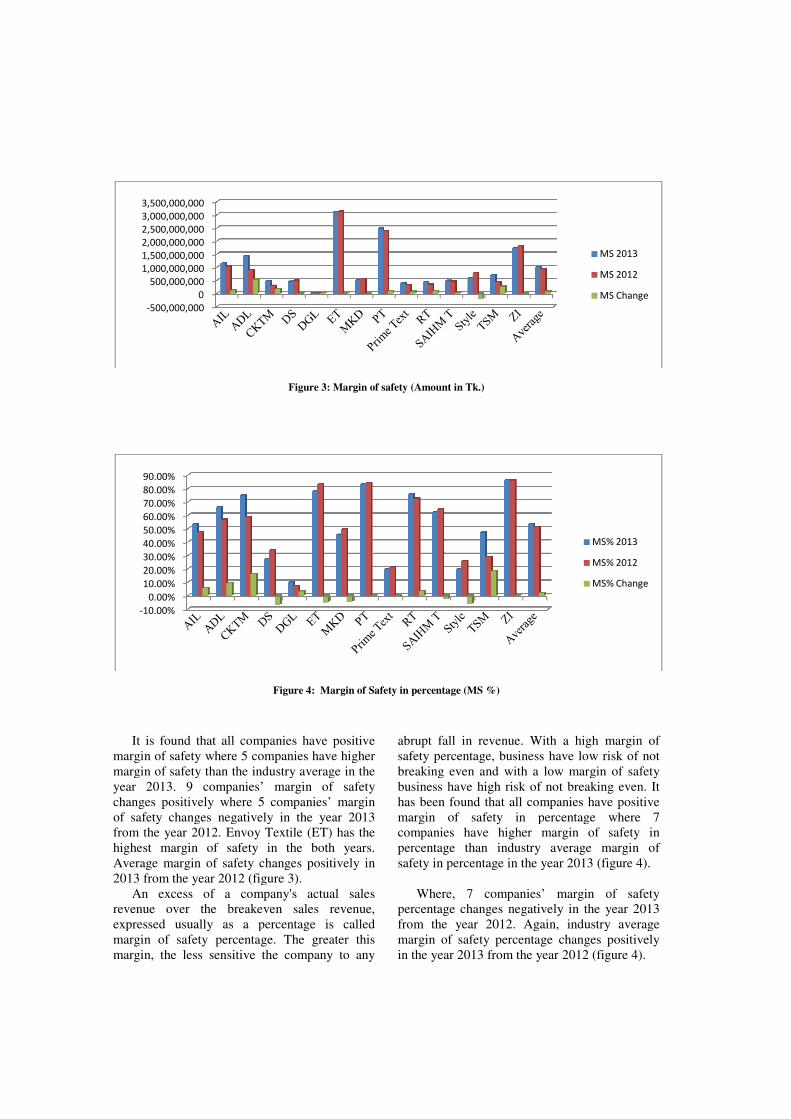
Figure 4
It is found that all companies have positive margin of safety where 5 companies have higher margin of safety than the industry average in the year 2013. 9 companies’ margin ofchanges positively where 5 companies’ margin of safety changes negatively in the year 2013 from the year 2012. Envoy Textile (ET) has the highest margin of safety in the both years. Average margin of safety changes positively in 2013 from the year 2012 (figure 3).
An excess of a company'srevenue over the breakeven expressed usually as a percentage is called margin of safety percentage. The greater this margin, the less sensitive the company to any
-500,000,000
0
500,000,000
1,000,000,000
1,500,000,000
2,000,000,000
2,500,000,000
3,000,000,000
3,500,000,000
-10.00%
0.00%
10.00%
20.00%
30.00%
40.00%
50.00%
60.00%
70.00%
80.00%
90.00%
Md. Rostam Ali; Syed Moudud-Ul-Huq
294
Figure 3: Margin of safety (Amount in Tk.)
Figure 4: Margin of Safety in percentage (MS %)
It is found that all companies have positive margin of safety where 5 companies have higher margin of safety than the industry average in the year 2013. 9 companies’ margin of safety changes positively where 5 companies’ margin of safety changes negatively in the year 2013 from the year 2012. Envoy Textile (ET) has the
f safety in the both years. Average margin of safety changes positively in
2012 (figure 3). company's actual sales
sales revenue, expressed usually as a percentage is called
in of safety percentage. The greater this , the less sensitive the company to any
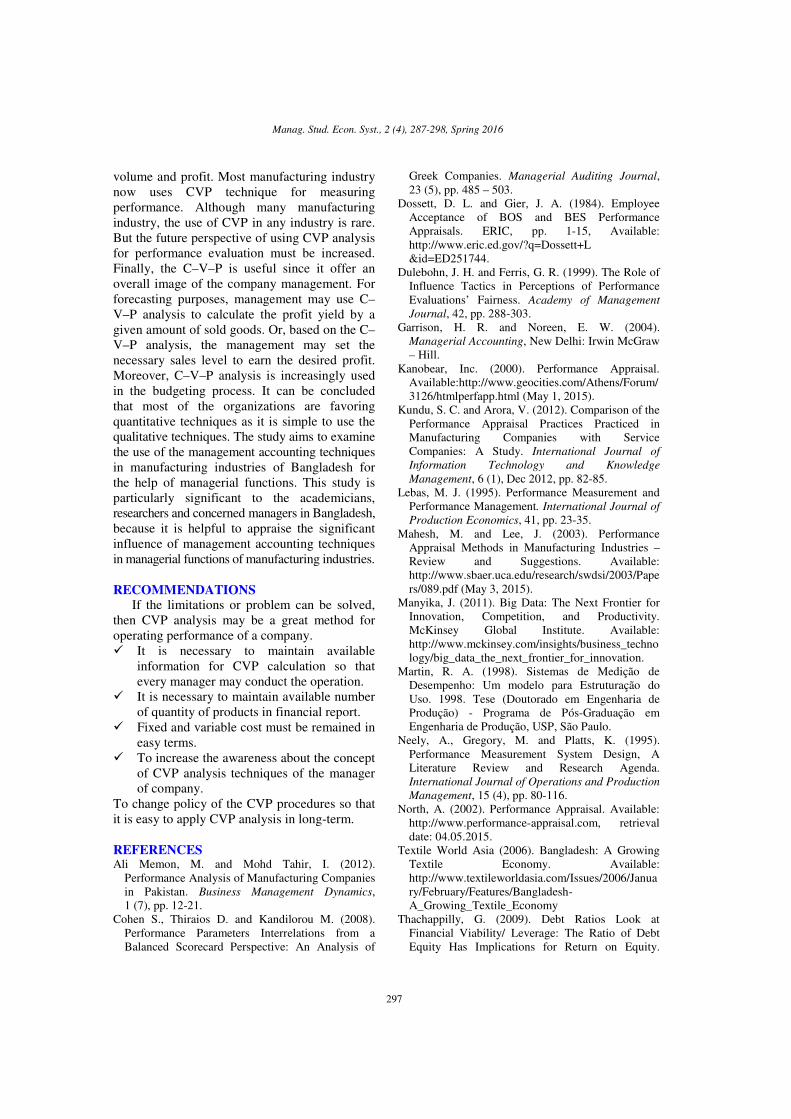
abrupt fall in revenue. With a high margin of safety percentage, business have low risk of not breaking even and with a low margin of safety business have high risk of not breaking even. It has been found that all companies have positive margin of safety in percentage where 7companies have higher margin of safety in percentage than industry average msafety in percentage in the year 2013 (figure 4).
Where, 7 companies’ margin of safety percentage changes negatively in the year 2013 from the year 2012. Again, industry average margin of safety percentage changes positively in the year 2013 from the year 2012 (figure 4).
abrupt fall in revenue. With a high margin of safety percentage, business have low risk of not
eaking even and with a low margin of safety business have high risk of not breaking even. It has been found that all companies have positive margin of safety in percentage where 7 companies have higher margin of safety in percentage than industry average margin of safety in percentage in the year 2013 (figure 4).
Where, 7 companies’ margin of safety percentage changes negatively in the year 2013 from the year 2012. Again, industry average margin of safety percentage changes positively
the year 2012 (figure 4).
MS 2013
MS 2012
MS Change
MS% 2013
MS% 2012
MS% Change

Manag. Stud. Econ. Syst., 2 (
Leverage results from the use of fixedassets or funds to magnify returns to the firm’s owners. Generally, increases in leverage result in increased return and risk, whereas decreases in leverage result in decreased return aOperating leverage is concerned with the relationship between the firm’s sales revenue and its operating profits. Operating leverage works in both directions. When a firm has fixed operating costs, operating leverage is present. An increase in sales results in a moreproportional increase in operating profitsdecrease in sales results in a moreproportional decrease in operating profitsHowever, the relative size of the Degree of Operating Leverage is affected by how close the firm is to their break-even point. The closer the higher is the DOL. It is shown that industry average DOL is 2.79 times and 3.09 times in the year 2013 and 1012 respectively
Again, 4 companies (Style, Prime Text, DGL, DS) have higher DOL than the industry average DOL in the year 2013 that means these
Figure 5
-6.00
-4.00
-2.00
0.00
2.00
4.00
6.00
8.00
10.00
12.00
14.00
16.00
Manag. Stud. Econ. Syst., 2 (4), 287-298, Spring 2016
295
results from the use of fixed-cost assets or funds to magnify returns to the firm’s owners. Generally, increases in leverage result in increased return and risk, whereas decreases in leverage result in decreased return and risk.
is concerned with the relationship between the firm’s sales revenue
perating leverage When a firm has fixed
operating costs, operating leverage is present. An increase in sales results in a more-than-
operating profits; a decrease in sales results in a more-than-
operating profits. e relative size of the Degree of
Operating Leverage is affected by how close the even point. The closer the
higher is the DOL. It is shown that industry average DOL is 2.79 times and 3.09 times in the
(figure 5). Again, 4 companies (Style, Prime Text,
DGL, DS) have higher DOL than the industry average DOL in the year 2013 that means these
companies’ operating income is more sensitive to sale than the other companies. Industry average DOL decreases in the year 2013 as fixed cost increases (figure 5).
Earnings per share (EPS) ratiomany dollars of net income have been earned by each share of common stock. It is computed by dividing net income less preferred dividend by the number of shares of common stock outstanding during the period. measure of overall profitability of the company. The higher the EPS figure, the better it is, as EPS is the sign of higher earnings. From figure 6 it has been found that the industry average EPis 3.37 and 4.36 in the year 2013 and 2012 respectively. But industry average EPS changes negatively by 0.99 in the year 2013 from the year 2012.
All but two companies (Style and RT) have lower EPS in the year 2013. Though the StylecraftLimited (Style) has the highest EPS in the both years but EPS changes negatively by 14.2 in the year 2013 from the year 2012 (figure 6).
Figure 5: Degree of Operating Leverage (DOL)
companies’ operating income is more sensitive to sale than the other companies. Industry
the year 2013 as fixed
Earnings per share (EPS) ratio measures how many dollars of net income have been earned by each share of common stock. It is computed by dividing net income less preferred dividend by
f common stock It is a popular
measure of overall profitability of the company. The higher the EPS figure, the better it is, as EPS is the sign of higher earnings. From figure 6 it has been found that the industry average EPS is 3.37 and 4.36 in the year 2013 and 2012 respectively. But industry average EPS changes negatively by 0.99 in the year 2013 from the
All but two companies (Style and RT) have lower EPS in the year 2013. Though the Stylecraft
has the highest EPS in the both years but EPS changes negatively by 14.2 in the year 2013 from the year 2012 (figure 6).
DOL 2013
DOL 2012
DOL Change

Limitations of the Study
There is some limitation of our report. When we used the main methods of CVP analysis for performance evaluation of Textile Company, we can face different kinds of problem. CVP is a short run, marginal analysis. So it is difficult to measure the performance of textile industry in the long run.CVP analysis is a simple and useful managerial tool which has certain limitations because several assumptions are made in CVP analysis. Such limitations include the following: � All cost should be accurately classified
either fixed cost or variable cost but it is very difficult to identify actual variable and fixed cost.
� Per unit Selling prices and variable costs should be constant (But due to the change of sales volume per unit Selling prices and variable costs might change due to the economy of scale).
� Total fixed costs should be constant (But fixed cost changes over a period of time).
� Sales volume approximates production volume and there are no significant inventory balance fluctuations (which sometimes is not the case).
� For CVP analysis a company should produce either a single product or a constant product mix (while in real life companies can react to market conditions and change their product mix often).
-15
-10
-5
0
5
10
15
20
25
30
35
Md. Rostam Ali; Syed Moudud-Ul-Huq
296
Figure 6: Earnings per Share (EPS)
There is some limitation of our report. When we used the main methods of CVP analysis for performance evaluation of Textile Company, we can face different kinds of problem. CVP is a short run, marginal analysis. So it is difficult to
e of textile industry in the long run.CVP analysis is a simple and useful managerial tool which has certain limitations because several assumptions are made in CVP analysis. Such limitations include the following:
All cost should be accurately classified either fixed cost or variable cost but it is very difficult to identify actual variable and
Per unit Selling prices and variable costs should be constant (But due to the change of sales volume per unit Selling prices and
ange due to the
Total fixed costs should be constant (But fixed cost changes over a period of time). Sales volume approximates production volume and there are no significant inventory balance fluctuations (which
For CVP analysis a company should produce either a single product or a constant product mix (while in real life companies can react to market conditions and change
� Productivity is constant (while in fact it might change due to the economy of scale or changes in technology).
� It is also complicated to find out quantity of the product.
� Difference company show the cost terms in difference forms. For this, it may complex and time consuming to practice CVP ingredients into the company
� Lack of awareness about the concept and usability of CVP techniques of the concerned personnel of manufacturing organization.
� In our analysis the companies’ performance is evaluated on the basis of industry average where only 14 companies have been considered randomly from the textile industry to calculate the industry average.
CONCLUSION
The aim of this study is to examine the performance of textile industry using cvp analysis. Cost-volume-profit (CVP) analysis expands the use of information provided breakeven analysis. At this breakeven point (BEP), a company will experience no income or loss. CVP analysis can be an extremely useful tool for determining potential success of a business venture. This paper selects 10listed companies, and uses their financial data in 2013, empirically studies the relationship among cost,
Productivity is constant (while in fact it the economy of scale
It is also complicated to find out quantity of
Difference company show the cost terms in difference forms. For this, it may complex and time consuming to practice CVP ingredients into the company. Lack of awareness about the concept and usability of CVP techniques of the concerned personnel of manufacturing
In our analysis the companies’ performance is evaluated on the basis of industry average where only 14 companies have been
idered randomly from the textile industry to calculate the industry average.
The aim of this study is to examine the performance of textile industry using cvp
profit (CVP) analysis expands the use of information provided by breakeven analysis. At this breakeven point (BEP), a company will experience no income or loss. CVP analysis can be an extremely useful tool for determining potential success of a business venture. This paper selects 10listed
inancial data in 2013, empirically studies the relationship among cost,
EPS 2013
EPS 2012
EPS Change
Manag. Stud. Econ. Syst., 2 (4), 287-298, Spring 2016
297
volume and profit. Most manufacturing industry now uses CVP technique for measuring performance. Although many manufacturing industry, the use of CVP in any industry is rare. But the future perspective of using CVP analysis for performance evaluation must be increased. Finally, the C–V–P is useful since it offer an overall image of the company management. For forecasting purposes, management may use C–V–P analysis to calculate the profit yield by a given amount of sold goods. Or, based on the C–V–P analysis, the management may set the necessary sales level to earn the desired profit. Moreover, C–V–P analysis is increasingly used in the budgeting process. It can be concluded that most of the organizations are favoring quantitative techniques as it is simple to use the qualitative techniques. The study aims to examine the use of the management accounting techniques in manufacturing industries of Bangladesh for the help of managerial functions. This study is particularly significant to the academicians, researchers and concerned managers in Bangladesh, because it is helpful to appraise the significant influence of management accounting techniques in managerial functions of manufacturing industries.
RECOMMENDATIONS
If the limitations or problem can be solved, then CVP analysis may be a great method for operating performance of a company. � It is necessary to maintain available
information for CVP calculation so that every manager may conduct the operation.
� It is necessary to maintain available number of quantity of products in financial report.
� Fixed and variable cost must be remained in easy terms.
� To increase the awareness about the concept of CVP analysis techniques of the manager of company.
To change policy of the CVP procedures so that it is easy to apply CVP analysis in long-term.
REFERENCES Ali Memon, M. and Mohd Tahir, I. (2012).
Performance Analysis of Manufacturing Companies in Pakistan. Business Management Dynamics, 1 (7), pp. 12-21.
Cohen S., Thiraios D. and Kandilorou M. (2008). Performance Parameters Interrelations from a Balanced Scorecard Perspective: An Analysis of
Greek Companies. Managerial Auditing Journal, 23 (5), pp. 485 – 503.
Dossett, D. L. and Gier, J. A. (1984). Employee Acceptance of BOS and BES Performance Appraisals. ERIC, pp. 1-15, Available: http://www.eric.ed.gov/?q=Dossett+L &id=ED251744.
Dulebohn, J. H. and Ferris, G. R. (1999). The Role of Influence Tactics in Perceptions of Performance Evaluations’ Fairness. Academy of Management
Journal, 42, pp. 288-303. Garrison, H. R. and Noreen, E. W. (2004).
Managerial Accounting, New Delhi: Irwin McGraw – Hill.
Kanobear, Inc. (2000). Performance Appraisal. Available:http://www.geocities.com/Athens/Forum/3126/htmlperfapp.html (May 1, 2015).
Kundu, S. C. and Arora, V. (2012). Comparison of the Performance Appraisal Practices Practiced in Manufacturing Companies with Service Companies: A Study. International Journal of
Information Technology and Knowledge
Management, 6 (1), Dec 2012, pp. 82-85. Lebas, M. J. (1995). Performance Measurement and
Performance Management. International Journal of
Production Economics, 41, pp. 23-35. Mahesh, M. and Lee, J. (2003). Performance
Appraisal Methods in Manufacturing Industries –Review and Suggestions. Available: http://www.sbaer.uca.edu/research/swdsi/2003/Papers/089.pdf (May 3, 2015).
Manyika, J. (2011). Big Data: The Next Frontier for Innovation, Competition, and Productivity. McKinsey Global Institute. Available: http://www.mckinsey.com/insights/business_technology/big_data_the_next_frontier_for_innovation.
Martin, R. A. (1998). Sistemas de Medição de Desempenho: Um modelo para Estruturação do Uso. 1998. Tese (Doutorado em Engenharia de Produção) - Programa de Pós-Graduação em Engenharia de Produção, USP, São Paulo.
Neely, A., Gregory, M. and Platts, K. (1995). Performance Measurement System Design, A Literature Review and Research Agenda. International Journal of Operations and Production
Management, 15 (4), pp. 80-116. North, A. (2002). Performance Appraisal. Available:
http://www.performance-appraisal.com, retrieval date: 04.05.2015.
Textile World Asia (2006). Bangladesh: A Growing Textile Economy. Available: http://www.textileworldasia.com/Issues/2006/January/February/Features/Bangladesh-A_Growing_Textile_Economy
Thachappilly, G. (2009). Debt Ratios Look at Financial Viability/ Leverage: The Ratio of Debt Equity Has Implications for Return on Equity.

Md. Rostam Ali; Syed Moudud-Ul-Huq
298
Journal of Debt Ratio Analysis. Thachappilly, G. (2009). Liquidity Ratios Help Good
Financial Management: Liquidity Analysis reveals likely Short-Term Financial Problems. Journal of
Liquidity Ratio Analysis.
Uyar,S.(2008).Denizli’DefaaliyetgösterenüretimişletmElerindemaliyetmuhasebesi Uygulamaları. Muhasebeve Finansman, 38, pp. 132-146.
Appendix
Table 2: Performance evaluation table by using CVP key indicators of textile industry
Table 3: Working Sheet