textile-based electrochemical sensors and …
TRANSCRIPT

TEXTILE-BASED ELECTROCHEMICAL SENSORS AND BATTERIES
FOR WEARABLE BIOSENSING
By
Xiyuan Liu
A DISSERTATION
Submitted to
Michigan State University
in partial fulfillment of the requirements
for the degree of
Mechanical Engineering – Doctor of Philosophy
2017

ABSTRACT
TEXTILE-BASED ELECTROCHEMICAL SENSORS AND BATTERIES FOR WEARABLE
BIOSENSING
By
Xiyuan Liu
Wearable biosensors have gained tremendous attention in the past decade due to their
capacity for ex vivo physical and biochemical measurements of important physiological
parameters including heart rate, oxygenation of the blood, respiration rate, skin temperature,
bodily motion, brain activity, blood pressure, and sweat composition. This has been achieved, in
part, through recent developments in flexible sensors and miniature electronics, which can offer
high sensing performance on a compact, lightweight platform. While much progress has been
made in this field, existing wearable chemical sensors are prone to damage due to mechanical
deformation and/or require bulky, rigid electronic components. In this work, we explored the
development of robust, textile-based electrochemical sensors and batteries for wearable sensing
applications. In particular, a novel method for fabricating flexible electrochemical sensors was
introduced by utilizing embroidery. Using this technique, conductive thread-based electrodes
were fabricated onto various types of textile and fabrics, which could be made with customized
geometries and configurations to accommodate commercial or custom electrochemical
instrumentation. For proof-of-concept, embroidered biosensors were used for measurements of
glucose and lactate in buffer and whole blood samples, which offered excellent analytical
performance, good resiliency against mechanical stress and superior repeatability. We also
adapted this technology for generating embroidered sensors onto gauze for rapid measurements
of uric acid, a biomarker of wound healing. We demonstrated that this embroidered gauze sensor
maintained high accuracy up to 7 hours for continuous wound monitoring.

We also explored the development of liquid-activated textile batteries as a lightweight,
flexible power source for textile biosensors. Two generations of batteries, the first utilizing thin
film metal electrodes and the second utilizing screen-printed electrodes, were designed,
fabricated and tested. These batteries are designed to turn on upon exposure to small amounts of
liquid (~30 µL per cell) and turn off after being completely dried, thus facilitating autonomous
operation. Additionally, this battery can be reactivated simply by adding more liquid to the
cell(s). Through optimizing various battery parameters, a steady output voltage of 1.3 V was
achieved from a single cell, which exhibited discharging times of 100 min and 50 min for
loading currents of 1 µA and 50 µA, respectively. Batteries with higher voltages and currents
were obtained by connecting multiple cells in series or parallel.
Towards a fully integrated, wearable “smart diaper” sensing platform, we developed a
textile biosensing system consisting of a screen-printed, liquid-activated battery and
electrochemical sensor integrated with a miniature detection circuit. This device was used for
quantitative measurements of xanthine oxidase (XOx), a biomarker correlated with urinary tract
infections, in spiked buffer samples, which exhibited good linearity and accuracy. We also
analyzed urine samples from patients with positive urine cultures using this device, which could
detect XOx at concentrations between 0 U/L to 16,000 U/L, demonstrating the clinical
usefulness of this platform. In conclusion, the results and technological advancements presented
in this dissertation will provide researchers with new insights into the design and fabrication of
textile-based chemical sensors and batteries, as well as their integration with miniature
electronics, towards the realization of fully integrated, robust, wearable biosensing platforms.

iv
To my mother and father for their endless love and support;
To my husband, who is always there for me.

v
ACKNOWLEDGEMENTS
I have had the pleasure of associating with many wonderful people over the last few
years, and each of these people has played a significant role in shaping my life and my career.
First and foremost, I would like to thank my advisor, Prof. Peter B. Lillehoj for his
tremendous support and guidance throughout my graduate studies. I am impressed by him
pursuing perfections in all his work and his respect for others. He taught me a wide range of
things including scientific research, life altitude and career paths, which benefits and will benefit
me for my future life. I appreciated that he spent time mentoring me and always challenges me to
do beyond the best.
I am very thankful to my PhD committee members, Prof. Andrew J. Mason, Prof. Patrick
Kwon and Prof. Junghoon Yeom for their support, valuable time and providing valuable advices
and feedback on my research.
I additionally want to thank professors in College of Engineering and MSU who provided
me valuable advises as I have difficulties with my research and enabled me to accomplish all of
the research presented in this dissertation. A special thank you to Dr. Geoffrey Recktenwald,
thank you for giving me opportunities to teach dynamics class, help me all the way along as I
look for my career options.
I also want to thank all my lab mates in Integrated Microtechnologies Systems
Laboratory (IMS Lab), I feel so fortunate to have the opportunity to work with you in such a
stimulating intellectual work environment. First, I would like to thank Tung-Yi Lin, being as the
only two members in the lab in the first two years, thank you for all your help and support.
Special thanks go to Zoe Jiang, Dr. Gorachand Dutta, and Dr. Yongliang Yang for their help,

vi
insight and assistance through the years. An extra special thanks to the undergraduates who
helped me along the way: Michelle Lou and Olivia Weprich.
I would like to acknowledge my friends, Yaozhong Zhang, Xiaolu Huang, Wu Pan
Zagorski and Wu Zhou, I always look forward to our lunch tradition, thank you for those
wonderful lunch times, being there with me and giving me advices, comfort and support. I would
like to thank Sina Parsnejad for his help for my project. I would also like to acknowledge my
friends Tian Cai, Shupei Yuan who have supported in any way they can, especially those
workout days before my wedding shot. That brings me a lot of fun and good memories. Thank
you to my friends outside of MSU, Zhiping Zhang, Kunning Jiang, Fang Fang, Yan Li, Ying Li,
Zhi he, thank you for your friendship, and I am looking forward to meet you sometime back in
China.
Most importantly, I would like to thank my parents for their unconditional love and
support. Thank you to my amazing mother who has always been my inspiration in my entire life.
Thank you to my father who teaches me integrity, goodness, hardworking and the value of
education. Without you, I cannot achieve what I have got and become who I am today. Last but
certainly not the least, thank you Zhen, my dear husband, for your support and love as always. I
love you all.

vii
TABLE OF CONTENTS
LIST OF TABLES ......................................................................................................................... ix
LIST OF FIGURES ........................................................................................................................ x
1. INTRODUCTION ................................................................................................................... 1
1.1 Point-of-care Diagnostics ................................................................................................. 2
1.2 Electrochemical Detection ............................................................................................... 4
1.3 Wearable Biosensors ........................................................................................................ 7
1.3.1 Saliva-based sensors ................................................................................................. 8
1.3.2 Sweat-based sensors................................................................................................ 10
1.3.3 Wound fluid-based sensors ..................................................................................... 12
1.3.4 Challenges and perspectives ................................................................................... 13
1.4 Textile Batteries ............................................................................................................. 15
1.5 Objectives ....................................................................................................................... 18
2. EMBROIDERED ELECTROCHEMICAL SENSORS ON TEXTILE ................................ 20
2.1 Motivation ...................................................................................................................... 21
2.2 Experimental Design ...................................................................................................... 22
2.2.1 Biochemicals and reagents ...................................................................................... 22
2.2.2 Thread preparation .................................................................................................. 23
2.2.3 Thread characterization ........................................................................................... 23
2.2.4 Sensor design and fabrication ................................................................................. 24
2.2.5 Electrochemical measurements ............................................................................... 25
2.3 Results and Discussion ................................................................................................... 25
2.3.1 Characterization of ink-coated thread ..................................................................... 25
2.3.2 Thread embroidery characterization ....................................................................... 27
2.3.3 Single analyte detection .......................................................................................... 28
2.3.4 Multiplexed detection ............................................................................................. 29
2.3.5 Glucose detection in whole blood ........................................................................... 31
2.3.6 Sensor durability testing ......................................................................................... 32
2.4 Summary ........................................................................................................................ 34
3. EMBROIDERED ELECTROCHEMICAL SENSORS ON GAUZE................................... 35
3.1 Motivation ...................................................................................................................... 36
3.2 Experimental Design ...................................................................................................... 37
3.2.1 Wound-simulated biochemical and reagents .......................................................... 37
3.2.2 Thread preparation and characterization ................................................................. 37
3.2.3 Gauze sensor design and fabrication ....................................................................... 38
3.2.4 Wound monitoring measurements .......................................................................... 39
3.2.5 Statistical analysis ................................................................................................... 39
3.3 Results and Discussion ................................................................................................... 39
3.3.1 Fabrication of gauze-based biosensor ..................................................................... 39

viii
3.3.2 Analytical performance of embroidered gauze sensors .......................................... 42
3.3.3 Uric acid monitoring ............................................................................................... 43
3.3.4 Durability of gauze-based biosensor ....................................................................... 45
3.4 Summary ........................................................................................................................ 48
4. LIQUID-ACTIVATED TEXTILE–BASED BATTERIES .................................................. 49
4.1 Motivation ...................................................................................................................... 50
4.2 First Generation Liquid-Activated Ag – Al Battery....................................................... 51
4.2.1 Battery design and fabrication ................................................................................ 51
4.2.2 Battery characterization .......................................................................................... 54
4.2.3 Summary ................................................................................................................. 58
4.3 Second Generation Liquid-Activated Ag – Zn Battery .................................................. 59
4.3.1 Battery design and fabrication ................................................................................ 59
4.3.2 Battery characterization .......................................................................................... 63
4.3.3 Summary ................................................................................................................. 65
5. INTEGRATED, SELF-POWERED, TEXTILE WEARABLE BIOSENSOR SYSTEM .... 67
5.1 Experimental .................................................................................................................. 68
5.1.1 XOx sensor design and fabrication ......................................................................... 68
5.1.2 Development of aMEASURE2 ............................................................................... 72
5.1.3 Regulation circuit .................................................................................................... 73
5.2 Results and Discussion ................................................................................................... 74
5.2.1 XOx detection ......................................................................................................... 74
5.2.2 Integration of sensor and aMEASURE2 ................................................................. 75
5.2.3 Integration of the sensor, aMEASURE2 and the battery ........................................ 78
5.3 Summary ........................................................................................................................ 82
6. CONCLUSIONS ................................................................................................................... 83
6.1 Summary of Presented Work ......................................................................................... 84
6.2 Future Work ................................................................................................................... 86
BIBLIOGRAPHY ......................................................................................................................... 88

ix
LIST OF TABLES
Table 5-1: Comparison of results achieved from urine culture, our biosensing platform and urine
test strips. ...................................................................................................................................... 77

x
LIST OF FIGURES
Figure 1-1: An idealized point-of-care device consisting of sample processing, microfluidic chip,
receptors, signal transduction and electronics. Image obtained from [1]. ...................................... 2
Figure 1-2: General arrangement of electrochemical real-time detection systems. Image obtained
from [21]. ........................................................................................................................................ 5
Figure 1-3: Saliva-based electrochemical wearable sensors. (a) A mouthguard biosensor for
continuous monitoring of salivary lactate. Image obtained from [40]. (b) A graphene-based
dental tattoo for continuous wireless monitoring of bacteria. Image obtained from [41]. ............. 9
Figure 1-4: Sweat-based electrochemical wearable sensors. (a) A tattoo based biosensor for
continuous lactate sensing in human perspiration during exercise events. Image obtained from
[43]. (b) A fully integrated wearable sensor array for multiplexed in situ perspiration analysis.
Image obtained from [36]. (c) A woven-based electrochemical biosensor patch for non-invasive
detection of lactate. Image obtained from [47]. ............................................................................ 11
Figure 1-5: Wound-based electrochemical wearable sensors. (a) A bandage-based wearable
biosensor with potentiometric pH cell embedding for real-time monitoring of pH changes in a
wound. Image obtained from [48]. (b) A bandage-based electrochemical wearable sensors for
real-time monitoring of uric acid. Image obtained from [49]. ...................................................... 12
Figure 1-6: Textile-based batteries. (a) A PEDOT-based charge storage device was fabricated on
a textile substrate. Image obtained from [76]. (b) A solar rechargeable wearable battery was
demonstrated to light up LED bulbs. Image obtained from [57]. ................................................. 16
Figure 2-1: Photographs showing the flux application process (a) and thread resistance
measurements (b). ......................................................................................................................... 24
Figure 2-2: Optical images of uncoated thread (a) and Ag/AgCl-coated thread (b). Scale bar, 500
µm. SEM images of Ag/AgCl-coated thread showing its surface morphology (c) and cross-
section (d). Scale bar, 50 µm. ....................................................................................................... 25
Figure 2-3: EDS spectrum of Ag/AgCl-coated thread containing Ag, C, Cl and O. .................... 26
Figure 2-4: Embroidered electrochemical sensors fabricated on a textile “chip” (a), cotton gauze
(b) and cotton t-shirt (c). Zoomed-in image of the sensor array on the t-shirt (d). ....................... 27
Figure 2-5: (a) Close-up image of a single embroidered electrochemical sensor. The yellow
dashed circle represents the sensing area. Amperometric measurements of glucose (b) and lactate
(c) in buffer. Values are averaged over the final 10 sec of the detection signal. Each data point
represents the mean ± standard deviation (SD) of three separate measurements which were
obtained using new sensors. .......................................................................................................... 28

xi
Figure 2-6: (a) Close-up image of a dual electrochemical sensor for multiplexed analyte
detection. Specificity of the glucose assay (b) and lactate assay (c) using glucose (5 mM), lactate
(12.5 mM) and uric acid (40 mM) in PBS, and PBS (blank). Amperometric signals of a 40 nM
glucose sample (d), 50 mM lactate sample (e) and 40 mM glucose + 50 mM lactate sample (f)
using the dual electrochemical sensor. Each bar represents the mean ± SD of three separate
measurements which were obtained using new sensors. .............................................................. 30
Figure 2-7: (a) Embroidered sensor inside the electrochemical workstation during testing. (b)
Amperometric measurements of glucose in whole blood. Values are averaged over the final 10
sec of the detection signal. Each data point represents the mean ± SD of three separate
measurements which were obtained using new sensors. .............................................................. 32
Figure 2-8: (a) Mechanical bend testing of embroidered electrochemical sensors. (b)
Amperometric measurements of lactate (50 mM) in PBS following up to 100 cycles of folding.
Images of the sensor positioned flat (c) and bent at 90° (d) in the reader. (e) Comparative
measurements of lactate using flat or bent sensors. Each bar represents the mean ± SD of three
separate measurements.................................................................................................................. 33
Figure 3-1: (a) Embroidered electrochemical sensors on gauze and wound dressing. Inset shows
a close-up image of the sensor. The dashed circle represents the sensing region. (b) Customized
embroidered electrochemical sensors on textile. .......................................................................... 40
Figure 3-2: (a) Embroidered electrochemical sensor on gauze. SEM images of the WE (b) and
RE (c) at 30× magnification. Scale bar, 500 μm. Close-up SEM images of carbon-coated thread
(d) and Ag/AgCl-coated thread (e) at 5000× magnification. Scale bar, 5 μm. ............................. 41
Figure 3-3: (a) Amperometric measurements of uric acid in simulated wound fluid. Values are
averaged over the final 10 sec of the detection signal. (b) Specificity of the uric acid assay using
simulated wound fluid samples containing glucose (2 mM), lactate (10 mM), creatinine (120
µM) and uric acid (400 μM), and non-spiked simulated wound fluid. Each bar represents the
mean ± SD of three separate measurements obtained using new sensors. ................................... 42
Figure 3-4: Uric acid monitoring over the course of 7 hr using simulated wound fluid spiked with
600 µM (a), and varying concentrations (b) of uric acid. Each data point represents the mean ±
SD of three separate measurements using three new sensors. ...................................................... 44
Figure 3-5: Bend testing of the embroidered gauze sensor. Images of the sensor before (a) and
after (b) folding. (c) Amperometric measurements of uric acid (200 μM) in simulated wound
fluid using folded (solid) and unfolded (striped) sensors. Images of the sensor positioned flat (d)
and bent at 90˚ (e, f), while wrapped around an arm. (g) Amperometric measurements of uric
acid in simulated wound fluid using flat (solid) or bent (striped) sensors. Each bar represents the
mean ± SD of three separate measurements using new sensors. .................................................. 46
Figure 3-6: Comparison of screen-printed and embroidered gauze sensors in response to
mechanical stretching. Images of a screen-printed sensor before (a) and after (b) stretching, and
corresponding cyclic voltammetry measurements (c). Arrows indicate electrode cracking due to
stretching. Images of an embroidered sensor before (d) and after (e) stretching, and
corresponding cyclic voltammetry measurements (f). .................................................................. 47

xii
Figure 4-1: Schematic of the electrochemical cell and the liquid activation process. .................. 52
Figure 4-2: Schematic of a dual-cell battery showing the arrangement of the electrolyte layers. 53
Figure 4-3: Maximum output current versus AgNO3 concentration for a single-cell battery
activated using 20 µL of DI water. Each data point represents the mean ± SD of three
measurements. ............................................................................................................................... 54
Figure 4-4: Maximum current from a single-cell battery activated using 20 µL of sample. Each
bar represents the mean ± SD of three measurements. ................................................................. 55
Figure 4-5: VOC versus time for a single-cell battery activated using 20 µL of DI water. ........... 56
Figure 4-6: VOC versus number of cells activated using 20 µL of DI water for each cell. ........... 57
Figure 4-7: A dual-cell battery is powering a LED using 20 µL of DI water for each cell. Inset
shows the LED in the 'off' state for comparison. .......................................................................... 58
Figure 4-8: Schematic of single-cell battery showing the arrangement of the electrolyte layers. 60
Figure 4-9: Microfluidic channel on fabric fabrication steps used in photolithography. ............. 61
Figure 4-10: Photos of two layers of the battery. The left figure shows fabricated microfluidic
channel with 5 electrolyte cells in textile using photolithography methods. The right figures are
screen-printed electrodes which consists of 5 battery cells connecting in series. ........................ 63
Figure 4-11: Discharging characterization with different external loadings. (a) Discharging curve
of the battery through Keithley SourceMeter at 1, 5, 10, 25, 50 µA. (b) With the discharging
curve, a relationship curve of battery capacities versus different loadings was plotted according
to ohms’ law. ................................................................................................................................. 64
Figure 4-12: Characterization of battery lifetime versus duty cycles. Inset indicates the
calculation of battery duty cycles. ................................................................................................ 65
Figure 5-1: Schematic illustration of the XOx detection scheme. ................................................ 69
Figure 5-2: (a) Schematic of fabricating XOx electrochemical sensor; (b) A picture of a screen-
printed biosensor for XOx detection. ............................................................................................ 71
Figure 5-3: A photograph of aMEASURE2 next to a quarter. ..................................................... 72
Figure 5-4: A photograph of battery management evaluation module board from Texas
Instruments. ................................................................................................................................... 73
Figure 5-5: (a) Chronoamperograms of simulated urine spiked with XOx from 0 U/L up to
16,000 U/L generated using the Genefluidics platform. (b) Calibration plot of generated current
vs. XOx concentration. Each data point represents mean ± SD of three measurements of the
amperometric signal averaged over the final 10 sec of the chronoamperograms. ........................ 74

xiii
Figure 5-6: (a) Integration of the screen-printed sensor with aMEASURE2 via flat alligator clips.
(b) Calibration plot of generated current vs. XOx concentration using Genefluidics platform
(blue) and aMEASURE2 circuit (orange). Each bar represents the mean ± SD of three separate
measurements using new sensors. ................................................................................................. 75
Figure 5-7: (a) Calibration plot of generated current vs. XOx concentration using aMEASURE2.
Each data point represents mean ± SD of three measurements of the amperometric signal
averaged over the final 10 sec of the chronoamperograms. (b) Chronoamperograms of two
patient urine samples, one is negative and the other is infected with E. Coli. .............................. 76
Figure 5-8: Schematic illustration of the integrated “smart diaper” system. ................................ 78
Figure 5-9: Charging and discharging curve of the supercapacitor using a 9-cell liquid-activated
battery. .......................................................................................................................................... 79
Figure 5-10: (a) Chronoamperograms of simulated urine spiked with XOx at 0 U/L, 500 U/L and
1,000 U/L generated using the integrated system. (b) Calibration plot of generated current vs.
XOx concentration. Each data point represents mean ± SD of three measurements of the
amperometric signal at 6 sec of the chronoamperograms (dash line in (a)). ................................ 80
Figure 5-11: A mock prototype of a “smart diaper” platform for urine XOx monitoring. ........... 81

1
1. INTRODUCTION

2
1.1 Point-of-care Diagnostics
Figure 1-1: An idealized point-of-care device consisting of sample processing, microfluidic chip,
receptors, signal transduction and electronics. Image obtained from [1].
The detection and quantification of cells and biomarkers provide a wealth of information
that is valuable in many disciplines including medicine, biotechnology, cell biology, and
chemistry. Currently, most analytical measurements are performed using laboratory-based
technologies, which are costly, time consuming and labor intensive. As a result, quantitative
diagnostic testing is limited to resource-rich countries where it plays a significant role in rising
healthcare costs [2, 3]. Additionally, there is a growing interest to develop compact health
monitoring systems that can be used outside of hospital and clinical settings [1, 4-5]. To address
these issues, researchers have been working on the development of point-of-care (POC)
diagnostics, which offers several advantages over conventional laboratory-based analytical
methods, including enhanced portability and automation, faster processing times, reduced sample
volumes, and lower costs [6]. An idealized POC device including sample processing,
microfluidic chip, receptors, signal transduction and electronics is shown in Figure 1-1. The

3
success of glucose meters and pregnancy tests has motivated more people to opt for self-testing,
conferring increased responsibility to maintain their own medical records and notify their
physicians should abnormal results arise.
One of the ultimate goals of POC technology is to make diagnostic testing more widely
accessible (e.g., outpatient centers, health clinics, doctor’s offices) and cost effective, which can
ultimately improve several areas of healthcare including early disease detection, health
maintenance, and therapeutic monitoring. Empowering individuals to do their own tests can
improve patient compliance (adherence to diagnosis and treatment regimens). A recent study of
the cost effectiveness of POC testing reveals significant increases in testing regularity and
adherence to prescribed medications, as well as improvements in clinical outcomes. Near-patient
testing in diabetic clinics results in greater patient satisfaction accompanied by better
understanding of medical results and improved long-term prognosis relative to a dearth of
testing. The advent of “telemedicine” or “tele-health”, the provision of health services over long
distances via telecommunications, is addressing this challenge by giving healthcare professionals
partial control over patient self-testing and data management.
While much work has focused on the diagnosis of human diseases, POC systems have
also been applied to other important applications, including the identification of animal and plant
pathogens [7–9], biological warfare agent detection [10, 11], food quality assurance [12, 13] and
environmental monitoring [14]. The broad applicability of POC systems is in part resulted from
their versatility in identifying and analyzing a wide variety of biological targets (e.g., chemical
compounds, nucleic acids, proteins, metabolites, biological cells) in clinical and environmental
samples. For this reason, numerous companies have been working to commercialize POC
platforms, mainly for healthcare applications. In 2016, POC testing constituted roughly $23

4
billion, one-third of the entire in vitro diagnostics market in the world [15]. With an increasing
aging population and a growing obesity epidemic, the demand for cost-effective diagnostics is
expected to rise [16] and it is predicted that the POC testing market will reach approximately
$75.1 billion by 2020 [17]. Therefore, next generation POC systems need to be economical and
simple to use, while still providing valuable clinical information.
POC diagnostics have been extensively reviewed in recent years, from the points of view
of both technological development and medical application. Cell and biomolecular detection is
critically dependent on the availability of high quality reagents (e.g., recombinant proteins and
nucleic acids, antibodies, aptamers) and highly specific and sensitive analytical tools, which is
the basis for the prognosis and diagnosis of many types of diseases including cancer, diabetes,
AIDS/HIV, tuberculosis, and other communicable diseases [18, 19] Therefore, research on the
characterization of existing biomarkers and the discovery of new ones plays an important role in
the development of POC tests. Generally, these tests are designed to detect the presence or
measure the concentration of one or more disease-specific cell or biomarker, which can offer
much more diagnostic information than physiological measurements alone. The insights gained
from biomarker research provide tremendous opportunities not only for the diagnosis of diseases,
but also for the development of novel molecular-targeted therapeutic strategies [20]. Therefore,
the realization of these opportunities depends on the availability of sensitive, low-cost, easy to
use analytical instruments, which is the basis for POC diagnostics.
1.2 Electrochemical Detection
Several reasons make electrochemical detection highly suitable and useful in POC
testing: 1) It is easily miniaturized; 2) it can provide high sensitivity; and 3) it is more rugged

5
than optical detection method. The electrochemical sensors are usually consisted of three
electrodes: working electrode (WE), counter electrode (CE), and reference electrode (RE).
Electrochemical measurements include the measurement of voltage (in potentiometry), current
(in amperometry), and current-voltage profile (in voltammetry).
Figure 1-2: General arrangement of electrochemical real-time detection systems. Image obtained
from [21].
Potentiometry passively measures the potential of a solution between reference electrode
and indicator electrode, a general arrangement of electrochemical detection systems is showing
in Figure 1-2. The reference electrode maintains a constant potential, while the indicator
electrode changes the potential with the composition of the sample. Therefore, the difference of
potential between the two electrodes gives an assessment of the composition of the sample. In
potentiometric method, indicator electrodes are made selectively sensitive to the specific ions,
such as fluoride in fluoride selective electrodes, so that the potential solely depends on

6
the activity of the ion of interest. The most common potentiometric electrode is the glass-
membrane electrode used in a pH meter.
The principle of voltammetry based on potential sweep is to obtain the analyte
composition by measuring the current with an application of a continuously time-varying
potential to the working electrode. This method, including linear sweep voltammetry and cyclic
voltammetry (where the sweep direction is inverted at a certain, chosen potential) is probably the
most widely used for studying electrode process. Different from current measured in the steady
state (dс/dt = 0), the current measured with varying potential is resulted from the occurrence of
oxidation or reduction reactions of electroactive species in solution, adsorption of species
according to the potential, and a capacitive current due to double layer charging. Not only for
identification and measurement of analyte in solution, voltammetry has been also used for
understanding mechanisms of electrochemical reactions and for the semi-quantitative analysis of
reaction rates.
On the contrary, amperometric biosensors function by the production of a current, when a
potential is applied between two electrodes. To initiate the amperometric measurement, a small
and highly controlled electrical polarization is applied between the WE and RE by an electronic
circuit. Because of the chemical reactions of the analytes on the WE, e.g. oxidation, the current is
generated proportional to the concentration of the analyte in the solution. This method generally
has response times, dynamic ranges and sensitivities similar to the potentiometric biosensors.
Furthermore, this method has numerous advantages for on-chip electrochemical detection,
including (1) the detector has a minimal dead volume; (2) preparation of electrodes is compatible
with the planar micromachining technology; (3) the electrodes can be miniaturized without
compromising limit of detection; and (4) the electrochemical detection has a short response time.

7
1.3 Wearable Biosensors
Efforts on research and development of smart, flexible systems for wearable purpose
have been increasing in both academia and industry. A large variety of laboratory prototypes, test
beds and industrial products have already been produced. These flexible/wearable systems aim to
match the living environment with the physical and cognitive abilities and to probe the
limitations of those suffering from disabilities or diseases, thereby enhancing human
performance or minimizing the risk of illness, injury, and inconvenience. As results, these
systems support independent living for the elderly, postoperative rehabilitation for patients to
expedite recovery, and assessment or enhancement of individual sportive or technical abilities
[22].
An ideal completed smart flexible system may consist of a wide range of wearable
devices, including sensors, actuators, smart fabrics, power supplies, wireless communication
networks, processing units, multimedia devices, user interfaces, software and algorithms for data
capture, processing, and decision support. These systems are able to monitor vital signs, such as
body and skin temperature [23], heart rate [24, 25], respiration rate [26–28], oxygenation of the
blood [29], arterial blood pressure [30], bodily motion [31–34] and brain activity [35]. The
measurements can be forwarded via a wireless sensor network either to a central connection
node, such as a personal digital assistant (PDA), or directly to a medical center. Advances in the
field of micro- electromechanical systems (MEMS) have addressed a number of flexible
biosensors for both wearable real-time monitoring [36] and POC testing [37].
Despite the extensive progress that has been charted in wearable sensors for physiological
monitoring, very little attention has been directed towards non-invasive chemical sensing for
measuring analytes and biomarkers in bodily fluids. Along with this information, doctors or

8
patients can have much further insight into the overall health status than physiological variables
alone can provide. Researchers have recently made considerable efforts to develop wearable
chemical sensors that can monitor analytes in tears, saliva, sweat, and wound fluid.
1.3.1 Saliva-based sensors
Saliva is a complex biofluid comprising numerous constituents permeating from blood,
thus the diagnostic use of saliva has attracted the attention of numerous investigators due to its
noninvasive nature and relative simplicity of collection with fewer pre-treatment steps. One of
the earliest designs for continuous in vivo biofluidic measurement is modified denture-based
devices to monitor pH [38] and fluoride activity [39] in saliva and dental plaque. In the two
designs, potentiometric sensors incorporated liquid junction-based electrodes, miniature
transmitters, and a power supply. As the early prototype, these saliva-based biosensors required
pre-calibration step that was extra workload for the user, and temperature variations in mouth
also affected the accuracy of potentiometric sensors.
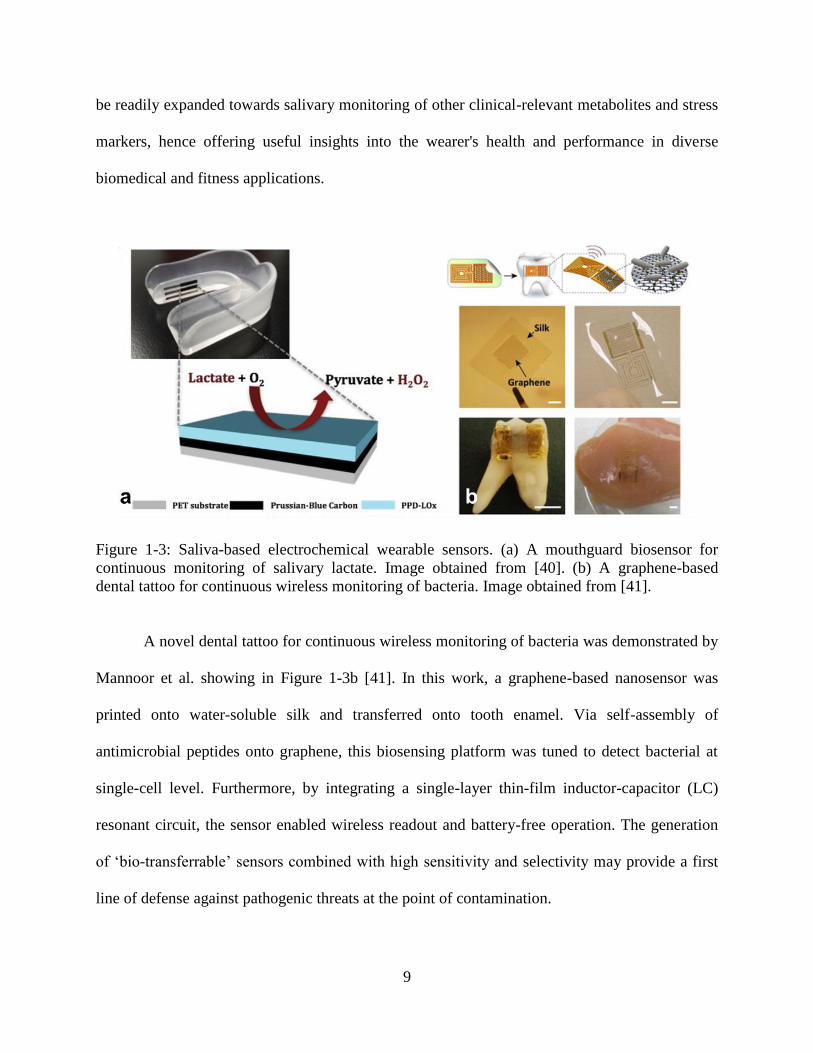
An in-mouth biosensor for continuous monitoring of salivary metabolites was introduced
by Wang’s group (Figure 1-3a) [40]. Towards continuous salivary lactate monitoring in
undiluted human saliva samples, they integrated a printable amperometric enzymatic biosensor
onto an easily removable mouthguard platform. The sensor was fabricated on polyethylene
terephthalate (PET) and subsequently affixed to a mouthguard, which provided great potential
for real-time physiological monitoring of the fitness state of individuals. The sensor can be
further improved with the integration of amperometric circuits and electronics for data
acquisition, processing, and wireless transmission, as well as critical assessment of all potential
toxicity and biocompatibility concerns. This amperometric mouthguard biosensing concept can
9
be readily expanded towards salivary monitoring of other clinical-relevant metabolites and stress
markers, hence offering useful insights into the wearer's health and performance in diverse
biomedical and fitness applications.
Figure 1-3: Saliva-based electrochemical wearable sensors. (a) A mouthguard biosensor for
continuous monitoring of salivary lactate. Image obtained from [40]. (b) A graphene-based
dental tattoo for continuous wireless monitoring of bacteria. Image obtained from [41].
A novel dental tattoo for continuous wireless monitoring of bacteria was demonstrated by
Mannoor et al. showing in Figure 1-3b [41]. In this work, a graphene-based nanosensor was
printed onto water-soluble silk and transferred onto tooth enamel. Via self-assembly of
antimicrobial peptides onto graphene, this biosensing platform was tuned to detect bacterial at
single-cell level. Furthermore, by integrating a single-layer thin-film inductor-capacitor (LC)
resonant circuit, the sensor enabled wireless readout and battery-free operation. The generation
of ‘bio-transferrable’ sensors combined with high sensitivity and selectivity may provide a first
line of defense against pathogenic threats at the point of contamination.

10
1.3.2 Sweat-based sensors
Human sweat contains abundant information about a person’s health status, which makes
it an excellent biofluid for non-invasive electrochemical sensing [42]. For example, sodium,
lactate, ammonium, and calcium levels in sweat are indicators of electrolyte imbalance, cystic
fibrosis (CF), physical stress, osteoporosis, and bone mineral loss. Therefore, continuous
detection of these analytes in sweat has been used for monitoring a person’s physiological
balance, intoxication level, signs of drug abuse, as well as among other applications.
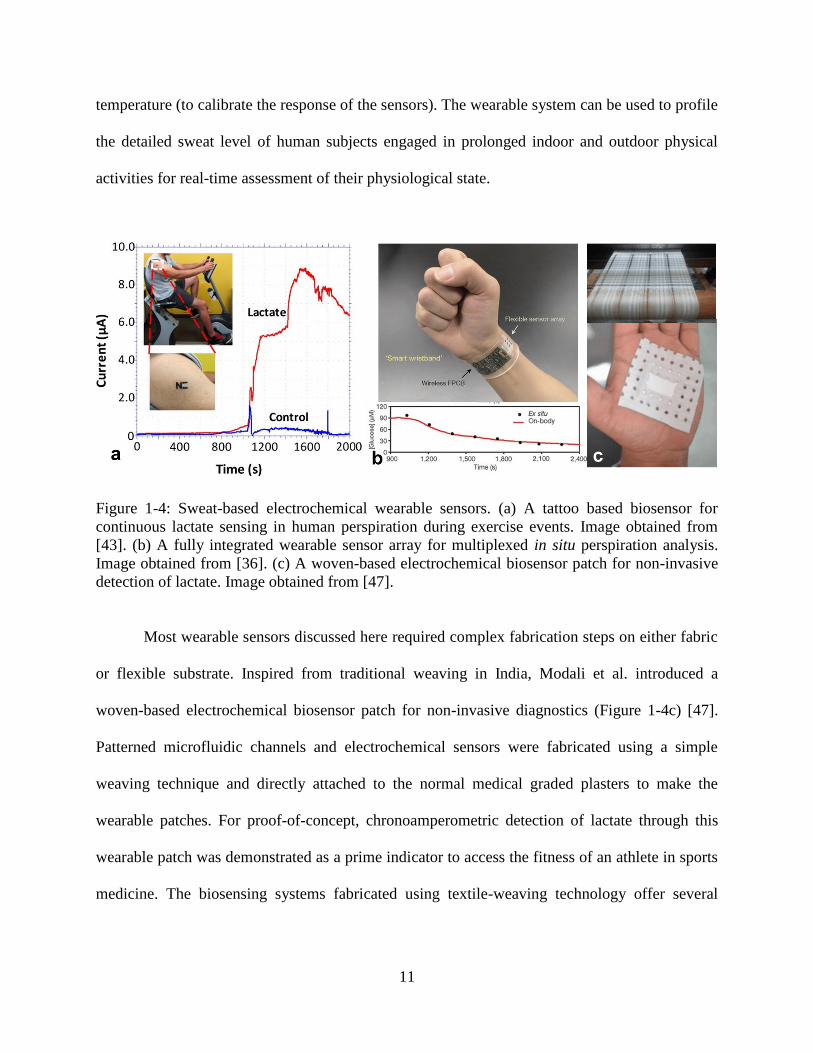
For the first example of real-time noninvasive lactate sensing in human perspiration
during exercise events, Jia et al. demonstrated a skin-worn electrochemical biosensor printed on
a flexible temporary-transfer tattoo (Figure 1-4a) [43]. Fabricated via conventional screen-
printing methods, these flexible tattoo sensors conformed to the contours of the body and
displayed resiliency toward extreme mechanical stresses during physical activity. The epidermal
data from these tattoo biosensors has been demonstrated the capability of closely tracking
exercise intensity through monitoring sweat lactate dynamics. Compared with traditional blood
tests for lactate, the epidermal biosensor was noninvasive, simple-to-operate, and caused no
hindrance to the wearer. In the following studies, researchers developed the epidermal biosensors
for monitoring acidity [44] and ammonium [45] in sweat by combining solid-state potentiometry
and tattoo sensor technology. Coupled with wearable transceiver, a potentiometric tattoo sensor
has been introduced for continuous wireless monitoring of sodium levels in human sweat [46].
Recently, a fully integrated wearable sensor array for multiplexed in situ perspiration
analysis was reported by Dr. Javey’s group shown in Figure 1-4b [36]. This mechanically
flexible sensor array could simultaneously and selectively measure sweat metabolites (such as
glucose and lactate) and electrolytes (such as sodium and potassium ions), as well as the skin
11
temperature (to calibrate the response of the sensors). The wearable system can be used to profile
the detailed sweat level of human subjects engaged in prolonged indoor and outdoor physical
activities for real-time assessment of their physiological state.
Figure 1-4: Sweat-based electrochemical wearable sensors. (a) A tattoo based biosensor for
continuous lactate sensing in human perspiration during exercise events. Image obtained from
[43]. (b) A fully integrated wearable sensor array for multiplexed in situ perspiration analysis.
Image obtained from [36]. (c) A woven-based electrochemical biosensor patch for non-invasive
detection of lactate. Image obtained from [47].
Most wearable sensors discussed here required complex fabrication steps on either fabric
or flexible substrate. Inspired from traditional weaving in India, Modali et al. introduced a
woven-based electrochemical biosensor patch for non-invasive diagnostics (Figure 1-4c) [47].
Patterned microfluidic channels and electrochemical sensors were fabricated using a simple
weaving technique and directly attached to the normal medical graded plasters to make the
wearable patches. For proof-of-concept, chronoamperometric detection of lactate through this
wearable patch was demonstrated as a prime indicator to access the fitness of an athlete in sports
medicine. The biosensing systems fabricated using textile-weaving technology offer several

12
advantages for the development of wearable sensors, such as ease of production, reagent waste
minimization, scalability and controllability.
1.3.3 Wound fluid-based sensors
Figure 1-5: Wound-based electrochemical wearable sensors. (a) A bandage-based wearable
biosensor with potentiometric pH cell embedding for real-time monitoring of pH changes in a
wound. Image obtained from [48]. (b) A bandage-based electrochemical wearable sensors for
real-time monitoring of uric acid. Image obtained from [49].
Wounds raise healthcare concerns and medical burdens on the patient and costs
significantly to the healthcare provider, especially when the wounds fail to heal properly. To
protect wounds from debris and bacteria, adhesive bandages are widely used to ensure a moist
and unperturbed environment in order to accelerate the healing processes. In real-life scenarios,
researchers have started to integrate biosensors with bandages for monitoring wound status. Such

13
wearable sensing platforms are designed for precise analytical performance, simplicity of
operation, low-cost and compact size.
A novel bandage-based wearable biosensor has been designed by embedding a
potentiometric pH cell into an adhesive bandage for real-time monitoring of pH changes in a
wound [48]. The potentiometric cell was fabricated by screen-printing a set of Ag/AgCl
electrodes on a commercial adhesive bandage. The biosensor exhibited Nernstian sensitivity over
the 4.35–8.00 pH within the physiological range of interest. The bandage-based biosensor
displayed attractive analytical figures of merit in terms of sensitivity, linearity, selectivity and
stability. A similar biosensor for wound status monitoring was designed for chronoamperometric
measurements of uric acid (UA), which is highly correlated with wound severity because of
catabolysis by microbial uricase during bacterial infection [49]. In this design, all electrodes
were fabricated by screen-printing Prussian Blue (PB)-modified carbon electrodes onto a
commercial bandage, and working electrodes were immobilized with the enzyme of urate
oxidase (uricase). The analytical performance of this smart bandage biosensor, including
sensitivity, selectivity, operational stability, and robustness, was evaluated through a series of in
vitro experiments performed in PBS. With customized wearable potentiostatic and wireless
electronics, this biosensor brought convenience to the patients at home for self-testing via a
special application on a smartphone or tablet, and transferring medical data to a healthcare
service as needed.
1.3.4 Challenges and perspectives
There are still several challenges to be addressed before the realization of wearable non-
invasive electrochemical biosensors. Particular attention should be given to technological issues,

14
such as the resiliency of these devices, their long-term stability, and their biocompatibility. For
example, the mechanical deformation that exerts to the epidermal sensors during normal bodily
movement will increase as the wearer is performing intense physical activity. For reusable
wearable sensors, washing procedures presents immense mechanical, chemical, and heat
degradation to the sensors. Extensive efforts need to be taken in developing sensors that can
sustain such severe stresses over extended periods or rigorous use. The advances in stretchable
electronics give the researchers in the field of wearable electrochemical sensors great
opportunities to address the issue of mechanical resiliency while maintaining the low cost of
devices.
Another key development of wearable electrochemical biosensor is to achieve
calibration-free, user-independent, extended storage and long-term stability. For example, for
wearable salivary biosensors, the performance will be hindered due to the biofilm formation over
teeth, which might be minimized through protective coating or antimicrobial coverage on the
sensors. Furthermore, effort has been devoted towards enhancing the sensitivity of wearable
sensors via nanomaterial-based signal amplification. However, the potential toxicity of
nanomaterials should be considered prior to their on-body applications. Other challenges also
exist before fully implementing the use of wearable sensors, including high costs, size and
weight limitations, energy consumption, sensor implementation and connectivity, ethics, laws,
privacy, freedom, autonomy, reliability, security, and service issues [24, 50-51]. Amongst these
issues, one major challenge is to power these wearable biosensors and still retain their
mechanical properties [52–54].

15
1.4 Textile Batteries
To fully implement the use of flexible sensors, flexible batteries are essential for
powering flexible electronic devices. One of the most common types of battery is an
electrochemical cell which consists of active layers supported on conductive substrates (current
collectors) to form the anode and cathode electrodes. The electrolyte provides ionic contact
between the electrodes and helps to complete the redox reactions within the cell.
Traditional commercial batteries, prismatic, cylindrical, and coin cells, are rigid and non-
flexible, making them poorly suited for flexible systems. A power source for a flexible electronic
device should be thin, bendable, and mechanically compliant [55–62]. Flexible electronics are
fabricated by patterning traditional inorganic components in an ultra-thin form [63–65] or by
depositing solution-processed organic/inorganic semiconductors and conductive inks on flexible
substrates [66–69]. Due to the thinness of active layers and conducting electrodes, these devices
can be flexed to low bending radii without reaching their fracture limit [63, 65]. To replace all
the rigid components of a battery by flexible counterparts, flexible batteries require flexible
pouches for packaging, flexible current collectors, and flexible active layers and current collector
interfaces to prevent cracking and delamination [70–72]. Over the past couple of years, there has
been significant progress towards using printing-based methods to fabricate power sources by
depositing battery components with printable inks for the active layers, current collectors, and
electrolyte. Batteries fabricated using printing processes have the advantage of low cost,
flexibility, ease of production, and integration with electronic devices [73–75].
Recently, wearable electronics has attracted significant attention since they eliminate the
necessity for additional carriage of the devices. These wearable systems have the requirements of
being both lightweight and comfortable, which implies that the electronics must be energy

16
efficient so as to limit the size of the batteries used to power them. However, although
considerable progresses have been made in wearable electronics, the power sources of the
devices do not keep pace with such progresses due to tenuous mechanical stability, causing them
to remain as the limiting elements in the overall technology. To solve this issue, the researchers
have been working to develop batteries that can be integrated onto textile substrates, thereby
replacing rigid batteries used in the current systems.
Figure 1-6: Textile-based batteries. (a) A PEDOT-based charge storage device was fabricated on
a textile substrate. Image obtained from [76]. (b) A solar rechargeable wearable battery was
demonstrated to light up LED bulbs. Image obtained from [57].
Bhattacharya et al. reported a polymeric charge storage device that can be directly
fabricated onto a textile surface with a simple process (Figure 1-6a) [77]. This device can be
used as a rechargeable textile battery that consist of a poly-(3,4-ethylenedioxythiophene):poly
(styrene sulphonic acid) (PEDOT) solid electrolytic layer deposited between two woven silver
coated polyamide yarns. The device could be charged and discharged five times without
suffering degradation in electrical performance. Lee et al. reported another wearable textile
battery that can be recharged by solar energy [60]. This battery was integrated with a Ni-coated
polyester yarn as a current collector for efficient stress release, polyurethane (PU) binder for

17
strong adhesion of active materials, and PU separator with superior mechanical, electrical, and
thermal properties. This battery endures extremely severe mechanical tests while delivering
comparable electrochemical properties to those of the conventional foil-based counterparts. For
recharging the textile battery without physical connection to power outlet, the flexible and
lightweight solar cells were integrated onto the outer surface of the textile battery to enable
convenient solar-charging capabilities.
Despite the advancements in textile batteries, several manufacturing challenges are
positioned in this field due to thermal budget imposed by plastic substrates, compatibility issues
of different layers in the device, and stability during bending [78]. The bending mechanics of
flexible electronic devices have been previously studied with various potential solutions for
strain management [76, 79-80]. While there has been much progress toward the development of
flexible electronics [68], a similar level of maturity has not yet been achieved in flexible batteries
[81–83]. For example, one approach to improve the mechanical stability of flexible electronics
has been proposed to use very thin electrodes with buckled structure architecture, thereby
reducing the strain on these structures during bending [84, 85]. However, similar principles are
difficult to apply in flexible batteries, because the cell capacity is directly related to the amount
of electroactive material present. Hence, a relatively large footprint is required for a thin battery
[86] in order to achieve the same capacity as of a typical battery with thick-film electrodes.
An alternative type of battery that can meet these requirements is a liquid-activated
battery which turns ‘on’ when a liquid sample is applied to the cell. This unique scheme offers
useful advantages for some sensing applications where the liquid can be utilized for sampling
and device activation. Furthermore, it enables on-demand power generation which can simplify
the design and operation of the overall device. Previous groups have demonstrated liquid-

18
activated batteries fabricated on paper [87] and plastic [88] which are capable of 1.3 V (open
circuit) and 1.2 V with a 1 kΩ load, respectively.
Currently, the areal capacity of a flexible battery is typically in the range of 0.1–1.0
mAh/cm2, and their flexibility only reaches to a bending radius of 20–40 mm with active area of
approximately 5 cm2. These batteries are only suitable for powering devices that have very low
power requirements, because the thinness of the active materials in flexible batteries reduces the
areal capacity of the battery. Flexible batteries would benefit from the development of new
active materials with high energy density and improvement in flexible packaging. New materials
would help improve the areal capacity and volumetric energy density of the battery without
increasing the overall thickness of the active layers. The development of thinner, flexible
packaging that is impermeable to moisture and prevents the egress of electrolyte from the battery
will help to improve the volumetric energy density of the batteries and make them more
compliant.
1.5 Objectives
The field of wearable sensing offers numerous advantages over conventional benchtop
technologies, especially for ex vivo measurements and POC testing. Although numerous devices
and systems have already been demonstrated for various applications, there are still a vast
number of applications yet to be explored. Our long-term goal is to develop a self-powered,
wearable electrochemical biosensor for quantitative biomarker measurements and POC
applications. The objectives of this dissertation are to:
1. Develop robust, flexible electrochemical sensors on textile;
2. Develop liquid-activated batteries on textile;

19
3. Integrate textile electrochemical sensors and batteries with a miniature detection
circuit.
In Chapters 2 and 3, we introduce the design, fabrication and validation of embroidered
textile biosensors for biomolecular detection (Objective 1). In Chapter 4, we develop a liquid-
activated textile battery for biosensor self-powering (Objective 2). In Chapter 5, we demonstrate
our screen-printed biosensor for xanthine oxidase (XOx) detection and development of
electronics for system integration (Objective 3). In Chapter 6, we conclude our achievements in
this dissertation. The wearable sensing technologies developed in this dissertation represent a
culmination of the experience and knowledge that have been obtained throughout my graduate
career. It also reveals a wide spectrum for the development of wearable sensors for a variety of
healthcare applications.

20
2. EMBROIDERED ELECTROCHEMICAL SENSORS ON TEXTILE

21
2.1 Motivation
Textile is a widely available, inexpensive material that offers capillary-based sample
transport and enhanced robustness compared with paper. Furthermore, textile-based sensors and
electronics offer facile integration with wearable materials and garments which can be used to
develop wearable sensor systems. Recent research in wearable sensing has focused on the
integration of sensors into fabrics for monitoring physiological parameters such as temperature
[89], heart rate [90, 91], and respiration [23]. With respect to chemical sensing, Wang’s group
has developed electrochemical sensors on fabrics for health [92], wound [49], and environmental
monitoring [93, 94]. Diamond’s group has also demonstrated wearable, textile-based
electrochemical sensors for sweat analysis [95, 96]. While these devices are capable of
performing sensitive analytical measurements, they rely on screen-printed sensors which tend to
be mechanically fragile and can be challenging to integrate with textile-based electronic
components. Recently, a textile-based electrochemical sensor was reported which employs
conductive silk yarn woven into the fabric [97]. This approach offers improved robustness
compared with screen-printed sensors, but is limited to simple electrode geometries and
substrates that are woven.
In this chapter, we explore the design, fabrication and validation of an embroidered
electrochemical sensor on textile for quantitative analytical measurements. This unique approach
employs conductive thread which can be embroidered onto various types of textiles and fabrics.
Using a computerized embroidery machine, electrodes can be quickly fabricated with customized
geometries and configurations to accommodate commercial or custom electrochemical
instrumentation. For wearable sensing applications, sensors can be embroidered at specific
locations on a garment needed for sampling or detection. This technique is also amenable to
22
high-volume production which minimizes device costs associated with in vitro diagnostic testing.
Due to the hydrophilic nature of most threads, embroidered sensors can quickly absorb liquids
facilitating sample loading and improving automation. To demonstrate the functionality of this
biosensor technology for POC testing, we performed several studies to evaluate its specificity
and accuracy for the detection of glucose and lactate in buffer and whole blood samples. We also
show that our embroidered sensor can be used for multiplexed detection with high specificity and
sensitivity by fabricating a sensor array for simultaneous measurements of analytes. Lastly, we
evaluate the performance of our biosensor under repeated mechanical deformation, which reveals
its ability to generate accurate and consistent measurements under such conditions.
2.2 Experimental Design
2.2.1 Biochemicals and reagents
Glucose, glucose oxidase, uric acid, and L-lactate were purchased from Sigma-Aldrich
(St. Louis, MO) and lactate oxidase was purchased from A.G. Scientific (San Diego, CA).
Silver/silver chloride (Ag/AgCl) and carbon inks were purchased from Conductive Compounds
Inc. (Hudson, NH). Blocker Casein in PBS was purchased from Thermo Scientific (Tustin, CA).
Deionized (DI) water was generated using a Barnstead Smart2Pure water purification system.
For single and multi-analyte measurements in buffer samples, analytes were resolved in PBS at
room temperature. Blood samples were prepared by adding analytes in human whole blood from
BioreclamationIVT (Hicksville, NY). Samples were freshly prepared prior to experiments and
remaining biochemicals were used without further purification.

23
2.2.2 Thread preparation
The electrochemical sensors consist of three electrodes, a reference electrode (RE),
working electrode (WE) and counter electrode (CE), which were fabricated from custom
conductive thread. Briefly, polyester thread (Brothers International, Bridgewater, NJ) was coated
with carbon or Ag/AgCl ink and cured at 120˚C for 40 min. Thread coated with carbon ink was
used for the WE and CE, and thread coated with Ag/AgCl ink was used for the RE. For Ag/AgCl
thread, soldering flux (Kester, Itasca, IL) was applied to the thread using a flux pen (Figure 2-1a)
prior to the ink coating process to minimize oxidation of the ink. Glucose oxidase or lactate
oxidase was immobilized onto the WE by immersing carbon-coated thread in either a glucose
oxidase (645 U/mL) or lactate oxidase (256 U/mL) solution, followed by air drying overnight at
room temperature.
2.2.3 Thread characterization
Threads were characterized using optical microscopy (Nikon Eclipse TS100-F trinocular
microscope and DS-Fi1 camera), scanning electron microscopy (SEM) and energy-dispersive X-
ray spectroscopy (EDS) to study their morphology after the ink coating process. SEM images
and EDS spectrum were captured using a JEOL 6620LV scanning electron microscope at 10 kV
or 12 kV with 1200× and 170× magnifications for Figs. 1c and 1d, respectively. The electrical
properties of the threads were characterized by measuring their electrical resistance using a Fluke
87-V digital multimeter. Threads were cut into 1 m-long pieces and attached to the multimeter by
clamping the ends using alligator clip probes (Figure 2-1b).

24
Figure 2-1: Photographs showing the flux application process (a) and thread resistance
measurements (b).
2.2.4 Sensor design and fabrication
Electrodes were designed using AutoCAD software (Autodesk, Vernon Hills, IL) and
converted into an embroidery file using SewArt software (S & S Computing). Several
embroidery parameters, such as the stitch length and stitch density, were optimized to enhance
the embroidery quality for improved signal consistency and signal-to-background ratio (SBR).
The electrodes were fabricated using a Brothers SE400 computerized embroidery machine on
polyester fabric stacked with an embroidery stabilizer film (World Weidner, Ponca City, OK).
After the sensors were embroidered, the stabilizer film was removed and individual sensors were
cut and stored at ambient conditions prior to experiments.

25
2.2.5 Electrochemical measurements
Amperometric measurements were performed using a multichannel electrochemical
workstation (GeneFluidics, Inc. Irwindale, CA). For single analyte measurements, 35 µL of
sample was dispensed onto the sensing region using a pipette, followed by the application of a -
200 mV bias potential after 1 min. For multi-analyte measurements, 60 µL of sample was used.
All measurements were performed at room temperature under ambient conditions using new
sensors.
2.3 Results and Discussion
2.3.1 Characterization of ink-coated thread
Figure 2-2: Optical images of uncoated thread (a) and Ag/AgCl-coated thread (b). Scale bar, 500
µm. SEM images of Ag/AgCl-coated thread showing its surface morphology (c) and cross-
section (d). Scale bar, 50 µm.
Optical images of uncoated thread (Figure 2-2a) and Ag/AgCl-coated thread (Figure
1-3b) show the effects of the thread coating and enzyme immobilization process. As shown in
Fig. 1b, the entire length of thread is uniformly coated with Ag/AgCl with negligible blotching

26
or defects. Similar surface coverage was also observed for carbon-coated thread. SEM was used
to further observe changes in the thread surface morphology following the coating process.
Magnified images of Ag/AgCl-coated thread reveal that Ag/AgCl completely fills the
microscopic voids on the surface thereby improving surface coverage (Figure 2-2c). Cross-
sectional images of the threads show that Ag/AgCl permeates into the fibers at depths of up to 50
µm (Figure 2-2d), which is confirmed by EDS analysis (Figure 2-3). These results also
demonstrate that the enzyme immobilization process has a negligible impact on the surface
morphology and the coating thickness. Since the electrical properties of the threads are strongly
dependent on the quality of the ink coating, we also measured the electrical resistance of the
coated threads. Ag/AgCl and carbon-coated thread exhibited resistances of ~0.8 and ~140 Ω/cm
respectively, which is similar to values reported in literature [14]. The resistance of Ag/AgCl-
coated thread was significantly reduced by applying flux to the thread which helped to prevent
oxidation of Ag/AgCl. The resistance of Ag/AgCl-coated thread without flux can reach as high
as 80 Ω/cm.
Figure 2-3: EDS spectrum of Ag/AgCl-coated thread containing Ag, C, Cl and O.

27
2.3.2 Thread embroidery characterization
Figure 2-4: Embroidered electrochemical sensors fabricated on a textile “chip” (a), cotton gauze
(b) and cotton t-shirt (c). Zoomed-in image of the sensor array on the t-shirt (d).
Embroidery is an intricate process where graphical patterns are sewn onto fabrics using
thread. Several embroidery parameters, including stitch length and separation distance, were
studied to optimize the quality of the electrodes. For instance, decreasing the stitch separation
distance resulted in a higher stitch density which improved electrode uniformity. However, using
a higher stitch density required a larger amount of thread which increased the electrical
resistance of the electrodes. We determined that a stitch separation distance of 0.2 mm and stitch
length of 0.5 mm produced consistent uniformity while minimizing the electrode resistance.
Using these optimized parameters, we successfully fabricated sensors and sensor arrays onto
28
polyester and cotton fabrics, as well as wearable garments. Figure 2-4 shows proof-of-concept
examples of embroidered sensors on a textile “chip” for in vitro diagnostic testing, a cotton
gauze for wound monitoring and a cotton t-shirt for sweat analysis.
2.3.3 Single analyte detection
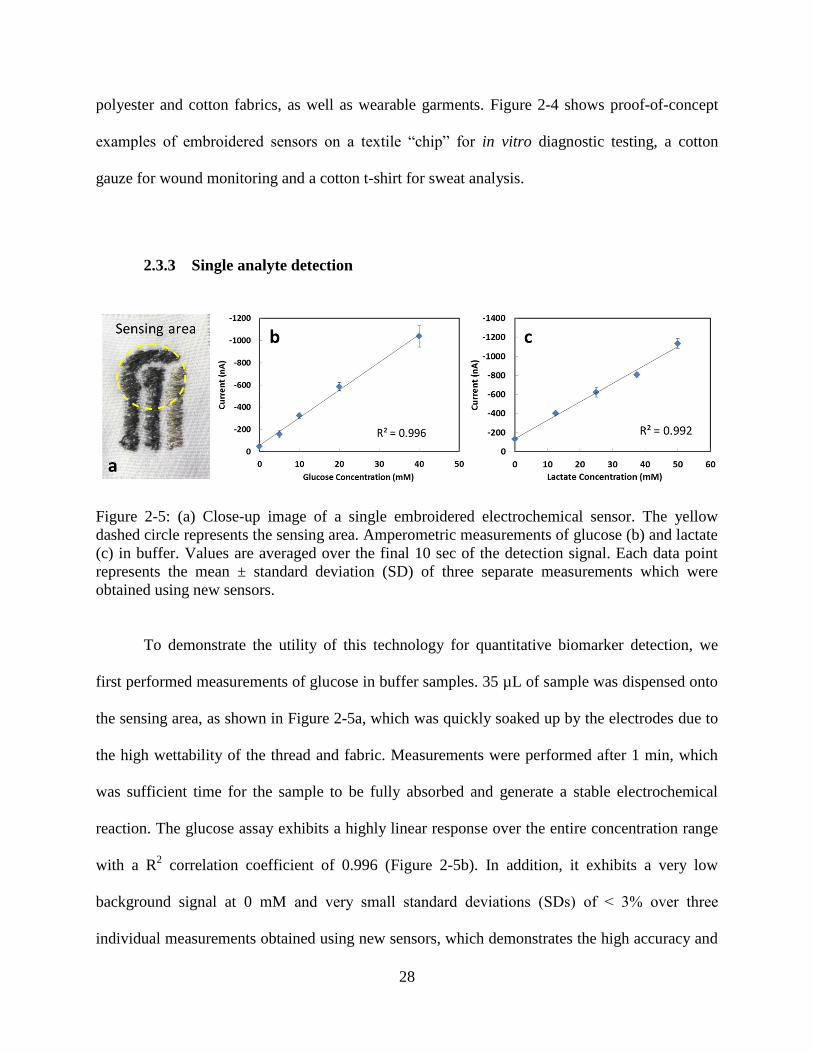
Figure 2-5: (a) Close-up image of a single embroidered electrochemical sensor. The yellow
dashed circle represents the sensing area. Amperometric measurements of glucose (b) and lactate
(c) in buffer. Values are averaged over the final 10 sec of the detection signal. Each data point
represents the mean ± standard deviation (SD) of three separate measurements which were
obtained using new sensors.
To demonstrate the utility of this technology for quantitative biomarker detection, we
first performed measurements of glucose in buffer samples. 35 µL of sample was dispensed onto
the sensing area, as shown in Figure 2-5a, which was quickly soaked up by the electrodes due to
the high wettability of the thread and fabric. Measurements were performed after 1 min, which
was sufficient time for the sample to be fully absorbed and generate a stable electrochemical
reaction. The glucose assay exhibits a highly linear response over the entire concentration range
with a R2 correlation coefficient of 0.996 (Figure 2-5b). In addition, it exhibits a very low
background signal at 0 mM and very small standard deviations (SDs) of ˂ 3% over three
individual measurements obtained using new sensors, which demonstrates the high accuracy and
29
reproducibility of this assay. Measurements were also performed to detect lactate in buffer
samples using sensors functionalized with lactate oxidase. Similar to the glucose assay, this
assay exhibits an excellent linear response over the entire concentration range (R2 = 0.992) and
highly accurate measurements with SDs of ˂ 6%. These results show that our embroidered
biosensor can quickly and accurately detect different types of analytes on a flexible, textile
platform.
2.3.4 Multiplexed detection
In addition to single analyte measurements, experiments were carried out using our
embroidered biosensors for multiplexed measurements of glucose and lactate. We first tested the
specificity of the individual glucose and lactate assays by performing measurements using a
mixture of analytes in PBS including glucose (5 mM), lactate (12.5 mM) and uric acid (40 mM).
For the glucose assay, only the glucose sample generated a significant response (SBR of 3.2)
compared with the irrelevant targets and blank control (Figure 2-6b). Similarly, the lactate assay
only generated a substantial response to lactate (SBR of 4.1) with negligible signals from the
nonspecific analytes (Figure 2-6c). These results indicate that our sensor is capable of high
specificity measurements and suitable for multiplexed detection of multiple analytes with a low
likelihood of interference caused by nonspecific targets.
We designed a dual electrochemical sensor, with two sensors facing opposite to each
other (Figure 2-6a), for simultaneous measurements of glucose and lactate. One sensor was
functionalized with glucose oxidase and the other was functionalized with lactate oxidase. Using
this dual sensor, we first tested a sample containing only 40 mM of glucose. As shown in Figure
2-6d, only the glucose oxidase-functionalized sensor generated a significant signal, which is

30
consistent with the results from the individual assay measurements in Figure 2-6b. In contrast,
the lactate oxidase-functionalized sensor generated a negligible signal similar to that of the PBS
blank control. We also tested a 50 mM lactate sample using the dual sensor, and only the lactate
oxidase-functionalized sensor generated a significance response (Figure 2-6e), demonstrating the
high specificity of our dual electrochemical sensor.
Figure 2-6: (a) Close-up image of a dual electrochemical sensor for multiplexed analyte
detection. Specificity of the glucose assay (b) and lactate assay (c) using glucose (5 mM), lactate
(12.5 mM) and uric acid (40 mM) in PBS, and PBS (blank). Amperometric signals of a 40 nM
glucose sample (d), 50 mM lactate sample (e) and 40 mM glucose + 50 mM lactate sample (f)
using the dual electrochemical sensor. Each bar represents the mean ± SD of three separate
measurements which were obtained using new sensors.
For multiplexed detection, we prepared a sample containing 40 mM glucose and 50 mM
lactate and dispensed it onto the dual sensor chip. Two distinct signals were simultaneously
generated corresponding to the glucose and lactate targets (Figure 2-6f). These collective results
show that the signals generated for different analytes do not interfere with each other during
multiplexed measurements. By incorporating additional sensors in the array, it will be possible to
perform simultaneous measurements of numerous analytes from a single sample. While the dual

31
electrochemical sensor used in this work was designed to accommodate our electrochemical
analyzer, it is possible to design sensor arrays that can accommodate other commercial or custom
electrochemical instrumentation.
2.3.5 Glucose detection in whole blood
To further demonstrate the utility of this sensor for biomolecular detection, we tested its
performance for analyte measurements in whole blood. Blood samples spiked with glucose were
dispensed on the sensor and placed in the electrochemical reader (Figure 2-7a). Due to the higher
viscosity of blood compared with buffer, it took slightly longer (~30 sec) for the sample to
completely be absorbed by the electrodes. Similar to glucose measurements in PBS, this assay
exhibits a highly linear response (R2 = 0.992) from 0 mM to 40 mM (Figure 2-7b), which spans
the clinically relevant blood glucose concentrations in humans. Additionally, the low current at
0 mM indicates that this assay generates a minimal background signal even in complex
biological matrices. These results show that our embroidered sensor is capable of accurate
quantitative measurements of protein biomarkers in clinical samples and holds great potential for
POC testing.

32
Figure 2-7: (a) Embroidered sensor inside the electrochemical workstation during testing. (b)
Amperometric measurements of glucose in whole blood. Values are averaged over the final 10
sec of the detection signal. Each data point represents the mean ± SD of three separate
measurements which were obtained using new sensors.
2.3.6 Sensor durability testing
An important consideration for flexible sensors is the influence of mechanical
deformation on the detection performance. Specifically, textile sensors are inherently susceptible
to deformation (i.e. bending or folding) before and during testing and should be able to maintain
detection accuracy. To mimic such effects, we carried out two studies using our embroidered
biosensor. In the first study, we manually folded and flattened the sensor (as shown in Figure
2-8a) for up to 100 cycles, and performed measurements of lactate samples at intervals of 5, 10,
25, 50 and 100 folding cycles. By comparing the signals of sensors that underwent folding with
control sensors that did not undergo deformation (Figure 2-8b), we can see that there is
negligible change in the signal after 25 cycles, which is a reasonable limit for in vitro diagnostic
testing. Furthermore, there is only a marginal decrease of 7% and 9% in the signal after 50 and
100 cycles, respectively, which is tolerable for wearable sensing applications.
In the second study, we examined the sensor performance in response to deformation
occurring simultaneously while the measurement was being carried out. To experimentally
mimic this scenario, we performed measurements of lactate samples (0-50 mM) using sensors
which were manually bent at 90° while the signals were being recorded. Comparative signals
from sensors positioned flat in the reader (Figure 2-8c) and mechanically bent sensors (Figure
2-8d) are shown in Fig. 6e. While the signal of the bent sensors slightly diminishes at
concentrations above 25 mM, the signal maintains a highly linear response (R2
= 0.981)
throughout the tested concentration range, which is similar to that of the flat sensor.

33
Additionally, both the bent and flat sensors exhibit high accuracy as represented by the low SD
(< 6%) of multiple measurements. These data reveal that mechanical deformation during testing
has a minimal impact on the performance of our embroidered biosensor as the response from the
bent sensors is nearly identical to those from the flat sensors. These results also suggest that our
embroidered biosensor will be able to maintain its accuracy and reproducibly under instances of
repeated deformation for in vitro diagnostic testing or wearable sensing.
Figure 2-8: (a) Mechanical bend testing of embroidered electrochemical sensors. (b)
Amperometric measurements of lactate (50 mM) in PBS following up to 100 cycles of folding.
Images of the sensor positioned flat (c) and bent at 90° (d) in the reader. (e) Comparative
measurements of lactate using flat or bent sensors. Each bar represents the mean ± SD of three
separate measurements.

34
2.4 Summary
In this chapter, we presented the first demonstration of an embroidered electrochemical
sensor for quantitative biomarker measurements. This biosensor consists of electrodes fabricated
from conductive threads that are subsequently embroidered onto wearable fabrics. Based on this
approach, biosensor arrays can be rapidly produced with customized electrode geometries and
configurations. For proof-of-concept, we performed single analyte measurements of glucose and
lactate in PBS, which exhibited high specificity, a highly linear response and excellent accuracy.
A dual sensor was fabricated and employed for multiplexed measurements of glucose and
lactate, which exhibited similar performance as our single analyte assays. We further
demonstrated the utility of this platform for biomolecular detection by using it for glucose
measurements in whole blood samples, which exhibited excellent performance, thereby
showcasing its usefulness for clinical sample testing. Experiments to evaluate the performance of
our biosensor in response to mechanical deformation showed its capability to produce consistent
and accurate measurement in response to repeated folding/bending prior to and during testing. In
addition to its exceptional sensing performance, our embroidered biosensor is amenable to high-
volume production using existing manufacturing technologies which minimizes overall costs and
enables facile integration with inexpensive and wearable materials. These collective features
make our embroidered electrochemical sensors well suited for diagnostic applications requiring
rapid, accurate measurements on disposable and wearable platforms.

35
3. EMBROIDERED ELECTROCHEMICAL SENSORS ON GAUZE

36
3.1 Motivation
In Chapter 2, we introduced our novel sensor embroidery technology and demonstrated
the potential that our sensor can be used for multiplexed biomolecular detection on
cotton/polyester textiles. In this chapter, we apply this technology to fabricate sensors on wound
dressings for uric acid monitoring, which is a biomarker for wound severity. Chronic wounds are
a rapidly growing public health issue and place a significant burden on the healthcare system. In
the United States alone, it is estimated that chronic wounds affect 6.5 million people resulting in
annual treatment costs in excess of $25 billion [98]. One of the main challenges associated with
wound management is monitoring wound status which is largely based on visual inspection and
patient feedback [99]. Therefore, researchers have been developing wearable sensors to monitor
various physiological and biochemical parameters of wounds such as wound pH [48, 100],
bacterial metabolites [101–103], temperature [104, 105], moisture [106, 107] and endogenous
biomarkers [49, 108]. These devices, as well as most wearable chemical sensors, employ screen-
printed electrodes which are simple to fabricate, inexpensive and offer good analytical
performance. However, screen-printing is poorly suited for loosely woven materials, such as
gauze and wound dressing, due to their high porosity and textured surface. Furthermore, screen-
printed sensors on gauze are highly susceptible to damage resulting from mechanical stress and
deformation in response to the wearer’s movement.
In this chapter, we demonstrate a gauze-based embroidered biosensor for in situ
electrochemical measurements. This is made possible via a unique embroidery process which
enables the fabrication of robust, flexible electrodes on loosely woven materials including gauze
and wound dressing. For proof-of-concept, this sensor was used for quantitative measurements of
uric acid in simulated wound fluid. Uric acid is associated with oxidative stress and bacterial
37
infection within the wound area [49, 102, 109] and its levels in wound fluid is highly correlated
with wound severity, which makes its a useful indicator of wound status and infection [110,
111]. In addition to single measurements, embroidered sensors were used for continuous
measurements of uric acid for up to 7 hr demonstrating the utility of this platform for wound
monitoring. Lastly, we compare the durability of our embroidered biosensors with screen-printed
biosensors, and evaluate the effects of mechanical deformation on its analytical performance.
3.2 Experimental Design
3.2.1 Wound-simulated biochemical and reagents
Uric acid, glucose, L-lactate, creatinine, albumin and potassium ferrocyanide
(K3[Fe(CN)6]) were purchased from Sigma-Aldrich (St. Louis, MO). Uricase and Ringer’s
solution were purchased from Fisher Scientific (Pittsburgh, PA). DI water (18.3 MΩ-cm-1
) was
generated using a Barnstead Smart2Pure water purification system. PBS powder (pH 7.4) was
purchased from Sigma-Aldrich (St. Louis, MO) and prepared as directed using DI water.
Simulated wound fluid was freshly prepared by adding 17 g/L albumin to Ringer’s solution as
previously described [112]. Analytes were serially diluted in simulated wound fluid at room
temperature, and samples were freshly prepared prior to measurements.
3.2.2 Thread preparation and characterization
We used the same procedure discussed in Chapter 2 for tread preparation and
characterization. Briefly, each electrochemical sensor consists of three electrodes; a reference

38
electrode (RE), working electrode (WE) and counter electrode (CE), which was fabricated using
ink-coated thread. Briefly, polyester thread (Brothers International, Bridgewater, NJ) was soaked
in carbon or Ag/AgCl ink and cured at 120 °C for 40 min. Carbon-coated thread was used for the
WE and CE, and Ag/AgCl-coated thread was used for the RE. Soldering flux (Kester, Itasca, IL)
was applied to the Ag/AgCl thread using a flux pen prior to the ink coating process to minimize
oxidation of the ink.
3.2.3 Gauze sensor design and fabrication
Fabrication of gauze sensors share the similar process discussed in Chapter 2. Briefly, the
sensors were designed using AutoCAD software (Autodesk, Vernon Hills, IL), converted into an
embroidery file using SewArt software (S & S Computing), and embroidered onto gauze using a
Brothers SE400 computerized embroidery machine. A stabilizer (World Weidner, Ponca City,
OK) was used to improve the embroidery quality. After the electrodes were embroidered, the
stabilizer was removed and sensors were cut into individual pieces. Screen-printed sensors were
fabricated by screen-printing Ag/AgCl and carbon inks onto gauze using a Kapton stencil. The
stencil was designed using AutoCAD software and fabricated using a CO2 laser cutter (Universal
Laser Systems, Scottdale, AZ). After screen-printing, the sensors were heated for 4 min at 120˚C
and cut into individual pieces. Uricase solution (10 mg/mL) was drop cast on the WE and dried
for at least 1 hr prior to measurements. Prepared sensors were used immediately or stored at
ambient conditions for up to 3 days prior to experiments.

39
3.2.4 Wound monitoring measurements
Amperometric measurements were performed using a multichannel electrochemical
workstation (GeneFluidics, Inc. Irwindale, CA). For single measurements, 15 µL of sample was
dispensed from the backside of the sensor using a pipette, followed by the application of a 350
mV bias potential. Each measurement was performed using a new sensor. For uric acid
monitoring, 20 µL of sample was dispensed from the backside of the sensor using a pipette,
followed by amperometric detection at 350 mV and the application of 100 µL of Ringer’s
solution to flush the WE. Measurements were performed at 1 hr intervals using the same sensor.
All measurements were performed at room temperature under ambient conditions.
3.2.5 Statistical analysis
Each data point represents the mean standard deviation (SD) of three individual
measurements. A one-tailed Student’s t-test was used for comparison between flat and bent
sensors where a p-value < 0.05 was considered significant.
3.3 Results and Discussion
3.3.1 Fabrication of gauze-based biosensor
In this work, we used a computerized embroidery machine which offers high flexibility in
regards to sensor design, configuration and placement. In contrast to most wearable textiles,
gauze is highly porous and delicate making it difficult to embroider. Therefore, a stabilizer film
was used to enhance the rigidity of the gauze which greatly improved the embroidery quality.

40
Additionally, we optimized several embroidery parameters, such as the thread tension, stitch
angle, stitch length and stitch density, to enhance the quality of the electrodes. To accommodate
the stretchability of the gauze, the thread tension was adjusted to lowest setting, which
minimized tangling of the thread and generated uniform and consistent embroidered patterns.
The stitch angle is the angle between the stitching and the horizontal axis and influences the
weave pattern and robustness of the embroidered features. We found that a stitch angle of 30 –
45° improved the embroidery quality by increasing the strain of stitches without deforming the
underlying gauze. Stitch length and stitch density were optimized to 0.5 mm and 0.2 mm,
respectively, which resulted in good electrode uniformity while minimizing the electrical
resistance of the electrodes.
Figure 3-1: (a) Embroidered electrochemical sensors on gauze and wound dressing. Inset shows
a close-up image of the sensor. The dashed circle represents the sensing region. (b) Customized
embroidered electrochemical sensors on textile.
Using these optimized parameters, we were able to embroider electrochemical sensors
onto commercial gauze and wound dressing (Figure 3-1a). To demonstrate the flexibility of this
approach, we fabricated electrochemical sensors with various geometries and configurations

41
(Figure 3-1b). For example, multiple sensors can be fabricated for multiplexed detection or
electrodes with different sizes can be generated to accommodate commercial or custom
electrochemical instrumentation. Additionally, sensors can be customized into unique designs,
such as symbols or logos, making them less obtrusive and conspicuous.
Scanning electron microscopy (SEM) of the working electrode (WE) and reference
electrode (RE) was performed to study their surface morphology on gauze. SEM images were
captured using a JOEL 6620V scanning electron microscope at 10 kV at 30× or 5000×
magnification for both the RE and WE. From Figure 3-2b, d, we can observe that the stiches are
tightly-sewn together and firmly integrated into the underlying gauze which enhances the
electrical conductivity and robustness of the sensor. Furthermore, the interstitial spacing between
the stitches provides a high surface area for the liquid sample thereby enhancing the
electrochemical reaction and improving the detection signal. Close-up SEM images of the WE
and RE show that the threads are uniformly coated with carbon (Figure 3-2c) and Ag/AgCl
(Figure 3-2e) with good surface coverage even after undergoing the embroidery process.
Figure 3-2: (a) Embroidered electrochemical sensor on gauze. SEM images of the WE (b) and
RE (c) at 30× magnification. Scale bar, 500 μm. Close-up SEM images of carbon-coated thread
(d) and Ag/AgCl-coated thread (e) at 5000× magnification. Scale bar, 5 μm.

42
3.3.2 Analytical performance of embroidered gauze sensors
To evaluate the effectiveness of our embroidered gauze sensor for analytical sensing, we
used it for quantitative measurements of uric acid in simulated wound fluid. Samples were
dispensed on the backside of the sensor to simulate wound excretion and were quickly absorbed
by the sensors due to the high wettability of the thread and gauze. Amperometric measurements
were performed after 1 min, which was sufficient time for the sample to be fully absorbed and
generate a stable electrochemical reaction. As shown in Figure 3-3a, this uric acid assay exhibits
a lower detection limit of 100 µM and a highly linear response (correlation coefficient, R2 of
0.995) over the tested concentration range (100 – 800 µM) which encompasses the clinically
relevant levels in wound patients [113]. In addition, each data point exhibits small SDs of < 7%
over three individual measurements obtained using new sensors, which demonstrates the high
reproducibility of this sensor platform.
Figure 3-3: (a) Amperometric measurements of uric acid in simulated wound fluid. Values are
averaged over the final 10 sec of the detection signal. (b) Specificity of the uric acid assay using
simulated wound fluid samples containing glucose (2 mM), lactate (10 mM), creatinine (120
µM) and uric acid (400 μM), and non-spiked simulated wound fluid. Each bar represents the
mean ± SD of three separate measurements obtained using new sensors.
43
We also tested the selectivity of the uric acid assay by performing measurements of
samples containing other analytes. For these experiments, we used simulated wound fluid spiked
with glucose, lactate, creatinine and uric acid at concentrations of 2 mM, 10 mM, 120 µM and
400 µM, respectively, which is similar to physiological levels found in wound fluid [113]. As
shown in Figure 3-3b, only the uric acid sample generated a substantial signal (signal-to-
background ratio, SBR ~7), while the irrelevant targets generated negligible signals similar to
that of the non-spiked sample which was used as a blank control. These results suggest that our
embroidered gauze sensor is capable of highly specific measurements in complex biofluid
samples with a low likelihood of interference caused by nonspecific analytes.
3.3.3 Uric acid monitoring
To evaluate the utility of our gauze sensor for wound monitoring, we performed
continuous measurements of uric acid over the course of 7 hr using the same sensor. Uric acid in
simulated wound fluid (600 µM) was applied to the sensor every hour followed by amperometric
detection. In practice, several layers of gauze are typically wrapped over the wound for adequate
coverage and fluid drainage. To mimic this scenario, the sensor was wrapped around a gauze pad
and covered with an additional layer of gauze. After each measurement, 100 µL of Ringer’s
solution was applied to the sensor to flush the sensing region. As shown in Figure 3-4a, the
detection signals were consistent throughout the 7 hr experiment exhibiting a small coefficient of
variance (COV) of 0.05. These results indicate that our embroidered sensor can generate
consistent measurements for several hours which are adequate time between wound dressing
changings.

44
Figure 3-4: Uric acid monitoring over the course of 7 hr using simulated wound fluid spiked with
600 µM (a), and varying concentrations (b) of uric acid. Each data point represents the mean ±
SD of three separate measurements using three new sensors.
We also tested the performance of our sensor in response to dynamic changes in the
analyte concentration to more accurately mimic the wound healing process. Specifically, it has
been shown that uric acid levels in wound fluid significantly decrease later in the wound healing
processing due to catabolysis by microbial uricase [102]. To mimic this scenario, we performed
multiple measurements of samples containing different concentrations of uric acid over the
course of 7 hr using the same sensor. Samples containing 200 µM were initially dispensed,
followed by samples containing 600 µM at hours 2, 3, 4, 5 and 400 µM at hours 6 and 7. As
shown in Figure 3-4b, the sensor accurately responded to the dynamic changes of uric acid
concentration in the samples. Furthermore, the detection signals are consistent with those
generated from single measurements (Figure 3-2a) even after being exposed to multiple samples

45
with varying concentrations. These results indicate that our gauze sensor offers excellent
accuracy and repeatability, making it suitable for wound monitoring.
3.3.4 Durability of gauze-based biosensor
An important consideration for wearable sensors is the influence of mechanical
deformation on the analytical performance. To evaluate the mechanical durability of our
embroidered gauze sensor, we manually folded and flattened the sensors for up to 100 cycles
(Figure 3-5a, b) and performed measurements of uric acid (200 µM) in simulated wound fluid at
intervals of 5, 10, 25, 50 and 100 bending cycles. Measurements were also performed at the same
intervals using sensors that did not undergo folding. By comparing the detection signals from
folded and unfolded sensors (Figure 3-5c), we found no significant difference (p > 0.292) in the
analytical performance due to mechanical deformation for up to 100 bending cycles. To mimic
the mechanical stress on the sensor due to the wearer’s movement, we evaluated the analytical
performance in response to deformation occurring simultaneously while the measurement was
carried out. Amperometric measurements of uric acid in simulated wound fluid were performed
using sensors that were positioned flat (Figure 3-5d) and bent at 90° (Figure 3-5e, f) while the
signal was being recorded. As shown in Figure 3-5g, there is no significant difference (p >
0.181) in the detection performance between the two sets of sensors from 0 – 800 µM.
Furthermore, the signals generated from the bent sensors maintained a highly linear response (R2
= 0.994) similar to those of the flat sensors with low SDs (< 8%). across multiple measurements
using new sensors This collective data shows that mechanical deformation has a minimal impact
on the performance of our embroidered gauze sensor, suggesting that it will be able to maintain

46
high accuracy and reproducibility under instances of repeated deformation for wearable sensing
applications.
Figure 3-5: Bend testing of the embroidered gauze sensor. Images of the sensor before (a) and
after (b) folding. (c) Amperometric measurements of uric acid (200 μM) in simulated wound
fluid using folded (solid) and unfolded (striped) sensors. Images of the sensor positioned flat (d)
and bent at 90˚ (e, f), while wrapped around an arm. (g) Amperometric measurements of uric
acid in simulated wound fluid using flat (solid) or bent (striped) sensors. Each bar represents the
mean ± SD of three separate measurements using new sensors.
We also evaluated the mechanical resilience of our embroidered gauze sensor and
compared it with a screen-printed sensor by subjecting both sensors to mechanical stretching as
shown in Figure 3-6. For sensor stretching experiments, one end of the sensor was affixed to a
solid surface using a bar clamp while the other side was attached to a M&A Instruments digital
force gauge using a plastic spring clamp. While sensors can be screen-printed on gauze (Figure
3-6a), the electrodes begin to crack after a stretching force of 2.6 N (Figure 3-6b). In contrast,

47
there was no observable damage to the embroidered sensor at the same stretching force. Upon
further stretching, the embroidered electrodes remained intact with no damage even as the gauze
began to tear (Figure 3-6e). Cyclic voltammetry was used to investigate the electrochemical
performance of both sensors in response to mechanical stretching. Prior to stretching, the cyclic
voltammogram of the screen-printed sensor shows good electroactivity and similar performance
(i.e. reversibility, anodic peak currents) as the embroidered sensor. However, the screen-printed
sensor exhibits significant loss of functionality after stretching generating a nearly zero response
signal (Figure 3-6c). In contrast, the cyclic voltammograms of the embroidered gauze sensor
before and after stretching are nearly identical indicating that it exhibits excellent resilience
against mechanical stretching (Figure 3-6f).
Figure 3-6: Comparison of screen-printed and embroidered gauze sensors in response to
mechanical stretching. Images of a screen-printed sensor before (a) and after (b) stretching, and
corresponding cyclic voltammetry measurements (c). Arrows indicate electrode cracking due to
stretching. Images of an embroidered sensor before (d) and after (e) stretching, and
corresponding cyclic voltammetry measurements (f).

48
3.4 Summary
In this chapter, we have presented a unique embroidery method to fabricate robust,
flexible electrochemical sensors on gauze for rapid analytical measurements. This approach
offers high flexibility and customization in regards to sensor design and configuration, and is
readily amenable to existing manufacturing processes (i.e. embroidery) using off-the-shelf
materials (i.e. thread, gauze). Single and continuous measurements of uric acid in simulated
wound fluid show that this sensor offers excellent analytical performance for both in vitro testing
and wound monitoring. Experiments to evaluate the durability of our sensor showed its ability to
generate consistent and accurate results in response to repeated folding/bending before and
during measurements, and exhibit superior resilience against mechanical strain and deformation.
These collective features make our embroidered gauze sensor a promising technology for
wearable applications requiring rapid, accurate measurements on a disposable platform.

49
4. LIQUID-ACTIVATED TEXTILE–BASED BATTERIES

50
4.1 Motivation
In the previous two chapters, we introduced the development of robust, flexible,
embroidered electrochemical sensors on various types of textiles. For device testing,
amperometric measurements were performed using a benchtop electrochemical workstation
which requires an external power source. Although the workstation can provide accurate
detection measurements, it is bulky and impracticable for wearable biosensing applications. This
encourages us to realize the importance of flexible, lightweight components, particularly power
sources, for wearable sensor systems.
Commercial batteries (NiCd, NiMH, Li-ion) are typically comprised of rigid metallic
components and casings, which limit their integration with flexible materials. To address these
issues, new materials such as carbon nanotube/polyaniline composites [114] and carbon
nanotube films [82], have been explored for the development of flexible energy storage devices
[115]. Textile batteries have also been demonstrated which utilize poly(3,4-
ethylenedioxythiophene) (PEDOT)-coated textiles as either a solid electrolyte layer or electrode
[77, 116]. While these batteries offer portability and flexibility required for wearable sensor
systems, they still require additional circuitry for start/stop operation and are not suitable for
aqueous conditions.
An alternative type of battery that can meet these requirements is a liquid-activated
battery which turns ‘on’ when a liquid sample is applied to the cell. This unique scheme offers
useful advantages for some sensing applications where the liquid can be utilized for sampling
and device activation. Furthermore, it enables on-demand power generation which can simplify
the design and operation of the overall device. Previous groups have demonstrated liquid-

51
activated batteries fabricated on paper [117] and plastic [88] which are capable of 1.3 V (open
circuit) and 1.2 V with a 1 kΩ load, respectively.
For improved durability and integration with wearable materials, we developed two
generations of liquid-activated battery using textile. The first generation, liquid-activated battery
is fabricated based on the metal electrodes embedded in the textiles. Although this design has
achieved our goal of liquid activation and miniaturization, the use of metal films limits the
overall device robustness and flexibility. Therefore, we designed and fabricated a second-
generation, liquid-activated battery based on screen-printing electrodes. This battery is based on
a simple fabrication process which can be applied to an assortment of textiles and flexible
materials, enabling integration with low-cost diagnostics and wearable sensor systems.
Furthermore, this battery is compatible with various types of liquids (water, buffer solutions,
biofluid), broadening its versatility for chemical and biosensing applications.
4.2 First Generation Liquid-Activated Ag – Al Battery
4.2.1 Battery design and fabrication
An electrochemical cell (Figure 4-1) consists of three layers of textile sandwiched
between two metal electrodes (Ag and Al), which serve as the anode and cathode. Two of the
textile layers are impregnated with silver nitrate (AgNO3) and aluminum chloride (AlCl3)
respectively, which serve as dry electrolytes, and the third is impregnated with sodium nitrate
(NaNO3), which serves as a salt bridge. The cell is sheathed between two additional layers of
textile, which are affixed together using double-sided adhesive. When the cell is dry, the battery
is ‘off’. By applying an aqueous sample to the cell, the salt bridge and electrolyte layers become

52
hydrated, thus generating an electrochemical reaction and activating the battery. As shown in
Figure 4-1, the electrodes and electrolyte layers are roughly half the size of the salt bridge and
are offset to one side of the cell (directly underneath the sample inlet). This configuration enables
the salt bridge to become hydrated first so that the two half-cells can be simultaneously hydrated,
thereby balancing the electrochemical reaction. The chemical reaction for this battery at the
anode (oxidation) and cathode (reduction) are represented by equations (1) and (2), respectively:
Ag → Ag+ + e
- (1)
Al3+
+ 3e- → Al (2)
Figure 4-1: Schematic of the electrochemical cell and the liquid activation process.
To fabricate the battery, Ag and Al foil were cut using scissors and textile was cut using a
Universal Laser Systems CO2 laser cutter. To generate the electrolyte layers and salt bridge,
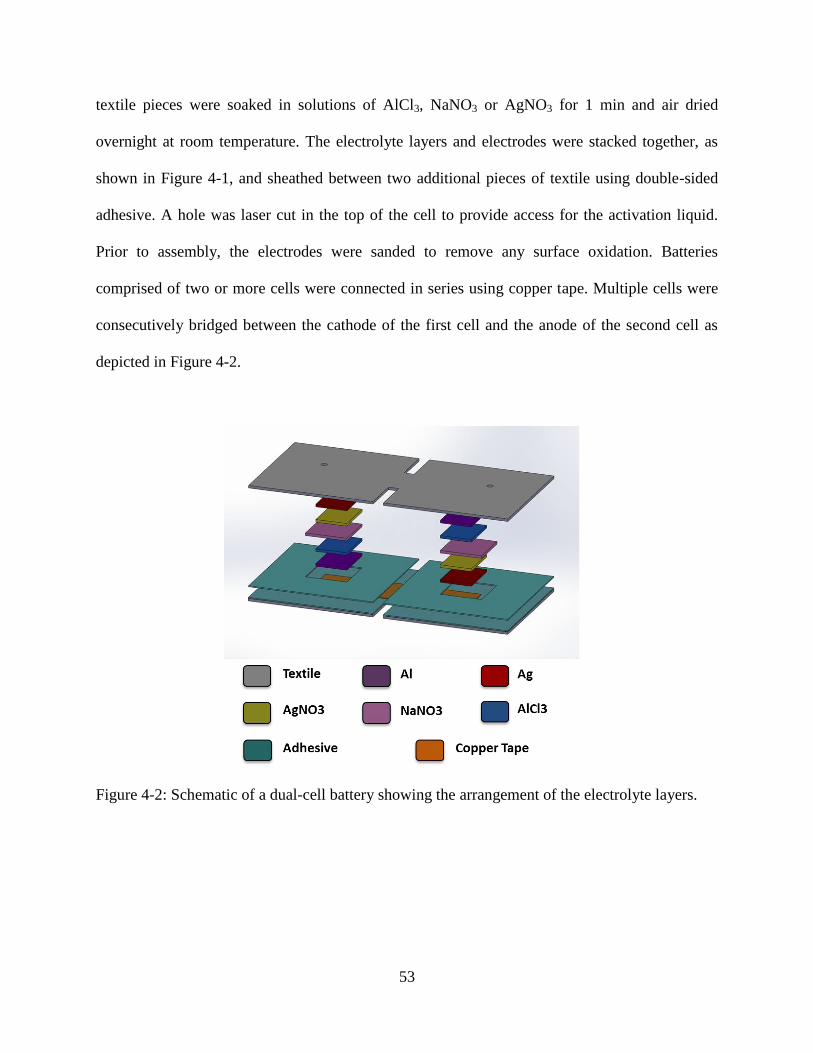
53
textile pieces were soaked in solutions of AlCl3, NaNO3 or AgNO3 for 1 min and air dried
overnight at room temperature. The electrolyte layers and electrodes were stacked together, as
shown in Figure 4-1, and sheathed between two additional pieces of textile using double-sided
adhesive. A hole was laser cut in the top of the cell to provide access for the activation liquid.
Prior to assembly, the electrodes were sanded to remove any surface oxidation. Batteries
comprised of two or more cells were connected in series using copper tape. Multiple cells were
consecutively bridged between the cathode of the first cell and the anode of the second cell as
depicted in Figure 4-2.
Figure 4-2: Schematic of a dual-cell battery showing the arrangement of the electrolyte layers.

54
4.2.2 Battery characterization
(i) Influence of electrolyte concentration on output current
Experiments were performed to investigate the influence of the electrolyte concentration
on the short-circuit current of the cell. To balance the reaction rate (Ag loses one electron while
Al gains three electrons) and maximize the efficiency of the half-reaction, the concentration of
AlCl3 was fixed at a 3:1 ratio with AgNO3. As shown in Figure 4-3, there is a linear correlation
between the output current and the concentration of AgNO3 from 1.5 M to 4.5 M. For AgNO3
concentrations above 4.5 M, the output current levels off to ~58 mA, which is likely due to the
saturation of the electrolyte species. This can also be attributed to the high viscosity of AgNO3
solutions > 4.5 M which limits its ability to be absorbed by the textile.
Figure 4-3: Maximum output current versus AgNO3 concentration for a single-cell battery
activated using 20 µL of DI water. Each data point represents the mean ± SD of three
measurements.

55
(ii) Evaluating the battery performance
We first investigated the influence of liquid type on the battery performance by activating
a single cell using four different types of liquids and measuring the maximum output current.
The tested liquids were DI water (pH 6.5), tap water (pH 7), PBS (pH 7.3), and artificial sweat
(pH 4.6). As shown in Figure 4-4, no noticeable difference in the output current was observed for
these four liquids. These results indicate that the pH of the activation liquid has a negligible
impact on the electrochemical kinetics, suggesting that this battery technology can be useful for
various sensing applications that utilize different types of samples including water, buffer
solutions and biofluid.
Figure 4-4: Maximum current from a single-cell battery activated using 20 µL of sample. Each
bar represents the mean ± SD of three measurements.
Another parameter that was studied was the battery activation time which was carried out
by monitoring the temporal trend of the VOC. Within 10 sec of dispensing the liquid in the cell,
the battery becomes fully activated where the VOC rapidly jumps from 0 V to 1.3 V. A steady
voltage of 1.3 V can be maintained for ~15 min after which point, it gradually decreases with

56
time dropping to ~0.9 V after 40 min (Figure 4-5). We attribute this drop-in signal to the
evaporation of the liquid which reduces the volume of the electrolyte solution and the effectively
contact area between the electrode and electrolyte layers. The battery can be reactivated (at 1.3
V) after being completely dried by simply adding more liquid to the cell. The re-activation
response follows a similar trend as its initial activation with a slightly faster voltage drop. This
process can be repeated several times until the chemical species are completely consumed. This
functionality illustrates the on-demand power generation capability of our liquid-activated
battery where current is generated only when the cell is hydrated. When the liquid has
evaporated, the electrochemical reactions cease and the battery automatically turns ‘off’.
Figure 4-5: VOC versus time for a single-cell battery activated using 20 µL of DI water.
Based on the results presented above, a single-cell can generate a VOC of 1.3 V, which is
approximately half of the theoretical value of 2.4 V. We attributed this loss to the high internal
resistance of the cell due to its extensive utilization of textile which is inherently non-conductive.
Additionally, poor contact between the textile layers and electrodes contributes to a higher

57
internal resistance. To generate higher voltages, we fabricated batteries consisting of multiple
cells connected in series. As shown in Figure 4-6, there is a linear correlation between VOC and
the number of cells with an average value of 1.0 V per cell (R2 = 0.987). This is ~23% lower
than the VOC for a single-cell battery (1.3 V), which can be attributed to the added resistance
from connecting multiple cells and higher rates of fabrication-associated defects, as mentioned
above.
Figure 4-6: VOC versus number of cells activated using 20 µL of DI water for each cell.
For proof-of-concept, we used a dual-cell battery to power a 1.6 V LED, which could
remain lit for up to 30 min (Figure 4-7). Considering that the duration of sensing measurements
typically range from tens of seconds to a few minutes [35], this battery can provide sufficient
power for multiple independent measurements or continuous temporal sampling over long
durations.

58
Figure 4-7: A dual-cell battery is powering a LED using 20 µL of DI water for each cell. Inset
shows the LED in the 'off' state for comparison.
4.2.3 Summary
We have successfully developed a liquid-activated Ag-Al textile battery. Through
optimizing various battery parameters, a steady output voltage of 1.3 V was achieved using a
single cell. Higher voltages were obtained by connecting multiple cells in series, where a
quadruple-cell battery could generate ~3.8 V. A unique feature of this battery is its ability to
generate power on-demand, which can minimize its size and simplify operation. This capability
also makes this battery suitable for sensing applications requiring multiple independent
measurements or continuous temporal sampling over long periods of time. For proof-of-concept,
a dual-cell battery was used to power a LED, which could remain lit for 30 min.

59
4.3 Second Generation Liquid-Activated Ag – Zn Battery
While the first generation, liquid-activated battery demonstrates the feasibility of this
approach, this design suffers from a few limitations including limited flexibility, poor stability
and non-uniformity issues. To overcome these limitations and improve the functionality of the
battery, we have designed the second generation battery by combining the microfluidics and
screen-printing fabrication methods. We choose screen-printing technology to fabricate our
battery electrodes because they can be easily integrated with our biosensors that will be
fabricated using the same technology. To simplify the battery design, we take advantage of Ag –
Zn battery scheme, since electrolyte and salt bridge can be used with the same chemical (NaOH).
Furthermore, Ag and Zn inks can be either commercially purchased or easily synthesized in the
lab.
In this study, we fabricate a screen-printed Ag – Zn battery which not only provides high
flexibility in configuration of the battery cells, but also meet powering requirements of the
biosensor system. The cells are screen-printed on commercially available Evolon fabric which
serves as the substrate for both electrodes and microfluidic channels. Photolithography method is
used to fabricate the microfluidic channels for the liquid flow into the cells and the battery
activation.
4.3.1 Battery design and fabrication
(i) Battery design and fabrication
An electrochemical cell (Figure 4-8) consists of two screen-printed electrodes: anode
(Silver, Ag) and cathode (Zinc, Zn). Sodium hydroxide (NaOH) is used as both electrolyte and
salt bridge. As shown in Figure 4-8, the electrodes and electrolyte layers are fabricated by

60
stacking two layers of Evolon fabrics together. On one fabric layer, we fabricate screen-printed
electrodes using Ag and Zn inks for the electrodes, and carbon ink as current collector for the
zinc electrode. On the other fabric layer, we fabricate microfluidic channels using
photolithography method and drop cast the electrolyte in the desired areas. When the cell is dry,
the battery is ‘off’. By applying an aqueous sample to the system inlet, the sample will flow
along the channels due to the capillary force in the fabric and rehydrate the electrolyte areas. As
a result, the electrochemical reaction is generated, and the battery is activated. The chemical
reaction that takes place inside the battery is the following:
Zn + Ag2O → ZnO + 2Ag
Figure 4-8: Schematic of single-cell battery showing the arrangement of the electrolyte layers.
(ii) Electrodes fabrication
The Ag and Zn electrodes were fabricated using a stencil-printing technique with a
0.005’’ thick Kapton® polyimide film (McMaster-Carr, Aurora, OH). The patterns were
designed using Autodesk AutoCAD software, and then cut into a mask using a Universal Laser
Systems CO2 laser cutter. The laser-cut film was placed on the fabric for screen-printing.

61
Individual Ag, Zn and carbon inks were pressed inside the openings on the mask with the help of
a squeegee to fabricate different electrodes respectively on the fabric, and then baked in the oven
at 120 °C for 5 min to remove the solvent.
(iii) Microfluidic channel design and fabrication
For the purpose of on-demand battery activation, we designed microfluidic channels on
the fabric to connect multiple electrolyte cells, so that all the cells can be activated
simultaneously. A microfluidic system consisting of micro-channels and reservoirs was designed
using Autodesk AutoCAD software. The pattern design was transferred onto a 3M-transparency
film by a laser printer. As shown in the figure, the system consists of one inlet and five
electrolyte cells, which are connected by the micro-channels. When the liquid is applied onto the
inlet, it will start wicking along the channels and arrive at five electrolyte cells within 1 min.
Figure 4-9: Microfluidic channel on fabric fabrication steps used in photolithography.

62
To create hydrophilic channels and reservoirs on the Evolon® nonwoven fabric, a
negative photoresist, SU-8 3050, is used to create hydrophobic barriers on the fabric. SU-8
polymer can be readily coated on the fabric due to fabric’s inherent absorbent structure.
First, approximate 3 ml of SU-8 3050 negative photoresist polymer was poured onto the
nonwoven fabric, and evenly coated over the fabric with a squeegee. The SU-8 polymer can
permeate fully through the fabric within 1 min. The excess SU-8 was removed from the fabric
with a squeegee. Then, the SU-8 coated fabric was soft baked at 100 °C for 1 hr, and cooled to
the room temperature.
Second, the SU-8 coated fabric was sandwiched by two transparency films. The film with
patterns printed by the laser printer was placed on the top of the fabric, while the film without
any patterns was placed underneath the fabric. Subsequently, the film-fabric-film assembly was
exposed under UV light for 1.5 min through the top mask film, then flipped and exposed under
UV light for 0.4 min through the bottom mask film to obtain a complete hydrophobic, leak-proof
surface. After UV exposure, fabric was transferred on a hot plate at 100 °C for 5 min post bake
to cross-link the exposed portions of the photoresists.
Last, a wet etching process was performed to remove unpolymerized SU-8 by
submerging the fabric into acetone solution for 5 min. This is followed by rinsing the fabric with
isopropyl alcohol to clean the organic solutions from the fabric surface. After the wet etching
process, the fabric was hard baked at 65°C for 1 hr in a convection oven to fully crosslink the
photoresist. The fabrication steps are shown in Figure 4-9.

63
(iv) Electrolyte preparation
For our liquid-activated Ag – Zn battery, we used 5M NaOH solution as both electrolyte
and salt bridge of the battery. The electrolyte solution was drop-casted directly onto the battery
cell reservoirs, and then dehydrated in a glove box filled with Argon gas.
(v) Battery assemble
Figure 4-10: Photos of two layers of the battery. The left figure shows fabricated microfluidic
channel with 5 electrolyte cells in textile using photolithography methods. The right figures are
screen-printed electrodes which consists of 5 battery cells connecting in series.
4.3.2 Battery characterization
(i) Battery discharging characterization
The discharging characteristics of the battery can be carried out by connecting an
assembled battery to Keithley 6430 Sub-Femtoamp Remote SourceMeter, which is considered as
a specific load that pulls the energy out of the battery with certain amount of current. We started

64
the characterization process with a single battery by discharging this battery with different
draining currents, including 1, 5, 10, 25, 50, 60, 75 and 100 µA respectively. By recording the
time period that takes the voltage of a battery dropping to 0.2 V at each specific draining current,
we can calculate the capacitance of the battery for each current.
In the Figure 4-11a, we found that as the draining current increases from 1 to 10 µA, the
time period for battery discharge decreases from ~2 to 1 hr. We calculated and plotted the
battery capacitance relied on the current (Figure 4-11b). From the figure, the capacitance of the
battery firstly increased to the maximum when the draining current is 50 µA. Then, increasing
the draining current will decrease the battery capacitance. Therefore, to maximize the battery
usage for powering wearable sensor tests, 50 µA is the best current to drain the battery and store
all the energy in a power storage device. This discharging performance of the battery will help us
design the regulation circuit for our biosensor system.
Figure 4-11: Discharging characterization with different external loadings. (a) Discharging curve
of the battery through Keithley SourceMeter at 1, 5, 10, 25, 50 µA. (b) With the discharging
curve, a relationship curve of battery capacities versus different loadings was plotted according
to ohms’ law.

65
(ii) Characterization of duty cycles versus battery life
It is important to understand the usage pattern of battery for determining the overall
current drain on the battery. For portable telecommunication equipment, standby mode, receive
mode and transmit mode typically take around 80%, 10% and 10% of the total operation time
respectively. Therefore, we characterized the battery life with different duty cycles (4%, 8%,
16% and 32%) by discharging a single battery with optimized draining current of 50 mA. As the
duty cycle increased exponentially, the battery life decreased from 6000 sec down to 1500 sec.
Figure 4-12: Characterization of battery lifetime versus duty cycles. Inset indicates the
calculation of battery duty cycles.
4.3.3 Summary
In this chapter, we have successfully developed two generations of liquid-activated,
textile batteries. Compared to the first generation, the second generation battery was fabricated
via screen-printing for enhanced flexibility for wearable applications. To prevent electrolyte

66
migration, we used photolithography to fabricate hydrophobic barriers on textiles to separate
each battery cell. Through optimizing various battery parameters, a steady output voltage of 1.3
V was achieved from a single cell. Higher voltage or current can be obtained by connecting
multiple cells in series or parallel with high design flexibility. Considering the battery is to be
used to power a custom, miniature electrochemical circuit (aMEASURE2), we also characterized
the draining current versus the battery capacitance, as well as the duty cycles versus the battery
life. This battery is specifically designed for diaper-based wearable sensor for XOx detection. A
unique feature of this battery is its ability of on-demand power generation that fits with diaper
padding for simple operation. This capability also makes this battery suitable for sensing
applications requiring multiple independent measurements or continuous temporal sampling for
long-term monitoring. The battery will be tested for powering aMEASURE2 in Chapter 5 with a
regulation circuit. In addition to its excellence performance, this battery can be easily integrated
with fabrics and flexible materials, and reduces the overall size, weight and complexity of POC
biosensors and wearable sensor systems.

67
5. INTEGRATED, SELF-POWERED, TEXTILE WEARABLE
BIOSENSOR SYSTEM

68
In the last chapter, we presented the development of a liquid-activated textile battery for
powering wearable biosensor systems. The textile nature of the battery offers enhanced
flexibility and simplified integration with textile-based biosensors towards a self-powered,
wearable sensing system. The main advantages of such a system over benchtop devices are: (i)
No external power source is required for the sensor and circuit operation, which makes it easier
for system miniaturization, and (ii) as the system can be self-powered by biological fluids, it can
be autonomously activated by the sample matrix.
In this chapter, we present the development of a fully integrated, textile-based, wearable
sensing system incorporating the battery, biosensor and detection circuit. For proof-of-concept,
this platform was used for rapid measurements of xanthine oxidase (XOx), a biomarker
correlated with urinary tract infections (UTIs) [118, 119].
5.1 Experimental
5.1.1 XOx sensor design and fabrication
(i) Detection scheme
The detection scheme of the XOx assay is illustrated in Figure 5-1. HX is immobilized on
the WE. When the urine sample is applied to the sensor, XOx in the urine catalyzes HX and
generates Xanthine and H2O2. Since H2O2 is a strong oxidizing agent, with applied potential, 2e-
was generated and this current flow can be measured through the sensor. The detection scheme
can be represented by the following equation [120]:

69
Thus, the electrochemical signal resulting from electro-oxidation can be captured by
aMEASURE2 or other electrochemical measurement devices.
Figure 5-1: Schematic illustration of the XOx detection scheme.
For this system, we decided to employ a screen-printed sensor which is amenable with
our textile battery, thus facilitating device integration. In order to protect the electrodes from the
aqueous sample and minimize crosstalk between electrodes, we incorporated an insulation layer
on top of the electrical contacts. This was accomplished by pattering dielectric ink over the
electrodes via screen-printing.
(i) Materials and methods
HX, XOx, urea, creatinine, glucose, sodium hydroxide (NaOH) pellet, hydrogen chloride
(HCl), phosphate buffer (PBS) were purchased from Sigma Aldrich (St. Louis, MO).
Silver/silver chloride (Ag/AgCl) ink, carbon ink and thermal dry dielectric ink were purchased

70
from Conductive Compounds Inc. (Hudson, NH). 0.005” thick Kapton® polyimide film was
purchased from McMaster-Carr (Aurora, OH).
Simulated urine was prepared by adding 9.3 g/L urea, 0.67 g/L creatinine, 0.04 g/L
human serum albumin and 0.15 g/L glucose into PBS. XOx lyophilized power was dissolved in
the simulated urine to make 16,000 U/L stock solutions, and different concentrations of samples
were prepared by diluting XOx stock solution into the simulated urine. For amperometric
measurement, a multichannel electrochemical workstation (GeneFluidics, Inc. Irwindale, CA)
was used to establish the calibration curve and determine the sensor specificity. Samples were
freshly prepared prior to experiments and remaining biochemicals were used without further
purification.
HX solution was prepared by adding 5 mg HX powder into 1 mL DI water and mixing
well with vortex in a centrifuge tube. Couple drops of 1 M NaOH solution were added into the
centrifuge tube, and then pH value of the solution was adjusted to 8 by adding 1% HCl solution.
Both NaOH and HCl solutions were prepared with DI water.
(ii) Sensor fabrication
A laser cutting system was used to fabricate stencils with high consistency, precision and
efficiency. Electrochemical sensors were fabricated by screen-printing Ag/AgCl ink and carbon
ink onto textiles as shown in Figure 5-2. The electrode geometry was designed using Autodesk
AutoCAD software. The RE was printed using Ag/AgCl ink and baked for 3 min at 120 °C. The
WE and CE were printed using carbon ink and baked for 3 min at 120°C. Next, thermal
dielectric ink was printed on top of the Ag/AgCl and carbon layer to insulate the entire sensor,
except for the detection region of contact pads. This insulation layer is used to eliminate

71
crosstalk between electrodes due to the long leads and possible liquid coverage when using and
define the WE for drop-casting 5 µL of HX solution to complete the sensor fabrication.
Figure 5-2: (a) Schematic of fabricating XOx electrochemical sensor; (b) A picture of a screen-
printed biosensor for XOx detection.
(iii) Electrochemical measurements
To evaluate the effectiveness of our screen-printed biosensor for analytical sensing, we
used it for quantitative measurements of XOx in the simulated urine samples. Amperometric
measurements were performed using both Genefluidics multichannel electrochemical
workstation for creating the initial calibration curve and aMEASURE2 for sample
measurements. For XOx measurements, 60 µL of sample was dispensed onto the detecting
region using a pipette, followed by the application of a 250 mV bias potential after 5 min, which
was sufficient time for the sample to be fully absorbed to generate a stable electrochemical
reaction.

72
(iv) Statistical analysis
Each data point represented the mean SD of three individual measurements. A one-
tailed Student’s t-test was used for comparison between two conditions, where a p-value < 0.05
was considered significant.
5.1.2 Development of aMEASURE2
Figure 5-3: A photograph of aMEASURE2 next to a quarter.
A customized detection circuit, named aMEASURE2 (Figure 5-3), was developed by
Sina Parsnejad from Prof. Mason’s group in the Department of Electrical and Computer
Engineering at MSU to perform amperometric measurements and signal processing (Figure 5-3)
[121], [122]. This circuit is comprised of an analog readout, a microcontroller, and a physical-
electrical interface between biosensor and computer. The circuit can provide a current signal
from 0.94 nA to 2.4 mA, and automatically adapt to responding current levels. The circuit

73
consumes low power (7 mAh), so it can be powered by the regulated current from our liquid-
activated battery. The biosensor is connected to aMEASURE2 via small flat alligator clips.
5.1.3 Regulation circuit
Figure 5-4: A photograph of battery management evaluation module board from Texas
Instruments.
In order to power aMEASURE2 by the liquid-activated battery, it requires a regulation
circuit to assist with collecting the power from the battery and releasing the power to
aMEASURE2 for measurements. To achieve this functionality, we used an ultra-low power
boost converter with battery management for energy harvester evaluation kit from Texas
Instruments (BQ25504 EVM) (Figure 5-4). The device is specifically designed to efficiently
acquire and manage the microwatts (µW) to miliwatts (mW) of power generated from a variety
of DC sources like photovoltaic (solar) or thermoelectric generators. The start input voltage for
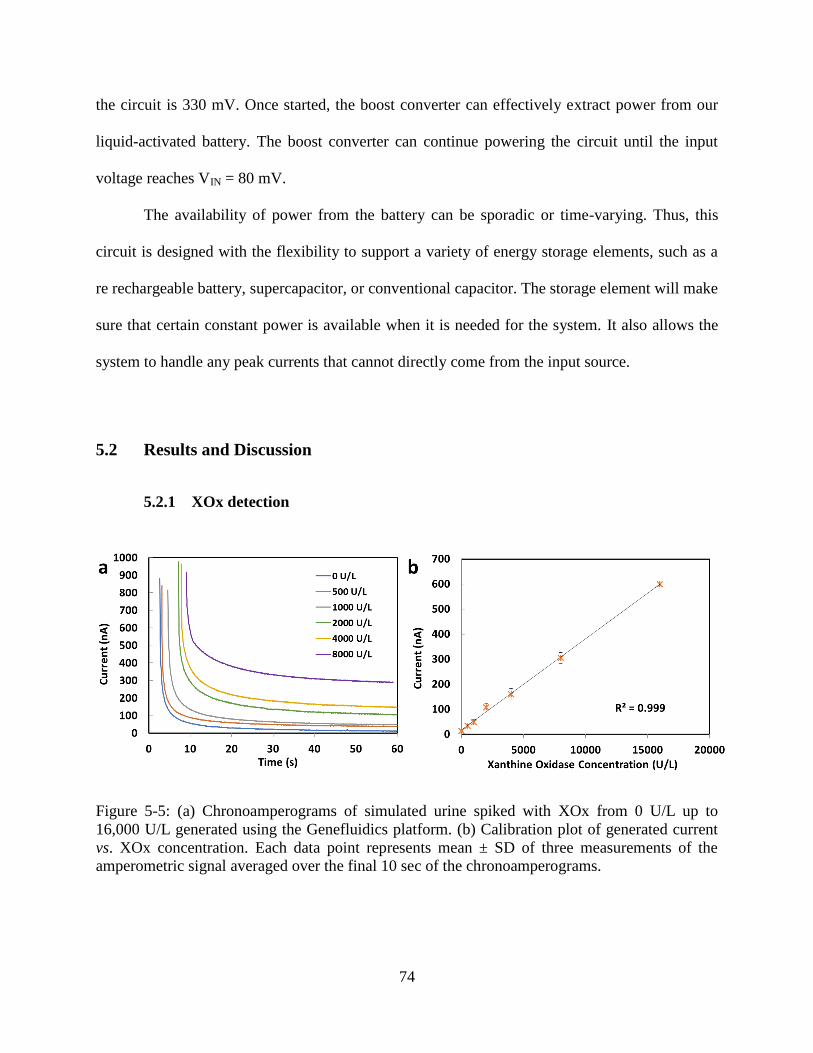
74
the circuit is 330 mV. Once started, the boost converter can effectively extract power from our
liquid-activated battery. The boost converter can continue powering the circuit until the input
voltage reaches VIN = 80 mV.
The availability of power from the battery can be sporadic or time-varying. Thus, this
circuit is designed with the flexibility to support a variety of energy storage elements, such as a
re rechargeable battery, supercapacitor, or conventional capacitor. The storage element will make
sure that certain constant power is available when it is needed for the system. It also allows the
system to handle any peak currents that cannot directly come from the input source.
5.2 Results and Discussion
5.2.1 XOx detection
Figure 5-5: (a) Chronoamperograms of simulated urine spiked with XOx from 0 U/L up to
16,000 U/L generated using the Genefluidics platform. (b) Calibration plot of generated current
vs. XOx concentration. Each data point represents mean ± SD of three measurements of the
amperometric signal averaged over the final 10 sec of the chronoamperograms.

75
In order to measure XOx levels from clinical urine samples, it is necessary to build a
calibration curve which correlates amperometric signals with XOx concentrations. Simulated
urine samples with XOx ranging 0 – 16,000 U/L were dispensed on the detecting region of the
sensors. After 5 min of incubation, amperometric measurements were performed using a
benchtop electrochemical workstation. As shown in Figure 5-5a, amperometric signals at
different XOx concentrations were clearly distinguishable from non-spiked simulated urine (0
U/L). All signals exhibited smooth responding profiles with minimal background signal. Each
measurement was taken over 60 sec, and final 10 sec was averaged to generate the dose-response
profile (Figure 5-5b). The XOx measurements exhibited a highly linear response over the entire
concentration range with a R2 correlation coefficient of 0.999. In addition, it exhibited a low
background signal at 0 U/L and small SDs of < 3% among three individual measurements, which
demonstrates the high accuracy and reproducibility of this assay.
5.2.2 Integration of sensor and aMEASURE2
Figure 5-6: (a) Integration of the screen-printed sensor with aMEASURE2 via flat alligator clips.
(b) Calibration plot of generated current vs. XOx concentration using Genefluidics platform
(blue) and aMEASURE2 circuit (orange). Each bar represents the mean ± SD of three separate
measurements using new sensors.

76
Based on the calibration curve constructed using the Genefluidics platform, we integrated
the screen-printed biosensor with aMEASURE2 for measuring XOx from urine samples. We
connected our sensor to aMEASURE2 measuring channels with flat alligator clips (Figure 5-6a),
and then set the applied potential to 350 mV via the computer connected to the aMEASURE2.
To evaluate the performance of the integrated system, we performed amperometric
measurements using simulated urine samples spiked with different concentrations of XOx. As
shown in Figure 5-6b, there is no significant (p > 0.043) in the signal between aMEASURE2 and
the Genefluidics platform. Similar to the results obtained from the Genefluidics platform, the
calibration curve generated from the integrated system also exhibited a highly linear response
(R2 = 0.997) throughout the entire concentration range, which demonstrated that aMEASURE2
circuit can work properly with our biosensor for XOx detection.
Figure 5-7: (a) Calibration plot of generated current vs. XOx concentration using aMEASURE2.
Each data point represents mean ± SD of three measurements of the amperometric signal
averaged over the final 10 sec of the chronoamperograms. (b) Chronoamperograms of two
patient urine samples, one is negative and the other is infected with E. Coli.
To evaluate the clinical utility of our integrated biosensing platform, we performed
measurements of XOx in fourteen urine samples obtained from Sparrow Laboratories (Lansing,

77
MI). These samples were sourced from existing specimens collected for urine culture and were
de-identified of all patient information. Urine samples were tested using the same procedure for
generating the calibration curve (Figure 5-7), and the final results were obtained by averaging the
current values over the last 10 sec of amperometric measurements from our sensors. We also
tested the urine samples using UTI test strips from Tbuymax, which is a colorimetric assay
measuring the levels of leukocytes, nitrites and pH.
Table 5-1: Comparison of results achieved from urine culture, our biosensing platform and urine
test strips.
Sample
No.
Urine Culture Biosensor Test Strips
Bacterial Type Result XOx Concentration (U/L) Result
1 No growth Negative 393.69 Negative
2 Mixed Negative 493.32 Negative
3 Mixed Negative 665.43 Positive
4 Mixed Negative 611.08 Negative
5 No growth Negative 1,987.89 Negative
6 P. Aerug + Achr.
Xylosoxidans + MF
Positive 420.86 Negative
7 Mixed Negative 1,272.31 Negative
8 C. Alb Positive 284.99 Negative
9 C. Koseri + Mixed Positive 9,053.11 Negative
10 No growth Negative 8,799.48 Positive
11 No growth Negative 25,429.92 Positive
12 Enterococcus + MF Positive 10,611.08 Positive
13 No growth Negative 178.21 -
14 E. Coli Positive 8,098.45 -
In Table 5-1, we compare the results for each sample obtained from a urine culture
(provided by Sparrow Laboratories), our biosensing platform and the UTI test strips. In the urine
culture results, ‘No growth’ indicates no significant pathogen growth. The test result with a given

78
name for specific pathogen type (e.g. C. albicans) indicates UTI as positive, and susceptibility
testing should be performed to guide subsequent treatment. For the test result of ‘Mixed’, the
growth is from mixed flora likely due to contamination. As shown in Table 5-1, there was a
moderate (71.4%) correlation between the XOx concentration and the urine culture results where
samples with a “No growth” or “Mixed” urine culture result contained low (< 2,000 U/L)” levels
of XOx, and samples with a “Positive” urine culture result contained high (> 2,000 U/L) levels of
XOx. Based on these cutoff values, there is a 71.4% correlation between the XOx concentration
and the test strip results.
5.2.3 Integration of the sensor, aMEASURE2 and the battery
Figure 5-8: Schematic illustration of the integrated “smart diaper” system.
A schematic illustration of the integrated system is shown in Figure 5-8. To provide
enough power to the sensing unit, the battery consisted of 9 cells. Every three cells were

79
connected in series in a 3-cell battery format providing ~4 V of potential, and then three 3-cell
batteries were connected in parallel to triple the output current. To integrate the power unit, we
connected the liquid-activated battery to the J1 jack, input source (+) and input source return (-)
of the regulation circuit. For best use of the battery, we connected a 100 mF supercapacitor to the
J2 jack, battery connection (+) and battery connection return (-) of the regulation circuit. Once
the battery was activated, the regulation circuit can pull the power out of the battery, and
temporarily store it in the supercapacitor. The whole process took ~5 min to completely store all
the energy from the battery into the supercapacitor.
Figure 5-9: Charging and discharging curve of the supercapacitor using a 9-cell liquid-activated
battery.
As the potential of supercapacitor reaches to the same level as the regulation circuit
output, the charging process is completed, and the amperometric measurement is initiated
through aMEASURE2, which is controlled by a laptop through the USB-based interface. A
charging and discharging curve shown in Figure 5-9 demonstrates that the supercapacitor is fully
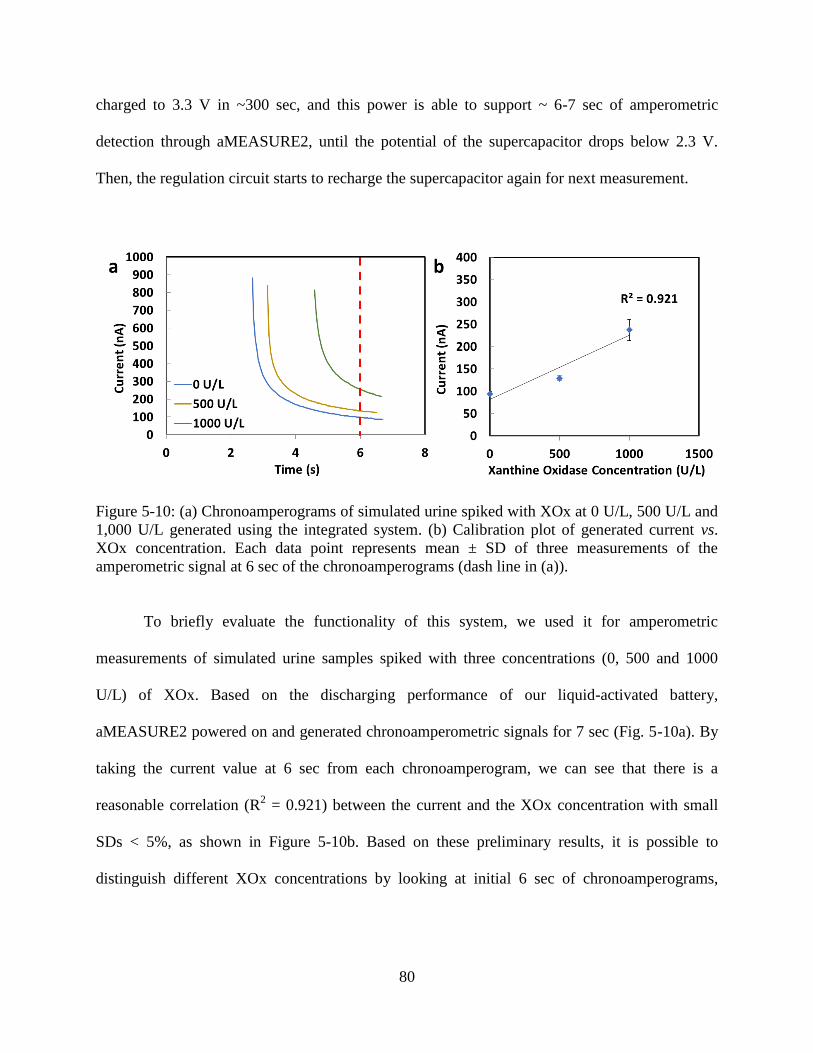
80
charged to 3.3 V in ~300 sec, and this power is able to support ~ 6-7 sec of amperometric
detection through aMEASURE2, until the potential of the supercapacitor drops below 2.3 V.
Then, the regulation circuit starts to recharge the supercapacitor again for next measurement.
Figure 5-10: (a) Chronoamperograms of simulated urine spiked with XOx at 0 U/L, 500 U/L and
1,000 U/L generated using the integrated system. (b) Calibration plot of generated current vs.
XOx concentration. Each data point represents mean ± SD of three measurements of the
amperometric signal at 6 sec of the chronoamperograms (dash line in (a)).
To briefly evaluate the functionality of this system, we used it for amperometric
measurements of simulated urine samples spiked with three concentrations (0, 500 and 1000
U/L) of XOx. Based on the discharging performance of our liquid-activated battery,
aMEASURE2 powered on and generated chronoamperometric signals for 7 sec (Fig. 5-10a). By
taking the current value at 6 sec from each chronoamperogram, we can see that there is a
reasonable correlation (R2 = 0.921) between the current and the XOx concentration with small
SDs < 5%, as shown in Figure 5-10b. Based on these preliminary results, it is possible to
distinguish different XOx concentrations by looking at initial 6 sec of chronoamperograms,

81
which suggests that our integrated system can potentially be used to detect XOx in clinical urine
samples.
Figure 5-11: A mock prototype of a “smart diaper” platform for urine XOx monitoring.
Towards the realization of a “smart diaper” platform for monitoring XOx levels in urine,
we integrated the textile-based components and detection circuit onto a disposable diaper, as
shown in Figure 5-11. Sensor and battery units were fabricated on textile pieces and embedded
into the diaper, and potentially can be directly screen-printed onto the diaper surface. The
biosensor and battery are located in the center of the diaper to ensure receiving sufficient liquid
sample for both battery activation and XOx detection. The miniaturized regulation circuit and
aMEASURE2 are connected to the battery and sensor, respectively, via screen-printed electrical
leads. As the battery is activated, the regulation circuit will start pulling the energy from battery
and store it into the supercapacitor. When the supercapacitor is fully charged, aMEASURE2 will
start the amperometric detection using the biosensor. The results are stored in aMEASURE2 and

82
are accessed via USB or can be transmitted wirelessly through the incorporation of a wireless
data module.
5.3 Summary
In this chapter, we present the first demonstration of a textile-based, liquid-activated
electrochemical sensor for quantitative XOx detection. This system consists of four components:
an electrochemical biosensor, a detection circuit, a regulation circuit and a liquid-activated
battery. The screen-printed sensor was connected to aMEAURE2, which was powered by a 9-
cell, liquid-activated battery. Power management was controlled via a regulation circuit
consisting of a battery management evaluation board and a supercapacitor. The integrated system
can perform electrochemical detection for ~6 sec. Using this prototype sensing platform, we
were able to detect XOx concentrations in both spiked simulated urine samples and clinical urine
samples. Through this system, we demonstrate the feasibility in creating a fully operational,
wearable biosensing system and its potential for POC testing and health monitoring.

83
6. CONCLUSIONS

84
6.1 Summary of Presented Work
Wearable sensors are an emerging area that has the great potential to impact healthcare.
Recent development in the field of wearable sensors has enabled devices that can not only
measure physiological parameters, but also perform highly sensitive analytical measurements.
Towards this end, wearable electrochemical sensors have been integrated onto either textiles or
directly attached on the epidermis for various monitoring applications, owing to their unique
ability to process chemical analytes in a non-invasive and non-obtrusive fashion.
My research aims to advance wearable chemical sensors through the development of self-
powered, textile-based electrochemical sensors for biomolecular detection. To achieve this goal,
we developed and fabricated several wearable biosensors for different disease/health status
monitoring applications. In Chapter 2, we presented for the first time an embroidered
electrochemical sensor that is capable of quantitative analytical measurements. This unique
approach utilizes custom-coated conductive thread and can be fabricated on various fabrics.
Conductive threads immobilized with enzyme probes were generated using a simple and robust
fabrication process and used to fabricate flexible, mechanically robust electrodes on textiles. For
proof-of-concept, measurements were performed to detect glucose and lactate in buffer and
whole blood samples, which exhibited excellent specificity and accuracy. We also demonstrated
that our embroidered biosensor can be readily fabricated in two-dimensional (2D) arrays for
multiplexed measurements. Lastly, we showed that this biosensor exhibits good resiliency
against mechanical stress and superior repeatability, which are important requirements for
flexible sensor platforms.
In Chapter 3, we applied the sensor embroidery technology to develop a robust
electrochemical sensor on gauze for quantitative measurements of wound biomarkers. For proof

85
of principle, this biosensor was used to detect uric acid, a biomarker for wound severity and
healing, in simulated wound fluid which exhibited high specificity, excellent reproducibility and
good linearity from 0 to 800 µM. Continuous sensing of uric acid was also performed using this
biosensor which revealed that it can generate consistent and accurate measurements for up to 7
hr. Experiments to evaluate the robustness of the embroidered gauze sensor demonstrated that it
offers excellent resilience against mechanical stress and deformation, making it a promising
wearable platform for assessing and monitoring wound status in situ. Our unique embroidery
fabrication process employed in Chapters 2 and 3 provides researchers with a simple method to
create wearable electrochemical sensors on textiles which are flexible, breathable and offer
superior mechanical resilience compared with screen-printed sensors.
As most biosensors require a power source to operate, it is critical that wearable sensing
systems have a power source that is robust, lightweight, and integrative with wearable materials.
Therefore, in Chapter 4, we reported two generations of liquid-activated battery fabricated on
textile. In the first generation, the battery was comprised of dry electrolyte layers sandwiched
between Ag and Al thin metal electrodes. Upon application of an aqueous sample, the electrolyte
layers became hydrated and generated an electrochemical reaction, thereby activating the battery.
To demonstrate the functionality of this battery, we fabricated a dual-cell battery, which was able
to power a 1.6 V LED. Considering that the metal pieces of electrodes were bulk and inflexible,
we developed second generation printed Ag - Zn battery by combining screen-printing and
microfabrication technology. Anode and cathode electrodes were screen-printed onto Evolon
fabric, which served as the substrate for both electrodes and microfluidic channels.
Photolithography was used to fabricate the microfluidic channels for liquid flow to the cells to
activate the battery. This battery is the very first demonstration of a liquid-activated battery on

86
textile and the results presented in this chapter offer new insights into the fabrication and
performance of this new type of wearable battery.
Finally, in Chapter 5, we developed a self-powered, wearable electrochemical biosensing
system that can be integrated with a disposable diaper for quantitative measurements of XOx in
urine. This system is comprised of a screen-printed electrochemical biosensor, a liquid-activated
battery, a custom, miniature detection circuit (aMEASURE2), and an ultra-low power boost
converter with battery management. When the urine sample is applied to the sensing unit,
electrochemical measurements start as XOx catalyzes xanthine to generate electro-oxidation
reactions. We established the calibration curves for the integrated system based on simulated
urine samples spiked with different XOx concentrations, and system exhibited a highly linear
response throughout the entire concentration range. Using this integrated system, we were able to
perform XOx measurements from simulated urine samples, which is the first demonstration of a
self-powered, wearable biosensor system on textile for quantitative biomolecular detection.
6.2 Future Work
In Chapter 2 and 3, we developed a unique fabrication method that enables the creation of
embroidered electrochemical sensors onto various fabrics for quantitative biomolecular
detection. With this sensor, we were able to perform electrochemical detection for different
analytes with great linearity and reproducibility. Experiments demonstrate that this embroidered
sensor offers excellent resilience against mechanical stress and deformation, which makes it a
promising wearable platform for assessing and monitoring parameters in situ. However, in order
to take the measurements, it required an electrochemical instrument (i.e. Genefluidics described
in Chapters 2 and 3 or aMEASURE2 described in Chapter 5) to perform the measurements. Both

87
these devices require an external power source (i.e. a liquid-activated battery described in
Chapter 4) to operate.
As we have presented in Chapter 5, we were able to integrate the sensors with the battery
and circuit to demonstrate a fully integrated, wearable sensing system. However, this prototype
device is still far from being commercialized. For example, the regulation circuit and
aMEASURE2 can be designed and fabricated using complementary metal oxide semiconductor
(CMOS) integrated circuits technology to minimize the size and expenses [123]. Moreover, by
adding a wireless component to the current system, the detection results can be directly sent to
patient’s smartphone and/or doctor’s computer for continuous monitoring and future treatment.
Lastly, we can also improve the system performance by creating multiplexed sensor array which
can simultaneously detect several biomarkers in a single measurement.

88
BIBLIOGRAPHY

89
BIBLIOGRAPHY
[1] L. Gervais, N. de Rooij, and E. Delamarche, “Microfluidic chips for point-of-care
immunodiagnostics,” Adv. Mater., vol. 23, no. 24, pp. H151–H176, 2011.
[2] G. F. Anderson, P. S. Hussey, B. K. Frogner, and H. R. Waters, “Health spending in the
United States and the rest of the industrialized world,” Health Aff. (Millwood), vol. 24, no. 4,
pp. 903–914, Jul. 2005.
[3] D. I. Auerbach and A. L. Kellermann, “A decade of health care cost growth has wiped out
real income gains for an average US family,” Health Aff. (Millwood), vol. 30, no. 9, pp.
1630–1636, Sep. 2011.
[4] A. L. Gerche et al., “Exercise-induced right ventricular dysfunction and structural
remodelling in endurance athletes,” Eur. Heart J., vol. 33, no. 8, pp. 998–1006, Apr. 2012.
[5] K. Görlinger, D. Fries, D. Dirkmann, C. F. Weber, A. A. Hanke, and H. Schöchl, “Reduction
of Fresh Frozen Plasma Requirements by Perioperative Point-of-Care Coagulation
Management with Early Calculated Goal-Directed Therapy,” Transfus. Med. Hemotherapy,
vol. 39, no. 2, pp. 104–113, 2012.
[6] A. Niemz, T. M. Ferguson, and D. S. Boyle, “Point-of-care nucleic acid testing for infectious
diseases,” Trends Biotechnol., vol. 29, no. 5, pp. 240–250, May 2011.
[7] B. S. Miranda, E. M. Linares, S. Thalhammer, and L. T. Kubota, “Development of a
disposable and highly sensitive paper-based immunosensor for early diagnosis of Asian
soybean rust,” Biosens. Bioelectron., vol. 45, pp. 123–128, Jul. 2013.
[8] C. R. Thornton and O. E. Wills, “Immunodetection of fungal and oomycete pathogens:
established and emerging threats to human health, animal welfare and global food security,”
Crit. Rev. Microbiol., pp. 1–25, Jun. 2013.
[9] R. Q. Zhang et al., “A simple point-of-care microfluidic immunomagnetic fluorescence
assay for pathogens,” Anal. Chem., vol. 85, no. 5, pp. 2645–2651, Mar. 2013.
[10] J. Kirsch, C. Siltanen, Q. Zhou, A. Revzin, and A. Simonian, “Biosensor technology:
recent advances in threat agent detection and medicine,” Chem. Soc. Rev., vol. 42, no. 22, pp.
8733–8768, Oct. 2013.
[11] T. D. Minogue, P. A. Rachwal, A. T. Hall, J. W. Koehler, and S. A. Weller, “Cross
institute evaluations of inhibitor resistant PCR reagents for direct testing of aerosol and
blood samples containing biological warfare agent (BWA) DNA,” Appl. Environ.
Microbiol., p. AEM.03478-13, Dec. 2013.

90
[12] S. Jamal and Y. K. Agrawal, “Advances in microfluidics: lab-on-a-chip to point of care
diagnostic devices,” Adv. Sci. Eng. Med., vol. 5, no. 5, pp. 385–394, May 2013.
[13] P. Shah, X. Zhu, and C. Li, “Development of paper-based analytical kit for point-of-care
testing,” Expert Rev. Mol. Diagn., vol. 13, no. 1, pp. 83–91, Jan. 2013.
[14] A. Vasudev, A. Kaushik, K. Jones, and S. Bhansali, “Prospects of low temperature co-
fired ceramic (LTCC) based microfluidic systems for point-of-care biosensing and
environmental sensing,” Microfluid. Nanofluidics, vol. 14, no. 3–4, pp. 683–702, Mar. 2013.
[15] “In Vitro Diagnostics Market Size | IVD Industry Report, 2020.” [Online]. Available:
http://www.grandviewresearch.com/industry-analysis/in-vitro-diagnostics-ivd-market.
[Accessed: 12-Jul-2016].
[16] A. I. Mushlin, H. S. Ruchlin, and M. A. Callahan, “Costeffectiveness of diagnostic tests,”
The Lancet, vol. 358, no. 9290, pp. 1353–1355, Oct. 2001.
[17] “Market research report -- point of care testing market to reach $25 billion by 2016,”
Yahoo Finance. [Online]. Available: http://finance.yahoo.com/news/market-research-report-
point-care-080800154.html. [Accessed: 17-Jan-2014].
[18] K. A. Landers et al., “Use of multiple biomarkers for a molecular diagnosis of prostate
cancer,” Int. J. Cancer, vol. 114, no. 6, pp. 950–956, 2005.
[19] S. A. Soper et al., “Point-of-care biosensor systems for cancer diagnostics/prognostics,”
Biosens. Bioelectron., vol. 21, no. 10, pp. 1932–1942, Apr. 2006.
[20] J. M. Llovet and J. Bruix, “Molecular targeted therapies in hepatocellular carcinoma,”
Hepatology, vol. 48, no. 4, pp. 1312–1327, Oct. 2008.
[21] A. S. Patterson, K. Hsieh, H. T. Soh, and K. W. Plaxco, “Electrochemical real-time
nucleic acid amplification: towards point-of-care quantification of pathogens,” Trends
Biotechnol., vol. 31, no. 12, pp. 704–712, Dec. 2013.
[22] L. Gatzoulis and I. Iakovidis, “Wearable and Portable eHealth Systems,” IEEE Eng. Med.
Biol. Mag., vol. 26, no. 5, pp. 51–56, Sep. 2007.
[23] S. Jung, T. Ji, and V. K. Varadan, “Point-of-care temperature and respiration monitoring
sensors for smart fabric applications,” Smart Mater. Struct., vol. 15, no. 6, p. 1872, 2006.
[24] B. Stanberry, “Legal ethical and risk issues in telemedicine,” Comput. Methods Programs
Biomed., vol. 64, no. 3, pp. 225–233, Mar. 2001.
[25] M. D. Rienzo et al., “Textile Technology for the Vital Signs Monitoring in Telemedicine
and Extreme Environments,” IEEE Trans. Inf. Technol. Biomed., vol. 14, no. 3, pp. 711–717,
May 2010.

91
[26] F. Chiarugi et al., “Measurement of heart rate and respiratory rate using a textile-based
wearable device in heart failure patients,” in 2008 Computers in Cardiology, 2008, pp. 901–
904.
[27] C. Rovira, S. Coyle, B. Corcoran, D. Diamond, F. Stroiescu, and K. Daly, “Integration of
textile-based sensors and Shimmer for breathing rate and volume measurement,” in 2011 5th
International Conference on Pervasive Computing Technologies for Healthcare
(PervasiveHealth) and Workshops, 2011, pp. 238–241.
[28] C. R. Merritt, H. T. Nagle, and E. Grant, “Textile-Based Capacitive Sensors for
Respiration Monitoring,” IEEE Sens. J., vol. 9, no. 1, pp. 71–78, Jan. 2009.
[29] M. Rothmaier, B. Selm, S. Spichtig, D. Haensse, and M. Wolf, “Photonic textiles for
pulse oximetry,” Opt. Express, vol. 16, no. 17, p. 12973, Aug. 2008.
[30] I. M. Penhaker, M. Černý, L. Martinák, J. Spišák, and A. Válková, “HomeCare — Smart
embedded biotelemetry system,” in World Congress on Medical Physics and Biomedical
Engineering 2006, R. Magjarevic and J. H. Nagel, Eds. Springer Berlin Heidelberg, 2007,
pp. 711–714.
[31] C. Mattmann, F. Clemens, and G. Tröster, “Sensor for Measuring Strain in Textile,”
Sensors, vol. 8, no. 6, pp. 3719–3732, Jun. 2008.
[32] F. Lorussi, W. Rocchia, E. P. Scilingo, A. Tognetti, and D. D. Rossi, “Wearable,
redundant fabric-based sensor arrays for reconstruction of body segment posture,” IEEE
Sens. J., vol. 4, no. 6, pp. 807–818, Dec. 2004.
[33] Y. Hasegawa, M. Shikida, D. Ogura, Y. Suzuki, and K. Sato, “Fabrication of a wearable
fabric tactile sensor produced by artificial hollow fiber,” J. Micromechanics
Microengineering, vol. 18, no. 8, p. 085014, 2008.
[34] F. Lorussi, E. P. Scilingo, M. Tesconi, A. Tognetti, and D. D. Rossi, “Strain sensing
fabric for hand posture and gesture monitoring,” IEEE Trans. Inf. Technol. Biomed., vol. 9,
no. 3, pp. 372–381, Sep. 2005.
[35] J. R. Windmiller and J. Wang, “Wearable Electrochemical Sensors and Biosensors: A
Review,” Electroanalysis, vol. 25, no. 1, pp. 29–46, Jan. 2013.
[36] W. Gao et al., “Fully integrated wearable sensor arrays for multiplexed in situ
perspiration analysis,” Nature, vol. 529, no. 7587, pp. 509–514, Jan. 2016.
[37] T. M.-H. Lee, “Over-the-Counter Biosensors: Past, Present, and Future,” Sensors, vol. 8,
no. 9, pp. 5535–5559, Sep. 2008.
[38] H. Graf and H. R. Mühlemann, “Telemetry of plaque pH from interdental area,” Helv.
Odontol. Acta, vol. 10, no. 2, pp. 94–101, Oct. 1966.

92
[39] H. Graf and H. R. Mühlemann, “Oral telemetry of fluoride ion activity,” Arch. Oral Biol.,
vol. 14, no. 3, pp. 259-IN3, Mar. 1969.
[40] J. Kim et al., “Non-invasive mouthguard biosensor for continuous salivary monitoring of
metabolites,” The Analyst, vol. 139, no. 7, pp. 1632–1636, Apr. 2014.
[41] M. S. Mannoor et al., “Graphene-based wireless bacteria detection on tooth enamel,” Nat.
Commun., vol. 3, p. 763, Mar. 2012.
[42] K. Mitsubayashi, M. Suzuki, E. Tamiya, and I. Karube, “Analysis of metabolites in sweat
as a measure of physical condition,” Anal. Chim. Acta, vol. 289, no. 1, pp. 27–34, Apr. 1994.
[43] W. Jia et al., “Electrochemical Tattoo Biosensors for Real-Time Noninvasive Lactate
Monitoring in Human Perspiration,” Anal. Chem., vol. 85, no. 14, pp. 6553–6560, Jul. 2013.
[44] A. J. Bandodkar et al., “Tattoo-based potentiometric ion-selective sensors for epidermal
pH monitoring,” The Analyst, vol. 138, no. 1, pp. 123–128, 2013.
[45] T. Guinovart, A. J. Bandodkar, J. R. Windmiller, F. J. Andrade, and J. Wang, “A
potentiometric tattoo sensor for monitoring ammonium in sweat,” The Analyst, vol. 138, no.
22, p. 7031, 2013.
[46] A. J. Bandodkar et al., “Epidermal tattoo potentiometric sodium sensors with wireless
signal transduction for continuous non-invasive sweat monitoring,” Biosens. Bioelectron.,
vol. 54, pp. 603–609, Apr. 2014.
[47] A. Modali, S. R. K. Vanjari, and D. Dendukuri, “Wearable Woven Electrochemical
Biosensor Patch for Non-invasive Diagnostics,” Electroanalysis, vol. 28, no. 6, pp. 1276–
1282, Jun. 2016.
[48] T. Guinovart, G. Valdés-Ramírez, J. R. Windmiller, F. J. Andrade, and J. Wang,
“Bandage-Based Wearable Potentiometric Sensor for Monitoring Wound pH,”
Electroanalysis, vol. 26, no. 6, pp. 1345–1353, Jun. 2014.
[49] P. Kassal et al., “Smart bandage with wireless connectivity for uric acid biosensing as an
indicator of wound status,” Electrochem. Commun., vol. 56, pp. 6–10, Jul. 2015.
[50] E.-H. W. Kluge, “Ethical and legal challenges for health telematics in a global world:
Telehealth and the technological imperative,” Int. J. Med. Inf., vol. 80, no. 2, pp. e1–e5, Feb.
2011.
[51] P. Brey, “Freedom and Privacy in Ambient Intelligence,” Ethics Inf. Technol., vol. 7, no.
3, pp. 157–166, Sep. 2005.

93
[52] X. Wang, X. Lu, B. Liu, D. Chen, Y. Tong, and G. Shen, “Flexible energy-storage
devices: design consideration and recent progress,” Adv. Mater. Deerfield Beach Fla, vol.
26, no. 28, pp. 4763–4782, Jul. 2014.
[53] Y. Hu and X. Sun, “Flexible rechargeable lithium ion batteries: advances and challenges
in materials and process technologies,” J. Mater. Chem. A, vol. 2, no. 28, pp. 10712–10738,
Jun. 2014.
[54] G. Zhou, F. Li, and H.-M. Cheng, “Progress in flexible lithium batteries and future
prospects,” Energy Environ. Sci., vol. 7, no. 4, pp. 1307–1338, Mar. 2014.
[55] P. Hiralal et al., “Nanomaterial-Enhanced All-Solid Flexible Zinc−Carbon Batteries,”
ACS Nano, vol. 4, no. 5, pp. 2730–2734, May 2010.
[56] Z. Wang, Z. Wu, N. Bramnik, and S. Mitra, “Fabrication of High-Performance Flexible
Alkaline Batteries by Implementing Multiwalled Carbon Nanotubes and Copolymer
Separator,” Adv. Mater., vol. 26, no. 6, pp. 970–976, Feb. 2014.
[57] Z. Wang and S. Mitra, “Development of flexible secondary alkaline battery with carbon
nanotube enhanced electrodes,” J. Power Sources, vol. 266, pp. 296–303, Nov. 2014.
[58] A. M. Gaikwad, H. N. Chu, R. Qeraj, A. M. Zamarayeva, and D. A. Steingart,
“Reinforced Electrode Architecture for a Flexible Battery with Paperlike Characteristics,”
Energy Technol., vol. 1, no. 2–3, pp. 177–185, Mar. 2013.
[59] S. Berchmans, A. J. Bandodkar, W. Jia, J. Ramírez, Y. S. Meng, and J. Wang, “An
epidermal alkaline rechargeable Ag–Zn printable tattoo battery for wearable electronics,” J.
Mater. Chem. A, vol. 2, no. 38, pp. 15788–15795, Sep. 2014.
[60] Y.-H. Lee et al., “Wearable Textile Battery Rechargeable by Solar Energy,” Nano Lett.,
vol. 13, no. 11, pp. 5753–5761, Nov. 2013.
[61] M. Koo et al., “Bendable Inorganic Thin-Film Battery for Fully Flexible Electronic
Systems,” Nano Lett., vol. 12, no. 9, pp. 4810–4816, Sep. 2012.
[62] J. F. M. Oudenhoven, L. Baggetto, and P. H. L. Notten, “All-Solid-State Lithium-Ion
Microbatteries: A Review of Various Three-Dimensional Concepts,” Adv. Energy Mater.,
vol. 1, no. 1, pp. 10–33, Jan. 2011.
[63] D.-H. Kim et al., “Ultrathin Silicon Circuits With Strain-Isolation Layers and Mesh
Layouts for High-Performance Electronics on Fabric, Vinyl, Leather, and Paper,” Adv.
Mater., vol. 21, no. 36, pp. 3703–3707, Sep. 2009.
[64] S. Wang et al., “Mechanics of curvilinear electronics,” Soft Matter, vol. 6, no. 22, pp.
5757–5763, Nov. 2010.

94
[65] J. A. Rogers, T. Someya, and Y. Huang, “Materials and Mechanics for Stretchable
Electronics,” Science, vol. 327, no. 5973, pp. 1603–1607, Mar. 2010.
[66] A. Pierre, M. Sadeghi, M. M. Payne, A. Facchetti, J. E. Anthony, and A. C. Arias, “All-
Printed Flexible Organic Transistors Enabled by Surface Tension-Guided Blade Coating,”
Adv. Mater., vol. 26, no. 32, pp. 5722–5727, Aug. 2014.
[67] T. N. Ng, B. Russo, B. Krusor, R. Kist, and A. C. Arias, “Organic inkjet-patterned
memory array based on ferroelectric field-effect transistors,” Org. Electron., vol. 12, no. 12,
pp. 2012–2018, Dec. 2011.
[68] A. C. Arias, J. D. MacKenzie, I. McCulloch, J. Rivnay, and A. Salleo, “Materials and
Applications for Large Area Electronics: Solution-Based Approaches,” Chem. Rev., vol. 110,
no. 1, pp. 3–24, Jan. 2010.
[69] T. W. Kelley et al., “Recent Progress in Organic Electronics: Materials, Devices, and
Processes,” Chem. Mater., vol. 16, no. 23, pp. 4413–4422, Nov. 2004.
[70] A. M. Gaikwad, G. L. Whiting, D. A. Steingart, and A. C. Arias, “Highly Flexible,
Printed Alkaline Batteries Based on Mesh-Embedded Electrodes,” Adv. Mater., vol. 23, no.
29, pp. 3251–3255, Aug. 2011.
[71] S. Xu et al., “Stretchable batteries with self-similar serpentine interconnects and
integrated wireless recharging systems,” Nat. Commun., vol. 4, p. 1543, Feb. 2013.
[72] N. Li, Z. Chen, W. Ren, F. Li, and H.-M. Cheng, “Flexible graphene-based lithium ion
batteries with ultrafast charge and discharge rates,” Proc. Natl. Acad. Sci., vol. 109, no. 43,
pp. 17360–17365, Oct. 2012.
[73] F. C. Krebs, “Fabrication and processing of polymer solar cells: A review of printing and
coating techniques,” Sol. Energy Mater. Sol. Cells, vol. 93, no. 4, pp. 394–412, Apr. 2009.
[74] P. Calvert, “Inkjet Printing for Materials and Devices,” Chem. Mater., vol. 13, no. 10, pp.
3299–3305, Oct. 2001.
[75] B.-J. de Gans, P. C. Duineveld, and U. S. Schubert, “Inkjet Printing of Polymers: State of
the Art and Future Developments,” Adv. Mater., vol. 16, no. 3, pp. 203–213, Feb. 2004.
[76] H. Gleskova, I.-C. Cheng, S. Wagner, J. C. Sturm, and Z. Suo, “Mechanics of thin-film
transistors and solar cells on flexible substrates,” Sol. Energy, vol. 80, no. 6, pp. 687–693,
Jun. 2006.
[77] R. Bhattacharya, M. M. de Kok, and J. Zhou, “Rechargeable electronic textile battery,”
Appl. Phys. Lett., vol. 95, no. 22, p. 223305, Nov. 2009.

95
[78] J. Perelaer et al., “Printed electronics: the challenges involved in printing devices,
interconnects, and contacts based on inorganic materials,” J. Mater. Chem., vol. 20, no. 39,
pp. 8446–8453, Sep. 2010.
[79] S.-I. Park, J.-H. Ahn, X. Feng, S. Wang, Y. Huang, and J. A. Rogers, “Theoretical and
Experimental Studies of Bending of Inorganic Electronic Materials on Plastic Substrates,”
Adv. Funct. Mater., vol. 18, no. 18, pp. 2673–2684, Sep. 2008.
[80] T. Sekitani, S. Iba, Y. Kato, Y. Noguchi, T. Someya, and T. Sakurai, “Ultraflexible
organic field-effect transistors embedded at a neutral strain position,” Appl. Phys. Lett., vol.
87, no. 17, p. 173502, Oct. 2005.
[81] A. M. Gaikwad, J. W. Gallaway, D. Desai, and D. A. Steingart, “Electrochemical-
Mechanical Analysis of Printed Silver Electrodes in a Microfluidic Device,” J. Electrochem.
Soc., vol. 158, no. 2, pp. A154–A162, Feb. 2011.
[82] L. Hu, H. Wu, F. La Mantia, Y. Yang, and Y. Cui, “Thin, Flexible Secondary Li-Ion
Paper Batteries,” ACS Nano, vol. 4, no. 10, pp. 5843–5848, Oct. 2010.
[83] C. C. Ho, J. W. Evans, and P. K. Wright, “Direct write dispenser printing of a zinc
microbattery with an ionic liquid gel electrolyte,” J. Micromechanics Microengineering, vol.
20, no. 10, p. 104009, 2010.
[84] T. Someya, T. Sekitani, S. Iba, Y. Kato, H. Kawaguchi, and T. Sakurai, “A large-area,
flexible pressure sensor matrix with organic field-effect transistors for artificial skin
applications,” Proc. Natl. Acad. Sci. U. S. A., vol. 101, no. 27, pp. 9966–9970, Jul. 2004.
[85] D.-H. Kim, J. Xiao, J. Song, Y. Huang, and J. A. Rogers, “Stretchable, Curvilinear
Electronics Based on Inorganic Materials,” Adv. Mater., vol. 22, no. 19, pp. 2108–2124, May
2010.
[86] J. W. Long, B. Dunn, D. R. Rolison, and H. S. White, “Three-Dimensional Battery
Architectures,” Chem. Rev., vol. 104, no. 10, pp. 4463–4492, Oct. 2004.
[87] N. K. Thom, G. G. Lewis, M. J. DiTucci, and S. T. Phillips, “Two general designs for
fluidic batteries in paper-based microfluidic devices that provide predictable and tunable
sources of power for on-chip assays,” RSC Adv., vol. 3, no. 19, p. 6888, 2013.
[88] K. B. Lee, “Urine-activated paper batteries for biosystems,” J. Micromechanics
Microengineering, vol. 15, no. 9, p. S210, 2005.
[89] M. Sibinski, M. Jakubowska, and M. Sloma, “Flexible Temperature Sensors on Fibers,”
Sensors, vol. 10, no. 9, pp. 7934–7946, Aug. 2010.

96
[90] R. Paradiso, G. Loriga, and N. Taccini, “A wearable health care system based on knitted
integrated sensors,” IEEE Trans. Inf. Technol. Biomed., vol. 9, no. 3, pp. 337–344, Sep.
2005.
[91] G. Loriga, N. Taccini, D. De Rossi, and R. Paradiso, “Textile Sensing Interfaces for
Cardiopulmonary Signs Monitoring,” in Engineering in Medicine and Biology Society, 2005.
IEEE-EMBS 2005. 27th Annual International Conference of the, 2005, pp. 7349–7352.
[92] Y.-L. Yang, M.-C. Chuang, S.-L. Lou, and J. Wang, “Thick-film textile-based
amperometric sensors and biosensors,” Analyst, vol. 135, no. 6, pp. 1230–1234, May 2010.
[93] M.-C. Chuang et al., “Textile-based Electrochemical Sensing: Effect of Fabric Substrate
and Detection of Nitroaromatic Explosives,” Electroanalysis, vol. 22, no. 21, pp. 2511–2518,
Nov. 2010.
[94] K. Malzahn, J. R. Windmiller, G. Valdés-Ramírez, M. J. Schöning, and J. Wang,
“Wearable electrochemical sensors for in situ analysis in marine environments,” The Analyst,
vol. 136, no. 14, p. 2912, 2011.
[95] B. Schazmann et al., “A wearable electrochemical sensor for the real-time measurement
of sweat sodium concentration,” Anal. Methods, vol. 2, no. 4, pp. 342–348, Apr. 2010.
[96] S. Coyle et al., “BIOTEX #x2014;Biosensing Textiles for Personalised Healthcare
Management,” IEEE Trans. Inf. Technol. Biomed., vol. 14, no. 2, pp. 364–370, Mar. 2010.
[97] T. Choudhary, G. P. Rajamanickam, and D. Dendukuri, “Woven electrochemical fabric-
based test sensors (WEFTS): a new class of multiplexed electrochemical sensors,” Lab.
Chip, vol. 15, no. 9, pp. 2064–2072, Apr. 2015.
[98] C. K. Sen et al., “Human Skin Wounds: A Major and Snowballing Threat to Public
Health and the Economy,” Wound Repair Regen. Off. Publ. Wound Heal. Soc. Eur. Tissue
Repair Soc., vol. 17, no. 6, pp. 763–771, 2009.
[99] C. A. Chrisman, “Care of chronic wounds in palliative care and end-of-life patients,” Int.
Wound J., vol. 7, no. 4, pp. 214–235, Aug. 2010.
[100] A. Nocke, A. Schröter, C. Cherif, and G. Gerlach, “Miniaturized textile-based multi-layer
pH-sensor for wound monitoring applications,” Autex Res. J., vol. 12, no. 1, pp. 20–22,
2012.
[101] I. Ciani et al., “Development of immunosensors for direct detection of three wound
infection biomarkers at point of care using electrochemical impedance spectroscopy,”
Biosens. Bioelectron., vol. 31, no. 1, pp. 413–418, Jan. 2012.
[102] D. Sharp and J. Davis, “Integrated urate sensors for detecting wound infection,”
Electrochem. Commun., vol. 10, no. 5, pp. 709–713, May 2008.

97
[103] L. Zhou et al., “Detection of the Pseudomonas Quinolone Signal (PQS) by cyclic
voltammetry and amperometry using a boron doped diamond electrode,” Chem. Commun.,
vol. 47, no. 37, pp. 10347–10349, Sep. 2011.
[104] G. Matzeu et al., “Skin temperature monitoring by a wireless sensor,” in IECON 2011 -
37th Annual Conference on IEEE Industrial Electronics Society, 2011, pp. 3533–3535.
[105] Y. Moser and M. A. M. Gijs, “Miniaturized Flexible Temperature Sensor,” J.
Microelectromechanical Syst., vol. 16, no. 6, pp. 1349–1354, Dec. 2007.
[106] D. McColl, M. MacDougall, L. Watret, and P. Connolly, “Monitoring moisture without
disturbing the wound dressing,” Wounds UK, vol. 5, no. 3, pp. 94–99, 2009.
[107] D. McColl, B. Cartlidge, and P. Connolly, “Real-time monitoring of moisture levels in
wound dressings in vitro: An experimental study,” Int. J. Surg., vol. 5, no. 5, pp. 316–322,
Oct. 2007.
[108] D. Sharp, S. Forsythe, and J. Davis, “Carbon Fibre Composites: Integrated
Electrochemical Sensors for Wound Management,” J. Biochem. (Tokyo), vol. 144, no. 1, pp.
87–93, Jul. 2008.
[109] A. McLister, J. Phair, J. Cundell, and J. Davis, “Electrochemical approaches to the
development of smart bandages: A mini-review,” Electrochem. Commun., vol. 40, pp. 96–
99, Mar. 2014.
[110] M. L. Fernandez, Z. Upton, and G. K. Shooter, “Uric Acid and Xanthine Oxidoreductase
in Wound Healing,” Curr. Rheumatol. Rep., vol. 16, no. 2, pp. 1–7, Dec. 2013.
[111] M. L. Fernandez, Z. Upton, H. Edwards, K. Finlayson, and G. K. Shooter, “Elevated uric
acid correlates with wound severity,” Int. Wound J., vol. 9, no. 2, pp. 139–149, Apr. 2012.
[112] M. Lehnhardt et al., “A qualitative and quantitative analysis of protein loss in human
burn wounds,” Burns, vol. 31, no. 2, pp. 159–167, Mar. 2005.
[113] N. J. Trengove, S. R. Langton, and M. C. Stacey, “Biochemical analysis of wound fluid
from nonhealing and healing chronic leg ulcers,” Wound Repair Regen., vol. 4, no. 2, pp.
234–239, Apr. 1996.
[114] C. Meng, C. Liu, L. Chen, C. Hu, and S. Fan, “Highly Flexible and All-Solid-State
Paperlike Polymer Supercapacitors,” Nano Lett., vol. 10, no. 10, pp. 4025–4031, Oct. 2010.
[115] G. Chitnis, T. Tan, and B. Ziaie, “Laser-assisted fabrication of batteries on wax paper,” J.
Micromechanics Microengineering, vol. 23, no. 11, p. 114016, 2013.

98
[116] D. Wei, D. Cotton, and T. Ryhänen, “All-Solid-State Textile Batteries Made from Nano-
Emulsion Conducting Polymer Inks for Wearable Electronics,” Nanomaterials, vol. 2, no. 3,
pp. 268–274, Aug. 2012.
[117] N. K. Thom, G. G. Lewis, M. J. DiTucci, and S. T. Phillips, “Two general designs for
fluidic batteries in paper-based microfluidic devices that provide predictable and tunable
sources of power for on-chip assays,” RSC Adv., vol. 3, no. 19, pp. 6888–6895, Apr. 2013.
[118] P. Ciragil, E. B. Kurutas, and M. Miraloglu, “New Markers: Urine Xanthine Oxidase and
Myeloperoxidase in the Early Detection of Urinary Tract Infection,” Dis. Markers, vol.
2014, p. e269362, Jan. 2014.
[119] S. Giler, E. F. Henig, I. Urca, O. Sperling, and A. de Vries, “Urine xanthine oxidase
activity in urinary tract infection.,” J. Clin. Pathol., vol. 31, no. 5, pp. 444–446, May 1978.
[120] V. Venugopal, “Biosensors in fish production and quality control,” Biosens. Bioelectron.,
vol. 17, no. 3, pp. 147–157, Mar. 2002.
[121] S. Parsnejad, Y. Hu, H. Wan, E. Ashoori, and A. J. Mason, “Wide dynamic range multi-
channel electrochemical instrument for in-field measurements,” in 2016 IEEE SENSORS,
2016, pp. 1–3.
[122] S. Parsnejad, Y. Gtat, T. Y. Lin, X. Liu, and A. J. Mason, “Thrumb-sized modular
multichannel electrochemical instrument for portable sensing,” in 2017 IEEE SENSORS,
2017.
[123] H. Li, X. Liu, L. Li, X. Mu, R. Genov, and A. J. Mason, “CMOS Electrochemical
Instrumentation for Biosensor Microsystems: A Review,” Sensors, vol. 17, no. 1, p. 74, Dec.
2016.