textila nr 6 2013bun textila 2 2012
TRANSCRIPT

IndustriaTextila
ISSN 1222–5347 (301–368)
6/2013
Recunoscutã în România, în domeniul ªtiinþelor inginereºti, de cãtre Consiliul Naþional al Cercetãrii ªtiinþifice din Învãþãmântul Superior
(C.N.C.S.I.S.), în grupa A /Aknowledged in Romania, in the engineering sciences domain,
by the National Council of the Scientific Research from the Higher Education (CNCSIS), in group A
COLEGIULDE REDACTIE:
Dr. ing. EMILIA VISILEANUcerc. şt. pr. gr. I – EDITOR ŞEF
Institutul Naţional de Cercetare-Dezvoltare pentru Textile şi Pielărie – Bucureşti
Dr. ing. CARMEN GHIŢULEASAcerc. şt. pr. II
Institutul Naţional de Cercetare-Dezvoltare pentru Textile şi Pielărie – Bucureşti
Prof. dr. GELU ONOSEcerc. şt. pr. gr. I
Universitatea de Medicină şi Farmacie„Carol Davila“ – Bucureşti
Prof. dr. GEBHARDT RAINERSaxon Textile Research Institute – Germania
Prof. dr. ing. CRIŞAN POPESCUInstitutul German de Cercetare a Lânii – Aachen
Prof. dr. ing. PADMA S. VANKARFacility for Ecological and Analytical Testing
Indian Institute of Technology – IndiaProf. dr. SEYED A. HOSSEINI RAVANDIIsfahan University of Technology – Iran
Dr. FRANK MEISTERTITK – Germania
Prof. dr. ing. ERHAN ÖNERMarmara University – Istanbul
Dr. ing. FAMING WANGLund University – Sweden
Prof. univ. dr. ing. CARMEN LOGHINUniversitatea Tehnică „Ghe. Asachi“ – Iaşi
Ing. MARIANA VOICUMinisterul Economiei, Comerţului
şi Mediului de AfaceriConf. univ. dr. ing.
LUCIAN CONSTANTIN HANGANUUniversitatea Tehnică „Ghe. Asachi“ – Iaşi
Prof. ing. ARISTIDE DODUcerc. şt. pr. gr. I
Membru de onoare al Academiei de ŞtiinţeTehnice din România
Prof. univ. dr. DOINA I. POPESCUAcademia de Studii Economice – Bucureşti
IULIANA DUMITRESCU, OVIDIU GEORGE IORDACHE,ANA MARIA MOCIOIU, GHEORGHE NICULAFuncționalizarea antimicrobiană a materialelor textile cu hidrofobine și nanopulberi compozite de Ag/ZnO 303–312
ALENKA PAVKO-CUDEN, URSKA STANKOVIĆ ELESINIDiametrul firelor din structurile tricotate elasticizate 313–320
HONGYAN WU, FUMEI WANGMetodă de măsurare a lungimii fibrelor pe bază de imagini 321–326
JIHONG LIU, BO ZHU, HONGXIA JIANG,RURU PAN, WEIDONG GAOAprecierea calității firelor folosind un sistem digital cu plăci negre 327–333
MIRELA BLAGA, NECULAI-EUGEN SEGHEDIN, ANA RAMONA CIOBANUComportarea tricoturilor din urzeală la testarea dinamică 334–341
ANCA BUTNARIU, GHEORGHE CONDURACHEAnaliza SWOT a eficienţei producerii aburului tehnologic destinat finisării materialelor textile 342–345
ĞASSAN ASKER, ONUR BALCIFolosirea unor tratamente cu enzime de tipul catalazei şi celulazei în procesul de vopsire cu coloranţi reactivi 346–354
INESE PARKOVA, ALEKSANDRS VALIŠEVSKIS,ANDIS UŽĀNS, AUSMA VIĻUMSONE Analiza și perfecţionarea sistemului de alarmă pentru enurezis nocturn 355–361
GHEORGHE ORZAN, CLAUDIA ICONARU, IOANA CECILIA POPESCU,MIHAI ORZAN, OCTAV IONUȚ MACOVEI Analiza SEM a comportamentului de cumpărare online a articolelorvestimentare, bazată pe tehnica PLS. Importanța eWOM 362–367
DOCUMENTARE 312, 320,326, 333,361, 368
Editatã în 6 nr./an, indexatã ºi recenzatã în:Edited in 6 issues per year, indexed and abstracted in:
Science Citation Index Expanded (SciSearch®), Materials ScienceCitation Index®, Journal Citation Reports/Science Edition, World Textile
Abstracts, Chemical Abstracts, VINITI, Scopus
Revistã cotatã ISI ºi inclusã în Master Journal List a Institutului pentruªtiinþa Informãrii din Philadelphia – S.U.A., începând cu vol. 58, nr. 1/2007/ISI rated magazine, included in the ISI Master Journal List of the Instituteof Science Information, Philadelphia, USA, starting with vol. 58, no. 1/2007
¸
˘
301industria textila 2013, vol. 64, nr. 6˘
302industria textila 2013, vol. 64, nr. 6˘
IULIANA DUMITRESCUOVIDIU GEORGE IORDACHEANA MARIA MOCIOIUGHEORGHE NICULA
ALENKA PAVKO-CUDENURSKA STANKOVIĆ ELESINI
HONGYAN WU FUMEI WANG
JIHONG LIU BO ZHUHONGXIA JIANG RURU PANWEIDONG GAO
MIRELA BLAGA NECULAI-EUGEN SEGHEDINANA RAMONA CIOBANU
ANCA BUTNARIUGHEORGHE CONDURACHE
ĞASSAN ASKERONUR BALCI
INESE PARKOVAALEKSANDRS VALIŠEVSKISANDIS UŽĀNSAUSMA VIĻUMSONE
GHEORGHE ORZANCLAUDIA ICONARUIOANA CECILIA POPESCUMIHAI ORZANOCTAV IONUȚ MACOVEI
DOCUMENTARE
303
313
321
327
334
342
346
355
362
312, 320,326, 333,361, 368
Antimicrobial functionalization of textile materials with hydrophobins and Ag/ZnOcomposite nanopowders
Yarn diameter in elasticized knitted structures
Image measuring method for fiber length measurements
Yarn quality measurement by digital blackboard system
Warp knitted fabrics behaviour under dynamic testing
SWOT analysis of the efficiency in the production of technological steam for thetextile materials finishing
The combination of catalase and cellulase enzyme treatments with reactive dyeingprocess
Analysis and improvement of nocturnal enuresis alarm system
PLS-based SEM analysis of apparel online buying behavior. The importance ofeWOM
Documentation
Revista „INDUSTRIA TEXTILÓ, Institutul Naþional de Cercetare-Dezvoltare pentru Textile ºi Pielãrie – Bucureºti
Redacþia (Editura CERTEX), administraþia ºi casieria: Bucureºti, str. Lucreþiu Pãtrăºcanu nr. 16, sector 3, tel.: 021-340.42.00, 021-340.02.50/226, e-mail:[email protected]; Fax: +4021-340.55.15. Pentru abonamente, contactaþi redacþia revistei. Instituþiile pot achita abonamentele în contul nostru de vira-ment: RO25RNCB0074029214420001 B.C.R. sector 3, Bucureºti.
Lucrare realizatã în colaborare cu Editura AGIR , Calea Victoriei nr. 118, sector 1, Bucureºti, tel./fax: 021-316.89.92; 021-316.89.93; e-mail: [email protected], www.edituraagir.ro
Referenþii articolelor publicate în acest numãr al revistei INDUSTRIA TEXTILÃ/Scientific reviewers for the papers published in this number:
Cerc. şt. gr. III ing./Senior researcher eng. DOINA TOMACerc. şt. gr. III ing./Senior researcher eng. LILIOARA SURDU
Cerc. şt. gr. III ing./Senior researcher eng. RÃZVAN SCARLATCerc. şt. gr. III ing./Senior researcher eng. LAURA CHIRIAC
Prof. dr. ERHAN ÖNERProf. univ. dr. DOINA I. POPESCU
Contents

industria textila 2013, vol. 64, nr. 6˘
Textile materials can be exposed to contaminationwith micro-organisms during production, usage or
storage, particularly if the goods are left for a longtime in favorable conditions for microbial growth.Many different finishes applied on textiles such asanti-static, thickeners, lubricants, as well as grease,sweat and dead skin from the human body provide agreat source of nourishment for microbes, makingtextiles susceptible to microbial attack. Contaminationwith micro-organisms can lead to quality loss of thematerial itself (staining, fading and lowering tensilestrength) and can affect user’s comfort (smell, itching,and skin irritation). Moreover, since microbes areabsorbed by textiles there is a high risk of humancontamination and infection. Different finishing agentshave been used to improve the anti-microbialresistance of textiles, such as silver, ZnO, TiO2. Themain disadvantages of these compounds consist intheir low adherence and non-uniformity on the mate -rial surface. One method to avoid these drawbacks isthe use of hydrophobins. Class I and class II hydro -
phobins are small proteins containing around100–150 amino acids and eight cysteine units [1] thatform intra molecular disulphide bridges [2]. Due totheir self-assembling property at hydrophilic-hydro -phobic interfaces into amphipathic membranes [3]they can be used to prevent microbial cell adhesion[4], to attach different molecules (e.g. cells, proteins,antibodies, enzymes) to hydrophobic surfaces, toimprove the water resistance of hydrophilic sub -strates. The property of hydrophobins to coat anytype of surface with a 10 nm thin film was used in thetextile field to preserve the physical characteristicsand especially the comfort degree [5]; to modify thesurface wettability [6]; to fix metal oxides (ZnO, TiO2). The aim of this research was to develop protectiveantimicrobial textiles coatings with hydrophobins andAg/ZnO composite nanopowders. The antimicrobialfunctionalization of the textiles will assure the pro -tection of the materials from decay or degradation,control of staining caused by microbial growth andelimination of smells created by microbes.
REZUMAT – ABSTRACT
Funcționalizarea antimicrobiană a materialelor textile cu hidrofobine și nanopulbericompozite de Ag/ZnO
Scopul cercetării îl constituie realizarea de textile antimicrobiene din fire de bumbac și poliester, prin funcționalizarea cuhidrofobine și nanopulberi compozite de Ag/ZnO. Soluția coloidală de nanoparticule de Ag depuse pe nanoparticule deZnO a fost obținută prin sinteză chimică. Prin formarea de straturi proteice de hidrofobine, se urmărește o mai bunăuniformizare și fixare a nanoparticulelor de AgNp/ZnONp pe materialele textile, datorită formării de legături ionice cugrupe funcționale, punți oxo, legături Van der Waals sau integrării în structura conformațională a proteinelor. Materialeletratate au fost analizate atât din punct de vedere fizico-mecanic, cât și al eficienței antimicrobiene. Rezultatele audemonstrat că metoda folosită permite depunerea unui strat subțire de hidrofobine, la care AgNp/ZnONp aderă puternic.Caracteristicile fizico-mecanice sunt modificate nesemnificativ față de materialul inițial, netratat, păstrând confortul înprocesul de purtare. Testele antimicrobiene au indicat o eficiență crescută a materialelor împotriva microorganismeloranalizate.
Cuvinte-cheie: hidrofobine, Ag/ZnO, funcționalizare antimicrobiană, textile
Antimicrobial functionalization of textile materials with hydrophobins and Ag/ZnOcomposite nanopowders
The purpose of the research was to achieve antimicrobial textiles made of cotton and polyester yarns by function -alization with hydrophobins and pigments of Ag/ZnO composite nanopowders. The colloidal suspensions con sisting inAg nanoparticles deposited on ZnO nanoparticles were obtained by chemical synthesis. By forming protein layers ofhydrophobins, a better uniformity and fixation of AgNp/ZnONp on textile materials was aimed due to the formation ofionic bonds with functional groups, of oxo bridges, bonding through Van der Waals forces or integration in the proteinsconformational structure. The treated materials were analyzed in terms of physical-mechanical and antimicrobialeffectiveness. The results demonstrated that the used method allows the deposition of a uniform hydrophobins layer towhich AgNp/ZnONp adhere strongly. The physical-mechanical characteristics insignificantly modify to the initial,untreated material, preserving wear comfort. Bioassays showed high efficiency against tested microorganisms.
Key-words: hydrophobins, Ag/ZnO, antimicrobial functionalization, textiles
Antimicrobial functionalization of textile materials withhydrophobins and Ag/ZnO composite nanopowders
IULIANA DUMITRESCU ANA MARIA MOCIOIUOVIDIU GEORGE IORDACHE GHEORGHE NICULA
303industria textila 2013, vol. 64, nr. 6˘

EXPERIMENTAL PART
Materials and chemicals
As textile support for the deposition of hydrophobinslayers and subsequently AgNp/ZnONp solutions, a3/2 twill fabric made of 57.5% cotton in weft and42.5% polyester in warp was used. The samples areidentified using numerical codes, respectively 1, 2and 3.Ag/ZnONp suspensions prepared by “in situ” chem -ical reduction of Ag+ ions were acquired from ICPE,their characteristics being shown in table 1. Hydrophobins, H*Protein A (HA) and H*Protein B(HB), His6-tagged, from class I, were kindly providedby BASF-SE, Ludwigshafen, Germany. HA is a fusionprotein (yaaD-A. nidulans hydrophobin DewA-His6)with a molecular weight of about 47 kDa and HB(truncated yaaD-A. nidulans hydrophobin DewA-His6) has a molecular weight of about 19 kDa [7].
Method of preparing hydrophobins solutions
The hydrophobins solutions were prepared accordingto the producer specification, namely, by dissolvingprotein (3.25 g hydrophobin HA with an active con -tent of 61%, respectively 5 g hydrophobin HB with anactive content of 40%) in 1 000 mL of de-ionizedwater. The solutions were stirred with a magneticstirrer for 45 minutes at room temperature, after whichwere filtered and diluted with 3 000 mL Na-phos phatebuffer (pH 6.5 – 7) to achieve hydrophobine finalconcentration of 0.05 wt.%.
Method of treating textile materialswith hydrophobins and AgNp/ZnO Np
The fabric was immersed into 4 L of hydrophobinsolution (material: solution ratio of 1:8.88) and thetemperature was raised to 80°C and kept for 4 hours.Then 8 g of sodium dodecylsulphate (SDS) (93%,Consors) were added in the hydrophobin bath andthe solution was heated to 100°C for 10 minutes toform an insoluble, stable hydrophobin beta-sheet onthe textiles surface. Next, the material was washedwith distilled water and left to dry at room temper -ature. Due to the very slight increase of fabricsweight, the fabric was re-immersed into a fresh
hydrophobin solution and maintained at 25°C for24 hours. The purpose was to obtain a thicker layerof hydrophobins which could include a higher amountof nanoparticles.The fabrics previously covered with hydrophobinswere immersed in Ag/ZnONp suspensions and ultra -sonicated for 0.5 hours, washed with distilled waterand dried at room temperature.
Analyses
Physical and mechanical analysis of fabrics treatedwith hydrophobins HA and HB and Ag/ZnONp wereperformed according to the ISO standards. The mor -phology of fabrics was analyzed by scanning electronmicroscopy (SEM, Quanta 200-FEI Netherland). Theelemental composition was assessed by SEM/EDAX.The antibacterial efficiency was tested according toASTM E2149-01 and ISO 20743:2007 standard againstPseudomonas aeruginosa (ATCC 9027), Staphylo -coccus aureus (ATCC 6538) and Escherichia coli(ATCC 8739). The effect of treatment on Aspergillusniger colony was visualized on SEM: the untreatedand treated fabrics were inoculated with a fungalsuspension of Aspergillus niger, fresh culture, grownon Czapek-Dox nutritive media. After the 2 days incu -bation at 28°C, the samples were visualized by SEM.
RESULTS AND DISCUSSIONS
Physical and mechanical characterizationof fabrics treated with hydrophobins andAgNp/ZnONp
The characteristics of fabrics, both untreated andtreated with hydrophobins HA and HB are presentedin table 2.The deposition of a thick layer (26 µm) hydrophobinson fabrics is demonstrated by the growth of mass,thickness, yarn diameter, yarn density and air/waterpermeability of materials, especially for hydrophobinA after the second treatment. The amphipathic char -acter of hydrophobins allows them to be deposited onhydrophobic (polyester) and hydrophilic (cotton)materials. The amount of hydrophobin HA depositedon the polyester (warp) yarns is more than doublethan on cotton (weft) yarns indicating the presence of
304industria textila 2013, vol. 64, nr. 6˘
Table 1
PHYSICAL AND OPTICAL CHARACTERISTICS OF AG/ZnO COMPOSITE NANOPOWDERS SUSPENSIONS
Samplecode
AgNp/ZnONpsuspensiondescription
Npaverage
diameter,nm
Standarddeviation,
nm
Poly-dispersity
index
Zetapotential,
ζ, mV
SuspensionpH value
Absorbance,a.u.
Wavelength,nm
1 5 wt% ZnONp,75 ppm AgNp
42.0 2.8 0.122 –41.25 9.410.299 0.189 0.233 0.177 0.237
686 453 424 376 343
2 5 wt% ZnONp,750 ppm AgNp
78.3 6.7 0.103 –52.43 9.830.280 0.112 0.196 0.154 0.216
687 446 421 377 341
3 5 wt% ZnONp,1 500 ppm AgNp
93.4 8.9 0.050 –64.28 9.450.339 0.144 0.231 0.133 0.219
685 452 423 373 344
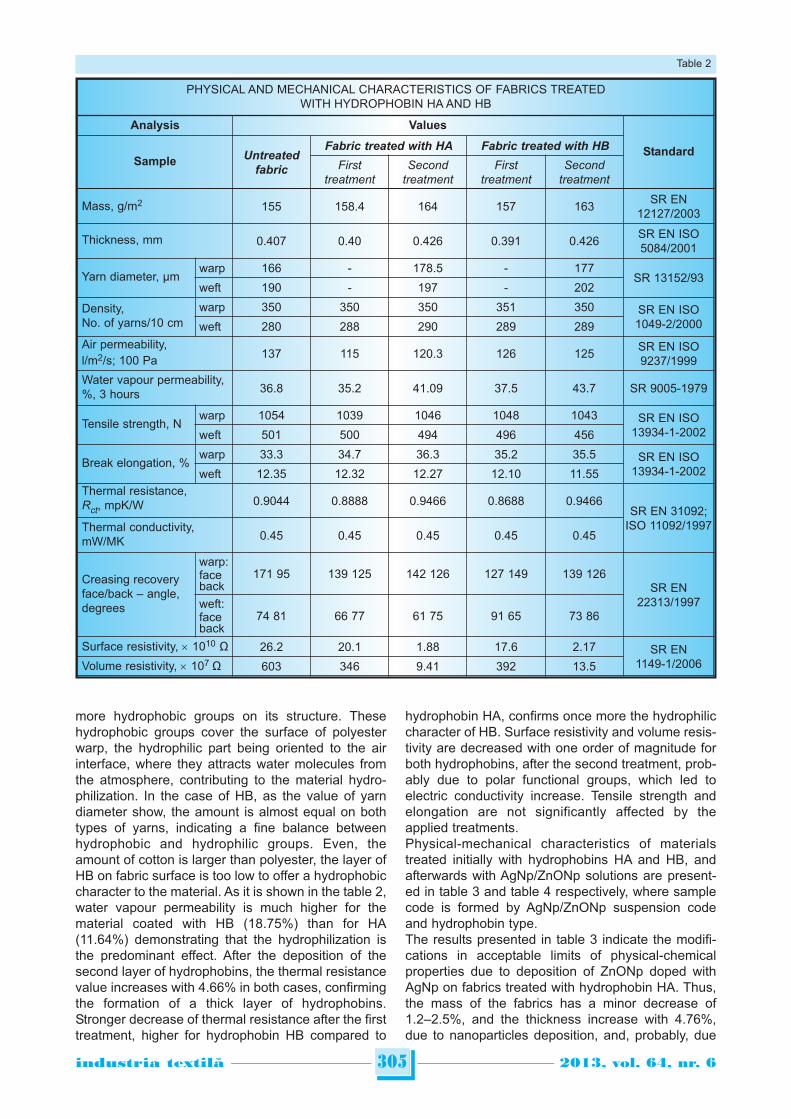
more hydrophobic groups on its structure. Thesehydrophobic groups cover the surface of polyesterwarp, the hydrophilic part being oriented to the airinterface, where they attracts water molecules fromthe atmosphere, contributing to the material hydro -philization. In the case of HB, as the value of yarndiameter show, the amount is almost equal on bothtypes of yarns, indicating a fine balance betweenhydrophobic and hydrophilic groups. Even, theamount of cotton is larger than polyester, the layer ofHB on fabric surface is too low to offer a hydrophobiccharacter to the material. As it is shown in the table 2,water vapour permeability is much higher for thematerial coated with HB (18.75%) than for HA(11.64%) demonstrating that the hydrophilization isthe predominant effect. After the deposition of thesecond layer of hydrophobins, the thermal resistancevalue increases with 4.66% in both cases, confirmingthe formation of a thick layer of hydrophobins.Stronger decrease of thermal resistance after the firsttreatment, higher for hydrophobin HB compared to
hydrophobin HA, confirms once more the hydrophiliccharacter of HB. Surface resistivity and volume resis -tivity are decreased with one order of magnitude forboth hydrophobins, after the second treatment, prob -ably due to polar functional groups, which led toelectric conductivity increase. Tensile strength andelon gation are not significantly affected by theapplied treatments. Physical-mechanical characteristics of materialstreated initially with hydrophobins HA and HB, andafterwards with AgNp/ZnONp solutions are present -ed in table 3 and table 4 respectively, where samplecode is formed by AgNp/ZnONp suspension codeand hydrophobin type.The results presented in table 3 indicate the modifi -ca tions in acceptable limits of physical-chemicalproperties due to deposition of ZnONp doped withAgNp on fabrics treated with hydrophobin HA. Thus,the mass of the fabrics has a minor decrease of1.2–2.5%, and the thickness increase with 4.76%,due to nanoparticles deposition, and, probably, due
305industria textila 2013, vol. 64, nr. 6˘
Table 2
PHYSICAL AND MECHANICAL CHARACTERISTICS OF FABRICS TREATEDWITH HYDROPHOBIN HA AND HB
Analysis Values
StandardSample Untreated
fabric
Fabric treated with HA Fabric treated with HBFirst
treatmentSecond
treatmentFirst
treatmentSecond
treatment
Mass, g/m2 155 158.4 164 157 163SR EN
12127/2003
Thickness, mm 0.407 0.40 0.426 0.391 0.426SR EN ISO5084/2001
Yarn diameter, µmwarp 166 - 178.5 - 177
SR 13152/93weft 190 - 197 - 202
Density, No. of yarns/10 cm
warp 350 350 350 351 350 SR EN ISO1049-2/2000weft 280 288 290 289 289
Air permeability, l/m2/s; 100 Pa 137 115 120.3 126 125
SR EN ISO9237/1999
Water vapour permeability,%, 3 hours 36.8 35.2 41.09 37.5 43.7 SR 9005-1979
Tensile strength, Nwarp 1054 1039 1046 1048 1043 SR EN ISO
13934-1-2002weft 501 500 494 496 456
Break elongation, %warp 33.3 34.7 36.3 35.2 35.5 SR EN ISO
13934-1-2002weft 12.35 12.32 12.27 12.10 11.55Thermal resistance, Rct, mpK/W 0.9044 0.8888 0.9466 0.8688 0.9466
SR EN 31092;ISO 11092/1997Thermal conductivity,
mW/MK 0.45 0.45 0.45 0.45 0.45
Creasing recoveryface/back – angle,degrees
warp:faceback
171 95 139 125 142 126 127 149 139 126SR EN
22313/1997weft:faceback
74 81 66 77 61 75 91 65 73 86
Surface resistivity, × 1010 Ω 26.2 20.1 1.88 17.6 2.17 SR EN1149-1/2006Volume resistivity, × 107 Ω 603 346 9.41 392 13.5

to a contraction of the fabric as seen from increasingdensity of warp polyester fibers. Noteworthy is theincrease of yarn diameter of weft cotton fibers simul -taneously with increase of AgNp concentration, unlikepolyester fibers, whose diameter decreases. It canbe advanced the hypothesis that cotton fibers,wrapped in hydrophobin HA, are oriented withnonpolar, hydrophobic groups towards the exterior,and with polar, hydrophilic groups towards thesurface of the fibers. Instead, on the polyester fibers,in case of HA, the nonpolar groups are orientedtowards the surface of the fibers and the polar groupstowards the exterior. Consequently, Ag/ZnO nano -particles, having a polar character, are attracted bypolar groups of hydrophobin HA existent on cotton, inlarger quantity than on polyester fibers. Also, chem -ical interactions are possible, forming of oxo bridgesand Van der Waals bonds between hydrophobinfunctional groups and ZnO. With the increase of
AgNp concentration air permeability decreases ininsignificant proportion for the first two concentrations(2.24%, respectively 2.44%) and slightly higher(11.2%) for the fabric treated with the solution con -taining 1 500 ppm AgNp showing a higher depositionof nanoparticles on the fabric. Water vapor perme -ability of materials treated with hydrophobin HA andAgNp/ZnONp decreases compared to the one offabrics treated only with hydrophobins. Comparingonly the fabrics treated with hydrophobin HA andAgNp/ZnONp it is observable an increase in watervapor permeability as the concentration of AgNp/ZnONp increases, which shows, on one hand, thatwith the increase of nanoparticles concentration takesplace an increasing in AgNp/ZnONp deposition onthe fabric, and on the other hand, AgNp/ZnONp arehydrophilic and retain a larger amount of water vaporsfrom the atmosphere. Surface resistivity increases bytwo orders of magnitude in samples treated with
306industria textila 2013, vol. 64, nr. 6˘
Table 3
Table 4
PHYSICAL AND MECHANICAL CHARACTERISTICS OF FABRICS TREATEDWITH HYDROPHOBIN HB AND AgNp/ZnONp
Analysis ValuesStandard
Sample code HA (control) 1HA 2HA 3HA
Mass, g/m2; Δ% 163 158/3 160/1.8 162/0.6 SR EN 12127/2003
Thickness, mm 0.426 0.44 0.44 0.43 SR EN ISO 5084/2001
Yarn diameter, µm
warp 177 173.5 171.0 175.5SR 13152/93
weft 202 204.0 201.5 202.0
Density, no. yarns/10 cm
warp 350 350 351 350SR EN ISO 1049-2/2000
weft 289 283 288 290
Air permeability, l/m2/s; 100 Pa 125 123.7 124 120.2 SR EN ISO 9237/1999
Water vapour permeability,%, 3 hours 43.7 42.8 37.7 43.3 SR 9005-1979
Surface resistivity, ×1010 Ω 2.17 32.7 18.6 15.3SR EN1149-1/2006
Volume resistivity, ×107 Ω 1.35 15.6 30 29
PHYSICAL AND MECHANICAL CHARACTERISTICS OF FABRICS TREATEDWITH HYDROPHOBIN HA AND AgNp/ZnONp
Analysis ValuesStandard
Sample code HA (control) 1HA 2HA 3HA
Mass, g/m2 164 160 162 162 SR EN 12127/2003
Thickness, mm 0.426 0.44 0.44 0.44 SR EN ISO 5084/2001
Yarn diameter, µmwarp 178.5 169.5 175.5 173.5
SR 13152/93weft 197 198.0 202.5 203.5
Density, no. fibers/10 cmwarp 350 350 351 353
SR EN ISO 1049-2/2000weft 290 286 288 290
Air permeability, l/m2/s; 100 Pa 120.3 117.6 115 106.8 SR EN ISO 9237/1999
Water vapour permeability,%, 3 hours 41.09 39.6 40.2 40.6 SR 9005-1979
Surface resistivity, ×1010 Ω 1.88 538 413 216SR EN1149-1/2006
Volume resistivity, ×107 Ω 9.41 216 340 173

307industria textila 2013, vol. 64, nr. 6˘
AgNp/ZnONp than those treated with hydrophobins,the largest increase occurring in the sample treatedwith the lowest concentration of nanoparticles.Studies by Jose and Khadar [8] on the behavior of amixture of ZnO and Ag (5–30%) nanoparticles sug -gest that this increase in resistance is determined bythe presence of Ag particles at the edge of theparticles. Due to charge difference from zinc ions,silver ions, have the tendency to accumulate at theinterface of zinc particles, creating an electrostaticbarrier against the movement of electrons andincreasing the resistance of ZnO system doped withAg [9]. As the AgNp concentration increases there isa half decrease of surface resistivity, probably due toreduced distance between silver inclusions, whichmeans that a greater number of AgNp provide aneasier dispersion of electrostatic charges on thesurface of the fabric.As with fabrics treated with hydrophobin HA, themass of fabrics treated with hydrophobin HB anddispersions of AgNp/ZnONp decreases by 0.6–3%while the thickness grows insignificant. Comparingonly the values obtained in case of samples 1HB,2HB and 3HB, it is visible a parallel increase in massand density on weft with increasing quantity of AgNp/ZnONp showing a deposition of a greater quantity ofnanoparticles with increasing concentra tion of thesolutions. Although air permeability doesn’t have alinear variation with increasing AgNp/ZnONp concen -tration, the lowest value is recorded for the material
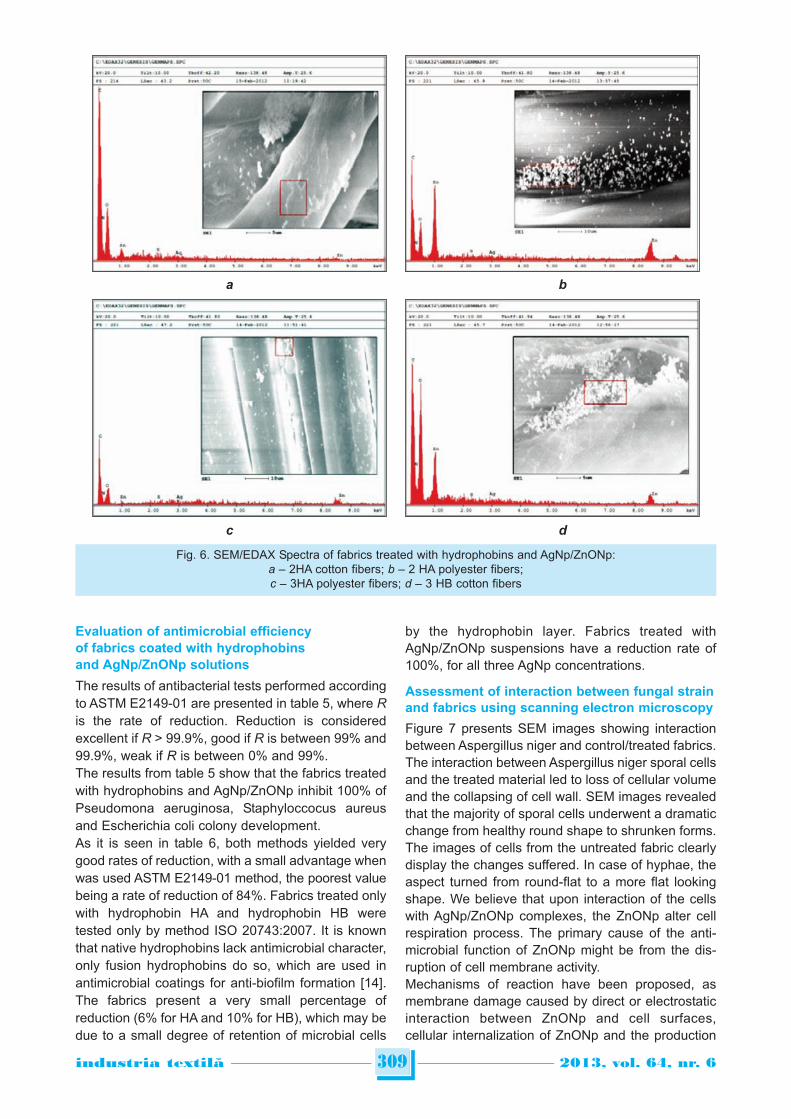
treated with the highest concentration of nano par -ticles, demonstrating once more that treatment with ahigh concentration leads to the deposition of a greateramount of nanoparticles on the fabric. The hypothesis is confirmed by the lowest value of airpermeability together with the highest value of watervapor permeability. The deposition of a higherquantity of AgNp/ZnONp on the surface of the fabricand between fibers, involves, on one hand, passing asmaller amount of air through the fabric, and on theother hand, the absorption of a higher quantity ofwater vapors from the atmosphere. Comparativelywith fabrics treated with hydrophobin HA, the onestreated with hydrophobin HB and AgNp/ZnONp showa significant drop in volume and surface resistivity,with increasing concentration of AgNp/ZnONp. Thisrequires a higher deposition of nanoparticles on thefabrics treated with hydrophobin HB than thosetreated with hydrophobin HA. The SEM images of thefabrics treated with hydrophobins and AgNp/ZnONpare presented in figures 1–5.From SEM images, it is visible that the hydrophobinsdeposited on polyester/cotton fabric at 80°C in pres -ence of SDS, differently cover the fibers dependingon their polarity and structure. Thus, hydrophobin HAcovers polyester fibers as flakes, with various sizes,and cotton fibers as parallel, relatively thick rodlets.This confirms literature data according to which thehydrophobic part of hydrophobins layers has theshape of parallel fibrils with amyloidal structure.
a b cFig. 1. SEM images of fabrics treated with hydrophobin HA:
a – polyester fibers; b – cotton fibers; c – detail of hydrophobin HA fibrils on glass slide
a b cFig. 2. SEM images of fabrics treated with hydrophobin HB:
a – polyester fibers; b – cotton fibers; c – detail of hydrophobin HB on glass slide

308industria textila 2013, vol. 64, nr. 6˘
Instead, hydrophobin HB covers the polyester fibersas thin layers on which surface it is distinguishable amultitude of small multi-fibril clusters, and on cottonfibers as a thick layer, of amyloidal fibrils. On theglass slide, after an incubation time of 24 hours, atroom temperature, hydrophobin HA forms amyloidalstructures, and hydrophobin HB forms a thick layerwith many bumps.Figures 3–5 show a large deposition of AgNp/ZnONpon both cotton and polyester fibers, deposition that iseven greater as the AgNp/ZnONp concentration ishigher. If at low concentrations, the deposition is rel -atively uniform, as the concentration increases, thenanoparticles tend to stick together, thus forming
clusters due to Van der Waals attraction forces. Also,it is clearly visible the deposition of a greater numberof nanoparticles on fabrics treated with hydrophobinHB than those treated with hydrophobin HA. Thepresence of ZnO, Ag and hydrophobins on the fabricsis highlighted by SEM/EDAX spectra (fig. 6).Peaks located at 1.03 KeV and 8.62 KeV (9.59 KeV)can be attributed to Zn [10] – [12] and those locatedat 2.98 KeV and 3.14 KeV to silver [13]. The sulphurspecific peaks (around 2.40 KeV) found on the treatedfabrics, can be attributed to the existence of cysteiniccomponents of the hydrophobins. The presence ofhydrophobins on fabrics is demonstrated by C, N andO peaks.
a b c dFig. 3. SEM images of cotton/polyester fabric treated with AgNp/ZnONp solution containing
5 wt.% ZnONp and 75 ppm AgNp: a – polyester fibers/HA/AgNp/ZnONp; b – polyester fibers/HB/AgNp/ZnONp;
c – cotton fibers/HA/AgNp/ZnONp; d – cotton fibers/HB/AgNp/ZnONp
a b c dFig. 4. SEM images of cotton/polyester fabric treated with AgNp/ZnONp solution containing
5 wt.% ZnONp and 750 ppm AgNp: a – polyester fibers/HA/AgNp/ZnONp; b – polyester fibers/HB/AgNp/ZnONp;
c – cotton fibers/HA/AgNp/ZnONp; d – cotton fibers/HB/AgNp/ZnONp
a b c dFig. 5. SEM images of cotton/polyester fabric treated with AgNp/ZnONp solution containing
5 wt.% ZnONp and 1 500 ppm AgNp: a – polyester fibers/HA/AgNp/ZnONp; b – polyester fibers/HB/AgNp/ZnONp;
c – cotton fibers/HA/AgNp/ZnONp; d – cotton fibers/HB/AgNp/ZnONp
309industria textila 2013, vol. 64, nr. 6˘
Evaluation of antimicrobial efficiencyof fabrics coated with hydrophobinsand AgNp/ZnONp solutions
The results of antibacterial tests performed accordingto ASTM E2149-01 are presented in table 5, where Ris the rate of reduction. Reduction is consideredexcellent if R > 99.9%, good if R is between 99% and99.9%, weak if R is between 0% and 99%.The results from table 5 show that the fabrics treatedwith hydrophobins and AgNp/ZnONp inhibit 100% ofPseudomona aeruginosa, Staphyloccocus aureusand Escherichia coli colony development.As it is seen in table 6, both methods yielded verygood rates of reduction, with a small advantage whenwas used ASTM E2149-01 method, the poorest valuebeing a rate of reduction of 84%. Fabrics treated onlywith hydrophobin HA and hydrophobin HB weretested only by method ISO 20743:2007. It is knownthat native hydrophobins lack antimicrobial character,only fusion hydrophobins do so, which are used inantimicrobial coatings for anti-biofilm formation [14].The fabrics present a very small percentage ofreduction (6% for HA and 10% for HB), which may bedue to a small degree of retention of microbial cells
by the hydrophobin layer. Fabrics treated withAgNp/ZnONp suspensions have a reduction rate of100%, for all three AgNp concentrations.
Assessment of interaction between fungal strainand fabrics using scanning electron microscopy
Figure 7 presents SEM images showing interactionbetween Aspergillus niger and control/treated fabrics.The interaction between Aspergillus niger sporal cellsand the treated material led to loss of cellular volumeand the collapsing of cell wall. SEM images revealedthat the majority of sporal cells underwent a dramaticchange from healthy round shape to shrunken forms.The images of cells from the untreated fabric clearlydisplay the changes suffered. In case of hyphae, theaspect turned from round-flat to a more flat lookingshape. We believe that upon interaction of the cellswith AgNp/ZnONp complexes, the ZnONp alter cellrespiration process. The primary cause of the anti -micro bial function of ZnONp might be from the dis -ruption of cell membrane activity. Mechanisms of reaction have been proposed, asmembrane damage caused by direct or electrostaticinteraction between ZnONp and cell surfaces,cellular internalization of ZnONp and the production
Fig. 6. SEM/EDAX Spectra of fabrics treated with hydrophobins and AgNp/ZnONp:a – 2HA cotton fibers; b – 2 HA polyester fibers; c – 3HA polyester fibers; d – 3 HB cotton fibers
a b
c d

310industria textila 2013, vol. 64, nr. 6˘
ANTIBACTERIAL EFFICIENCY AGAINST PSEUDOMONAS AERUGINOSA (ATCC 9027),STAPHYLOCOCCUS AUREUS (ATCC 6538) AND ESCHERICHIA COLI (ATCC 8739) OF FABRICS
TREATED WITH HYDROPHOBINS AND AgNp/ZnONp ACCORDING TO ASTM E2149-01
Samplecode
Antibacterial efficiency
Pseudomonas aeruginosa(ATCC 9027)
Staphylococcus aureus(ATCC 6538)
Escherichia coli(ATCC 8739)
T0,
CFU/mL
T24,
CFU/mLR,%
Log.red
T0,
CFU/mL
T24,
CFU/mLR,%
Log.red
T0,
CFU/mL
T24,
CFU/mLR,%
Log.red
1HA 0.3 × 10⁵ 0 100 4.47 0.13 × 10⁵ 0 100 4.11 0.13 × 10⁵ 0 100 4.11
2HA 0.3 × 10⁵ 0 100 4.47 0.12 × 10⁵ 0 100 4.08 0.3 × 10⁵ 0 100 4.47
3HA 0.3 × 10⁵ 0 100 4.47 0.14 × 10⁵ 0 100 4.14 0.14 × 10⁵ 0 100 4.14
1HB 0.3 × 10⁵ 0 100 4.47 0.7 × 10⁴ 0 100 4.84 0.3 × 10⁵ 0 100 4.47
2HB 0.3 × 10⁵ 0 100 4.47 0.1 × 10⁵ 0 100 4 0.1 × 10⁵ 0 100 4
3HB 0.3 × 10⁵ 0 100 4.47 0.1 × 10⁵ 0 100 4 0.1 × 10⁵ 0 100 4
Table 5
Fig. 7. Interaction between Aspergillus niger and the control/treated fabrics:a and c – untreated fabrics; b and d – 3 HA
a b
c d

311industria textila 2013, vol. 64, nr. 6˘
of active oxygen species, such as H2O2 [15]. TheAgNp themselves present a highly reactive potential,with high antimicrobial efficiency [16]. The AgNp can disrupt the transport systems, includ ingion efflux, which leads to inter rupting cellular pro -cess es, such as respiration and metabolism spe cificreactions [17]. Sulfur-containing proteins from the cellwall are likely to be preferential sites for AgNp binding.
CONCLUSIONS
The used method allows the obtaining of uniformlayers of hydrophobins and AgNp/ZnONp on cot -ton/poly ester fabrics. Hydrophobins films allow abetter fixation of AgNp/ZnONp on the surface of the
fabrics due to the formation of ionic bonds withfunctional groups, of oxo bridges (–O–), bondingthrough Van der Waals forces or of integration inprotein conformational structure. As the concentra -tion of AgNp increases, the number of nanoparticlesthat are deposited on the fabric increases as well.Physical-mechanical properties of the materialstreated in this way do not change significantly. Theincrease of surface electrical resistivity suggests theaccumulation of AgNp at the edges of ZnONp wherean electrostatic barrier is created. This barrierdecreases as the concentration of AgNp increases.Bioassays have shown great effectiveness againstthe tested microorganisms.
ANTIFUNGAL EFFICIENCY AGAINST CANDIDA ALBICANS STRAIN OF FABRICS TREATED WITHHYDROPHOBINS AND AgNp/ZnONp ACCORDING TO ASTM E2149-01 AND ISO 20743:2007
Sample code
Results, according to:
ASTME 2149-01
ISO 20743:2007
ASTME 2149-01
ISO 20743:2007
ASTM E 2149-01
ISO 20743:2007
ASTME 2149-01
ISO 20743:2007
T0, CFU/mL T24, CFU/mL R, % Log. redControl(untreatedmaterial)
N/A N/A N/A 1 × 10⁴ N/A N/A N/A N/A
HA (control) N/A N/A N/A 9.4 × 10³ N/A 6 N/A 0.03
HB (control) N/A N/A N/A 9 × 10³ N/A 10 N/A 0.05Material treatedwith solution 1 N/A N/A N/A 0 N/A 100 N/A 4
Material treatedwith solution 2 N/A N/A N/A 0 N/A 100 N/A 4
Material treatedwith solution 3 N/A N/A N/A 0 N/A 100 N/A 4
1HA 0.1 × 10⁵ N/A 0 0 100 100 4 4
2HA 0.2 × 10⁵ N/A 0 0 100 100 4.30 4
3HA 0.3 × 10⁵ N/A 0 0 100 100 4.47 4
1HB 0.2 × 10⁵ N/A 0 4.8 × 10² 100 95.2 4.30 1.32
2HB 0.3 × 10⁵ N/A 0 2 × 101 100 99.8 4.47 2.7
3HB 0.2 × 10⁵ N/A 0 2 × 101 100 99.8 4.30 2.7
Table 6
BIBLIOGRAPHY
[1] Wessels, J. G. H. Developmental regulation of fungal cell wall formation. In: Annual Rewiev of Phytopathology,1994, vol. 32, pp. 413–37
[2] Wösten, H. A., Vocht, M. L. Hydrophobins: The fungal coat unravelled. In: Biochimica and Biophysica Acta, 2000,vol. 1 469, pp. 79–86
[3] Wösten, H. A. B., Asgeirsdóttir, S. A., Krook, J. H., Drenth, J. H., Wessels, J. G. The fungal hydrophobin Sc3pself-assembles at the surface of aerial hyphae as a protein membrane constituting the hydrophobic rodlet layer.In: European Journal of Cell Biology, 1994, vol. 63, issue 1, p. 122–9
[4] Subkowski, T., Weickert, U. Coated stents and process for coating with protein. WIPO Patent ApplicationsWO/2011/121009
[5] Bauermann, L. P., del Campo, A., Bill, J., Aldinger, F. Heterogeneous nucleation of ZnO using gelatin as the organicmatrix. In: Chemistry of Materials, 2006, vol. 18, pp. 2 016–20
[6] Opwis, K., Gutmann, J. S. Surface modification of textile materials with hydrophobins. In: Textile ResearchJournal, 2011, vol. 81, issue 15, pp. 1 594–602

312industria textila 2013, vol. 64, nr. 6˘
Authors:
Cerc. şt. gr. III dr. ing. IULIANA DUMITRESCUAsist. cerc. şt. drd. ing. OVIDIU GEORGE IORDACHE
Cerc. şt. gr. III dr. ing. ANA MARIA MOCIOIUCerc. şt. gr. III drd. ing. GHEORGHE NICULA
Institutul Național de Cercetare-Dezvoltare pentru Textile și PielărieStr. Lucreţiu Pătrăşcanu nr. 16, 030508 Bucureşti
e-mail: [email protected];[email protected]
Corresponding author:
OVIDIU-GEORGE IORDACHEe-mail: [email protected]
[7] Wohlleben, W., Subkowski, T., Bollschweiler, C., von Vacano, B., Liu, Y., Schrepp, W. et al. Recombinantly producedhydrophobins from fungal analogues as highly surface-active performance proteins. In: European BiophysicsJournal, 2010, vol. 39, issue 3, pp. 457–680
[8] Jose, J., Khadar, M. A. Role of grain boundaries on the electrical properties of ZnO–Ag nanocomposites: animpedance spectroscopic study. In: Acta Mater, 2001, vol. 49, pp. 729–735
[9] Kuo, S. T., Tuan, W. H., Shieh, J., Wang, S. F. Effect of Ag on the microstructure and electrical properties of ZnO.In: Journal of the European Ceramic Society, 2007, vol. 27, pp. 4 521–2
[10] Büsgen, T., Hilgendorff, M., Irsen, S., Wilhelm, F., Rogalev, A., Goll, D. et al. Colloidal cobalt-doped ZnO nanorods:synthesis, structural and magnetic properties. In: Journal of Physical Chemistry, 2008, vol. 112, pp. 2 412–17
[11] Qi, H., Alexson, D. A., Glembocki, O. J., Prokes, S. M. Synthesis and oxidation of silver nano-particles. Proceedingsof SPIE 2011, 7947: 79470Y-1-11
[12] Lazić, V., Vodnik, V., Nedeljković, J., Šaponjić, Z., Jovančić, P., Radetić, M. Antibacterial and colorimetric evaluationof cotton fabrics dyed with direct dyes and loaded with Ag nanoparticles. In: Industria Textilă, 2013, vol. 64, issue2, pp. 89–97
[13] Chuang, H. Y., Chen, D. H. Fabrication and photocatalytic activities in visible and UV light regions of Ag@TiO2 andNiAg@TiO2 nanoparticles. In: Nanotechnology, 2009, vol. 20, issue 10, p. 105 704
[14] Rieder, A., Schwartz, T., Obst, U., Bollschweiler, C., Gutt, B., Zoller, J. et al. Hydrophobins – using hydrophobins toprevent microbial biofilm growth on mineral surfaces. In: Geotechnologien Science Report, 2010, vol. 16, pp. 3–18
[15] Stoimenov, P. K., Klinger, R. L., Marchin, G. L., Klabunde, K. J. Metal oxide nanoparticles as bactericidal agents.Langmuir, 2002, vol. 18, pp. 6 679–86
[16] Khoddami, A., Shokohi, S. S., Sebdani, Z. M. A facile method for anti-bacterial finishing of cotton fabrics using silvernanoparticles. In: Industria Textilă, 2012, vol. 63, issue 1, pp. 20–26
[17] Min, J. S., Kim, K. S., Kim, S. W., Jung, J. H., Lamsal, K., Kim, S. B. et al. Effects of colloidal silver nanoparticleson sclerotium-forming phytopathogenic fungi. In: Plant Pathology Journal, 2012, vol. 25, issue 4, pp. 376–380
DOCUMENTARE
PROCES ECOLOGIC DE FINISARE A BLUGILOR
Furnizorul tehnologiei de finisare a suprafeţei blugilor,Jeanologia, din Paterna/Spania, a expus noul laser3E Twin Jeanologia, pentru prima dată, la MunichFabric Start, desfășurat în februarie 2013, laMunchen, Germania. Tehnologia cu laser de finisare a textilelor este con -cepută pe baza celor trei principii “Ecologie, Eficienţăşi Etică” (3E). Acest lucru permite ca, în procesul definisare a blugilor, să se realizeze atât o scurtare a
timpului, cât și o economisire a energiei, apei şi pro -duselor chimice. 3E Twin Jeanologia este utilizat în producţia blugilor,la scară industrială, datorită faptului că noul lasereste echipat cu doi rezonatori laser, permițând fini -sarea simultană a celor două părţi ale pantalonilor. Astfel, este posibilă o producţie de 100–200 de pe -rechi de blugi pe oră, spre deosebire de 10 perechipe oră în cazul sablării manuale sau de numai 60 deperechi pe oră în cazul tehnicilor de sablare utilizatepână în prezent.
Melliand International, martie 2013, p. 12
Noi tehnologii

Nowadays, elastane threads are often incor po -rated in knitted fabrics to improve their elastic
recovery. Highly extensible yarns with elastane coreare at least two-component and two-layered, as aresult they are therefore non-homogeneus, whichaffects the uniformity of the yarn diameter. Knittingwith elasticized yarns results in compact structurebecause of the yarn extension during loop formation,fabric relaxation after knitting and during wet pro -cesses and yarn compression within the knittedstructure which reflects in the yarn cross-sectionchange. The shrinkage of knitted fabrics made from highlyelastic yarns with the elastane core after the wetrelaxation is significantly higher than the shrinkage ofthe knitted fabric made from yarns without the elas -tane core. A very compact elasticized knitted struc -ture can be defined as a supercompact structure [1]where the yarn compression in the interlockingregion of the loops can be forcast. The yarn diameterwithin the structure varies with the tightness ofknitting [2]. As the tightness of the knitted structurechanges during relaxation, the change of the yarn
diameter within knitted structure during relaxationcan be anticipated.Yarn diameter is a knitted fabric parameter which isdifficult to determine as the yarn is not a solid body ofuniform and known density; its porosity may amountto 30–70%. The yarn core is dense while the yarnsheath consists of free ends of the fibers that pro -trude from the yarn surface [3], [4]. Low twist of theknitting yarns results in a variable real yarn diameterwithin the knitted structure [2]. There are many methods for measuring yarn diam -eter and yarn compression. These methods haveundergone considerable change and developmentover the years. However, none of them have beenaccepted as a standard method. A typical classifi ca -tion of the methods is as follows: • measuring yarn diameter via mass and length;• measuring yarn diameter using optical methods;• measuring yarn diameter by employing mechani-
cal methods [5].The first two methods involve measuring yarn diam -eter free from any forces, i.e. free from lateral forcesin a non-compressed state. There is usually only a
Yarn diameter in elasticized knitted structures
ALENKA PAVKO-CUDEN URSKA STANKOVIĆ ELESINI
REZUMAT – ABSTRACT
Diametrul firelor din structurile tricotate elasticizate
Diametrul este un parametru de bază al firelor, care depinde atât de densitatea liniară, cât şi de structura acestora și decompoziția materialului. În prezent, în materialele tricotate, adesea, sunt încorporate fire foarte flexibile, cu miez deelastan. Acestea nu sunt omogene, ceea ce afectează uniformitatea diametrului firului. De obicei, structurile tricotaterealizate din fire convenționale sunt poroase, în timp ce tricotarea cu fire elasticizate are ca rezultat o structurăcompactă, cu efect de compresiune a firelor în cadrul buclei tricotate. Scopul studiului îl constituie comparareadiametrelor firelor elasticizate, realizate prin diverse procese, cu diametrele firelor tradiţionale fără elastan, toate acestefire fiind realizate din fibre identice, cu densitate liniară identică și torsiune comparabilă. Modificarea diametrului firului,după relaxarea în stare umedă, a fost observată în cazul tuturor firelor testate. Rezultatele au arătat că diametrele firelor,determinate prin măsurători sau calculate din valorile parametrilor structurii fibrei sau a firului, au crescut în timpulrelaxării în stare umedă. Diametrul firului în punctele de interţesere orizontale ale buclei, calculate pe baza parametrilorstructurilor tricotate, a scăzut în timpul relaxării în stare umedă.
Cuvinte-cheie: diametrul firelor, grosimea firelor, structură tricotată, tricot glat, relaxare, elastan, analiza imaginilor
Yarn diameter in elasticized knitted structures
Yarn diameter is a basic yarn parameter dependent on yarn linear density, yarn structure and its material composition.Nowadays, highly extensible yarns with elastane core are often incorporated in knitted fabrics. They are non-homogeneus which affects the uniformity of the yarn diameter. Knitted structures made from conventional yarns areusually porous while knitting with elasticized yarns results in a compact structure with yarn compression within theknitted loop. The objective of this research was to compare yarn diameters of elasticized yarns produced by variousprocesses and yarn diameters of conventional yarns without elastane, all made from identical fibers with the identicallinear density and comparable twist. The change of the yarn diameter after wet relaxation was observed for allinvestigated yarns. The results showed that yarn diameters, determined either by measurements or calculated from thefiber or yarn structure parameters, increased during wet relaxation. The yarn diameter within the loop horizontalinterlocking points calculated from the knitted structure parameters decreased during wet relaxation.
Key-words: yarn diameter, yarn thickness, knitted structure, single jersey, relaxation, elastane, image analysis
313industria textila 2013, vol. 64, nr. 6˘

314industria textila 2013, vol. 64, nr. 6˘
small longitudinal force (tension) on the yarn to keepit straight [4]. Measuring yarn diameter by micro -scopic observation and optical-projection methodinvolves subjective determination of the yarn bound -aries in the unloaded state, which is a weak point ofthese methods. Measuring yarn diameter via mechanical measuringhead involves inserting the yarn between suitableelements, one of which is fixed while the other can bedisplaced freely. Mechanical methods of measuringyarn diameter include direct compression of the yarn.Considering the fact that the yarn is compressedduring weaving and knitting, mechanical methodsenable experimental results that may exhibit the realgeometry of the flat textile structure [5], [6]. Many researchers have investigated yarn geomet -rical parameters and measured yarn diameter byvarious methods [7] – [26] which indicates the impor -tance of this parameter for the design and planningof textile structures. The analysis into the state ofcurrent reseach revealed that it has been mostlyconventional yarns without elastane core which havebeen included in studies of the yarn diameter. The research objective was to compare yarn diam -eters of elasticized yarns produced by various pro -cesses and yarn diameters of conventional yarnswithout elastane, all made from identical fibers withthe identical linear density and comparable twist. Thechange of the yarn diameter after wet relaxation wasobserved for all investigated yarns. In the investi -gation, various methods of yarn diameter measure -ment were applied and evaluated.
THEORETICAL, EFFECTIVE AND MAXIMALYARN DIAMETER
Yarn lengths from which knitted loops are formed, arecharacterized by their thickness. Yarn thickness is abasic yarn parameter dependent on yarn lineardensity, structure and material composition. Yarnthickness is equal to yarn diameter, if the circularcross-section of the yarn is assumed. During theknitting process, yarn thickness changes depend onloading and longitudinal extension. Yarn thickness ina loose condition differs from yarn thickness in astrongly compressed state. In the first case, yarnthickness is equal to yarn effective diameter de,equation (1), and in the second case, it is equal toyarn theoretical diameter dt, equations (1) and (3).Yarn theoretical diameter dt is a diameter of the yarnwith no air pockets between the indvidual fibers. Inreal knitted fabric, yarn theoretical diameter dt is onlyexhibited by individual sections of the knitting yarnplaced over the knitting elements during the knittingprocess. In real knitted fabric, yarn effective diameterde exceeds theoretical diameter dt [27], [28] due tothe yarn voluminosity.It holds [27], [28]:
de = kD ⋅ √Tt (1)
and
2kD = (2)
√ π ⋅ γwhere:de is yarn effective diameter, mm; kD – experimentally defined coefficient of yarn diam-
eter, tex–1/2 mm [28]; Tt – yarn linear density, tex;γ – yarn density for effective yarn diameter de,
kgm–3.
For theoretical yarn diameter dt, density of the fibermaterial composing the yarn can be introducedwhere γF is fiber density. It holds [28]:
2kD = (3)
√π ⋅ γF
For higly voluminous yarns with a low yarn density γand multifilament yarns with low twist, yarn maximaldiameter dmax can be defined. It exceeds yarn effec -tive diameter de, caluculated by equation (1) [28]. Inreal knitted fabric, yarn maximal diameter dmaxcomes into effect in a very open knitted structurewhere the yarn can expand within the knittedstructure during relaxation after the knitting processand wet processes.In theory, yarn minimal diameter dmin equals the -oretical diameter dt when a round cross-section ofthe yarn is assumed. In real knitted fabric, yarnminimal diameter dmin may be less than yarn the -oretical diameter dt if the yarn cross-section is notcircular [28]. This may come into effect in interlockingpoints of the loop if the yarn is compressed.Therefore, it can be assumed that dmin ≤ dt in theinterlocking points of a very compact, i.e. super -compact knitted structure [1].
EXPERIMENTAL PART
Samples preparation
Ring-spun yarns used for the knitted samplespreparation were designed and made to order withplanned parameters for the research purposes fromviscose (CV) and poliacrylonitryle (PAN) fibers. Fromeach raw material, elasticized yarns with the samelinear density were made: mouliné twisted yarn (com -posed of an elastomeric core-spun yarn and a yarnwithout elastane, both ring-spun), core-twisted yarn(elastane filament yarn, core-twisted with two ring-spun yarns) and core-spun yarn (a yarn with an elas -tane core and staple fiber sheath covering). For com -parison, ring-spun yarns without elastane with equallinear density as elasticized yarns were also produced.The knitted samples were produced on the electronicflat weft knitting machine UNIVERSAL MC 720,gauge E8. All samples were knitted with an equalyarn input tension, equal knitted fabric take-off and atidentical environment conditions. From each yarn,the samples were knitted in two densities. First, allsamples were statically dry relaxed, i.e. placedunloaded to the standard environment for 72 hours.

315industria textila 2013, vol. 64, nr. 6˘
After the dry relaxation, a half portion of each samplewas additionally dynamically wet relaxed. The pro -cess comprised laundering at 30°C, short spinning,40 minutes drying, four cycles of short rinsing and40-minute tumble drying (all delicate laundry pro -gramme), and placing wet relaxed samples flat to thestandard environment for at least 24 hours after thedrying was finished. Due to their structure, high extensibility and highelastic recovery of the elastane core yarns, sig -nificant changes of the elastane core yarn thicknesswere expected after the dynamic wet relaxationofknitted fabrics. Therefore, yarns were relaxedsimultaneously with the knitted fabrics in order tocalculate the parameters of the dry and wet relaxedknitted structure and examine the yarn diameterchange after wet relaxation. The dry relaxed yarnswere placed unloaded to the standard environmentfor 72 hours. To avoid the ruffling of yarns in thelaundering machine drum during rotation, the yarnswere dynamically wet relaxed with a 2 hours soakingof the threads in the water at 30°C with occasionalstirring. Afterwards, they were dried simultaneouslywith the investigated knitted fabrics in a tumble dryerat the delicate programme. SEM pictures of yarnsamples are presented in table 1.Based on the review of experimental methods [5],[7] – [26], investigations were carried out into thediameter of the elasticized yarns compared to con -ventional yarns without elastane. It was not possibleto determine the yarn diameter at the loop inter -locking points within the real knitted fabric by theimage analysis due to the high compactness of theelasticized knitted fabric tested. Instead, the yarndiameter at the interlocking points was calculatedfrom the loop width. In addition, various methodswere selected to experimentally and mathematicallydetermine the yarn diameter.
Yarn diameter determination
Maximal yarn diameter dmax measuredby image analysis
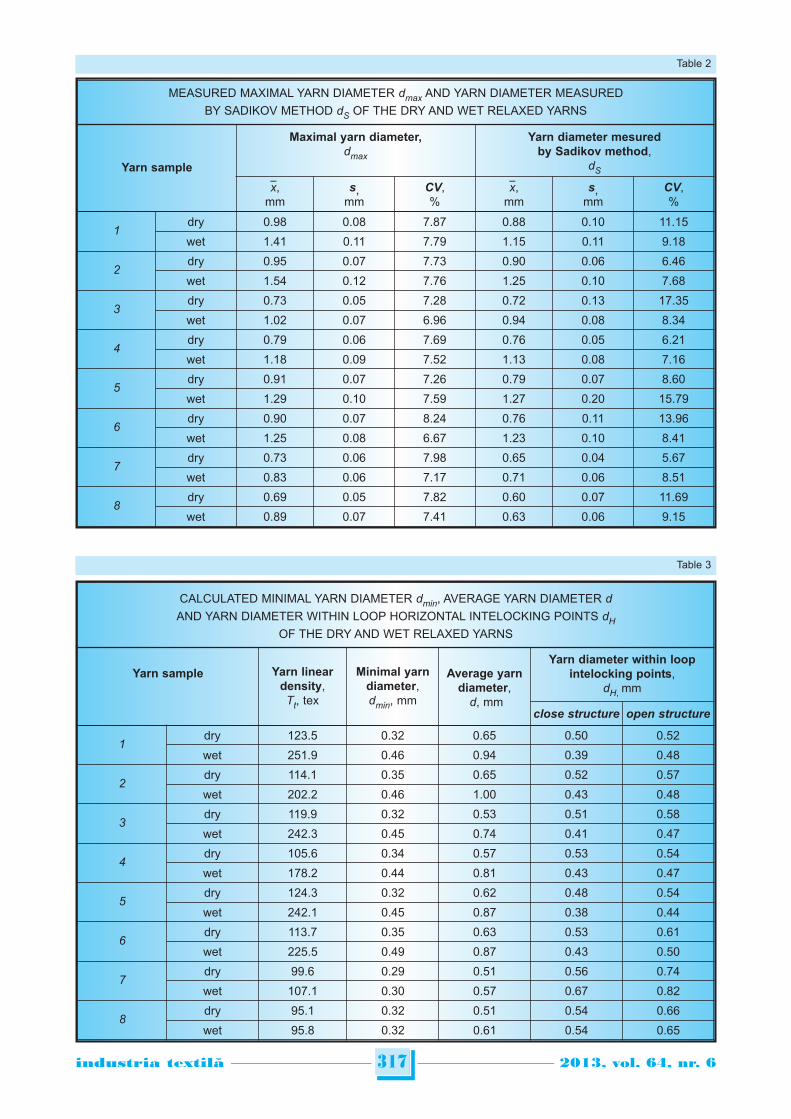
A maximal yarn diameter dmax of the dry relaxed andwet relaxed samples was measured. It was deter -mined by an optical method, a derivative of theFletcher & Roberts method [8] – [11]. The dry and wetrelaxed yarn samples were prepared from the yarnskein. A length of 50 cm was cut from the yarn skeinwithout untwisting the yarn. The upper end of theyarn was glued to the A6 size cardboard using a gluegun. The cardboard with the glued yarn pieces wasmounted in a vertical clamp. The lower end of theyarn was loaded with a preload of 0.3 cN [18] toremove the crimp, and glued to cardboard using theglue gun. On each cardboard, 10 yarns were glued.The prepared yarn samples were optically scannedwith a resolution of 1 200 dpi. For each sample, ahundred yarn cutouts were prepared in Photoshop.The cutout size was 0.5 × 0.5 cm. The maximal widthof the yarn was limited by the Photoshop guidebar
tool. The maximal yarn diameter was measured as adistance between the guidebars. The number ofmea surements for each yarn sample of yarn wasone-hundred. The results of the maximal yarn diam -eter measurements are given in table 1 and figure 1.
Yarn diameter dS measured by image analysisbased on Sadikov methodYarn diameter dS was measured by the modifiedSadikov method [18]. Yarn samples glued on card -board, previously prepared for the maximal yarndiameter determination were used. 30 mm long yarnsections were scanned with a resolution of 1 200 dpi.Then, they were printed on paper at 20 × magnifica -tion and cut. The cut out samples were weighed. Theaverage yarn diameter was calculated from the sur -face of the yarn sample and the yarn sample length.The results of the yarn diameter measurements byimage analysis based on Sadikov method are givenin table 2 and figure 2.
Minimal yarn diameter dmin – calculatedtheoretical yarn diameterThe minimal yarn diameter dmin was calculated foreach dry and wet relaxed yarn sample from thematerial composition and the measured yarn lineardensity using the equations (1) and (2) [27], [28].The yarn material composition is given in table 1. Forthe calculation of the yarn theoretical diameter, the
Fig. 1. Measured maximal yarn diameter dmax of the dryand wet relaxed yarns
Fig. 2. Yarn diameter measured by Sadikov method dSof the dry and wet relaxed yarns

den sity of elastane – Lycra, viscose (Danufil) – CVand polyacrylonitrile (Leacril) – PAN fibers was con -sidered as follows: γCV = 1 510 gdm–3, γPAN = 1 180gdm–3 and γLYCRA = 1 210 gdm–3. The values of themea sured yarn linear density and the calculatedminimal diameter for each yarn sample are given intable 3 and figure 3. Yarn diameter within loophorizontal interlocking points dH smaller than minimal
yarn diameter dmin – which indicates the super -compact knitted structure [1].
Average yarn diameter dAverage yarn diameter d [7] – [11], [28] was calculat -ed using equation (4) below:
dmax + dmind = (4)2
316industria textila 2013, vol. 64, nr. 6˘
Table 1
YARN CHARACTERISTICS
Yarnsam-ple
Materialcompo-sition,
%
Nomi-nal
lineardensity,
tex
Twist,m–1
Brea-kingtena-city,
cNtex–1
Brea-king
exten -sion,
%
Ustervalue,
%
No. ofthin
places
No. ofthick
places
No. ofnobs
SEM photo dryrelaxed yarn
SEM photo wetrelaxed yarn
1 97.8% CV2.2% EL
100 500 S 20.2 19.3 7.4 0 0 0
2 97.8% PAN2.2% EL
100 500 S 21.5 26.9 7.3 0 2 1
3 97.8% CV2.2% EL
102 500 S 20.3 19.1 7.5 0 0 0
4 97.8% PAN2.2% EL
102 500 S 21.2 26.5 7.4 0 0 0
5 97.8% CV2.2% EL
100 281 Z 18.4 17.7 8.5 0 0 1
6 97.8% PAN2.2% EL
100 278 Z 19.6 23.8 9.1 0 0 0
7 100% CV 100 221 Z 21.9 17.7 8.4 0 1 0
8 100% PAN 100 221 Z 19.7 23.0 9.1 0 1 0
317industria textila 2013, vol. 64, nr. 6˘
MEASURED MAXIMAL YARN DIAMETER dmax AND YARN DIAMETER MEASURED
BY SADIKOV METHOD dS OF THE DRY AND WET RELAXED YARNS
Yarn sample
Maximal yarn diameter,dmax
Yarn diameter mesuredby Sadikov method,
dS
x,mm
s,mm
CV,%
x,mm
s,mm
CV,%
1dry 0.98 0.08 7.87 0.88 0.10 11.15
wet 1.41 0.11 7.79 1.15 0.11 9.18
2dry 0.95 0.07 7.73 0.90 0.06 6.46
wet 1.54 0.12 7.76 1.25 0.10 7.68
3dry 0.73 0.05 7.28 0.72 0.13 17.35
wet 1.02 0.07 6.96 0.94 0.08 8.34
4dry 0.79 0.06 7.69 0.76 0.05 6.21
wet 1.18 0.09 7.52 1.13 0.08 7.16
5dry 0.91 0.07 7.26 0.79 0.07 8.60
wet 1.29 0.10 7.59 1.27 0.20 15.79
6dry 0.90 0.07 8.24 0.76 0.11 13.96
wet 1.25 0.08 6.67 1.23 0.10 8.41
7dry 0.73 0.06 7.98 0.65 0.04 5.67
wet 0.83 0.06 7.17 0.71 0.06 8.51
8dry 0.69 0.05 7.82 0.60 0.07 11.69
wet 0.89 0.07 7.41 0.63 0.06 9.15
Table 2
Table 3
CALCULATED MINIMAL YARN DIAMETER dmin, AVERAGE YARN DIAMETER dAND YARN DIAMETER WITHIN LOOP HORIZONTAL INTELOCKING POINTS dH
OF THE DRY AND WET RELAXED YARNS
Yarn sample Yarn lineardensity,Tt, tex
Minimal yarndiameter,dmin, mm
Average yarndiameter,
d, mm
Yarn diameter within loopintelocking points,
dH, mm
close structure open structure
1dry 123.5 0.32 0.65 0.50 0.52
wet 251.9 0.46 0.94 0.39 0.48
2dry 114.1 0.35 0.65 0.52 0.57
wet 202.2 0.46 1.00 0.43 0.48
3dry 119.9 0.32 0.53 0.51 0.58
wet 242.3 0.45 0.74 0.41 0.47
4dry 105.6 0.34 0.57 0.53 0.54
wet 178.2 0.44 0.81 0.43 0.47
5dry 124.3 0.32 0.62 0.48 0.54
wet 242.1 0.45 0.87 0.38 0.44
6dry 113.7 0.35 0.63 0.53 0.61
wet 225.5 0.49 0.87 0.43 0.50
7dry 99.6 0.29 0.51 0.56 0.74
wet 107.1 0.30 0.57 0.67 0.82
8dry 95.1 0.32 0.51 0.54 0.66
wet 95.8 0.32 0.61 0.54 0.65

where:d is the average yarn diameter, mm;dmax – the maximal yarn diameter, mm;
dmin – the minimal yarn diameter, mm.
The values of the calculated average yarn diameterare given in table 3 and figure 4.
Yarn diameter within the loop horizontalinterlocking pointsThe yarns in the loop of the normal to supercompactknitted structure joint in the contact region, thereforeA = 4 dH. Consequently, the yarn diameter within theloop horizontal interlocking points can be calculatedfrom the measured width of loop A [1]. The values ofthe calculated yarn diameter within the loop hori -zontal interlocking points dH are given in table 3 andfigure 5.
RESULTS AND DISCUSSIONS
In table 2 and figure 1 show that the maximal yarndiameter dmax of the wet relaxed yarns is greater thanthe maximal yarn diameter dmax of the dry relaxedyarns. This is due to the yarn shrinking during wetprocesses. Differences between mean values of theyarn diameters of individual dry and wet relaxed yarnsare significantly greater for the elasticized yarns whichexhibit greater shrinkage compared to non-elasti -cized yarns. The maximal yarn diameter dmax of theelasticized yarns increased by 39.7% to 62.1%during wet relaxation. For non-elasticized yarns, theincrease was 13.7% (CV yarn) or 30.9% (PAN yarn). Wet relaxed mouliné yarns (samples 1 and 2) andcore-spun yarns (samples 5 and 6) exhibit the great -est maximal diameter dmax, while the conventionalyarns without elastane core (samples 7 and 8) exhibitthe lowest maximal diameter dmax. Mouliné twistedyarns are composed of an elastomeric core-spunyarn and a yarn without elastane, both ring-spun.Core-spun yarn is a yarn with an elastane core andstaple fiber sheath covering. During wet relaxation,crimps are formed in these yarns due to theununiform relaxation shrinking of the elastane coreand fiber assembly in the sheath, which influences
the substantial increase of the maximal yarn diameter(fig. 1).Yarn diameter measured by Sadikov method dS ispresented in table 2 and figure 2. It exhibits highervalues for the wet relaxed yarns than for the dryrelaxed yarns. Yarn diameter values are the lowestfor the conventional yarns without elastane. The yarndiameter increase during wet relaxation is 29.8% to61.7% for the elasticized yarns, while it is 10% forviscose conventional yarn and 6.2% for polyacrylo -nitrile conventional yarn. Core-spun yarns (samples 5and 6) exhibit the largest increase, while conven tion -al yarns without elastane (samples 7 and 8) exhibitthe lowest increase.Minimal yarn diameter dmin (table 3, fig. 3) increasedduring wet relaxation due to yarn shrink age andresulted in a consequent increase in the yarn lineardensity. Therefore, the calculated average yarn diam -eter d increased during wet relaxation as well. The average yarn diameter d (table 3, fig. 4) calcu -lated from the maximal yarn diameter dmax and theminimal yarn diameter dmin, and the average yarndiam eter measured by the Sadikov method dS (table 2,fig. 2) differ significantly. Yarn diameter of the elas -ticized yarns measured by the Sadikov method dS(samples 1 – 6) is significantly higher than the calcu -lated average diameter of the yarn d. The mea suredaverage diameter dS of the conventional yarns
318industria textila 2013, vol. 64, nr. 6˘
Fig. 3. Calculated minimal yarn diameter dmin of the dryand wet relaxed yarns
Fig. 4. Calculated average yarn diameter d of the dryand wet relaxed yarns
Fig. 5. Calculated yarn diameter within loop horizontalinterlocking points dH of the dry
and wet relaxed yarns

without elastane (samples 7 and 8) also exceeds theaverage calculated yarn diameter d, although thedifferences are smaller.Comparison of the yarn diameters, measured andcalculated by different methods, shows that the yarndiameter within the interlocking points shown in table3 and figure 5, (which equals the quarter of the loopwidth, i.e. dH = A/4) is smaller than the minimal yarndiameter dmin for all close wet relaxed samples madefrom elasticized yarns. It can be assumed that theyarn cross-section within the interlocking points isnot circular. The fibers composing the yarn are re-arranged around the elastane core during wet relax -ation so that the yarn is flattened in the interlockingpoints.Yarn diameter determined either by measurementsor calculated from the fiber and yarn structureparameters, increases during wet relaxation in allcases. It is lower for the conventional yarns withoutelastane than for the elasticized yarns. However,yarn diameter within the loop horizontal interlockingpoints calculated from the knitted structure param -eters decreases during wet relaxation. The loopdimensions, especially loop width and height change.Furthermore, the yarn diameter also changes withinthe loop interlocking points due to yarn compress -ibility. The calculated yarn diameter within the loophorizontal interlocking points dH is substantially lowerfor the elasticized yarns than for the conventionalyarns without elastane.
CONCLUSIONS
Various optical and mathematical methods wereapplied in order to determine the yarn diameter, bothexperimentally and mathematically. It was notpossible to determine the yarn diameter within thereal knitted structure by the image analysis due to thehigh compactness of the tested elasticized knittedfabric. Since highly elasticized yarns extend signifi -cantly at low stress and the relation between load-extension is not linear, mechanical methods were notselected for this research either.Yarn diameter determined either by measurementsor calculated from the fiber and yarn structure param -eters, increased during wet relaxation. The yarndiam eter within the loop horizontal interlocking pointscalculated from the knitted structure parametersdecreased during wet relaxation. This is explained bythe loop dimensions changing as well as the changesin yarn compressibility. The calculated yarn diameterwithin the loop horizontal interlocking points is sub -stantially lower for the elasticized yarns than for theconventional yarns without elastane.Comparison of the yarn diameters measured andcalculated by different methods showed that the yarndiameter within the interlocking points is smaller thanthe minimal yarn diameter for all close wet relaxedsamples made from elasticized yarns. It can beassumed that the yarn cross-section within the inter -locking points is not circular. The fibers composingthe yarn are re-arranged around the elastane coreduring wet relaxation so that the yarn is flattened inthe interlocking points.
319industria textila 2013, vol. 64, nr. 6˘
BIBLIOGRAPHY
[1] Pavko-Cuden, A. Parameters of compact single weft knitted structure. Part 2: Loop modules and Munden constants– compact and supercompact structure. In: Tekstilec, 2010, vol. 53, no. 10/12, pp. 259–272
[2] Grosberg, P. The geometry of knitted fabrics. Hearle, V. J. W. S., Grosberg, P., Backer, S. Structural mechanics offibers. Part 1 – Yarns and fabrics. New York, London, Sidney, Toronto: John Wiley & Sons, 1969, pp. 411–450
[3] Grosberg, P. Shape and structure in textiles. In: Journal of the Textile Institute, 1966, vol. 57, pp. T383–T394[4] Bukhonka, N. Experimental studies of the dimensional properties of single tuck stitches. In: Industria Textilă, 2011,
vol. 62, no. 1, pp. 14–18 [5] Mahmoudi, M. R., Oxenham, W. A new electro-mechanical method for measuring yarn thickness. In: Autex
Research Journal, 2002, vol. 2, no. 1, pp. 28–37[6] Onions, W. J., Oxtoby, E., Townend, P. P. Factors affecting the thickness and compressibility of worsted-spun yarn.
In: Journal of the Textile Institute, 1968, vol. 59, pp. 293–319[7] Barella, A. Law of critical yarn diameter and twist. In: Textile Research Journal, 1950, vol. 20, pp. 249–258[8] Fletcher, H. M., Roberts, S. H. The geometry of plain and rib knit cotton fabrics and its relation to shrinkage in laun-
dering. In: Textile Research Journal, 1952, vol. 22, pp. 84–88[9] Fletcher, H. M., Roberts, S. H. The geometry of knit fabrics made of staple rayon and nylon and its relationship to
shrinkage in laundering. In: Textile Research Journal, 1952, vol. 22, pp. 466–471[10] Fletcher, H. M., Roberts, S. H. Distortion in knit fabrics and its relation to shrinkage in laundering. In: Textile
Research Journal, 1953, vol. 23, pp. 37–42[11] Fletcher, H. M., Roberts, S. H. Relationship of the geometry of plain knit cotton fabric to its dimensional change and
elastic properties. In: Textile Research Journal, 1954, vol. 24, pp. 729–737[12] Fletcher, H. M., Roberts, S. H. Elastic properties of plain and double knit cotton fabrics. In: Textile Research Journal,
1965, vol. 35, pp. 497–503[13] Fletcher, H. M., Roberts, S. H. Dimensional stability and elastic properties of plain knit wool fabrics with and
without Wurlan finish. In: Textile Research Journal, 1965, vol. 35, pp. 993–999[14] Postle, R., Munden, D. L. Analysis of the dry-relaxed knitted-loop configuration. Part 1. Two-dimensional analysis.
Journal of the Textile Institute, 1967, vol. 58, pp. T329–T351

320industria textila 2013, vol. 64, nr. 6˘
Author:
Assoc. prof. dr. ALENKA PAVKO-CUDENAssoc. prof. dr. URSKA STANKOVIĆ ELESINI
University of LjubljanaFaculty of Natural Sciences and Engineering
Department of Textiles, Snezniska 5, 1000-Ljubljana, Sloveniae-mail: [email protected]
[15] Lord, P. R., Mohamed, H. M., Ajgaonkar, D. B. The performance of open-end, twistless and ring yarns in weftknitted fabrics. In: Textile Research Journal, 1974, vol. 44, pp. 405–414
[16] Sirang, Y., Dinfon, G., Begery, H. M. A study of hairness and diameter of open-end yarn processed through single-and double-cylinder carding machines and its comparison with ring yarn. In: Textile Research Journal, 1982, vol. 52,pp. 274–279
[17] Lasic, V., Vrljicak, Z., Srdjak, M. Effects of the features of the knitting machine and yarns on the structure of knitgoods. In: Tekstil, 1984, vol. 33, pp. 611–621
[18] Laboratory practice in the study of textile materials. Edited by A. Kobljakov. Moskva, Izdanie Mir, 1989[19] Cybulska, M. Assessing yarn structure with image analysis methods. In: Textile Research Journal, 1999, vol. 69,
pp. 369–373[20] Demiroz, A., Dias, T. A study of the graphical representation of plain-knitted structures. Part 2. Experimental
studies and computer generation of plain-knitted structures. In: Journal of the Textile Institute, 2000, vol. 91,pp. 481–492
[21] Nagy, V., Vas, L. M., Nagy, P., Lazar, A., Devenyi, L. Comparative testing of spun yarns manufactured from polyesterfibers of different cross sections. Proceedings of the IN-TECH-ED Conference. Budapest, Hungarian Society ofTextile Technology and Science, 2002, pp. 61–66
[22] Basu, A., Doraiswamy, I., Gotipamul, R. L. Measurement of yarn diameter and twist by image analysisl. In: Journalof the Textile Institute, 2003, vol. 94, no. 1–2, pp. 37–48
[23] Bueno, M., Renner, M., Nicoletti, N. Influence of fiber morphology and yarn spinning process on the 3D loop shapeof weft knitted fabrics in terms of roughness and thickness. In: Textile Research Journal, 2004, vol. 74, pp. 297–304
[24] Carvalho, V., Soares, F. O., Belsley, M. A comparative study between yarn diameter and yarn mass variationmeasurement systems using capacitive and optical sensors. In: Indian Journal of Fibre & Textile Research, 2008,vol. 33, June, pp. 119–125
[25] Carvalho, V., Cardoso, P. J., Belsley, M. S., Vasconcelos, R. M., Soares, F. O. Yarn diameter mesurements usingcoherent optical signal processing. In: IEEE Sensors Journal, 2008, vol. 8, no. 11, pp. 1 785–1 793
[26] Rameshkumar, C., Regasamy, R. S., Anbumani, N. Studies on polyester/waste silk core-spun yarns and fabrics.In: Journal of Industrial Textiles, 2009, vol. 38, pp. 191–203
[27] Dalidovic, A. S. Osnovi teorii vjazanija. In: Legakaja industrija, Moskva, 1970, pp. 144[28] Laboratory practice in knitting technology. Edited by L. Kudriavin. Moskva : Mir Publishers, 1985, pp. 81–82
DOCUMENTARE
O NOUĂ MAŞINĂ DE ŢESUT
În cadrul Expoziţiei internaţionale pentru industriamaselor plastice şi cauciucului Chinaplas, care s-ades fășurat în perioada 20-23 mai 2013, laGuangzhou – China, producătorul liniilor de fabri ca -ţie a ambalajelor ţesute din plastic, Starlinger & Co.GmbH, din Viena – Austria, a prezentat o nouămaşină circulară de ţesut, cu 8 suveici, RX 8.0. RX 8.0 a fost proiectată, în principal, pentru produ-cerea benzilor textile din polipropilenă (PP) și poli -etilenă de înaltă densitate (HDPE), destinate aplica -ţi ilor în condiţii grele de lucru, cum ar fi: containere
flexibile vrac intermediare, foi de cort, geotextile şiagrotextile. Bazată pe conceptul de realizare a maşinii de ţesutmodelele Starlinger SL şi Alpha, noua maşină deţesut este rentabilă şi uşor de întreţinut.Utilizarea noilor materiale reduce tensiunea şifrecarea pe suprafața benzilor şi măreşte timpul deviaţă a pieselor supuse uzurii, menţinând la niveluriscăzute atât cheltuielile cu piese de schimb, cât şicele legate de întreţinere.
Melliand International, mai 2013, p. 74
Þesãtorie

Length is one of the most important parameters offibers because it has effects on yarn strength,
yarn hairiness, the properties of fabrics and on theefficiency of the yarn spinning process [1], [2], [3].There are several testing methods for fiber lengthmeasurements. The conventional method [4] is thearray method which gives a weight frequency-lengthdistribution and always serves as a benchmark towhich other methods are compared [5]. This methodis, however, slow and tedious and depends onoperator skill for reliability and accuracy [6], [7].Now, the two popular instruments, namely high vol -ume instrument (HVI) and advanced fiber informationsystem (AFIS), are fully automatic machines. HVI isthe official USDA method [8]. However, it cannotobtain the entire fibrogram, because its holdinglength is about 4.06 mm and the start of the scan setpoint at 3.8 to 5.1 mm from the held point [9]. AFIS ismainly used by modern textile mills for evaluating theindividual fiber properties in order to optimize theirdownstream processing [8]. However, there may besome questions in AFIS measurements, for examplefiber break, straightening, separation, alignment andonly 9–33 % of fibers are counted in the measure -ment unit [10].Recently, various image analyses have been used forfiber length measurement. Fischer [11] and Y. Ikiz [9]
showed image processing method to measure singlefiber length, respectively. This method could test singlefiber length accurately, but individualizing fibers isques tionable. Weilin Xu [12] introduced a newmethod for cotton length measurement that involvedcombing fibers into a test beard, cutting the beardinto a number of segments of a given interval, andcounting the snippets in each segment by imageprocessing. The method seems time-consuming andtedious.This paper presents a new fiber length measurementmethod, namely Image measuring method. This newmethod can scan the two sides of the dual-beardfrom the holding line synchronously to generate twoentire fibrograms. In this paper, the methodology wasdemonstrated and experiments were performed toexamine Image measuring method.
METHODOLOGY USED
Image measuring method consisted of four parts:sam pling, obtaining gray image, extracting fibro -grams and calculating fiber length, as showed infigure 1. Firstly, the dual-beard was produced throughsampling. Secondly, the dual-beard was put on ascanner to produce a digital gray image. Thirdly, thefibrograms were extracted based on the image ofthe beard. Finally, mean length by weight, coefficient
Image measuring method for fiber length measurements
HONGYAN WU FUMEI WANG
REZUMAT – ABSTRACT
Metodă de măsurare a lungimii fibrelor pe bază de imagini
În lucrare este prezentată o nouă metodă pentru determinarea lungimii fibrelor, utilizând imaginile a două fibrogramecomplete, realizate în acelaşi timp. Pe baza noii metodologii, au fost efectuate experimente pentru stabilirea perfor -manţei metodei de măsurare pe bază de imagini. Rezultatele măsurătorilor demonstrează că această metodă prezintăo bună fiabilitate, repetabilitate şi compatibilitate cu AFIS şi HVI.
Cuvinte-cheie: AFIS, fibrogramă, lungimea fibrei, HVI, imagine alb-negru
Image measuring method for fiber length measurements
This paper presents a new method for measuring fiber length using image method which can obtain two wholefibrograms by one time. The methodology was introduced and experiments were performed to investigate availability ofImage measuring method. The results show image measuring method has good trueness and repeatability and goodagreement with AFIS and HVI.
Key-words: AFIS, fibrogram, fiber length, HVI, gray image
321industria textila 2013, vol. 64, nr. 6˘
Fig. 1. The measurement flowchart of image measuring method

of variation, modal length and quality length wascalculated.
Sampling
First, 0.2 to 0.3 g sample was selected randomly fromtested fibers, then opened and mixed by hands, andremoved trash particles with a pair of tweezers.Second, the sample was drawn three times by a fiberdraw-off device to prepare a sliver in which fibers areparallel, straight and uniform nearly. Third, the sliverwas clamped randomly along the fiber longitudinalaxis by a clamper, and then loose fibers on the openend of the clamper were removed. Lastly, clamp thesliver with another clamper at the holding line of thefirst clamper, release the first clamper and remove allloose fibers on the open end of the second one. Thedual-beard with 20 mg to 40 mg and 5 cm wasobtained, as shown in figure 2.The two sides of the dual-beard are approximatelysymmetrical and fibers in the beards are well straight -ened and parallel, which allow two entire fibrograms(fig. 4) scans apart from the holding line simulta ne -ously.
Obtaining gray image
The dual-beard sample was scanned by a scanner toa digital gray image. A grayscale digital image is animage in which the value of each pixel is a singleintensity value, that is, it contains only the luminanceinformation without color information. Often, the gray -scale intensity is stored as an 8-bit integer giving 256(from 0 to 255) possible different shades of gray fromblack at the weakest intensity to white at thestrongest.
The dual-beard was put on the glass tray of the scan -ner. The properties of the scanner were set as follows:scan type was gray scale; resolution was 1 000 dpi(0.0254 mm per pixel). A beard image, with high 2 257pixels and width 2 339 pixels, was shown in figure 3.
Extracting the fibrograms
As shown in figure 3, the higher gray value is, themore quantity of fibers is. Hence, the decline of grayvalues along the horizontal direction indicated thegradually descent of fibers quantity. The progressiveaccumulate gray values of every column vertical withfiber long direction was calculated by computersoftware. The origin of the coordinates is set at thelocation of the holding line where the progressiveaccumulate gray value is set 1. So, at the ith column,the relative quantity of fiber equaled the value thatthe gray values at this column divided by the grayvalues at the holding line, and the protruding distanceto zero point equaled i × 0.0254 mm. The fibrogramis the beard curve that shows the quantity of fibers ateach protruding distance from the holding line, asshown in figure 4. The abscissa and ordinate valuesare protruding distance and relative quantity of fiber,respectively.
Calculating fiber length
To calculate fiber length, the equations [13] havebeen extracted directly from the fibrogram by author.According to the equations, the computer softwarewas developed for calculating fiber length: meanlength by weight, modal length, quality length and thecoefficient of variation.
EXPERIMENTAL VERIFICATION
Trueness of image measuring method
Samples usedSix groups of kapok fibers marked as 1# ~ 6#, twogroups of cotton samples marked as 7# and 8# andone group of polyester fibers with same cut lengthsmarked as 9# were tested, which contained a broadrange of length-distribution properties.
322industria textila 2013, vol. 64, nr. 6˘
Fig. 2. Dual-beard sample
Fig. 3. Digital gray image of the dual-beard Fig. 4. The fibrograms

Methods usedFor every sample, four measurements were per formedby image measuring method. The results of one mea -surement were the average of length indexes at theboth ends of the dual-beard.Single fiber measurement method is the most accu -rate method for fiber length test, so it was selected toexamine trueness of Image measuring method. Theprocedure of single fiber measurement method wasas follows: pick up single fiber with tweezers, drag iton velvet board to straight it and measure it with ascale reading one decimal. And then the fiber lengthdistribution by number was obtained, which was con -verted to the fiber length distribution by weight basedon the assumption that the fibers were uniform in crosssection. Thus fiber length characteristics by weightcan be calculated. For every sample, 900 ~ 1 000 indi - vidual fibers were tested by single fiber measurementmethod, except for polyester fibers where 100 indi -vidual fibers were measured.
Results and discussionsThe results of the two methods are showed in figure 5.In figure 5 the line y = x is the perfect correlation lineof the two methods; an abscissa point corresponds tofour ordinate points which are four measurementresults of one sample by Image measuring method.
Figure 5 shows, for mean length by weight, modallength, quality length and coefficient of variation,Image measuring method agrees well with singlefiber measurement method. However, due to randomerror, data of Image measuring method fluctuateslightly with the ideal line. In order to examine thetrueness of Image measuring method, the meanvalue of four measurements of every sample byImage measuring method were calculated. Then thebiases of Image measuring method were calculatedin table 1, which were equal to the results of Imagemeasuring method minus the results of single fibermeasurement method. From table 1, it is observed that biases of Imagemeasuring method are small. The average biases ofmean length, modal length and quality length are allless than 1 mm. In order to test significance of bias,T-test was applied. Under significance level α = 0.01,it can be obtained equation (1):
t1–α/2 (n – 1) = t1–0.005 (8) = 3.3554 (1)
In table 1, T-test statistics all are less than 3.3554, sobiases of image measuring method are not signif i -cant. It shows that the trueness of Image measuringmethod is high.Besides, from table 1, it is observed that the averagebiases of mean length, modal length and quality length
323industria textila 2013, vol. 64, nr. 6˘
Fig. 5. The results of the two test methods:a – mean length by weight; b – modal length; c – quality length; d – coefficient of variation
a b
c d

are negative, that shows the results of Image mea -sur ing method are slightly shorter than single fibermeasurement method. This was due to that thestraight degree of the fibers in single fiber measure -ment method was slightly higher than which in Imagemeasuring method, because of fibers dragged onvelvet board by tweezers in single fiber measurementmethod.
Repeatability of Image measuring method
Sample usedThe 7# cotton fiber was tested.
Methods usedThe sample was tested five times by Image measur -ing method, HVI and AFIS, respectively.
Results and discussionsVariance of five measurements by the three methodswere caculated in table 2. F-test was applied to testvariance of the three methods. Under significancelevel α = 0.05, for mean length, it can be obtainedequations (2):
S12 /S2
2 = 4.73
S32 /S1
2 = 1.25 (2)
S32 /S2
2 = 5.80
which are all less than:
F(1–0.025) (4.4) = 9.60 (3)
So, for mean length, repeatability of the three meth -ods was in the same level. Similarly, for modal lengthand coefficient of variation, repeatability of Imagemeasuring method and AFIS was in the same level.Because AFIS and HVI do not provide quality length,
variance of quality length of the three methods can notbe compared, whereas it is obvious variance ofquality length by Image measuring method is small.So repeatability of Image measuring method is good.
Compared to other measurement methods
Besides 7# and 8# cotton samples, three groups ofcotton fiber, marked as 10#, 11# and 12#, were test edby image measuring method, HVI and AFIS, respec -tively. The results of the three methods are showed infigure 6. Figure 6a shows mean length of Image measuringmethod are very close to AFIS’s which are slightlyhigher than HVI’s. The square of correlation coef fi -cient was R2 = 0.9901 between image measuringmehtod and AFIS, and was R2 = 0.9901 betweenImage measuring method and HVI. So, the meanlength obtained from Image measuring method hasgood agreement with AFIS’s and HVI’s. The smalldifference of the three methods may be due to ran -dom error and different measuring principles.In figure 6b, quality length, upper quartile length (UQL)and upper half mean length (UHML) are compared.Quality length is defined as the weight-weightedaver age length of fibers whose length exceeds themodal length; upper quartile length (UQL) is the valueof length for which 75% of all the observed valuesare lower, and 25% higher; upper half mean length(UHML) is the average length of the longest one-halfof the fibers when they are divided on a weight basis.Though, the three length indices have different mean - ing, they present weight average length of fibers withlonger length. From figure 6b, it is obvious that thequality length of Image measuring method is samewith UQL from AFIS which is slightly greater thanUHML from HVI and the three methods has highconsistency.Figure 3c shows modal length of Image measuringmethod are so close to AFIS’s. Figure 3d showscoefficient of variation of Image measuring method isagreed well with AFIS’s and R2 of the two methods is0.8316. HVI do not provide modal length and coef -ficient of variation.
324industria textila 2013, vol. 64, nr. 6˘
Table 2
VARIANCE OF THREE METHODS
MethodMean
length,mm2
Modallength,
mm2
Qualitylength,
mm2
Coefficientof variation,
%
Imagemeasuringmethod
S12 0.093 0.291 0.166 1.413
AFIS S22 0.020 1.742 - 0.828
HVI S32 0.116 - - -
Table 1
BIASES OF IMAGE MEASURING METHOD
SampleMean
length,mm
Modallength,
mm
Qualitylength,
mm
Coefficientof variation,
%
1# –0.09 0.21 –0.32 2.74
2# 0.07 0.39 –0.08 0.56
3# –0.90 –1.04 –1.43 1.03
4# –0.60 –1.99 –1.81 1.68
5# –0.21 –0.72 –0.99 2.40
6# –0.54 –1.31 –1.22 2.53
7# –0.05 0.04 –1.80 0.04
8# –0.75 –0.40 –1.95 –1.08
9# –0.31 0.32 0.65 1.98
Averagebias
–0.38 –0.50 –0.99 1.32
Standarddeviation
0.337 0.827 0.898 1.287
T-teststatistics
3.3398 1.8125 3.3182 3.0760

CONCLUSIONS
We present a new method for fiber length meas -urement, namely Image measuring method whichinvolved sampling, obtaining image, extracting fibro -gram and calculating fiber length. This new methodhas two outstanding advantages: it can scan thebeard from the holding line to produce the entirefibrogram and can produce two test results by onetime using a dual-beard sample. A lot of experimentswere performed to examine the new method.Compared to single fiber measurement method, thebiases of Image measuring method were small andnot significant, so it had high trueness. Then, repeata -
bility of image measuring method was in the samelevel with AFIS and HVI. At last, Image measuringmethod was compared to AFIS and HVI. The resultsshowed Image measuring method agrees well withAFIS and HVI. Therefore, it can be concluded thatImage measuring method has good accuracy, repeata -bility and can be applied to measure fiber lengthdistributions.
ACKNOWLEDGEMENT
This work was supported by "the Fundamental ResearchFunds for the Central Universities" in China. GrantNo.12D10138
325industria textila 2013, vol. 64, nr. 6˘
Fig. 6. Data comparisons with image measuring method, AFIS and HVI
a b
c d
BIBLIOGRAPHY
[1] Mogahzy, Y. E., Broughton, R. A statistical approach for determining the technological value of cotton using HVIfiber properties. In: Textile Research Journal, 1990, vol. 60, pp. 495–500
[2] Krowicki, R. S., Hinojosa, O., Thibodeaux, D. P. et al. An AFIS parameter for correcting mass measures on theSpinlab HVI. In: Textile Research Journal, 1996, vol. 66, pp. 70–72
[3] Zeidaman, M., Sawhney, P. S. Influence of fiber length distribution on strength efficiency of fibers in yarn. In: TextileResearch Journal, 2002, vol. 72, pp. 216–220
[4] ASTM, Standard D 1447-07. Standard test method for length and length distribution of cotton fibers (Array method).Annual Book of ASTM Standards, 2006, vol. 07.01, pp. 334–339
[5] Stewart, James Mc D., Oosterhuis, Derrick M., Heitholt, James J. et al. Physiology of cotton. London: Springer,2010, p. 233
326industria textila 2013, vol. 64, nr. 6˘
Authors:
HONGYAN WU
FUMEI WANG
College of Textiles
Donghua University
Shanghai 201620, China
e-mail: [email protected]; e-mail: [email protected]
[6] Zeidman, M. I., Batra, S. K. Determining short fiber content in cotton. Part I: Some Theoretical Fundamentals. In:Textile Research Journal, 1991, vol. 61, pp. 21–30
[7] Balasubramanian, N. Influence of cotton quality. In: The Indian Textile Journal, 1995, pp. 48–51[8] Nair, A. U., Nachane, R. P., Patwardhan, B. A. Comparative study of different test methods used for the measure-
ment of physical properties of cotton. In: Indian Journal of Fiber & Textile Research, 2009, vol. 34, pp. 352–358[9] Ikiz, Y., Rust, J., Jasper, W. Fiber length measurement by image processing. In: Textile Research Journal, 2001,
vol. 71, pp. 905–910[10] Cui, X., Calamari, T. A., Robert, K. et al. An Investigation of cotton fiber lengths measured by HVI and AFIS. In:
Tenth EFS Research Forum Proceedings, 1997, pp. 115–124[11] Fischer, H., Rettig, D., Harig. H. Image processing for measuring the length distribution of reclaimed fibres. In:
Melliand Textilberichte/International Textile Reports, 1999, vol. 80, pp. 94–96[12] Weilin Xu, Bugao Xu, Wenbin Li, Weigang Cui. Snippet counting for cotton length distribution measurement using
image analysis. In: Textile Research Journal, 2008, vol. 78, pp. 336–341[13] Fumei Wang, Hongyan Wu. A rapid and low-cost method for fiber-length measurement. China Patent:
201210106711.8
DOCUMENTARE
EMULSIE POLIURETANICĂ PENTRU FINISAREAMATERIALELOR TEXTILE
Finisarea textilelor destinate articolelor de îmbră că -minte sport și echipamentelor de lucru este o con di -ție-cheie pentru conferirea unor proprietăți funcționale,cum ar fi rezistența la condiții meteo nefavorabile. Cutoate acestea, utilizarea unor agenți de impregnareobișnuiți, cum sunt cei pe bază de compuși perfluoru -rați este controversată.Eliberarea acestor substanțe în mediul înconjurătoreste considerată foarte dăunătoare, deoarece ele seacumulează și devin un pericol pentru mediu șipentru sănătatea oamenilor. În plus, îmbrăcăminteatratată cu unii agenți de impregnare se recomandă săfie spălată doar în anumite condiții, deoarece rezis -tența la abraziune este destul de mică, ceea ce areun impact negativ asupra funcționalității articolelor deîmbrăcăminte.Noul produs de finisare a textilelor, Purtex, oferă oalternativă unică în acest domeniu. Produsele Purtex,de finisare a textilelor, sunt rezultatul unui proiect dedezvoltare interdisciplinar al companiei FreudenbergGroup, din Weinheim, Germania. Experiența dobândită
în domeniul industriei textile a fost îmbinată cu cerce -tările în domeniul prelucrării polimerilor și tehnologieide suprafață, pentru a dezvolta o soluție completnouă de finisare funcțională a textilelor. Emulsia poliuretanică Purtex nu conține solvenți șiîmbină compatibilitatea față de mediu cu o foartebună capacitate de spălare și cu proprietățile de im -per meabilizare durabilă și de rezistență la abraziune,dar și cu confortul ridicat și tușeul plăcut.Textilele finisate cu Purtex își păstrează proprietățilefuncționale pe întreaga lor durată de viață. Purtex nuconține substanțe considerate a avea efecte dăună -toare asupra sănătății umane sau mediului și, deasmenea, nu conține fluorocarburi, compuși organiciai staniului, ftalați, izocianați, metale grele, etoxilați dealchilfenol și formaldehidă.Produsul poate fi aplicat pe materialele țesute sautricotate, în timpul procesului de finisare, prin proce -deele industriale obișnuite și își păstrează proprie -tățile funcționale pe toată durata de viață a articolelortextile realizate.
Sursa: www.freudenberg.de
Noi tehnologii

In the textile industry quality control of yarn is animportant part of production. Quality improvement
can increase competitiveness as well as reducingcosts. Consequently, there are many methods formon i toring of quality characteristics [1–6]. Black -board is a traditional tool of approaching the uneven -ness characterization of yarn. In the tool, operatorsmust wind the yarn on the blackboard at first. Afterthat the operators analyze quality of yarn byinspecting several blackboards. It is labor-intensiveand time-consuming, which makes quality analysisbecome the bottleneck in the textile production. With the development of computer technology, lots ofmethods based on computer graphics have beenproposed since last century to analyze quality ofyarn. Su et al. [7] studied evaluation method of theunevenness of the stretch-broken tow in the breakdraft zone of a two drafting three pairs of rollers withdouble apron draft system using oxidized filamenttow. Some new apparatuses were developed toanalyze the quality of yarns in different semi-finishedproducts [8]. For getting different properties of yarns,researchers did many works in data mining through
acquiring data by Uster apparatus. Liu et al. [9]presented an automatic method for characterizingthe parameters of ring slub yarn by analyzing the 2Dimage using cluster analyses with an amendedsimilarity-based clustering method. Militký et al. [10]proposed that the complex analysis of mass variationcurve from Uster apparatus enables a deeper inves -tigation of many phenomena connected with yarnunevenness and related problems. For providing pre -cise higher measurement, automatic systems fordeter mination of mass characteristics of textile yarnwere developed based on 1 mm parallel capacitivesensors, working online or offline. This new approachallows direct measurement of yarn mass in the 1 mmrange (increasing the resolution by eight times) [11].Hakan et al. [12] simulated the appearance of wovenfabric defects due to yarn faults by a method devel -oped which was based on photographs taken fromyarns along with their lengths. For getting differentproperties of yarns, researchers did many works in datamining through acquiring data by Uster apparatus.The yarn inspection system in Uster Tester 5-C80018provides the functions of simulation of yarn boards,
Yarn quality measurement by digital blackboard system
JIHONG LIU HONGXIA JIANGBO ZHU RURU PAN
WEIDONG GAO
REZUMAT – ABSTRACT
Aprecierea calității firelor folosind un sistem digital cu plăci negre
Placa neagră este un instrument tradițional folosit pentru determinarea neuniformității firelor textile. Deoarece posibi -litățile de evaluare a calității firelor erau limitate, s-au făcut eforturi mari pentru înlocuirea plăcilor negre tradiționale șidezvoltarea unui sistem digital cu plăci negre, care să poată fi cuplat la aparatul cu sistem capacitiv de determinare aneuniformității firelor textile. Aspectul firului este reconstruit pe baza rezultatelor măsurătorilor diametrelor firelor, folosindun model matematic de dreptunghiuri și un model de iluminare a firului, precum și un software îmbunătățit. Platformapoate fi utilizată pentru o operare ulterioară, în funcție de necesitățile practice, de exemplu: redimensionarea lățimii șiînălțimii, alegerea unei fețe unice sau a ambelor fețe, modificarea culorii plăcii, ajustarea dimensiunii etc. Rezultateleexperimentale arată că sistemul are o configurație flexibilă și este ușor de manipulat.
Cuvinte-cheie: placă neagră, calitatea firului, aparat capacitiv, testarea uniformității
Yarn quality measurement by digital blackboard system
Yarn blackboard is a traditional tool of approaching to unevenness characterization of yarn. Since the initial use of thecapacitive apparatus in industry, much effort has been put into completely replacing of traditional yarn blackboard.Unfortunately, such development efforts have not succeeded since traditional yarn blackboard can express thealignment effect of yarn, and further significant improvement cannot be expected. This has prompted many groups todevelop digital yarn blackboard for replacing of traditional yarn blackboard. In the research a digital blackboard systemis developed for measuring yarn quality combining with the measurement result through capacitive apparatus in theresearch. The appearance of yarn is reconstructed based on the diameter data of yarn using a mathematical model ofrectangles and illumination model of yarn. Furthermore, the software is improved. The platform can be used for furtheroperation according to the practical demand: the width and the height can be resized; single or double-face is optional;the color of blackboard can be edited; the magnification or minification can be adjusted freely and so on. Theexperimental results showed that the system is flexible for configuration and convenient for operating.
Key-words: blackboard, yarn quality, capacitive tester, unevenness characterization
327industria textila 2013, vol. 64, nr. 6˘

woven and knitted fabric. This is a kind of algorithmfrom yarn to boards or fabric by the measurementdata [13], [14]. Here defined the simulation of yarn boards as digitalyarn blackboard. Digital yarn blackboard includesmainly two key technologies: • Simulation of yarn appearance. Sriprateep et al.
[15] demonstrated the CAD model of fiber andyarn with Nurbs solid. The geometry of yarn struc-tures is modeled through the proposed approachby using the SolidWork CAD software package.The graphical results of fiber migration observedfrom the experimental results with different twistfactors. A number of researches have been car-ried out to simulate woven fabric appearance fromyarn images generated from given yarn structuralparameters including count or diameter, togetherwith fabric structural parameters including weaveand thread sets [16–24]. Most of these yarn mod-els are of uniform and complex cross sections.The speed of display from the model is slow. TheCAD model has also been developed for apparel.Tom et al. [25] investigated the requirements for aCAD interface to facilitate the successful educa-tion of fashion and textile students in the area ofyarn design and production. Kang et al. [26] havedeveloped a CAD system for the 3D circular braid-ed preform was following the modeling sequencesand applied to the parametric study of the pre-forms. Using the developed CAD system, the rela-tionships between processing variables and geo-metric parameters have been established. Chenet al. [27] presented the work and progress madein the mathematical modeling of woven structuresand in establishing CAD/CAM tools for 3D wovenarchitectures based on the use of the convention-al weaving technology. Liao et al. [28] attemptedthe geometric modeling of woven and braidedfabric structures in three dimensions using a com-puter aided geometric design (CAGD) technique.Some traditional 2D fabric models are extendedinto 3D models and demonstrated in 3D form.Özdemir et al. [29] have presented a method tosimulate fabric surface appearance from achievedyarn properties. The simulation of woven fabricsurface appearance depends on yarn and fabriccross sectional geometry as well as on yarn mea-surements and yarn image recordings.
• Construction of digital blackboard. Image pro-cessing has also been used in textile analysesrecently [30]. Zhou et al. [31] introduced a digitalprocessing of yarn blackboard on the basis ofcomputer image processing and proved the yarndiameter measured by image processing method.Although a number of approaches for yarn qualitydetermination exist, the methods using digitalblackboard and analysis algorithms are still underdevelopment. Several capacitive sensors-basedapproaches dedicated to yarn quality assessmenthave already been proposed. However, these meth -ods use data from capacitive sensors approaches,
which often lack model of yarn and characteristicas they simulate no more than yarn outline ofmanual blackboard. This study presents mathe-matical modeling of yarn and establishes a graph-ic system of digital blackboard based on the datafor capacitive sensor.
EXPERIMENTAL SYSTEM OF DIGITALBLACKBOARD
A flowchart of digital blackboard system is shown infigure 1. As data recording part, the data of yarnfineness each 4 mm are dynamically recorded usingcapacitive evenness tester. In the data analyzingpart, the data of yarn fineness are converted into thedata of yarn diameter according to linear relationshipbetween the data of yarn diameter and AD con -version result of signal of capacitor plates. After that,a model of yarn is built. At last, yarn is wound virtuallyaround a digital blackboard to simulate the appear -ance of physical blackboard including nep, thick, thinand details, etc. As auxiliary function, the system pro -vides adjusting parameters of digital yarn black board,and so on. Drawing process of digital yarn blackboard is asfollows: First draw a color back area according to thesize of the blackboard. In general, the color of backarea is black. Then according to the data of yarndiam eter arrange yarns on the digital yarn blackboardin columns with a certain interval to simulate theaction of reeling yarn on a physical yarn blackboard.The means set length's data is skipped after arran -ging one column of yarn for one side of double face.An experimental system is set up for verifying thefunction of digital yarn blackboard. The software ofDelphi (version: 7.0) was used as the tool to devel opthe experimental system, and the system of the com -puter used in the experiment was P8600 3.00 GHzand 2G DDRIII memory. Figure 2 shows an exampleof digital yarn blackboard with interface of software.
RESULTS AND DISCUSSIONS
Translating data from capacitive measurements
The result characterizes a given yarn’s linear massand the average diameter is deduced from the result,
328industria textila 2013, vol. 64, nr. 6˘
Fig. 1. Flowchart of digital blackboard system
Data recording part
Data analysing part
Build model of yarn
Digital blackboard
Auxiliary function
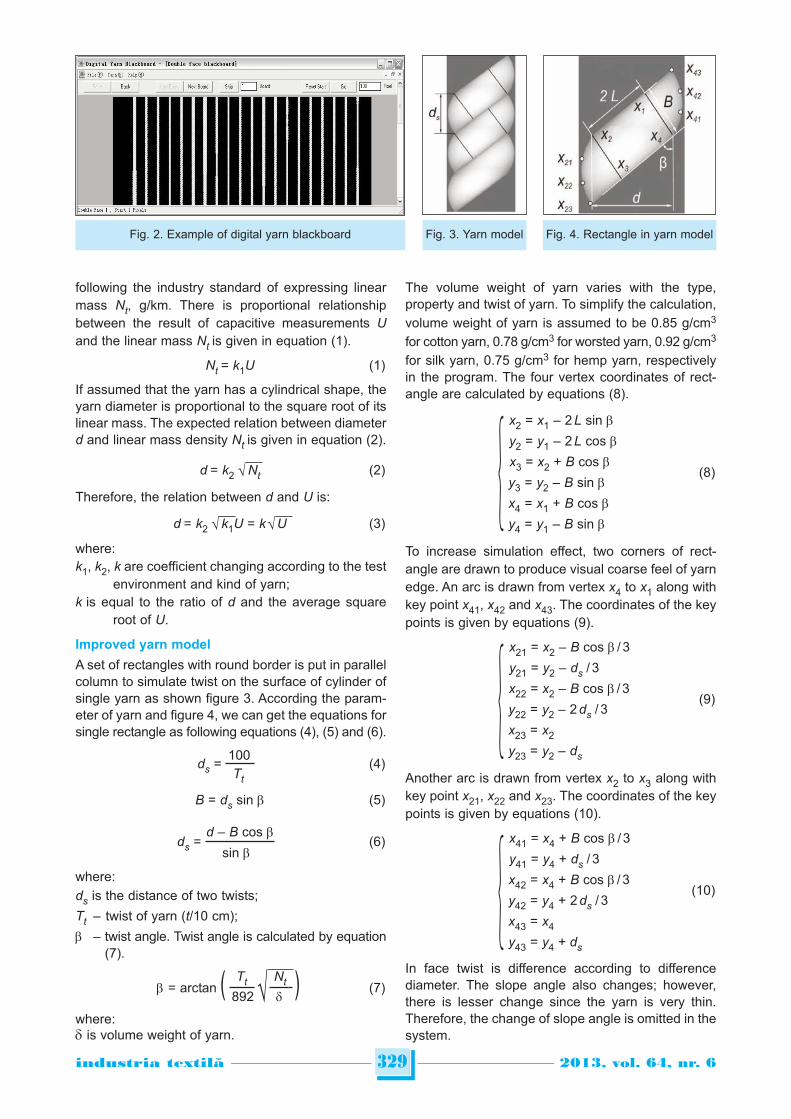
following the industry standard of expressing linearmass Nt, g/km. There is proportional relationshipbetween the result of capacitive measurements Uand the linear mass Nt is given in equation (1).
Nt = k1U (1)
If assumed that the yarn has a cylindrical shape, theyarn diameter is proportional to the square root of itslinear mass. The expected relation between diameterd and linear mass density Nt is given in equation (2).
d = k2 √Nt (2)
Therefore, the relation between d and U is:
d = k2 √k1U = k √U (3)
where:k1, k2, k are coefficient changing according to the test
environment and kind of yarn;k is equal to the ratio of d and the average square
root of U.
Improved yarn model
A set of rectangles with round border is put in parallelcolumn to simulate twist on the surface of cylinder ofsingle yarn as shown figure 3. According the param -eter of yarn and figure 4, we can get the equations forsingle rectangle as following equations (4), (5) and (6).
100ds = (4)Tt
B = ds sin β (5)
d – B cos βds = (6)
sin β
where:ds is the distance of two twists;
Tt – twist of yarn (t/10 cm);
β – twist angle. Twist angle is calculated by equation(7).
Tt Ntβ = arctan ( √ ) (7)892 δ
where:δ is volume weight of yarn.
The volume weight of yarn varies with the type,property and twist of yarn. To simplify the calculation,volume weight of yarn is assumed to be 0.85 g/cm3
for cotton yarn, 0.78 g/cm3 for worsted yarn, 0.92 g/cm3
for silk yarn, 0.75 g/cm3 for hemp yarn, respectivelyin the program. The four vertex coordinates of rect -angle are calculated by equations (8).
x2 = x1 – 2 L sin β
y2 = y1 – 2 L cos β
x3 = x2 + B cos β(8)
y3 = y2 – B sin β
x4 = x1 + B cos β
y4 = y1 – B sin β
To increase simulation effect, two corners of rect -angle are drawn to produce visual coarse feel of yarnedge. An arc is drawn from vertex x4 to x1 along withkey point x41, x42 and x43. The coordinates of the keypoints is given by equations (9).
x21 = x2 – B cos β / 3
y21 = y2 – ds / 3
x22 = x2 – B cos β / 3(9)
y22 = y2 – 2 ds / 3
x23 = x2
y23 = y2 – ds
Another arc is drawn from vertex x2 to x3 along withkey point x21, x22 and x23. The coordinates of the keypoints is given by equations (10).
x41 = x4 + B cos β / 3
y41 = y4 + ds / 3
x42 = x4 + B cos β / 3(10)
y42 = y4 + 2 ds / 3
x43 = x4
y43 = y4 + ds
In face twist is difference according to differencediameter. The slope angle also changes; however,there is lesser change since the yarn is very thin.Therefore, the change of slope angle is omitted in thesystem.
329industria textila 2013, vol. 64, nr. 6˘
Fig. 2. Example of digital yarn blackboard Fig. 3. Yarn model Fig. 4. Rectangle in yarn model

Pixel number for parameters
The screen of display is comprised of many pointscalled as pixel. According to resolution and size ofscreen, one pixel has different size. Therefore, thesystem calculates the height and width of pixel,respectively. In general, the size of pixel is about0.3 – 0.4 mm, whilst, the diameter of normal yarn is0.1 – 0.3 mm as listed in table 1 (e.g. d = 0.85). Whenwe want to simulate the information of yarn, we mustset 4 dots for one yarn at least, which express thecurve of reflecting rays. It is very important to selectappropriate magnification according to the count ofyarn. We advise the minimum magnification fordifferent yarns (table 2) on condition of resolution ofscreen: 1 024 × 768, ratio of width and height: 4:3 andsize of screen: 19 inch (width × height: 15.2 × 11.4).Therefore, in simulation the parameters of yarn mustbe magnified X times, after that the number of pixelcan be calculated.
Illumination model of yarn
Under visible light irradiation, the reflection, refrac -tive, transmission, absorption diffraction, interferenceand so on will be produced by the surface of yarn. Tosimulate yarns on digital yarn blackboard, the repro -duction of realistic intensity profile or illuminationmodel of yarn is the primary task. In fact, a digitalyarn blackboard is the intensity profile of a yarn, be itgrey or color shades, depends also on position ofviewpoint, power and the number of light sourcespresent in the environment. For simple model, thereis ambient light and reflection [32].
Diffused reflection model. According to LambertCosine Law a yarn can be assumed as a cylinderwith constant section to simplify the model as shownin figure 5. To simplify illumination model, diffusedreflection is considered only. According to LambertCosine Law, diffused reflection is due to the presenceof one or more external light sources and representsthe direct light being shattered on the yarn surfacefrom the light source(s). The center point a is thebrightest place when a ray of light perpendicularly irra - diate on the surface of yarn. The brightness graduallybecomes darker from the center point to both sidespoints c.
Assuming a single point light source is emanatinglight energy uniformly in all directions; the diffusedreflection is dependent on the incident angle ϕ betweensurface normal at the yarn point b and the directionof light source. The corresponding illumination formono chromatic light due to this external point lightsource is given by equations (11) and (12).
x 2cos ϕ = √1 – ( ) (11)r
πId = kd Ip cos ϕ, 0 ≤ ϕ ≤ (12)2
where: Ip is the intensity of the point light source. The degree of the light source diffusion is given bythe weight factor kd = [0, 1] that controls the extentof incident light diffused, depending on the surfaceprop erty. It is lower for duller surface such as yarn.Diffused reflection Id has only relation with the cosinevalue of the light source intensity.Effect of Yarn Light shining process could be per -formed to the whole yarn for brightness of the yarnafter twisted. The simulation effect of twisted yarn isshown in figure 6.
Development of auxiliary functions
This research demonstrates the feasibility of simu -lating yarn blackboard. Comparing with physical yarnblackboard, the system has particular propertiesdisplaying the data of yarn in different model. Thesystem includes two auxiliary functions: selectingsingle or double face of the blackboard, adjustingfreely the start point.Selecting view A continuous yarn is arranged on thedigital yarn blackboard alternating face and backview according to reeling process of yarn blackboard.At most half of the yarn comes into view omitting thethickness of yarn blackboard: face view or back view.Neither view shows all part of yarn since both viewsskip half of the yarn. The system provides simulta -neously face views as shown in figure 7 a and backviews as shown in figure 7 b. We can find the yarncontinues from the face view to back view and vice
330industria textila 2013, vol. 64, nr. 6˘
DIAMETER OF NORMAL YARN
Ne, s 80 60 50 40 30 21 10Nt, tex 7.3 9.7 11.7 14.5 19.5 27.8 58.3
D, mm 0.11 0.12 0.13 0.15 0.17 0.20 0.30
MAGNIFICATION OF NORMAL YARN
Ne, s 80 60 50 40 30 21 10
X 14 12 11 10 9 7 5
Table 2
Table 1
Fig. 5. Illumination of one point on the surface of yarn
Fig. 6. Effect of simulation for twisted yarn

versa. The system also provides single face in whichthe yarn is continuously arranged on the face view ofthe digital yarn blackboard. Adjusting the start point As long as the yarns arewound on the physical yarn blackboard, the yarnscannot be re-wound. Comparing with physical yarnblackboard the digital yarn blackboard uses the dataof diameter to simulate appearance of yarn; there -fore, the yarns can be re-wound on the digital black -board adopting different start point since the data canbe used repeatedly. It can reduce the processing ofwinding yarn on yarn blackboard. Figure 8 a showsan example of digital yarn blackboard. Assumed thestart point in figure 8a is 1st pixel, figure 8b shows anexample of digital yarn blackboard in which the startpoint is 200th pixel. From figure 8b, we find that allpart of one defect on the second line move to displayon the face view of the digital yarn blackboard. Wecan view the appearance of other defect easy usingsame method.
Detecting defect of yarn
The periodic defect is a kind of typical exampledefect. When there are periodic defects on the yarn,a typical digital blackboard is shown in figure 9. Fromthe figure periodic defects can be found. The size ofdefect is calculated as 28 mm and the distancebetween two defects is calculated as 160 mm. If we
adjust the height of blackboard to be the cycle ofperiodic defect, meanwhile we adjust the start point;the periodic can be deduced as shown in figure 10.
CONCLUSIONS
This has prompted many groups to develop digitalyarn blackboard for replacing of traditional yarn black -board. In the research a digital blackboard system isdeveloped for measuring yarn quality combining withthe measurement result through capacitive appa ra -tus in the research. The appearance of yarn is recon -structed based on the diameter data of yarn using amathematical model of rectangles and illuminationmodel of yarn. Furthermore, the software is improved. The platformcan be used for further operation accord ing to thepractical demand: the width and the height can beresized; single or double-face is option al; the color ofblackboard can be edited; the mag nification or mini -fication can be adjusted freely and so on. The exper -imental results showed that the system is flexible forconfiguration and convenient for operating. Becausethe use of winding blackboard is avoided in theresearch, the system will find widespread use inindustry.
Acknowledgements
The authors were grateful for the financial support by theopen project program of key laboratory of ECO-Textiles(Jiangnan University), ministry of education, China (NO.KLET1114, NO.KLET1113), the Fundamental ResearchFunds for the Central Universities of Jiangnan University(JUSRP211A51).
331industria textila 2013, vol. 64, nr. 6˘
Fig. 7. Face and back views:a – face view; b – back view
a b
Fig. 8. Result of adjusting the start point:a – start point 1st pixel; b – start point 200th pixel
a b
Fig. 9. Typical digital blackboard with periodic defects
Fig. 10. Typical digital blackboard with 188 mm height

332industria textila 2013, vol. 64, nr. 6˘
BIBLIOGRAPHY
[1] Carvalho, V., Soares, F., Vasconcelos, R., Belsley, M., Goncalves, N. Yarn hairiness determination using image pro-cessing techniques. Emerging Technologies & Factory Automation (ETFA), 2011 IEEE 16th Conference on, pp. 1–4
[2] Fabijanska, A., Kuzanski, M., Sankowski, D., Jackowska-Strumitto, L. Application of image processing and analy-sis in selected industrial computer vision systems. Perspective Technologies and Methods in MEMS Design.MEM-TECH International Conference, 2008, pp. 27–31
[3] Zhang, X., Gao, W., Liu, J. Automatic recognition of yarn count in fabric based on digital image processing. Imageand Signal Processing, 2008. CISP '08 Congress, 3, pp. 100–103
[4] Fabijanska, A. A survey of thresholding algorithms on yarn images. Perspective Technologies and Methods inMEMS Design (MEMSTECH). Proceedings of 6th International Conference, 2010, pp. 23–26
[5] Kuzariski, M. The algorithms of the yarn shape detection and calculation of the protruding fibres length. PerspectiveTechnologies and Methods in MEMS Design. MEMSTECH International Conference 2008, pp. 98–100
[6] Kuzahski, M., Jackowska-Strumillo, L. Yarn hairiness determination the algorithms of computer measurement met-hods. Perspective Technologies and Methods in MEMS Design. MEMSTECH International Conference 2007,pp. 155–158
[7] Su, C., Lai, P. Evaluating the unevenness of stretch-broken tow in tow-to-yarn direct spinning. In: Fibers andPolymers, 2010, vol. 11, issue 4, pp. 648–653
[8] Slater, K. Yarn Evenness. In: Textile Progress, 1986, vol. 14, issue 3, 4, pp. 1–95[9] Liu, J., Xie, Z., Gao, W., Jiang, H. Automatic determination of slub yarn geometrical parameters based on an
amended similarity-based clustering method. In: Textile Research Journal, 2012, vol. 80, issue 11, pp. 1 075–1 082[10] Militký, J., Ibrahim, S. Complex characterization of yarn unevenness. Studies in Computational Intelligence, 2007,
vol. 55, pp. 57–73[11] Vítor, C., Monteiro, L., Soares, F., Vasconcelos, R. Yarn evenness parameters evaluation: A new approach. In:
Textile Research Journal, 2008, vol. 78, issue 2, pp. 119–127[12] Hakan, Ö., Güngör, B. Computer simulation of woven fabric defects based on faulty yarn photographs. ISCIS 2006,
LNCS, pp. 325–333
[13] Zellweger Uster Ltd. Application report measurement of slub yarns with the Uster®tester 5, 2009;http://www.uster.com/UI/textile-Fancy-Yarn-Profile-2-3034.aspx
[14] Zellweger Uster Ltd. Uster Tester 5-C800 technical data, 2005[15] Sriprateep, K., Bohz, E. A new computer geometric modeling approach of yarn structures for the conventional ring
spinning process. In: The Journal of The Textile Institute, 2009, vol. 100, issue 3, pp. 223–236[16] Liao, T., Adanur, S. A novel approach to three-dimensional modeling of interlaced fabric structures. In: Textile
Research Journal, 1998, vol. 68, issue 11, pp. 841–847[17] Lin, H., Newton, A. Computer representation of woven fabrics by using B-splines. In: The Journal of the Textile
Institute, 1999, vol. 90, issue 1, pp. 59–62[18] Jiang, Y. Chen, X. The structural design of software for simulation ftand analysis of woven fabric by geometry model.
Textile Institute Conference, Donghua University Press, Shanghai, 2004, pp. 1 298–1 301[19] Zhong, H., Xu, Y., Guo, B., Shum, H. Realistic and efficient rendering of free-form knitwear. In: Journal of
Visualization and Computer Animation, 2001, vol. 12, issue 1, pp. 13–22 [20] Lomov, S., Verpoest, I. Model of shear of woven fabric and parametric description of shear resistance of glass
woven reinforcements. In: Composite Science Technology, 2006, vol. 66, pp. 919–933[21] Sherburn, M. Geometric and mechanical modeling of textiles. PhD Thesis, The University of Nottingham, 2007[22] Kayacan, O., Kurbak, A. Basic studies for modeling complex weft knitted fabric structures. Part IV. Geometrical
modeling of miss stitches. In: Textile Research Journal, 2008, vol. 78, issue 8, pp. 659–663[23] Aileni, R. M., Ciocoiu, M., Fărîmă, D. Modeling and 3D simulation of the garment product. In: Industria Textilă, 2011,
vol. 62, issue 3, pp. 141–45[24] Olaru, S., Niculescu, C., Mocenco, A., Săliștean, A., Teodorescu, M. Shape categories for the Romanian female
population and specific clothing recommendations. In: Industria Textilă, 2011, vol. 62, issue 3, pp. 141–45[25] Tom, C., Sergei, G., Weih-Her, H. Yarn CAD simulation for fashion and textile design education. In: International
Journal of Fashion Design, Technology and Education, 2008, vol. 1, issue 1, pp. 13–21[26] Kang, T., Kim, S., Jung, K. Analysis of geometrical parameters using a CAD system for a 3-D braided preform. In:
Textile Research Journal, 2008, vol. 78, issue 10, pp. 922–935[27] Chen, X. Mathematical modeling of 3D woven fabrics for CAD/CAM software. In: Textile Research Journal, 2011,
vol. 81, pp. 42–50[28] Liao, T., Adanur, S. A novel approach to three-dimensional modeling of interlaced fabric structures. In: Textile
Research Journal, 1998, vol. 68, pp. 841–847[29] Özdemir, H., Baser, G. Computer simulation of woven fabric appearances based on digital video camera recordings
of moving yarns. In: Textile Research Journal, 2008, vol. 78, pp. 148–157[30] Semnani, D., Sheikhzadeh, M., Hadjianfar, M., Reyhani, Z. Study of structural parameters of weft knitted fabrics on
luster and gloss via image processing. In: Industria Textilă, 2012, vol. 63, issue 1, pp. 42–47

333industria textila 2013, vol. 64, nr. 6˘
[31] Zhou, X., Cheng, L. Digital image processing method of yarn black board. In: Journal of Textile Research, 2008,vol. 29, issue 8, pp. 30–34
[32] Mukherjee, D. P., Jana, D. Computer graphics algorithms and Implementations. PHI Learning Private Limited,New Delhi, 2011
Authors:
Chief of works dr. eng. JIHONG LIU Conf. dr. eng. BO ZHU
Conf. dr. eng. HONGXIA JIANG Conf. dr. eng. RURU PAN
Conf. dr. eng. WEIDONG GAOJiangnan University
1800 LiHu Road, Wuxi, 214122 China
e-mail: [email protected]; [email protected]
DOCUMENTARE
CONFORT SPORIT CU SALTEAUA iSURO
Salteaua iSURO, din bobiţe de polistiren şi structuritricotate din urzeală 3D, tip sandwich, conturatespațial, optimizează confortul somnului. Alegereasaltelei potrivite poate avea un impact pozitiv asupracalității somnului şi, prin urmare, asupra regenerăriicorpului. Ideal este ca stratul de bază să diminuezepresiunea, să susţină coloana şi să ofere libertate demişcare, cerinţe pe care salteaua iSURO AG lesatisface într-un mod inovator. Prin combinareasferelor de polistiren cu structuri tip sandwich şispumă, saltelele devin mai uşoare, mai ferme şi maimaleabile decât vechile tipuri de saltele construiteconvenţional. Iniţial, salteaua iSURO a fost proiectată pentru a fiutilizată în sectorul medical, construcţia sa specialăpermițându-i adaptarea la anatomia corpului ome -nesc. Miezul construcţiei stratului de bază flexibil estestratul iSU, din aşa-numitele sfere iSURO. Sferelerealizate din polistiren, la aceeaşi dimensiune – câtgămălia unui ac, se pot mişca liber în interiorulstratului iSU, ceea ce înseamnă că ele se pot adaptala orice poziţie a corpului, oferind un suport ferm. Prinadăugarea unui amestec fibros, umplutura devinepufoasă. Stratul fibros este inserat în material princoasere, creând un model ondulat, datorită matlasăriipe diagonală. Segmentele previn uzura în centrulsaltelei, iar husa este largă şi elastică, permiţândutilizatorului să se aşeze confortabil, fără a simţipuncte de presiune. Materialul tricotat din urzeală, cuo structură tip sandwich, este aşezat pe partea de josa stratului iSURO. Acest material cu pori deschişipermite circulaţia aerului, menţinând tot timpul unclimat echilibrat. Construcţia stratificată, alcătuitădintr-un strat iSU şi un material 3D tricotat dinurzeală, este încorporată într-un strat de spumă,pentru a crea un suport ferm.
Utilizatorii acestor saltele confirmă faptul că iSUROconferă o senzaţie de confort și de cald, garanteazăun somn relaxant și ajută la reducerea durerii înregiunea spatelui şi gâtului. Daniela Happel, dez vol -tator de produs la iSURO sublinia faptul că “copiilor leplace în special senzaţia că se află într-un cuib,datorită suprafeței ușor vălurite, create de sfere”.Substratul ferm, dar maleabil, atenuează starea deagitaţie, iar sferele iSURO flexibile permit mişcăriindependente ale încheieturilor. Suprafaţa flexibilăpermite persoanei care doarme să găsească imediato altă poziţie, iar presiunea să fie redistribuită. Pentrua asigura menţinerea caracteristicilor funcţionale alesaltelei, aceasta trebuie scuturată în mod regulat, iarsferele trebuie împinse către centru.Institutul pentru sport şi cercetare interdisciplinară asomnului (ISIS) a testat eficienţa saltelelor iSURO.Specialiştii din Münster au efectuat, timp de şasesăptămâni, testări pe 32 de bărbaţi şi femei, care auimplicat interviuri și completarea unor formulare,pentru a studia calitatea somnului. Testările au fostefectuate folosind o saltea iSURO şi o saltea cuarcuri. Toate datele culese au arătat că substratul cuumplutură de sfere a îmbunătăţit calitatea somnului.Aproximativ 87,5% din persoanele testate au afirmatcă au avut un somn mult mai odihnitor decât atuncicând au dormit pe vechile saltele cu arcuri. Numai12,5% din subiecții testați au afirmat că au dormit maibine pe salteaua cu arcuri.În concluzie, se poate afirma că efectele pozitive alesistemului inovator iSURO constau în aceea că62,5% din subiecții testați au adormit mai repede,50% din ei au avut mai puţine întreruperi ale somnu -lui, iar 37,5% au dormit mai profund şi s-au răsucitmai puţin în timpul somnului. Studiul a arătat, deasemenea, că alte valori măsurate în mod obiec tiv,cum ar fi variaţia ritmului cardiac, s-au îmbunătățitsemnificativ.
Kettenwirk Textilinformationen Praxis, martie 2013,p. 21
Noi tehnologii

Warp knitting is by far the most versatile fabricproduction system in textiles. Warp knitted fab -
rics can be produced elastic or stable, with an openor closed structure. The flexibility of warp knittingtech niques makes them attractive both to the design -er and to the manufacturer of technical textiles,where knitted products can meet the requirementsof a large range of applications: medical, protective,rein forced composites, industrial uses [1]. Their con -tin uously spreading use in technical applicationsincreas es the research interest related to them,either concerning their complex structure [2], [3], orregarding their mechanical properties. Textile materials and products made of these mate -rials are exposed to varied load regimes [4]. The loadregimes act in two different stages: during their tech -nological processes and during their use. The defor -mation properties are different in the two cases. Duringknitting stage, both yarns and fabrics are load edcyclically, at a relative high frequency, there fore aspecial vibration testing device has been devel oped,for textile materials of different kind, during cyclicalstress at a high frequency. A vibration sensor wasused as exciter, generating cyclical elongation of thetextiles. The range of attainable frequencies at themaximum elongation of textiles was determined bythe vibration system [5].
Nowadays the warp knitted structures produced byhigh performance fibers made from glass or carbonare used for composites reinforcement. The tensilebehaviors of the CWKF (co-woven-knitted fabric)com posite under the quasi-static and high strain ratetension were compared and analyzed in the fre -quency domain using the Fast Fourier Transform(FFT) method. The results show that the tensionbehavior, amplitude spectrum and phase spectrum ofthe CWKF composite are strain rate sensitive. TheCWKF composite can absorb higher energy in aspecific frequency range [6].
MATERIALS AND METHOD
Materials under testing
Knitting techniques and machinery are extensivelyused for the production of textile products for gar -ments and industrial use. Warp knitting is the mostsuitable technique for the production of DOS(Directionally Oriented Structures) fabrics, with noncrimped inserted yarns, used for composite materialsproduction. The use of warp knitted fabrics in tech -nical applications usually involves the use of yarnsmade of high performance fibres such as aramids,glass and carbon, which are more complex due to
Warp knitted fabrics behaviour under dynamic testing
MIRELA BLAGA NECULAI-EUGEN SEGHEDIN
ANA RAMONA CIOBANU
REZUMAT – ABSTRACT
Comportarea tricoturilor din urzeală la testarea dinamică
În lucrare se propune o metodă indirectă de determinare a rigidităţii tricoturilor din urzeală, prin analiza comportăriidinamice a acestora. Perfomanţele dinamice ale acestor tricoturi au fost evaluate prin determinarea frecvenţelorproprii de vibraţie, obţinute în urma excitării prin şoc a unui ansamblu elastic, compus dintr-o masă metalică şi tricotulatașat acesteia. Cercetările au avut în vedere determinarea rigidităților relative ale diverselor probe de material. Acesterigidități au fost apreciate prin intermediul frecvențelor naturale ale sistemelor elastice masă metalică - tricot, cunoscutăfiind relația directă dintre rigiditate și frecvența naturală. Frecvenţele naturale au fost determinate prin aplicareaTransformatei Fourier Rapidă, în acest scop utilizându-se instrumentul virtual Spectrum Analyzer, din mediul LabView.Testele au fost efectuate asupra unor tricoturi produse de firmele Karl Mayer și Liba, fiind proiectate ca suport pentrustructurile laminate. S-au analizat efectele structurii, ale tipului de fire și ale finisării asupra comportării dinamice atricoturilor din urzeală.
Cuvinte-cheie: tricoturi din urzeală, vibrații, comportare dinamică, textile tehnice
Warp knitted fabrics behaviour under dynamic testing
This paper aims at presenting the preliminary results of the research concerning warp knitted fabrics behavior underdynamic stress. The dynamic performances of knitted fabrics have been evaluated through the recorded frequenciescaused by one impact hammer. Fast Fourier Transformation-FFT has been applied and the Spectrum Analyzerapplication from the LabView software was employed to determine the natural frequencies of the system. The tests werecarried out on fabrics produced by Karl Mayer and Liba companies, for basic coatings and laminating, geotextiles, andreinforced composites. The effects of structure, yarn type and finishing treatment on the dynamic performance of knittedfabrics were evaluated.
Key-words: warp knitted fabrics, vibrations, dynamic behaviour and technical textiles
334industria textila 2013, vol. 64, nr. 6˘

their high stiffness, low extension at break and highflexural rigidity [11]. The investigations were carried out on DOS warpknits with parallel non-crimped yarns, as being rep -resentative for technical applications, such as:agricultural, road constructions, slope stabilization,roofing, bank reinforcement. These products may bemanufactured in a way featuring optimum charac -teristics in line with the final purpose, on warp knittingmachines with specific devices. The fabrics wereproduced on Karl Mayer and Liba machines, ascommercial samples, provided with the purpose ofdemonstrating the technical facilities of warp knittingmachines. The samples were coded and groupedaccording to their end use, the machine where it hasbeen produced, yarn type inserted into the structureand raw material used. The technical features of theselected fabrics are presented in tables 1–4.
Testing method and equipment
In order to make a complete characterization of themechanical behavior of warp knitted fabrics, freevibra tion method was employed [7]. An elastic sys -tem out of the position of stable equilibrium, thenreleased, produces free vibrations. In the presence offriction forces, mechanical energy is dissipated, andthe vibration is damped by a certain number ofcycles. Free vibration frequencies depend on themass, stiffness and damping of the system. They areindependent of the initial conditions of the motion or
of the system external forces. Therefore, their fre -quency or frequencies are called natural frequency ofvibrations. For a given system, they have constantvalues well defined [8]. The dynamic behavior of knitted fabrics has beenstudied by analyzing the frequencies that charac -terize the motion of one attached mass. Metal massattached to the textile material acts like a seismicmass, to the testing directions. Frequencies can bemeasured using an accelerometer attached to thismass. Periodic signals can be written as a countable sum ofsinusoidal components whose amplitudes and phas -es can be easily calculated from these signals, whichare Fourier series. Fourier transform generalizes thesignal decomposition into a sum of sinusoids andnon-periodic signals [8]. Fast Fourier transform (FastFourier Transformation) allows an easy calculation ofthe frequency spectrum of a sequence of data.There are several formulas for calculating the Fouriertransform, which differ by the magnitude of the result,scaling or frequency sign. One of the most commonlyused formulas is:
∞F (ξ) = ∫ f (x) e–2 π i x ξ dx (1)
–∞
Under certain conditions the Fourier transform cancompletely recover the original function by applyingthe inverse Fourier transform:
∞f (x) = ∫ F (ξ) e2 π i x ξ dξ (2)
–∞
335industria textila 2013, vol. 64, nr. 6˘
KARL MAYER – BASIC FABRICS FOR COATING (C) – UNIAXIAL TYPE
Code Machine YarnsThreading Chain link
Structural parameters
L, mm/rack M,g/m2
Courses/10 cmGB 1
frontGB 2back GB 1 GB 2 GB 1 GB 2
C1 RS3 EMSE 18
A – dtex 80f 24 PES HT
B – dtex 1 100 f 200 PES HT
C – dtex 1 100f 200 HT PES
full A
Weft: full C
full B 1–0/1–2
0–0/0–0
2 490 636 184 76
C2 RS3 EMS E 18
A – dtex 76 f 24 PES
B – dtex 550 f 96 PES HT
C – dtex 550f 96 PES HT
full A
Weft: full C
full B 1–0/1–2
0–0/0–0
2 430 695 97 71
C3 RS3 EMS E 18
A – dtex 80 f 24 PES HT
B – dtex 1 100 f 200 PES HT
C – dtex 1 100 f 200 HT PES
full A
Weft: full C
full B 1–0/1–2
0–0/0–0
2 550 680 173 72
C4 RS3 MSU-NE 24
A – dtex 100 f 30 PES
B – dtex 1 100 f 200 PES
C – dtex 1100 f 200 PES
full A
Weft: full C
full B 1–0/1–2
0–0/0–0
2 540 485 265 100
Table 1

336industria textila 2013, vol. 64, nr. 6˘
KARL MAYER – BASIC FABRICS FOR LAMINATED (L) – UNIAXIAL TYPE
Code Machine YarnsThreading Chain link
Structural parameters
L, mm/rack M,g/m2
Courses/10 cmGB 1
frontGB 2back GB 1 GB 2 GB 1 GB 2
L1 RS3 MSUE 9
A – dtex 80f 24 PES HT
B – dtex 1 100 f 200 PES HT
full A
Weft: full B
full B 1–0/1–2
1–1/0–0
3 460 695 135 35
L2 RSP3 MSU – V E 18
A – dtex 80 f 24 PES HT
B – dtex 1 100 f 200 PES HT
C – dtex 1 100 f 200 PES HT
D – fleece PES 30 g/m2
full A
Weft: full C
full B 1–0/1–2
0–0/0–0
2 620 695 210 70
L3 RSP3 MSU – V E 9
A – dtex 80 f 24 PES HT
B – dtex 1 100 f 200 PES HT
C – fleece PES 30 g/m2
full A
Weft: 1B 1 out
full B 1–0/1–2
0–0/0–0
2 550 680 102 72
L4 RS3 EMS E 18
A – dtex 80 f 24 PES HT
B – dtex 550 f 96 PES HT
C – dtex 550 f 96 PES HT
1A 1 out
Weft: full C
1 out1B
1–0/2–3
1–1/0–0
4 800 1 300 48 71
LIBA – GEOTEXTILES (G) – BIAXIAL TYPE
Code Machine YarnsThreading Chain link Structural parameters
Cell size,mm × mm
M,g/m2
Courses/10 cmGB 1 GB 2 FB 3 GB 1 GB 2 FB 3
G1 COPCENTRA HS 2-STE6
A – PES 167dtex f 34
B – glass 2 400 tex
1A2 out
Weft: 1B4 out
1A2 out
1B2 out
1–2/1–0
1–0/1–2
0–0/0–0
12 × 12 500 42
G2 COPCENTRA HS 2-STE6
A – PES 167dtex f 34
B – glass 2 400 tex
1A2 out
Weft: 2B4 out
1A2 out
1B2 out
1–2/1–0
1–0/1–2
0–0/0–0
12 × 15 624 40
G3 COPCENTRA HS 2-STE6
A – PES 167dtex f 34
B – glass 2 400 tex
2A4 out
Weft: 2B6 out
2A4 out
2B4 out
1–2/1–0
1–0/1–2
0–0/0–0
25 × 25 530 32
G4 COPCENTRA HS 2-STE12
A – PES 167dtex f 32
B – PES 1 100 dtexf 200
3A14 out
Weft: 4B × 68 out
3A14 out
3B × 814 out
1–0/1–2
1–2/1–0
0–0/0–0
30 × 30 400 28
G5 COPCENTRA HS 1-STE5
A – PES 167dtex f 32
B – PES 1 100 dtexf 210
Full A
Weft: 1B1 out
Full B 1–0/0–1
0–0/1–1
5 × 5 115 40
Table 2
Table 3

From the conceptual argument ξ is a frequency, where -as x is a dimension (temporal or spatial). Fouriertransform of the function f can be noted symbolically:
F = f (3)This capacity for reorganization of the Fourier trans -form of frequency information (temporal, spatial orother wise) is very useful in signal processing ofvarious types, to understanding the properties ofmany physical systems, to solve equations in otherscientific fields theoretical and applied. During vibra -tion, mechanical energy dissipates by friction or otherresistance. In the presence of damping, free vibrationamplitude decreases over time and to maintain con -stant amplitude of vibration outside forces should beapplied. In general, energy dissipation is called damp -ing. It is produced by internal friction in materials, thefriction between the components of one structure, thefluid-structure interactions, radiation and motion inelectric or magnetic fields. Structural or hystereticdamping is described by a damping force in phasewith velocity, but proportional to the displacement [8].In case of knitted fabrics, energy dissipation is deter -mined by relative friction between the yarns and thespecific internal friction yarn structure. The frictiondepends on the nature of yarn, knitting technology,finishing chemical treatments etc.Dynamic performance of knitted fabrics has beenstudied by testing the dynamic behaviour of onemetal lic piece, 135 g weight, 30 × 70 × 30 mm dimen -sions, fixed through an adhesive, directly on theirsurface. Also, the textile material is fixed on oneheavy plate, with an adhesive. This way, the relativemovements between the piece-knitted fabric-platehas been avoided. This method allows the measure -
ment of the vibrations of the metallic piece, by usingan impact hammer employed as an exciter. Thevibrations were produced and measured on threedirections: wale wise (fig. 1a), course wise (fig. 1b)and perpendicular on the fabric surface (fig. 1c). Theequipment used as an exciter consists of an impacthammer Piezotronics and vibrations were measuredwith an accelerometer PCB B52 Piezotronics. Thesignal is processed with a data acquisition card 6023National Instruments. In order to determine the nat -ural frequencies of the system, the Fast FourierTransformation-FFT has been applied and theSpectrum Analyzer application from the Lab View 8.2software [9] has been employed (fig. 2). The recorded frequencies obtained by using theemployed software are displayed in figures 3 – 6 forone sample from each group of fabrics. For all knittedspecimens, the tests were conducted similarly andthree experimental values for each sample havebeen recorded. The average values were calculatedand displayed in table 5, to facilitate the discussionsand general conclusions.
RESULTS AND DISCUSSIONS
Testing direction
The comparative analysis of fabric’s behavior fromeach group of fabrics has been depicted in figures 7a, b, c, d. The differences between sam ples withinthe same group are small, considering the relativeless variations of their structural parameters.However, some observations can be made, about thedirection along which the vibrations were measured.For the C1 – C4 group, fabrics natural frequencies
337industria textila 2013, vol. 64, nr. 6˘
LIBA – GEOTEXTILES (G) – MULTIAXIAL TYPE
Code Machine YarnsThreading Number of multiaxial
threadsStructural parameters
Chain link M,g/m2
Courses/10 cmGB 1 GB 2 +45° 90° –45° GB 1 GB 2
G6 COPMultiaxialE6
A – PES76 dtex f 24+45° glas 68 tex90° glas 68 tex–45° glas 68 tex
Full A - 48 72 48 1-0/1-2
- 689 64
G7 COPMultiaxialCNCE5
A – PES50 dtex f 24+45° carbon 800 tex–45° carbon 800 tex
empty Full B 10 - 10 - 1-0/0-1
275 38
G8 COPCENTRMultiaxialCNCE5
A – PES76 dtex f 24+35° glas 600 tex90° glas 600 tex–45° glas 600 tex
empty Full A 48 30 48 - 1-0/1-0
1 106 30
Table 4

reveal a comparable level of the values on wale andcourse direction 65–85 Hz, the differences beingassociated with the machine gauge and fabric square
mass, mostly noticeable for sample C4, 94–98 Hz. Incase of L1 – L4, fabric L4 has a sensible increasedvalue of the frequencies, comparing to the otherthree. This can be explained by its different thread -ing, yarn fineness and consumption. For the groupG1 – G5, the results are comparable, sample G4 pre -sents the lowest values of the determined fre quen -cies, the differences being justified by the highermachine gauge and cell dimensions. The multiaxialfabrics G6 – G8, have responded similarly to thedinamic testing, fabric G6 has the highest values fromthe group, the machine higher gauge being resposi -ble for this, together with yarn fineness. On the per -pendicular direction, the natural frequencies areplaced in a higher range of values for all fabrics, factthat can be explained by the increased system rigid ity,created by the assembly attached mass – knitted
338industria textila 2013, vol. 64, nr. 6˘
a b cFig. 1. Direction of producing and measuring the vibrations:
a – walewise; b – coursewise; c – perpendicular
a b cFig. 3. Natural frequencies of the knitted fabric on various directions – sample C1:
a – walewise; b – coursewise; c – perpendicular
Fig. 2. Spectrum analyzer application
a b cFig. 4. Natural frequencies of the knitted fabric on various directions – sample L1:
a – walewise; b – coursewise; c – perpendicular

339industria textila 2013, vol. 64, nr. 6˘
fabric. Another explanation can be connected to thefabric thickness and its cross section, the number ofcontact points between yarns.
Yarn consumption
For the group L1 – L4, samples with weft parallelyarns, the results can be interpretated from the figure7b. L2 and L3 contain a fleece layer, leading to aheavier structure, but with lower yarn consumption.The structural parameters have close values for thesetwo fabrics, from course density to yarn con sumptions
for both bars. L3 is the single sample, having partialthreading for weft in-laid yarns, and the lowest yarnconsumption. This structural arrange ment provides asofter structure, which is reflected in the lowest valuesof natural frequencies, as can be observed in figure7b. One preliminary conclusion can be drawn: struc -tures with lower yarn run-in [mm/rack] indicate lowervalues of natural frequencies, and con sequentlylower fabric rigidity. This theory is con firmed by thesample L4, which has been manu factured with thehighest yarn consumption and also has registered
a b cFig. 6. Natural frequencies of the knitted fabric on various directions – sample G6:
a – walewise; b – coursewise; c – perpendicular
a b cFig. 5. Natural frequencies of the knitted fabric on various directions – sample G1:
a – walewise; b – coursewise; c – perpendicular
a b
c d
Fig. 7. Natural frequencies of the knitted fabrics in relation with testing direction:a – fabrics C1 – C4; b – fabrics L1 – L4; c – fabrics G1 – G5; d – fabrics G6 – G8
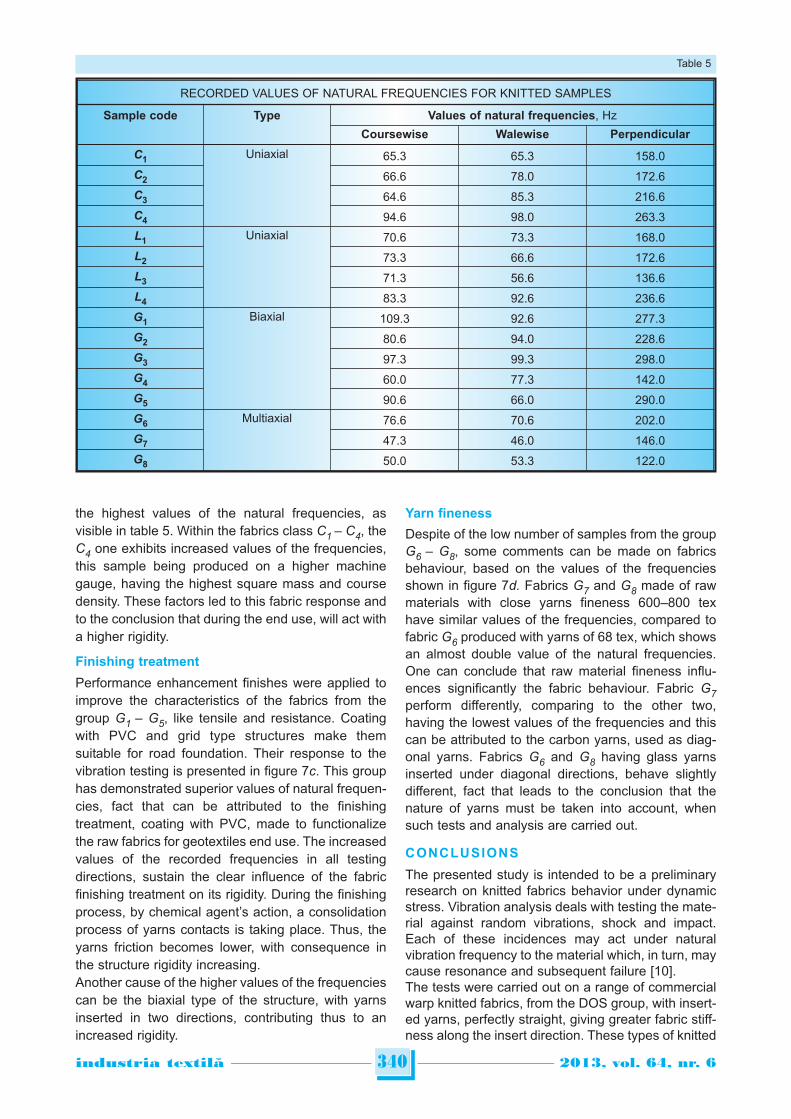
the highest values of the natural frequencies, asvisible in table 5. Within the fabrics class C1 – C4, theC4 one exhibits increased values of the frequencies,this sample being produced on a higher machinegauge, having the highest square mass and coursedensity. These factors led to this fabric response andto the conclusion that during the end use, will act witha higher rigidity.
Finishing treatment
Performance enhancement finishes were applied toimprove the characteristics of the fabrics from thegroup G1 – G5, like tensile and resistance. Coatingwith PVC and grid type structures make themsuitable for road foundation. Their response to thevibration testing is presented in figure 7c. This grouphas demonstrated superior values of natural frequen -cies, fact that can be attributed to the finishingtreatment, coating with PVC, made to functionalizethe raw fabrics for geotextiles end use. The increasedvalues of the recorded frequencies in all testingdirections, sustain the clear influence of the fabricfinishing treatment on its rigidity. During the finishingprocess, by chemical agent’s action, a consolidationprocess of yarns contacts is taking place. Thus, theyarns friction becomes lower, with consequence inthe structure rigidity increasing.Another cause of the higher values of the frequenciescan be the biaxial type of the structure, with yarnsinserted in two directions, contributing thus to anincreased rigidity.
Yarn fineness
Despite of the low number of samples from the groupG6 – G8, some comments can be made on fabricsbehaviour, based on the values of the frequenciesshown in figure 7d. Fabrics G7 and G8 made of rawmaterials with close yarns fineness 600–800 texhave similar values of the frequencies, compared tofabric G6 produced with yarns of 68 tex, which showsan almost double value of the natural frequencies.One can conclude that raw material fineness influ -ences significantly the fabric behaviour. Fabric G7perform differently, comparing to the other two,having the lowest values of the frequencies and thiscan be attributed to the carbon yarns, used as diag -onal yarns. Fabrics G6 and G8 having glass yarnsinserted under diagonal directions, behave slightlydifferent, fact that leads to the conclusion that thenature of yarns must be taken into account, whensuch tests and analysis are carried out.
CONCLUSIONS
The presented study is intended to be a preliminaryresearch on knitted fabrics behavior under dynamicstress. Vibration analysis deals with testing the mate -rial against random vibrations, shock and impact.Each of these incidences may act under naturalvibration frequency to the material which, in turn, maycause resonance and subsequent failure [10].The tests were carried out on a range of commercialwarp knitted fabrics, from the DOS group, with insert -ed yarns, perfectly straight, giving greater fabric stiff -ness along the insert direction. These types of knitted
340industria textila 2013, vol. 64, nr. 6˘
RECORDED VALUES OF NATURAL FREQUENCIES FOR KNITTED SAMPLES
Sample code Type Values of natural frequencies, Hz
Coursewise Walewise Perpendicular
C1 Uniaxial 65.3 65.3 158.0
C2 66.6 78.0 172.6
C3 64.6 85.3 216.6
C4 94.6 98.0 263.3
L1 Uniaxial 70.6 73.3 168.0
L2 73.3 66.6 172.6
L3 71.3 56.6 136.6
L4 83.3 92.6 236.6
G1 Biaxial 109.3 92.6 277.3
G2 80.6 94.0 228.6
G3 97.3 99.3 298.0
G4 60.0 77.3 142.0
G5 90.6 66.0 290.0
G6 Multiaxial 76.6 70.6 202.0
G7 47.3 46.0 146.0
G8 50.0 53.3 122.0
Table 5

structure are termed non-crimp structures and can beproduced in a single stage knitting process. According to the referenced sample of knitted fabric,some preliminary conclusions can be summarized,as follows: • Research indicated a comparable dinamic behav-
ior on wale and course direction of the fabrics.This sim ilar response can be explained by the gridstructures of all samples, well balanced by thepresence of the straight yarns, inserted in variousdirections. The comparable behaviour of the fab-rics on the two directions can be attributed to factthat the vibration mechanism does not involve anymovement or distribution of the yarn inside thestructure.
• The most significant differences of the fabrics nat-ural frequencies were recorded on perpendiculartesting direction. This is the direction that knits canbe used for shock isolation of the fine mechan icdevices, as potential end uses.
• The finishing process, by its chemical agent’s actionproved a certain influence on the higher natural
frequencies values of the tested fabrics. The con -solidation process of yarns contacts is taking place,determining a lower yarns friction and thus anincreased rigidity of the structure.
Further research will primary taking into account thedynamic testing on the perpendicular fabric direction,correlated with other parameters, such as: – yarns properties (nature, fineness, bending, rigid -
ity, tensile);– number of contact points per square unit;– vibrations amplitude;– finishing treatment of the knitted fabrics.The research conducted so far, have been carriedout considering that, the fabrics were preloaded onthe perpendicular direction, under the action of seis -mic mass weight. More, the studies will considervarious initial pretension values in this direction.Another future research objective is the study of theenergy dissipation way of the vibrating mass, throughthe ratio between dissipated energy by the yarnsbending and yarns friction.
341industria textila 2013, vol. 64, nr. 6˘
Authors:
MIRELA BLAGA
ANA RAMONA CIOBANU
Universitatea Tehnică Ghe. Asachi
Facultatea de Textile-Pielărie şi Management Industrial
Bd. D. Mangeron nr. 53, 700050 Iaşi
e-mail: [email protected]
NECULAI EUGEN SEGHEDIN
Universitatea Tehnică Ghe. Asachi
Facultatea de Construcții de Mașini și Management Industrial
Bd. D. Mangeron nr. 43, 700050 Iaşi
BIBLIOGRAPHY
[1] Karl Mayer Technical Textiles Guide. Karl Mayer GmbH, Germany[2] Renkens, W., Kyosev, Y. Geometry modelling of warp knitted fabrics with 3D form. In: Textile Research Journal,
2011, vol. 81, issues 4, pp. 437–443[3] Kalivretaki, A. et. al. Finite element modeling of the warp knitted structure. In: Research Journal of Textile and
Apparel, Hong Kong Polytechnic University, 2007, vol. 11, issue 4, pp. 40 – 47, ISSN 1560 – 6074[4] Morton, W. E., Hearle, J. W. S. Physical properties of textile fibers. The Textile Institute Butterworths, Manchester
& London, 1962 [5] Tumajer, P. et. al. Use of the Vibtex vibration system for testing textiles. In: AUTEX Research Journal, June 2011,
vol. 11, issue 2[6] Pibo, Ma. et al. Frequency features of co-woven-knitted fabric (CWKF) composite under tension at various strain
rates. Composites: Part A, 2011, vol.42, issue 5, p. 446–452[7] Seghedin, N. E., Blaga, M., Ciobanu, R. Weft knitted fabrics behaviour under dynamic testing. 12th World Textile
Conference AUTEX, June 13th to 15th, 2012, Zadar, Croatia, pp. 455–460[8] Goldman, S. P. E. Vibration spectrum analysis, a practical approach. Industrial Press. Inc., 1999[9] Rades, M. Vibrații mecanice. Printech Publishing House, Bucharest, 2008
[10] Mogahzy, Y. E. El. Engineering textiles, integrating the design and manufacture of textile products. WoodheadPublishing Limited, Cambridge England, 2009, ISBN 978-1-84569-048-9
[11] Au, K. F. Advances in knitting technology. Woodhead Publishing Limited, Cambridge England, 2011, ISBN 978-1-84569-372-5

The SWOT analysis is a research method thatindicates the opportunity of the introduction of
technological change in the circuit of execution of acertain product. It is considered the first stage ofstrategic planning of an organization [1], [2]. The SWOT analysis method falls back upon fourresearch directions: strengths, weaknesses, oppor tu -nities and threats of the business [3]. The phases ofSWOT analysis encompass some stages:• the identification of strengths, weaknesses,
oppor tunities and threats; • the analysis of strengths, weaknesses, opportuni-
ties and threats;• the formulation of the strategic alternatives.The present work submits a SWOT analysis of theproduction of technological steam in a plant thatprocesses cotton textile products.
EXPERIMENTAL PART
The increasing exigencies of the sustainable devel -op ment, on account of the reduction of pure waterresources, energy resources and not only, representone of the most important problems for the textileindustry firms nowadays.The SWOT analysis applied in the case of tech no -logical steam production in the discussed case, wasbuilt on a model that comprehends six strengths, sixweaknesses, six opportunities and six threats, andstarts from the existing heat carrier production circuit,
indispensable for the manufacturing activity (fig. 1). Itcontinues with a different circuit that improves thethermal potential of the waste waters in the plant(fig. 2).
The identification of weaknesses
The thermal balances performed on the existingcircuit of the heat carrier manufacturing presented inthe figure 1 showed that the technological steam isobtained on the base of high fuel consumption ofmethane gas, whose price is continuously increasing.In the same time, the process of production of tech -nological steam is based on the existence of someimportant emissions of gases with greenhouse effect,as CO2, CO, NOx and powders [4] – [6].
Also we can mention that the production of tech no -logical steam is supersized and it must be mod -ernized and re-dimensioned to the actual capacitiesof production. In these conditions, we could identify the weak -nesses and the strengths for the existing variant ofobtaining the technological steam (fig. 1). The weaknesses are: • over dimensioning of the plant; • high energy consumption;• the exploitation of thermal energy of residual
waters;• low yield of the plant;• high emissions with greenhouse effect and high
maintenance costs.
SWOT analysis of the efficiency in the production of technological steamfor the textile materials finishing
ANCA BUTNARIU GHEORGHE CONDURACHE
REZUMAT – ABSTRACT
Analiza SWOT a eficienţei producerii aburului tehnologic destinat finisării materialelor textile
În lucrare se analizează eficiența producerii aburului tehnologic într-o societate comercială care prelucrează articoletextile din bumbac și tip bumbac, utilizând o formă modernă de aplicare a metodei SWOT. S-a plecat de la un studiu decaz asupra acestei societăți comerciale și, folosind metoda SWOT modificată, s-a realizat un studiu comparativ întreeficiența circuitului actual de obținere a agentului termic și un circuit modernizat, în care este implementată o pompă decăldură, ce poate valorifica energia termică a apelor reziduale. Metoda SWOT aplicată în acest caz a demonstrat claravantajele economice și ecologice ale tehnologiei de producere a agentului termic prin utilizarea pompei de căldură.
Cuvinte-cheie: analiză SWOT, eficienţă, materiale textile, finisare
SWOT analysis of the efficiency in the production of technological steam for the textile materials finishing
The paperwork analyses the efficiency of technological vapor production for a textile firm that processes cotton andcotton based products, using a modern way of applying the SWOT method. We have used a study case of a textile firm,in which using the modified SWOT method we have compared the efficiency of the existing circuit of obtaining the heatcarrier and a modernized circuit that contains a heat pump that can exploit the thermal energy of the residual waters.The SWOT analysis method that we have implemented clearly gave proof of economic and ecologic advantages of theheat carrier production technology when the heat pump is used.
Key-words: SWOT analysis, efficiency, textile materials, finishing
342industria textila 2013, vol. 64, nr. 6˘

According to this scheme, the industrial water usedfor the production of the steam is pre-heated in a heatchanger that uses the burnt gas, the temperaturerising to 30ºC. Next, the water is passed through asecond heat changer operated by steam, the tem -perature rising to 84.5ºC. The water is passed througha degasser, its temperature getting to 103ºC, andthen enters the steam generator.
The identification of strengths
The study using the SWOT analysis conducted to thenominalization of the following strengths, in the pre -sent system of production of technological steam inthe company that we have analyzed: • thermal and energetic efficiency;• recovery of the thermal energy of burnt gases;• recovery of the condensed water;• safety in exploitation;• invulnerability to weather and flexibility.The data collected in the introductory analysis thatencompasses the weaknesses and the strengths ofthe system conducted to the conclusion that a tech -nological change of the circuit of steam production isimposed. We proposed an ecological technology withlow fuel consumption and consequently with lowimpact on the environment. The compliance with this condition could be attainedby the acquisition of efficiently energetic equipments,and the present work proposes the utilization of“green” technologies with low effects on the envi -ronment, that responds to the increasing demand ofconsumers for ecological products.The technological variant proposed by the presentwork starts from the idea of capitalization of the ther -mal energy of residual waters in the phase of pre-heat ing of industrial water used in the process oftech nological steam production, according to thescheme in the figure 2 [7]. The following weaknesses were identified for thisvariant of steam production:• over dimension of the plant; • high energy consumption;• vulnerability;
• high maintenance costs;• low exploitation safety and low flexibility.In this modified circuit, a heat pump is inserted on thetrack of the heat carrier, which rises the temperatureof the water that charges the steam generator until60ºC. After the pump, the circuit is identical with thefirst variant, but the temperatures are higher. In thiscase, the thermal balances showed a considerablereduction of the demand of steam necessary for thepre-heating and consequently a reduction of fueldemand. That allows a reduction of the gas fumesexpelled in the atmosphere [6], [7].
Opportunities for the circuit of steam production
The opportunities identified for the circuit of steamproduction in the analyzed company are thefollowing: • attraction of investment funds for the energetic effi -
cien cy, an increasing demand of ecological products;• the development of the business;• increased market competitiveness by the reduc-
tion of costs;• the promotion of clean technologies and increased
business profitability. We point out that the opportunities and the threatsare the same for the both variants. In order to trans -form the advanced theoretical model of analysis in aspecific analysis model we must perform a compar -ison between the two circuits of technological steamproduction, respectively the present circuit and theproposed one, that has implemented a heat pump,circuit that exist in the same firm that processescotton products.
RESULTS AND DISCUSSIONS
Based on the answers of some special question -naires and on the discussions with a group of expertsand specialists we have performed a ranking of thefactors found by the SWOT analysis, by assigningweights to every factor, the sum of those for every
343industria textila 2013, vol. 64, nr. 6˘
Fig. 1. Existing heat carrier production circuit
Fig. 2. Optimized heat carrier production circuit

indicator (strengths, weaknesses, opportunities,threats) being 1. In the tables 1 – 4 we have displayed the data obtainedafter the ranking of weaknesses and strengths, forboth variants and the comparative anal ysis of oppor -tunities and threats. In these tables Ki is the coeffi -cient of relative importance that values between 0and 1, and the sum of these coefficients for compar -ative analysis must equal 1. The graph representation of the comparative analysisis presented in figure 3.In order to analyze the level of hierarchy we haveused the Likert scale, with notation with five values.Therefore Ni is the grade conferred by the specialistsfor every factor and has values included between 0and 5. The value 0 signifies the fact that the respec -tive indicator is not characteristic to that analysis, the
344industria textila 2013, vol. 64, nr. 6˘
THE COMPARATIVE ANALYSIS OF STRENGHTS
Strengths Initialcircuit
Proposedcircuit
Ki Ni ni Ki Ni niThermal energeticefficiency 0.15 2 0.3 0.15 4 0.6
Recovery of thermalenergy of burnt gases 0.1 4 0.4 0.1 4 0.4
Safe operations 0.1 3 0.3 0.1 0 0
Low vulnerability 0.05 2 0.1 0.05 0 0
Flexibility 0.1 1 0.1 0.1 0 0Recovery of thecondenser water 0.1 4 0.4 0.1 4 0.4
Low emissions ofgreenhouse effect gases 0.15 0 0 0.15 5 0.75
High efficiency plant 0.1 0 0 0.1 3 0.3
Recovery of thermalenergy of residual waters 0.15 0 0 0.15 5 0.75
Strengths – total 1 - 1.6 1 - 3.2
THE COMPARATIVE ANALYSIS OF WEAKNESSES
Weaknesses Initialcircuit
Proposedcircuit
Ki Ni ni Ki Ni niOver dimension of theplant 0.1 4 0.4 0.1 2 0.2
High energy consumption 0.15 4 0.6 0.15 2 0.3
The exploitation ofthermal energy ofresidual waters
0.15 5 0.75 0.15 0 0
Low yield of the plant 0.1 4 0.4 0.1 0 0
High emissions withgreenhouse effect 0.15 3 0.45 0.15 0 0
High maintenance costs 0.1 2 0.2 0.1 4 0.4
Vulnerability 0.05 0 0 0.05 2 0.1
Low exploitation safety 0.1 0 0 0.1 1 0.1
Low flexibility 0.1 0 0 0.1 1 0.1
Weaknesses – total 1 - 2.8 1 - 1.2
Table 1 Table 2
Table 3 Table 4
THE COMPARATIVE ANALYSIS OF OPPORTUNITIES
Opportunities Initialcircuit
Proposedcircuit
Ki Ni ni Ki Ni niAttraction of investmentfunds for the energeticefficiency
0.15 2 0.3 0.15 4 0.6
Increasing demand ofecological products 0.15 2 0.3 0.15 4 0.6
Development of business 0.2 2 0.4 0.2 4 0.8Increased marketcompetitiveness by thereduction of costs
0.1 2 0.2 0.1 4 0.4
Promotion of cleantechnologies 0.1 2 0.2 0.1 4 0.4
Increased businessprofitability 0.25 2 0.5 0.25 4 1
Opportunities – total 1 - 1.9 1 - 3.8
THE COMPARATIVE ANALYSIS OF THREATS
Threats Initialcircuit
Proposedcircuit
Ki Ni ni Ki Ni niDegradation of energeticresources 0.1 4 0.4 0.1 2 0.2
Increasing exigencies ofthe sustainabledevelopment
0.15 5 0.75 0.15 2 0.3
Economic recession 0.25 3 0.75 0.25 3 0.75
Increasing prices ofenergy and fuels 0.15 4 0.6 0.15 2 0.3
Disadvantageouslegislation 0.2 4 0.8 0.2 2 0.4
Global warming process 0.15 4 0.6 0.15 3 0.45
Threats – total 1 - 3.9 1 - 2.4
Fig. 3. The graph representation of the comparativeanalysis
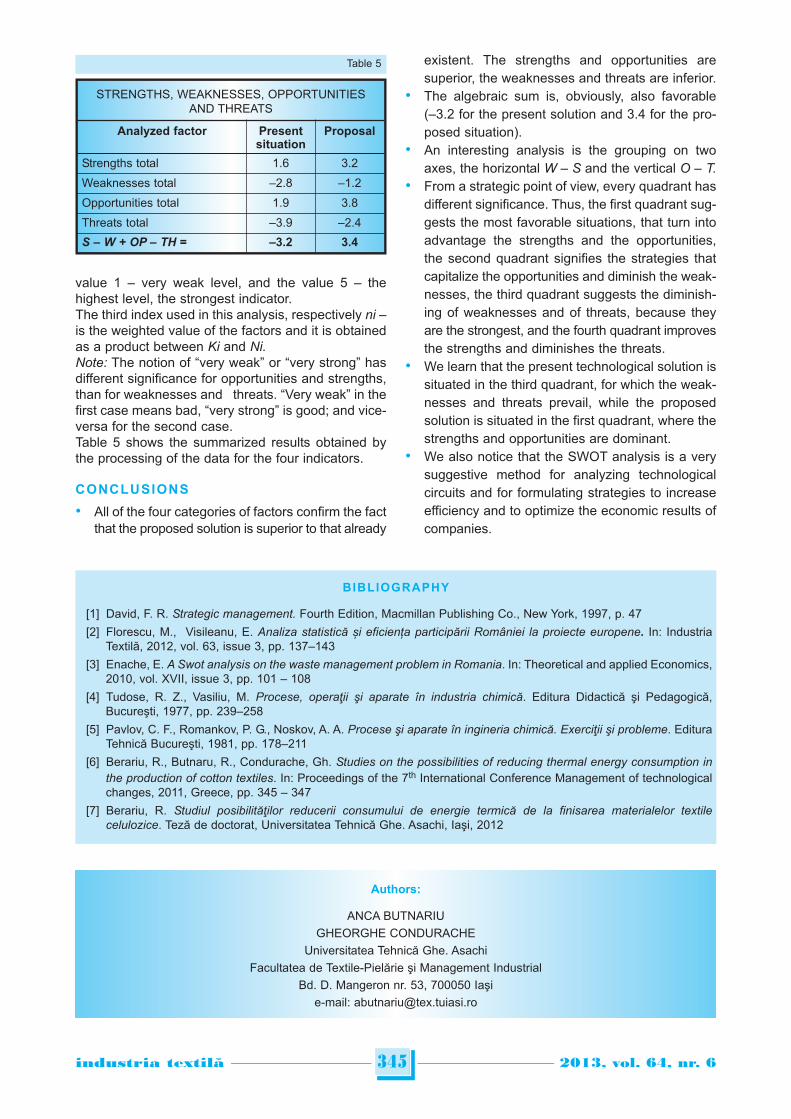
value 1 – very weak level, and the value 5 – thehighest level, the strongest indicator.The third index used in this analysis, respectively ni –is the weighted value of the factors and it is obtainedas a product between Ki and Ni.Note: The notion of “very weak” or “very strong” hasdifferent significance for opportunities and strengths,than for weaknesses and threats. “Very weak” in thefirst case means bad, “very strong” is good; and vice-versa for the second case.Table 5 shows the summarized results obtained bythe processing of the data for the four indicators.
CONCLUSIONS
• All of the four categories of factors confirm the factthat the proposed solution is superior to that already
existent. The strengths and opportunities aresupe rior, the weaknesses and threats are inferior.
• The algebraic sum is, obviously, also favorable(–3.2 for the present solution and 3.4 for the pro-posed situation).
• An interesting analysis is the grouping on twoaxes, the horizontal W – S and the vertical O – T.
• From a strategic point of view, every quadrant hasdifferent significance. Thus, the first quadrant sug-gests the most favorable situations, that turn intoadvantage the strengths and the opportunities,the second quadrant signifies the strategies thatcapitalize the opportunities and diminish the weak -nesses, the third quadrant suggests the diminish-ing of weaknesses and of threats, because theyare the strongest, and the fourth quadrant improvesthe strengths and diminishes the threats.
• We learn that the present technological solution issituated in the third quadrant, for which the weak-nesses and threats prevail, while the proposedsolution is situated in the first quadrant, where thestrengths and opportunities are dominant.
• We also notice that the SWOT analysis is a verysuggestive method for analyzing technologicalcircuits and for formulating strategies to increaseefficiency and to optimize the economic results ofcompanies.
345industria textila 2013, vol. 64, nr. 6˘
STRENGTHS, WEAKNESSES, OPPORTUNITIESAND THREATS
Analyzed factor Presentsituation
Proposal
Strengths total 1.6 3.2
Weaknesses total –2.8 –1.2
Opportunities total 1.9 3.8
Threats total –3.9 –2.4
S – W + OP – TH = –3.2 3.4
Table 5
BIBLIOGRAPHY
[1] David, F. R. Strategic management. Fourth Edition, Macmillan Publishing Co., New York, 1997, p. 47
[2] Florescu, M., Visileanu, E. Analiza statistică și eficiența participării României la proiecte europene. In: IndustriaTextilă, 2012, vol. 63, issue 3, pp. 137–143
[3] Enache, E. A Swot analysis on the waste management problem in Romania. In: Theoretical and applied Economics,2010, vol. XVII, issue 3, pp. 101 – 108
[4] Tudose, R. Z., Vasiliu, M. Procese, operaţii şi aparate în industria chimică. Editura Didactică şi Pedagogică,Bucureşti, 1977, pp. 239–258
[5] Pavlov, C. F., Romankov, P. G., Noskov, A. A. Procese şi aparate în ingineria chimică. Exerciţii şi probleme. EdituraTehnică Bucureşti, 1981, pp. 178–211
[6] Berariu, R., Butnaru, R., Condurache, Gh. Studies on the possibilities of reducing thermal energy consumption inthe production of cotton textiles. In: Proceedings of the 7th International Conference Management of technologicalchanges, 2011, Greece, pp. 345 – 347
[7] Berariu, R. Studiul posibilităţilor reducerii consumului de energie termică de la finisarea materialelor textilecelulozice. Teză de doctorat, Universitatea Tehnică Ghe. Asachi, Iaşi, 2012
Authors:
ANCA BUTNARIUGHEORGHE CONDURACHE
Universitatea Tehnică Ghe. AsachiFacultatea de Textile-Pielărie şi Management Industrial
Bd. D. Mangeron nr. 53, 700050 Iaşie-mail: [email protected]

The change, development and globalization of theworld have brought up new notions and devel -
opments in the textile sector. The number of featuresexpected from textile products has increased due tochanges in the buyers’ expectations and their aware -ness of quality and environment [1]. Enzyme treatments have become one of the mostcommon wet process techniques in the industry. Ingeneral, the enzyme technology has been applied toimprove handle, appearance and other surface char -ac teristic of cotton and cotton blends [1], [2]. Catalase is a common enzyme found in nearly allliving organisms that are exposed to oxygen. It func -tions to catalyze the decomposition of hydrogen per -oxide (H2O2) which is used in the scouring process in
textile finishing to the water and the oxygen. Theresidual hydrogen peroxide on the surface of thetextile material must be removed before dyeing. Themain aim of the usage of the catalase enzyme in thepretreatment is to remove these kinds of residuals[9]. The catalase has one of the highest turnovernumbers of all enzymes; one catalase enzyme canconvert 40 million molecules of hydrogen peroxide towater and oxygen each second. The catalase is atetramer of four polypeptide chains, each over 500amino acids long. It contains four porphyrin heme(iron-Fe) groups that allow the enzyme to react withthe hydrogen peroxide [3] – [7]. The cellulase enzymes used for the bio-polishing andthe stone washing processes can be accepted asone of the most common applications. The commer -cial cellulase may contain mixtures of different
cellulases, and the effects on the fabric propertiesdepend on this composition. There are several benefits resulting from the enzy -matic bio-polishing of the cellulosic woven and theknitted fabrics:• smoother surface;• more attractive appearance;• better pilling resistance;• gentle and soft feel;• improved drapability;• the use of environment-friendly technology [8] – [10].In this experimental study, we studied on the catalaseand cellulase enzymes and the determination of theoptimum combination conditions of cellulase, cata -lase enzyme treatments and reactive dyeing. In theliterature, some studies are available about combin -ing wet enzymatic processes or usage about cellu -lase or catalase enzymes in the different area suchas using the bleaching effluent again for dyeing [11].Different from these studies, we combined the pro -cesses after bleaching in one bath for different reac -tive dye. We did not applied catalase enzymes to thebleaching effluent and performed dyeing in this solu -tion. In combined processes, we carried on catalaseapplication with dyeing and cellulase applicationtogether. In this study, we established six differentprocesses, and applied eight experiments for eachpro cess. As a result, we obtained 48 dyed speci -mens. After the experiments, we measured CIELabvalues of all specimens and calculated color differ -ences. In addition, we applied some color fastnesstests to the specimens.
The combination of catalaseand cellulase enzyme treatments with reactive dyeing process
ĞASSAN ASKER ONUR BALCI
REZUMAT – ABSTRACT
Folosirea unor tratamente cu enzime de tipul catalazei şi celulazei în procesul de vopsire cu coloranţi reactivi
Scopul acestui studiu îl constituie studierea avantajelelor combinării enzimelor de tip catalază şi celulază în procesul devopsire cu coloranţi reactivi. În acest scop, au fost efectuate şase experimente diferite, pentru care s-au utilizat patrutipuri de coloranţi reactivi. Rezultatele au arătat că nu există diferenţe importante între procesele bazate pe combinareade enzime şi procesul de referinţă, în ceea ce priveşte valorile CIELab şi performanţele rezistenţei vopsirii.
Cuvinte-cheie: catalază, celulază, CIELaB, bumbac, rezistenţa vopsirii, colorant reactiv
The combination of catalase and cellulase enzyme treatments with reactive dyeing process
The basic of the study consists of investigating the usage facilities of combining the catalase and cellulase enzymes withreactive dyeing process. For this aim, six different experiment sets were established. The experiments carried out usingfour different reactive dyes. As results, we found out that there were not any important differences between combinedprocesses and reference one in terms of CIELab values and fastness performances.
Key-words: catalase, cellulase, CIELab, cotton, fastness, reactive dye
346industria textila 2013, vol. 64, nr. 6˘

MATERIALS AND METHODS
In the study, the single-jersey raw fabrics were knittedon a 30' E 28 fein circular knitting machine in theİSKUR Textile (Kahramanmaraş) and all wet pro cess -es were carried on the BİLKUR Textile. The density ofthe raw fabric is 24 courses/cm and 38 wale/cm. Themass per unit area of the fabric is 121 g/m2. The specimen was scoured in the bulk productionwith discontinue method. The scouring process wasapplied with wetting agent (0.8 g/L), sequesteringagent (1 g/L), 48 Be° caustic soda (2 g/L), H2O2(2 g/L) according to the graphic shown in figure 1.The catalase enzyme application was not applied tothe fabric in the bulk production. The knitted fabric was taken from the machine afterscouring. The scouring process was carried on theconventional jet dyeing machine with 1/8 liquor ratio.Four types of reactive dyes used in the study areshowed in table 1 and figure 2 as Reactive Yellow176, Reactive Red 239, Reactive Blue 221 andReactive Black 5 which are supplied from DengeKimya (Turkey). The dyebath was prepared with 4%owf (shade) with Na2SO4 (70 g/l) and soda (20 g/l),applications were made in the laboratory dyeingmachine at 1/8 liquor ratio (M/L). The catalase andcellulase enzyme treatments were carried out in thelaboratory dyeing machine, manufactured by theATAÇ Company (Turkey) which ensured continuousrotation. The whole catalase enzyme treatmentswere applied with 0.2% owf. The cellulase enzymatic
bath was prepared with 1% and 1.6% acid cellulaseenzyme supported from Rudolf & Duraner (Turkey)at 1/8 liquor ratio. The graphic of the enzymatic
347industria textila 2013, vol. 64, nr. 6˘
Fig. 1. The graphic of the scouring process
Fig. 2. The chemical structure of reactive dyes used in the study
Reactive Black 5 Reactive Blue 221
Reactive Red 239 Reactive Yellow 176
EXPERIMENTAL DESIGN (48 EXPERIMENTS)
Process,P
Specimencode
Reactivedyes
Theanchor
group ofdye
Cellulaseconcen -tration,
%
No enzyme - - - 0.0
P1 – refer -
enceP2
P3
P4
P5
P6
N1 ReactiveBlack 5
VS1.0
N2 1.6
N3 ReactiveBlue 221
VS1.0
N4 1.6
N5 ReactiveRed 239
MCT1.0
N6 1.6
N7 ReactiveYellow 176
VS1.0
N8 1.6
Table 1
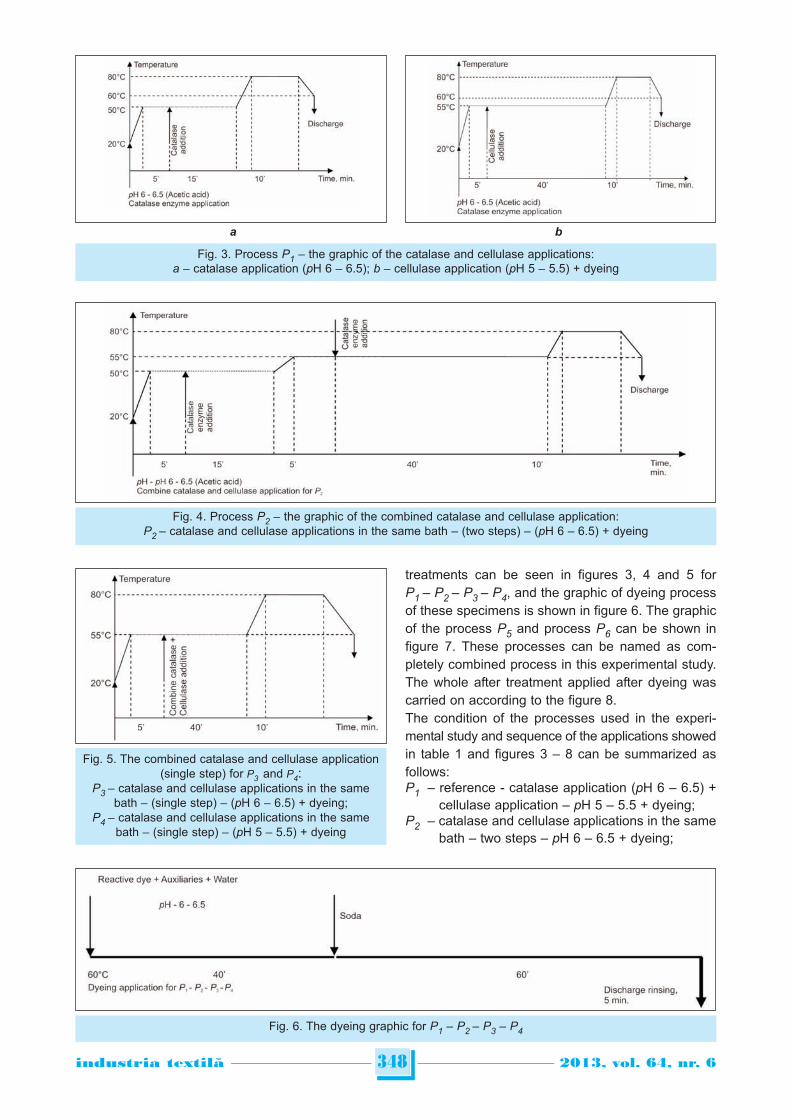
treatments can be seen in figures 3, 4 and 5 forP1 – P2 – P3 – P4, and the graphic of dyeing processof these specimens is shown in figure 6. The graphicof the process P5 and process P6 can be shown infigure 7. These processes can be named as com -pletely combined process in this experimental study.The whole after treatment applied after dyeing wascarried on according to the figure 8.The condition of the processes used in the exper i -mental study and sequence of the applications showedin table 1 and figures 3 – 8 can be summarized asfollows: P1 – reference - catalase application (pH 6 – 6.5) +
cellulase application – pH 5 – 5.5 + dyeing;P2 – catalase and cellulase applications in the same
bath – two steps – pH 6 – 6.5 + dyeing;
348industria textila 2013, vol. 64, nr. 6˘
Fig. 3. Process P1 – the graphic of the catalase and cellulase applications:a – catalase application (pH 6 – 6.5); b – cellulase application (pH 5 – 5.5) + dyeing
Fig. 5. The combined catalase and cellulase application(single step) for P3 and P4:
P3 – catalase and cellulase applications in the samebath – (single step) – (pH 6 – 6.5) + dyeing;
P4 – catalase and cellulase applications in the samebath – (single step) – (pH 5 – 5.5) + dyeing
Fig. 6. The dyeing graphic for P1 – P2 – P3 – P4
Fig. 4. Process P2 – the graphic of the combined catalase and cellulase application:P2 – catalase and cellulase applications in the same bath – (two steps) – (pH 6 – 6.5) + dyeing
a b

P3 – catalase and cellulase applications in the samebath – single step – pH 6 – 6.5 + dyeing;
P4 – catalase and cellulase applications in the samebath – single step – pH 5 – 5.5 + dyeing;
P5 – catalase and cellulase and dyeing applicationsin the same bath – single step – pH 6 – 6.5;
P6 – catalase and cellulase and dyeing applicationsin the same bath – single step – pH 5 – 5.5.
As it is known, catalase and acid cellulase enzymeshaving natural protein structures are produced bysome organism such as fungal, plants, and catalyzesome chemical reactions. These enzymes must bedeactivated after the completion of the process intoharmless form, and removed from the bath. Theenzyme activity can be affected by several molecules.Inhibitors are molecules that decrease enzyme activ -ity; activators are molecules that increase activity.Activity is also affected by temperature, chemicalenvironment (e.g., pH), and the amount of the sub -strate (for example cotton fibre). Either the increasingof the process temperature above 80°C or fixing thepH above 10 are the best ways in order to deactivatethe cellulase and catalase enzymes. In this context,in the study, the deactivation was performed byincreasing the temperature above 80°C for P1 – P2 –P3 – P4 processes shown in the graphics. From thisview, these approaches can bring extra operation forthese processes, and increase the working time andenergy consumption. However, in the P5 and P6,there were not any deactivation processes, becausedeactivation of the catalase and cellulase enzymes
could be achieved by increasing the pH of the bathabove 10 (approximately 10.5) adding soda after 40minutes duration.The whole experimental study was replicated twice.After the experiments, the performances of the spec -imens were tested with measurement of the colorfastness and CIELab values. In addition, we per -formed pilling and abrasion resistance tests in orderto determine the physical properties of samples.
CIELab measurement. The colorimetric measure -ments were carried out using a DataColor SF 600Plus spectrophotometer interfaced to a PC. Measure -ments were taken with the specular component of thelight included (SCI) and the UV component excluded,using illuminant D65 and 10° standard observer. Thesamples were folded to ensure opacity and an aver -age of three readings was calculated. We recordedL*, a*, b*, C, h° values of all samples. In addition, CIE“∆” values between the samples obtained from P1(reference samples) and samples processed with P2– P6 were calculated according to CIELab formulation(CMC 2:1) by software.
Pilling. The pilling resistance of the fabrics wasdeter mined using a Martindale pilling and abrasiontester, according to EN ISO 12945-2. We finished thetest at 2 000 revolutions for two samples [12].
Abrasion. The abrasion character of the sampleswas measured using Martindale pilling and abrasiontester, according to EN ISO 12947-2 (the breakdownof the specimen) [13]. With the help of this analysis,we tried to determine the abrasion resistance perfor -mance of the surface of the knitted samples towardsexternal mechanical effects.
Color fastness. In the study, the several fastnessperformances as color fastness to the washing, colorfastness to water, color fastness to perspiration, colorfastness to rubbing (wet) were measured accordingto TS EN ISO 105-CO6 [14], TS EN ISO 105-E01[15], TS EN ISO 105-E04 [16], TS EN ISO 105-X16[17], respectively. We recorded only staining result ofthe samples as fastness results. As a result, in thisexperimental study, we aimed to obtain new pro -cesses having minimum cost accessing the targetcolor and fastness values without causing any changeon the pilling and abrasion resistance performance.
349industria textila 2013, vol. 64, nr. 6˘
Fig. 7. The graphic of combined process for P5 and P6:P5 – catalase and cellulase and dyeing applications in the same bath – (single step) – (pH 6 – 6.5);P6 – catalase and cellulase and dyeing applications in the same bath – (single step) – (pH 5 – 5.5)
Fig. 8. The graphic of after treatment processesfor all applications

350industria textila 2013, vol. 64, nr. 6˘
CIELab AND COLOR DIFFERENCES VALUES OF THE SPECIMENS
Parameters CIELab values Color differences CMC (2:1)
Process Sample L* a* b* C* h° ΔL* ΔC* ΔH* ΔE
P1 –
referencesamples
N1 17.96 –2.24 –11.87 12.08 259.28 Ref. Other samplesP1 N1 [P2 N1 – P3 N1 – P4 N1 – P5 N1 – P6 N1]P1 N2 [P2 N2 – P3 N2 – P4 N2 – P5 N2 – P6 N2]P1 N3 [P2 N3 – P3 N3 – P4 N3 – P5 N3 – P6 N3]P1 N4 [P2 N4 – P3 N4 – P4 N4 – P5 N4 – P6 N4]P1 N5 [P2 N5 – P3 N5 – P4 N5 – P5 N5 – P6 N5]P1 N6 [P2 N6 – P3 N6 – P4 N6 – P5 N6 – P6 N6]P1 N7 [P2 N7 – P3 N7 – P4 N7 – P5 N7 – P6 N7]P1 N8 [P2 N8 – P3 N8 – P4 N8 – P5 N8 – P6 N8]
N2 18.51 –2.31 –12.13 12.35 259.18N3 29.24 1.57 –29.74 29.78 273.02N4 28.74 1.55 –29.32 29.41 273.03N5 38.05 58.30 4.21 58.45 4.14N6 37.8 57.98 4.126 58.13 4.07N7 66.14 37.11 76.64 85.15 64.16N8 66.39 36.80 76.61 84.99 64.34
P2
N1 18.60 12.13 –11.93 12.13 259.54 0.576 0.038 0.064 0.581N2 18.07 –2.06 –11.63 11.81 259.92 –0.385 –0.407 0.183 0.589N3 28.88 1.70 –29.82 29.87 273.26 –0.227 0.042 0.104 0.253N4 29.11 1.57 –29.85 29.90 273.01 0.240 0.245 –0.011 0.343N5 37.40 58.28 4.94 58.49 4.85 –0.346 0.015 0.396 0.526N6 37.58 58.43 4.94 58.63 4.83 –0.116 0.185 0.421 0.474N7 66.22 37.21 76.69 85.25 64.11 0.033 0.029 –0.053 0.069N8 66.32 36.76 76.49 84.86 64.32 –0.028 –0.040 –0.018 0.052
P3
N1 18.22 –2.30 –11.65 11.88 258.83 0.237 –0.157 –0.111 0.305N2 18.64 –2.32 –11.69 11.92 258.74 0.115 –0.324 –0.109 0.361N3 29.09 1.49 –29.68 29.72 272.89 –0.097 –0.034 –0.061 0.12N4 29.55 1.24 –29.54 29.56 272.41 0.521 0.079 –0.271 0.592N5 38.14 58.98 4.84 59.18 4.69 0.049 0.266 0.308 0.410N6 38.25 59.23 4.85 59.43 4.68 0.244 0.475 0.342 0.634N7 66.74 36.40 76.26 84.51 64.48 0.239 –0.202 0.350 0.469N8 66.67 36.42 76.42 84.66 64.51 0.111 –0.105 0.186 0.241
P4
N1 18.48 –2.12 –11.78 11.97 259.82 0.463 –0.086 0.133 0.489N2 18.07 –2.11 –11.79 11.97 259.85 –0.386 –0.282 0.166 0.506N3 28.98 1.67 –29.79 29.83 273.22 –0.222 0.025 0.085 0.239N4 28.98 1.64 –29.77 29.82 273.16 0.156 0.205 0.056 0.264N5 37.62 57.94 4.44 58.11 4.38 –0.228 –0.123 0.134 0.292N6 37.63 57.78 4.27 57.94 4.23 –0.089 –0.069 0.089 0.144N7 66.28 36.74 77.09 85.39 64.51 0.058 0.075 0.388 0.400N8 66.03 37.07 76.52 85.02 64.14 –0.145 0.010 –0.211 0.257
P5
N1 17.17 –1.69 –11.35 11.47 261.51 –0.706 –0.469 0.538 1.004N2 17.6 –1.762 –11.36 11.50 261.18 –0.793 –0.643 0.486 1.131N3 27.87 1.86 –29.30 29.36 273.62 –0.867 –0.214 0.259 0.930N4 28.75 1.54 –29.40 29.44 273.00 0.004 0.017 –0.014 0.023N5 36.59 58.02 6.13 58.34 6.03 –0.781 –0.040 1.046 1.306N6 36.62 57.68 6.16 58.18 6.08 –0.634 0.018 1.110 1.278N7 65.29 37.83 77.15 85.93 63.87 –0.340 0.242 –0.315 0.523N8 65.49 38.19 77.42 86.33 63.74 –0.360 0.418 –0.657 0.858
P6
N1 17.94 –1.93 –11.55 11.71 260.50 –0.018 –0.289 0.296 0.414N2 17.99 –1.92 –11.66 11.82 260.62 –0.448 –0.401 0.354 0.698N3 29.77 1.22 –29.89 29.92 272.34 0.303 0.066 –0.301 0.433N4 30.17 1.19 –29.90 29.93 272.28 0.914 0.261 –0.333 1.008N5 37.61 58.53 5.28 58.77 5.15 –0.237 0.118 0.566 0.625N6 37.55 58.24 5.05 58.46 4.96 –0.130 0.123 0.493 0.524N7 65.67 37.54 76.88 85.55 63.97 –0.188 0.125 –0.209 0.308N8 66.21 36.96 76.28 84.77 64.15 –0.071 –0.071 –0.211 0.233
Table 2
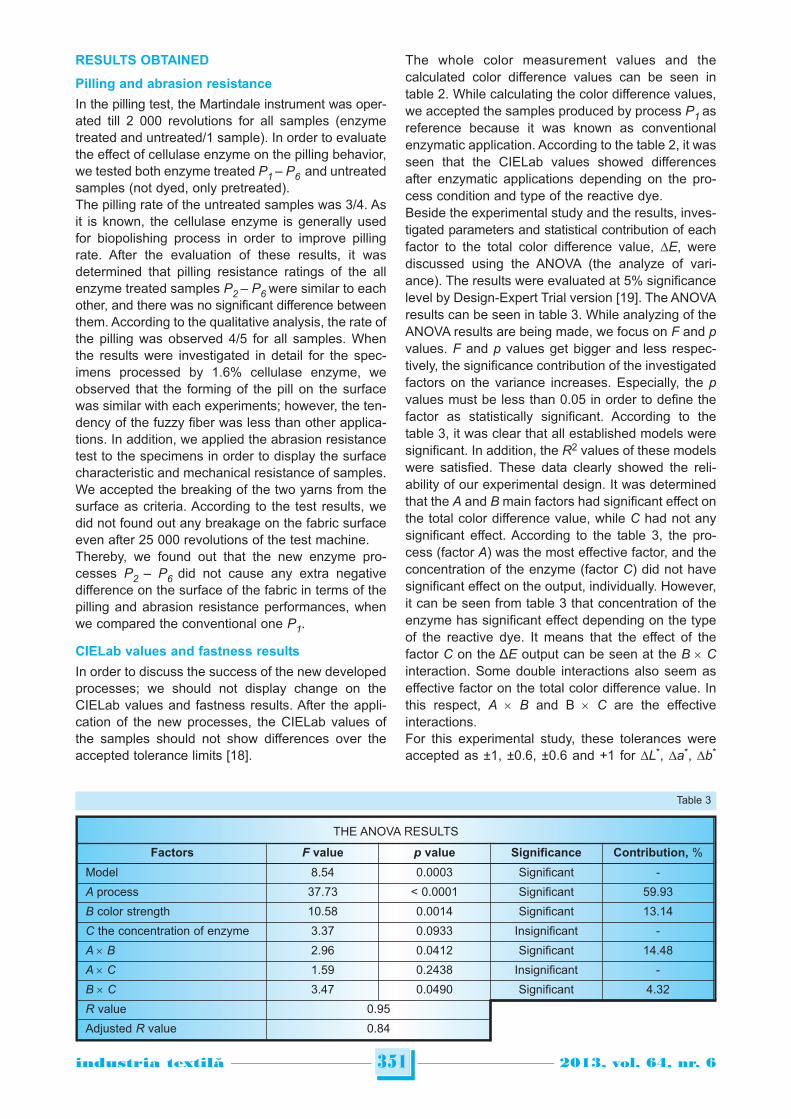
RESULTS OBTAINED
Pilling and abrasion resistance
In the pilling test, the Martindale instrument was oper -ated till 2 000 revolutions for all samples (enzymetreated and untreated/1 sample). In order to evaluatethe effect of cellulase enzyme on the pilling behavior,we tested both enzyme treated P1 – P6 and untreatedsamples (not dyed, only pretreated). The pilling rate of the untreated samples was 3/4. Asit is known, the cellulase enzyme is generally usedfor biopolishing process in order to improve pillingrate. After the evaluation of these results, it wasdetermined that pilling resistance ratings of the allenzyme treated samples P2 – P6 were similar to eachother, and there was no significant difference betweenthem. According to the qualitative analysis, the rate ofthe pilling was observed 4/5 for all samples. Whenthe results were investigated in detail for the spec -imens processed by 1.6% cellulase enzyme, weobserved that the forming of the pill on the surfacewas similar with each experiments; however, the ten -dency of the fuzzy fiber was less than other applica -tions. In addition, we applied the abrasion resistancetest to the specimens in order to display the surfacecharacteristic and mechanical resistance of samples.We accepted the breaking of the two yarns from thesurface as criteria. According to the test results, wedid not found out any breakage on the fabric surfaceeven after 25 000 revolutions of the test machine.Thereby, we found out that the new enzyme pro -cesses P2 – P6 did not cause any extra negativedifference on the surface of the fabric in terms of thepilling and abrasion resistance performances, whenwe compared the conventional one P1.
CIELab values and fastness results
In order to discuss the success of the new developedprocesses; we should not display change on theCIELab values and fastness results. After the appli -cation of the new processes, the CIELab values ofthe samples should not show differences over theaccepted tolerance limits [18].
The whole color measurement values and thecalculated color difference values can be seen intable 2. While calculating the color difference values,we accepted the samples produced by process P1 asreference because it was known as conventionalenzymatic application. According to the table 2, it wasseen that the CIELab values showed differencesafter enzymatic applications depending on the pro -cess condition and type of the reactive dye. Beside the experimental study and the results, inves -tigated parameters and statistical contribution of eachfactor to the total color difference value, ∆E, werediscussed using the ANOVA (the analyze of vari -ance). The results were evaluated at 5% significancelevel by Design-Expert Trial version [19]. The ANOVAresults can be seen in table 3. While analyzing of theANOVA results are being made, we focus on F and pvalues. F and p values get bigger and less respec -tively, the significance contribution of the investigatedfactors on the variance increases. Especially, the pvalues must be less than 0.05 in order to define thefactor as statistically significant. According to thetable 3, it was clear that all established models weresignificant. In addition, the R2 values of these modelswere satisfied. These data clearly showed the reli -ability of our experimental design. It was determinedthat the A and B main factors had significant effect onthe total color difference value, while C had not anysignificant effect. According to the table 3, the pro -cess (factor A) was the most effective factor, and theconcentration of the enzyme (factor C) did not havesignificant effect on the output, individually. However,it can be seen from table 3 that concentration of theenzyme has significant effect depending on the typeof the reactive dye. It means that the effect of thefactor C on the ΔE output can be seen at the B × Cinteraction. Some double interactions also seem aseffective factor on the total color difference value. Inthis respect, A × B and B × C are the effectiveinteractions. For this experimental study, these tolerances wereaccepted as ±1, ±0.6, ±0.6 and +1 for ∆L*, ∆a*, ∆b*
351industria textila 2013, vol. 64, nr. 6˘
Table 3
THE ANOVA RESULTS
Factors F value p value Significance Contribution, %
Model 8.54 0.0003 Significant -
A process 37.73 < 0.0001 Significant 59.93
B color strength 10.58 0.0014 Significant 13.14
C the concentration of enzyme 3.37 0.0933 Insignificant -
A × B 2.96 0.0412 Significant 14.48
A × C 1.59 0.2438 Insignificant -
B × C 3.47 0.0490 Significant 4.32
R value 0.95
Adjusted R value 0.84

352industria textila 2013, vol. 64, nr. 6˘
THE FASTNESS RESULTS OF THE SAMPLES
Process Sample
Washing Perspiration WaterRub-bing,wet
Secon-dary
acetateCotton
Poly-ester
Secondaryacetate
Cotton Polyester Secon-dary
acetateCotton
Poly-esterAc Al Ac Al Ac Al
P1 –
reference
N1 4/5 4/5 4/5 4/5 4/5 4 4 4 4 4/5 4/5 4/5 3N2 4/5 4/5 4/5 4/5 4/5 4 3/4 4 4 4/5 4/5 4/5 2/3N3 4/5 3/4 4/5 4/5 4 3 1/2 3/4 3/4 4/5 4 4/5 4N4 4/5 3/4 4/5 4/5 4 2 2 3 3/4 4/5 4 4/5 3/4N5 5 4 4/5 5 5 2 2/3 3 3/4 4/5 3/4 4 3N6 4/5 4 5 5 5 2 2 3 3 4/5 3/4 4 4N7 4/5 4/5 5 5 5 5 5 5 5 4/5 4/5 4/5 4N8 4/5 4/5 4/5 5 5 5 5 5 5 4/5 4/5 4/5 4
P2
N1 4/5 4/5 4/5 5 5 4 4 4 4/5 4/5 4 4/5 2/3N2 4/5 4/5 4/5 5 5 4 4 4 4/5 4/5 4 4/5 2/3N3 4/5 3/4 4/5 4/5 5 3 2/3 4 4 4/5 4 4/5 3/4N4 4/5 3/4 4/5 4/5 5 3/4 2/3 4 4 4/5 4 4/5 3/4N5 4/5 4 4/5 5 5 3 3 4 3/4 4/5 3 4 3/4N6 4/5 4 4/5 5 5 2/3 3 4 4 4/5 3 4 3/4N7 4/5 4/5 5 5 5 4/5 5 5 5 4/5 4/5 4/5 4/5N8 4/5 4/5 5 5 5 5 5 5 5 4/5 4/5 4/5 4
P3
N1 4/5 4/5 4/5 5 5 4 3/4 5 4/5 4/5 4/5 4/5 2/3N2 4/5 4/5 4/5 5 5 4 4 5 4/5 4/5 4/5 4/5 3N3 4/5 3/4 4/5 5 5 2/3 1/2 4 4 4/5 4 4/5 3/4N4 4/5 3/4 4/5 5 5 2/3 2/3 4 4 4/5 4 4/5 3/4N5 4/5 4 4/5 5 5 2/3 2/3 4 3/4 4 3 3/4 3N6 4/5 4 4/5 5 5 2/3 3 4 4 4 3 4 3N7 4/5 4/5 5 5 5 5 5 5 5 4/5 4/5 5 4N8 4/5 4/5 5 5 5 5 5 5 5 4/5 4/5 5 4
P4
N1 4/5 4/5 5 5 5 4 4/5 4 4/5 4/5 4/5 4/5 2N2 4/5 4/5 5 5 5 4 4/5 4 4/5 4/5 4/5 5 2/3N3 5 3/4 4/5 5 5 1/2 1 3/4 3/4 4/5 4 4/5 3/4N4 4/5 3/4 5 5 5 2 2 3/4 4 4/5 4 4/5 3N5 4/5 4 4/5 5 5 3 3/4 3/4 4 4/5 3/4 4 2/3N6 4/5 4 4/5 5 5 3 4 3/4 4/5 4/5 3/4 4 3N7 4/5 5 5 5 5 5 5 5 5 4/5 4/5 5 3/4N8 4/5 5 5 5 5 5 5 5 5 5 4/5 5 3/4
P5
N1 4/5 4/5 4/5 5 5 3/4 3/4 3/4 4/5 4/5 4/5 5 2/3N2 4/5 4 4 5 5 3/4 3/4 3/4 4/5 4/5 4/5 5 3N3 4/5 3 4/5 5 5 1 1 3 4 4/5 4 4/5 4N4 4/5 3 5 5 5 1/2 1 3 4 4/5 4 4/5 3/4N5 4/5 4 4/5 4 5 2/3 3 3 3/4 4 3 4 2/3N6 4/5 4/5 4/5 5 5 2/3 3 3/4 3/4 4 3 4 2/3N7 4/5 4/5 5 5 5 5 5 5 5 5 4/5 5 4N8 4/5 4/5 5 5 5 5 5 5 5 4/5 4/5 5 4
P6
N1 4/5 4/5 5 4/5 5 4/5 4 4/5 4/5 4/5 4/5 4/5 3N2 4/5 4/5 4/5 5 5 4 5 4/5 5 4/5 4 4/5 2/3N3 4/5 3/4 5 5 5 2/3 2/3 4/5 4/5 4/5 4 4/5 3N4 4/5 4 5 5 5 2/3 2 4/5 4/5 4/5 4 4/5 3/4N5 4/5 4 4/5 5 5 3 3 4 4/5 4/5 3 4 3N6 4/5 4 4/5 5 5 3 3 4 4/5 4 3 4 2/3N7 4/5 4/5 5 5 5 5 5 5 5 5 4 4/5 4N8 4/5 4/5 5 5 5 5 5 5 5 5 4 4/5 4
Table 4

and ∆E, respectively. According to the table 2, it wasfound out that while ΔL*, ΔC* and ΔH* values wereamong the accepted tolerance limits, ΔE values ofthe samples produced with process P5 was abovethe limit value. It was also seen that the samplesobtained with process P4 had the closest CIELabvalues to the reference process P1. It was thoughtthat the similarity of the pH condition (pH 5 – 5.5) ofthe process P4 and reference process P1 could beshowed the reason of this result. In terms of theproduction cost, the process P5 and the process P6were seen the most advantageous ones. When weanalyzed process P5 and process P6, P5 hadnegative effect on the CIELab values; however wedid not determine similar results for P6 because thepH value (pH 5 – 5.5) of this process was the mostsuitable for the acid cellulase enzyme activity.Therefore, it could be said that P6 was the optimumprocess in terms of CIELab values. In addition, whenthe results were analyzed, different color sensibilitywas determined for the reactive dyes used in thestudy depending on the interaction between pH valuesof the process and reactive groups of the dyes. The fastness results of the whole samples are givenin table 4. In this table, we analyzed the stain valueson the secondary acetate, cotton and polyester piecesof the multifiber. According to the table 4, the fastnessperformance of the samples showed differ encesaccording to the reactive dye used in the experimen -tal study and new developed enzymatic processes. When the results of the color fastness to the washingwere investigated, the concentration of the enzymewas not seemed as an important factor. When theresults of the fastness tests for samples obtainedfrom P1 were compared with P2 – P6 we could notfind out any crucial difference. We determined similarresults for the performance of the color fastness tothe washing. We did not recognize important changesafter the application of the new enzymatic process forcolor fastness to the both washing and water.We determined some changes for the performance ofthe color fastness to the rubbing. According to thetable 4, the performances of the rubbing fastnessgenerally displayed decrease depending on the typeof the reactive dye, the enzymatic processes and theconcentration of the cellulase enzyme used in theprocesses. The most decrease was measured for thesamples obtained by P4. The least change on thefastness values was determined for the samples pro -cessed by P2 in which process conditions wereapprox imately same with P1 in terms of the pH andthe temperature. This state showed us the effect of
the process pH. While the fastness performance ofthe processes applied on pH 6.5 – 7 did not showcrucial changes, on the contrary, the new establishedenzymatic processes having pH 5 – 5.5 causedbigger decrease according to the others. In addition, we found out effect of the type of thereactive dye on the rubbing fastness result. ReactiveBlack 5, Reactive Blue 221, Reactive Yellow 176 andReactive Red 239 have VS and MCT reactive group,respectively. In the study, we generally determinedthe worst rubbing fastness results for the samples N5and N6 dyed using Reactive Red 239 in whichreactive group was MCT as different from the otherreactive dyes. According to this result, it was possibleto mention about the sensitivity of the Reactive Red239 to the new developed enzymatic processes. When the results of the color fastness to the per -spiration were investigated, first of all, we got satis -factory fastness results for the stain performance onthe secondary acetate. In addition, we found out thedecrease on the fastness performances for thesamples applied by P4 and P5 processes.
DISCUSSIONS
In the study, we tried to bring new approach to thecellulase enzymatic treatments of the cellulose basedknitted fabric. We established novel wet processeswhich could decrease the cost of the enzymatictreatment without causing any negative change onthe fabric performance. When the results were investigated from this point ofview, the pilling performances and abrasion resis -tances of the fabrics did not reduce depending on theenzymatic processes and their working conditions.According to these results, we decided to attendexperimental study and measured the CIELab valuesand fastness performances of the all samples. TheCIELab values of the new samples did not showcrucial differences out of the accepted toleranceswhen they were compared with the reference ones(P1 samples) except the samples obtained by P5 pro -cess. In addition, it was found out that the fastnessperformances displayed similar tendency with thecolor measurement results. Therefore, as a conclusion, when we realized wholeresults, it was clear that P6 significantly had optimumprocess conditions in terms of the cost and the qual -ity performances, because all wet processes after thepretreatment as cellulase-catalyze enzymatic appli -ca tions and reactive dyeing could be combined insingle application and bath.
353industria textila 2013, vol. 64, nr. 6˘
BIBLIOGRAPHY
[1] Özdil, N., Özdoğan, E., Öktem, T. Effects of enzymatic treament on various spun yarn fabrics. In: Fibres & Textilesin Eastern Europe, 2003, vol. 43, issue 11–4, pp. 58–61
[2] Yang, C. Q., Zhou, W., Lickfield, G. C., Parachura, K. Cellulase treatment of durable press finished cotton fabric:effects on fabric strength, abrasion resistance and handle. In: Textile Research Journal, 2003, vol. 73, issue 12,pp. 1 057–1 062

354industria textila 2013, vol. 64, nr. 6˘
Authors:
ĞASSAN ASKERONUR BALCI
The Department of Textile EngineeringThe University of Kahramanmaraş Sütçü İmam
Avşar Campus46100 Kahramanmaraş – Turkey
Corresponding author:
ONUR BALCIe-mail: [email protected]; [email protected]
[3] Chelikani, P., Fita, I., Loewen, P. C. Diversity of structures and properties among catalases. In: Cellular andMolecular Life Sciences, 2004, vol. 61, issue 2, pp. 192–208
[4] Maehly, A., Chance, B. The assay of catalases and peroxidases. In: Methods of Biochemical Analysis, 1954,issue 1, pp. 357–424
[5] Verenich, S., Arumugam, K., Shim, E., Pourdeyhimi, B. Treatment of raw cotton fibers with cellulase for nonwovenfabrics. In: Textile Research Journal, 2008, vol. 78, issue 6, pp. 540–548
[6] Balci, O., Gençer, U. Cellulase enzyme application for the cotton based woven fabrics. Part I. Determination ofeffect of enzyme on the performance. In: Industria Textilă, 2013, vol. 64, issue 1, pp. 20–26
[7] Balci, O., Gençer, U. Cellulase enzyme application for the cotton based woven fabrics. Part II. The determining ofnecessity and cellulase enzyme application sequence in the finishing process. In: Industria Textilă, 2013, vol. 64,issue 2, pp. 80–88
[8] Rousselle, M. A., Bertoniere, N. R., Howley, P. S., Goynes, W. R. Effect of whole cellulase on the supramolecularof cotton cellulose. In: Textile Research Journal, 2002, vol. 72, issue 11, pp. 963–972
[9] Ciechanska, D., Kazimierczak, J. Enzymatic treatment of fibres from regenerated cellulose. In: Fibres & Textiles inEastern Europe, 2006, vol. 55, issue 14–1, pp. 92–95
[10] Tzanov, T., Costa, S., Guebitz, M. G., Paulo, C. A. Dyeing in catalase-treated bleaching baths. In: ColorationTechnology, 2011, vol. 117, pp. 1–5
[11] Tzanov, T., Costa, S., Guebitz, M. G., Paulo, C. A. Effect of temperature and bath composition on the dyeing ofcotton with catalase-treated bleaching effluents. In: Coloration Technology, 2001, vol. 117, pp. 166–170
[12] TS EN ISO 12945-2. Textiles – determination of fabric propensity to surface fuzzing and to pilling. Part 2: ModifiedMartindale method (ISO 12945-2:2000), 2002
[13] TS EN ISO 12947-2. Textiles- Determination of abrasion resistance of fabrics by the Martindale method. Part 2:Determination of specimen breakdown, 2001
[14] TS EN ISO 105 C06. Test for colour fastness. Part C06: Colour fastness to domestic and commercial laundering,2001
[15] TS EN ISO 105-E04. Textiles – Tests for colour fastness. Part E04: Colour fastness to perspiration, 2006
[16] TS EN ISO 105-E01. Textiles – Tests for colour fastness. Part E01: Colour fastness to water, 2006
[17] TS EN ISO 105-X16. Textiles–test for colour fastness. Part X16: Colour fastness to rubbing-small areas, 2003
[18] Oğulata, R. T., Balcı, O. Effects of extra washing after treatments on fastness and spectrophometric properties ofdyed PET/viscose/elastane fabric. In: The Journal of Textile Institute, 2007, vol. 98. issue 5, pp. 409-419
[19] Myers, R. H., Montgemery, D. C. Response surface methodology: Process and product optimization using designedexperiments. Second edition, 2002, pp.17–21, A Wiley-Interscience Publication

Bedwetting or nocturnal enuresis is a commonproblem. Statistical data shows that a significant
number of children and teens suffer from nocturnalenuresis. Different approaches towards the treatmentof enuresis are being studied – alarm systems arecompared to non-treatment and to drug therapies, aswell as to combined therapies, analyzing theirefficiency and decrease in wetting frequency [1]. Theaim of this research is to summarize available noctur -nal enuresis alarm systems, to analyze advantagesand drawbacks: to compare modules of the systemsfrom the point of view of comfort and efficiency, byanalyzing their design, materials and usage conve -nience. As a result, options for improving the existingalarm systems are proposed, which ensure a morecomfortable use of the product.
ENURESIS – DEFINITION OF THE PROBLEM
Nocturnal enuresis or bed-wetting is intermittentincon tinence during sleep of children after age of5 years [2]. This problem affects about 15–20% fiveyear old children and have tendency to decrease byage: it affects 5–10% of seven year olds and about2% eighteen year olds [3]. Nocturnal enuresis is acondition which is related with psychosocial conse -quences and may precipitate wide range of behav -ioral and developmental problems and decreased
quality of life. Psychosocial problems have been report -ed to 40% of affected children. Emotional and behav -ioral problems [4], social difference and restrict edpeer relationships are observed.
Causes of enuresis
Nocturnal enuresis can be caused by many factors, itis affected by genetic, physiological and psycho log -ical causes. Most often this issue is transmittedgenet ically. The mode of inheritance is autosomaldominant so if both parents were enuretic as children,the risk for their offspring is 77%, while if only oneparent had NE, the risk is about 45% [5]. In paper [6] it is mentioned that the conventionalparadigm for bed-wetting presumes three factors:disorder of sleep arousal, nocturnal polyuria and areduced nocturnal bladder capacity. Upper airwayobstruction is another cause of nocturnal enuresis.Behavioral factors predisposing enuresis are exces -sive fluid intake and inappropriate toilet training.Heterogeneity of enuresis is still topic of research.
Treatment methods
There are several approaches towards the reductionof bed-wetting, for example, reducing the fluid intakeduring the second half of the day and no liquid intakebefore going to bed, going to the toilet before goingto bed, waking the child at night for repeated
Analysis and improvement of nocturnal enuresis alarm system
INESE PARKOVA ANDIS UŽĀNSALEKSANDRS VALIŠEVSKIS AUSMA VIĻUMSONE
REZUMAT – ABSTRACT
Analiza și perfecţionarea sistemului de alarmă pentru enurezis nocturn
Enurezisul nocturn este o problemă des întâlnită în întreaga lume, având o prevalenţă foarte ridicată la populaţiapreşcolară și o scădere lentă pe parcursul copilăriei. Există câteva tratamente pentru rezolvarea acestei probleme, unuldintre acestea fiind alarma de enurezis, o metodă primară şi eficientă de tratare a enurezisului nocturn la copii. În lucraresunt prezentate diferite sisteme de alarmă – senzori de umezeală plasaţi pe pat, senzori de umezeală purtabili cu fir,senzori de umezeală purtabili fără fir, precum și avantajele şi dezavantajele acestora. S-au analizat atât modul defuncţionare şi construcţie, cât şi tehnologia de ataşare şi amplasare a unităţilor şi senzorilor de alarmă în obiectele deîmbrăcăminte. În acest studiu sunt prezentate date privitoare la sistemele de alarmă de enurezis, din punct de vedereal confortului şi siguranţei, precum şi recomandări de perfecţionare a proiectării senzorului şi a unităţii de alarmă.
Cuvinte-cheie: enurezis nocturn, sistem de alarmă, confort, fire conductoare
Analysis and improvement of nocturnal enuresis alarm system
Nocturnal enuresis is a common problem throughout the world, it has a very high prevalence in the preschool populationand the prevalence slowly falls during childhood. Several therapies exist to solve this problem, one of them being theenuresis alarm, which is a primary and effective nocturnal enuresis treatment method for children. In the paper differentalarm systems were summarized: pad-and-bell alarms, wearable wired alarms and wearable wireless alarms, analyzingits advantages and drawbacks. Operation and construction as well as attachment technology and placement in thegarment of alarm units and sensors have been explored. This study describes issues related to enuresis alarm systemsfrom the comfort and safety point of view, as well as recommendations for improvement of sensor and alarm unit design.
Key-words: nocturnal enuresis, alarm system, comfort, conductive threads
355industria textila 2013, vol. 64, nr. 6˘

urination and so on. This can reduce the number ofbed-wetting, but it does not eliminate the issuecompletely. Nocturnal enuresis treatment options include phar -macological and non-pharmacological methods.Pharmacological methods. Enuresis can be treatedwith regular drug use, but the effect will only last aslong as the drug is used. When it is stopped, the bed-wetting often recurs. Besides that, drugs can haveadverse effects on child's body – drugs that are com -monly used in the treatment of enuresis contain eitherantidepressants (high doses are harmful) or synthetichormones, which reduce the amount of urine in thekidneys during sleep (can cause side effects such asheadache or abdominal pain or interfere with theproper balance of the body fluids) [6], [7].Non-pharmacological methods. One of the non-phar -macological methods is the use of a bed-wettingalarm system. In practice this therapy is used both asa monotherapy and in combination with pharma co -logical methods. The alarm awakens the child when bed-wettingstarts, the child gets out of bed and finishes voidingin the toilet. With time a successful therapy results ina child learning to wake up by himself, when hisbladder is full. Child's involvement and a desire tosolve the issue are important for this therapy. It istherefore important that the system is convenient, itsuse does not hinder the child and does not constitutea psychological barrier. Alarm treatment is moreeffective if strong support is given to child and familyand it makes treatment less uncomfortable. Severalstudies have shown higher results when psycholog -ical or educational training is used with alarm therapy.
ANALYSIS OF EXISTING ENURESIS ALARMSYSTEMS
There are several types of enuresis alarm systemsavailable:• pad-and-bell alarms;• wearable wired alarms;• wearable wireless alarms.
Operation and construction of Pad-and-bellalarms
Pad-and-bell alarms are bed-based, with the childsleeping on a pad or mat containing an electrical
circuit. A bell rings if urine is contacting the electricalcircuit. Usually bed-mat is made out of waterproofplastic material, in which conductive (copper, foil etc.)material is embedded in a comb-like manner. It detectswetness by measuring the change in resistancewhen the sheet is wet [9]. Some of the commerciallyavailable examples are summarized in table 1. The mat is placed between mattress and bed sheet.In order to ensure that humidity gets to the sensorfaster, perforated sheet can be used as a top layer. Amat is connected to the alarm unit with a wire and assoon as urine gets on the conductive surface, thealarm unit activates. The vibrating alarm can beplaced under the pillow and the sound alarm placednear the bed. Some models allow recording a per -son alized message or sounding [10]. Examples ofmats are shown in figure 1. In study [9] humidity sensor was used, which consistsof conductive threads sewn onto a layer of absorbentpaper covered by a thin layer of biodegradable poly -ethylene. But it is intended for single use only.
Operation and construction of wearablealarm systems
Wearable wired alarms are body-worn alarms wherethe small sensor is attached to the child's pants andthe alarm is worn on the pajamas top. The sensor islocated closer to the child's body than it is in a pad-and-bell model, so it can detect bed-wetting quicker.In the wireless version of alarm system a sensor
356industria textila 2013, vol. 64, nr. 6˘
COMMERCIALLY AVAILABLE PAD-AND-BELL ALARMS
Type of product Padparameters,
cm
Materialof pad
Materialof sensor
Malem bed-mat 54 × 42 plastic foil
Tunstall enuresissensor
9.5 × 16 ×× 3.5
plastic foil
Wet call bed-sidebed wettingalarm
47 × 62polyethylene
foamconductivevinyl sheets
Sleep-free digitalchildcare system
-
breathableand water-resistantmaterial
-
Table 1
Fig. 1. Commercially available pad-and-bell alarms: a – Malem; b – Wet call bed-side; c – Astric dry-bed; d – Crazeal sleep free
a b c d

communicates with the alarm by a radio signal. In thiscase the sensor dimensions are greater, since thesensor system includes a transmitter and a battery.Consequently, the sensor unit shall be completelyisolated, which gives it additional stiffness [11]. There are different variants of wearable enuresis alarmsystems, but operating principle of all such systemsis similar, however they differ in arrangement of ele -ments and in their dimensions, materials, connectiontechnology, sensor and alarm unit communication andsignaling type, comfort level etc. Operating principleof wired and wireless systems is shown in figure 2.
Alarm unit placement and attachment
Electronic components of bed-wetting alarm unit arecontained in a small plastic box, which is attached tochild's pajamas or briefs and signals using an acous -tic, light and/or vibrating alarm. In the case of a wire -less alarm unit, it can be placed on a table. If thesystem has a separate vibrating module, it can beplaced under the pillow or beneath bed sheet. Alarmsequipped with a buzzer are suitable for children whodo not respond to an alarm sound or for householdsin which an alarm disrupts the sleep of others [9].Some of the commercially available wearable alarmunits are summarized in table 2. Placement of the alarm unit can vary, the module isattached to a collar, a pocket, trousers waistband orelsewhere, depending on the attachment type. Mostoften it is attached near the ear, so that the acousticsignal could be heard better. There are also alarm
units, which use an earphone alarm for privacy andbetter perception [13], but prolonged use of suchheadphones can cause discomfort. In some cases,the alarm unit is worn on the wrist like a wrist watch.Alarm unit is attached to the clothing with a magneticor mechanical clip, Velcro tape, press studs or safetyneedle. It is important that the child makes someeffort in order to deactivate the alarm, so that hewakes up as the result. In this sense, wireless mod -ules are more effective, since the alarm unit can beplaced further away from the bed.
Sensor type and design
Sensor of wearable alarm system operates by thesame principle as a pad-and-bell alarm: it detectswetness by measuring the change in resistance whenthe surface is wet [9]. Generally two types of sensorsare available: electrodes encased in silicone rubberor in plastic module. Some of the alarm system unitexamples are summarized in table 3. Insertable modular sensors are relatively bulky anduncomfortable to wear, especially the ones with theplastic casing. The silicon-based sensors are flexible,but they also can be felt, especially if the sensor isplaced between two closely adjacent briefs. This beingthe main reason why a child will ultimately refuse touse an alarm [14]. Several examples of sensors areshown in figure 3.
Sensor attachment technology
The way the sensor is attached to the clothingdepends on its type. Modular sensors are placed inminipad, pantyliner or into an external crotch pocket.It can also be placed inside a nappy, however nap -pies have granules, which are designed to absorbliquid and may keep the sensor too dry and fail totrigger. The sensor can be placed between two adja -cent briefs. In other cases, sensors are embeddedinto a magnetic/mechanical or lead-and-clip attach -ments, which can be attached to any part of clothing.Such attachment is less secure, because the clip canbe lost in bed.
357industria textila 2013, vol. 64, nr. 6˘
Fig. 2. Operating principle of wired and wireless system
COMMERCIALLY AVAILABLE WEARABLE ALARM UNITS
Type of product Parameters,mm
Case type Type ofattaching
Type ofcommunication
Power supply
DRI sleeper (wiredand wireless)
a – 60 × 40 × 15;b – 80 × 40 × 20
plastic block velcro tape wired wireless 4 × 1.5 V button cell
Chummie 65 × 50 × 17 plastic block snap on clip wired 2 × 1.5 V AAA
Malem (wired andwireless)
a – 49 × 39 × 18;b – transmitter46 × 45 × 22;
receiver76 × 74 × 25
plastic block
(2 blocks forwireless version)
pin/ clip wired wireless a – 3 × 1.5 V button cellb – 2 × AAA + 1 × A23
Nite train-r (for boysand for girls)
64 × 51 × 20 plastic block pin wired 1 × 9V PP3
Wet-stop 3 60 × 48 × 13 plastic block magnetic clip wired 2 × 1.5 V AAA
Enurad 400 - clock - wireless A 9V DC adapter
Table 2

There is a strong objection to the use of products thathave a wired connection attached to the patient sinceit affects the safety and comfort [10]. Another type ofsensor system is micro-wires that are built into under -wear and connected to wireless transmitter attachedwith snaps to waistband of pants [14]. Such approachis used in Rodger wireless alarm (fig. 4). Alarm trans -
mitter uses 3 V button cell, so system remains safeeven if the transmitter does get moisture on it. Wiresare embedded into briefs using a zigzag stitch.Another solution for improving the enuresis alarmsystem and making the moisture sensor more suit -able for the properties of textile product is describedin the patent [11]. It describes briefs with humidity
358industria textila 2013, vol. 64, nr. 6˘
Table 3
ALARM SYSTEM UNITS
Type of product Parameters,mm
Material Type of sensor andattaching
Communicationmode
Flexibility
DRI sleeper (wiredand wireless)
a – 40 × 20 × 3.5b – -
a – electrodesencased in silicone
rubber b – electrodes inplastic module
insertable module:put in a mini pad
or pantyliner
wired wireless flexible/not flexible
Chummie 50 × 34 × 3 electrodes encasedin silicone rubber
insertable module:put in a mini pad
or pantyliner
wired flexible
Malem (wired andwireless)
a – 18 × 2b – 32
a – flat gold platedPCB
b – electrodes inplastic module
a – insertablemodule: put in minipad or pantyliner
b – clip-on module:clip-on garment
wired wireless not flexible
Nite train-r (for boysand for girls)
a – 168 × 94 × 3b – 168 × 74 × 3
electrodes encasedin foam plastic
inserting module:put between a pair
of snug fitting panties
wired not flexible
Wet-stop 3 - electrodes in plasticmodule
clip-on module:clip-on garment
wired not flexible
Enurad 400 60 × 25 × 7 - insertable module:put in a mini pad
or pantyliner
wireless -
Fig. 3. Alarm system plastic sensors: a – Chummie; b – Enurad; c – Nite train-r; d – Malem
a b c d
Fig. 4. Textile sensors: a – Rodger wireless alarm; b – pants with conductive threads as the sensor
a b

sensor integrated directly into the textile structureusing knitting technique. Conductive threads are usedas the sensor material, which are knitted into thecrotch area. Sensor is attached to the alarm unit withwires.
REQUIREMENTS FOR COMFORTABLEENURESIS ALARM SYSTEM
Child's skin is very sensitive and underwear comfortis especially important. This section describes issuesrelated to enuresis alarm systems from the comfortand safety point of view, as well as recommendationsfor improvement of sensor and alarm unit design.
Comfort options for enuresis alarm system
Factors affecting the comfort of underwear are eval -uated from the following aspects: • sensorial – softness, stiffness, smoothness,
roughness, prickliness, dampness, clinginess ofthe fabrics;
• hygienic – hygroscopicity of underwear fabrics,heat transmission, moisture management;
• motion – fitting, freedom of movements; • aesthetic – design, quality [12]. During the optimization of enuresis alarm systems, itis necessary to take into account these factors whenchoosing product materials, design technology andsystem layout. Below is a description of enuresis alarmsystem issues from the comfort and safety aspects: Sensorial. Wires are mostly stiff and inflexible, so thatthey reduce comfort of the product. Wires in pyjamascan psychologically affect the child, creating a reluc -tance or a complex towards the product, which maydecrease the effectiveness of treatment, because inthis case child's willingness to participate in therapyis very important. Hygienic. Increased perspiration during sleep can leadto false alarms. Moisture management of the intimateapparel is important as it helps to remove excessivewetness. Modified fibres have been applied tosportswear and underwear for perspiration absorben -cy [12]. Thus, sweat evaporates more quickly andaccumulates less on the surface of clothing, whichcan reduce the likelihood of false bed-wetting alarms.After studying regulations in the area of children'ssleepwear safety, it was found that no special restric -tions on textile materials, which affect the hygienicproperties, are defined. Several regulations werelarge ly based on fire properties of apparel and tex -tiles [13]. Burning characteristics of fibres show thatcotton and linen fabrics are least resistant to fire, onthe other hand PE, PA, silk and modacrylic fabricsare more secure [14].Motion. If the elements attached to sleepwear arerigid and inflexible, they reduce the sleeping comfort,especially during movements. The movement alsoaffects the reliable operation of the system – if sleepis restless, insertable or clippable sensor can detachor slip away, connecting wire may break, alarm unitcan disconnect.
Aesthetic. Visually the system must be as neutral aspossible in order to avoid psychological discomfort orcomplexes. Safety. Paper [15] indicates that during the design ofa secure children's clothing it is recommended toavoid using long cords that could pose a serious riskof accidents if they get stuck in nearby objects. In theexisting enuresis alarm systems cables that connecttrousers and pyjamas are located near child's neck,and can pose certain security risks if they get entan -gled during a troubled sleep [14]. On the other hand, wireless sensors have greatersize (because of additional batteries and electronics),which reduces the comfort properties. Perhaps awireless solution requires constructing a distributedsystem. Alarm devices that are attached with a safety needleare dangerous as well, because if they detach acci -dentally, they may result in a serious injury.
Options for enuresis alarm sensor
It is important to choose an appropriate size of thesensor – if the sensor is too small, then it may notdetect the urination, but if it is too large, it may causediscomfort when it is worn [16]. The sensor must beplaced in the area, which is mostly exposed to con -tact with the first drops of urine. Consequently, asolution that ensures greater comfort and detectionefficiency is direct sensor integration into briefs crotcharea and using conductive material, which is incor -porated into the fabric structure. It is possible to inte -grate conductive contacts or circuits into textile struc -ture, using various non-traditional techniques, suchas: printing or laminating of conductive mate rials, inter -weaving, knitting, sewing or embroidery with con duc -tive threads. As a result it is possible to obtain a flex -ible sensor with characteristics of a textile product,which covers the entire area subject to wetting. When one uses conductive materials suitable for tex -tiles (yarn or coatings), it is necessary to think abouttheir properties – they have to be thin and durableenough and should have good electrical conductivity,as well as they should be resistant to various envi -ronmental factors (moisture, friction, bend ing, tensionetc.). We propose to design sensors with embroidery tech -nique using conductive threads. As was mentionedbefore, conductive threads are a preferable materialfor enuresis alarm sensors, since they blend with thetextile structure of underwear and bedding sheet,inducing less stress on the treated person. As was found in a previous study [17], conductivethreads behave differently in seams, so before theiruse in textile circuits it is important to determine theproperties of threads. Resistance of conductiveseams can be influenced of different variables: typeof thread, length of stitch, number of package layers,integration method. Resistance of some sampleswas affected by tension, for that reason its behavioris influenced by sewing process, which defines strainof thread in fabric.
359industria textila 2013, vol. 64, nr. 6˘

In order to assess suitability of such threads for theapplication envisioned, it is necessary to develop asuitable sensor configuration and to test the longevityand stability of the materials used.
Options for enuresis alarm unit
Enuresis alarm systems are placed inside plasticcases – some are bigger and others are smaller,although all are rigid and non-flexible. With thedevelopment of smart textiles field, now there arevarious solutions for flexible electronic circuits, whichcan be applied to the alarm unit in order to improvethe system. Possible ways to improve enuresis alarmsystem include: development of a flexible or softalarm module, replacing wires with textile conductivethreads, integrating connectors and conductivetraces into the textile material. Although certain partsof the system will inevitably remain hard – e.g. aspeaker, control electronics etc., it is still possible toadd a degree of freedom by placing these elementson a flexible PCB or a circuit printed with conductiveink on a flexible substrate. Further this module can beencapsulated into an elastomer to provide protectionwithout compromising flexibility. Additional protectivemeasures should be applied in this case so that theelectronic components do not get damaged byexcessive bending. On the other hand, such systemis more suitable both for attaching to the garment andto the bed or lining in close proximity to the sleepingperson, as it increases comfort and reduces risk ofinjuries.
CONCLUSIONS
When enuresis alarm system is used in a medicaltherapy, child's involvement is important, so it isessen tial that the system is convenient and does notcause the child a psychological discomfort. Existingenuresis alarm systems use wires that connecttrousers with pajamas, which can cause a child aver -sion to therapy. Besides that, cables are located nearchild's neck and can pose certain security risks if theyget entangled during a troubled sleep.
In order to improve the system comfort properties,modular humidity sensor should be replaced with atextile sensor, which is embroidered with conductivethreads on fabric. Conductive threads are a prefer -able material for enuresis alarm sensors, since theyblend with the textile structure of underwear andbedding sheet, inducing less stress on the treatedperson. In order to assess suitability of such threadsfor the application envisioned, it is necessary todevel op a suitable sensor configuration and to testthe longevity and stability of the materials used. Bed-wetting or nocturnal enuresis is a commonissue, statistical data show that a significant numberof children and youth suffer from nocturnal enuresis.There are different approaches towards the treat -ment of enuresis – both pharmacological methodsand non-pharmacological methods. Enuresis alarm system is one of the most effectivenon-pharmacological treatment methods. The alarmawakens the child when bed-wetting starts, the childgets out of bed and finishes voiding in the toilet. Withtime a successful therapy results in a child learning towake up by himself, when his bladder is full. Different enuresis alarm system types have beendiscussed in the article: pad-and-bell alarms, wear -able wired alarms and wearable wireless alarms.Operation and design of all alarm types have beenanalyzed, describing alarm unit placement and fas -tening techniques, sensor types and construction.The existing systems were evaluated, highlightingdraw backs and providing requirements for comfort -able enuresis alarm system.
ACKNOWLEDGEMENT
This work has been supported by the European SocialFund within the projects “Support for the implementationof doctoral studies at Riga Technical University” and“Establishment of interdisciplinary research groups for newfunctional properties of smart textiles development andintegrating in innovative products” (ESF no. 2009/0198/1DP/ 1.1.1.2.0./09/APIA/VIAA/148).
360industria textila 2013, vol. 64, nr. 6˘
BIBLIOGRAPHY
[1] Clinical Guideline Centre: Nocturnal enuresis – The management of bed-wetting in children and young people.London, National Clinical Guideline Centre, 2010. Available from www.nice.org.uk accessed: 2012.04.04
[2] Neveus, T., Eggart, P., Evans, J. et al. Evaluation of and treatment for monosymptomatic enuresis. AStandardization Document from the International Children’s Continence Society. Available from http://i-c-c-s.org/pdfs/standardisation-documents/Monosympt-Enuresis.pdf, accessed 2012-04-06 accessed: 2012.03.04
[3] Neveus, T. Nocturnal enuresis: theoretic background and practical guidelines. In: Pediatric Nefrology, 2011, vol. 26,pp. 1207–1214, ISSN 1432-198X
[4] Sempik, J., Ward, H., Darker, J. Emotional and behavioral difficulties of children and young people at entry into care.In: Journal of Clinique Children Psych Psychiatry, 2008, vol. 13, no. 2, pp. 221–233, ISSN 1461–7021
[5] Hunskaar, S., Arnold, E. P., Burgio, K., Diokno, A. C., Herzog, A. R., Mallett, V. T. Epidemiology and natural historyof urinary incontinence. In: International Urogynecology Journal Pelvic Floor Dysfunction, 2000, vol. 11, no. 5,pp. 301–19
[6] Deshpande, A. V., Caldwell, P. H. Medical management of nocturnal enuresis. In: Pediatric Drugs, 2012, vol. 14,no. 2, pp. 71–77
[7] Treating nocturnal enuresis in children. In: Effective Health Care, 2003, vol. 8, no. 2, ISSN: 0965-0288

361industria textila 2013, vol. 64, nr. 6˘
[8] Hemani, A., Huang, J., Jayaprakash, G. et al. Disposable mattress cover that detects when the sheets are wet. ECE4884/4007 Senior Design Project, 2007
[9] Thiedke, C. Nocturnal enuresis. In: American family physicians, 2003, vol. 67, issue 7, pp. 1 499–1 506
[10] Biswas, J., Wai, A. A. P., Foo, V. S. F. et al. Design of a smart continence management system based on initial userrequirement assessment. In: Smart homes and health telematics, 2008, vol. 5 120, pp. 62–72, ISBN 978-3-540-69916-3
[11] Jahn, M., Wilhaus, M., Von Riedheim et al. Knit good with moisture sensor. Patent US 2011/0132040 A1
[12] Yu, W. Achieving comfort in intimate apparel, in Improving comfort in clothing. Woodhead Publishing, Cambridge,2011, pp. 427–448, ISBN: 978-1-84569-539-2
[13] Horrocks, A. R., Nazaré, S., Kandola, B. The particular flammability hazards of nightwear. In: Fire Safety Journal,June 2004, vol. 39, no. 4, pp. 259–276
[14] Jan, S. Facts about fabric flammability. North Central Regional Extension Publication 174, 2003
[15] Quality characterization of apparel. Edited by Subrata Das, Oxford, Woodhead Publishing, Cambridge, 2009, ISBN81 908001 3
[16] Page, A. E. Device and apparatus for detecting moisture. Patent US 2008/0246620 A1
[17] Parkova, I., Vališevskis, A., Viļumsone, A. et al. Improvements of smart garment electronic contact system. In:Advances in Science and Technology, 2012, vol. 80, pp. 90–95
Authors:
INESE PARKOVA ALEKSANDRS VALIŠEVSKIS
ANDIS UŽĀNSAUSMA VIĻUMSONE
Riga Technical University Institute of Textile Material Technologies and Design
14/24 Azenes, LV 1048, Riga, Latviae-mail: [email protected]
DOCUMENTARE
FUNCȚIONALITATE SPORITĂ CU ARNITEL VT
Prin folosirea membranelor ultrasubțiri Arnitel VT, dela DSM of Sittard – Olanda, pot fi optimizate proprie -tățile de impermeabilitate, respirabilitate și confort aleîmbrăcămintei de exterior.În prezent, se urmărește evitarea utilizării PCM-urilor,care se regăsesc în membranele pe bază de poli -tetra fluoroetilenă (PTFE). Firmele specializate în pro -ducerea îmbrăcămintei de exterior caută noi metodede realizare a unor confecții cu performanțe supe -rioare și confort sporit pentru purtător, utilizând mate -riale și procese cu un impact redus asupra mediului. Cu Arnitel VT, vaporii de umiditate se pot deplasa dininteriorul îmbrăcămintei către exteriorul acesteia, iarmembrana fiind 100% impermeabilă, spre deosebirede alte produse folosite până în prezent, nu necesităperforări pentru a fi respirabilă. La membranele perfo -rate, capacitatea de ignifugare ar putea fi afectată,atunci când sunt spălate sau când intră în contact cuunele lichide, cum ar fi alcoolul sau combustibilul
lichid. Perforațiile reduc, de asemenea, rezistența larupere a membranei, fapt ce-i alterează și respira bi -litatea.Datorită faptului că Arnitel VT nu este perforat, acestaacționează ca o barieră nu numai în cazul lichidelor,ci și al bacteriilor și virusurilor. Din acest motiv,Arnitel VT este utilizat la fabricarea halatelor chirur -gicale cu cel mai ridicat nivel de protecție. Materialulnu conține perfluorocarbon și, prin urmare, este100% reciclabil.Unul dintre principalii parteneri ai DSM esteSympatex Technologies, din Germania, un furnizorglobal de materiale funcționale high-tech pentruîmbrăcăminte, încălțăminte, accesorii și aplicațiitehnice. Colaborarea dintre DSM și Sympatex a dusla o reducere drastică a amprentei de carbon înprocesul de producție a polimerilor, în comparație cumembranele pe bază de PTFE. Legat de aceasta, Michael Kamm – director generalexecutiv al Sympatex, declara: “DSM a fost un par -tener de încredere pentru noi, în dezvoltarea de teh -no logii și procese bazate pe principiile responsa bi -lității și sustenabilității ecologice”.
Sursa: www.dsm.com; www.sympatex.com
Confecþii textile
The fashion industry in Romania registered thefastest growth among e-commerce industries in
the last year, due to the fact that online consumersare spending higher amounts of money on clothesand shoes, especially on brand products. Accordingto the same source, the average apparel spendingrose from an average of 177 lei registered in 2011 toan average of 185 lei. Moreover, transactions over400 lei (without VAT) increased by 25% compared tolast year. The Romanian online apparel market roseto approximately 50 million euro, representing2,5–3% of the entire Romanian apparel market.Moreover, the Romanian online apparel market hadan ascending trend even in the economic recessionperiod of 2009, entitling the media to affirm that theonline apparel market “mocks the recession”.There are numerous players on the Romanian onlineapparel market which sell significant volumes of cloth - ing and accessories at highly discounted prices: BonPrix, Kurtmann, Fashion Days and Mini Prix. Whileprice can be perceived as the main benefit of onlineapparel buying, we are interested in a more holisticapproach to analyzing online consumer behavior.
Thus, we integrate both perceived benefits and per -ceived risks of apparel online buying in a model ofonline consumers’ intention to buy apparel online. Weidentify perceived benefits and perceived risks whenbuying online according to a rigorous previous liter -ature empirical evidences. Previous literature reviewregarding consumers’ salient beliefs when buyingonline is presented in the next section of this paper.Following Fishbein and Ajzen approach to explainingand predicting human behavior [1], we determineconsumers attitude based on these salient beliefs asmain determinants. We also pay special attention to the influence of thee-word of mouth on consumers’ intention to buyonline apparel. The direct and indirect influence ofconsumers’ salient beliefs, attitude and social influ -ence on consumers’ intention to buy online apparelare analyzed using a PLS-based SEM analysis.Our conceptual model and research methodologyform the third and forth section of this paper. Dataanalysis and results of the empirical research is pre -sented in the fifth section.
PLS-based SEM analysis of apparel online buying behavior.The importance of eWOM
GHEORGHE ORZAN MIHAI ORZANCLAUDIA ICONARU OCTAV IONUȚ MACOVEIIOANA CECILIA POPESCU
REZUMAT – ABSTRACT
Analiza SEM a comportamentului de cumpărare online a articolelor vestimentare,bazată pe tehnica PLS. Importanța eWOM
Scopul lucrării îl constituie elaborarea și testarea unui model simplu și riguros al comportamentului de cumpărare onlinea articolelor vestimentare, capabil să explice şi să prezică intenţia comportamentală. În acest scop, s-a folosit teoriaacţiunii motivate (TRA), care confirmă faptul că atitudinea unui individ privitoare la un anumit comportament estedeterminată de convingerile fundamentale ale acestuia. Pentru a menţine simplitatea modelului au fost identificate douăconvingeri fundamentale, capabile să explice variaţia în atitudinea consumatorului privitoare la cumpărarea articolelorvestimentare prin intermediul internetului, dar și riscul şi beneficiile percepute. Atât atitudinea, cât şi influența socială,analizate prin folosirea markerului viral online eWOM, determină intenţia consumatorului de a cumpăra online articolevestimentare. Pentru a testa relaţiile cauzale dintre variabile, a fost folosită o analiză SEM, bazată pe tehnica PLS, îndouă faze.
Cuvinte-cheie: comportament, cumpărare online, eWOM, analiză de tip PLS
A PLS-based SEM analysis of apparel online buying behavior: The importance of eWOM
The aim of this paper is to propose and test a simple, yet rigorous model of apparel online buying behavior, capable ofexplaining and predicting consumers’ behavioral intention. We drew on TRA (Theory of Reasoned Actions) frameworkwhich postulates that individuals’ attitude toward a behavior is determined by their salient beliefs. In order to maintainthe simplicity of the model, we have identified two salient beliefs capable of explaining the variance in consumers’attitude towards buying apparel using the Internet: perceived benefits and perceived risk. Both attitude and the socialinfluence, represented in this paper by the influence of eWOM (e-Word-of-Mouth), will determine consumers’ intentionto buy apparel online. In order to test the causal relationships between variables, we have employed a two phasePLS-based SEM analysis.
Key-words: behavior, online buying, eWOM, PLS analysis
362industria textila 2013, vol. 64, nr. 6˘

In the last section of the paper we draw the con -clusions and state the managerial implications of thisresearch paper in regards to apparel online market.
ONLINE BUYING: BENEFITS AND RISKS
Previous literature is rich in motivational studies whichtry to explain why consumers chose to shop online.Authors have identified two types of motivations thatdrive consumers when engaging in online shopping.First, there is utilitarian motivation or the rationallyperceived benefits of using the Internet in the buyingprocess and second, there is the hedonistic motiva -tion, or the pleasure experienced by the consumerwhen engaged in the online buying experience [2]. An utilitarian consumer will chose to buy online dueto various reasons. Perceived convenience hasproven to be the top reason of using the Internet tobuy goods and services [3]. Convenience is given bythe fact that the online consumer can shop fromanyplace, home or office, at any given time withoutbeing constrained by stores’ schedules or clerks’availability [4].Time can be saved when shopping from home.Consumers will save time by not having to drive tothe store, find a parking lot, and wait at check-up. Butmoney can also be saved when choosing to use theInternet for buying goods and services. Perceivedlower prices in the online environment is anotherstrong motivation to shop online [3]. Moreover, theInternet offers a great variety of products and goods,easing the process of comparison and selection [5].There are consumers that chose to shop onlinebecause the Internet offers access to productsunavailable offline in their immediate proximity [6].Consumers also mention the lack of sociality as amotivation to shop online. When shopping onlinethere is a smaller chance to be disturbed by shoppingpartners or noisy sales people [7]. Thus, consumerswill choose to buy online if the buying process isfaster, easier and also if they obtain a better price [6]. But buying online is not only about benefits.Consumers also report certain types of risks,especially when buying apparel. Especially apparelbuyers are skeptical when ordering online due to thefact that sizes may not fit and the product must bereturned [8].The inability of touching, feeling and physically exam -ining the product before buying are considered mainobstacles of e-commerce [9]. Thus consumers willwonder whether the product bought online will or willnot performed as expected, giving rise to the per -ceived performance risk [10]. Consumers also perceive financial risk resulting fromonline fraud. This is the risk associated with theInternet financial data security, namely the fear thatthe data can be intercepted and willfully manipulatedby unauthorized people [11]. Such cases have beenrevealed and highly promoted by the media, consol -idating consumers’ negative perceptions about theuncertainty of online payment [12]. Financial risk isone of the main barriers of online buying [9], [3].
Strongly related to the perceived financial risk, thereis the perceived privacy risk. In this case, not onlythat personal data, such as name, address, identi -fication number, can be intercepted but also onlinevendors can alienate consumers’ personal data with -out their permission [12]. Even though risk can beeither real or perceived, the security of both financialand personal data can slow down the adoption of theInternet for buying goods and services [12].
eWOM
Word-of-mouth (WOM) is based on personal recom -mendations for products or services where the sen -der is usually known by the consumer, thus, the per -suasive nature of WOM is attributed to trust bet weenthe sender and the receiver of a message. Accordingto Perju et al., the great influence of WOM lies in thefact that consumers are likely to trust recommen -dations that come from their community, friends andfamily, as WOM has greater persua sive ness due toits perceived credibility and trustwor thiness [13], [14].Their research also posits that even though elec -tronic word-of-mouth (eWOM) eliminates the consu -mer’s ability to judge the credibility of the sender andtheir message, a high amount of users make use ofeWOM. Additionally, the quantity of online reviewsshows a positive relationship with cus tomers’ inten -tion to purchase [15]. Additionaly, eWOM is enabledby accessibility and reach at a completely differentlevel than traditional WOM could have ever achieved.eWOM is also more likely to contain references toadvertising than traditional WOM, as the Internet allowsthe sharing of links, pictures, videos and informationin general, thus making it easier for consumers toshare marketing messages. The wide dissemination of eWOM communicationsand the high level of acceptance by consumers sug -gest that eWOM exerts considerable influence onconsumer buying and communication behavior, and,consequently, on the success of products sale in themarket [16]. eWOM not only increases marketingmessages but also alters consumer information pro -cessing [17]. In particular, peer communicationthrough social media, a new form of consumer socia -li zation, has profound impacts on consumer decisionmaking and thus marketing strategies [18]. The socialization process and thus eWOM are faci -litated by blogs, instant messaging, and social net -working sites, which provide easy and convenientcommunication tools. For example, new members onsocial networking sites can be easily socialized intovirtual groups in which they may share and findinformation to help the make consumption-relateddecisions. Consequently, the multitude of friends orpeers acts as a socialization agent, providing vastproduct information and evaluations and facilitatesonline education.Previous literature shows that online advertisingeffectiveness is related to consumer engagementwith a website, as manifested in “finding a basis forconversation and social interaction” [19].
363industria textila 2013, vol. 64, nr. 6˘

Online reviews on the other hand, can be anonymousor can offer additional personal details of the senderand can thus have an influence on the credibility ofthe message, which in turn, can induce different atti -tudes and intentions towards specific products orservices.
CONCEPTUAL FRAMEWORK
The best predictor of an individual’s behavior as stip -ulated by Fishbein and Ajzen’s Theory of ReasonedActions (TRA) and subsequent TRA-based studies isa measure of his intention to perform such behavior[1]. Thus, our main objective is to study consumers’behavior when buying apparel online by modelingconsumers’ stated intentions. According to TRA framework, individuals’ behavioralintention is a function of individuals’ attitude and socialinfluence [1]. Thus, we state our first hypothesis:1. Consumers’ attitude towards buying apparel
online will directly and positively affect con -sumers’ intention to use the Internet in the appar -el buying process.
2. Electronic word of mouth (eWOM) has becomean important decision factor for evaluating pro d -ucts as consumers gather information and readreviews of previous consumers before buyingonline [18]. eWOM has gained importance sincethere are more and more online discussionforums, reviews web-sites, social network sites ofblogs for potential, actual or previous consumersto disseminate information.
3. Many potential Internet shoppers tend to observethe experiences of others who have tried a prod -uct before considering whether to purchase itthemselves. Contributions on opinion platformsusually include both the verbal account of a con -sumer’s experience with a product and a formal -ized rating of the product.
4. eWOM can be conceptualized as a form of socialinfluence which, according to TRA, will determineto a great extent individuals’ behavioral intention[1]. Thus, we state our second hypothesis:
5. eWOM will directly and positively affect con sumers’intention to use the Internet in the apparel buyingprocess.
6. But according to TRA, individuals’ attitudetowards a behavior is determined by the individ -uals’ salient beliefs [1], which we have identifiedas being perceived benefits and perceived risk ofbuying online apparel. Thus, we state our thirdand forth hypotheses:
7. Perceived benefits of using the Internet in theapparel buying process will directly and positivelyaffect consumers’ attitude towards buying onlineapparel.
8. Perceived risks of using the Internet in the appar -el buying process will directly and negativelyaffect consumers’ attitude towards buying onlineapparel.
9. Based on the TRA framework, our model postu -lates that perceived benefits and perceived risks
are the main determinants of attitude and thatattitude together with eWOM will determine con -sumers’ intention to use the Internet for buyingonline apparel.
METHODOLOGY
In order to test our conceptual framework, we havegathered primary data from 98 consumers that havepreviously bought apparel online. An invitation tocom plete the web survey was posted on a Facebookpage, Romania’s most popular social network. Thefirst part of the questionnaire contained 20 state -ments, 3 statements for each construct: perceivedbenefits, perceived risks, attitude, eWOM and inten -tion, measured on a Likert scale from 1 to 7 and thesecond part of the questionnaire was designed togather socio-demographic data: gender, age, incomeand level of education. Measurements of all five constructs were adaptedfrom previous literature for the specificity of thisstudy. Each construct was constructed as a formativelatent variable with three indicators.“Intention to use the internet in the apparel buy -ing process” was constructed following Soderlundand Ohman approach to intentions as wants, expec -tations and plans [20] (“I want to/I expect to/ I plan touse the Internet in the apparel buying process). “The attitude towards apparel online buying” com -prises both the cognitive and the affective componentof attitude in a single formative construct accordingto Fishbein and Ajzen [1] (using the Internet in theappar el online buying process is a good/wise/pleas a -nt idea).“eWOM” was measured as consumers’ willingness torely on information gathered from online discussionforums/blogs/consumers’ reviews sites. “Perceived benefits” was constructed as a formativelatent variable, measuring apparel online buying ben -efits identified in previous literature review section -convenience, time savings and price savings (buyingapparel online is convenient/saves time/savesmoney).“Perceived risks” was constructed as a formativelatent variable, measuring apparel online buying risksidentified in previous literature review section: per -formance risk, financial risk and privacy risk (apparelbought online may not perform as expected/I canlose money when buying apparel online/I can losemy privacy when buying apparel online).
DATA ANALYSIS AND RESULTS
Data analysis and results section of this paper com -prises three main parts: measurements’ reliability,measurements’ validity and the PLS-based SEManal ysis. We have chosen warp PLS 3.0 in order toperform our analysis due to various reasons: WarpPLS can operate with small amount of data, it differ -entiates between reflective and formative variablesand it allows multiple causal relationships betweenlatent variables [21].
364industria textila 2013, vol. 64, nr. 6˘
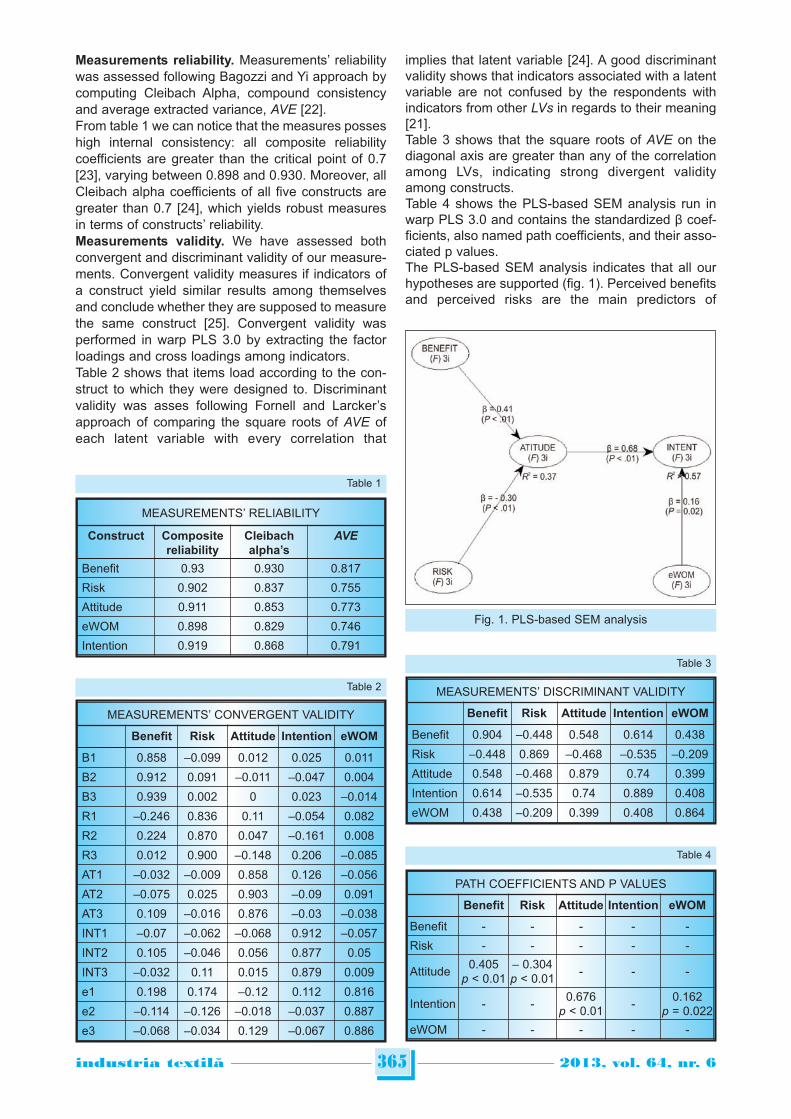
Measurements reliability. Measurements’ reliabilitywas assessed following Bagozzi and Yi approach bycomputing Cleibach Alpha, compound consistencyand average extracted variance, AVE [22]. From table 1 we can notice that the measures posseshigh internal consistency: all composite reliabilitycoef ficients are greater than the critical point of 0.7[23], varying between 0.898 and 0.930. Moreover, allCleibach alpha coefficients of all five constructs aregreater than 0.7 [24], which yields robust measuresin terms of constructs’ reliability.Measurements validity. We have assessed bothconvergent and discriminant validity of our measure-ments. Convergent validity measures if indicators ofa construct yield similar results among themselvesand conclude whether they are supposed to measurethe same construct [25]. Convergent validity wasperformed in warp PLS 3.0 by extracting the factorloadings and cross loadings among indicators.Table 2 shows that items load according to the con -struct to which they were designed to. Discriminantvalidity was asses following Fornell and Larcker’sapproach of comparing the square roots of AVE ofeach latent variable with every correlation that
implies that latent variable [24]. A good discriminantvalidity shows that indicators associated with a latentvariable are not confused by the respondents withindicators from other LVs in regards to their meaning[21]. Table 3 shows that the square roots of AVE on thediagonal axis are greater than any of the correlationamong LVs, indicating strong divergent validityamong constructs.Table 4 shows the PLS-based SEM analysis run inwarp PLS 3.0 and contains the standardized β coef -ficients, also named path coefficients, and their asso -ciated p values. The PLS-based SEM analysis indicates that all ourhypotheses are supported (fig. 1). Perceived benefitsand perceived risks are the main predictors of
365industria textila 2013, vol. 64, nr. 6˘
Table 1
Table 3
Table 4
Table 2
MEASUREMENTS’ RELIABILITY
Construct Compositereliability
Cleibachalpha’s
AVE
Benefit 0.93 0.930 0.817
Risk 0.902 0.837 0.755
Attitude 0.911 0.853 0.773
eWOM 0.898 0.829 0.746
Intention 0.919 0.868 0.791
MEASUREMENTS’ CONVERGENT VALIDITY
Benefit Risk Attitude Intention eWOM
B1 0.858 –0.099 0.012 0.025 0.011
B2 0.912 0.091 –0.011 –0.047 0.004
B3 0.939 0.002 0 0.023 –0.014
R1 –0.246 0.836 0.11 –0.054 0.082
R2 0.224 0.870 0.047 –0.161 0.008
R3 0.012 0.900 –0.148 0.206 –0.085
AT1 –0.032 –0.009 0.858 0.126 –0.056
AT2 –0.075 0.025 0.903 –0.09 0.091
AT3 0.109 –0.016 0.876 –0.03 –0.038
INT1 –0.07 –0.062 –0.068 0.912 –0.057
INT2 0.105 –0.046 0.056 0.877 0.05
INT3 –0.032 0.11 0.015 0.879 0.009
e1 0.198 0.174 –0.12 0.112 0.816
e2 –0.114 –0.126 –0.018 –0.037 0.887
e3 –0.068 –0.034 0.129 –0.067 0.886
MEASUREMENTS’ DISCRIMINANT VALIDITY
Benefit Risk Attitude Intention eWOM
Benefit 0.904 –0.448 0.548 0.614 0.438
Risk –0.448 0.869 –0.468 –0.535 –0.209
Attitude 0.548 –0.468 0.879 0.74 0.399
Intention 0.614 –0.535 0.74 0.889 0.408
eWOM 0.438 –0.209 0.399 0.408 0.864
PATH COEFFICIENTS AND P VALUES
Benefit Risk Attitude Intention eWOM
Benefit - - - - -
Risk - - - - -
Attitude0.405
p < 0.01– 0.304p < 0.01
- - -
Intention - -0.676
p < 0.01-
0.162p = 0.022
eWOM - - - - -
Fig. 1. PLS-based SEM analysis
consumers’ attitude towards buying apparel online,with a standardized β coefficient of 0.405 and –0.304,respectively. As initially stipulated, perceived risks when buyingonline have a strong direct negative effect on con -sumers’ attitude towards buying online apparel.However, an even stronger influence on consumers’attitude toward buying online apparel is given byperceived benefits. As expected, the best predictor of consumers’ inten -tion to use the Internet in the online buying process isgiven by consumers’ attitude towards buying apparelonline, with a standardized β coefficient of 0.676 atp < 0.001. eWOM has a significant direct effect on consumers’intention to buy apparel online, but not as significantas expected, with a standardized β coefficient of0.160 at p < 0.05.Consumers rely on eWOM when buying online, buttheir attitude towards buying apparel online has anobviously greater effect on their stated behavioralintention.Furthermore, we will test the robustness of the modelby analyzing model fit indices and their associated pvalues. The warp PLS 3.0 output reports three model fitindices: average path coefficients APC, average Rsquared ARS and average variance inflation factors,AVIF.Following Kock’s approach, the model fit indicesindicates show that the model has a good predictiveand explanatory capacity if all the assumptions aremet (table 5).
CONCLUSIONS AND IMPLICATIONS
Analyzing online consumers’ behavior givesresearchers and practitioners the opportunity ofpruning few high impact determinants. It all comes tolowering risk, increasing the perceived benefits ofonline buying and offering a highly reputable productat a fair lower price.By a close examination of the relationship betweenperceived risks when buying online and consumers’attitude towards using the Internet in the apparel
buying process, one can notice that performance riskposes a huge problem for selling online apparel.Consumers may wonder if the colors or the cut will beidentically with what they can only see in pictures orvideo representations of the product, without beingable to touch, feel the fabric or try on before pur -chase. Colors may vary according to the type ofscreen and colors’ fidelity cannot be guaranteed bythe online vendors. Another problem when buyingapparel online is size, as size varies according todifferent size charts and measurements.Lower prices ponder in the decision making processof choosing online buying over traditional buying.Judging by the huge volumes of sales of Romaniandiscount fashion stores, one can state that lowerprices are the main relative advantages of buyingonline apparel.The ease of finding and ordering apparel also con -stitutes a relative advantage of buying online.Consumers can browse in a relative short timeamong a variety of products without any physicallyeffort. They can easily compare different productsand brands, selecting within the shortest time framethe product that best suits current needs and wants.Also, apparel products should have positive reviewsas eWOM is gaining more and more popularityamong online consumers. Previous consumers sharetheir experience with products bought online on theirpersonal blogs, social network pages or discussionforums and potential consumers often check others’opinion before purchasing a product.Without being able to operate with both positive andnegative reviews, online vendors’ image may beharmed. Marketers should not overlook the power ofonline opinions and recommendations, particularlythe power of spreading negative information.Marketers should take advantage of consumer par -ticipation through active communication to stren gthentheir relationships. Apparel companies should alsoallow consumers to not only exchange infor mationabout products or services but also engage in “parti -ci pating and socializing” experiences, across bothcurrent and potential consumers [26].
ACKNOWLEDGEMENTS
This article is a result of the project POSDRU/88/1.5./S/55287 „Doctoral Programme in Economics at EuropeanKnowledge Standards (DOESEC)". This project is co-fund -ed by the European Social Fund through The SectorialOperational Programme for Human Resources Develop -ment 2007–2013, coordinated by The Bucharest Academyof Economic Studies in partnership with West University ofTimisoara.
366industria textila 2013, vol. 64, nr. 6˘
MODEL FIT INDICES
APC = 0.387 (p < 0.01) Good if p < 0.05
ARS = 0.472 (p < 0.01) Good if p < 0.05
AVIF = 1.239 Good if < 5
Table 5
BIBLIOGRAPHY
[1] Fishbein, M., Ajzen, I. Belief, attitude, intention, and behavior: An introduction to theory and research. Reading, MA:Addison-Wesley, 1975
[2] Sejin, H., Stoel, L. Consumer e-shopping acceptance: Antecedents in a technology acceptance model. In: Journalof Business Research, 2009, vol. 62, pp. 565–571
[3] Saprikis, V., Chouliara, A., Vlachopoulou, M. Perceptions towards online shopping: Analyzing the Greek Universitystudents’ attitude. In: Communications of the IBIMA, 2010, vol. 2010, pp. 1–13

367industria textila 2013, vol. 64, nr. 6˘
Professor GHEORGHE ORZAN, PhD
Lecturer MIHAI ORZAN, PhD
CLAUDIA ICONARU, PhD
Assist. IOANA CECILIA POPESCU, PhD
The Bucharest University of Economic Studies
6 Romana Street, 010374, Bucharest, Romania
e-mail: [email protected]
Lecturer OCTAV IONUȚ MACOVEI, PhD
Lumina – The University of South-East Europe
64B Colentina Street
021178 Bucharest, Romania
e-mail: [email protected]
[4] Margherio, L. The Emerging Digital Economy. In: U.S. Department of Commerce, Washington, D.C., 1998, availa-ble online at http://govinfo.library.unt.edu/ecommerce/EDEreprt.pdf
[5] Gurvinder, S., Chen, Z. Shopping on the internet–online purchase behavior of New Zealand consumers. In: Journalof Internet Commerce, 2004, vol. 3, issue 4, pp. 61–77
[6] Croome, R., Lawly, M. Antecedents of purchase in the online buying process. In: Journal of Internet Business, 2010,vol. 8, pp. 1–40
[7] Gilly, M. C., Wolfinbarger, M. A comparison of consumer experiences with online and offline shopping. In:Consumption Markets & Culture, 2000, vol. 4, issue 2, pp. 187–205
[8] Lim, N. Consumers’ perceived risk: sources versus consequences. In: Electronic Commerce Research andApplications, 2003, vol. 2, pp. 216–228
[9] Rudolph, T., Rosenbloom, B., Wagner, T. Barriers to online shopping in Switzerland. In: Journal of InternationalConsumer Marketing, 2004, vol. 16, issue 3, pp. 55–74
[10] Almousa, M. Perceived risk in apparel online shopping: A multidimensional perspective. In: Canadian SocialScience, 2011, vol. 7, issue 2, pp. 23–31
[11] Orzan, G., Orzan, M. Cybermarketing. Bucharest: Uranus Publihing House, 2007
[12] Jahankhani, H. The behavior and perception of online consumers: risk, risk perception and trust, 2009. Availableonline at http://www.srlst.com/ijist/ijism-Vol7No1/ijism71-79-90.pdf
[13] Popescu, D. I., Popa, I., Cicea, C., Iordănescu, M. The expansion potential of using sales promotion techniques inthe Romanian garments industry. In: Industria Textilă, 2013, vol. 64, issue 5, pp. 293–300
[14] Perju, A., Iconaru, C., Macovei, O. I. The impact of E-WOM spread through social networks on the decision makingprocess: a Romanian online community analysis. 12th WSEAS International Conference on Mathematics andComputers in Business and Economics, Transilvania University of Brasov, Romania, April 11– 13, 2011, WSEASPress, pp. 66–70, ISBN: 978-960-474-293-6
[15] Chan, Y. Y. Y., Ngai, E. W. T. Conceptualising electronic word of mouth activity: An input-process-output perspecti-ve. In: Marketing Intelligence & Planning, 2011, vol. 29, issue 5, pp. 488–516
[16] Watts Sussman, S., Schneier Siegal, W. Informational influence in organizations: An integrated approach to know-ledge adoption. In: Information systems research, 2003, vol.14, pp. 47–65
[17] Casteleyn, J., Mottart, A., Rutten, K. How to use facebook in your market research. In: International Journal ofMarket Research, 2009, vol. 51, issue 4, pp. 439–47
[18] Calder, B. J., Malthouse, E. C., Schaedel, U. An experimental study of the relationship between online engagementand advertising effectiveness. In: Journal of Interactive Marketing, 2009, vol. 23, pp. 321–31
[19] Doh, S.-J. M. S., Hwang, J.-S. How consumers evaluate eWOM (Electronic Word-of-Mouth) messages. In: CyberPsychology & Behavior, 2009, vol. 12, issue 2, pp. 193–197
[20] Soderlund, M., Ohman, N. Intentions are plural: Towards a multidimensional view of intentions in consumerresearch. In: European Advances in Consumer Research, 2006, vol. 7, pp. 410–416
[21] Kock, N. Using Warp PLS in e-collaboration studies: Mediating effects, control and second order variables and algo-rithm choices. In: International Journal of e-Collaboration, 2011, vol. 7, issue 3, pp. 1–13
[22] Nunally, J. C. Psychometric theory, 2nd edition, 1978, McGraw Hill: New York
[23] Bagozzi, R. P., Yi, Y. On the evaluation of structural equation models. In: Journal of the Academy of MarketingScience, 1988, vol. 16, issue 1, pp. 74–94
[24] Fornell, C., Larcker, D. F. Evaluating structural equation models with unobservable variables and measurementerror. In: Journal of Marketing Research, 1981, vol. 48, pp. 39–50
[25] Jewell D. V. Guide to evidence-based physical therapist practice, 2nd edition, 2011, Jones & Bartlett Learning:Ontario
[26] Mersey, R., Davis, E., Malthouse, C., Calder, B. J. Engagement with online media. In: Journal of Media BusinessStudies, 2010, vol. 7, issue 2, pp. 39–56
Authors:
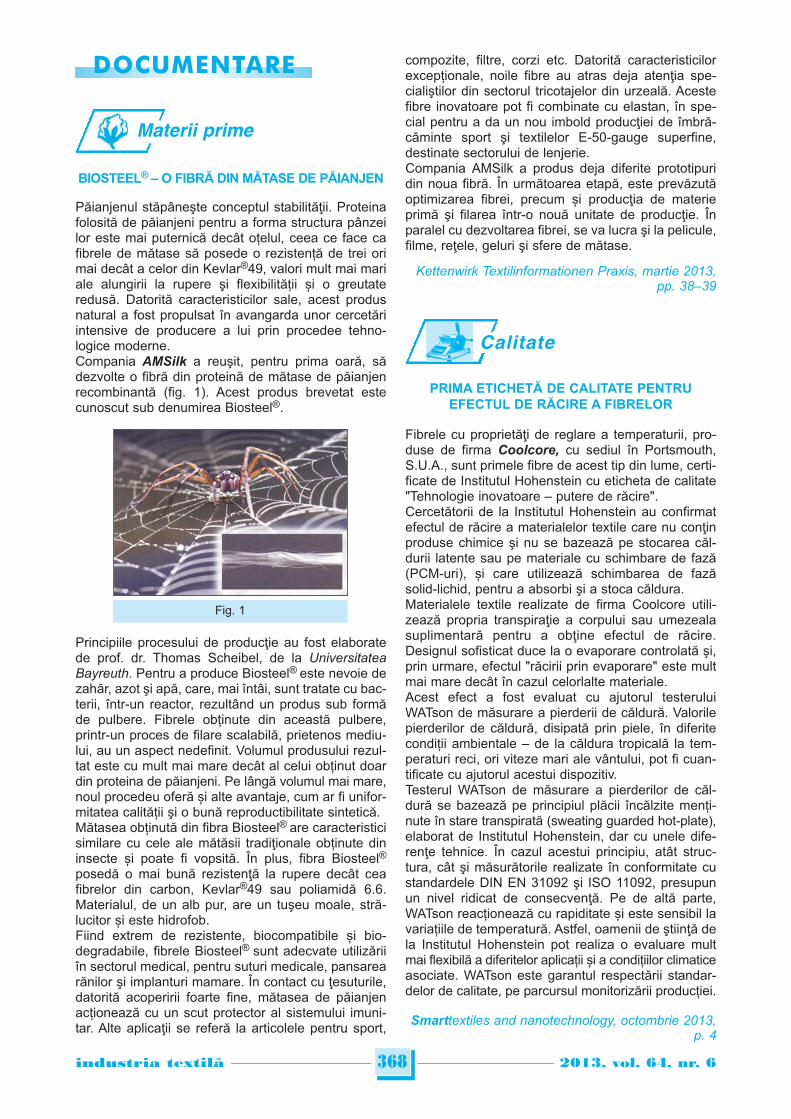
BIOSTEEL® – O FIBRĂ DIN MĂTASE DE PĂIANJEN
Păianjenul stăpâneşte conceptul stabilităţii. Proteinafolosită de păianjeni pentru a forma structura pânzeilor este mai puternică decât oțelul, ceea ce face cafibrele de mătase să posede o rezistență de trei orimai decât a celor din Kevlar®49, valori mult mai mariale alungirii la rupere şi flexibilității și o greutateredusă. Datorită caracteristicilor sale, acest produsnatural a fost propulsat în avangarda unor cercetăriintensive de producere a lui prin procedee tehno -logice moderne. Compania AMSilk a reuşit, pentru prima oară, sădezvolte o fibră din proteină de mătase de păianjenrecombinantă (fig. 1). Acest produs brevetat estecunoscut sub denumirea Biosteel®.
Principiile procesului de producţie au fost elaboratede prof. dr. Thomas Scheibel, de la UniversitateaBayreuth. Pentru a produce Biosteel® este nevoie dezahăr, azot şi apă, care, mai întâi, sunt tratate cu bac -terii, într-un reactor, rezultând un produs sub formăde pulbere. Fibrele obținute din această pulbere,printr-un proces de filare scalabilă, prietenos mediu -lui, au un aspect nedefinit. Volumul produsului rezul -tat este cu mult mai mare decât al celui obținut doardin proteina de păianjeni. Pe lângă volumul mai mare,noul procedeu oferă și alte avantaje, cum ar fi unifor -mitatea calității şi o bună reproductibilitate sintetică. Mătasea obținută din fibra Biosteel® are caracteristicisimilare cu cele ale mătăsii tradiţionale obținute dininsecte și poate fi vopsită. În plus, fibra Biosteel®
posedă o mai bună rezistenţă la rupere decât ceafibrelor din carbon, Kevlar®49 sau poliamidă 6.6.Mate rialul, de un alb pur, are un tuşeu moale, stră -lucitor și este hidrofob. Fiind extrem de rezistente, biocompatibile și bio -degradabile, fibrele Biosteel® sunt adecvate utilizăriiîn sectorul medical, pentru suturi medicale, pansarearănilor şi implanturi mamare. În contact cu ţesuturile,datorită acoperirii foarte fine, mătasea de păianjenacționează cu un scut protector al sistemului imuni -tar. Alte aplicaţii se referă la articolele pentru sport,
compozite, filtre, corzi etc. Datorită caracteristicilorexcepționale, noile fibre au atras deja atenţia spe -cialiştilor din sectorul tricotajelor din urzeală. Acestefibre inovatoare pot fi combinate cu elastan, în spe -cial pentru a da un nou imbold producţiei de îmbră -căminte sport şi textilelor E-50-gauge superfine,destinate sectorului de lenjerie. Compania AMSilk a produs deja diferite prototipuridin noua fibră. În următoarea etapă, este prevăzutăoptimizarea fibrei, precum și producţia de materieprimă şi filarea într-o nouă unitate de producţie. Înparalel cu dezvoltarea fibrei, se va lucra şi la pelicule,filme, reţele, geluri şi sfere de mătase.
Kettenwirk Textilinformationen Praxis, martie 2013,pp. 38–39
PRIMA ETICHETĂ DE CALITATE PENTRUEFECTUL DE RĂCIRE A FIBRELOR
Fibrele cu proprietăţi de reglare a temperaturii, pro-duse de firma Coolcore, cu sediul în Portsmouth,S.U.A., sunt primele fibre de acest tip din lume, certi-ficate de Institutul Hohenstein cu eticheta de calitate"Tehnologie inovatoare – putere de răcire".Cercetătorii de la Institutul Hohenstein au confirmatefectul de răcire a materialelor textile care nu conţinproduse chimice şi nu se bazează pe stocarea căl -durii latente sau pe materiale cu schimbare de fază(PCM-uri), și care utilizează schimbarea de fazăsolid-lichid, pentru a absorbi şi a stoca căldura.Materialele textile realizate de firma Coolcore utili -zează propria transpiraţie a corpului sau umezealasuplimentară pentru a obţine efectul de răcire.Designul sofisticat duce la o evaporare controlată şi,prin urmare, efectul "răcirii prin evaporare" este multmai mare decât în cazul celorlalte materiale.Acest efect a fost evaluat cu ajutorul testeruluiWATson de măsurare a pierderii de căldură. Valorilepierderilor de căldură, disipată prin piele, în diferitecondiții ambientale – de la căldura tropicală la tem-peraturi reci, ori viteze mari ale vântului, pot fi cuan-tificate cu ajutorul acestui dispozitiv.Testerul WATson de măsurare a pierderilor de căl -dură se bazează pe principiul plăcii încălzite menți -nute în stare transpirată (sweating guarded hot-plate),elaborat de Institutul Hohenstein, dar cu unele dife -renţe tehnice. În cazul acestui principiu, atât struc -tura, cât şi măsurătorile realizate în conformitate custandardele DIN EN 31092 şi ISO 11092, presupunun nivel ridicat de consecvenţă. Pe de altă parte,WATson reacționează cu rapiditate și este sensibil lavariațiile de temperatură. Astfel, oamenii de ştiinţă dela Institutul Hohenstein pot realiza o evaluare multmai flexibilă a diferitelor aplicații și a condițiilor climaticeasociate. WATson este garantul respectării standar -delor de calitate, pe parcursul monitorizării producției.
Smarttextiles and nanotechnology, octombrie 2013,p. 4
368industria textila 2013, vol. 64, nr. 6˘
DOCUMENTARE
Calitate
Materii prime
Fig. 1