text only for casac’s letter/report concerning the...
TRANSCRIPT

UNITED STATES ENVIRONMENTAL PROTECTION AGENCYWASHINGTON D.C. 20460
OFFICE OF THE ADMINISTRATORSCIENCE ADVISORY BOARD
August 20, 2010
EPA-SAB-10-011
The Honorable Lisa P. JacksonAdministratorU.S. Environmental Protection Agency1200 Pennsylvania Avenue, N.W.Washington, D.C. 20460
Subject: Consultation on EPA’s Proposed Approach for Developing Lead Dust Hazard Standards for Residential Buildings and Commercial and Public Buildings
Dear Administrator Jackson:
In 2001, EPA’s Office of Pollution Prevention and Toxics (OPPT), under the Toxic Substances Control Act (TSCA), established standards for lead-based paint hazards including lead dust in residential buildings. OPPT is considering possible revision of the residential lead dust hazard standards as well as the development of lead dust hazard standards for public and commercial buildings. OPPT developed two documents outlining their proposed technical approach, Proposed Approach for Developing Lead Dust Hazard Standards for Residences, and Proposed Approach for Developing Lead Dust Hazard Standards in Commercial and Public Buildings. OPPT requested that the EPA Science Advisory Board (SAB) provide early consultative advice on the proposed approaches. An SAB consultation is a mechanism to provide individual expert advice early in the development of an EPA’s technical product. A consultation does not involve the development of a consensus report.
The SAB Lead Review Panel held a public meeting on July 6-7, 2010 and discussed comments in response to EPA’s charge questions centered on the overall approach, health endpoints, conversion of dust loadings to dust concentrations, relation of sill dust to floor dust, activity patterns and microenvironments, and blood lead modeling. My summary of key points discussed by the Panel members and their individual comments are provided in Appendix A. EPA’s charge questions are available in Appendix B. Major highlights of the discussion are presented below.
The Panel finds the general approach for the document, Proposed Approach for Developing Lead Dust Hazard Standards for Residences, to be well conceived, clearly described, logical, and reasonable. The Panel commends EPA for initiating a revision of the residential lead dust hazard that takes into account recent studies indicating adverse health effects of lead to children at relatively low levels of lead exposure. Although EPA’s approach incorporates well

accepted exposure and uptake models, it also includes considerable uncertainty. Several Panel members recommend an alternate approach utilizing the recent epidemiologic studies. These studies provide direct observations of observed dust loadings and their associated blood lead concentrations that take into account real world exposure for susceptible populations. Many Panel members agree that there would be value in using both approaches such that the Agency’s approach could be validated by, or compared with, the epidemiologic evidence.
The document, Proposed Approach for Developing Lead Dust Hazard Standards Commercial and Public Buildings, is similar to the Residential approach. However, in the case of commercial and public buildings, there are relatively scant data that underlie the approach thereby introducing considerable uncertainty. For example, there are no data to establish the relationship between lead loadings and adult blood lead levels. The lack of data to support the commercial building approach highlights the need for research and data collection efforts in this area. Additionally, the Panel has mixed views regarding the appropriate health endpoint for adults. Some Panel members believe that blood pressure is an appropriate health endpoint, whereas other Panel members view that fetal and infant neurocognitive deficits from maternal lead exposure provide a more appropriate and sensitive health endpoint.
We hope these comments are helpful to EPA and look forward to reviewing the completed documents as the Agency continues to develop dust lead hazard standards for residential buildings and public and commercial buildings.
Sincerely, /Signed/
Dr. Timothy Buckley, Chair SAB Lead Review Panel
cc: Dr. Deborah Swackhamer, Chair Science Advisory Board
2

U.S. Environmental Protection AgencyScience Advisory Board
Lead Review Panel
CHAIRDr. Timothy Buckley, Associate Professor and Chair, Division of Environmental Health Sciences, College of Public Health, The Ohio State University, Columbus, OH
MEMBERSDr. Richard Canfield, Senior Research Associate, Division of Nutritional Sciences , Cornell University, Ithaca, NY
Dr. Jack Caravanos*, Associate Professor, Environmental & Occupational Health Sciences, School of Health Sciences, Hunter College of the City University of New York, New York, NY
Dr. Scott Clark, Professor, Environmental Health, College of Medicine, University of Cincinnati, Cincinnati, OH
Dr. Kim Dietrich, Professor, Department of Environmental Health, College of Medicine, University of Cincinnati, Cincinnati, OH
Dr. Philip E. Goodrum, Principal Scientist /Statistician, ARCADIS BBL, ARCADIS of New York, Inc., Syracuse, NY
Dr. Sean Hays, President, Summit Toxicology, Allenspark, CO
Dr. Andrew Hunt, Assistant Professor, Department of Earth and Environmental Sciences, University of Texas at Arlington, Arlington, TX
Dr David E. Jacobs, Adjunct Associate Professor, School of Public Health, Division of Occupational and Environmental Health MC922 , University of Illinois at Chicago, Chicago, IL
Dr. Michael A. Jayjock, Senior Analyst, The LifeLine Group, Langhorne, PA
Dr. Michael Kosnett, Associate Clinical Professor, Division of Clinical Pharmacology and Toxicology, Department of Medicine, University of Colorado Health Sciences Center, Denver, CO
Dr. Bruce Lanphear, Professor, Children’s Environmental Health, Faculty of Health Sciences, Simon Fraser University, Vancouver, BC, Canada
3
Dr. Thomas Louis, Professor, Department of Biostatistics, Johns Hopkins University Bloomberg School of Public Health, Baltimore, MD
Dr. Howard Mielke, Research Professor, Department of Chemistry and Center for Bioenvironmental Research, Tulane University, New Orleans, LA
Dr Joel Pounds**, Scientist, Cell Biology & Biochemistry, Biological Sciences Divison, Battelle - Pacific Northwest National Laboratory, Richland, WA
Dr. Michael Rabinowitz*, Geochemist, Clinical Instructor in Neurology, Harvard University, Newport, RI
Dr. Ian von Lindern, President, TerraGraphics Environmental Engineering, Inc., Moscow, ID
Dr. Michael Weitzman*, Professor, Pediatrics; Psychiatry, New York University School of Medicine, New York, NY
SCIENCE ADVISORY BOARD STAFFMr. Aaron Yeow, Designated Federal Officer, 1200 Pennsylvania Ave, NW (1400R), Washington DC, Phone: 202-564-2050, Fax: 202-565-2098, ([email protected])
* Unable to attend the July 6-7, 2010 meeting.** Did not provide individual written comments.
4

NOTICE
This report has been written as part of the activities of the EPA Science Advisory Board, a public advisory committee providing extramural scientific information and advice to the Administrator and other officials of the Environmental Protection Agency. The Board is structured to provide balanced, expert assessment of scientific matters related to problems facing the Agency. This report has not been reviewed for approval by the Agency and, hence, the contents of this report do not necessarily represent the views and policies of the Environmental Protection Agency, nor of other agencies in the Executive Branch of the Federal government, nor does mention of trade names or commercial products constitute a recommendation for use. Reports of the EPA Science Advisory Board are posted on the EPA Web site at: http://www.epa.gov/sab.
5

Table of Contents
APPENDIX A - Comments from Panel Members..................................................................A-1
Summary of Key Points Discussed from Dr. Timothy Buckley, Panel Chair........................A-1Comments from Dr. Richard Canfield....................................................................................A-4Comments from Dr. Scott Clark..............................................................................................A-9Comments from Dr. Kim Dietrich.........................................................................................A-20Comments from Dr. Philip Goodrum....................................................................................A-29Comments from Dr. Sean Hays.............................................................................................A-44Comments from Dr. Andrew Hunt........................................................................................A-46Comments from Dr. David E. Jacobs....................................................................................A-57Comments from Dr. Michael Jayjock...................................................................................A-63Comments from Dr. Michael Kosnett...................................................................................A-70Comments from Dr. Bruce Lanphear....................................................................................A-83Comments from Dr. Thomas Louis.......................................................................................A-89Comments from Dr. Howard Mielke.....................................................................................A-99Comments from Dr. Ian von Lindern..................................................................................A-114
APPENDIX B - EPA Charge Questions to the Panel..................................................................B-1
APPENDIX A - Comments from Panel Members
Summary of Key Points Discussed from Dr. Timothy Buckley, Panel Chair
The following is a summary of key points relating to both documents, Proposed Approach for Developing Lead Dust Hazard Standards for Residences and Proposed Approach for Developing Lead Dust Hazard Standards in Commercial and Public Buildings.
Reasonableness of the Approach
The approach proposed by OPPT for establishing lead standards for residential and commercial buildings is well conceived, clearly and systematically described in their two draft documents and appropriately conceptualized in Figure 1-1. However, there is one key component missing from the current rendition, i.e. the identification of the critical adverse health effect upon which the standard is to be based.
Selection of IQ as the adverse health outcome to protect against is well supported given the sensitivity of this response, its public health importance, and the strength of the evidence. There was some discussion over the appropriateness of the age range used by OPPT that spanned 1 to 6 years. The proposed approach can be strengthened with a focus on ages 1-3 y where increased susceptibility to both exposure and effects are observed.
For adult exposure within commercial and public buildings, EPA selected blood pressure changes as the adverse health effect to protect against. OPPT provides appropriate justification for this selected outcome (sensitive and strong supporting epidemiologic evidence), however, there is no discussion of neurotoxic effects on a developing fetus as a likely more sensitive adverse health effect of concern.
There are recognized advantages to the approach that OPPT has taken for the development of the dust-Pb standard. It is a mechanistic approach that includes a logical series of inter-connected compartments (models), each with its own data source and validation. At the heart of this “mechanistic” approach is the IEUBK model which has undergone extensive development and review (including SAB) and is broadly accepted by the scientific community. However, the approach as a whole, i.e. the assembly of the compartments as proposed by OPPT lacks validation. The Panel discussed the availability of recent epidemiologic data (Gaitens et al. 2009 and Dixon et al. 2009), which could be used for this purpose. These studies provide direct observations of observed dust loadings and their associated blood-Pb concentrations that take into account background and time-activity data within a representative population of susceptible individuals. The approach proposed by OPPT would benefit by a comparison of estimates derived from their approach relative to these epidemiologic observations.
There is a striking contrast between the two Lead Dust Standard documents (i.e. residential and commercial) in that whereas there is a plethora of data supporting the approach for the development of the residential hazard lead standards, there is little or no data to populate the models that make up the commercial building approach. For example, we have no data upon
1

which to establish the relationship between floor and sill lead-dust loading in commercial buildings or more importantly the relationship between lead loadings and adult blood-Pbs. As a result, as a necessity, the Commercial approach borrows extensively from the Residential literature introducing considerable uncertainty. The current EPA document identifies this limitation within the report details (e.g. pg 39, ln 10) but it is an important enough limitation to identify and briefly describe upfront within the Introduction. The lack of data to support the commercial building approach highlights the need for research and data collection efforts in this area.
Conversion of Dust-Pb Loading to Concentration
Within the context of the current “Proposed Approach” documents, the need to convert dust loadings to concentrations is counter-intuitive since loading is recognized as a more relevant metric of exposure and disease risk. The need for this conversion is to accommodate the blood-Pb models that are at the heart of both approaches. This is a recognized limitation to the IEUBK model that likely introduces considerable uncertainty in its estimate of blood-Pb from dust. One of the advantages of relying on associations observed from the recent epidemiologic studies described above is that this conversion would not be necessary, and accordingly, the introduction of this uncertainty avoided.
If OPPT relies on the current approach that requires conversion of dust-Pb from loading to concentration, for the residential standard, reliance on the statistical approach is justified since there are robust data that support it and it carries the advantage of real-world representation. There is considerable error in this predictive association as represented by the scatter in the data, but at least the error can be quantified. In contrast, in the case of commercial and public buildings where no data exist, it will be necessary to rely on alternative approaches such as the mass-balance model as proposed.
Relation of Sill Dust to Floor Dust
A very similar situation to conversion of dust-Pb loading to concentrations exists for estimating sill dust from floor dust, i.e. statistical models (with considerable uncertainty) are constructed from rich data sources for the residential environment but are entirely lacking for commercial and public buildings. In the absence of data relevant to commercial and public building, it seems reasonable to rely on the residential model. This extrapolation of the residential model to commercial and public buildings will introduce considerable uncertainty in the hazard standard.
Activity Patterns and Microenvironments
The approach proposed seems reasonable and is well justified with the exception of excluding dust-Pb (or soil) exposure while in a vehicle (pg 17, ln 11).
Blood Lead Modeling
The blood lead modeling plays a critical role in establishing the quantitative relationship between lead loading and blood lead concentrations deemed to be protective of health. OPPT has chosen to rely on mechanistic models (e.g. IEUBK) to establish quantitative relationships between exposure and blood-Pb concentrations. This approach is traditional and benefits from years of development and review. However, with the availability of more recent epidemiologic data from Gaitens et al. 2009 and Dixon et al. 2009 provide OPPT the opportunity to consider an alternative option of empirical models establishing direct linkages between dust-Pb loading and blood-Pb. As described above, at a minimum, these epidemiologic findings might be used to “truth” the multi-compartment mechanistic approach described within the current documents.
References
Dixon SL, Gaitens JM, Jacobs DE, Strauss W, Nagaraja J, Pivetz T, Wilson JW, Ashlety PJ. 2009. Exposure of U.S. children to residential dust lead, 1994-2004: II. The contribution of lead-contaminated dust to children’s blood lead levels. Environmental Health Perspectives, 117:468-474.
Gaitens JM, Dixon SL, Jacobs DE, Nagaraja J, Strauss W, Wilson JW, Ashley PJ. 2009, U.S. Children’s Exposure to Residential Dust Lead, 1999-2004: I. Housing and Demographic Factors Associated with Lead-contaminated Dust, Environmental Health Perspectives, 117:461-467.

Comments from Dr. Richard Canfield
1. Developing Lead Dust Standards for Residences
Proposed Approach
The present OPPT draft approach for developing lead dust hazard standards represents an ambitious and impressive effort by many talented scientists to create an empirically-based mechanistic model for predicting children’s blood lead levels from environmental media, and then to develop hazard standards based on that model. The model requires the estimation of environmental media concentrations, conversion of media concentrations to exposure concentrations, and exposure concentrations to children’s blood lead concentrations. By specifying a given target concentration in floor and sill dust and estimating the resultant blood lead concentration, it is hoped that the model will serve as a valid guide to protecting children from lead-related adverse health outcomes. This approach is well thought out, follows a tradition of similar approaches in related areas and, in my opinion, is likely to be the optimal approach.
Selection of Endpoint
Restricting the endpoint to psychometric intelligence seems very reasonable at this time. Although it is possible that other cognitive endpoints could prove more sensitive or more revealing of the nature of lead-related adverse effects, there is no other measure that provides empirically-verified and nationally-representative norms with adequate currency across a wide range of scientific, regulatory, economic, and public audiences.
Target Blood Lead Concentrations
The target blood lead concentrations of 1, 2.5, and 5 µg/dL appear reasonable, given the continuing absence of evidence for a threshold below which blood lead concentration is shown to have no effect on children’s cognitive functioning. Although data are scarce-to-nonexistent regarding the clinical significance of blood lead levels as low as 1 µg/dL, one is reminded that at one time levels less than 10 µg/dL seemed unlikely to be related to important health outcomes. At this time, I recommend using 2.5 µg/dL as the primary target blood lead concentration, but there is a need for data from well-designed and adequately powered prospective studies to examine effects at lower levels. Presently, the Boston cohort and the Rochester cohort contribute virtually all the data for blood lead levels less than 10 µg/dL to the pooled analysis study (Lanphear et al., 2005). Even when these studies are combined there are not many children with lead levels less than 5 µg/dL. I do not believe that the cross-sectional data based on NHANES are much relevant to the less-than-5 µg/dL question because we do not know the exposure histories of the children nor do we know much of anything about their childrearing environment. Additional empirical data are much needed to withstand criticism of any target value of less than 5.
4

Using concurrent blood lead measures during the age range under consideration is reasonable given the parameters from simple linear, semiparametric, and piecewise linear regressions based on Canfield et al. (2003) and Lanphear et al. (2005). It also appears that concurrent blood lead concentration during childhood reflects both cumulative exposure and contemporaneous exposure.
Conversion of Dust Loadings to Dust Concentrations
This key element of the Approach document proposes either a very straightforward empirical approach based on statistical regression or, from my perspective, a tremendously complicated set of modeling steps based on previous empirical work and models developed for related types of particulate contamination. My view of which approach is the preferred one has vacillated over repeated readings of Appendix A and discussion of this issue at the SAB meeting. In the end, I prefer the mechanistic mass-balance model. That said, I am not comfortable with many aspects of that enterprise, having to do mostly with the lack of empirical data, a lack of documentation of the performance of the models used to set input values, and its simplicity.
One issue to consider with the mechanistic modeling is the possible tradeoff between developing a “model of everything” versus several more focused models tailored to various types of residences, cleaning rates, and low vs. high loadings. Not surprisingly, the model performs very poorly at high loading values, but that is also true of the regression model and reflects dispersion of the raw data. It is possible that more focused models might be more closely tied to available empirical evidence and in this and other ways reduce uncertainties in how specific assumptions apply across situations. Would it be reasonable to conduct sensitivity analyses separately by groups and examine whether the same parameter assumptions function similarly in the smaller and larger models?
A specific concern in for the loading-concentration conversion is the modeling of tracking and resuspension rate. To what extent have numbers of persons living in the home, numbers of children, or crowding (people per room or square foot) been accounted for? My intuition is that some such measure would be an important factor.
The empirical model avoids the hard work of modeling the physical processes by treating the system as a “black box”. However, it also is vulnerable to questions of whether all relevant factors have been accounted for in the prediction of children’s blood lead levels. If previous research with a complex deterministic model shows that it can lessen the burden of creating a new statistical model for each new situation then I would prefer it.
Relation of Sill Dust to Floor Dust
A lack of empirical data leaves substantial uncertainty regarding the relation of sill dust to floor dust in estimating exposure. The most straightforward approach was used—relative surface area—which produces an estimated contribution of 1% from sills and 99% from floors. Importantly, this relation is being treated as constant across the age of the child. Although no empirical data exist to guide one in the choice of specific age-related differences in contribution, it seems clear that the contribution from sills will be greater for children who are able to mobile

enough and tall enough to come into direct contact with the sill, as compared to infants in the first or second year. Thus, the inclusion of child age into the regression model could be explored. The casual estimates cited in the CDC (2002) document could be used as a starting point, but the model could be tested for its sensitivity to a range of values.
Also, when comparing the results of regression modeling for the HUD and Rochester data it should be noted that the two data sets are focused on somewhat different ranges of floor and dust loadings. For example, after converting the natural log values from figures 6-1 and 6-2 it appears that minimum sill loading values for the HUD data are about 1 µg/ft2 whereas the minimum in the Rochester data is about 7 µg/ft2. The floor loading distributions are only slightly overlapping. Differences in the estimated regression parameters should be interpreted in this context. Finally, inspecting the relationship in figure 6-1 suggests a possible nonlinearity in the HUD data. At natural log floor loadings greater than 4 µg/ft2 the slope of the sill-load relation appears less steep than for values less than about 4. The data in that range are sparse, but might it be that measurement error plays a role or that regression to the mean is operating here? The Rochester data do not suggest an attenuated relationship a higher loadings.
Better understanding of the sill loading – floor loading relation seems dependent on additional empirical data.
Activity Patterns and Microenvironments
The methods used to characterize activity patterns and microenvironments appear sound and based on relevant empirical data. If indeed children up to age 6 spend nearly the same (and vast majority) of their time in the home, then including information about other microenvironments is less critical. However, it is surprising to see in table 3-2 that children ages 5 to 6 years spend only an average (mean) of 2 hours per day in a child occupied facility (COF) and half spend no time at all. Is that due to an averaging of week days and weekend days? Most children attend some form of day care or kindergarten for 4 or more hours per day at this age but that isn’t reflected in the data reported in the table. This leads me to question the CHAD data set and I suggest the quality of those data for preschool and school-aged children be reviewed.
Blood Lead Modeling
This, of course, is the critical question. There is a strong temptation to bypass complex mathematical modeling that includes a large number of parameters, estimates of which are not well supported in the literature in favor of a straightforward regression model that is readily understood. In my opinion, the existing data in this area should not be ignored. Their limitations should not be ignored, but they must be used as part of the validation process. In my opinion, the IEUBK model must continue to be developed for the purpose of setting hazard standards. However, large discrepancies between the results of IEUBK and the simple epidemiological model would be a cause of great concern, but that issue must be confronted. Thus, largely for the reasons cited in the Approach document, using the IEUBK model is appropriate and preferred. It would be premature to use the AALM model for this purpose.

2. Developing Lead Dust Standards for Commercial/Public Buildings
Proposed Approach
The general recursive 3-step approach of first selecting a target blood lead concentration, then estimating environmental media and exposure concentrations, and then estimating blood lead concentrations seems reasonable. However, I recommend separating step 3 into 2 steps by elevating sensitivity analyses/model validation to an explicit “step 4.”
Development of a Response Curve for the Blood Lead-Blood Pressure Relationship
It is not clear to me why blood pressure should be the outcome of primary interest for adults. I support the position that we should set the standards so as to protect the most vulnerable populations. The research indicates that the most vulnerable populations are the developing fetus, infants, and children (note that a particular age when lead exposure is substantially less damaging to a "child" has not been established).
A particular concern is that the assumption that “there may be some buildings in which children are unlikely to visit” seems to make an unwarranted distinction between adults and children. Any woman of child-bearing age might, with or without her knowledge, bring a developing fetus into a building. Any lead in a building would be a potential source of exposure to the fetus. Thus, I would prefer to classify buildings according to whether infants, children, and women of child-bearing age are likely or unlikely to visit. It is reasonable to assume that pregnant women might spend 40 hours per week in a public or commercial building if that is their place of employment. Thus, a possible standard could be that the allowable amount of lead in dust is defined to be an amount such that women employed full-time in the building would have a blood lead concentration of less than (for example) 2.5 µg/dL, when all other sources of her exposure (including re-exposure from endogenous bone-lead stores that are mobilized during pregnancy) are taken into account.
I am also concerned about the basing an adult standard on the existing data relating blood lead levels in adults to increased systolic and diastolic blood pressure. In particular, the degree to which a measure of blood lead in adults reflects recent exposure or exposure from remobilized bone lead is unclear and this is a critical issue for setting dust lead standards. For example, choosing 0.3 µg/dL as a blood lead level of concern in adults seems unreasonably low given that older adults were likely exposed to large amounts of airborne lead from automobile emissions—and possibly also exposed to large amounts of lead from paint—over a period of several decades. Enough lead might be stored in the bones of these individuals such that ongoing re-exposure could keep blood lead levels relatively high for decades. My expertise does not extend far into this area of adult exposure, but these sorts of issues have not been adequately addressed in the current draft document to support the 0.3 or 1 µg/dL standard. More clarity on these issues would require greater expertise among the SAB panel members in the domain of adult lead exposure and also on blood pressure as an outcome. This appeared to me to be a consensus opinion of members of the SAB. Thus, until such expertise is incorporated into the draft approach, and for the other reasons I stated above, my current position is that out of concern for
the unborn fetus, the lead dust standards for commercial and public buildings should be the same as for residences.
Conversion of Dust Loadings to Dust Concentrations
Please see the comment for this Section above.
Relation of Sill Dust to Floor Dust
Again, central issues relating to this charge question are somewhat beyond my expertise as a child developmental psychologist. Nevertheless, I would recommend that the estimate of the relative contribution of floor and sill dust lead for children and adults should take into consideration that adults have possibly unique exposure to dust on the desktop, which could be inhaled or ingested, although whether exposure from desktop lead is more similar to floor lead or sill lead probably depends on where the desk is located.
A problem in the development of all the regression models is that maximizing the correlation between sill loading and floor loading is not a basis for choosing a model based on the transformed data. This practice could be justified based on the presence of undue influence from extreme data values or as a way to avoid messy nonlinearities in the model or because it is most consistent with the theoretical sill-floor relationship. The rationale should be more fully presented.
Activity Patterns and Microenvironments
I recommend consideration of a separate grouping for women of childbearing age rather than the current age grouping of 18-24. The lack of data concerning the contribution of maternal exposure to fetal and infant exposure appears to be a significant source of uncertainty in the proposed model.
Blood Lead Modeling
Again, as a child developmental psychologist I have insufficient experience in the area of biokinetic modeling for adults to provide an authoritative evaluation of this issue. It was clear to me during the group meeting that there are several very qualified scientists on the panel who have offered their views on this question. I have no reason to question the consensus choice of the Leggett model.

Comments from Dr. Scott Clark
1. Developing Lead Dust Hazard Standards for Residences
Proposed Approach
There appears to be abundant epidemiological data with which to develop lead dust hazard standards for residences (for example, see material presented by Jacobs and others at the September 2008 National Healthy Homes Conference and in Dixon et al., 2009). It would be useful to compare the Dixon et al. NHANES results with those from the IEUBK and also to prepare a compendium of situations where results from the IEUBK model were compared with empirical data. Some such comparisons likely already exist or could readily be assembled. To facilitate comparison of the Dixon et al. NHANES results with those from the IEUBK, soil lead data from national studies such as that reported by Jacobs et al. (2002) could be integrated with it.
If EPA wants to use the IEUBK model to aid in setting dust lead standards that are expressed as loadings, consideration should be given to altering the model to use these lead loadings as the units of dust lead. Lead dust hazards are expressed in loading units because research indicates that lead exposure in children is best expressed in loading units rather than mass concentration (ppm). Therefore, it would appear to be logical that an exposure model with dust lead expressed in loading units would more accurately represent conditions resulting in childhood exposure.
The contribution to settled dust from fallout of air lead could be estimated based on particulate fallout data. Data on the resuspension of settled dust may be available from studies were interior lead dustfall data were collected. For example, in the Cincinnati Prospective Study, interior lead dustfall data, collected primarily in the first half of the 1980s were reported in units of mg of Pb per sq m per 30-days for housing of various types and conditions. The housing included public housing constructed from the late 1930s to the 1950s, private housing in satisfactory condition constructed after World War II and 19th century and early 20th century housing ranging from poor condition to rehabilitated. Although the housing in this study was located in the inner city neighborhoods of Cincinnati OH where the ambient air lead concentrations were expected to be the same, and ranged from 0.2 to 1.0 µg/m3 (Clark et al., 1985). Mean lead dustfall accumulation, mg of Pb per sq m per 30-days, varied widely among the housing types, from a geometric mean of 0.035 (post World War II private housing in satisfactory condition) to 0.199 (19th century housing in deteriorated or dilapidated condition). The correlation of the interior dustfall loading with interior dustfall concentration was 0.73, similar to that between interior floor surface dust lead loading and interior floor surface lead concentration, 0.72. The interior floor dust lead concentrations were much higher than that for interior dustfall lead for all housing types, ranging from 1.9 to 4.2 with an average of 3.0, suggesting that the sources of lead in the interior floor dust were different in some ways from those in the interior dustfall (Clark et al., 1991). See particularly Table 2 for the environmental
9

lead data by housing type and Table 3 for inter-correlations among the environmental lead variables.
The protocol for one of the study sites in the US EPA Urban Soil Lead Demonstration Projects contained the use of dustfall measurements. Some exterior dustfall data are available in the literature but for special circumstances. Hilts (2003) showed a decline in interior and exterior lead dustfall after installation of controls at a lead zinc smelter in Trail BC. Mucha et al. (2009) compared exterior lead dustfall adjacent to houses being demolished with levels exterior of other houses where demolition was not occurring.
Conversion of Dust Loadings to Concentrations
The conversion would not be necessary if epidemiological data were being used to develop the standards since most interior dust lead measurements yield data that are in loading units (µg Pb/sq ft), the units of the standards being developed, or if the blood lead models are used were able to use dust lead loading data.
Although in general a mechanistic or rational model is preferable since it could be considered for use in other situations as well, a large number of assumptions need to be made. Its use thus would require “verification” with a number of sets of empirical data to test the reasonableness of the assumptions involved. Such an overall approach might be considered. If time and the availability of existing databases were limited, my preference would be to use the empirical approach involving data produced in epidemiological studies.
Following are some specific comments on each approach.
Empirical Approach
P. 9, line 34 - The vacuum samples in the studies mentioned may also have levels reported in ppm. Vacuum samples generally involve the collection of a mass of dust from a measured area using a nozzle connected to a pump producing a vacuum. The analysis of the mass of dust results in the determination of the quantity of lead in the sample. If the weight of the sample is determined then the parts per million of lead can be calculated.
P. 9, lines 42-43 - Both wipe and vacuum samplers have some inefficiencies and the relative amounts of lead dust captured by each varies by factors such as surface type. There have been a number of studies comparing wipe and vacuum dust collection methods (Reynolds S, 1997).
P. 10, lines 5-10 - Each of the three study sites of the EPA Urban Soil-Lead Demonstration Project (Baltimore, Boston and Cincinnati) used a vacuum sampling method to collect dust from interior floors, window sills and window wells. It would be useful to examine reports from these projects to determine the extent of the data available to compare dust lead loading with dust lead concentration. Although the housing in the Soil Project was not representative of US housing, a range of housing was included that may provide results of use in

comparison with results of the empirical and mechanistic approaches outlined in this document for housing of the same age.
Mechanistic Model
Pages 10-12 - Some information on the lead deposition from the air inside houses is available from the literature. For example, in the Cincinnati Prospective Study, interior lead dustfall data have been reported in units of mg of Pb per sq m per 30-days for housing of various types and conditions. Mean lead dust accumulation ranged among the housing types from 0.025 to 0.22 (Clark et al., 1985). The correlation of the interior dustfall loading with interior dustfall concentration was 0.73. The interior dustfall lead concentrations were much lower than that for interior surface dust for all housing types (Clark et al., 1991) which suggests that there are differences in the sources of lead in surface dust and recently settled dust (as measured in dustfall) and that the floor dust presents a higher risk to the health of children than the current dustfall lead. The protocol for one of the study sites in the US EPA Urban Soil Lead Demonstration Project (Cincinnati) contained the use of dustfall measurements. Other dustfall data are available in the literature and some were cited previously in the response to Charge Question 1.
Pages 10-11 “Chip Fraction” - Although walls have the largest surface area in housing, other areas of the house where lead paint leaves the surfaces and becomes dust also need to be mentioned such as doors, windows, ceilings, floors etc . Much attention is given in the literature to “friction” and “impact” surfaces as sources of lead dust. Most of these areas often have much higher lead content (mg/sq cm) than walls. Expanding the ‘chip fraction” term can be accomplished by changing the name of the “Chip Fraction” term or adding additional terms. In addition, the removal processes should be expanded to include “intentional” removal such as occurs in renovation, remodeling and painting (RRP) activities as well as in activities whose primary purpose is for lead hazard control activities. It is important that RRP and lead hazard control attention is not limited to paint coming from walls.
Pages 10-11 - It is not clear if the tracking in of lead dust is fully covered by use of the mat factors. It would be useful to determine if this factor can be examined in data sets that contain information on the extent and lead content of bare soil near the house, data on track in-related factors (numbers of children, adults and pets) and lead levels in exterior dust.
P. 10, line 13 - The material tracked into houses is not just soil but contains a variety of other “dust” materials. It may be more clearly called “dust/soil”.
P. 10, line 14 - Removal also occurs from “tracking out of” the house.
P. 10, line 15 - Does “lead and particulate” refer to “lead and non-lead particulate”?
P. 10, lines 18-20 - The “cooking” source of mass should be expanded to include other food-handling and eating activities, perhaps by calling it “food-related” sources. It may be useful to have another term representing clothing, furniture and carpet type sources of mass.

P. 10, lines 21-23 - In the HUD Evaluation data set, season of sample collection was a predictor of window sill. Window trough and interior floor dust lead loading levels and it has been found to be a significant factor in other studies also.
P. 11, line 15 - Cleaning efficiency is a function of the method used and frequency of use and cleanability of the surface; cleanability of surface does not appear to be included in the proposed model.
Relation of Sill Dust to Floor Dust
Uncertainties involved in this conversion would not occur if an empirical approach using epidemiological data was selected.
Use of a weighting strategy based on relative surface area alone does not seem to adequately represent the location of the window as a portal to the outside environment and as a component that usually has much higher lead content (higher paint content and higher dust lead loading )than floors. The area weighting method treats windows as a “mis-placed floor area” that is just another floor area that happens to be located at a different location.
P. 28, lines 1-2 - The impact of window sills should be increased somewhat from the surface area ratio to account for the movement of sill dust lead to nearby floor locations. Models often indicate that window dust lead loading is a predictor of floor dust lead loading. For example, see Figure 8-15 on pp. 8-44 in the Final Report of HUD Evaluation. Window sill lead loadings are correlated with floor loadings (Clark et al., 1991). A regression approach may be reasonable to use. However, it should first be determined how variable the correlations are from situation to situation. There have been some studies which measured floor dust levels near windows in comparison with floor areas elsewhere in the room.
P. 28, line 24 - There likely are data available from HUD Evaluation that can be used. The Rochester study represents target housing and the Evaluation would be useful in that it is a much larger data base of target housing in many areas of the country.
Activity Patterns and Microenvironments
There are numerous assumptions that need to be made for use of these models which involve numerous sources of uncertainty. These uncertainties could be avoided if another approach was used.
The table of media concentration by microenvironment type (Table 3-1) does not account for exposures from paved or other hard-surface areas outside the home such as exterior entryways. A number of studies have found that lead concentrations on these areas are much higher than soil lead concentrations. For example, in a publication from the HUD Evaluation (Clark et al., 2004) the concentration of lead in exterior entry dust was almost 60 % higher than that of perimeter soil. There may not be enough data nationwide to include this factor but it should be mentioned as a limitation of the approach, if not used.
Some useful data may be available from the HUD Evaluation where data was collected on “Number of Hours Away from Home per Week”, “Number of Hours Inside the House per Week” and “Number of Hours Outside the House per Week” (Table I, List of Variables Used in Pre-intervention Blood/Dust Lead Structural Equations Models, Compendium to the Final Report.)
P. 16 - A portion of the lead dust on the floors comes into the house through the windows and may be deposited temporarily on the window sills before a portion moves to the floors. Another pathway is from the floor of the exterior entry to the housing unit to the interior entry floor to the other floors inside the house. A gradient along this pathway was documented in a subset of 541 housing units from twelve grantees in the HUD Evaluation (Succop et al., 2004). Modeling of data from the HUD Evaluation (see page 8-15 of HUD Final Report) also showed a pathway leading from window sill dust lead loading to floor dust lead loading.
P. 27, line 23 - This sentence would be clearer if the word “building” was inserted between “commercial” and “soil”.
Blood Lead Modeling
In my opinion, shared by a number of other members of the Review Panel, the epidemiological approach needs to be used to determine the dust lead hazard control levels that would result in the blood lead goals being met. Performing a side-by-side analysis using the IEUBK method would be a useful exercise also. Such a comparison may reveal ways that the IEUBK can be modified to directly use chemical contaminant loading level (µg contaminant/ sq ft). If there are long term plans to continue to use the IEUBK model in the future for the development of dust lead loading hazard levels, or for other surface dust loadings of contaminants, that efforts should be made to modify the model to permit the direct use of use dust lead loading. Using a model that requires mass concentration data to determine a hazard level in surface loading units seems to be a fundamentally flawed approach.
Also see other comments under Proposed Approach.
2. Developing Lead Dust Hazard Standards for Public and Commercial Buildings
Proposed Approach
The definition of the public and commercial buildings of concern needs to be spelled out in more detail than what was in the initial approach document. This document indicates that public buildings under consideration are those built prior to 1978 and that there are no limitations on commercial buildings. At the July 6-7, 2010 meeting, schools were discussed as being an important category of public buildings. Schools serving children six years of age and younger, either as regular students or in such other programs such as “after school” programs are already covered as Child-Occupied-Facilities and would be treated the same as residential areas for the purpose of this project. Private schools should also be included. Other public buildings that need to be considered are libraries, museums, public assembly areas. Would publicly-financed

sports, musical and other entertainment facilities be treated as public or commercial buildings? This distinction may seem trivial but if it was decided that they would be public buildings then only these built pre-1978 would be covered. Commercial buildings such as retail stores (including eating establishments) where children are allowed to enter are covered. It is possible that older commercial buildings such as stores and restaurants, especially those located on the ground floor where the upper floors are residential areas, have high lead paint. Some data on lead levels in these commercial areas may be available in publicly-funded lead hazard control projects involving some commercial space in a predominantly residential project.
The blood lead levels from existing data represent the integration of exposures from various locations of exposure such as the residence, neighborhood, traveling, other child-occupied building and commercial/public buildings. Hazards developed for each of these locations, in the present case residences and commercial/public buildings, taken together, need to be protective enough to meet the blood lead objectives. Thus, standards for each need to be developed in some coordinated fashion.
As has been mentioned earlier, an underlying and very serious weakness of the approach described in the documents provided to us is that the blood lead model for children used requires lead input dust lead data as mass concentration (ppm) while the dust hazard standards, and much of the available environmental data for lead dust, are expressed as surface loading (micrograms of lead per square foot). Uncertainties are thus unavoidably introduced by assumptions used in the procedures for converting surface loading data to mass concentration data.
Some specific comments on the approach are:
P. 14, lines 19-20 - Support is needed for the assumption that while in an automobile the occupants will not come into contact with lead in dust or soil. A number of studies document elevated lead levels on the floor mats and elsewhere in cars. (See comments for lines 14-19 on page 16). Although most of these deal with occupational exposures, they do demonstrate the “track in” that goes on with cars and that can occur from non-occupational sources as well. Given the small intakes expected from the air, the intake of lead from dust/soil in cars may be in the same range or higher. Because food and snack consumption in cars is very common, it is plausible to consider that associated hand to mouth activity may result in intake of present on the children’s hands from upholstery et al. Thus it may be necessary to reconsider the “not needed” decision in Table 3-1 for floor dust lead concentration while “Traveling”.
P.15, lines 18-21 - Will the existing databases be used in some fashion to adjust selected standards so that compliance with the selected hazard standards for floors and sills are the same? Data from the HUD Evaluation and elsewhere do not indicate equal compliance with floor and window sill standards in the same dwelling unit as illustrated in the next paragraph. Since window sill and floor dust lead are strongly correlated, especially for individual studies, it is reasonable to expect that with careful adjustments, equivalent compliance with each standard may on average be attained in the same dwelling unit.
How “equal” is it planned to make the compliance with the floor and window sill standards and why is it important? It is likely that for any given group of housing units, there

will be a certain degree of difference in compliance with the two standards. If there is confidence in the establishment of the numerical standard, it would seem that differences in compliance would indicate that health hazards are likely to occur more often in one of the two locations and that additional remediation is needed there. In environmental surveys it is frequently reported that the compliance with dust wipe standards varies between floors and windows. Two examples are cited. In the HUD Evaluation (Final Report, Table 8-4, page 8-14) at pre-intervention the percent of the 1,034 dwelling units with at least one interior floor dust loading at or above 40 µg/sq ft was fifty-six (56) compared to sixty-seven (67) for window sills. At one year post intervention the percentages were thirty-three (33) and twenty-five (25), respectively. In a study of a cross-section of housing in Delhi, India thirty-one (31) percent of the floor dust wipe samples exceeded the US limit of 40 µg Pb/sq ft while only fourteen (14) percent of the window sill wipe samples exceeded the limit of 250 µg/sq ft (Kumar et al., 2009).
P.16, lines 14-19 - This will change if non-air exposures, such as ingestion of lead dust from surfaces within the automobile, are assumed to occur while traveling. There are some workplace studies of the carry home of lead dust that have included dust loading measurements in the automobiles of lead workers and of controls. Results of some of these studies are summarized in Chapter 2 of the NIOSH Workers’ Home Contamination Study (NIOSH, 1995). Other data of use may be available in NIOSH Health Hazard Evaluation reports (NIOSH, 2001). In one of these studies (Piacitelli et al., 1997), surface dust lead levels were measured in the automobiles of the lead workers and of a control group. Lead loadings expressed as µg Pb/ sq ft in the autos of the control group were as follows: floors 23.1, seat 3.8, and arm rest 17.6.
P.36, lines 17-22 - It would be interesting to compare lead dust concentrations from the vacuum samples with the lead dust concentrations that are obtained by converting the dust wipe loading data by the methods being developed. This could be accomplished using data sets that included dust wipe loading data and vacuum data in loading and concentration.
P.39, lines 7-8 - Window sill dust lead loading and interior entry dust lead loading were each found to be predictors of floor dust lead loading in the HUD Evaluation at pre-intervention. (See page 8-24 of the HUD Final Report). The interior entry dust samples were wipes collected just inside the entry to the dwelling unit from either an area exterior to the building or from a common area, depending upon the building. Window sill dust lead loading has also been shown to be a predictor of floor dust lead loading in other studies.
Blood Pressure Endpoint for Adults
The use of the results of the meta analysis in Nawrot et al. (2002) appears to be a reasonable approach but my knowledge in this area is very limited.
Conversion of Dust Loadings to Concentrations
See comments on Conversion of Dust Loadings to Concentrations in Section 1 above. In the absence of sufficient data from epidemiological and other studies, it appears that there may be a need to develop a mechanistic model for public and commercial buildings. Some data on lead dust loading levels in schools are available in a NIOSH Health Hazard Evaluation involving
school buildings (NIOSH, 1996). The geometric mean level on desks (µg/sq ft) were 23 in non-abated rooms and 15.4 in abated rooms.
A major category of public buildings would likely be schools, other than those that are already classified as child-occupied-facilities. Presumably libraries and museums are other major categories. Whether or not privately owned schools (including parochial schools) and other privately owned facilities such as museums are defined as public or commercial may already have been determined. It needs to be made clear in the document, although if the approach to both categories is the same, the practical implications may not be many.
Do adults in commercial buildings include volunteers who may often be in the buildings but are not employees?
This may likely be an area that needs more data before exposures can be examined for purposes of developing standards. If there is no available evidence of lead levels above proposed levels in commercial buildings built after 1978 (even if there is not an age limit for these buildings), is it appropriate to establish such limits when available exposure data is so sparse? Presumably, the existence of a standard would require testing for lead on certain occasions, such as when renovations occur, or ownership changes.
For adults a floor dust lead hazard standard may not be as appropriate as one for a surface such as a table desk top or keyboard. The US EPA Environmental Response Training Program (ERTP) has, in recent years, been developing methods for sampling of a variety of materials that could be used in chemical, biological or nuclear terrorism and related actions. Some of these methods are designed to collect dust from surfaces and some resemble dust sampling as is used for collecting dust lead wipes. Other methods are designed to obtain samples from working surfaces such as computers and keyboards. It might be useful to contact the ERTP to determine if they are aware of any data from buildings, or for the interpretation of such data, that might be useful in the current project.
Neighborhoods of public/commercial buildings may have exposures that are significant for public/commercial buildings such as industrial sources (e.g. foundries, paint removal operations).
The specific population groups for which the proposed lead hazard standards are being developed should be spelled out.
COF applies to children six and under so other schools [middle schools and above that are not otherwise COFs because of other uses such as ‘after school’ programs involving 6 and under] not included.
Relation of Sill Dust to Floor Dust
Please see comments on Relation of Sill Dust to Floor Dust in Section 1 above.
For adults do we want to consider a more relevant exposure location such as table tops/work areas?
Suggest considering a study of schools that are not COF that includes floor, table top and window sill Pb data in concentration and loading.
Could NHANES houses already sampled be revisited to collect soil lead data? Could the public/commercial buildings used by the populations included in the survey and then sampling those?
Activity Patterns and Microenvironments
Please see comments on Activity Patterns and Microenvironments in section 1 above.
While the overall approach appears to be reasonable, if these data are needed for the overall approach selected, some of the values in Tables 3-2 and 3-3 do not. For example, the increase in average and median time spent outdoors does not increase as much as expected from 1-2 years to 5-6 years. The median time spent outdoors for adults also seems low and more differences in travel time by age were expected. Do the data in Tables 3-2 and 3-3 include input from the other studies mentioned on lines 34-37 of page 20?
P. 26, line 15 – Have other studies of air lead inside housing been located? Dr. Shane Que Hee performed a pilot study on this in Cincinnati. As I recall, the interior levels were about three fourths as high as the exterior levels.
P. 27, line 23 – Would be clearer if the word “building” was inserted between “commercial” and “soil”.
P. 37, line14 – The occupational health literature contains potentially useful data on the air lead levels for groups such as traffic police.
Blood Lead Modeling
See comment on use of IEUBK model in Proposed Approach and Blood Lead Modeling in Section 1.
The challenge in using any model is the absence of available data on lead levels in public and commercial buildings.
EPA may consider indicating the sparseness of the literature on environmental lead data in public/commercial buildings that are needed to develop lead hazard standards, requesting that those aware of such data to bring it to the attention of the USEPA.
Superfund adult blood lead model now available- version/alternative to all ages model was mentioned.
Leggett model use for adults seems reasonable.
P. 42, Table 6-2, last column, 4th sentence – change to “It was assumed that rainy days were associated with all INDOOR DUST ingestion ….” [In the document it was stated as ALL OUTDOOR SOIL/DUST]
References:
Clark CS, Bornschein RL, Succop P, Que Hee SS, Hammond PB, and Peace B. 1985. Condition and Type of Housing as an Indicator of Potential Environmental Lead Exposure and Pediatric Blood Lead Levels. Environmental Research 38: 46-53.
Clark S, Bornschein R, Succop P, Roda S, and Peace B. 1991. Urban Lead Exposures of Children in Cincinnati, Ohio. Chemical Speciation and Bioavailability, 3(3/4):163-171.
Clark S, Menrath, W, Chen M., Succop P, Bornschein R, Galke W, Wilson J. 2004. The Influence of exterior dust and soil lead on interior dust lead levels in housing that had undergone lead-based paint control. Journal of Occupational and Environmental Hygiene, 1, 273-282.
Dixon SL, Gaitens JM, Jacobs DE, Strauss W, Nagaraja J, Pivetz T, Wilson JW, Ashlety PJ. 2009. Exposure of U.S. children to residential dust lead, 1994-2004: II. The contribution of lead-contaminated dust to children’s blood lead levels. Environmental Health Perspectives, 117, 468-474.
Hilts SR. 2003. Effect of smelter emission reductions on children’s blood lead levels. Science of the Total Environment, 303: 51–58.
Jacobs DE, Clickner RL, Zhou JL, Viet SM, Marker DA, Rogers JW, et al. 2002. The prevalence of lead-based paint hazards in U.S. housing Environ Health Perspect 110: A599–A606.
Kumar A. and Clark S. 2009. Lead loadings in household dust in Delhi, India, Indoor Air, 19:414-420.
Mucha AP, Stites N, Evens A, MacRoy PM, Persky VW, Jacobs DE: Lead dustfall from demolition of scattered site family housing: Developing a sampling methodology. Environ Res 2009; 109: 143-148
National Center for Healthy Housing and University of Cincinnati Department of Environmental Health, 2004. Evaluation of the HUD Lead-based Paint Hazard Control Grant Program. Final Report, Washington, DC.
NIOSH. 1995. Report to Congress on Workers’ Home Contamination Study Conducted Under the Workers’ Family Protection Act (29 U.S.C. 671a), U.S. Department of Health and Human Services, September, 1995.

NIOSH. 1996. Health Hazard Evaluation Report, HETA 96-0140-2606, October 1996
NIOSH. 2001. Health Hazard Evaluations: Issues related to occupational exposure to lead, 1994 to 1999. Centers for Disease Control and Prevention. DHHS (NIOSH) Publication No. 2001-113.
Piacitelli GM, Whelan EA, Sieber WK, Gerwel B. 1997. Elevated lead contamination in homes of construction workers. Am Ind Hyg Assoc J 58:447–454.
Reynolds SJ, Etre L, Thorne PS, Whitten P, Selim M, and Popendorf WJ. 1997. Laboratory comparison of vacuum, OSHA, and HUD sampling methods for lead in household dust. Amer. Indus. Hygiene Assoc. 58:439-446.
Succop PA, Clark CS, Chen M, Galke W. 2004. Imputation of data Values that are Less Than a Detection Limit, J. Occupational and Environmental Hygiene 1:436-441. (2004)

Comments from Dr. Kim Dietrich
1. Developing Lead Dust Hazard Standards for Residences
Proposed Approach
Both draft documents are well written and organized with informative supporting tables, figures, and appendices. The three primary steps proceed logically from the selection of a target blood lead concentration range, estimation of environmental media within microenvironments and exposure concentrations and finally to an estimate of blood lead concentrations under different environmental conditions, activity patterns, and ages.
Revised Comments
My comments on the overall draft approach remain largely unchanged. However, as noted below some of my initial views have changed as the result of the discussion that took place during the meeting as well as a review of the preliminary comments of the other SAB consultants.
Selection of Target Blood Lead Concentrations and IQ
In light of current neuroepidemiological data on lead exposure and cognitive and behavioral effects in children, the target blood lead concentrations appear to be reasonable. The targeted range of blood lead concentrations from 1-5 µg/dL reflect data indicating associations with childhood IQ that extend below 10 and perhaps below 5 µg/dL (several critical studies cited in the Draft Document). Although the focus on IQ is appropriate given the enormous amount of data on this outcome and several supporting meta- and pooled- analyses, effects on neurodevelopmental indices other than IQ have also been observed (as acknowledged in the Draft Document with several critical studies cited). One group of studies that are not referenced in the document in support of so-called subclinical lead effects are the modern neuroradiological studies of brain anatomical development and function. These studies are important in that they lend key independent and strong objective support for previous studies utilizing largely observational measures of psychometric intelligence, educational achievement, attention/executive functions, behavior, etc. that may be subject to greater bias. They also provide more direct evidence of central nervous system harm to key areas of the brain involved in cognition and behavior such as the prefrontal cortex.
For example, Trope and colleagues were the first to apply magnetic resonance imaging (MRI) and magnetic resonance spectroscopy (MRS) to the evaluation of lead-exposed subjects (Trope, Lopez-Villegas, & Lenkinski, 1998; Trope, Lopez-Villegas, Cecil, & Lenkinski, 2001). Trope et al. (2001) performed MRI and MRS studies on a sample of 16 subjects with a history of elevated blood lead levels (23 to 65 µg/dL) prior to 5 years of age. The average time of evaluation was 8 years. Compared to age-matched controls composed of siblings or cousins without a history of undue lead exposure (i.e., < 10 µg/dL), lead-exposed subjects exhibited a
20
significant reduction in N-acetylaspartate:creatine and phosphocreatine ratios. N-acetylaspartate is a metabolite shown to decrease in processes that involve decreased neurononal densities and neuronal loss. The results of Trope et al. have recently been replicated by a similar study in China (Meng, Zhu, Ruan, She, & Lao, 2005).
Using functional MRI, the influence of childhood lead exposure on language function was examined in a subsample of 48 young adults from the Cincinnati Lead Study (Yuan et al., 2006). Subjects performed an integrated verb generation/finger tapping paradigm. Higher childhood average blood lead levels were significantly associated with reduced activation in Broca’s area, a recognized region of speech production in the left hemisphere. Higher blood lead levels were also associated with increased activation in the right temporal lobe, the homologue of Wernicke’s area which is associated with speech perception. These associations were statistically significant following adjustment for covariates that were also predictive. These included the subject’s own IQ score, birth weight, and marijuana consumption as assessed by a positive urine screen. The results of this study suggest that elevated childhood blood lead levels influence neural substrates of semantic language function, with concomitant recruitment of contra-lateral regions resulting in a striking, dose-dependent atypical reorganization of language function.
Using volumetric MRI, Cecil and colleagues also examined a subset of the Cincinnati Lead Study cohort (Cecil et al. 2008). In studies of 157 subjects between the ages of 19 and 24 years (mean age = 22 years), analyses of whole brain MRI revealed significant decreases in brain volume associated with childhood blood lead concentrations. Following adjustment for other significant predictors including age at time of imaging and birth weight, the most affected regions were within the frontal gray matter, specifically the anterior cingulate cortex and ventrolateral prefrontal cortex which are areas associated with executive functions, including mood regulation, decision-making, and interpretation of sensory inputs. Areas of lead associated gray matter volume loss were larger for males. In a related study, these investigators examined the association between age of childhood blood lead measurement and adult gray matter volume (Brubaker, et al. 2010). As noted in the SAB Draft Document, target blood lead concentrations in the older (5-6-year-old child) may be critical in that several epidemiological studies have observed stronger associations between blood lead concentrations measured later in life and decreased cognitive abilities and increased behavioral problems. In this study, it was found that the extent of prefrontal gray matter loss associated with yearly childhood (1-6 years) blood lead concentrations increased with advancing age of the subjects.
Brubaker, et al. (2009) also found altered myelination and axonal integrity in adults with a history of childhood lead exposure in a diffusion tensor imaging (DTI) study. Ninety-one Cincinnati Lead Study subjects participated. Results of this study indicated multiple insults appearing as distinct patterns of white matter diffusion abnormalities in the adult brain. This study suggests that childhood lead exposure is associated with a significant and persistent impact on white matter microstructure as quantified with diffusivity changes suggestive of altered myelination and axonal integrity.
The specifics of these studies are not crucial for purposes of the SAB Consultation Draft Document, but they should be referenced as supporting material.

References
Brubaker, C.J., Schmithorst, V.J., Haynes, E.N., Dietrich, K.N., Egelhoff, J.C., Lindquist, D.M., Lanphear, B.P., Cecil, K.M. (2009). Altered myelination and axonal integrity in adults with childhood lead exposure: A diffusion tensor imaging study. Neurotoxicology, 30, 867-875.
Brubaker, C.J., Dietrich, K.N., Lanphear, B.P., Cecil, K.M. (2010). The influence of age of lead exposure on adult gray matter volume. Neurotoxicology, 31, 259-266.
Cecil, K.M., Brubaker, C.J., Adler, C.M., Dietrich, K.N., Altaye, M., Egelhoff, J.C., Wessel, S., Elangovan, I., Jarvis, K., & Lanphear, B.P. (2008). Decreased brain volume in adults with childhood lead exposure. PLoS Medicine, 5, 741-750..
Meng, X.M., Zhu, D.M., Ruan, D.Y., She, J.Q., & Luo, L. (2005). Effects of chronic lead exposure on H MRS of hippocampus and frontal lobes in children. Neurology, 64, 1644-1647.
Trope, I., Lopez-Villegas, D., Cecil, K.M., & Lenkinski, R.E. (2001). Exposure to lead appears to selectively alter metabolism of cortical gray matter. Pediatrics, 107, 1437-1443.
Trope, I., Lopez-Villegas, D., & Lenkinski, R.E. (1998). Magnetic resonance imaging and spectroscopy of regional brain structure in a 10-year-old boy with elevated blood lead levels. Pediatrics, 101, e7.
Yuan, W., Holland, S.K., Cecil, K.M., Dietrich, K.N., Wessel, S.D., Altaye, M., Hornung, R.W., Ris, M.D., Egelhoff, J.C., & Lanphear, B.P. (2006). The impact of early childhood lead exposure on brain organization: A functional magnetic resonance imaging study of language function. Pediatrics, 118, 971-977.
Revised Comments
My comments on the selection of target blood lead concentrations of neurodevelopmental concern and IQ as the core outcome are largely unchanged. However, some consultants opined that restricting the endpoint to psychometric intelligence may be too limiting. Indeed, IQ may not be among the most robust or persistent outcomes related to fetal and childhood lead exposure. Measures of specific abilities in the realms of attention and executive functions are often more sensitive than global assessments of intelligence in recent studies (e.g., Canfield, et al. 2003; 2004). Furthermore, recent studies of subjects exposed to low to moderate levels of lead in-utero and postnatally have shown that disturbances in conduct and behavior may be equally or more important than so-called subtle deficits in cognitive functioning (Needleman, et al. 2004; Wright, et al. 2008). Nevertheless, IQ has been assessed by nearly every modern study of childhood lead exposure and remains the outcome most often used by econometricians in their

assessments of the economic and human impact of childhood lead poisoning (e.g., Grosse, et al. 2002).
There was a brief discussion regarding maternal blood lead concentrations and reproductive endpoints (e.g., birth weight, prematurity, SGA) as targets. Indeed, it is important to remember that the current United States Centers for Disease Control action level of 10 µg/dL (USCDC, 1991) established under the George H.W. Bush administration and Dr. Louis Sullivan in 1991 was based largely on cord blood lead concentrations and infant neurodevelopmental outcomes obtained in a single study conducted in Boston (Bellinger et al. 1987). This is not recommended for a number of reasons. First, the vast majority of studies have found that postnatal blood lead concentrations are more predictive of longer term outcomes such as IQ in later childhood (e.g., Lanphear et al. 2005), and if effects are present at all they are greatly diminished in later neurodevelopmental assessments in the prospective studies and/or after adjustment for postnatal lead exposure (Braun and Lanphear, 2007). Second, the measurement and epidemiological analysis of reproductive outcomes presents special challenges that are likely to be outside of the scope of this assignment.
References
Bellinger, D., Leviton, A., Waternaux, C., Needleman, H., Rabinowitz, M. (1987). Longitudinal analyses of prenatal and postnatal lead exposure and early cognitive development. New England Journal of Medicine, 316, 1037-1043.
Braun, J.M., Lanphear, B.P. (2007). Comments on ‘Lead neurotoxicity in children; is prenatal exposure more important than postnatal exposure?’ Acta Paediatrica, 96, 473-474.
Canfield, R.L., Kreher, D.A., Cornwell, C., & Henderson, C.R. (2003). Low-level lead exposure, executive functioning, and learning in early childhood. Child Neuropsychology, 9, 35-43.Canfield, R.L., Gendle, M.H., & Cory-Slechta, D.A. (2004). Impaired neuropsychological functioning in lead-exposed children. Developmental Neuropsychology, 9, 35-53.Grosse, S.D., Matte, T.D., Schwartz, J., Jackson, R.J. (2002). Economic gains resulting from the reduction in children’s exposure to lead in the United States. Environmental Health Perspectives, 110, 563-569.
Lanphear, B.P., Hornung, R., Khoury, J., Yolton, K., Baghurst, P., Bellinger, D.C., Canfield, R.L., Dietrich, K.N., Bornschein, R., Greene, T., Rothenberg, S.J., Needleman, H.L., Schnaas, L., Wasserman, G., Graziano, J., & Roberts, R. (2005). Low-level environmental lead exposure and children’s intellectual function: An international pooled analysis. Environmental Health Perspectives, 113, 894-899.
Needleman, H.L. (2004). Lead poisoning. Annual Review of Medicine, 55, 209-222.USCDC (1991). Preventing lead poisoining in young children. Atlanta, Georgia: US Department of Health and Human Services, CDC.

Wright, J.P., Dietrich, K.N., Ris, M.D., Hornung, R.W., Wessel, S.D., Lanphear, B.P., Ho, M., Rae, M.N. (2008). Association of prenatal and childhood blood lead concentrations with criminal arrests in early adulthood. PLoS Medicine, 5, 732-740.
Conversion of Dust Loadings to Dust Concentrations
As outlined in the Draft Document, both the Regression (empirical) and Mechanistic Mass Balance Models have their own unique strengths and limitations. The Regression or “empirical” model is based on a nationally representative set of data (HUD) with samples taken from different ages and types of homes, soil concentrations, and indoor lead paint concentrations. However, the regression equation in the empirical model can only be reliably applied to residential exposure scenarios within the range of the original data set. One limitation in common to both models is the lack of data on window sill lead loadings and concentrations as inputs.
Overall, the Mechanistic Mass-Balance Model has a number of important strengths, including extension of the model to public and commercial buildings, and incorporation of house-to-house variability (i.e., loading to concentration conversion to incorporate house-to-house variability). The multi-compartmental, multi-factorial, dynamic, and temporal nature of the Mechanistic model as illustrated in Figure A-2 in the Draft Document is also appealing given the complex nature of these relationships, and ultimately, the model’s relationship to human blood lead concentrations. These input values for this comprehensive multivariable model were taken, when available, from an extensive review of the literature as outlined in Table A-3. When calibrated to and compared to other data sets (HUD and others) the model seems to do reasonably well. Sensitivity analyses illustrated in Table A-6 indicate that none of the model inputs are particularly influential, although cleaning frequency, floor loading, house volume, and cleaning efficiency are relatively more influential based upon the elasticities. Based upon these results and as noted in the Draft Document, the model should sample both house volume and floor area loading in any future implementation. Another potential limitation which probably will not be resolved for this model is that exposure gradients cannot be accounted for (i.e., the residence or building is treated as a uniform environment).
Relation of Sill Dust to Floor Dust.
The Mechanistic model will require a single input for interior residential dust lead concentrations that combines floor and sill surfaces; thus an estimation of the quantitative relationship between window sill and floor dust lead loadings is needed. The lack of data on this association is a limiting factor. The empirical or regression method appears to be an adequate if not perhaps the only option for the approach. Two potential data sets are discussed (HUD and Rochester). One factor that is not considered in the Draft Document on this topic is the possibility that the age and condition of the housing may impact this relationship. This could be further explored in the HUD and perhaps the Rochester data sets. Additional literature search and further work on establishing a valid empirical approach to this problem is proposed in the Draft Document.

Revised Comments
These comments are related to charge questions 2 and 3 regarding the estimation of environmental media and exposures. As noted above, the mechanistic model is elegant and can be adapted to residential as well as commercial properties. Most of the parameters necessary for a reasonably sufficient specification of a model of environmental media sources and exposures appear to be included. However, as noted by several other SAB consultants, being removed from the actual assessment of dust lead loadings or concentrations adds uncertainty as to the validity of this approach. Ultimately, the mechanistic model will need to be verified against the empirical data to test the validity of the assumptions involved but this raises the issue of the time and effort needed to accomplish this as well as the availability of suitable data sets. At least for residences, the empirical approach seems preferred. A reasonable approach may be to utilize the regression or empirical model for residences and the mechanistic model for non-residential structures. Furthermore, as noted by several consultants, there appears to be sufficient empirical data estimating the relationship of floor dust lead loading and window sill dust lead loading with children’s blood lead concentrations (e.g., Dixon, et al. 2009).
Dixon, S.L., Gaitens, J.M., Jacobs, D.E., Strauss, W., Nagaraja, J., Pivetz, T., Wilson, J.W., Ashlety, P.J. (2009). Exposure of U.S. children to residential dust lead, 1994-2004: II. The contribution of lead-contaminated dust to children’s blood lead levels. Environmental Health Perspectives, 117, 468-474.
Activity Patterns and Microenvironments.
The method for characterizing activity patterns in hypothetical populations referred to as the Consolidated Human Activity Data Base or CHAD is composed of data from a number of studies that were designed to capture human activity patterns. It has been used in past exposure assessment studies and has provided inputs to a number of EPA exposure models including the Air Pollution Exposure Model or APEX. CHAD includes the National Human Activity Pattern Study (NHAPS) data which contains data from a small but nationally-representative sample. This will be augmented with other data to provide a large enough sample of exposure profiles to develop the activity patterns for simulated individuals. Two algorithms will be tested – the diversity autocorrelation algorithm and the Cluster-Markov algorithm which will better represent variability in activity patterns among simulated subjects. The algorithm that best represents both within- and between-person variability in activity patterns will ultimately be applied in the approach.
Overall, this appears to be an appropriate and previously tested strategy for characterizing activity patterns in the various microenvironments discussed in the Draft Document, including residences and child occupied facilities (especially important for children), outdoors, traveling and public and commercial buildings.

Revised Comments
My comments here are essentially unchanged. The methods outlined in the approach designed to characterize activity patterns and microenvironments of children appear to be quite reasonable. I remain concerned that the CHAD data base underestimates the number of hours children (particularly older preschool children) spend in COFs. Another complication that I raised during the SAB meeting was the fact that in many urban inner-city communities the distinction between residences and COFs is blurred. A large number of inner-city children attend licensed and sometimes unlicensed day-care centers located in residential buildings (flats or single family homes) that are indistinguishable from the surrounding housing stock.
Blood Lead Modeling
The Integrated Exposure Uptake Biokinetic (IEUBK) model is the most thoroughly validated dynamic mathematical model for estimating blood lead concentrations of children 0-7 years of age who are exposed to various sources (air, diet, drinking water, soil, dust, and others) of lead. It was developed from a conceptual design based on published biokinetic data and validated against existing standards and blood lead data sets in a number of sites and communities. Other models are available such as the O’Flaherty and Leggett, but neither of these has been extensively applied to studies of children. Regression or “empirical” blood lead models based on environmental concentrations of lead are not suitable to complex exposure scenarios as they assume constant exposures from material sources of lead. The IEUBK model appears to be the most appropriate for this approach.
Revised Comments
The IEUBK model remains the most appropriate choice for modeling blood lead concentrations in young pediatric populations. As noted above, the model has undergone extensive validation against existing standards and empirical data sets from a number of sites and communities. Nevertheless, a further quantitative analysis of the data that are available regarding results of the IEUBK model compared to empirical data would be very useful in evaluating the overall approach.
2. Developing Lead Dust Hazard Standards for Public and Commercial Buildings
Many of the above responses and revised comments are relevant to this particular Draft Document on public buildings. Only responses to the charge questions that appear to be unique to this document are provided below.
Development of a Response Curve for the Blood Lead-Blood Pressure Relationship
It would be of value to use a central nervous system outcome in adults to target critical blood lead concentrations since this is what is being used for children and the residential approach. Recent general population studies as well as investigations of workers have demonstrated that lead exposure may contribute to age-related cognitive deficits in adults (e.g.,

van Wijngaarden, et al. 2009; Weisskopf, et al. 2007; Wright, et al., 2003). However, most of these studies have used bone lead as a measure of cumulative dose. They have also largely focused on older adults and the elderly. Therefore, based upon individual studies and meta-analyses (e.g., Nawrot et al., 2002) as well as comprehensive reviews of the literature (e.g., USEPA, 2006 Revised Air Quality Criteria Document for Lead) blood pressure appears to be the most appropriate endpoint for targeting blood lead concentrations of concern for adults at the lower ranges (1 – 20 µg/dL).
References
Van Wijngaarden, E., Campbell, JR, Cory-Slechta, DA. (2009). Bone lead levels are associated with measures of memory impairment in older adults. Neurotoxicology, 30, 572-580.
Weisskopf, MG, Proctor, S.P, Wright, R.O., Schwartz, J., Spiro, A., Sparrow, D., Nie, H., Hu, H. (2007). Cumulative lead exposure and cognitive performance among elderly men. Epidemiology, 18, 59-66.
Wright, R.O., Tsaih, S.W., Schwartz, J., Spiro, A., McDonald, K., Weiss, S.T., Hu, H. (2003). Lead exposure biomarkers and mini-mental status exam scores in older men. Epidemiology, 14, 713-718.
Revised Comments
My comments on this charge question remain largely unchanged. One suggestion was to examine the range of coefficients that have been reported on studies that have examined the association between blood lead concentrations and blood pressure. Analyses that enable calculation of a cumulative blood lead index over the lifetime of study subjects might be considered. Including studies that have measured bone lead by K-XRF might be informative here as well (see Hu, et al. 2007; Navas-Acien et al. 2007).
References
Hu, H., Shih, R., Rothenberg, S., Schwartz, B.S. (2007). The epidemiology of lead toxicity in adults: measuring dose and consideration of other methodologic issues. Environmental Health Perspectives, 115, 455-462.
Navas-Acien, A., Guallar, E., Silbergeld, E.K., Rothenberg, S.J. (2007). Lead exposure and cardiovascular disease—a systematic review. Environmental Health Perspectives, 115, 472-482.

Blood Lead Modeling
The merits of the IEUBK for the modeling of blood lead concentrations in children under 7 years of age are discussed above. The “All Ages Lead Model”, which is an extension of the IEUBK will presumably be capable of simulating multimedia exposures and biokinetics on a lifespan scale. However it is not yet sufficiently developed to utilize in this approach. The O’Flaherty model is based primarily on animal data and has not been thoroughly tested in human populations. The Leggett model is capable of predicting blood lead concentrations in exposed individuals across the lifespan and has been more thoroughly tested than the O’Flaherty. The Leggett model, based upon an extensive base of animal and human data, appears to be the appropriate choice for this approach.
Revised Comments
My comments on this charge question remain unchanged.

Comments from Dr. Philip Goodrum
These comments apply to two EPA Documents (SAB Consultation Drafts): 1) Proposed Approach for Developing Lead Dust Hazard Standards for Residences, and 2) Proposed Approach for Developing Lead Dust Hazard Standards for Commercial and Public Buildings. I expanded and modified my preliminary comments based on discussions with USEPA and the full panel that convened on July 6-7, 2010 in Washington, DC.
Many comments apply to both documents, although comments specific to modeling blood lead concentrations for children vs. adults are noted separately.
1. General Comments
Modeling of PbB or Empirical Dust/PbB Relationship
Much discussion and debate occurred during the July meetings on the subject of the merits and limitations of estimating PbB using USEPA (and other) models (i.e., “modeling”) compared to estimating PbB from empirical data linking PbB to dust Pb (concentration and loading) (i.e., “empirical method”). Both methods should be considered, however, I believe the use of models is more likely to accommodate the many goals associated with developing Pb hazard standards.
Risk Metric
The documents clearly state that the risk metric is based on an estimate of the absolute blood lead concentration (PbB) from all exposure pathways (rather than an incremental increase in PbB associated with exposure to indoor dust). In addition, multiple target PbBs of interest below the current 10 µg/dL standard will be evaluated: 1, 2.5, and 5 µg/dL for children and 0.3, 1, 5, 10, and 20 µg/dL for adults. I have three comments with recommendations:
1. Probability Level. There is no indication of the probability level of interest (e.g., 95th percentile, or Prob(PbB > target) ≤ 0.05), or of the potential utility of the lognormal distribution model that is currently the basis for quantifying inter-individual variability using the IEUBK Model for Lead in Children and the Interim Adult Lead Model. At the July 6 meeting in Washington DC, USEPA confirmed that it intends to continue to adopt the lognormal distribution model and the 95th percentile of the distribution. A statement should be included to this effect.
2. Age Range for Children. By convention, the output from the IEUBK model is typically evaluated based on the distribution of PbBs averaged over the entire 1-84 month age range; however, sometimes a shorter 1-year interval is evaluated to evaluate PbBs during the period of presumed peak hand-to-mouth activity. California DTSC’s Leadspread model (http://www.dtsc.ca.gov/AssessingRisk/leadspread.cfm) is an example
29

of an application of the latter approach, although the probability level of concern may be changed from the standard 95th percentile. USEPA intends to continue using the distribution of 1-84 month average PbB; this should be more clearly stated.
3. Delta PbB. Lead risk can be expressed as a PbB threshold that should not be exceeded, or as a de minimis change in PbB (i.e., “delta PbB”) that should not be exceeded. The two approaches are not the same and can result in different lead hazard standards for exposure media. [Note the current cancer risk guidelines rely on the “delta” concept because remediation goals are based on limiting excess (additional) risk of cancer to within a range of 1 in a million to 1 in ten thousand] Historically, absolute PbB thresholds have been established based on epidemiological evidence linking PbB measurements to adverse health effects. As new study data have become available, the Centers for Disease Control has recommended lower PbB thresholds that have been adopted by USEPA and other agencies. The PbB threshold is convenient to implement because it accommodates community surveys of children at discrete points in time where the fraction of children with PbBs exceeding the threshold can be measured. By classifying results based on similar environmental Pb levels, we can calculate the probability of exceeding an absolute PbB threshold and compare the results to model predictions. Implicitly, a PbB threshold reflects a risk management/policy decision regarding a threshold for the health effect that should not be exceeded. In the current draft reports, the epidemiologic evidence cited by USEPA to support the use of a lower target PbB level provides a quantitative measure of the incremental change in IQ that can be associated with an incremental change in PbB. This relationship was established based on a study of children with varying blood lead levels. The analysis suggests that a small change (increase) in PbB may result in a decrement in cognitive performance for children at the population level - across a range of PbBs. Since individual IQ levels can be expected to vary across the relatively low PbB levels of concern (i.e., < 10 µg/dL), it may be rather difficult to define risk based on a threshold IQ score and corresponding threshold PbB level. Instead, if risk is defined as an incremental change (decrement) in IQ (at the population level) that should not be exceeded (and therefore, a delta PbB), the policy may be more generally applicable to children across a broad range of environmental and demographic conditions. The tradeoff in adopting a delta PbB risk metric is that it is more difficult to conduct community surveys to compare to model predictions. For example, I am not sure how one would quantify the change in PbB that occurred without having first established the baseline PbB conditions without the specific source of concern. It is possible, however, to measure the change in PbB that occurs following some remedial intervention – and expressed at the population level (e.g., change in mean PbB), inferences can be made about expected benefits in health outcomes supported by the epidemiologic data.
I encourage USEPA to consider the delta PbB method as an alternative to, or supplement to, the current approach based on defining an absolute PbB threshold. While both approaches can rely on the same underlying mathematical models to relate PbB to dust lead exposure, they require different considerations regarding the various sources of uncertainty. Computationally, the major advantage of the delta PbB metric is that it greatly simplifies the analysis because it does not require estimates of exposure to all other exposure media - diet, inhalation, drinking

water, and perhaps most importantly – outdoor soil. This is particularly important for establishing lead dust hazard standards because the relatively low level of absolute PbB (i.e., ≤ 5 µg/dL) that is proposed is within the range of “background” PbBs that might be expected for individuals at the high-end of the PbB distribution (see Risk Based on Absolute PbB Threshold below). The disadvantage is the method requires an understanding and accounting for different sources contributions to the medium. Specifically, indoor dust lead is expected to reflect a mix of outdoor soil and indoor sources including indoor paint. Therefore, we need to decide if the change in dust concentration (or loading) is a change above some background level. A clear understanding of the intent of the dust hazard standard and the limitations of an indoor dust remedy to effectively reduce all (indoor and outdoor) source contributions to levels approaching zero would be needed.
Risk Based on Absolute PbB Threshold
To better understand the challenge associated with defining the PbB risk metric as a threshold level that should not be exceeded by cumulative exposures from all pathways, it may be helpful to define a “baseline” PbB that first reflects exposures from all sources except indoor dust ingestion. Then, the difference between the PbB associated with baseline exposures and the threshold blood lead (e.g., 95th percentile < 5 µg/dL) can be used to frame the dust hazard standard. In the simplest case, if the baseline PbB already exceeds a specified PbB threshold, then no additional exposures via dust can be accommodated - the dust Pb standard would essentially be 0 mg/kg (concentration) or 0 mg per cubic foot (loading). While this may seem like an extreme scenario, in fact, the likelihood of exceeding the proposed PbB thresholds of 1, 2.5, and 5 µg/dL is notably high for even low levels of lead in outdoor soil. Using the IEUBK model (version 1.1, Build 11) with default inputs updated to reflect the Proposed Blood Lead Value Input Values (Table 6-2 of the Residential report), two scenarios were evaluated for a range of soil lead concentrations. First, it was assumed that dust lead concentration (PbD) is 0 mg/kg and that the soil and dust ingestion rate is weighted to reflect 45% intake of soil and 55% intake of dust, which is the default assumption recommended by USEPA for assessing residential lead risks and also proposed for the dust hazard standard. Table 1 summarizes the concentrations, intakes, and PbB statistics for children (1-84 month averages), including the geometric mean (GM), geometric standard deviation (GSD), and 95th percentile. For outdoor soil Pb concentrations (PbS) ranging from 0 to 100 mg/kg, the 95th percentile PbB ranges from 1.9 to 3.1 µg/dL. Table 2 provides similar information for a second scenario in which only outdoor soil contributes to the indoor dust lead mass using the IEUBK default equation: PbD = 10 + 0.70 x PbS. For outdoor PbS ranging from 0 to 100 mg/kg, the 95th percentile PbB ranges from 2.0 to 4.2 µg/dL, which is slightly higher due to the addition to the average daily Pb intake via indoor dust ingestion. For both scenarios, it is clear that a PbB metric of 1 µg/dL cannot be accommodated given the baseline conditions that are modeled. As shown in Table 3, the probability that PbB exceeds 1 µg/dL (i.e., P(X > 1 µg/dL)) approaches 50% for PbS in the range of 0 to 20 mg/kg. Similarly, P(X > 2.5 µg/dL) = 5% for PbS of 20 to 50 mg/kg and P(X > 5 µg/dL) = 5% for PbS of 140 to 270 mg/kg, depending on whether outdoor soil contributes to indoor dust. A detailed listing of the inputs and outputs associated with Tables 1 and 2 are provided in Supplements A and B, respectively.

Implementation of Delta PbB Threshold
To illustrate the delta PbB method with the IEUBK model, all of the exposure pathways (including outdoor soil Pb) were set to zero and only exposure via dust ingestion was modeled. Figure 1 summarizes a series of seven different complementary cumulative distribution functions (also called “exceedance curves”) for PbB associated with PbD ranging from 10 to 140 mg/kg. The P(X > 1 µg/dL) statistic is shown for each simulation. Figure 2 shows the probability distributions that correspond to exceedance probabilities of approximately 5.0% for each of the three PbB metrics. The analysis suggests that an incremental increase of PbD of 68.5, 175, and 360 mg/kg will yield 5% exceedance probabilities for the three absolute PbB thresholds: 1, 2.5, and 5 µg/dL. These are shown just for information purposes; it is important not to equate an absolute PbB with a delta PbB. In May 2009, California DTSC proposed the use of a delta PbB approach based on the same epidemiological evidence cited in the draft dust hazard documents. DTSC’s proposed guidance identified 1 µg/dL as the 97.5% upper confidence limit on the slope of the IQ versus PbB curve. An acceptable soil Pb concentration would be one that yields an increase of 1 µg/dL in the 90th percentile of the PbB distribution. Altogether, this guidance is intended to represent “concentrations in soil that have no more than a 2.5% probability of decreasing IQ by more than 1 point in a 90th percentile child or fetus” (OEHHA, 2009 ).
Background Concentration (or Loading) Must be Included
It is important to note that the delta PbB metric is intended to reflect an incremental increase in the Pb concentration in an exposure medium, above that of “background” conditions. Because soil is expected to contain some low levels of lead due to historical anthropogenic and non-anthropogenic sources, the same rationale applies to indoor dust. Supplement C to my comments includes a letter that I wrote to Dr. Kimi Klein of DTSC on January 29, 2010 that outlines the mathematical and conceptual basis for using the delta PbB method to calculate the media concentration that includes both background and site-specific sources. While the example is specific to the adult Pb model, the same concepts and general approach can be accommodated with the IEUBK model, particularly if it is noted that the relationship between the dust Pb concentration and GM PbB is linear. Dr. Klein has since retired, but she and her colleagues at DTSC have endorsed the concepts presented in the letter.
Monte Carlo Analysis
While I strongly support the use of Monte Carlo analysis (MCA) as a tool for understanding the relative contributions of variability and uncertainty in multiple input variables to a model output variable, I have two concerns about the methods proposed. First, I believe that the utility of MCA for assessing lead risk in children is largely limited to sensitivity analysis rather than prediction. Extensive Monte Carlo simulation experiments have been conducted with the IEUBK model to understand and quantify the contribution of exposure and uptake variables to variability and uncertainty in the PbB distribution; however, I am unaware of any investigations that account for the contribution of variability and uncertainty in biokinetics to the overall PbB distribution. Failing to account for key sources of variability and uncertainty in the MCA will likely yield an underestimate of the overall variance in the PbB distribution. This

shortcoming cannot be offset by introducing a series of conservative assumptions, nor can the degree of underestimation be quantified with confidence. For adults, if a slope factor approach is used, the solution is more tractable and may be supported by data on the uptake/PbB relationship. If the delta PbB risk metric is adopted, the approach becomes even more tractable because the evaluation can focus on just those factors associated with the dust exposure pathway. A second concern is that the proposed methods included a combination of concentration terms and exposure factors, thereby conflating the distributions representing uncertainty and variability. If we consider that the IEUBK model is intended to yield an estimate of a distribution (representing variability) in PbBs for a population that is exposed to the same lead concentrations in exposure media, than the path forward is clear. To evaluate alternative scenarios with alternative concentrations in one or more media, then the model should be run iteratively, with each iteration yielding a different PbB distribution. If the MCA combines distributions for concentration terms (each value representing an alternative arithmetic mean concentration) with distributions for exposure factors (each value representing an alternative average daily soil & dust ingestion rate, for example), we will obtain a probability distribution for PbB that combines variability and uncertainty in a misleading manner.
2. Specific Comments
Reasonableness of the Approach
Figure 1 provides an overview of the approach for quantifying a hazard standard that corresponds to a target PbB. The method can be described as a “forward calculation” in the sense that a candidate hazard standard is converted to an estimate of a concentration, which in turn is used to estimate an “exposure concentration” (note: this term is very confusing and I would recommend replacing throughout the document by the term average daily lead intake, or simply lead intake), and finally a PbB distribution is calculated. Table 5-1 provides details of the sampling frequency proposed for key variables or variable groups sampled in the residences model. Approaches for assessing stability of the output (PbB) distribution and for conducting a sensitivity analysis are noted. If distributions representing variability and uncertainty can be successfully separated (see general comments), this approach would be an ambitious simulation experiment, especially given the use of a submodel that will yield annual activity patterns and corresponding dust intake in microenvironments. But ultimately I do not believe this approach addresses the overall goal of the assessment. Variability will be quantified on exposure factors alone - focusing on soil and dust ingestion rate (mg/day), intake via drinking water (µg Pb/day), and dietary intake (µg Pb/day). Variability associated with uptake and biokinetic factors that influence variability in PbBs will not be quantified, so the variance in PbB will be underestimated to some degree.
The goal of the evaluation is to relate alternative floor and sill dust loading standards to a target PbB. Many sources of uncertainty are described in the documents, and the modeling effort might be simplified to address these more clearly. As suggested above, if the delta PbB risk metric is adopted, the overall analysis can be greatly simplified. If, instead, risk is defined by an absolute PbB threshold, the following steps may be considered to streamline the analysis:

Step 1
Use the Lead Model to determine the relationship between average daily lead uptake (µg/day) from multiple exposure pathways and pseudo-steady state PbB. Once the model converts a concentration to an average daily intake, and finally an average daily uptake, the particular lead medium from which each Pb dose originated is no longer a factor. Hypothetically, each exposure medium can yield the same PbB distribution by adjusting the concentration term. So collectively, the contribution of dust loadings can be viewed as another “alternative source” that can contribute to the total lead uptake. The first step should be to determine if there is even a “balance” of Pb uptake that can be included in the total dose before tipping the scales on the PbB distribution such that the target PbB is exceeded (see General Comments above).
If the target PbB is intended to represent an upper percentile (e.g., 95th percentile), then the central tendency PbB can be calculated by assuming a GSD (e.g., GSD = 1.6) for a lognormal distribution: PbB_p = GM x GSD^z_p, where PbB_p is the PbB at the “pth percentile” (i.e., the target PbB of interest) (µg/dL), GM = geometric mean PbB(µg/dL), GSD = geometric standard deviation (unitless), and z_p = z-score of the standard normal distribution with mean = 0, standard deviation = 1.
The exposure factors should be selected to represent the central tendency estimates, typically the arithmetic mean, but sometimes the median. This means that only central tendency estimates (CTE) are needed for soil ingestion rate, drinking water intake, and dietary intake. The concentration terms for outdoor soil, drinking water, and air become the key sources of uncertainty. Since the modeling approach proposes to treat the concentration terms as independent variables, a preliminary sensitivity analysis should be conducted to determine if each of the three exposure pathways may contribute at least 10% to the total (average daily) Pb uptake from all pathways combined. It may be possible to reduce the complexity of the approach if, for example, it turns out that even the high-end plausible air concentration is unlikely to yield a relative contribution via inhalation of more than 10% of the total dose.
The outcome from the first step would be a graphic that illustrates the relationship between CTE dust intake (x-axis) in units of µg/day and CTE PbB (y-axis). Multiple series can be graphed each corresponding to a different combination of concentration terms for the other media (e.g., low, medium, high). CTE dust intake would be entered using the alternate source intake option in IEUBK and an absorption fraction from 30%. This graphic will identify the range of CTE dust intakes that may correspond to the target PbB, depending on the range of concentrations in other media.
All of the remaining sources of uncertainty can be quantified outside of the lead model.

Step 2
Develop a relationship between CTE Dust Intake (y-axis) and Dust Pb Concentration (as a composite of floor and sill dust mass). If there is a range (or distribution) of plausible CTE values for key exposure variables, here’s where a separate MCA can be run. The MCA routine (including the microenvironment simulations) can still yield a CTE intake for dust, but now there will be a scatterplot of concentration vs intake results. A (1-α)x100% confidence limit can be generated to determine what threshold concentration in dust corresponds to the target CTE intake with specified confidence.
Step 3
Develop a relationship between CTE Dust Concentration and Dust Pb Loading (composite of floor and sill). Again, generate a (1-α)x100% confidence limit. It will be easier to work with the concept of a composite dust loading , factoring in the correlation between floor and sill measurements. Variability in floor vs sill contributions to total dust Pb loading may even be introduced in this step.
Dividing up the analysis into these three steps facilitates “compartmentalizing” the difference sources of variability and uncertainty, and provides for a more comprehensible sensitivity analysis. For example, Step 1 can be used to illustrate the sensitivity of the CTE target PbB to different estimates of GSD. Likewise, Steps 2 and 3 can be used to illustrate how the final dust loading varies as a function of the use of a regression model or mechanistic model, and the confidence coefficients.
Conversion of Dust Loading to Dust Concentration
It is helpful to pursue both methods for a check on consistency in the modeled relationship between loading and concentration, however, the mechanistic model in this case seems to have many more unknowns/datagaps. A probabilistic sensitivity analysis (using Monte Carlo simulation) should be conducted to determine if the modeling approach can be simplified. Despite the wide scatter in the relationship, it looks like ultimately the empirical approach may be preferred. The description of the data selection process using the HUD dataset sounds reasonable (i.e., vintage of homes and preference of wipe loading instead of vacuum samples).
Another approach would be to use a more formal multiple regression techniques to introduce additional variables to associate concentration and loading – even a principle components analysis may shed light on combinations of variables from the HUD survey that provide an improved predictive relationship.
Note that there is a transformation bias associated with the use of a log-transformation that should be taken into account. Two equations that can be considered to correct for this bias are:

Equation 1 (based on Ferguson, 1986) may actually overcorrect for the bias. It works well when n is large (>30) and σ (square root of mean squared error of regression) is small (<0.5), but may overcorrect for the bias:
Y = exp [β0 + β1 ln(X) + 0.5 σ2] Equation 1
Equation 2 is a more general (non-parametric) approach (Smearing estimator, Duan 1983) that may actually work better as rule of thumb:
Y = exp [β0 + β1 ln(X)] • sum(exp[e_i])/n Equation 2
Where e_i are the individual error estimates for each X_i.
Relation of Sill Dust to Floor Dust
p.8-9. It makes sense to view the floor and sill loadings as “fixed” in the context of a forward calculation methodology. But see above for a suggestion on how to reorganize the evaluation so that this is not a factor. By Step 3, we are determining the dust loading the yields a relevant dust Pb concentration. With this approach, we can make statements such as, “We are 95% certain that the dust Pb concentration is less than a threshold associated with a CTE Intake when the loading standard is less than X µg/ft2.”
p.9. The assumption that concentrations for a particular set of individuals are “fixed” is reasonable, easier to work with in the modeling, and consistent with EPA methodology which encourages interpretation of IEUBK simulations as providing estimates of variability under conditions that all individuals are exposed to a constant.
See comment on log transformation bias above. Alternative transformations (e.g., ladder of powers) should be considered beyond just logarithmic (e.g., square root, cube root), with a focus on improving normality of the residuals plot.
Activity Patterns and Microenvironments
p. 13. Day-to-day variation in activity patterns will be simulated to develop 24-hour diaries. It would be helpful if at least some respondents provided repeat measures from which assumptions about day-to-day to variability could be assessed.
p. 14. Last paragraph of Section 3.4.1.2. “The algorithm that most adequately represents both the within-person and between/person variability will ultimately be applied to characterize human activity.” What criteria will be used to establish the degree of representativeness?

Blood Lead Modeling
The IEUBK model is an appropriate choice for quantifying PbBs in children. It has undergone extensive Internal Verification and Validation (IV&V) and guidance on applications is well developed. Please see comments above regarding important principles regarding the use of the IEUBK model (e.g., CTE point estimates, use of lognormal distribution to represent variability).
The Adult Lead Methodology is an appropriate choice for quantifying PbBs in adolescents and adults. It is a slope factor model, and therefore, simplified (and easier to implement) than other candidate models that were identified (e.g., Leggett, O’Flaherty). ALM and supporting documentation is available on EPA’s website (http://epa.gov/superfund/lead/products.htm#alm). EPA’s Superfund Program has conducted evaluations of candidate models and summarized findings in a report posted to the website (http://epa.gov/superfund/lead/products/adultreview.pdf).
3. Other Comments
p. 6. I found the discussion of “concurrent” and “lifetime” blood lead measures to be confusing. Is this a way of introducing the relevance of the specification of an age range of interest. This section needs to be expanded or rewritten to clarify these points.
p.7. It will be informative to evaluate the distribution of reported concentrations in soil, water, and air. I suspect that a preliminary sensitivity analysis with low and high bounding estimates from each distribution will reveal that at least one concentration term can be expressed as point estimate without loss of generality. For the remaining concentration terms, point estimates can be used to define a range of scenarios (e.g., low, medium, and high). If probability distributions are to be used, then additional consideration should be given to the choice of distributions. Normal distributions will require truncation limits to avoid implausible results (e.g., negative). A beta distribution should be considered.
p. 24-25. In general, the sensitivity score is a good compromise between the elasticity equation alone and the coefficient of variation (CV) alone. Elasticity is a poor discriminator of relative contributions of variables within the same dose equation, but it will pick up on relative differences between equations. Conversely, CV may be high for a particular variable, but if the dose from that medium is low, then a CV is not a direct measure of rank. I would caution readers not to misinterpret the CV as a measure of the ration of the GSD and median. GSD is a unitless quantity that can be converted to CV; it is confusing to suggest that.
Table 6-2 (Proposed PbB Input Values) – values have changed from the defaults recommended by USEPA in the most recent IEUBK (Version 1.1, Build 11):
Inhalation /lung absorption is 42%, which is the high end for a child near a point source. IEUBK uses 32% as a default.

Water consumption approach (set ingestion rate to 1) is a good solution that enables user to rely on a dataset of intakes.
Dietary Intake – how do the Lifeline results compare to the current defaults used in IEUBK?
Soil/Dust Ingestion rate is to be estimated from EFH by fitting a distribution to percentile data. As discussed above, the distribution should apply to the range of CTEs, rather than the upper or lower percentiles themselves. Information is provided in Supplement D to support choices of central tendency parameter estimates for adults and children.

39


41
42
43

Comments from Dr. Sean Hays
EPA is attempting to derive regulatory standards for lead in dust in residences and commercial buildings. Unfortunately, lead is a multi-media contaminant, so attempting to derive dust standards in isolation creates numerous fundamental problems. Health Canada (HC) has developed (or is developing) standards for lead by looking at the whole picture for lead. They first started by selecting a target blood lead level in children (e.g., 1 or 2.5 µg/dL) to protect against. Then they used the O’Flaherty PBPK model to determine the total absorbed dose of lead (µg/day) that would be allowed and still not exceed the target blood lead level. They then determined the fraction of that total dose that should be allowed from each source of lead (e.g., outdoor soil, indoor dust, water, food, air, consumer products). Each department in charge of each media was then allowed to determine what concentration (or loading) of lead in their respective media that would achieve their allowed contribution to total absorbed lead dose. EPA may not be able to adopt this approach for regulatory reasons. If possible, EPA should consider this holistic approach for future lead regulations.
1. Developing Lead Dust Hazard Standards for Residences
Blood Lead Modeling
The existing lead PK models (IEUBK, Leggett, O’Flaherty) have been parameterized by simulating human (mostly adult) and animal blood and bone lead concentrations following mostly controlled dosing studies. When these models are coupled with multi-media exposure modules, uncertainty is added. The more scenarios, the more uncertainty.
Models are most useful to perform extrapolations where data do not necessarily exist. When data are available that provide a direct insight into the relationship under question (e.g., residence dust lead loading and blood lead levels in children), it is best to rely on the data over the models. Given that this data does exist (Dixon et al., 2009 and others), the empirical data should be used instead of using the IEUBK model. The only potential scenario that could not be addressed using the existing empirical data is the impact of acute elevated exposures occurring during the remodeling project. If EPA is not concerned with this scenario, or is willing to require contractors to limit dust exposures to the chronic standard during the remodeling project, then the approach using the empirical data is sufficient. I encourage EPA to analyze the NHANES data for themselves and derive their own regressions between children’s blood lead levels and their respective residential dust lead loadings.
If EPA decides it must use a PK model for this exercise, it is best to limit the models to the specific dust scenario. In which case, EPA can assume a background blood lead level (e.g., ~1 µg/dL, use NHANES to support this number), and then determine what dust concentration would correspond with an increase of 1.5 µg/dL (2.5-1=1.5 assuming 2.5 µg/dL is the target blood lead level). This kind of “delta” or “incremental” risk assessment will have lower uncertainty than trying to model everything using the IEUBK and making assumptions about
44

micro-exposure events. The background blood lead level in the U.S. (responsible from all sources other than dust) can be determined from the NHANES database via the Dixon et al. (2009) analysis or from an independent analysis from the same NHANES database.
Given EPA is also attempting to derive a lead loading standard for commercial buildings and adults will be one of the target populations, EPA should consider using one PK model for both adults and children. In which case, the O’Flaherty PBPK model should be considered over the IEUBK model.
2. Developing Lead Dust Hazard Standards for Public and Commercial Buildings
Blood Pressure
I’m not sure blood pressure is the most sensitive endpoint of relevance for this assessment. It all depends on what target blood lead level is chosen to protect against increases in blood pressure. Alternatively, it has been found that the ratio of blood lead in cord blood and maternal venous blood lead is approximately 0.8. Therefore, if one wants to protect the newborn infant from exceeding the target blood lead level chosen from the dust standard for residences, then the EPA may need to set a target blood lead level in pregnant women no higher than 1.25 (1/0.8=1.25) times the target level in children. Also, the post-menopausal woman is the most sensitive pharmacokinetic population for lead. This may need to be considered in this assessment. This will require a PK model that can account for menopause. The only model available for this is the O’Flaherty PBPK model.
Blood Lead Modeling
The O’Flaherty model is not a pharmacodynamic model. It is a pharmacokinetic or toxicokinetic model.
I would suggest the EPA use the O’Flaherty PBPK model for lead instead of the IEUBK and Leggett model. It allows the use of one model to be used for both adults and infants, and post-menopausal women. The O’Flaherty model has undergone extensive validation in adults, children and nonhuman primates.
This report seems to imply the desire to model acute or transient changes in exposures. Is this really an objective of this effort? If so, one of the PK models will be required.
Consider performing a delta/incremental assessment for dust exposures as discussed above for children in the residential dust standard.

Comments from Dr. Andrew Hunt
1. Synopsis
The principal goal of the project is to develop dust-lead hazard standards for floors and window sills in residential and in commercial and public buildings (the standards will be for children and adults).
The standards will be based on levels of Pb in human blood (considered the most appropriate biomarker of exposure). That is, levels of Pb in sill and floor dust are to be identified that will (following dust intake) result in specific blood Pb (PbB) levels.
o Three target PbB levels were identified (1, 2.5, and 5 µg/dL); thought to be significant for public health.
The necessary Pb intake that leads to the specific PbB levels is to be modeled using the EPA’s Integrated Exposure Uptake Biokinetic (IEUBK) Model for Lead in Children, and the Leggett model for adults.
o The IEUBK model requires Pb intake values for dust-, soil-, and air-Pb concentrations in the microenvironments where exposure takes place.
Exposure concentrations are a function of media concentrations of Pb and information on where the population of interest is located at different times (exposure variables).
o Media concentrations: Candidate floor and window sill Pb standards are fixed. The candidate
floor dust hazard standard is selected first and then the accompanying window sill candidate standard is estimated using a relationship between floor dust lead and window sill dust lead developed from empirical data.
Monte Carlo realizations (where each media concentration distribution will be sampled to estimate the total lead exposure of a hypothetical child) will be simulated to capture the variability in environmental concentrations in the other exposure media.
It is assumed that the exposure media concentrations in each microenvironment do not change through time (and the type of microenvironment does not change).
o Exposure variables: The degree of exposure to Pb-containing media is derived from an
exposure profile. An exposure profile is developed from the amount of time spent in various microenvironments during a one-year period.
Depending upon age exposure profiles will be developed from information in human activity data from the Consolidated Human Activity Database (CHAD), and algorithms in the Air Pollution Exposure Model (APEX).
Chad consists of diaries of activities of individuals during a 24-hour period.
o A national and regional datasets in CHAD will be used.
46

The APEX model has two stochastic methods to develop composite diaries.
o The diversity-autocorrelation algorithm assembles multi-day diaries based on reproducing realistic variability in a user-selected key diary variable.
o The Cluster-Markov algorithm, also stochastically generates composite diaries from individual 24-hour period diaries.
o The algorithm that will ultimately be used is the one considered (on statistical grounds) to most adequately represents both the within-person and between-person variability.
o Microenvironments of interest are specified as: Residences, Child-occupied facilities (COF), Outdoors: Traveling; and Public and commercial buildings. Age-specific estimates for time spent in each environment for children < 6-years of age and adults > 18-years of age are used.
o Other exposure variables: Distributions for the ingestion of soil and dust will be generated from
information CHAD and the Exposure Factors Handbook. To estimate the distributions of lead dietary and water intake, the LifeLine
Model (The LifeLine Group 2008) will be used to estimate a distribution of intakes across the population by age.
Exposure Concentration Estimateso Dust, soil, and air lead concentrations for each microenvironment for each
hypothetical person is provided by Mote Carlo sampling.o The concentrations in each microenvironment are to be combined to provide
overall air, soil, and dust concentrations for input into the blood lead model.
Estimation of Blood Lead Levelso The IEUBK was selected for modeling blood lead concentrations for children
under 6 years of age in the residential exposure scenario.o The Leggett was selected for modeling blood lead concentrations for adults
2. Developing Lead Dust Hazard Standards for Residences
Proposed Approach
This is an ambitious enterprise. The purpose of this modeling exercise is to calculate the floor and window sill dust lead loadings corresponding to the specific target PbB levels of 1, 2.5, and 5 µg/dL. In terms of reasonableness, the effort appears logical. The steps to arrive at the outcome are clearly defined. Namely:
Specify target PbB levels

Estimate environmental media and exposure concentrationso Environmental media concentrations: requires estimates of Pb concentrations
for all relevant environmental mediao Exposure concentrations: estimated using data on lead concentrations in
different environmental media and information population activities
Estimate Blood lead concentrations.
The proposed approach for developing Pb dust hazard standards for residences is plausible.
There are many assumptions that need to be made.
Major assumptions are articulated in the Charge Questions.
The approach may be deemed reasonable if consensus is reached on the charge questions (although problems associated with some of the charge questions may not be tractable).
The approach involves calculating a child’s blood lead concentration distribution by specifying lead dust loadings for the floor and window sill candidate hazard standards (10 and 100 µg/ft2) and simulating numerous hypothetical individuals, each with different sampled behaviors and environmental media concentrations. The purpose of the model, however, is to calculate the floor and window sill dust lead loadings corresponding to the specific target blood lead levels of 1, 2.5, and 5 µg/dL. (Are all these levels to be considered as unacceptable in terms of harm to the child? There is little clinical evidence for harm at a PbB of 1 µg/dL.)
The relationship between hazard standards and the various contributions to blood lead concentration will necessarily be modeled. This requires creating a response surface (constructed by running many iterations with different target loading levels) which will correlate candidate dust and window sill lead dust loading levels with blood lead levels. Once a response surface is created for range of loadings, an estimate of the relationship between candidate loadings and blood lead levels will be known. A set of loadings can be estimated to correspond with a target blood lead level, and the model is run to determine if the target blood lead level is reached with sufficient precision. The analysis is composed of a large number of sampled distributions (that will, for instance, involve various assumptions about exposure locations) so it is likely that thousands of realizations will be required to reach a stable blood lead level distribution. The proposed modeling exercise would have seemed more convincing if some simulations had been presented.
Conversion of Dust Loadings to Dust Concentrations
Development of a Regression Equation – pro et contra
Pros: The regression equation involves few assumptions, it is easily understood, and is
empirically based. The model is already developed.
Cons: The description states, “…the wipe loadings were paired with the blue nozzle
concentrations at each home to develop the loading-to-concentration statistical relationship. By doing so, the assumption is made that the concentration is roughly uniform across all particles and the particles collected by the blue nozzle device are representative of the true average concentration.” This assumption may not be valid.
o The blue nozzle sampler has been found to have the poor recovery rates. Compared to the widely used BRM and CAPS samplers (average dust recoveries for BRM, CAPS and blue nozzle were found to be 89%, 84% and 30% respectively). Lead recovery was no better (lead recoveries for BRM, CAPS and blue nozzle were found to be 81%, 72% and 26% respectively) (USEPA, 1995).
The correlation between concentrations and loadings in the HUD data is marginal: this maybe a function of:
o Particle size collection may be biased (it has been shown that vacuum sampling removal of dust from hard floor surfacing tends to not collect strongly adhering very fine particulate Pb that wet wiping does collect (Hunt et al., 2008)).
o Reproducibility of the wipe-blue nozzle side-by-side comparison. Are short range spatial variations in dust and Pb levels on the also floor impacting the correlation? Indoor floor dust is a transient phenomenon
The regression equation is based on a “nationally-representative dataset” with sufficient samples across different housing vintages, outdoor soil concentrations, and indoor paint concentrations.
o However, there are only approximately 280 data items in this nationally representative data set. This data set may not be sufficient to capture a representative snap-shot.
o Perhaps regional differences underlie this relationship (different parts of the country may have different sill to floor ratios). It could be that different regression relationships exist in different regions, and regional regression relationships need to be developed and used to provide regional error bars for developed dust-lead hazard standards for floors and window sills.
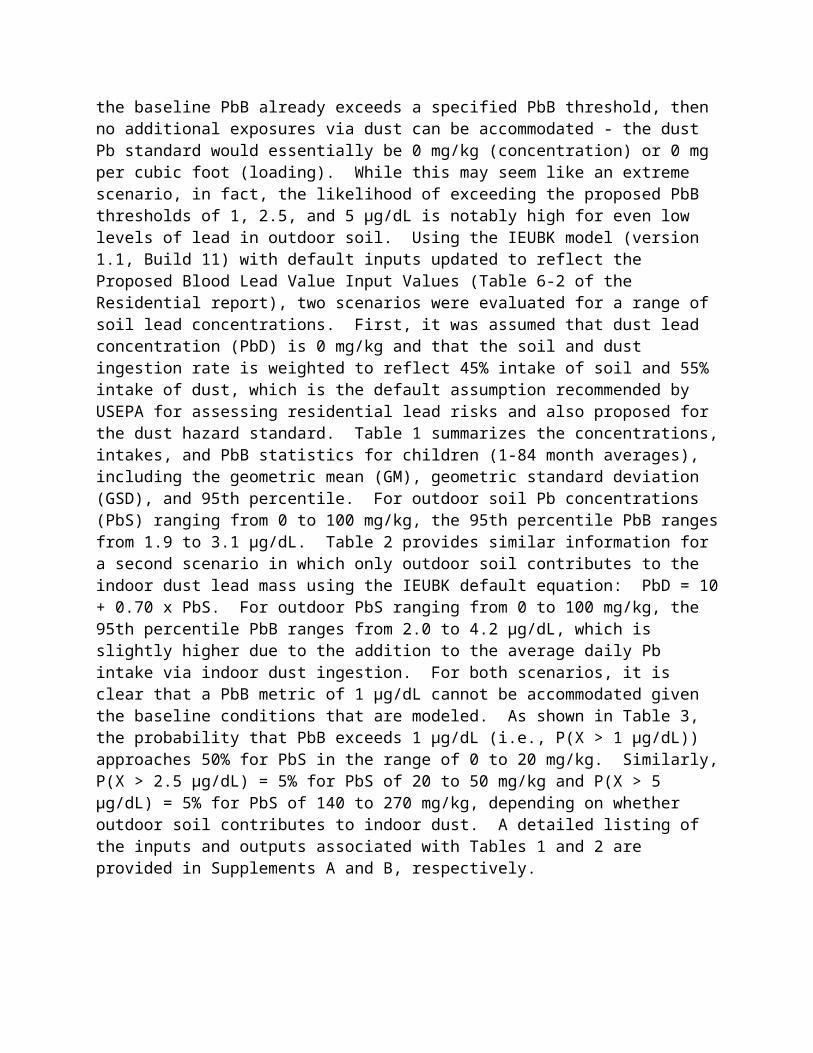
Questions and Comments
It would be much more useful to see the data from the HUD and EPA “American Healthy Homes Survey: A National Study of Residential Related Hazards in the Indoor Environment” with a nationally representative sample of 1,131 residences. I understand both Pb concentration and loading from floor dust samples are available from this study.
Development of a Mechanistic Model – pro et contra
Pros: The mechanistic model has a certain elegance if its validity is established (by
empirical testing). The mechanistic model can be adapted to residential and commercial properties.
Cons: The parameterization is complex.
o The model requires the separate calculation of dust mass and Pb mass for two compartments (a floor compartment and an air compartment).
o Dust mass and Pb mass are incorporated into a slope factor which is used to calculate dust Pb concentration with data on dust Pb loading (i.e., loading = slope x concentration).
The model has various assumptions may underestimate indoor dust masso Conditions in the home are static (in reality they are dynamic)o Household members do not smoke. Clearly this is unrealistic, and there is
a socio-demographic dimension to variations in levels of ETS particle generation
ETS exposure prevalence in inner-city homes in the National Cooperative Inner-City Asthma Study (NCICAS) (Phipatanakul, et al., 2000) was recorded in at around 59%. In the Urban Environment and Childhood Asthma (URECA) birth cohort study, with homes from urban Baltimore, MD; Boston, MA; New York City, NY and St. Louis, MO (Gern et al., 2009), 60% homes had tobacco smoke.
Nazaroff and Klepeis (2003), summarizing data from numerous studies, suggested that cigarette smoking can result in an average increase in fine PM indoors of between 10 and 45 µg/m3. The PTEAM study in Riverside, CA estimated the PM2.5 contribution of 14 (± 4) mg/cigarette to indoor air (Ozkaynak et al. 1996). Ten cigarettes smoked indoors over a day would contribute a third of the mass contributed by cooking (as estimated in the model). Certainly, during the winter in an urban community in a north eastern US city, with more than one smoker in residence, the contribution to dust mass from ETS may equal that from cooking.
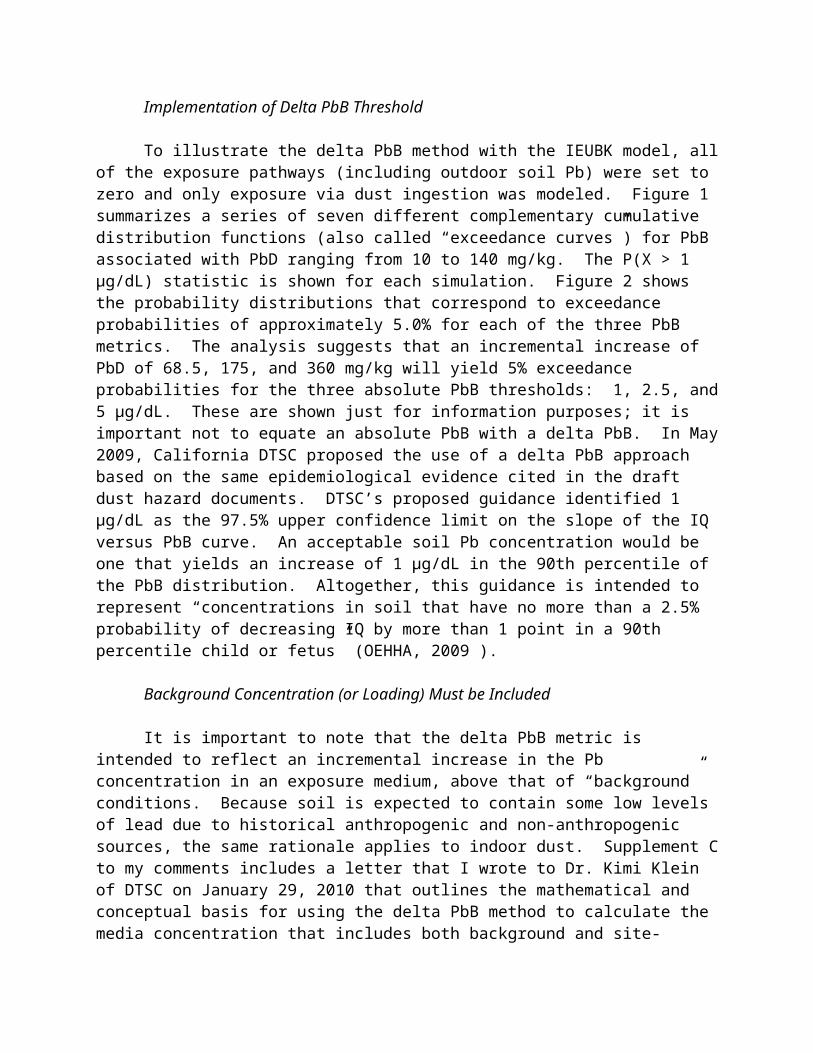
The Exposure Factors Handbook cleaning frequency data is representative of socio-economically challenged inner-city communities most at risk for Pb exposure. In my experience families in such communities often do not own vacuum cleaners, and cleaning is infrequent (use of dust pan and broom accounts for a specific fraction of the dust when cleaned up).
The model assumes that the home is a uniform environment (single box) there are no gradients in concentration. But, dust mass indoors declines as distance from the entrance increases (Thatcher and Layton, 1995).
Questions and Comments
What chip fraction (Pb contribution) is derived from impact and friction surfaces (doors, floors (including stairs), windows).
The loading measures are assumed to be representative of a uniform indoor environment. But, it is typical for loadings to be measured in kitchens (amenable to wiping). How does this location for loading modify the cleaning frequency and cleaning efficiency variables? Also, does this sampling location mean tracking flux needs to account for ingress of outside soil from the front of a residence and possibly from the back of the residence (if there is a kitchen door that leads to a rear yard) and account for the lack of door mat if absent in the kitchen.
I would have liked to have seen a graph of the modeled (loading-to-) concentration vs. the measured concentration data for the HUD dataset.
The Mechanistic model likely needs to be run successfully with several datasets of loading and concentration before it could be routinely applied with any confidence.
Conclusion
Because of the availability of data, the Regression Model is probably the favored option at this time.
Relation of Sill Dust to Floor Dust
Sill- vs. Floor-dust regression – pro et contra
Pros: The model is derived empirically
Cons: There appears to be a disparity between the HUD data and the Rochester data.
The equation relating sill loading to floor loading derived from the Rochester data results in 4 times more on the sill that the equation derived from the HUD data. It would be useful to explain these differences. If the Rochester data represents a

localized picture, and the HUD data set represents a blurring of localized effects, then the HUD data set is probably inadequate.
Combining the floor and sill concentrations into a single aggregate dust concentration where there is a 1% weighting given to sills and 99% weighting to floors in terms of relative ingestion begs the question of the utility of calculating the sill concentration in the first place.
Questions and Comments
I find using the relationship from one data set to establish a “global” sill dust to floor dust relationship inadequate.
Conclusion
In the absence of any other data at this time there appears to be liitle choice but to use this relationship.
Activity Patterns and Microenvironments
Pros: CHAD data and Apex model widely used The collapsing of CHAD data into a limited number of environments seems
reasonable given the population of concern.
Cons: Time spent in microenvironments is specified for children < 6-years of age and
adults > 18-years of age. What of individuals 6-18 years of age? For children up to age 6, one wonders if the inclusion of a Travel
microenvironment is warranted given the likely time spent there.
Conclusion
The proposed methods to establish the activity patterns and microenvironments are reasonable.
Blood Lead Modeling
Pros: The IEUBK is the model of choice. No other model (Leggett, O”Flaherty) has
been so thoroughly validated, and so extensively used for pediatric PbB estimation.

Cons: The IEUBK model has been used extensively for PbB estimations at Superfund
sites. Here, the use of the model is extended beyond a Superfund framework. At superfund sites, a major source of Pb exposure is from contaminated soil. Applications of the IEUBK model at such sites can ignore measured indoor dust concentrations (which, because of the transient nature of indoor dust (variability in cleaning, etc.) are may not be representative of exposure) and assuming a large contribution to indoor Pb from soil indoor dust Pb can be estimated from soil Pb. Here the IEUBK model is essentially being run backwards, which it was not originally designed for, to quantify an unreliable, when measured, exposure parameter.
Care should be taken with the default value for the mass transfer of soil to dust term (MSD). Data from mining, smelting and milling sites in EPA region 8 seem to be very variable (average mass fraction of soil in dust at Butte-Silverbow, MT = 0.25; at California Gulch, CO = 0.14; at East Helena, Mt = 0.17; at Eureka Mills, UT = 0.15; Midvale Slags, UT = 0.04 and 0.1; at Murray, UT 0.19; at Sandy, UT = 0.11 ).
3. Developing Lead Dust Hazard Standards for Public and Commercial Buildings
Proposed Approach
Please see comments to Proposed Approach in Section 2 above.
Development of a Response Curve for the Blood Lead-Blood Pressure Relationship
The Nawrot et al. (2001) meta-analysis found that a doubling of the blood lead concentration is associated with an increase of 1.0 mm Hg in systolic blood pressure and a 0.6 mm Hg rise in diastolic pressure.
Pros: The Nawrot meta-analysis data probably provides the best aggregate data on a
PbB association with blood pressure.
Cons: The Nawrot meta-analysis is not particularly convincing.
o Some of the studies have wide confidence intervals (CIs).o In eight of the 48 different groups presented the change in the diastolic
pressure was negative.o In 29 of the studies the confidence intervals overlap with the line of zero
(no effect)o The Nawrot meta-analysis authors note “On balance across all human
studies the relationship between blood pressure and blood lead concentration is inconsistent based on the observation that many studies did not reach the level of significance.”

o The Nawrot meta-analysis authors note “The present meta-analysis shows an overall statistically significant positive relationship, which is weak in biological terms.”
Conversion of Dust Loadings to Dust Concentrations
Development of a Regression Equation – pro et contra
Pros: The regression equation involves few assumptions, it is easily understood, and is
empirically based.
Cons: The regression data is not from public/commercial buildings
o Absolutely nothing is known about the relationship between dust loadings and dust concentrations in public/commercial buildings ( where cleaning regimens are likely to be hugely different)
Aggregating all public/commercial buildings into a single category may be invalid.
Development of a Mechanistic Model – pro et contra
Pros: The mechanistic model can be modified for public/commercial buildings.
Cons: In its current form the model is probably inadequately parameterized to be
adapted to public/commercial buildings.o Residences all have the same building funtions (living room, kitchen,
bathroom, etc.), public/commercial buildings come in all shapes and sizes.o Public/commercial buildings will have different outdoor dust ingress rates.o Public/commercial buildings may be in different states of repair generally
than residences and building component sources of Pb may be very different.
o Cleaning removal of dust in public/commercial buildings may be very different if professional cleaning equipment is employed.
Conclusion
Neither the regression model, nor the mechanistic model seems “ready for prime time.”
Relation of Sill Dust to Floor Dust
Pros: The model is derived empirically.

Cons: The model is not from public/commercial buildings.
o There is no available data on the relationship between sill and floor dust in public/commercial buildings.
o Cleaning public/commercial buildings will be different than residences.o Presence of Pb paint in public/commercial buildings might well be
different compared to residences (renovation over time may be different in nature and extent).
Conclusion
The use of this regression relationship in a model for public/commercial buildings may be no better than guesswork.
Activity Patterns and Microenvironments
Pros: See responses in residential property section.
Cons: Should there be a separate exposure for individuals who work in
public/commercial buildings? Should there be different exposure metrics for individuals who work in different types of public/commercial buildings?
Conclusion
The proposed methods to establish the activity patterns and microenvironments are reasonable.
4. References
1. USEPA [1995] Laboratory evaluation of dust lead recoveries for samplers and vacuum cleaners. Volume I: Objectives , methods, and results. OPPT, EPA 747-R-94-004A
2. Hunt, A., D.L. Johnson, and D.A. Griffith [2008] Risk remaining from fine particle contaminants after vacuum cleaning of hard floor surfaces. Env. Geochem. Health, 30(6):597-611.
3. Thatcher T.L., and Layton, D.W. [1995] Deposition, resuspension, and penetration of particles within a residence. Atmos. Env., 13:1487-1497.
4. Phipatanakul, W., Eggleston, P.A., Wright, E.C., Wood, R.A., 2000. National cooperative inner-city asthma study. Mouse allergen. II. The relationship of mouse allergen exposure to mouse sensitization and asthma morbidity in inner-city children with asthma. J. Allergy Clin. Immunol. 106, 1075–1080.
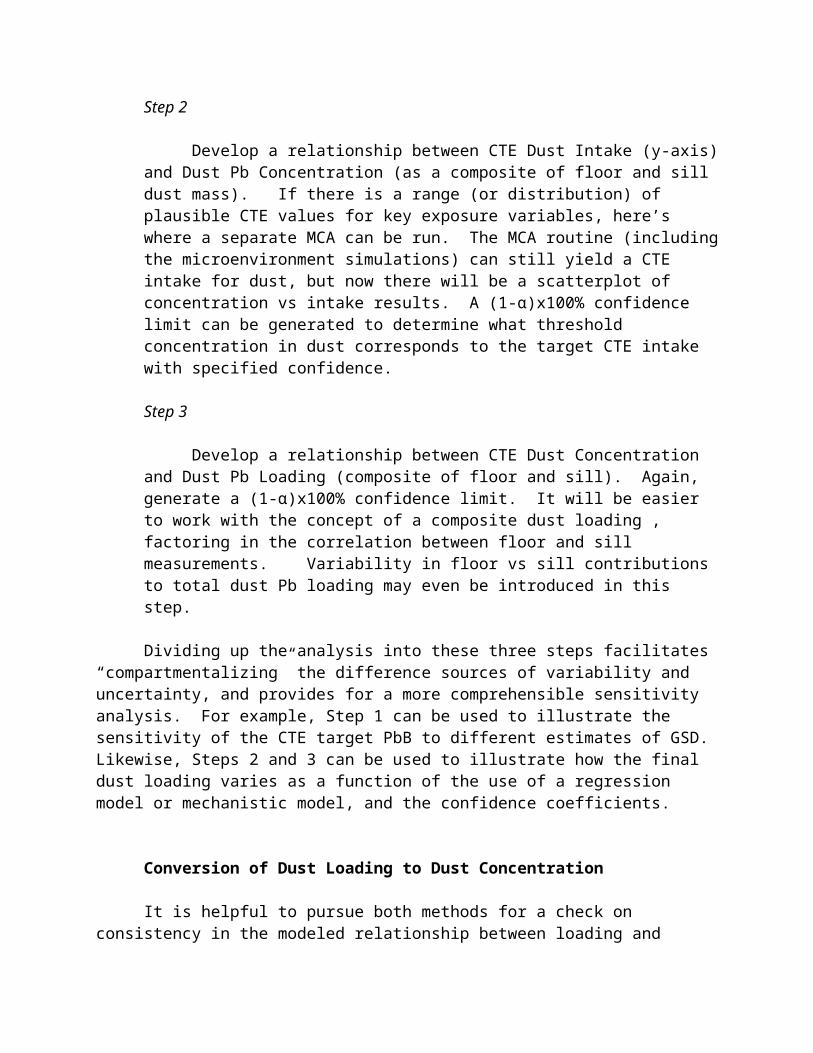
5. Gern, J.E., Visness ,C.M., Gergen, P.J., Wood, R.A., Bloomberg, G.R., O'Connor, G.T., Kattan, M., Sampson, H.A., Witter, F.R., Sandel, M.T., Shreffler, W.G., Wright, R.J., Arbes, S.A., Busse W.W., 2009. The Urban Environment and Childhood Asthma (URECA) birth cohort study: design, methods, and study population. BMC Pulm. Med. 9, 17.
6. Ozkaynak, H., Xue, J., Spengler, J., Wallace, L., Pellizzari, E., Jenkins, P., 1996. Personal exposure to airborne particles and metals: results from the particle team study in Riverside, California. J. Expo. Anal. Environ. Epidemiol. 6, 57-78.
7. Nazaroff, W.W., Klepeis, N.E., 2003. Environmental tobacco smoke particles. In Morawska L., Salthammer T., (Eds.) Indoor Environment, Wiley-VCH Verlag GmbH & Co. KGaA, Weinheim, pp 245-274.
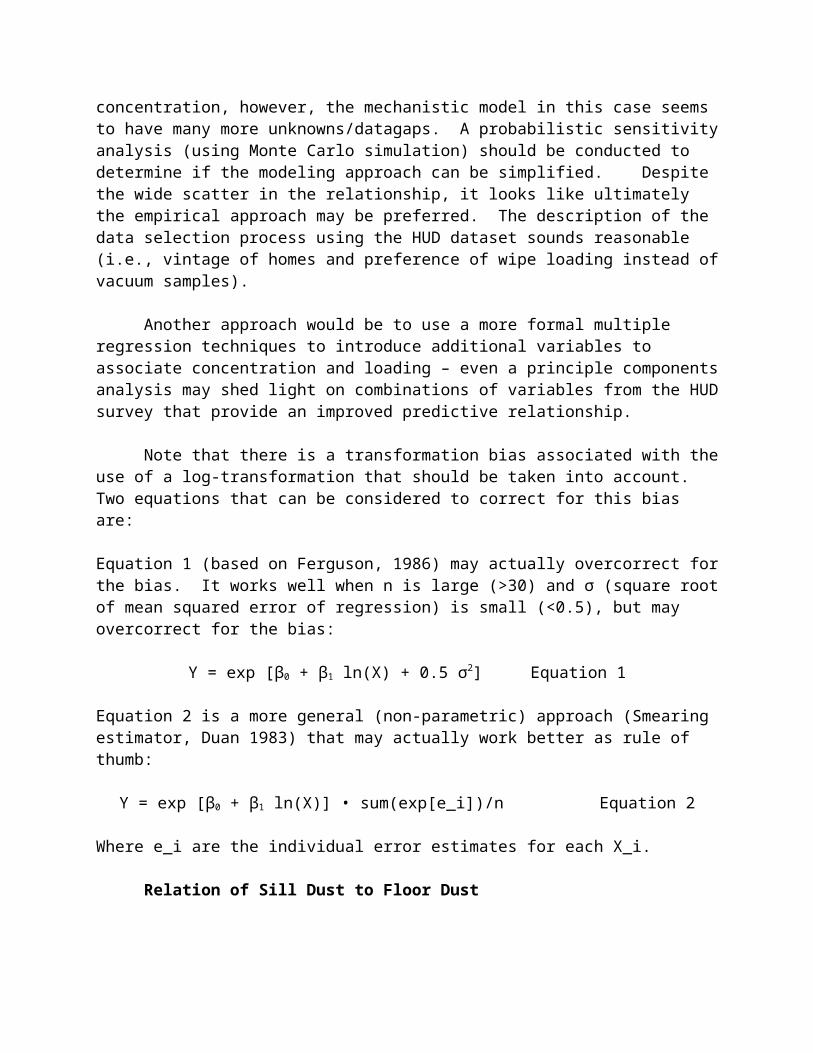
Comments from Dr. David E. Jacobs
1. General comments
The SAB Consultation Draft dated July 6-7, 2010 is well-articulated and thorough. The draft document for both residences and commercial & public buildings relies extensively on the IEUBK model, which requires conversion of dust lead loadings into dust lead concentrations. It also requires the use of many other assumptions. Together, these are likely to introduce unnecessary error into the findings and increase complexity. The approach can be strengthened considerably by augmenting the proposed approach with analysis of key empirical datasets, which reduces the number of assumptions involved, and then comparing the two resulting set of dust lead candidate standards. This comparative approach will strengthen the scientific basis of the dust lead standard. Specifically, the draft approach does not currently recommend the use of recent analyses of dust lead and blood lead data from the National Health and Nutrition Examination Survey (NHANES) (Dixon et al. 2009; Gaitens et al. 2009). These data are nationally representative and include blood and dust lead measurements from resident children and their households. This is the first such nationally representative dataset to include these metrics and should receive more attention from EPA in the development of the candidate standards. The data (in three NHANES waves) are publicly available at: http://www.cdc.gov/nchs/nhanes/nhanes1999-2000/lab99_00.htm
The specific comments below are organized by the charge questions and are intended to increase the scientific certainty associated with the development of valid standards.
2. Specific Comments
Reasonableness of Approach
The draft approach involves the following steps: (1) Select a target blood lead concentration; (2) Estimate environmental media and exposure concentrations; and (3) Estimate resulting blood lead concentrations.
The first step is presented as optional point estimates of 1, 2.5 and 5 µg/dL in the target blood lead level. Another option worthy of consideration by EPA is to develop dust lead standards that are associated with incremental increases in blood lead levels, holding all other important exposures and covariates to their national averages. This approach is more consistent with the vast evidence demonstrating that there is no blood lead level below which adverse health effects have not been found. In short, selecting a target blood lead level of, for example, 1 µg/dL would mean that the resulting standard would not be sufficiently protective, because there is likely to be significant harm at such a blood lead level when coming from all sources. The importance of this distinction can be seen in the paper from Smith and Flegal, 1992, demonstrating that so-called “natural background” blood lead levels are on the order of 0.016 µg/dL. This approach is also more consistent with an empirical approach, an example of which
57
is shown in Lanphear et al. 1998, which pooled 12 epidemiological studies examining the relationship between children’s blood lead levels and dust lead levels in the home environment. This analysis was also used by HUD in establishing its dust lead standard for federally assisted housing in 1999. This empirical approach using epidemiological data that controlled confounding influences and therefore requires fewer assumptions because the association between dust and blood lead is measured empirically. However, the Lanphear 1998 data are not nationally representative, suggesting that the new NHANES dataset should be used instead. It also means that the agency need not attempt to estimate exposures from all potential lead sources. In short, future modeling should include a comparison between modeling a specific target blood lead level, combining exposures from all sources, with a second model that estimates incremental increased blood lead due to incremental increases in dust lead exposure (if it is not feasible to do the incremental approach, the NHANES data can still be used to estimate a target blood lead level). In both cases, a targeted blood lead level of 1 µg/dL is reasonable. Target blood lead levels of 2.5 µg/dL and 5 µg/dL are too high to be adequately protective.
The evidence linking IQ decrements with low blood lead levels is scientifically robust and is a reasonable approach to use as a health endpoint in the development of the dust lead standard. However, EPA should note that selection of this endpoint means that other adverse health effects associated with lead exposure have not been included. This suggests a conservative approach (a necessary underestimate of the true health consequences of exposure to residential dust lead). The use of blood lead data from children under six is also an appropriate approach, as is the use of both concurrent and lifetime blood lead data. It is likely that IQ decrements will be the most sensitive endpoint available and therefore can be used to ensure protection against the other adverse effects of lead.
Use of the IEUBK model also requires the use of estimates or assumptions for exposures from air, water, soil and others, as well as estimates for a number of microenvironments. Again, the use of epidemiological data minimizes the need to develop such estimates or assumptions. For example, the draft document states that exposures from soil are assumed to occur only outdoors. However, a number of studies have examined dust lead exposure at the entryway, both the interior and the exterior entryway (for example NCHH 2004). Entryways have been shown to be related to soil track-in, so it would be important for EPA not to include entryway dust lead results in estimating indoor dust lead loadings. Similarly, the document states that children are assumed to have no exposure to dust or soil while in an automobile, i.e., their exposure is entirely from airborne lead. However, a number of studies of paraoccupational exposures (“take home” lead) shows that worker’s cars can become extensively contaminated with both dust and soil lead.
Conversion of Dust Lead Loading to Dust Lead Concentration
The draft approach uses data from the HUD National Lead Paint Survey ca. 1990, which provided side-by-side dust sample data using dust wipes (which provide loading only) and blue nozzle vacuum samples (capable of producing data on both concentration by weight as well as loading). Another side-by-side study demonstrated that loading is better correlated with children’s blood lead level than is concentration (Lanphear 1995). To my knowledge, the blue
nozzle vacuum sampling method has never been correlated with children’s blood lead level (although a number of other vacuum sampling methods have been).
Furthermore, the Blue Nozzle method has been abandoned for more than a decade, due primarily to concerns about inadequate collection efficiency from smooth surfaces (the Blue Nozzle tends to “stick” to such surfaces due to the vacuum and may push dust lead to the edges of the surface, rather than collecting it). Importantly, the blue nozzle method has not been used in the two most recent HUD national lead paint surveys, which have used the wipe method instead.
As a practical matter, loading is a more stable measure, because it is not confounded by the addition of dust with no lead, but concentration is. For example, if one were to add lead-free sand to a square foot of a surface with a known amount of lead dust on it, the loading in µg/ft2 would not change, but the concentration in µg/g would be reduced, i.e., the concentration of lead would be diluted. There is substantial evidence that cleaning reduces dust lead loading over the long term, but the evidence for concentration is far less clear.
In any event, it is not valid to expect that all vacuum sampling methods will produce the same correlation with wipe samples, because each vacuum sampling method is likely to collect different particle size fractions, which can be expected to have different lead concentrations. A study comparing two vacuum methods with the wipe method showed this finding (Lanphear et al. 1995). In addition, the surface type (e.g., smooth hard floors vs. carpeting) is likely to add error to the regression between wipe loading and vacuum concentration, because vacuums are likely to collect dust from deep in the carpet, while wipes are more likely to collect lead from the carpet surface (the latter is more readily available to children). The use of an abandoned sampling method in the EPA draft approach casts doubt on the ability create a reliable method of converting loading to concentration. Furthermore, it is highly unlikely that vacuum sampling methods will ever be able to be widely implemented in the nation’s housing stock, because it is a far more complicated and expensive sampling method compared to the wipe sampling method. The sole justification provided by EPA in the draft approach for using vacuum sampling data is that the IEUBK model requires an input term in concentration, not loading. Again, the use of empirical epidemiological data, which often provides wipe sampling loading data, avoids the need for such a conversion and should be used to augment the recommended approach. Finally, the two metrics (µg/ft2 and ppm) are by definition different. While it may be reasonable to develop regression equations to derive conversion factors to convert loading into concentration, it makes little sense to take wipe sampling data, convert it to concentration, model the results against blood lead data using the IEUBK, and then convert it back again to loading in the presentation of candidate dust lead standards. Each of these steps will introduce additional error into the final estimates unnecessarily, compared to the use of empirical data. However, it would be best to attempt to perform both the empirical analysis and the IEUBK modeling to determine if there is a substantial difference between the two approaches.
Specifically, on p. 9 of the EPA residence approach document, it states that the wipe loading data were used to determine the relationship between loading and concentration. However, this does not seem to be possible, because wipe samples do not produce concentration estimates. This sentence should be corrected in future work, stating that vacuum data were used.

In short, a more scientifically defensible approach is to use epidemiological data to estimate the relationship between dust and blood lead, either instead of, or in addition to, IEUBK modeling results.
Relation of Sill to Floor Dust
The approach in the proposal appears to be reasonable. However, EPA should compare the estimated relationship in the draft approach with the empirical approach from the NHANES dust lead database (Dixon et al. 2009), which supports the following relationship:
Ln(sill dust lead loading) = 2.654 + 0.524 x ln(floor dust lead loading)
Dixon et al. (2009) also presents standard errors for intercepts and slopes.
The differences in the two estimates using the EPA draft approach and the NHANES data should both be presented in the development of the dust lead standard. The NHANES dust and blood lead data are nationally representative and more current than the data used in the draft EPA approach document. Because it is more representative and more current, it is likely to produce more reliable estimates of the relationship between floor and sill dust lead, as well as the relationship between dust lead and children’s blood lead. The relationship can also be estimated from a larger data set in the national evaluation of the HUD lead hazard control grant program, which, although older and less representative, includes data from 14 jurisdictions from across the country (NCHH, 2004).
3. Other comments
The development of exposure profiles using data from CHAD and algorithms from the APEX model both appear to assume that time spent in a particular activity is necessarily related to exposure, which tends to ignore the magnitude of an exposure for a particular microenvironment. Again, a superior method would be to use epidemiologic data, which would avoid the need to assume that time spent in a microenvironment is equivalent to exposure.
The current draft EPA approach separates time spent in the residence with time spent in a child occupied facility (COF). A national survey of institutional day care centers from HUD appears to show that the prevalence of lead-based paint hazards is about the same as in housing. This suggests that it may be possible to combine time spent in the residence with time spent in a COF. The following is a summary of the HUD day care center survey:
“HUD sponsored a national environmental health survey of licensed childcare centers in partnership with the U.S. Environmental Protection Agency. Lead was measured in paint and in dust and soil samples. Dust and wipe samples were also collected for allergen and pesticide analyses, respectively. A total of 168 randomly selected licensed daycare centers were recruited into the study and data were collected from July - October, 2001. Main lead-related findings from the survey include:
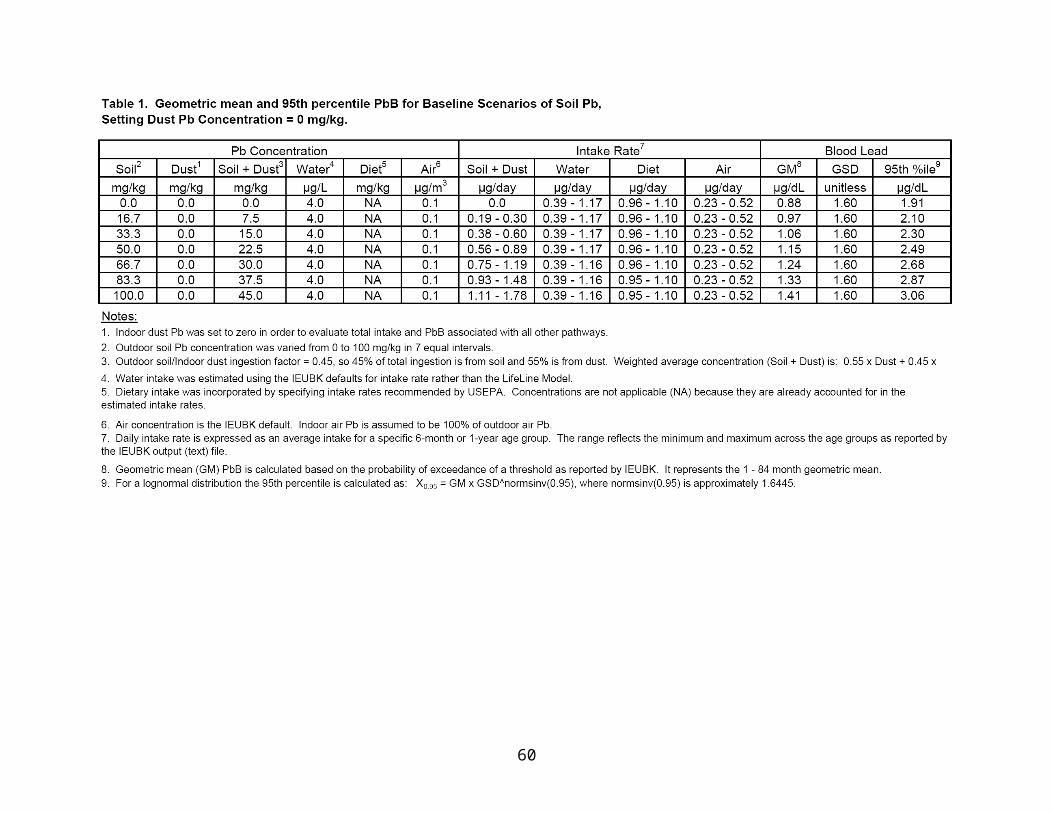
Lead-based paint is present in 28% of childcare centers.
14% of childcare centers have one or more significant lead-based paint hazards (11% with significantly deteriorated lead-based paint, 3% with dust-lead hazards, and 2% have soil-lead hazards).
Centers where the majority of children are African American are four times as likely (30% compared to 7%) to have significant lead-based paint hazards compared to those where a majority of children are white.”
From: http://www.hud.gov/offices/lead/researchers.cfm
NHANES Dust Lead Summary
HUD collaborated with CDC to collect dust lead samples in homes of children included in NHANES from 1999-2004 (n=2,155 children). The findings were published in two companion articles in EHP (Dixon et al. 2009; Gaitens et al. 2009). The data set is available on the CDC website (there are three waves of data, one for each two year NHANES reporting period; the first year is available at this link: http://www.cdc.gov/nchs/nhanes/nhanes1999-2000/lab99_00.htm
The programming of these data is complex and is available from the National Center for Healthy Housing upon request. Briefly, the data include a number of important variables that are not accounted for in the IEUBK modeling in the proposed EPA approach, including type of home, year of construction, length of time in the home environment (years of residency), smoking, paint condition, previous repainting and housing rehabilitation, poverty-to-income ratio and others. Wipe samples were collected from the floor and window sill in the room where the child spent most of the time. Unusually low detection limits were achieved using graphite furnace atomic absorption spectroscopy (<0.16 µg/wipe for floors and <2 µg/wipe for sills and <0.3 µg for blood lead). These data may be amenable to modeling blood lead levels at 1 µg/dL. Data on surface condition were also collected. Results show that only 0.16% of the floors and 4% of the window sills had dust lead levels above the current EPA standards (e.g., 40 µg/ft2 for floors). After controlling for a large number of confounding influences, the results show that at a floor dust lead level of 12 µg/ft2, more than 95% of children will have blood lead levels below 10 µg/dL; at a floor dust lead level of 1 µg/ft2, more than 95% of children would have a blood lead below 5 µg/dL.
EPA should make more extensive use of these data than currently proposed in the draft approach for the development of the dust lead standard. EPA could use this data set to model dust lead levels related to a target blood lead level of 1 µg/dL, although this was not published in the two articles cited. While the NHANES data are representative of children, it would be important for EPA to determine if the houses in the NHANES data set are also nationally representative. This could be done by examining the housing characteristics in the NHANES cohort with the national housing characteristics in the American Housing Surveys from the same years (see http://www.census.gov/hhes/www/housing/ahs/ahs.html).
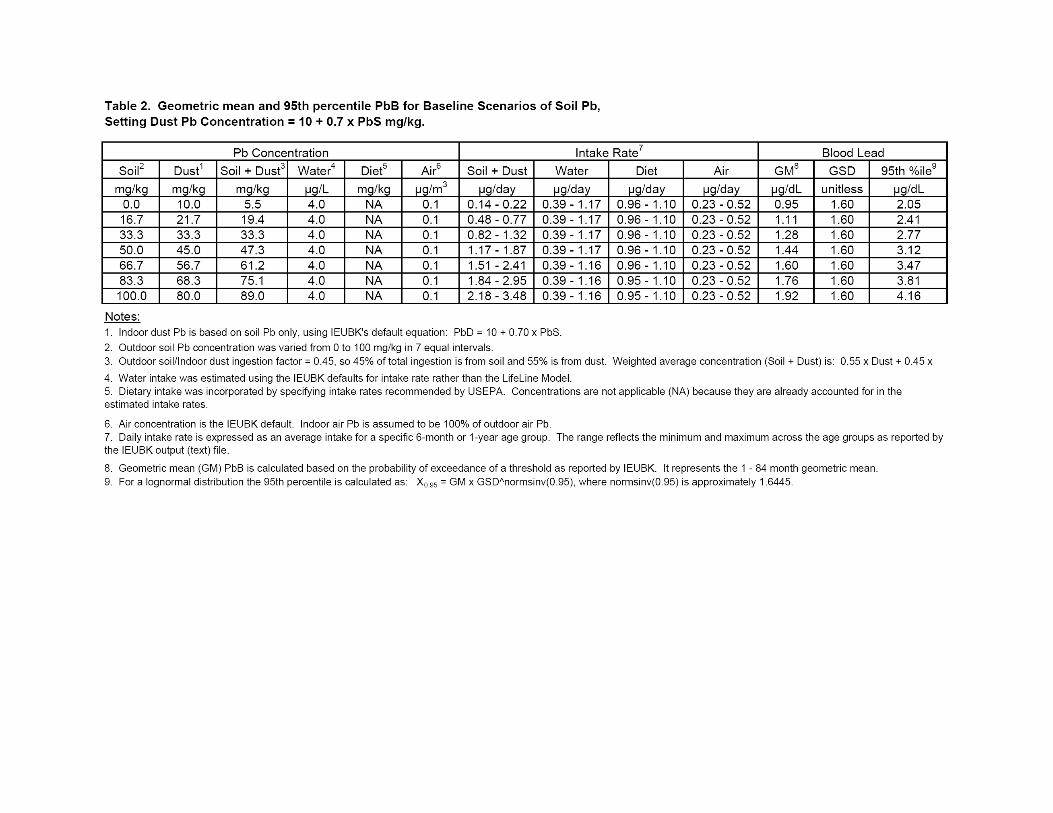
While the NHANES data do not provide dust lead levels in concentrations, making their inclusion in IEUBK modeling problematic, the direct measurement of dust and blood lead in a nationally representative sample eliminates the need to make assumptions regarding other exposures and time spent in individual microenvironments.
4. References
Dixon SL, Gaitens JM, Jacobs DE, Strauss W, Nagaraja J, Pivetz T, Wilson JW, Ashley PJ. U.S. Children’s Exposure to Residential Dust Lead, 1999-2004: II. The Contribution of Lead-contaminated Dust to Children's Blood Lead Levels, Env Health Perspect 117: 468-474 (2009)
Gaitens JM, Dixon SL, Jacobs DE, Nagaraja J, Strauss W, Wilson JW, Ashley PJ. U.S. Children’s Exposure to Residential Dust Lead, 1999-2004: I. Housing and Demographic Factors Associated with Lead-contaminated Dust, Env Health Perspect 117: 461-467 (2009).
Lanphear BP, Emond E, Weitzman M, Jacobs DE, Tanner M, Winter N, Yakir B, Eberly S. A Side-By-Side Comparison of Dust Collection Methods for Sampling Lead-Contaminated House Dust, Environ Res 68, 114-123, 1995.
Lanphear BP, Matte TD, Rogers J, Clickner R, Dietz B, Bornschein RL, Succop P, Mahaffey KR, Dixon S, Galke W, Rabinowitz M, Farfel M, Rohde C, Schwartz J, Ashley P and Jacobs DE. The contribution of lead-contaminated house dust and residential soil to children’s blood lead levels: A pooled analysis of 12 epidemiologic studies. Environmental Research 1998;79:51-68.
National Center for Healthy Housing and University of Cincinnati. 2004. Evaluation of the HUD Lead Hazard Control Grant Program (final report). Available: http://www.nchh.org/LinkClick.aspx?fileticket=1jFfxfohcig%3d&tabid=273
Smith DR, Flegal AR. The public health implications of humans' natural levels of lead.Am J Public Health. 1992 Nov;82(11):1565-6.
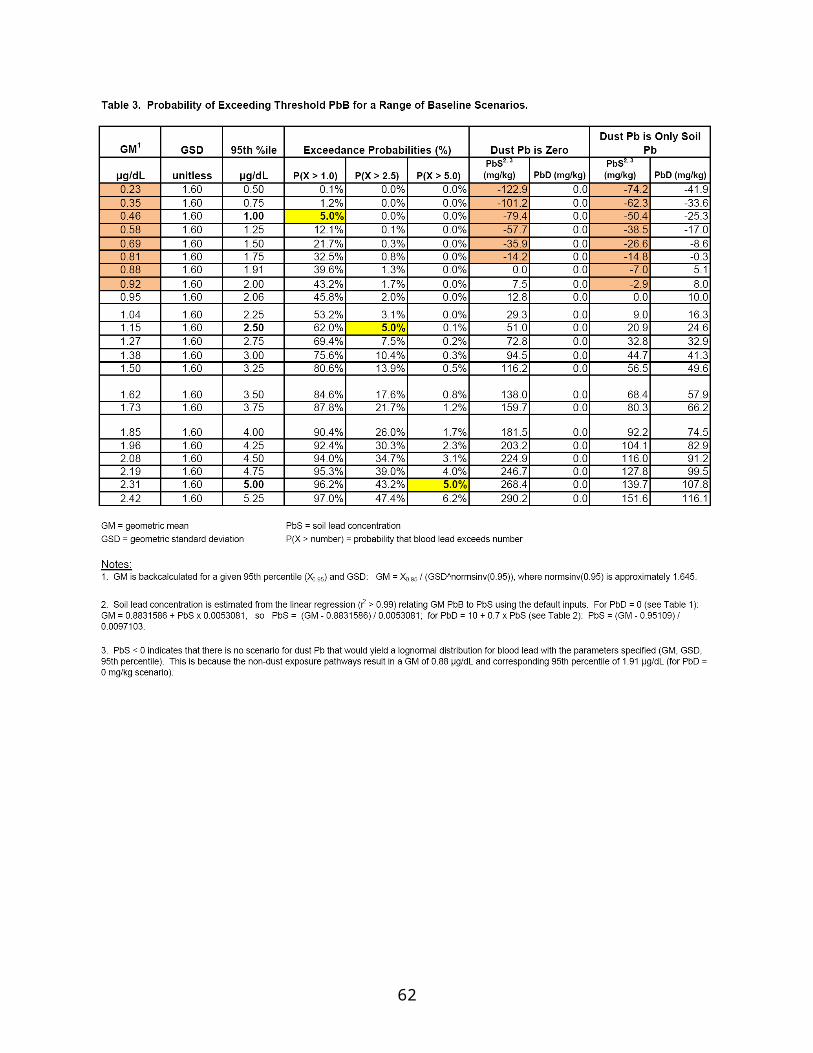
Comments from Dr. Michael Jayjock
1. Developing Lead Dust Hazard Standards for Residences
General Comments
Monte Carlo (MC) Simulations
The Analysis and Consideration of Uncertainty and its components of Lack of Knowledge (Ignorance) versus Natural Variability
I had originally considered rendering this note as an email exchange between myself and an old friend and colleague, Cathy Fehrenbacher (EPA, OPPT). Aaron Yeow convinced me that it should be part of my general comments on this work providing general advice on lead modeling.
Over the years, when analyzing uncertainty relative to the predictions in my work of substance exposure and risk it became very clear that it (uncertainty) is comprised of two components; viz., natural variability of the predictor variables and a basic lack of knowledge related to the true value of these variables. For convenience I call the second component ignorance. In many, indeed most, cases I have found this second component (ignorance) to be dominant.
For a long time I have used a software tool entitled “Crystal Ball” (CB) to conduct standard (one dimensional) Monte Carlo simulations. In executing a mechanistic model I would use all available information to determine and ascribe a specifically parameterized probabilistic distribution function (PDF) for each predictor variable in the model and then run the MC simulation with 10,000 trials to get some idea as to how much variability was extant in the prediction distribution. Examining the distribution of predicted results and the predicting PDFs (what CB calls the assumptions) triggered a number of, now evident, conclusions from this visualization:
1. The predicting PDFs were of 3 types. a. Type I – comprised predominantly of natural variability (e.g., adult body
weight)b. Type II – comprised to a very large extent of ignorance (e.g., natural
ventilation rate or level of linear air movement in a particular indoor industrial setting)
c. Type III – a reasonably equal or significant mixture of both components.
2. The distribution of predicted resulting exposure in cases where Type II or Type III PDFs were utilized is not reality but it is the best portrayal of reality given the limitations of the information at hand.
63
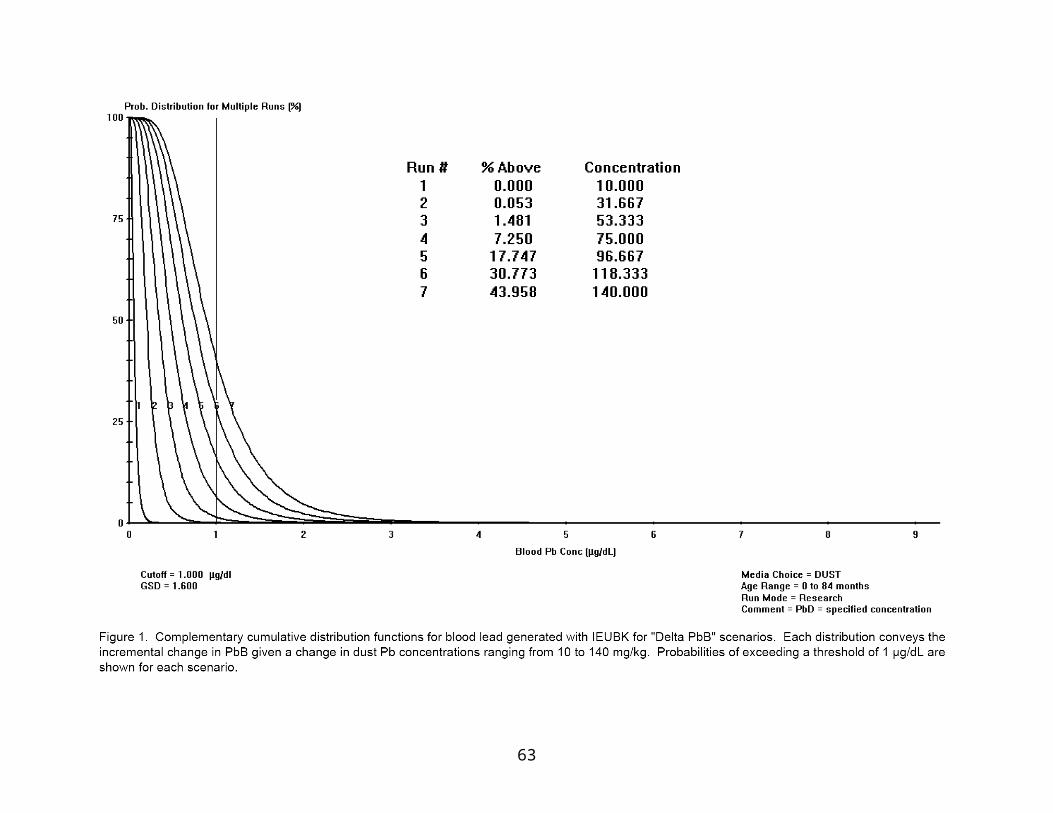
3. The predicted distribution will get significantly (sometimes dramatically) more narrow if we can reduce the ignorance involved with the Type II predictor variables to make them more like Type III or ideally Type I.
I have written about the process described in the third conclusion above in some detail in a recent text (Jayjock et al, 2009).
I am not a statistician but I am a user of statistical tools. The CB tool presents the option of doing a sensitivity analysis for any MC simulation as described above. This option provides a specific output showing the percentage of the variance (of the output distribution) provided by each simulated (PDF) variable. For example, consider a model with 10 predictor (PDF) variables in which 3 of the variables are shown to account for 90% (say approximately 30% each) of the total variance. If these variables are all Type I then additional research and resource allocation to further define these variables would not be warranted. If, however, they were all Type II or a mixture of Type II and III then addressing the informational/data needs of these variables would pay high dividends in narrowing the output distribution and in added confident knowledge of the model’s predictions.
This approach requires the analyst to be scrupulously honest in the assignment of the predicting PDFs relative to what is known and not known about them. When ignorance is very high a UNIFORM PDF with a relatively broad range (MIN, MAX) may be the appropriate assignment for that variable. Sometimes this is best done by discussion and consensus with a group of modelers.
The above analytical/judgmental approach is how I have done MC analysis for many years. More recently I have become aware of an analytical tool called 2 Dimensional Monte Carlo Analysis (2D MCA). To those encountering it for the first time it can appear to be fairly complicated. Indeed, for those who want a very basic, detailed, if somewhat lengthy, explanation of this technique, I have written a 4 page memo on it (Jayjock, 2009).
Apparently at its core 2D MCA is done by “nested” simulations in which one has an inner loop with variables dominated by some level of natural variability (Type I) and an outer loop in which Type II (lack of knowledge) variables are sampled and then run in the subsequent inner loop simulations. TYPE III variables are also handled by 2D MCA. Instead of calling them Type III, CB advises that these are called “second-order” assumptions or variables. 2D MCA handles Type III by assigning parameterized PDFs to the parameters of the original PDFs in the predicting distribution. (I told you it was somewhat complicated). One can model these types of predictor variables or “assumptions” as CB calls them by placing the uncertain (PDF) parameters of the variable distribution in separate cells (one cell for each parameter and each CB cell describing a designated PDF for that parameter) and then calling out, sampling from and simulating these cells in the outer loop of the simulation.
During the 2D MCA the process runs an outer loop to simulate the uncertainty value(s). That is, it samples from the outer loop distributions and then runs an entire simulation, using these sampled parameters, on the inner loop variables. Thus, if you run 100 outer loop simulations in the 2D MCA you get 100 prediction distributions. One can examine a combined

display of all of these distributions to get a sense of the overall width or range of predictions caused by the lack of information (ignorance) about the predictors.
Clearly, 2D MCA provides valuable information; however, from my perspective, the standard or 1D Monte Carlo method with sensitivity analysis combined with reasonably applied judgment remains the best method for determining confidence and, more important, the next steps to improve one’s level of certainty, if any.
References
Jayjock MA, Ramachandran G, Arnold SF (2009): Uncertainty. Chapter 10, page 81-83 in Mathematical Models for Estimating Occupational Exposure to Chemicals, CB Keil, CE Simmons and TR Anthony Eds., ISBN: 978-1-935082-10-1, American Industrial Hygiene Association, Fairfax, VA.
Jayjock MA (2009): December 23, 2009 Memo: 2D Monte Carlo Simulation in Crystal Ball 11.doc.
Proposed Approach
The overall methodology is well presented in Figure 1-1 which clearly shows the approach for developing the hazard standards for floor and window sill lead loadings. This figure and subsequent text present a somewhat complex but ultimately straightforward approach which appears to me to be well thought out and quite logical. Properly parameterized this model should serve the intended need and provide a reasonable answer to the question at hand. The real questions for me becomes: How well are the predictor variables characterized and if poorly characterized (i.e., accompanied by high total uncertainty) how is this lack of confidence appropriately handled within the method? My sense is that the model should undergo an intensive and complete 1D and 2D Monte Carlo analysis as described above.
As part of the methodology some consideration should be provided to set an explicit and specific consensus criterion for the subsequent standard; e.g., 99% of the exposed population would be protected from a 1 point loss of IQ.
Also, the model is complicated enough that it would benefit from providing some reasonable level compartmentalized output during its development and evaluation. That is, what are the model-predicted relative rates of dust input to and accumulation within a residence or non-residential space from penetrated and settled PM10, flaking paint, cooking and dander. This could be done by zeroing out certain inputs. Comparing these compartmentalized predictions with known or reasonably inferred values for these variables could significantly aid in the evaluation of the current model and its parameters.
Conversion of Dust Loadings to Dust Concentrations
I have dedicated a significant portion of my professional career to the development, use and evaluation of models of human exposure assessment and can say, without reservation, that

this mechanistic model is one of the more complicated constructs I have encountered. The authors are to be commended in their methodical approach and presentation of this work for which I cannot find any logical errors. Clearly, a lot of very good thought, consideration and technical acumen went into this work.
The arguments about the advantages and disadvantages of the empirical versus the mechanistic models are well considered and well presented within the report. Indeed, the best use of mechanistic or first principle modeling (versus monitored data/empirical modeling) almost always occurs when there is a need for portability. That is, when there is a need to extend the model beyond the scenario or simulation from which it was derived. Thus, my sense is that the empirical model of loading to concentration should be used for residences and the best mechanistic modeling construct should be used for the non-residential buildings under consideration.
More important, it should be noted that both approaches have a considerable level of uncertainty. For example, the regression model of the log-transformed empirical model only accounts for 46.5% of the variance (R2 = 0.465). I am not a statistician but I understand that the definition of variance is the difference between what is expected and what actually occurs (or is measured). In this case it means that the empirical regression model predicts or expects a value and the reality (measurements) will be significantly higher or lower than that predicted value. On one side the predicted value it will over-predict exposure/risk while on the other it will under-predict risk. Of course, proper risk management should reasonably guard against the risk of under-predicting the exposure/risk.
Thus, I believe that one needs to deal with the fact that over half the total variance in the empirical model predictions is in unaccounted for and is possibly random error. This error should be addressed in the ultimate uncertainty of the lead dust hazard standard. That is, appropriate risk management should appropriately trade conservatism for any significant lack of confident knowledge in the final expression of the standard.
One of the panelists, whose name escapes me, appropriately suggested during the meeting that all of this remaining variance (100 – 46.5 = 53.5%) is probably not completely random error and that the R2 could be significantly enhanced by seeking out one or two critical additional variables for inclusion in the model predicting concentration from loading.
On another matter, I am fascinated with the fact that a portion of dust within our residential space and many of our non-residential building is composed of desquamated skin cells or “dander” as identified in the document. Indeed, within the mechanistic model a specific and non-trival rate of dander is included as dust mass input. I consulted with a colleague who has been working on this aspect of indoor exposure modeling, Dr. Charles Weschler (Rutgers University), to ask him if he had or knew of other data on this input source. I asked him this because he presented recently the following data at an EPA Exposure Assessment Workshop (December 2009, RTP, NC):

Desquamation
• Shedded skin flakes– roughly 40 x 30 x 2 µm (~ 2.5 ng/flake)
• Shedding rate per occupant– 30 –90 mg skin flakes/hr (–200,000 –600,000 skin flakes/min)
• Squalene content of skin flakes ~ 1% by weight
References: Baker & Kligman, Arch Dermatol, 1967; Clark & Shirley, Nature, 1973; Gowadia & Settles, J Forensic Sci, 2001; Milstone, J Derm Sci, 2004
Squalene was chosen as a marker because of its presence in skin cells and absence in dust from vegetable matter.
Dr. Weschler also presented some distributional information on squalene in dust measurements done in Danish children’s bedrooms and day care centers which is reproduced below:
Children’s bedrooms (n =500) Geometric Mean = 27.2 µg/g (R2 = 0.95)Geometric Standard Deviation 4.3Median = 30.2 µg/g
Daycare centers (n = 151)Geometric Mean = 9.7 µg/g (R2 = 0.97)Geometric Standard Deviation 4.3Median = 8.9 µg/g
Assuming only 1% of the mass of these skins cells was squalene, then these data indicate that skin cells comprised a median value of 3020 µg/g of the total dust sampled in these 500 children’s bedrooms and 890 µg/g in the 151 Daycare centers.
If squalene is reasonably stable in the indoor environment then the rate of dander input into these rooms is clearly not a dominant or even a significant source of total dust since it accounts for less than 0.4% of the sampled mass of total dust in these spaces.
Dr. Weschler presented this data at the Spring ASC meeting in San Francisco and will also be submitting a manuscript which contains these data.
Relation of Sill Dust to Floor Dust
The method proposed is logical but again fraught with a high relative uncertainty. In the data set cited the R2 values were dismally low which introduces the same issues of trading

conservatism for confident knowledge in the model output and subsequently in the considered standard as discussed above.
Activity Patterns and Microenvironments
From my perspective the description of the CHAD database and the use of algorithms from APEX and a probabilistic algorithm to portray day-to-day variations of simulated individuals all make complete sense to me. That is, I believe that the natural variability of human activity can be reasonably captured and described and, unlike the issues related to the mechanistic model, it represents true variability and not uncertainty born of a lack of knowledge.
One of the reasons a dust concentration of lead in dust (versus a surface dust loading) is required for the model is that a primary source of exposure will most likely be from incidental ingestion of soil and dust. The primary input for this variable (ingestion) will be age-related data of mg/day of dust and soil ingested from the work of Calabrese et al and summarized in the latest editions of the Child Specific and General EPA Exposure Factors Handbooks. To the extent that these data are specific to residential or nonresidential exposures either indoors or outdoors they can and should be coupled with the information on time activity. To the extent that they are not then the general rate of age-related incidental ingestion should be used for all or most activities.
Previous work by one of the panelist (Dr. Goodrum) should be consulted relative to adult ingestion of soil and dust (USEPA, 2001). This is a solid analysis of the available data with a well justified recommendation for a PDF. The general issues discussed within this piece should also inform the interpretation of the ingestions rates used for children.
USEPA. 2001. Rocky Flats. Task 3 Report And Appendices: Calculation Of Surface Radionuclide Soil Action Levels For Plutonium, Americium, And Uranium
Blood Lead Modeling
I am not familiar with this model or the others mentioned as this specific type of modeling is somewhat beyond my areas of expertise, however, from the discussion within the draft it definitely appears to be the most appropriate model available for this particular work.
2. Developing Lead Dust Hazard Standards for Public and Commercial Buildings
Proposed Approach
Please see the comments on Proposed Approach in Section 1 above.
Development of a Response Curve for the Blood Lead-Blood Pressure Relationship
I find it fascinating that a large meta-analysis of 31 U.S. and European studies of over 54,000 subjects could actually document a small but significant increase in blood pressure in adults for every doubling of blood lead. I do not doubt that this is a valid and legitimate

relationship and as such it clearly could be used to develop a response curve that can be used in the hazard standard development. The real question for me is: What is the possible magnitude of BP increase as a result of exposure to lead and what is the health significance of this rise? Let us for example consider the doubling of 0.3 µg/dL to 0.6 µg/dL as causing a increase in systolic pressure in a normal adult of 1mm Hg from 120 to 121mmHg. Seven more doublings to 77 µg/dL would render a systolic pressure of 128mmHg. I am not a physician or expert in lead toxicity but my sense is that this increase in BP is not a significant health burden and that almost 80 µg/dL of blood lead could and may indeed have more dire consequence to an adult’s health.
During the meeting, Dr. Kosnett suggested that a more appropriate outcome from adult exposure would the effect of maternal blood lead on the offspring. Dr. Jacobs suggested that perhaps a carcinogenic outcome from adult exposure to lead may be a better choice.
From my perspective, the BP effect seems to be relatively “clean”; that is, it is well defined and data rich. If, however, there are good data for either of these other two adverse health outcome then I would vote to use the most sensitive response that has good data.
Conversion of Dust Loadings to Dust Concentrations
Please see comments on Conversion of Dust Loadings to Dust Concentrations in Section 1 above.
Activity Patterns and Microenvironments
Please see comments on Activity Patterns and Microenvironments in Section 1 above.
Blood Lead Modeling
Please see comments on Blood Lead Modeling in Section 1 above.

Comments from Dr. Michael Kosnett
The following are revised comments on the draft proposed approach documents submitted following the SAB review panel meeting of July 6 and 7, 2010. They may be subject to revision in the future I continue my assessment of the documents and the issues at hand.
1. Developing Lead Dust Hazard Standards for Residences
Reasonableness of the Approach
It is scientifically reasonable to select a decrement in the full-scale IQ of young children as the key endpoint of concern, to recognize that there is no identifiable level of lead exposure not associated with some risk of deleterious effect, and to affirm that the IQ/blood lead level (BLL) dose-response is well described by a log-linear model that is steepest at low BLLs.
The draft proposed approach described in the narrative is intended to identify dust-lead hazard standards for floors and window sills that would result in a target blood lead concentrations of either 1.0, 2.5, or 5 µg/dL being “reached”, taking into consideration the likely distribution of lead exposure from other sources (food, water, soil, and air). Implicit in the selection of these target blood lead values is that they would correspond to definable decrements in IQ. However, unlike other risk-assessment approaches (notably the NAAQS for lead issued by EPA in 2008), the narrative does not identify a benchmark decrement in IQ that would form the basis for the dust-lead hazard standards. Consideration should be given to presenting an approach that a) identifies a benchmark change in childhood IQ that would be considered “de minimis” or otherwise consistent with EPA’s mandate to protect public safety, b) determines an IQ/blood lead slope reflective of the dose-response observed in epidemiological studies of low level lead exposure, and c) employs modeling techniques to relate dust lead loading to a blood lead increment (at a particular percentile) that corresponds to the benchmark change.
An approach of this nature worthy of review was recently implemented by the Office of Environmental Health Hazard Assessment of the California Environmental Protection Agency (Carlisle and Dowling, 2007; Carlisle, 2009). While still acknowledging the absence of a low dose threshold, Cal EPA proposed a decrement of one IQ point in a child as a feasible benchmark for risk assessment. Using data from Lanphear et al (Lanphear et al, 2005) that identified the 97.5 % upper confidence limit of the IQ/blood lead relationship (across a range of <1 to 10 µg/dL); Cal EPA associated a blood lead increment of 1 µg/dL with a one IQ point change. As a next step, models that related lead ingestion to an estimated distribution of blood lead values (LeadSpread and the EPA Adult Lead Model) were used to identify lead ingestion quantities in a child (or a pregnant adult) that would result in a 90th percentile blood lead increment of 1 µg/dL. These “quantities” of lead were in turn used to identify screening levels of lead in soil (using assumptions regarding bioavailability). CalEPA’s discussion of its approach noted that selection of the 97.5 upper confidence limit on the IQ/blood lead relationship and the 90th percentile of the modeled blood lead distribution accommodated two
70
major sources of uncertainty. The resulting soil screening levels were considered to yield no more than a 2.5% probability of decreasing IQ by more than 1 point in a 90th percentile child.
EPA’s proposed approach for dust lead hazard standards could readily be modified to reflect a similar benchmark methodology and rationale. The draft narrative would have to be expanded to describe the analytical pathway from dust lead exposure to a benchmark IQ decrement. Identification of a specific IQ/BLL slope to use in benchmark analysis would require further discussion. For example, in the NAAQS for lead, EPA focused on -1.75 based on the results of epidemiological studies confined to children with blood lead concentrations closest to those in US children today (EPA, 2008, table 3), whereas CalEPA utilized a slope of -1.0. The designation of the percentile in the modeled blood lead distribution that would have to reach the targeted change in blood lead (e.g. the 90th percentile selected by CalEPA) will ultimately be a policy decision, but it should be informed by a detailed presentation of model uncertainty. Finally, it might be instructive to discuss other approaches. For example, in an approach analogous to that employed by the NRC in its risk assessment for methylmercury, a dust-lead hazard standard associated with a doubling of the number of children with IQ’s below the 5th percentile might be considered (NRC, 2000).
Three other possible modifications of EPA’s current draft approach worthy of discussion might reduce its complexity while still addressing public health protection goals:
i) The current approach is designed to generate age specific blood lead distributions from age 0 to 7 associated with candidate hazard standards. The narrative (page 6) indicates that ultimate values of interest would be an unstated percentile of either the lifetime average blood lead distribution, or the blood lead distribution at ages 5 or 6. There are some findings that suggest that lifetime average blood lead (i.e. from 0 to 7), or blood lead at age 5 or 6, may be stronger predictors of lead associated cognitive deficits than blood lead at earlier ages (Lanphear et al, 2005). According to the narrative, EPA apparently considered, but rejected, a narrower approach focused only on exposure between ages 1 to 3, which some data suggest is the period of peak blood lead level (cf O’Flaherty, 1995; EPA 2006 [Child A in Figure 4-6]). The basis for EPA’S decision merits further discussion. Blood lead from age 1 to 3 still appears to have an impact on cognitive development, and from a practical standpoint blood lead screening patterns in the US focus on children between the ages of 1 to 3. If the identified driver for the determination of EPA’s dust-lead hazard standards is to be a particular target blood lead value, it might be prudent and analytically simpler to focus on the age range in which the maximum blood lead level is anticipated to occur.
ii) A second potential modification for further discussion is simplification of the analytical approach by focusing on the incremental contribution of dust lead to blood lead, as opposed to the proposed method of also modeling the contribution of background lead exposure. There is a long history of utilizing the incremental approach in risk assessment at hazardous waste sites, and it forms the basis for the CalEPA approach mentioned above. Can EPA present an analysis that compares the relative strengths and weaknesses of the incremental approach and the background modeling approach, particularly with respect to their aggregate uncertainty, and their ultimate utility in protecting public

health? For example, an approach that exclusively analyzes the incremental contribution of dust lead to blood lead distribution sharpens the risk assessment focus on this source of lead exposure, and facilitates consideration of cumulative lead risk when designing risk management strategies for particular target communities with known high background blood lead concentrations.
iii) As per the extensive discussion at the SAB lead review panel meeting, I agree with the recommendation that EPA’s proposed draft approach should be supplemented by a side-by-side examination and consideration of empiric data from epidemiological studies of the relationship between interior house dust loading (expressed as µg/ft2) and childhood blood lead concentration. These studies include the HUD sponsored studies utilizing information from the 1999 – 2004 NHANES datasets (Dixon et al, 2009; Gaitens et al, 2009). One limitation of the NHANES studies is their lack of concurrent information regarding residential soil lead contamination. Accordingly, EPA should additionally examine and consider smaller data-sets available from childhood studies conducted in Rochester, New York by Lanphear and colleagues that do contain empirical data on blood lead, house dust lead loading, and residential soil lead concentration.
Relation of Sill Dust to Floor Dust
The use of empirical datasets and regression modeling to derive a relationship between window sill lead dust to floor lead dust is reasonable. However, further study is warranted for the decision to weight window sill dust contribution at 1% and floor dust contribution at 99% based on relative surface area within the home. One dataset not mentioned in the narrative that used stable lead isotopes to examine the relative contribution to blood lead of floor lead dust and window sill lead dust was reported by Manton et al (2000). Although floor dust was the strongest contributor, the ratio appeared to be somewhat less than 99:1. It would also be valuable to search for any data or models that might conceivably exist on child motion in indoor environments, such as those conducted by Freeman and colleagues in NJ. These could conceivably contribute to estimates on the relative potential for contact with window sills versus floors. Some data (e.g. Rhoads et al, 1999), indirectly suggest that window sill lead dust may merit more than a 1% weighting relative to floor lead dust.
Activity Patterns and Microenvironments
The approach for Monte Carlo modeling described in section 3 indicates that variables corresponding to indoor lead dust will be assumed to vary independently of indoor air concentrations. Is this assumption supported by empiric data that demonstrate that indoor air lead and surface dust lead are independent variables, particularly at high exposure settings? Notwithstanding the minor contribution of lead inhalation, if indoor air lead and surface dust lead are not independent variables, consideration should be given modifying the analytical approach to account for their relationship.

Blood Lead Modeling
There is extensive experience with the IEUBK model, and its use for dust lead hazard standard development is reasonable. The described approach, which links the biokinetic module of IEUBK with Monte Carlo modeling of several input parameters, appears to be similar to the Integrated Stochastic Exposure (ISE) Model for Lead. The ISE model has been examined for several risk assessments, such as the Vasquez Boulevard Interstate 70 Superfund Site (EPA Region VIII, 2001). That particular use of the ISE allowed for variability in certain important parameters that are fixed in EPA’s proposed approach for the dust lead hazard standard development. In particular, the ISE model allowed for variability in Fs, the fraction of daily soil intake attributed to soil (versus indoor dust), and in the parameters pertaining to the absorption of ingested lead (food, water, and soil/dust) (EPA Region VIII, 2001, Table 5-3). The scientific basis for EPA’s proposed approach, which fixes an absolute absorption fraction for lead in water and diet at 0.50, and for soil and dust at 0.30, merits critical examination and discussion.
Notwithstanding the potential value of the ISE approach, I impressed with the comments and concerns raised by Dr. Philip Goodrum at the SAB lead review panel meeting that the Monte Carlo modeling proposed by EPA might underestimate the variability in blood lead associated with exposure to indoor dust lead. This possibility was illustrated by an analysis presented by Goodrum and colleagues (Goodrum et al, 1996, Figure 2 and 3), in which the 90th percentile blood lead estimated by the IEUBK model using a default geometric standard deviation (GSD) of 1.60 was higher than the 90th percentile blood lead generated by Monte Carlo modeling. EPA should compare the output of Monte Carlo modeling to IEUBK modeling utilizing a GSD of 1.6 in its analysis, and discuss the implication of the side-by-side results.
References
Carlisle J, Dowling K. Child-specific benchmark change in blood lead concentration for school site risk assessment. California Environmental Protection Agency: Sacramento, CA. April 2007
Carlisle J. Revised California human health screening levels for lead. California Environmental Protection Agency: Sacramento, CA. September 2009
Dixon SL, Gaitens JM, Jacobs DE et al. Exposure of U.S. children to residential dust lead, 1999-2004: II. The contribution of lead-contaminated dust to children’s blood lead levels. Environ Health Perspect 117:468-474; 2009
EPA. Environmental Protection Agency. Air quality criteria for Lead. Vol I. EPA: Research Triangle Park, NC. EPA/600/R-05/144aF. October 2006
EPA. Environmental Protection Agency. National ambient air quality standards for lead. Final rule. Federal Register 73:66964-67062; November 12, 2008]
EPA. Environmental Protection Agency. Region VIII. Baseline human health risk assessment. Vasquez Boulevard and I-70 Superfund Site. Denver, CO. August, 2001
Gaitens JM, Dixon SL, Jacobs DE et al. Exposure of U.S. children to residential dust lead, 1999-2004: I. Housing and demographic factors. Environ Health Perspect 117:461-467; 2009
Goodrum PE, Diamond GL, Hassett JM, Johnson DL. Monte Carlo modeling of childhood lead exposure: development of a probabilistic methodology for use with the USEPA IEUBK model for lead in children. Human Ecol Risk Assessment 2:681-708; 1996
Lanphear BP, Hornung R. Khoury, J et al. Low-level environmental lead exposure and children's intellectual function: an international pooled analysis. Environmental Health Perspectives. 113: 894-899; 2005
Manton WI, Angle CR, Stanek KL et al. Acquisition and retention of lead by young children. Environmental Research [sec A] 82:60-80; 2000
NRC. National Research Council. Toxicological Effects of Methylmercury. NAS: Washington, DC, 2000
O’Flaherty E. Physiologically based models for bone-seeking elements. V. Lead absorption and disposition in childhood. Tox Appl Pharm 131:297-308; 1995
Rhoads GG, Ettinger AS, Weisel CP et al. The effect of dust lead control on blood lead in toddlers: a randomized trial. Pediatrics 103:551-555; 1999
2. Developing Lead Dust Hazard Standards for Public and Commercial Buildings
The comments below address the proposed approach for developing lead dust hazard standards for commercial and public buildings as they pertain to lead exposure to adults. These comments supplement comments on the proposed approach for residences, almost all of which apply to both documents. They are submitted following the SAB lead review panel meeting of July 6 – 7, 2010, but may be subject to revision or supplementation in the future based on continued assessment of the documents and the relevant issues.
Reasonableness of the Approach
Compared to the well-studied topic of estimating or modeling the exposure of young children to lead in indoor dust, there is much less experience and empirical data available to guide the modeling of indoor dust exposures to adults. Due to the relative lack of empiric data, the level of confidence in EPA’s proposed approach to estimating indoor dust exposure for adults, which is to mainly assume they will ingest a certain mass of indoor dust per day present on floors or windowsills, is modest at best.
I suggest that EPA expand its examination of possible approaches to modeling adult exposure to indoor dust to other two other recent methods presented in the last decade. The first alternative approach, published by individuals associated with the Department of Defense,

examined potential exposure of office workers to hazardous chemicals, including lead, that were possibly present in interior surfaces (mainly floors) of the Pentagon remediated in the aftermath of the September 11 attacks (Gaborek et al, 2001). A similar approach by DoD authors modeled exposure to various workers (construction and demolition workers, and general maintenance workers) potentially exposed to the residue of military explosive inside industrial buildings (May et al, 2002). The other alternative approach was devised by the Contaminants of Potential Concern (COPC) Committee of the World Trade Center Indoor Air Task Force Working Group in their assessment of exposure to contaminants in indoor dust following the WTC attacks, (COPC, 2003 – Appendix D). Both the DoD approach and COPC approach differ from that currently proposed by EPA for the dust-lead hazard standards in that the former model surface-to-hand dust transfer, and hand-to-mouth events by adults. An exposure model that adapted aspects of both methods has been utilized to estimate exposure of various receptors to arsenic contaminated dust in an indoor commercial settings (Kosnett and Haroun, unpublished data). These exposure models could be combined with the Leggett biokinetic model to estimate a distribution of blood lead concentrations in adults exposed to indoor dust.
The approach proposed by EPA to focus on the relationship between adult lead exposure and blood pressure is reasonable, because blood pressure is a key health endpoint influenced by low level exposure to lead. However, EPA should also note, consider, and discuss how its analysis might be supported by research findings associating low-level lead exposure with other adverse health effects in adults. These include the impact of long-term low-level lead exposure on cognitive function measured in middle-aged to elderly adults, as well as the risk of short-term adverse effects on reproductive outcome sustained by a pregnant woman with elevated blood lead concentrations. These health endpoints have been briefly reviewed in a publication that discusses the advisability of maintaining long term adult blood lead concentrations less than 10 µg/dL in some, if not all, adults, and of taking steps to reduce blood lead concentrations to < 5 µg/dL in women who are or may become pregnant (Kosnett et al, 2007). In like manner, it is anticipated that a soon to be released report, “Lead in Pregnancy” by the CDC Advisory Committee on Childhood Lead Poisoning Prevention will recommend that pregnant women with blood lead concentrations ≥ 5µg/dL undergo exposure reduction, nutritional counseling, and follow-up testing, and that pregnant women with blood lead concentration ≥ 10 µg/dL be removed from occupational lead exposure. (The CDC report “Lead in Pregnancy” may be formally released in early September, 2010, but it is likely that it has already been formally transmitted by CDC to EPA).
In its draft approach, EPA proposes to develop its dust-lead hazard standard for commercial and public buildings partly on consideration of “CHAD data” pertaining to the amount of time that adults of various ages spend in such premises (cf section 3.4.1.2, and Table 3-3). However, rather than solely utilizing an approach that models the distribution of time spent in various microenvironments, EPA should also consider a simpler alternative approach designed to protect an adult (including a pregnant woman) who spends what could be considered to be an “RME” level of time in a public or commercial building (e.g. 60 hours per week).

Development of a Response Curve For The Blood Lead- Blood Pressure Relationship
Ample epidemiological and experimental data establish lead exposure as a risk factor for hypertension and blood pressure elevation. The derivation of a quantitative dose-response relationship between human lead exposure and blood pressure is complicated by the observation that cumulative long-term lead exposure to lead (e.g. as reflected in bone lead concentration) may be a stronger predictor of blood pressure elevation or hypertension than contemporaneous blood lead measurement (Hu et al, 1996; Korrick et al, 1999). In addition, in some of the studies that found a positive association between blood lead and blood pressure (or other cardiovascular events) in adults, secular changes in lead exposure may have resulted in the measured blood lead concentration(s) having been different than the blood lead levels experienced by the subjects during a substantial portion of their lifetime. The issue of how much cumulative lead exposure to an adult, at which point in the lifespan, will yield a given risk of hypertension or a blood pressure elevation is an area of ongoing research interest.
Given our current research database, several options for developing a lead-dust hazard standard based on adult blood pressure elevation should be considered. As per an approached presented by Stern (1996), a target concentration of lead in dust could be identified that would increase the percentage of adults (18 – 65 years old) with systolic (or diastolic) blood pressure in excess of a certain value by 1%. A range of coefficients characterizing the relationship between blood lead and either systolic or diastolic blood pressure in such an approach should be examined. Studies that yield these coefficients should be examined and grouped with regard to the range of blood lead concentrations in the study subjects, and the estimated stability of the blood lead concentration over the life of the subjects. Analyses that might permit analysis of the impact of a cumulative blood lead index (µg/dL • years) on blood pressure should be considered. Because tibial bone lead concentration can be approximately related to cumulative blood lead index by a slope of 0.05 (Hu et al, 2007), studies that have examined the relationship of bone lead to blood pressure change or hypertension might also be productively examined. Finally, an approach that simply acknowledges a qualitative risk of blood pressure elevation in subjects who maintain a chronic blood lead concentration above a certain level, e.g. 5 or 10 µg/dL, and identifies a dust lead hazard standard that would keep a given percentile of the adult blood lead distribution below that level, might be satisfactory.
References
Contaminants of Potential Concern (COPC) Committee of the World Trade Center Indoor Air Task Force Working Group. World Trade Center Indoor Environment Assessment: Selecting Contaminants of Potential Concern and Setting Health-Based Benchmarks. EPA: May 2003
Gaborek BJ, Mullikin JM, Pitrat T, Cummings L, May LM. Pentagon surface wipe sampling health risk assessment. Toxicol Ind Health 17:251-261; 2001
Hu H, Aro A, Payton M, Korrick S, Sparrow D, Weiss ST, et al.The relationship of bone and blood lead to hypertension. JAMA 275:1171–1176; 1996

Hu H, Shih R, Rothenberg S, Schwartz BS. The epidemiologyof lead toxicity in adults: measuring dose and consideration of other methodologic issues. Environ Health Perspect 115:455–462; 2007
Korrick SA, Hunter DJ, Rotnitzky A, Hu H, Speizer FE. Lead and hypertension in a sample of middle-aged women. Am J Public Health 89:330–335; 1999
May, LM, Gaborek B, Pitrat T, et al. Derivation of risk based wipe surface screening levels for industrial scenarios. Sci Total Environ, 288: 65-80, 2002
Stern AH. Derivation of a target concentration of Pb in soil based on elevation of adult blood pressure. Risk Analysis 16:201-210; 1996
3. Supplemental Comments
July 29, 2010
To: Aaron Yeow, M.P.H.Designated Federal OfficerU.S. Environmental Protection AgencyScience Advisory Board, Lead Review Panel
From: Michael J. Kosnett, MD, MPHMember, EPA Science Advisory Board, Lead Review Panel
Cc: Steve WashburnLynne HarounEnviron International Corporation
In recent comments prepared for the SAB pertaining to my review of the documents: 1) Proposed Approach for Developing Lead Dust Hazard Standards for Residences and (2) Proposed Approach for Developing Lead Dust Hazard Standards for Commercial and Public Buildings, I referred to a model developed by myself, Lynne Haroun, and Steve Washburn to assess the risks posed to various receptors from arsenic containing dust in a commercial building. Although our model (and hence certain parameters such as those pertaining to absorption) was used to assess the risk from arsenic, the overall conceptual approach could be applicable to assessing incidental ingestion of other metals such as lead. Because of this, I wanted to share details of our model pertaining to incidental ingestion with our EPA colleagues currently developing lead dust hazard standards.
The pages that follow include a description of various receptors, the ingestion pathway equation, and two sets of parameter conditions. Two sets of exposure assumptions, reflecting a range of reasonable values for parameters that exert a strong influence on ingestion risk estimates (May et al, 2002), have been used to generate the overall risk results. For most receptors, the ingestion pathway is the major contributor to the total risk. Specifically, the exposure

assumptions set forth in Table A.2 represent a lower bound of risk. To generate the lower bound values, the parameter FTss (fraction of dust transferred from surface to skin) was set at 0.1, the parameter HTME (hand to mouth events per hour for an adult) was set to 0.5, and the oral absorption factor (bioavailability) for ingested arsenic in dust was set to 0.5. To generate upper bound risk estimates, (cf Table B.2), FTss was set at 0.5, HTME was set at 3.0, and the oral absorption factor was set to 1.0. Equations for
We are considering submitting the complete model for publication. Kindly contact me if there are any questions or if we can provide additional information.
Receptor
Adult warehouse workerAn adult worker is assumed to work within the northern half of the building and exposure is assumed to occur randomly throughout this area. Default worker assumptions of 8 hr/day, 250 d/yr, for 25 yr are used.Adult cubicle workerAn adult worker is assumed to work at a desk within the northern half of the building. The desk is assumed to be adjacent to the stain with the maximum arsenic concentration. Default worker assumptions of 8 hr/day, 250 d/yr, for 25 yr are used.Child cubicle visitorA child, 3-6 yr of age, is assumed to play in a confined area that contains the stain with the maximum arsenic concentration. The child comes to the area 4 hr/day, 50 d/yr for 4 yr.Cleanroom demolition workerAn adult worker is assumed to work on demolition of the clean rooms over a total period of 2 weeks.Construction workerAn adult worker is assumed to work on construction-related activities over a total period of 8 weeks.
Ingestion Intake Calculation
79
Notes:
1. For the child visitor ,based on 50th percentile 4-5 year-old male, with total body surface area of 0.731 m2, where mean percentage of arms and hands (14% and 5.7% of total body surface, respectively) are summed.
2. The inhalation rate for a child visitor is based on a moderate activity level with an inhalation rate of 1 m3/hr, and 4 hr exposure.
Source:
WTC/Contaminants of Potential Concern (COPC) Committee of the World Trade Center Indoor Air Task Force Working Group. 2003. World Trade Center
Indoor Environment Assessment: Selecting Contaminants of Potential Concern and Setting Health-Based Benchmarks. May.
May, L.M. et al. 2002. Derivation of risk based wipe surface screening levels for industrial scenarios. Sci Total Environ. 288 (65–80).
Sansone, E. 1987. "Redispersion of Indoor Surface Contamination and Its Implications." In: Treatise on Clean Surface Technology, Volume 1. Plenum Press.
Schneider, S. et al. 1993. Final Report: An Investigation of Health Hazards on a New Construction Project. Occupational Health Foundation.
United States Environmental Protection Agency (USEPA). 1989. Risk Assessment Guidance for Superfund. Volume 1: Human Health Evaluation Manual (Part A).
United Stated Environmental Proection Agency (USEPA). 1997a. Region III, Guidance for Assessing Wipe Samples, July 9.
United Stated Environmental Proection Agency (USEPA). 1997b. Exposure Factors Handbook, Volume 1, General Factors, August
United States Environmental Protection Agency (USEPA). 2002. Child-Specific Exposure Factors Handbook. September.
USEPA. 2004. Risk Assessment Guidance for Superfund, Volume I: Human Health Evaluation Manual (Part E, Supplemental Guidance for Dermal Risk Assessment). Appendix B, Screening Tables and Reference Values for the Water Pathway. EPA/540/R/99/005. July.

Comments from Dr. Bruce Lanphear
IQ as Primary Endpoint
I agree that IQ should be the primary endpoint because lead-associated IQ deficits are rigorously characterized and substantiated in an extensive number of cross-sectional and prospective studies conducted over the past three decades, including over ten studies not included in the international pooled analysis that examined the relationship below 10 micrograms per deciliter (see references, below). One of these, which was included in the international pooled analysis, suggests that the effects of lead exposure on children’s intellectual abilities may be underestimated using blood lead levels instead of bone lead concentration (Wasserman, 2003). Still, blood lead concentration is the appropriate biomarker for risk assessment because it has been used more extensively in epidemiologic studies, including those examining the contribution of lead-contaminated house dust to children’s blood lead levels. Since dust lead loadings are a major source of lead intake and directly associated with blood lead levels, this provides a direct causal pathway from lead exposure to children’s blood lead levels and, in turn, IQ scores for risk assessment and cost-benefit analyses of US EPA’s residential dust lead standard.
References
Lanphear BP, Dietrich KN, Auinger P, Cox C. Cognitive deficits associated with blood lead levels <10 g/dl in U.S. children and adolescents. Public Health Reports 2000;115:521-529.
Wasserman GA, Factor-Litvak P, Liu X, Todd AC, Kline JK, Slavkovich V, Popovac D, Graziano JH. The relationship between blood lead, bone lead and child intelligence. Child Neuropsychol 2003;9:22–34.
Chiodo LM, et al. Neurodevelopmental effects of postnatal lead exposure at very low levels. Neurotoxicol Teratol 2004;26:359-371.
Kordas K, et al. Deficits in cognitive function and achievement in Mexican first-graders with low blood lead concentrations. Environ Res 2006;100:371-86.
Tellez-Rojo MM, et al. Longitudinal associations between blood lead concentrations lower than 10 g/dL and neurobehavioral development in environmentally exposed children in Mexico City Pediatrics. 2006;118:e323-30.
Hu H, et al. Fetal lead exposure at each stage of pregnancy as a predictor of infant mental development. Environ Health Perspect 2006;114:1730–1735.
Sarkin PJ, et al. Neuropsychological function in children with blood lead levels below 10 g/dL. Neurotoxicology 2007;28:1170-1177.
83

Solon O, et al. Associations between cognitive function, blood lead concentration and nutrition among children in the Central Philippines. Journal of Pediatrics 2008;152:237-243
Chiodo LM, et al. Blood lead levels and specific attention effects in young children. Neurotoxicol Teratol 2007;29:538-546.
Chandramouli K, et al. Effects of early childhood lead exposure on academic performance and behavior of school age children. Arch Dis Child 2009;94:844-848.
Min MO, et al. Cognitive development and low-level lead exposure in poly-drug exposed children. Neurotoxicol Teratol 2009:31:225-231.
Jedrychowski W et al., Gender specific differences in neurodevelopmental effects of prenatal exposure to very low-lead levels: the prospective cohort study in three-year olds. Early Hum Dev. 2009:85:503-510.
Roy A, et al. Lead exposure and behavior among young children in Chennai, India. EHP 2009;117:1607-1611.
Selection of Target Blood Lead Concentration
For purposes of this Approach, a distribution for a hypothetical child will be modeled around individual candidate hazard standards. Blood lead levels of 1, 2.5 and 5 µg/dL have been chosen to evaluate a range of potential hazard standards.
I agree with the EPA’s selection of this lower range of blood lead levels to evaluate for potential dust lead hazard standards. Four of the key issues that should be considered in promulgating a final rule are the size and shape of lead-associated IQ decrements, the relationship of lead-contaminated dust and children’s blood lead levels, the dust sampling method to be used, and feasibility of attaining various dust lead loading values in housing, based on national survey data. Although the SAB and EPA should discuss feasibility, the EPA should carefully distinguish the scientific evidence from concerns about feasibility in their deliberations and in the final rule.
From a scientific perspective, I recommend using a population blood lead of 1 micrograms per deciliter or 2.5 micrograms per deciliter to indicate unacceptable risk or harm. This could be quantified by indicating that 95% of children should not exceed a value of 1 micrograms per deciliter or that 99.5% should not exceed 2.5 micrograms per deciliter. This would be consistent with CASAC Panel recommendation that, “a population loss of 1-2 IQ points is highly significant from a public health perspective”, and that, “the primary lead standard should be set so as to protect 99.5% of the population from exceeding that IQ loss.” It would be prudent to recognize that further reductions in children’s blood lead levels may be necessary in the future.
Although it may not be possible -- in the short term -- to achieve dust lead levels consistent with 95% of children not exceeding a value of 1.0 micrograms per deciliter or 99.5% children not exceeding a value of 2.5 micrograms per deciliter, the promulgation and enforcement of the revised Lead Renovation, Repair and Paint Rule should, in combination with the control of other sources of lead exposure, ultimately achieve population blood lead levels that are below what is determined to be associated with unacceptable risk. This is consistent with the regulatory actions established in the 1970s that ultimately led to the dramatic reductions in population mean blood lead levels.
The draft report is considering using both the lifetime and concurrent blood lead metrics, but not peak blood lead levels. There is merit to examining both lifetime and concurrent blood lead levels, but the two indices are highly correlated with each other. In the pooled analysis, for example, the correlation for these two values was >0.90 (Lanphear et al., 2005a). I agree that using peak blood lead levels is less informative than lifetime average or concurrent blood lead levels for predicting IQ scores, but there should be further discussion about focusing on children younger than 3 years for estimating the relationship of lead-contaminated house dust and blood lead levels because they are more susceptible to lead ingestion and absorption (see comments below).
Estimate Environmental Media and Exposure Concentrations
I would recommend against converting dust lead loading to dust lead concentration. First, several studies have shown that dust lead loading is a significantly better predictor of children’s blood lead concentrations than dust lead concentration (Lanphear et al., 1995, 1998). Second, the existing standard for measuring dust lead loading is the wipe sampling method, a simple and inexpensive tool that only measures loading. Third, it is not clear that we can adequately convert dust lead loading to dust lead concentration. Finally, it is a complex and unnecessary step if the EP A relies on existing epidemiologic data. If the US EPA decides to convert dust lead loading to dust lead concentration for the purpose of using a biokinetic model to generate dust lead hazards, I strongly encourage you to compare the results with existing epidemiologic studies, especially the NHANES analysis (Dixon et al., 2009), the Rochester LID Study, which was the key epidemiologic study used for the US EPA residential lead standard promulgated in 2001 (Lanphear et al., 1996) and the pooled dust study (Lanphear et al., 1998). If the biokinetic models conflict with the epidemiologic data it would raise serious questions about the validity of the biokinetic model(s).
I recommend that EPA rely on empirical (epidemiologic) data for estimating the relationship of floor dust lead loading and window sill dust lead loading with children’s blood lead levels instead of trying to calculate window sill dust lead levels using floor dust lead loading. The epidemiologic data are sufficient to use in the standard setting process for both floor and window sill dust lead loading. The most relevant data for estimating the relationship of floor and window sill lead loading on a national scale, and which has the largest sample size, is the NHANES analysis (Dixon et al., 2009). If there are concerns about the lack of mouthing behaviors and soil lead levels in the NHANES data set, you can examine whether the results differ from the Rochester studies, both of which account for soil lead levels, mouthing behaviors and other relevant characteristics (Lanphear et al., 1996, 2005b).

I would also recommend relying on empirical data rather than using Monte Carlo simulations to try to examine age-related play activities or mouthing behaviors. The empirical data can be used to represent the typical relationship for exposures to dust lead loading with children’s blood lead levels (i.e., to represent the mean childhood blood lead levels in populations of children who exhibit varying behaviors and activity patterns) without making a variety of assumptions. If we rely on empiric data, we will not need to describe how exposure profiles would be developed using the Consolidated Human Activity Database (CHAD) and algorithms from the Air Pollutants Exposure Model (APEX).
If the EPA chooses to use the biokinetic model(s) despite the limitations described above – which they will undoubtedly do – I would urge them to compare their results in tabular format with several epidemiologic studies (Dixon et al., 2009; Lanphear et al., 1996, 1998, 2005b). If the resulting floor and sill dust lead hazard levels generated using the biokinetic models differ substantially from the results of the epidemiologic data, they should provide sufficient discussion about why the results are not in agreement and justify why they should not rely on epidemiologic data. They should also be prepared to defend the mechanistic model to the public health community and the public who will find it confusing, if not in direct conflict with epidemiologic data.
The EPA should consider focusing on children younger than 3 years because they are most vulnerable to lead intake from residential sources. Although there is evidence that chronic, low-level lead exposure may be more harmful than short-term exposures (i.e., blood lead levels measured at 5 or 6 years of age are stronger predictors of IQ scores than 3 year old blood lead levels) (Hornung et al., 2009), it would be sufficiently protective and simpler to focus on children 0 to 3 years of age. If, however, EPA Staff believes it would add value to include all children younger than 6 years (e.g., for calculating cost-benefit analyses), then I would certainly encourage them to use the full age range.
Estimating Blood Lead Concentrations:
Although the IEUBK Model has been an important tool in the absence of epidemiologic data, I would recommend against using the IEUBK Model or any other mechanistic model to estimate blood lead levels for the following reasons:
1. We now have sufficient and consistent empirical data relating floor and window sill dust lead loadings with children’s blood lead levels, including nationally-representative data (Dixon et al., 2009);
2. The mechanistic models do not allow for dust lead loading as an input, which has been shown to be a stronger predictor of children’s blood lead concentrations than dust lead concentrations;
3. Using empirical data will not require converting dust lead concentration to dust lead loading, an exercise that is complex, burdensome and of questionable merit;
4. Using empirical data would not require assumptions (e.g., while in a car, a child is not coming into contact with lead in dust or soil) or extensive modeling for activity patterns or behaviors;

5. The ultimate validation of the IEUBK model and other mechanistic models are empirical data (i.e., empirical data are the gold standard); as such, we should rely on the “gold standard”.
Final Comments
Despite my reservations about using the biokinetic model(s), I think it would be extremely valuable and illuminating if the US EPA set up an analytic strategy to compare the biokinetic model(s) with epidemiologic data. The availability of the NHANES data, which represents a nationally representative sample of children with many of the relevant measures as well as the key exposure variables, could serve as a unique tool for future risk assessment studies. Indeed, this data set, which represents the first use of NHANES to integrate environmental exposures with biologic data, could serve as an extraordinary tool for EPA to establish population-based risk assessment in the future.
If EPA Staff are worried that the absence of soil lead and other key parameters in the NHANES data set (e.g., mouthing behaviors) makes it problematic, I would urge them to include the Rochester Lead-in-Dust Study in their tabulations and comparisons (Lanphear et al., 1996). They could also use cross-sectional data from a prospective cohort study in Rochester that has many of the relevant parameters (Lanphear et al., 2002, 2005b). Although one other SAB member recommended using other studies, I would advise staff to be selective about which data sets to use because most data sets do not contain adequate measures of environmental exposures or related characteristics. These comparisons should include:
a. labor costs for analyzing the biokinetic model(s) and epidemiologic studies;b. tabulations of assumptions required for each approach;c. tabulation of uncertainties for each approach;d. output (standards for floor dust and sill dust);e. discussion about why biokinetic models or epidemiologic data should be
considered more directly relevant for setting standards.
I would also urge EPA staff to include 4 SAB members in this process (2 who are more familiar with biokinetic modeling and 2 who are more familiar with epidemiologic studies) to make sure they are taking full advantage of this exercise.
References
Dixon SL, Gaitens JM, Jacobs DE, Strauss W, Nagaraja J, Pivetz T, Wilson JW, Ashley PJ. Environ Health Perspectives 2009;117:468-474;
Hornung RW, Lanphear BP, Dietrich KN. Age of greatest susceptibility to childhood lead exposure: a new statistical approach. Environ Health Perspect. 2009 Aug;117(8):1309-1312.

Lanphear BP, Emond M, Jacobs DE, Weitzman M, Tanner M, Winter NL, Yakir B, Eberly S. A Side-by-Side Comparison of Dust Collection Methods for Sampling Lead-Contaminated House Dust, Environmental Research, Volume 68, Issue 2, February 1995, Pages 114-123.
Lanphear BP, Weitzman M, Winter NL, Tanner M, Yakir B, Eberly S, Emond M, Matte TD. Lead-contaminated house dust and urban children’s blood lead levels. American Journal of Public Health 1996;86:1416-1421.
Lanphear BP, Matte TD, Rogers J, Clickner R, Dietz B, Bornschein RL, Succop P, Mahaffey KR, Dixon S, Galke W, Rabinowitz M, Farfel M, Rohde C, Schwartz J, Ashley P and Jacobs DE. The contribution of lead-contaminated house dust and residential soil to children’s blood lead levels: A pooled analysis of 12 epidemiologic studies. Environmental Research 1998;79:51-68.
Lanphear BP, Hornung R, Ho M, Howard CR, Eberley S, and Knauf K. 2002. Environmental lead exposure during early childhood. Journal of Pediatrics 140: 40-47.
Lanphear BP, Hornung R, Khoury J, Yolton K, Baghurst P, Bellinger DC, Canfield RL, Dietrich KN, Bornschein R, Greene T, Rothenberg SJ, Needleman HL, Schnaas L, Wasserman G, Graziano J. Low-level environmental lead exposure and children’s intellectual function: An international pooled analysis. Environ Health Perspect 2005a;113:894-899.
Lanphear BP, Hornung R, Ho M. Screening housing to prevent lead toxicity in children. Pub Health Rep 2005b;120:305-310.
Comments from Dr. Thomas Louis
1. Preamble
Notes were generated by review of the documents, “Proposed Approach for Developing Lead Dust Hazard Standards for Residences” and “Proposed Approach for Developing Lead Dust Hazard Standards for Commercial and Public Buildings” and by participation in the July 6-7, 2010 meeting.
Quoted content is in italics.
2. Commentary Applicable To All Settings
Goal Identification
It would be beneficial for the EPA and the contractor better to identify broad goals and goals of each analysis. Start with the overall goal (e.g., develop criteria for sill, floor and other measurements that can be used to assess whether a building meets a health effects standard). Goal identification will determine what data are needed and what analyses are relevant. The goal is to achieve control of a target blood level, but one needs to clarify whether this is “on average” or for the highly exposed/highly reactive. Specifically, what percentile of the blood level distribution (over environments and individuals) needs to be controlled? Are there important covariates (individual- or setting- specific) that need to be accommodated to work this out?
Flow charts
The proposed analyses, assumptions, data sources and goals are complex and multi-factorial. To help reviewers and those conducting the project it will be important to document the approach with additional flow charts, ideally computer-based in which one can click to get additional details.
Reproducible Research
The flow charts help support reproducible research. For scientific, workload and political reasons, it is important to put the projects in the context of “reproducible research” wherein there is an essentially seamless analytic system that starts with databases, feeds analyses that provide input to tables and graphs. In this context, all assumptions, data and analyses are completely documented and if someone wants to reproduce an analysis (possibly with some changes) they can do so without disturbing the integrity of the system. This ability addresses both scientific and political issues.
89
The front-end investment in reproducible research pays big resource dividends. For example, if one wishes to redo analyses taking logs of some quantities but keeping all else the same, one code change and new tables and graphs are available.
Animal models
Is there a benefit to bringing in information from animal studies?
Monte-Carlo & Enhancements
Use of Monte-Carlo (MC) is very appropriate. As the authors note, a large number of cycles will be needed to ensure sampling the extremes. The tails of distributions, consequently of lead loadings and, ultimately, of exposure, dose and health outcome are of principal importance. So, one needs to ensure that the MC sufficiently samples the tails. The MC can be made more efficient in this regard by use of Importance Sampling whereby samples are generated from a distribution that oversamples the tails and then samples are weighted by the likelihood ratio between the desired generating distribution and the one used to generate the samples (i.e., importance weights). As an added benefit, importance sampling facilitates sensitivity analyses; the initial samples are saved, but different importance weights are applied.
Assessing Stability
Page 23: Stability of the distribution will be assessed using statistical methods roughly comparing variability of the distribution to its median, with variability measures generated by such techniques as the bootstrap method.
Unless I misunderstand what is being proposed, this approach to stability is not as relevant as monitoring stability of various percentiles, of the mean, of the variance. The relation between the variance and the median has little to do with such assessments.
Proper processing
Proper processing of non-linear exposure/response and other relations requires integration over the full exposure distribution. It is not sufficient to summarize the exposure by central tendency and spread; full integration is needed to produce the appropriate “typical” response. As important, the full exposure distribution allows one to compute various percentiles of response and use these to set standards.
Full (joint) distributions
Valid point estimates, uncertainties and sensitivity analyses depend on use of full (joint) distributions when inputs and relations are uncertain.
Page 7: Previous similar assessments (e.g., USEPA 2008b) have shown that many media concentration distributions are positively skewed and the lognormal distribution often is the most appropriate representative. The definition of each distribution will be an arithmetic mean and

standard deviation (for normal distributions), a geometric mean and geometric standard deviation (for lognormal distributions), or a lower and upper cutoff (for uniform distributions).
It may be necessary to broaden the range of distributions and with MC and other computer-based approaches; there is no need to stick with single, parametric distributions such as the log-normal. Consider mixture distributions, the normal/gamma, mixtures of log-normals, etc. And, with these (really always), let the full distribution be the summary. It is the full distribution that should be used as input to a risk assessment.
There is an over-dependence on means, medians, variances and interquartile ranges of distributions. Full, joint predictive distributions need to be developed and used to support MC and, ultimately, standard-setting.
Predictive distributions need either to stratify on relevant covariates (e.g., humidity, SES) producing a context-specific prediction or mix over scenarios for a “population-based” prediction. For this latter, mixing weights will be needed.
Importantly, when mixing over scenarios, it is essential that the predictions be mixed (the expected prediction) rather than inputting a mixed/averages scenario (the prediction produced by the expected context).
The Three Steps
This step consists of three parts: selecting dust-lead levels for windowsills and floors (candidate hazard standards), estimating environmental media concentrations, and estimating exposure concentrations.
There may be a need to link these steps rather than have them conducted independently. Considering the three as an entity is the best approach even if, ultimately, they can be separated.
Time-constant Concentrations
To account for the variability in lead concentrations in other environmental media in the U.S., the approach will apply Monte Carlo sampling of distributions of background lead. To simplify the approach, it is assumed that environmental media concentrations will not change with time.
Is this assumption reasonable, especially in the context of non-linear relations and modeling? Even if the typical value is correct, the implied impact may be incorrect. This comment applies more generally. Also, I emphasize that joint distributions are likely to be necessary.
Exposure & Activity Patterns
The temporal patterns of exposure concentrations for children under age 6 will be developed using different exposure scenario characteristics for each year (0-1, 1-2, etc.).

Check that the age-specific models are compatible in that the transition across age boundaries is reasonable. Better still, link exposures in an age-indexed model. Regarding activity patterns, do season, window opening air conditioning, etc. play a role? Use of a “typical” scenario may not produce the correct population-level assessment.
Not Sampling Floor and Sill
Page 9: The only media concentrations that will not be sampled from distributions are residential floor and residential window sill, which are fixed based on the candidate hazard standards being evaluated.
I understand the rationale for fixing the sill and floor values at a candidate hazard standard and so the need for a (sill, floor) relation to identify “legal” points (see my discussion of sill/floor below). It is essential when fixing these values to sample other media from the joint distribution conditional on the sill/floor values.
Statistical/Data-Analytic & Mechanistic Models
General Comments
The report identifies two extremes in modeling: data analytic and mechanistic. As presented, each can be improved and a hybrid approach is recommended. Indeed, all modeling is hybrid to a degree, mixing the empirical and theory (mechanistic, but also stochastic). All modeling requires the goal of good, cross-validated performance (don’t use too many degrees of freedom, but do a good job). Empirical assessment in a cross-validated framework is essential. That is, some performance assessments need to be conducted either on data that were not used to train the model or via a cross-validation approach that adjusts for training (e.g., PRESS).
Fully empirical models are excellent for prediction within or very nearby the design space (the regressor values), but going beyond the available design space requires importing some structure, hopefully informed by outside knowledge (data, experiments, ...). Furthermore, a fully empirical model, while providing good in-range predictions, may not provide scientific/policy insights.
If a mechanistic provides a poor fit to data (switching the point of view, if the data don’t fit the mechanistic model), one needs to decide on the burden of proof. It could be that the data are confounded or that the mechanistic model is poorly specified.
Outliers relative to any model, if verified as valid data points, provide invaluable information on the need to augment a model or to conclude that there is a residual, underlying process for which we have inadequate information to model. In any case, outliers should be identified and discussed.
Mechanistic models are clearly important in supporting study design.

Statistical/Data-Analytic Models
Reported analyses are quite basic
The reported analyses are quite basic and don’t effectively address prediction, which is the appropriate goal. Analysts report on straight-line models, and plots show these need augmentation and, usually, transformation. With a given set of covariates (possibly including interactions) modern modeling techniques such as splines or Generalized Additive Models (GAMs) should be employed. If there are sufficient data, it would be interesting to compare those predictions with ones produced by a Classification and Regression Tree (CART) and a random forest. These are ideally suited to prediction and (semi)automatically bring in complicated interactions.
Residual plots and histograms, and added variable plots may identify the need for augmentation and inclusion of additional regressors. Also, they will indicate if there are notable outliers. If so, and if these are found to be valid data, tracking down the reason they are deviant may identify situations in which the model (even the augmented one) works poorly.
Inclusion of regressors should be based on goals, scientific understanding and features of the sampling plan. Prediction goals are best served by variable inclusion based on predictive performance rather than on P-values. Scientific understanding is imported via sub-components of a mechanistic model. Features of the sampling plan (e.g., confounding) are accommodated by inclusion of the relevant covariates (possibly interactions).
Additional Covariates
There may be additional covariates such as age, SES, region, season, relative humidity, air conditioning, forced air heating, ... that can be included to improve predictive performance of the models. Such covariates should be included in a format that reflects engineering understandings and other aspects (e.g., humidity may modifying other slopes).
Evaluation of fit and sensitivity
It is good to report on sensitivities and on fit, and the reported measures are ok. But, better will be measures that directly attend to the goals of the primary goals of the analysis: prediction of exposure, dose and health effects. Sensitivity analyses should “percolate” all the way through to these goals.
Reporting elasticity is fine, but in some cases absolute changes may be more relevant. Furthermore, with correlated regressors some form of multivariate assessment will be revealing. More generally, make sure that assessments of fit and sensitivity address the risk assessment goals.
Transformation & Augmentation
Page 28: the data were natural-log-transformed, since doing so resulted in an apparently higher regression coefficient. The correlation between the variables indicates moderate correlation (r = 0.43).
It's good to transform, or to use a GLiM that models the log(Expectation), but not because the coefficient is higher. Indeed, the coefficient can be made higher by dividing the regressor by a number bigger than 1. The reason to take logs is to make an additive model more appropriate and to make the residuals more symmetric and bell-shaped. After logging the data, model parameters measure effects on a percentage basis. Dr. Goodrum notes that if the goal is to model expectations in the original scale, an adjustment is needed (see his commentary). However, if interest focuses on percentiles, no adjustment is needed because percentiles map without adjustment for monotone transforms.
Accounting for Measurement Uncertainty
There are two aspects here: (1) Uncertainty in the dependent variable; (2) Uncertainty in regressors. Each can be ignored if the goal is to predict in this instance, for these conditions and this instrumentation (e.g., wipe samples). However, if one want to understand the underlying relations, understanding of each is important.
Uncertainty in the regressors is addressed by understanding the measurement process (Berkson, “Standard”, hybrid) and either doing post hoc adjustments or building the process into the analysis. Note that some measurement errors can induce a change in the shape of a relation as well as attenuating slopes.
Quantifying uncertainty in the dependent variable can help evaluate a low R2 (high residual variation) by partitioning it into that produced by measurement uncertainty and that which is not yet modeled, but potentially could be modeled by augmenting the regression. Of course, there needs to be information on replicate variation associated with the measurement instrument.
In some situations, for example the relation between sill and floor the focus should be on the general relation (neither is regressor or dependent). In this context one needs to use a symmetric approach, for example Altman/Bland or Marginal Structural Models.
Figure 6.1 and other figures: There is a non-linear hint here. Look at residuals to see. Augmenting the model without going too far is very important for the prediction goal.
Page A-4, figure A-1: Transform by logs and also improve fit with quadratic term. Investigate residuals to see if additional augmentation is needed.
Modeling Issue generated by Figure A-7: Are you trying to predict sill from floor (as in this plot), or should you predict floor from sill (and reverse the roles of floor and sill), or do you want to develop a relation between the two without declaring one the predictor and the other the

dependent variable? In this last case, you need a bivariate model that treats the two variables symmetrically (a marginal/structural model, a principal component decomposition or a factor analysis) or transform to an Altman/Bland representation.
Mechanistic Models
Mechanistic models, while attractive in principal, can have considerable, empirical deficits. Indeed, even if the model form is absolutely correct, unless the many parameters are known with great accuracy, predictions will be far worse than use of a more basic model because they are overwhelmed by uncertainty. Therefore, while it is a useful exercise to lay out such models, and they are key in designing studies and at some level of complexity very effective in going beyond the design space, almost never is it effective to use them in their full detail.
Page A-8 etc.: Investigators are likely at the point of very diminishing returns. There are likely too many parameters and relations with insufficient information for them. The net effect is too much variance and probably some bias. A more parsimonious model (fewer degrees of freedom) will be more effective. Parsimony can be accomplished by collapsing parts of the model into inputs and outputs without modeling the fine details within a pathway. Such collapsing moves that component of the mechanistic model towards and empirical model.
It is essential to evaluate how well the proposed mechanistic models fit real data, data that have not been used to “train” the model.
Hybrid Models
Page A-5 and elsewhere: A hybrid model may be most effective. The idea is to use a subset of the mechanistic model to guide the form of an empirical model. That is, build model forms that incorporate the major features of the mechanistic model and then estimate parameters from data. For example, one can produce an effective data-analytic model for the number of computer operations it takes to sort “n” objects using a specific sorting routine. However, there is also good theory on the mathematical form of the relation. Using it as the model form and using data to estimate parameters, produces a competitive fit for the data at hand, increases scientific understanding and supports valid extrapolation beyond the design space (for “n” different from those used in the training sample).
Page 11: From what distribution will the three values be sampled?
Page 12: Human activity patterns need to be developed.
Sill Loadings & Concentrations
There currently are no data supporting relationships, however, between window sill loadings and concentrations and, unless such slopes are developed, the same slopes as those used for the floor dust would have to be used in developing the window sill hazard standard.
Is some relation other than equal slopes more appropriate? Can a distribution of slopes be developed on the basis of expert opinion?
Sensitivity Analyses
There are many components to the overall assessment and, as the investigators note, sensitivity analyses for both the statistical and mechanistic models are important. However, in such a complex system, one-at-a-time sensitivities are inadequate and some form for multivariate sensitivity assessment should be conducted. Inadequacy results from failure to uncover synergies or antagonisms. For example, if two inputs are positively correlated, the highly likely sensitivity can be far greater than one at a time would suggest (synergy), or the changes could have a canceling effect producing a lower sensitivity (antagonism).
To conduct the more comprehensive analysis, parameters need to be sampled from multivariate distributions or, if reasonable estimates of these are not available, multivariate “scenarios” should be assessed.
Page 28: These assumptions appear to represent the authors’ professional judgment and do not reflect any measurements that could inform the weighting strategy chosen for this approach. Consequently, the relative floor area assumption will be used.
Conduct a sensitivity analysis on this assumption.
Page A-17: In general, the particulate mass does not vary as strongly from location to location as the lead mass in the particulate. Thus, the model uses only a central tendency estimate for the particulate concentration based on the average annually- averaged concentration across the AQS monitors
Is this approach reasonable? Would it be feasible to develop a spatial gradient instead?
Model Performance
Page A-21: The model tends to under-predict the mean loadings and concentrations; the means are more affected by the outliers, suggesting that the central tendency values used for most variables may not be sufficient to capture the very high loadings and concentrations. The model is able to capture the median loadings and concentrations, however, which still reflect the distribution, but are not as affected by outliers.
If possible, augment the models. In any case, if the outliers are valid, they must be included in developing predictive distributions.
The model predicts a straight line for a given cleaning frequency, while the regression suggests a nonlinear relationship. One possible interpretation of this discrepancy is that most of the higher loadings likely occur in homes which are vacuumed less often. Thus, as one moves along the loading axis, a change in cleaning frequency leads to a change in the slope of the loading-concentration relationship.

Modify/augment the model.
Plots in general
The main message of these plots is that there is (and always will be) a lot of residual variation. Hence, the need for full predictive distributions rather than relying in central tendency. This recommendation should not be taken to imply that one doesn’t need to work on the modeling, one does. However, ultimately, predictive distributions from a good model are needed. Then, exposures, doses and health effects are weighted and mixed by these distributions.
Figure A-6 and others: Model form appears to be inadequate and there is considerable residual variation. There is a hint of non-linearity, which can be exposed in a residual plot. Most likely, augmenting with the quadratic term will be effective. In any case, use the (possibly smoothed) residuals to produce a predictive distribution around the model.
Table A-11: Get entries out of Fortran format.
3. Comments Specific to Commercial/Public Buildings
Bone Lead vs Blood Lead
Consideration should be given to using bone rather than blood lead. Bone lead provides a measure of cumulative exposure; blood lead provides more of a short-term exposure measure. In analogy to pack years versus current cigarettes, each plays a role in health outcomes and possibly a combined measure should be considered.
Factors in Setting the Blood Lead Standard
Choice of Endpoint
The currently identified goal is to control blood lead in order to control its influence on blood pressure. However, there are several other, likely more important, health outcomes that should be considered when setting an exposure standard. Most important are those that affect reproductive health, the health of the fetus and the child.
Fecundity is affected by lead exposure and it is not sufficiently appreciated that its effects operate through the female AND the male, this latter via sperm motility, longevity and effectiveness. Lead affects female fecundity and fertility as well as birth outcomes.
Exposure of children in schools and other commercial/public spaces argues for using the same standard as for residences.

Should the Commercial/Public Standard be Different from the Residential?
Yes, if the sole focus is on blood pressure effects in adults; no if fecundity, fertility, birth outcomes and direct effects on children are part of the focus.
Recommendation
So long as standards can evolve, start by importing the residential standard. Design and conduct highly informative studies to pin down commercial/public building associations with blood or bone lead. Continue the discussion of the most important endpoints. This approach should motivate the necessary studies.

Comments from Dr. Howard Mielke
Empirical Results—Activity Patterns and Microenvironment
Introduction
During the past 3+ decades, I’ve conducted empirical studies on lead in urban areas, large and small. Several of the empirical studies incorporated blood Pb, age of housing, and learning outcomes of children. The purposes of my comments are to provide a brief overview of the empirical studies, to reference published findings, and to pique research interest into using the accompanying New Orleans empirical soil Pb, blood Pb, age of housing and school performance datasets; all of the data is matched by census tract. The data sets and descriptions of the data sets are in the accompanying zip file, which is available from the EPA Designated Federal Officer upon request.
Statistics: General Comment Regarding Section 3.1
Estimating distributions of concentrations in each microenvironment. Residential, p.7 and Commercial-Public, p. 14.
Lines 31-35 in both documents state… “In general, candidate distributions will be the normal distribution, the lognormal distribution, or the uniform distribution. Previous similar assessments (e.g., USEPA 2008b) have shown that many media concentration distributions are positively skewed and the lognormal distribution often is the most appropriate representative. The definition of each distribution will be an arithmetic mean and standard deviation (for normal distributions), a geometric mean and geometric standard deviation (for lognormal distributions), or a lower and upper cutoff (for uniform distributions).”
As a result of discussion with my brother, statistician Paul W. Mielke, Jr., concerns were expressed about the statistical approach. His alternative statistical approach is summarized below:
“In most investigations, the population distribution will never be known, and assuming an inappropriate distributional model will most likely result in invalid statistical inferences. Thus, the normal distribution is an inappropriate model for many ecological data, which most often are skewed, discontinuous, and multi-modal. When sample sizes are small, large sample approximate methods are often questionable. Permutation procedures make efficient use of small sample sets, because probabilities can be calculated exactly by complete enumeration of all possible combinations under the null hypothesis, otherwise, resampling or Pearson type III approximations are needed; the latter are because very small probability values (P-values) are encountered. Of greater importance, the permutation testing framework allows the use of exceedingly robust statistical tests based on distance functions such as Euclidean distance. Euclidean distances yield the ordinary geometrical interpretation of distance by investigators in any applied field of science. Most conventional parametric and nonparametric methods are
99
based on squared Euclidean distances as a consequence of statistical analyses based on least squares (Mielke PW et al., 2007). Statistics based on squared Euclidean distances are non-metric because they violate the triangle inequality property of a metric and consequently they have no simple geometrical interpretation for the r response variables associated with the r-dimensional Euclidean distance data space in question. The results are given as P-values, i.e., the probability of having the same or a more extreme outcome by chance alone. Thus a very small P-value (near 0) suggests that the outcome is most likely not attributed to chance alone. In contrast, a large P-value (e.g. from 0.1 to 1) suggests the outcome could easily be attributed to chance alone. More information about MRPP statistics and software can be obtained from the following sources (Mielke PW et al., 2007; USGS, 2005).
Multi-Response Permutation Procedures (MRPP) are used to compare g sets of cases where each case involves multivariate responses and are described in detail by Mielke and Berry (Mielke PW et al., 2007). A version of MRPP was applied to the first study of urban soil metals conducted in Baltimore in the mid-1970s (Mielke HW et al., 1983). The version of MRPP used here (Mielke et al., in review) is confined to univariate data and g = 2. While MRPP are a family of statistical tests based on various distance functions, the simple Euclidian distance used here is the intuitive choice of distance functions for evaluating the relationships of these data sets. The distance function between the r multivariate values of the Ith and Jth cases, i.e., (x1,I,…,xr,I) and (x1,J,…,xr,J), is given by:
ΔI,J = [ Σh=1r (xh,I – xh,J)2 ]1/2.
For completeness, if mi is the number of cases in ith of g data sets (i = 1,…,g), then the efficient MRPP weight function is given by ci = mi/(m1+…+mg). Euclidean distance has the property of being a metric that yields an analysis space that is congruent with the data space in question (Mielke PW et al., 2007).”
Sources of Lead: General Comment
Missing is discussion of the 20th Century magnitude of two major Pb sources, paint and additives to gasoline that impacted the macro and microenvironments of our urbanizing society. Figure 1 in Mielke HW and Reagan (1998) presents an overview of the U.S. tonnages of Pb from these two products. The peak use of Pb-based paint occurred in the 1920’s and the peak use of gasoline Pb additives occurred in the late 1960’s and early 1970’s.
One critical observation is that compared with intact paint coatings, which are visible, the exhaust from the Pb additives in gasoline consisted of invisible dust particles.
Empirical Evidence Regarding the Tonnages of Gasoline Pb Additives in the New Orleans Urbanized Area
New Orleans has been the site of environmental Pb research for 2+ decades. New Orleans is an old city with historic residential communities where houses were painted with Pb-

based paints. The communities also have roads bearing various flows of vehicle traffic. Figure 1 shows 1950-1982 tonnages of lead of additives to gasoline in the New Orleans urbanized area.
Figure 1 - Estimated Annual Metric Tons of Gasoline Pb Additives Used in the New Orleans Urbanized Area from 1950-1982.
The Pb additives in gasoline within the New Orleans urbanized area peaked between 1950 and 1982 and the facts about the quantities of Pb additives is critical for understanding the current environment of the city. At their peak the annual tonnages of Pb additive in gasoline were about 500 metric tons in the New Orleans urbanized area. At busy intersections within the city, 5 metric tons from traffic were emitted within the radius of 800 meters, an amount equivalent to the emission rates from some secondary Pb smelters.
Table 1 lists the estimated amounts (in metric tons) of gasoline Pb additives and further divides the data by the particle size of exhaust emissions from 1950-1982. These estimates were developed with the same paradigm used for estimations of California cities (Mielke HW et al., 2010). Lead toxicology is closely tied to particle size. The smaller the particles the more toxic they are. Accounting for gasoline additives is essential for perspective on the magnitude and extent of Pb pollution of urbanized areas such as New Orleans.
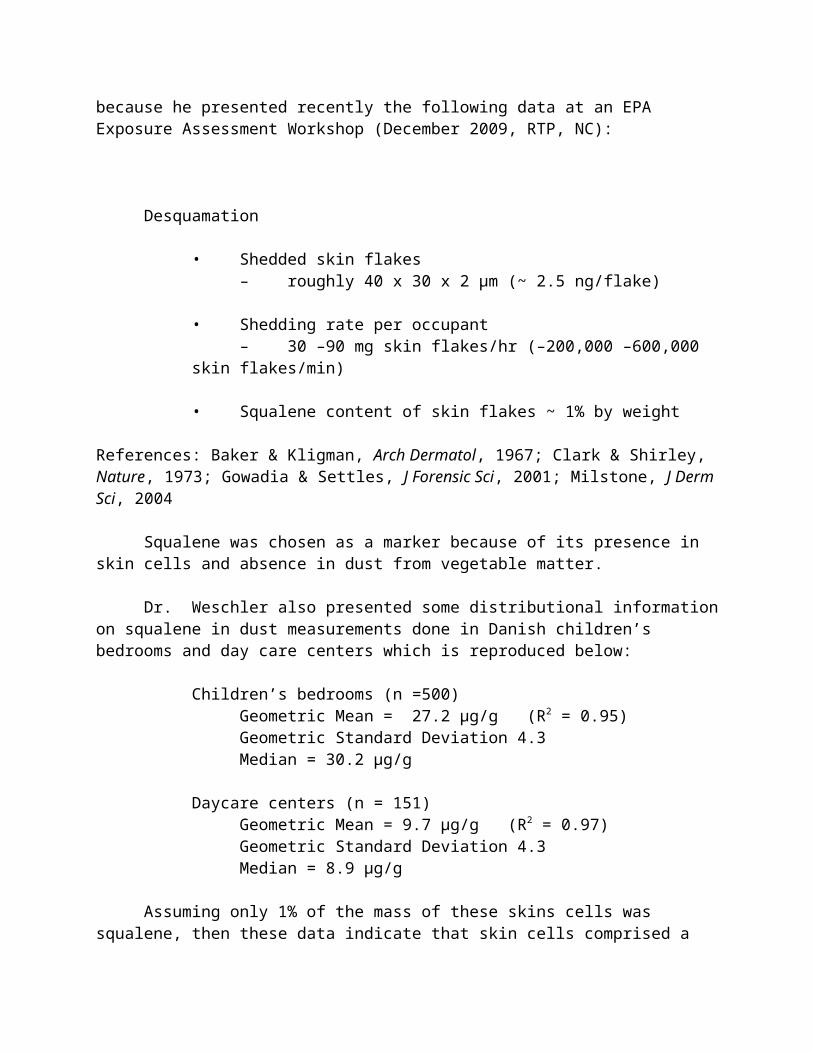
Estimated Metric Tons Gasoline Lead Additives used
in New Orleans 1950-1982YEAR
LA lead metric tons
NOLA Total
Aerosols (75%)
> 10µ (40%) < 0.25µ (35%)
1950 961 145 109 58 511951 904 137 102 55 481952 1051 159 119 64 561953 1315 199 149 80 701954 1418 214 161 86 751955 1502 227 170 91 791956 1695 256 192 102 901957 1725 261 196 104 911958 1548 234 175 94 821959 1618 244 183 98 861960 1629 246 185 98 861961 1799 272 204 109 951962 1837 278 208 111 971963 1970 298 223 119 1041964 2286 345 259 138 1211965 2486 376 282 150 1311966 2746 415 311 166 1451967 2975 450 337 180 1571968 3134 474 355 189 1661969 3424 518 388 207 1811970 3348 506 379 202 1771971 3171 479 359 192 1681972 3096 468 351 187 1641973 3191 482 362 193 1691974 3002 454 340 181 1591975 2698 408 306 163 1431976 2727 412 309 165 1441977 2556 386 290 154 1351978 2164 327 245 131 1141979 1989 301 225 120 1051980 1158 175 131 70 611981 1008 152 114 61 531982 860 130 98 52 46
Totals 68991 10427 7820 4171 3649
Table 1 - Annual Metric Tons of Gasoline Pb Additives in Louisiana and Estimated Metric Tons of Gasoline Pb Additives and Aerosol Exhaust Particles Dispersed into the New Orleans Urbanized Area.
Lead additives to gasoline are inherently hazardous because they are exhausted from the vehicle tail pipe as tiny, invisible particles of Pb dust. According to the U.S. EPA (1986), 25% of the lead additives remained in the oil or coated the interior surfaces of the engine and exhaust system. The remaining 75% of the lead additives to gasoline were exhausted as dust particles into the atmosphere. Table 1 indicates two size fractions of dust particles from lead additives. The largest particles (> 10 microns) settled relatively quickly along roads and within communities according to the flow of traffic. The smallest particles (<0.25 microns) were so small that they traveled longer distances. However, if the small particles hit a vertical surface such as a building side, they pierce the boundary layer of air, adhere to the siding, and wash off the surface into the soil around the perimeter of the building (U.S. EPA, 1986).
If the visible paint coating source of Pb deteriorates, or is disturbed and mismanaged by activities such as power sanding, then the paint coating is turned into invisible lead dust and it is
a serious hazard to everyone (including pets). Lead dust is the issue of critical concern regarding the toxicology and the distribution of Pb dust in the environment.
Characterizing Human Activity Patterns - Exposure Profiles (Section 3.4.1.2.)
The target population of children under 6 is appropriate; however a more sensitive group is children aged 3 or less. Children’s stage of growth and behavior places the youngest children at particular risk.
Children’s Hand-to-Mouth Activities
Exposure profiles described in 3.4.1.2 must be directly concerned with empirical findings concerning hand-to-mouth activities of children. For example, a study of children’s hand Pb at childcare centers in New Orleans revealed fundamental differences between interior hand Pb compared with exterior hand Pb at private and public, as well as inner city and outer city childcare centers (see Figures 1-4 in Viverette et al., 1996). The amount of Pb being picked up by children while at play in the exterior environment was many times higher than what they picked up in the interior environment. The main variable was the amount of Pb in the environment which varies with location in the city (see Pb map of New Orleans, section 6.2).
A study of children’s hand Pb from exterior soils in Denmark also indicated agreement between hand Pb and soil Pb (Nielsen et al., 2005). One striking feature of the study was the amount of soil Pb, 100-200 mg/kg, described as polluted, while the treatment consisted of soils containing <10 mg/kg Pb. The author’s state:
“We found a good agreement between the average concentration of lead in soil and the amount of lead on the hands of the children. Thus, the exposure marker worked and had the advantage compared to a blood sample, that we could evaluate the effect of the interventions shortly after they were accomplished using a noninvasive method. The amount of lead on the hands measured in one of the two kindergartens after the remediation (0.73 µg) was not significantly different from the control kindergarten (0.58 µg). Children from the second kindergarten still had higher median exposures to lead (1.29 µg)….” (Nielsen et al., 2005)
These same hand Pb characteristics extend to all properties, commercial, public and private, where children may play.
Soil and the Magnitude of the Pb Dust Reservoir
When Pb dust accumulates in soil, the soil becomes a deep reservoir of Pb. This fact assists with understanding the large effect that soil Pb has on hand Pb. The size of the soil Pb reservoir was explored empirically in projects comparing small cities and large cities of Minnesota and Louisiana (Mielke HW et al., 1993). The approach toward measurement plays a large role in the perception of the level of hazard presented by soil Pb.

Table 5 in Mielke HW et al. (1993), the amounts of Pb loading within the top 2.5 cm per meter square of soil were calculated from the Pb content of soil samples collected in small and large cities of Minnesota and Louisiana. The results are in grams per square meter. Thus, soils are large Pb dust reservoirs containing millions of µg of Pb per square meter. From this perspective, it is easier to comprehend why soil Pb exerts such a potent effect on the Pb exposure of children.
Using the hand of children to measure Pb dust loading of various environments has the same ethical problem as using children’s blood Pb for deciding about conducting an environmental investigation (Mielke HW et al., 2002). These are secondary prevention approaches and rely on using the individual’s unhealthy outcome as a trigger for finding and reducing the source of exposure. Another approach toward perceiving surface Pb loading is to measure the Pb loading directly by using a tool we call the “potential lead on play surface” (PLOPS) sampler (Mielke HW et al., 2007a). Basically, the PLOPS sampler is a weighted (1 kg) vinyl bag with a known area to which a wipe is attached. The PLOPS is set on the soil and rotated a quarter of a turn and the wipe is removed and analyzed for the Pb. The results from Table 1 of Mielke HW et al. (2007a) indicate the relationship between the results of Pb loading on the soil surface with the Pb content of the soil. There is a consistent (albeit noisy) relationship between the results of Pb loading and Pb content of the soil. It is important to note that the Pb loading of the soil is generally much larger than acceptable for the interior floors of a home. This fact plays into the instruction concerning removing shoes when entering a home. The mechanistic model fails to address the exterior Pb loading issue; in fact, the mechanistic model requires converting Pb loading into Pb content. However, lead loading is an important empirical quality of both interior and exterior environments (Mielke HW et al., 2007a).
Defining (Macro and) Microenvironments of Interest (Section 3.4.1.3.)
The mechanistic model makes general assumptions about microenvironments and human responses. From field research experience, empirical data depicts Pb in both micro and macro environments and human responses, as described in later sections.
Background vs. Urban Soils: Natural Soils Contain Very Small Amounts of Pb
The USGS conducted a survey of the background metals (including Pb) of the U.S. soil and concluded that the median national background soil Pb is 16.5 mg/kg and ranges from 10.3 to 30.1 mg/kg (Gustavsson et al., 2001). Table 1 of Mielke HW et al. (2000) demonstrates a large difference between the amounts of Pb in parent materials of the Mississippi River Delta where soil samples (median 4.7 mg/kg in Mississippi River alluvium) compared with Pb within the urban environment of New Orleans (median 120 mg/kg). Lead dust is connected with human activities and geographic location of the human activity must be a principal consideration.
Visualizing Lead Dust: Survey II Soil Pb Map of New Orleans (2001)
Visualization of paint coatings and their Pb content is relatively easy. Visualization of lead dust from any source, paint or non-paint, is not within the realm of human senses and the Pb must be measured. As described in section 2.2, the technique for measurement influences the

perceived level of hazard; Pb loading provides a better measure of the hazard of soil Pb but Pb content is the ordinary way for measuring soil Pb. Soils contain a record of Pb pollution by human actions. A method was required to visualize Pb dust contaminated soil, and over many years techniques were developed to systematically collect, extract and analyze soil samples to map urban environments for Pb dust (Mielke HW et al., 1983, 1989, 2005a).
The New Orleans map (see the recent soil Pb and childcare center map of New Orleans,
section 6.2) described in Mielke HW et al. (2005a) was created by systematically collecting soil samples throughout the urbanized area at a rate of ~19 samples per census tract (N=286) according to the following collection protocol: 10 samples within 1 m of the street (street side), 4 within 1 m of busy streets (busy street side), 3 matched with street side samples were collected within 1 m of house sides (foundation), and 2 samples were collected from vacant land or parks as far as possible from streets and house sides (open space); total collection N=5,467. Several key factors are related to Pb dust accumulation.
Soil Pb, City Size, Inner-City vs. Outer City, and Urban vs. Rural Location
The first empirical indication of the role of city size to the quantity of soil Pb came from soil Pb studies conducted in Baltimore and various cities of Minnesota.
Soil Pb and City Size
Figure 3 of Mielke HW et al. (1989) and Figure 1 of Mielke HW, et al. (1993) illustrate the basic results from Minnesota and Louisiana. These two Figures show a fundamental fact about ordinary cities without Pb smelters; the larger the city size the larger the quantity of soil Pb. Age of community was not as strong an indicator of Pb dust accumulation as size of the city (Mielke HW et al., 1993, 1989).
Inner City vs. Outer City
First noted for Baltimore (Mielke HW et al., 1983), the inner-city outer city pattern of median Pb by census tract is also observed in New Orleans as illustrated by the soil Pb map in Mielke HW et al. (2005a) (see soil Pb map of New Orleans, section 6.2). The light area near the second bend of the river is the Central Business District (CBD) and because of extensive pavement, there is little collectable soil available there. The darkest red areas surrounding the CBD are the first tier of residential properties in the core of New Orleans. There is a rapid reduction of Pb with increasing distance from the CBD. Every city examined has the same inner-city vs. outer city pattern of soil Pb.
Urban vs. Rural Location
Tables 1-3 in Mielke HW et al. (1997) illustrate the soil Pb differences (along with blood Pb and age of housing, discussed later) between New Orleans and Lafourche Parishes. Over half (52.6%) of the soil samples in rural Lafourche contained <25 mg/kg Pb, 47.4% contained 25-99 mg/kg, and 0% of the samples contained ≥100 mg/kg (16). In New Orleans, 5.2% of the samples contained <25 mg/kg Pb, 24.6% contained 25-99 mg/kg and 70.2% contained ≥100 mg/kg

(Mielke HW et al., 1997). Table 2 in Mielke HW et al. (1997) illustrates the soil Pb differences between urban Orleans Parish and Rural Lafourche Parish in Louisiana. Age of housing and blood Pb are discussed in more detail in section 5.1.
Microenvironments of Residences, Commercial and Public Buildings
Several maps in Mielke HW et al. (1994) illustrate the quantities of Pb dust in soils in different microenvironments. For example, the 3-D map of the house-side microenvironment illustrates the chaotic situation regarding soil Pb collected from drip lines of homes in New Orleans. The key factors are the age of home, the type of siding and maintenance activities of the old (Pb-based) paint. The 3-D map of the matched street-side Pb soil illustrates the soil Pb within a meter of the street matched with the house-side samples. The street-side soils contain a fraction of the Pb found in the narrow perimeter around house-sides.
In New Orleans open power sanding is the common practice and a cause of severe Pb poisoning of pets and children (Mielke HW et al., 2001). A child playing in an area next a structure (residential home, commercial or public building), may be playing in a microenvironment that is severely contaminated with Pb. The contamination is large, but the area is relatively small. A few feet away from the house-side, the soil is generally less Pb contaminated. In some parts of the city, the homes are packed together and the only available play areas are often next to residential homes.
An integrated 3-D soil Pb plot of New Orleans in Mielke HW et al. (1994) shows the general Pb dust pattern of the city. While these soil samples contain a fraction of the Pb dust that is found within the narrow perimeter of the house-side, empirically they represent the general Pb dust accumulation within the city. Further discussion about the general Pb-dust pattern and children’s responses (blood Pb and school achievement) is addressed in section 5.
Inner City and Outer City Soil Pb: Private Residential vs. Public Properties
Table 1 in Mielke HW et al. (2008) indicates that public housing built at the same time in two different locations, “CORE and OUTER” have different amounts of Pb dust accumulated on their properties. This indicates the urban effect of the city and is related to the Pb dust generated by vehicle traffic, Pb-based paint, and local commerce within the CORE of the city compared to OUTER areas of the city.
Table 5 in Mielke HW et al. (2008) illustrates the differences between various combinations of HANO and RES in CORE and OUT for two different surveys of New Orleans Pb dusts accumulation. In general, within the CORE of the city the public housing properties had less Pb than neighboring residential properties while in OUTER areas of the city public housing properties and residential properties had about the same amount of Pb dust.

Empirical Findings of Associations Between Soil Pb, Children’s Blood Pb, and School Performance
From urban soil Pb mapping, age of housing, children’s blood Pb, and school performance studies, we have identified several empirical associations at the macro and micro-environmental scale. These are summarized below:
Children’s Blood Pb Response to Age of Housing and Soil Pb
Tables 4-6 of Mielke HW et al. (1997) are contingency tables of pre-1940 housing (the best fit for the data) and soil Pb; pre-1940 housing and blood Pb; and blood Pb and soil Pb. All of the contingency results are significant; however the strongest results by 6 orders of magnitude (i.e. 10-12 instead of 10-6) for median soil Pb evaluated with median blood Pb (Mielke HW et al., 1997).
Soil Pb and Non-linear Blood Pb Response
The above outcome was followed up by further investigation of the relationship between soil Pb and blood Pb and the empirical relationship is illustrated by a curvilinear association between soil Pb and blood Pb in Mielke HW et al. (1999). These results are not unique as indicated by research conducted in Syracuse which found a similar curvilinear association between soil Pb and blood Pb (Johnson et al., 2003).
Orleans Soil Pb—Blood Pb Curve and Pb Safer Soil Guidelines
A practical application of the blood Pb-soil Pb relationship is illustrated for New Orleans from the 1999 New Orleans curve. Assuming that the policy is to protect most children to a blood Pb < 10 µg/dL then the median blood Pb = 9 µg/dL would define the partition of higher and lower exposure at 310 mg/kg soil Pb (Mielke HW et al., 1999). In Table 2 of Mielke HW et al. (1999), the soil Pb medians by census tract were sorted into two groups. The lower Pb containing census tracts indicates that empirically, a median soil Pb of 80 mg/kg should provide the Pb safer environment to protect most children from a blood Pb of ≥10 µg/dL (Mielke HW et al., 1999). Recent clinical findings of blood Pb and IQ etc. (Canfield et al., 2003, Zahran et al., 2009) indicate the need for a soil Pb guideline below 80 mg/kg to provide a Pb-safe environment and a margin of safety for children living and playing in their residential environments.
Additional Soil Pb, Blood Pb Associations
The most recent results of the blood Pb response to soil Pb indicate the substantial reduction of the number of children below 10 µg/dL in 2000 compared with 1995 (Mielke HW et al., 2007b). There are several possible explanations: the earlier blood Pb was from WIC data and biased toward the poorest, inner-city African-American children. The later surveys were expanded into the suburbs and the demographics of the tested population shifted toward higher income, suburban residents.

Soil Pb, Blood Pb and Learning Outcomes of 4th Grade Students
Recognizing the empirical association identified between soil Pb and blood Pb, and the empirical association between blood Pb and IQ described in recent literature (Canfield et al., 2003), two different studies were conducted. Prior to Hurricanes Katrina and Rita, the elementary schools of New Orleans were organized by districts. In the absence of blood Pb data environmental data was used to evaluate the association between learning measurements from the Louisiana Education Achievement Program by school and the amount of Pb of the environment by each school district (Mielke HW et al., 2005b). Although Pb had a strong association, multiple metal accumulation (MMA) was used because the association was strongest for this environmental measure. Table 3 in Mielke HW et al. (2005b) provides the outcomes of low, middle and high MMA by school district and performance of children (A, P, B, AB, and U) by subject. Note the consistent achievement outcomes were consistent for all performance levels and correspondence between high metals and low test scores was also consistent.
The second study evaluated the association between blood Pb and school learning achievement of 4th grade students (Zahran et al., 2009). The results of the association between blood Pb and learning achievement by students living in school districts with low to high blood Pb in the findings of the second study were similar to the results of the first study. The trend is strong; children living in high Pb communities have high blood Pb and tend to perform poorly compared with children exhibiting low blood Pb levels living in low Pb communities (Zahran et al., 2009). In an economic analysis, cost of reducing Pb exposure were lower than the treatment of Pb poisoning by adding teachers to the classroom (Zahran et al., 2009).
Soil Pb and Race
Figure 2 in Campanella et al. (2008) illustrates the percentage breakdown of the pre-Katrina racial demographics by soil Pb content in New Orleans. Note the decrease of whites and increase of blacks with increasing soil Pb, except at the highest soil Pb levels. These highest soil Pb levels occur in some of the most exclusive Uptown areas, especially the Garden District of New Orleans. Overall, there are large disparities in the soil Pb where African American citizens live compared to where white citizens live in New Orleans (Campanella et al., 2008).
Soil Pb at School Properties vs. Residential Properties
Figure 3 in Higgs et al. (1999) illustrates the differences between Pb dust accumulated in soils on residential properties compared with Pb dust accumulated on neighboring elementary schools. The elementary schools had smaller amounts of Pb than the residential properties where children were likely to be playing before they attend school. The school playgrounds of the inner city had more Pb than the mid or outer city and the soils around entrances had more Pb in the inner city than from other schools. Again, there is a strong inner city outer city trend for both school properties and residential properties (Higgs et al., 1999).

Soil Pb Intervention
Soil Pb intervention of private residential properties involved emplacing clean alluvial soils from the Mississippi River (see section 3.2) (Mielke HW et al., 2006a). The properties were located in areas of the city where the soil Pb survey indicated median soil Pb was ≥ 1000 mg (see Figure 1 of Mielke HW et al., 2006a). The median Pb for the soils, shown in Table 2 of Mielke HW et al. (2006a), before intervention on the properties was 1430 mg/kg. After intervention the median Pb was reduced to 6 mg/kg (Mielke HW et al., 2006a).
Soil Pb Intervention on Private Residential Properties
There was a gradual increase in Pb over three years suggesting resuspension of Pb dust and contamination from the city (see Table 3 in Mielke HW et al., 2006b). One house (UID #7 in Table 3) was power sanded after the intervention of the property and the soil Pb increased to near pre-intervention levels. The power sanding was allowed because the paint contained <5000 mg Pb/kg (Mielke HW et al., 2006b).
Soil Pb Intervention at Childcare Centers
The most recent project, funded by the Greater New Orleans Foundation-Environmental Fund, applied what is known about soil Pb, blood Pb and health outcomes toward intervention of exterior play areas at childcare centers of the city (Mielke HW et al., in review). Ten childcare centers (out of a total of 155 for New Orleans) and one community center were included in the project. The map shows locations of centers in the context of the soil Pb map of New Orleans.

The Tables below provide the pre and post intervention results for soil Pb and Pb loading at the play areas. Note the large change in soil Pb and Pb loading as a result of the intervention. This is a primary prevention intervention approach for reducing Pb exposure of children in New Orleans. Also, the pre-intervention amounts of Pb at each of the childcare centers matched what was predicted from the Pb map of New Orleans (Mielke HW et al., in review).
Table 1 - Before and After Intervention Results of Pb in the Top 2.5 cm of Soil Within Play Areas at New Orleans Childcare Centers. All Analytical Results are for Soil Pb in mg/kg.
Min 5% 10% 25% Median 75% 90% 95% Max nBefore: 14.1 28 40 140 558 1520 2720 3122 3692 50After: 2.2 2.3 2.5 2.8 4.1 7.1 9 11.9 26.1 30
Table 2 - Before and After Intervention Results of Pb Loading Measured by the PLOPS Sampler on the Soil Surfaces of Play Surfaces of Childcare Centers. All Analytical Results are in µg/ft2.
Min 5% 10% 25% Median 75% 90% 95% Max nBefore: 56 111 171 255 454 900 2660 3444 5263 24After: 8 9 13 19 37 53 66 76 91 30
Concluding Comments
Lead dust is the common dynamic factor for both Pb-based paint and Pb additives to gasoline and other sources. Soil is both a sink for Pb dust and a source of exposure to Pb dust. Because of their hand-to-mouth behavior, children are particularly sensitive to Pb dust loading of the surface environment where they play. Soil Pb content poorly characterizes the environmental conditions on the soil surface. For example, empirically, soil containing 400 mg/kg has a surface Pb loading of around 1500 µg/ft2. Through normal hand-to-mouth behavior during ordinary play activities, children readily obtain dust from multiple Pb sources accumulated in the soil.
At the micro-environment scale, Pb dust is most concentrated in the narrow parameter around buildings. At the macro-environmental scale, large areas of the city are contaminated with less concentrated Pb dust than around the perimeter of buildings. Empirically the general pattern of children’s blood Pb and school achievement responses are strongly associated with the general distribution of Pb dust (medians by community) not the extreme measurements of Pb.
Several macro-environment characteristics govern the Pb contamination of residential, commercial and public properties. Lead content significantly differs between urban vs. rural location; large and small cities; inner city vs. outer city location. At the macro environment scale, median blood Pb of children is non-linearly associated with median Pb content of soils.
Empirical research findings indicates that geographic factors are critical variables relating environmental Pb with Pb exposure. NHANES data includes unreleased geographic descriptors such as centroids of census tracts, city size, and urban-suburban-rural location. The geographic descriptors can be obtained by request. With geographic descriptors, NHANES data should provide a more complete set of empirical data to make science-based decisions about Pb dust
guidelines needed to protect the most sensitive group, children 3 or less, from unhealthy exposure to Pb.References
Campanella, R., Mielke, H.W., 2008. Human geography of New Orleans' high-lead geochemical setting. Environ. Geochem. Health 30(6), 531-540. doi:10.1007/s10653-008-9190-9.
Canfield RL, Henderson CR, Jr, Cory-Slechta DA, Cox C, Jusko TA, Lanphear BP. 2003. Intellectual impairment in children with blood lead concentrations below 10 microg per deciliter. N. Engl. J. Med. 348:1517-26.
Gustavsson N, Bølviken B, Smith DB, Severson RC. Geochemical Landscapes of the Conterminous United States—New Map Presentations for 22 Elements. Denver CO: US Geological Survey Professional Paper 1648; 2001. See Lead Map, p. 22.
Higgs, F.J., Mielke, H.W., Brisco, M., 1999. Soil lead at elementary public schools: Comparison between school properties and residential neighborhoods of New Orleans. Environ. Geochem. Health 21: 27–36.
Johnson, D.L. and Bretsch, J.K., 2003. Soil lead and children’s blood lead levels in Syracuse, N.Y., USA. Environ. Geochem. Health 24, 375–385.
Mielke, H.W., Anderson, J.C., Berry, K.J., Mielke, P.W., Chaney, R.L., 1983. Lead concentrations in inner city soils as a factor in the child lead problem. Amer. J. Public Health 73, 1366–1369.
Mielke HW, Adams JL, Reagan PL, Mielke PW, Jr. 1989. Soil-dust lead and childhood lead exposure as a function of city size and community traffic flow: The case for lead contaminated soil abatement in Minnesota. Environ Geochem Health (Supplement to volume 9) Lead in Soil: Issues and Guidelines, ISBN 0-905927-92-3: pp 253-271.
Mielke HW. 1993. Lead dust contaminated USA communities: Comparison of Louisiana and Minnesota. Applied Geochem 8 (Suppl 2): 257-261.
Mielke, H.W., 1994. Lead in New Orleans soils: new images of an urban environment. Environ. Geochem. Health 16(3/4), 123-128.
Mielke, H.W., Dugas, D., Mielke, P.W., Smith, K.S., Smith, S.L., Gonzales, C.R., 1997. Associations between lead dust contaminated soil and childhood blood lead: a case study of urban New Orleans and rural Lafourche Parish, Louisiana, USA. Environ. Health Perspect. 105(9), 950–954.
Mielke HW, Reagan PL. 1998. Soil is an important source of childhood lead exposure. Environ Health Perspect 106 (Supplement 1): 217-29.
Mielke, H.W., Smith, M.K., Gonzales, C.R., Mielke, Jr. P.W., 1999. The urban environment and children's health: Soils as an integrator of lead, zinc and cadmium in New Orleans, Louisiana, U.S.A. Environ. Res. 80(2), 117–129.
Mielke, H.W., Gonzales, C.R., Smith, M.K., Mielke, P.W. Jr., 2000. Quantities and associations of lead, zinc, cadmium, manganese, chromium, nickel, vanadium, and copper in fresh Mississippi alluvium and New Orleans alluvial soils. Sci. Total Environ. 246(2-3), 249-259.
Mielke H.W., Powell, E., Shah, A., Gonzales, C., Mielke, P.W., Jr. 2001. Multiple metal contamination from house paints: consequences of power sanding and paint scraping in New Orleans. Environ Health Perspect. 109:973-8.
Mielke, H.W., 2002. Research ethics in pediatric environmental health: Lessons from lead. Neurotoxicol. Teratol. 24(4), 467-469.
Mielke, H.W. Gonzales, C., Powell E., Mielke P.W., Jr. 2005a. Changes of Multiple Metal Accumulation (MMA) in New Orleans Soil: Preliminary Evaluation of Differences between Survey I (1992) and Survey II (2000). Int. J. Environ. Res. Public Health, 2(2), 308–313.
Mielke HW, Berry KJ, Mielke PW Jr., Powell ET, Gonzales CR. 2005b. Multiple metal accumulation as a factor in learning achievement within various New Orleans communities. Environ. Res. 97(1):67-75.
Mielke, H.W., Powell, E.T., Gonzales, C.R., Mielke, P.W. Jr., Ottesen, R.T., Langedal, M., 2006a. New Orleans soil lead (Pb) cleanup using Mississippi River alluvium: Need, feasibility and cost. Environ. Sci. Technol. 40(08), 2784-2789.
Mielke, H.W., Powell, E.T., Gonzales, C.R., Mielke, P.W. Jr., 2006b. Hurricane Katrina’s impact on New Orleans soils treated with low lead Mississippi River alluvium. Environ. Sci. Technol. 40 (24), 7623 -7628.
Mielke HW, Powell ET, Gonzales CR, Mielke PW Jr. 2007a. Potential lead on play surfaces: Evaluation of the “PLOPS” sampler as a new tool for primary lead prevention, Environ Res; 103: 154–9.
Mielke, H.W., Gonzales, C.R., Powell, E., Jartun, M., Mielke, P.W. Jr., 2007b. Nonlinear association between soil lead and blood lead of children in Metropolitan New Orleans. Sci. Total Environ. 388, 43-53. doi:10.1016/j.scitotenv.2007.08.012.
Mielke, H.W., Gonzales, C., Powell, E., Mielke, P.W. Jr., 2008. Urban soil lead (Pb) footprint: Comparison of public and private housing of New Orleans. Environ. Geochem. Health 30 (3), 231-242. doi:10.1007/s10653-007-9111-3.
Mielke HW, Laidlaw MAS, Gonzales CR. 2010. Lead (Pb) Legacy from vehicle traffic in eight California urbanized areas: Continuing influence of lead dust on children’s health. Sci. Total Environ. doi:10.1016/j.scitotenv.2010.05.017

Mielke H.W., Covington T.P., Mielke P.W. Jr., Wolman F.J., Powell E.T., Gonzales C.R. (In review). Soil intervention as a strategy for lead exposure prevention: The New Orleans lead-safe childcare playground project.
Mielke, P.W., Berry, K.J., 2007. Permutation Methods: A Distance Function Approach, 2nd ed. Springer-Verlag, New York , 439 pp.
Nielsen, J.B., Kristiansen, J. 2005. Remediation of soil from lead-contaminated kindergartens reduces the amount of lead adhering to children’s hands. J. Exposure Analy. Environ. Epidemiol. 15, 282–288.
U.S. EPA 1986—U.S. Air Quality Criteria for Lead, 1986, Volume II, p. 5-14. Washington DC:US Government Printing Office.
USGS, 2005. Blossom Statistical Software, August 2005 update. http://www.fort.usgs.gov/products/software/blossom/blossom.asp (accessed May 28, 2010).
Viverette, L., Mielke, H.W., Brisco, M., Dixon, A., Schaefer, J., Pierre, K., 1996. Environmental health in minority and other underserved populations: Benign methods for identifying lead hazards at day care centers of New Orleans. Environ. Geochem. Health 18 (1), 41-45.
Zahran S, Mielke HW, Weiler S, Berry KJ, Gonazles C. 2009. Children’s blood lead and standardized test performance response as indicators of neurotoxicity in metropolitan New Orleans elementary schools. NeuroToxicol 30:888-97. doi:10.1016/j.neuro.2009.07.017.
Comments from Dr. Ian von Lindern
Reasonableness of the Approach
Both of the proposals (Residential and Commercial) are well constructed and presented in a clear, logical and transparent manner. The proposed methodologies are reasonable given the knowledge-base, available data, and the evolution and precedents established in the Agency’s development of lead risk assessment and application of risk management policies.
The methodology presented is series of complex multi-disciplinary steps that proceed sequentially to estimate dust lead hazard levels protective of human health in the U.S. Each step involves different disciplines, analysis techniques and requires particular expertise and experience. The proposal provides a fair presentation and objective assessment of the status of current knowledge, data available, data gaps and uncertainties associated with each of the major steps and analyses.
In each step, the results of one analysis provide input for the following step. Due to the relative availability of supporting data and established protocols, there are disparities in the levels of uncertainty and resources that can be applied to different steps. As a result, there is a mix of empirical and mechanistic modeling and projections involved in the chain of analyses. This was discussed at length in the July 6-7, 2010 SAB public meetings.
General concerns with the approach were that the results of empirical results are limited to the range of data and conditions of the parent studies. Mechanistic models are hampered by the lack of data to inform selection of key parameters and variable forms or to validate model outputs. These shortcomings can propagate both error and uncertainty through the stepwise modeling process. The proposed methodology appropriately acknowledged these concerns and suggested approaches to address the weaknesses.
The most difficult problems were brought forward to the SAB for consultation in the Charge Questions; and the staff should be commended for the objective characterization of the challenges presented by these items. Among the more constructive criticisms offered by the SAB, in this reviewers opinion, is the advice to not limit model analyses in the individual steps to either empirical regressions or mechanistic models. Mechanistic models informed by empirical analyses will provide the most effective resolution to the pertinent inquiries. Specific suggestions are offered in the response to the following Charge Questions.
On an overall basis, however, there is an opportunity to address the entire process in a combined empirical/mechanistic format. The NHANES database cited during the SAB meeting offers the opportunity to conduct a stratified epidemiologic analysis that can estimate risk levels associated with dust lead loadings measured in a nationwide survey. This study can be conducted both independently of the proposed analysis, and to inform the selection and assessment of key parameters and variable structures in the mechanistic models. Additionally,
114

the Agency can also objectively evaluate the assertions of the petitioners seeking revision to the hazard standards.
With regard to the key steps in the analyses, the following comments apply:
Select Target Blood lead Concentration
Consideration of the proposed target blood lead levels in the residential document is appropriate as described. IQ decrement for young children is the most significant endpoint to consider and there is sufficient suggestive evidence to examine blood lead levels for this effect at the concentrations noted. With respect to the commercial buildings, the document considers adult health effects and identifies hypertension as the most significant effect. This reviewer does not have the expertise to comment on potential cardiovascular effects, particularly at these low target blood lead levels. However, it seems that consideration should be given to maternal blood lead levels, as surrogate for the fetus, as the most vulnerable population.
Estimate Environmental Media and Exposure Concentrations
There are two fundamental considerations in characterizing environmental media for this exercise: i) the dust hazard must be characterized as dust lead loading to meet the statutory definition, and ii) all the other lead intakes must be characterized in order to assess the baseline levels from which the impact of dust will be evaluated.
With respect to dust, there is an interrelated problem of selecting and characterizing environmental media concentrations for the purpose of quantifying exposures and estimating blood lead levels versus expressing the hazard standard. There has been a continuing discussion in lead risk assessment considerations as to whether to characterize dust hazard as a lead concentration or a lead loading. This argument has been carried out on the floor, where the measurement is taken. However, the underlying risk is ultimately related to the amount of lead ingested by children. This ingestion is the product of the mass dust consumed times the concentration of lead in that dust. In the epidemiologic approach the amount of lead in the dust is measured over a prescribed area, and is subsequently empirically related to the blood lead levels of children exposed to that lead. There exist distributions of baseline lead intakes and dust lead loadings across the population of housing measured, that are not necessarily independent. Risk probabilities can be calculated as a function of the variance of regression equations. In this approach there is an inherent assumption that there is a relationship between floor-loading and ingestion, i.e. the more dust on the floor - the more dust consumed.
In the mechanistic model approach, the concentration of the dust is measured, and it is presumed that a prescribed amount of dust is ingested. Lead ingestion is then calculated by the product of the concentration and the presumed ingestion. Several assumptions are applied and estimating the ingestion rate; and risk is calculated by applying an empirical description of the distribution of outcome blood lead levels across the same population (that distribution also subsumes the variation of other exposures and bio-kinetic response). In this approach there is an inherent assumption that the amount of dust ingested may be moderated by hand lead content. That is, there may a “sufficient” amount of dust to replenish the hand load and trigger the
ingestion distribution. Additional dust on the floor may not substantially add to overall ingestion by the hand-to-mouth route, making concentration the primary driver.
The simultaneous investigation by both approaches offers the opportunity to assess the characterization of ingestion rates. This could provide significant insight into dust ingestion, not only for this exercise, but for other diseases associated with house dust exposure of toxins and allergens in homes.
Estimate Blood Lead Concentrations: IEUBK Analysis
The key calculations performed in undertaking these analyses also include the baseline assigned to all other sources of lead intake and in the construct of the soil/dust ingestion input to the IEUBK model. With respect to the other intake sources, EPA recommended default values should be used, and sensitivity analyses performed to assess the significance of varying the intake assumptions. Monte Carlo techniques could also be employed to arrive at central tendency values. Several of these inputs can likely be set to point values due to the relative contribution to overall exposure.
With respect to the dust component, several factors go into this estimate including i) the overall ingestion rate of soil/dust, ii) the partition amongst outdoor soils and indoor dusts, and iii) the relative bioavailability of each component. The overall ingestion rate is analogous to the dust loading rate in the empirical/epidemiologic approach and reflects the central tendency of dust intake plus a baseline soil intake. This variable should be initially assessed at the suggested EPA default rates with lesser and greater values included in the sensitivity analyses. The partition should also be initially set at the EPA default values and, subsequently, at values determined by the micro-environment activity assessments proposed in the document. Various exposure activity scenarios can be considered to assess sensitivity to these factors in the model. Bioavailability should also be initially set at the EPA default recommendation and then evaluated at greater and lesser values to assess sensitivity. Monte Carlo techniques could also be employed to arrive at central tendency values.
The initial runs of the IEUBK analyses will yield estimated mean blood lead levels. Applying the geometric standard deviation (GSD) distribution calculation will yield estimated percentages of children to exceed the threshold blood lead criteria. These results can be related to the input dust lead concentration and subsequent sensitivity analyses can be used to evaluate the significance of other parameters in defining that relationship. Monte Carlo techniques should not be used to estimate the variance in outcome blood lead distributions. This GSD will, by necessity, need to be selected empirically based on experience and other relevant studies, per the recommendations provided in association with the IEUBK.
The initial model applications utilizing EPA recommended default values may tend to overestimate blood lead levels because conservative (or protective) values have been selected to ensure that risk is not underestimated. Selecting conservative values for each component can multiply though the model and result in over-prediction of mean blood lead levels. Applying the geometric standard deviation (GSD) distribution calculation to an over-predicted mean will similarly multiply the exaggeration of risk.

Epidemiologic Analysis
Simultaneously, the epidemiologic analysis should produce mean blood lead levels associated with stratified levels of dust lead loading. These results may be confounded by the lack of independence between the baseline blood lead levels and dust lead loadings. That is, the neighborhoods where high dust lead loadings are observed may also have higher lead concentrations in other media due to common sources or environmental cofactors. This result would not diminish the overall risk to inhabitants, but would affect the efficacy of the hazard standard in mitigating risk, as it might be more prudent to regulate the common source in another media. It may also result in an overly-protective standard, if the measures employed to meet the standard concurrently reduced concentrations in other exposure media.
In both approaches, the initial solutions are specific to a particular set of conditions and both the applicability and efficacy of extending these results to a national strategy must be evaluated. The first step in this evaluation is to objectively compare the results from the two approaches in the context of the specific conditions. This requires reconciling dust lead concentration and loading as noted in the Charge Question 2.
Conversion of Dust Loading to Dust Concentration
The document offers an elaborate methodology for this conversion that was constructively critiqued at the SAB meeting. Those analyses should be carried out as suggested. When considering lead loading it is convenient to consider that this variable is the product of two components – dust loading times the concentration of lead in that dust. The proposed method does recognize this in the equation using an inverse slope relationship to make the conversion.
However, it is important to recognize that the key estimate to assess risk is the ingestion rate for lead in dust as it relates to the measurement of lead content in the dust media. At one extreme, if the amount of dust consumed is independent of dust loading, then measuring concentration is sufficient to assess and manage risk. On the other hand, if dust ingestion rate is directly proportional to dust loading, then controlling dust loading may be the prudent course of intervention, independent of concentration. Practical experience and available evidence suggest that neither of these extremes apply. Ingestion rates are likely related to dust loading and home hygiene, but not in a linear fashion, with some threshold value below which minimal ingestion occurs - and another threshold above which significant additional ingestion does not occur.
The proposal to simultaneously perform the IEUBK mechanistic and empirical epidemiologic approaches offers a unique opportunity to assess the concentration verse loading argument. The stratification conducted in the epidemiologic approach can yield mean blood lead levels and percent of children to exceed critical threshold values for ranges of dust lead loading values. Geometric standard deviations (GSDs) can be determined from these results, allowing a direct comparison to the IEUBK results. Each IEUBK run will provide a unique solution (or mean and distribution) for each combination of key variable and parameter values. There will likely be several combinations that correspond to the outcome of the epidemiologic analysis. That is, several solutions to the IEUBK analysis will provide dust lead concentrations corresponding to the dust lead loading values observed in the epidemiologic analysis.

These results, to this reviewer’s understanding, will be unique and provide an opportunity to evaluate and, perhaps, validate the IEUBK approach with epidemiologic information; and conversely provide biologic and environmental plausibility support to the epidemiologic findings. These unique combinations of the other sources, key variables and parameters should be evaluated in the context of the plausibility of the biological and environmental transport mechanisms involved. This should be a 180-degree evaluation conducted from the perspective of both analyses, necessarily addressing the inherent assumptions in both approaches with regard to the baseline sources and the treatment of soil and dusts.
Relation of Sill Dust to Floor Dust
The proposed empirical analysis is appropriate as presented. However, there is some concern as to whether the 1% allocation attributed on the basis of surface area ratios is appropriate for exposure considerations. There is a scarcity of information with respect to dust concentration or loading data in commercial buildings. In the absence of such data, residential data distributions should be used. Exposure differences between residential and commercial buildings should be developed within the context of Charge Question 4.
Activity Patterns and Microenvironments
The proposed use of the available data bases is appropriate considering the historic uses and development of the information. However, because of the reliance on the IEUBK model to estimate mean blood lead levels and subsequent distributions across similar exposure scenarios, any discrepancies between the activities developed and EPA default assumptions should be discussed and justified. Any discrepancies of this nature could be the basis of alternative values examined in the sensitivity analyses. Due to the scarcity of data in commercial buildings, differences in the approach to developing risk estimates should rely on assessing activity patterns, with appropriate treatment of subsequent uncertainties.
Blood Lead Modeling
This topic was discussed above. The IEUBK is the most appropriate model and has significant precedence in Agency risk assessment and risk management protocols and policies. The opportunity to evaluate model performance in the context of the NHANES data base could be a significant contribution to lead health risk assessment. The Adult model should be used for commercial buildings applications.

APPENDIX B - EPA Charge Questions to the Panel
Charge Questions for Proposed Approach for Developing Lead Dust Hazard Standards for Residences
Background
TSCA section 403 directs EPA to promulgate regulations that identify, for the purposes of Title X and Title IV of TSCA, dangerous levels of lead in paint, dust, and soil. EPA promulgated regulations pursuant to TSCA section 403 on January 5, 2001, and codified them at 40 CFR part 745, subpart D (USEPA, 2001a). These hazard standards identify dangerous levels of lead in paint, dust, and soil and provide benchmarks on which to base remedial actions taken to safeguard children and the public from the dangers of lead. Lead-based paint hazards in target housing and child-occupied facilities are defined in these standards as paint-lead, dust-lead, and soil-lead hazards. A paint-lead hazard is defined as any damaged or deteriorated lead-based paint, any chewable lead-based painted surface with evidence of teeth marks, or any lead-based paint on a friction surface if lead dust levels underneath the friction surface exceed the dust-lead hazard standards. A dust-lead hazard is surface dust that contains a mass-per-area concentration of lead equal to or exceeding 40 micrograms per square foot (µg/ft2) on floors or 250 µg/ft2 on interior window sills based on wipe samples. A soil-lead hazard is bare soil that contains total lead equal to or exceeding 400 parts per million (ppm) in a play area or average of 1,200 ppm of bare soil in the rest of the yard based on soil samples.
On August 10, 2009, EPA received a petition from several environmental and public health advocacy groups requesting that the EPA amend regulations issued under Title IV of TSCA (Sierra Club et al., 2009). Specifically, the petitioners requested that EPA lower the Agency’s dust-lead hazard standards issued pursuant to section 403 of TSCA from 40 µg/ft2 to 10 µg/ft2 or less for floors and from 250 µg/ft2 to 100 µg/ft2 or less for window sills. On October 22, 2009, EPA granted this petition under section 553(e) of the Administrative Procedures Act, 5 U.S.C. 553(e) (USEPA, 2009a). In granting this petition, EPA agreed to commence the appropriate proceeding, but did not commit to a particular schedule or to a particular outcome.
The document entitled “Proposed Approach for Developing Lead Dust Hazard Standards for Residences” describes the methods that EPA proposes to examine the hazard standards for floors and window sills in residences.
Charge Question 1 - Draft Approach
OPPT has developed a draft Approach document for developing the hazard standards for floors and window sills in residences. This is intended to provide an overview of the approaches that will be used for the selection of the target blood lead levels, estimation of environmental media and exposure concentrations, and the blood lead modeling.
Question. Please comment on the reasonableness of the approach outlined in the draft Approach document.
1

Charge Question 2 - Conversion of Dust Loadings to Dust Concentrations
Section 3.3 and Appendix A of the Approach document describes the method for converting lead loadings to lead concentrations. Two methods are considered to convert from lead dust loading to lead dust concentration: a statistical regression model and a mechanistic mass-balance model. There are limited data available to develop an empirical relationship between lead dust loading and concentration for window sills and to parameterize the mechanistic model. In order to improve the approach, additional data would be needed or assumptions would have to be made which would introduce significant uncertainties to the results.
Question. Please comment on the proposed methods for converting dust loadings to dust concentrations. Please comment on whether the empirical or mechanistic model is preferred. Are there other methods that should be explored?
Charge Question 3 - Relation of Sill Dust to Floor Dust
Section 3.2 of the Approach document identifies a relationship that will be assumed between floor dust lead loadings and window sill dust lead loadings. This is further elaborated in section 6.1.5. Some such relationship is needed because not all studies measure lead loadings in both locations and the models that take lead exposures into blood lead require unitary indoor dust inputs. After a fashion similar to the regression model for converting lead loadings to lead concentrations, an empirical model was developed relating floor and window sill dust loadings.
Question. Please comment on the proposed method to relate floor dust loadings to window sill dust loadings. Please comment on the discussion of the regression’s development. Please comment on how the assumptions regarding compliance with hazard standards are incorporated. Are there other methods that should be explored?
Charge Question 4 - Activity Patterns and Microenvironments
Section 3.4.1.2 of the Approach document describes how exposure profiles would be developed using data from the Consolidated Human Activity Database (CHAD) and algorithms from the Air Pollutants Exposure Model (APEX). Section 3.4.1.3 of the Approach document describes how the time spent by persons in various microenvironments would be used to define microenvironments of interest.
Question. Please comment on the proposed methods to establish the activity patterns and microenvironments for the blood lead modeling. Are there methods other than CHAD/APEX that should be explored?
2

Charge Question 5 - Blood Lead Modeling
The assessment will estimate blood lead levels for children. Section 4 of the document describes several models including the IEUBK model (EPA, 1994), the AALM model (EPA, 2005), the Leggett model (Leggett et al., 1993), the O’Flaherty model (O’Flaherty et al., 1993, 1995), and an empirical model (Lanphear et al., 1998b). For the purposes of developing the hazard standards for floor and window sills in residences based on blood lead levels in children, OPPT proposes to use the IEUBK model (EPA 1994).
Question. Please comment on the use of the IEUBK model. Please comment on whether other models should be used.
3
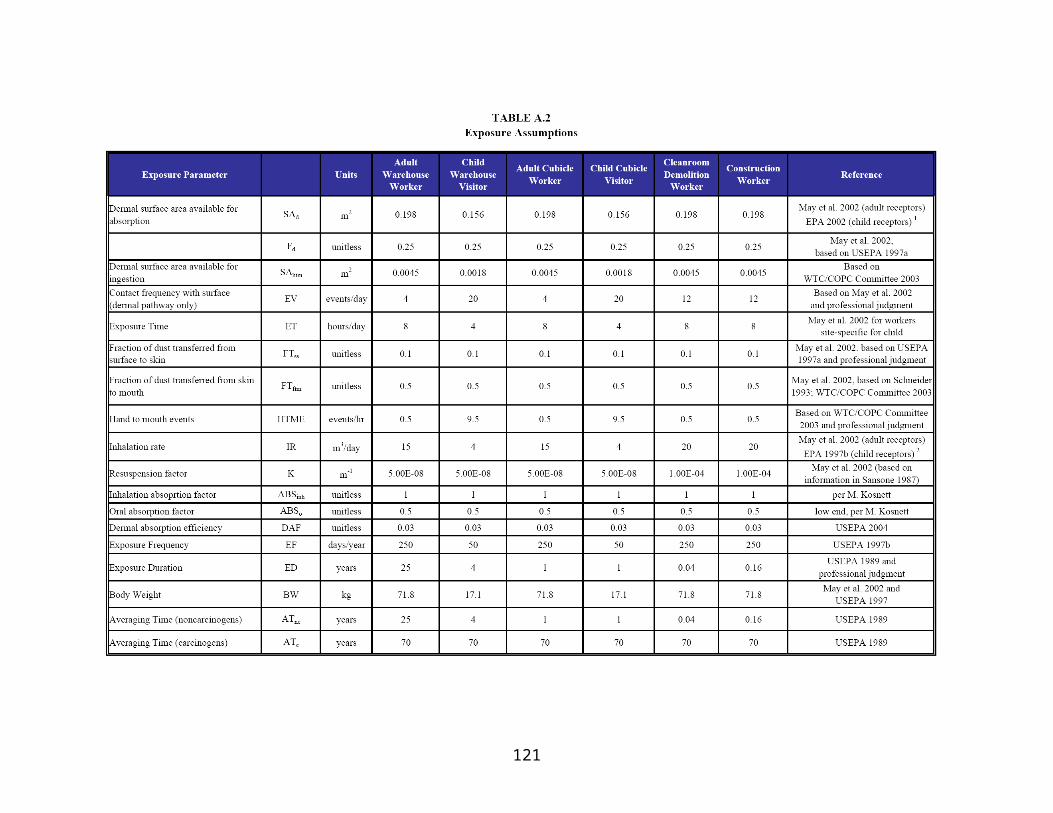
Charge Questions for Proposed Approach for Developing Lead Dust Hazard Standards for Public and Commercial Buildings
Background
Section 402(c)(3) of TSCA directs EPA to revise the regulations promulgated under TSCA section 402(a), i.e., the Lead-based Paint Activities Regulations, to apply to renovation or remodeling activities in target housing, public buildings constructed before 1978, and commercial buildings that create lead-based paint hazards. In April 2008, EPA issued the final Renovation, Repair and Painting Rule (RRP Rule) under the authority of section 402(c)(3) of TSCA to address lead-based paint hazards created by renovation, repair, and painting activities that disturb lead-based paint in target housing and child-occupied facilities (USEPA, 2008a). The term ‘‘target housing’’ is defined in TSCA section 401 as any housing constructed before 1978, except housing for the elderly or persons with disabilities (unless any child under age 6 resides or is expected to reside in such housing) or any 0- bedroom dwelling. Under the RRP Rule, a child-occupied facility is a building, or a portion of a building, constructed prior to 1978, visited regularly by the same child, under 6 years of age, on at least two different days within any week(Sunday through Saturday period), provided that each day’s visit lasts at least 3 hours and the combined weekly visits last at least 6 hours, and the combined annual visits last at least 60 hours. The RRP Rule establishes requirements for training renovators, other renovation workers, and dust sampling technicians; for certifying renovators, dust sampling technicians, and renovation firms; for accrediting providers of renovation and dust sampling technician training; for renovation work practices; and for recordkeeping. Interested States, Territories, and Indian Tribes may apply for and receive authorization to administer and enforce all of the elements of the RRP Rule.
Shortly after the RRP Rule was published, several petitions were filed challenging the rule. These petitions were consolidated in the Circuit Court of Appeals for the District of Columbia Circuit. On August 24, 2009, EPA entered into an agreement with the environmental and children’s health advocacy groups in settlement of their petitions (USEPA, 2009a). In this agreement, EPA committed to propose several changes to the RRP Rule. EPA also agreed to commence rulemaking to address renovations in public and commercial buildings, other than child-occupied facilities, to the extent those renovations create lead-based paint hazards. For these buildings, EPA agreed, at a minimum, to do the following:
• Issue a proposal to regulate renovations on the exteriors of public and commercial buildings other than child-occupied facilities by December 15, 2011 and to take final action on that proposal by July 15, 2013.• Consult with EPA’s Science Advisory Board by September 30, 2011, on a methodology for evaluating the risk posed by renovations in the interiors of public and commercial buildings other than child-occupied facilities.• Eighteen months after receipt of the Science Advisory Board’s report, either issue a proposal to regulate renovations on the interiors of public and commercial buildings other than child-occupied facilities or conclude that such renovations do not create lead-basedpaint hazards.
4

In order to evaluate the potential risks associated with lead exposure due to renovations in public and commercial buildings, and the potential need for regulations on these activities, it is first necessary to develop the hazard standards for lead dust on window sills and floors in public and commercial buildings; these become the standards to help inform the impact of renovation activities. These standards will identify dangerous levels of lead in paint and dust, and provide benchmarks on which to base remedial actions taken to safeguard children and the public from the dangers of lead. The document entitled “Proposed Approach for Developing Lead Dust Hazard Standards for Commercial and Public Buildings” describes the methods that EPA proposes to examine the hazard standards for floors and window sills in commercial and public buildings.
Charge Question 1. Draft Approach
OPPT has developed a draft Approach document for developing the hazard standards for floors and window sills in public and commercial buildings. This is intended to provide an overview of the approaches that will be used for the selection of the target blood lead levels, estimation of environmental media and exposure concentrations, and the blood lead modeling.
Question. Please comment on the reasonableness of the approach outlined in the draft Approach document.
Charge Question 2. Development of a Response Curve for the Blood Lead-Blood Pressure Relationship
The Approach document for public and commercial buildings discusses selecting blood lead concentrations associated with health effects in adults as well as children. This differs from the residential hazard standards because there may be some buildings in which children are unlikely to visit and OPPT may consider deriving an "adult standard" for certain public and commercial buildings. A large number of studies have found blood lead concentrations to be associated with varying degrees of blood pressure elevation in adults; OPPT will use this relationship as the hazard endpoint for adults.
The meta-analysis data provided in Nawrot et al (2002) were used to define the potential blood lead levels of concern. Levels of 0.3, 1, 5, 10, and 20 µg/dL were chosen based on the lower range of average blood lead levels represented in the studies included in the meta-analysis. These data, or a suitable subset of them, will be used to develop a response curve for the blood lead-blood pressure relationship that can be used in the hazard standard development for sills and floors.
Question. Please comment on this approach for developing a response curve for adults.
5

Charge Question 3. Conversion of Dust Loadings to Dust Concentrations
Section 3.3 and Appendix A of the Approach document describes the method for converting lead loadings to lead concentrations. Two methods are considered to convert from lead dust loading to lead dust concentration: a statistical regression model and a mechanistic mass-balance model. There are limited data available to develop an empirical relationship between lead dust loading and concentration for window sills and to parameterize the mechanistic model. In order to improve the approach, additional data would be needed or assumptions would have to be made which would introduce significant uncertainties to the results.
Question. Please comment on the proposed methods for converting dust loadings to dust concentrations. Please comment on whether the empirical or mechanistic model is preferred. Are there other methods that should be explored?
Charge Question 4. Relation of Sill Dust to Floor Dust
Section 3.2 of the Approach document identifies a relationship that will be assumed between floor dust lead loadings and window sill dust lead loadings. This is further elaborated in section 6.1.5. Some such relationship is needed because not all studies measure lead loadings in both locations and the models that take lead exposures into blood lead require unitary indoor dust inputs. After a fashion similar to the regression model for converting lead loadings to lead concentrations, an empirical model was developed relating floor and window sill dust loadings.
Question. Please comment on the proposed method to relate floor dust loadings to window sill dust loadings. Please comment on the discussion of the regression’s development. Please comment on how the assumptions regarding compliance with hazard standards are incorporated. Are there other methods that should be explored?
Charge Question 5. Activity Patterns and Microenvironments
Section 3.4.1.2 of the Approach document describes how exposure profiles would be developed using data from the Consolidated Human Activity Database (CHAD) and algorithms from the Air Pollutants Exposure Model (APEX). Section 3.4.1.3 of the Approach document describes how the time spent by persons in various microenvironments would be used to define microenvironments of interest.
Question. Please comment on the proposed methods to establish the activity patterns and microenvironments for the blood lead modeling. Are there methods other than CHAD/APEX that should be explored?
6

Charge Question 6. Blood Lead Modeling
The assessment will estimate blood lead levels for children and adults. Section 4 of the document describes several models including the IEUBK model (EPA, 1994), the AALM model (EPA, 2005), the Leggett model (Leggett et al., 1993), the O’Flaherty model (O’Flaherty et al., 1993, 1995), and an empirical model (Lanphear et al., 1998b). For the purposes of developing the hazard standards for floor and window sills in public and commercial buildings, OPPT proposes to use the IEUBK model (EPA 1994) for children and the Leggett model (Leggett et al., 1993) for adults.
Question. Please comment on the use of the IEUBK and Leggett models. Please comment on whether other models should be used.
7