texas water - state flood assessment · texas water development board september 17, 2018 dear flood...
TRANSCRIPT
Texas Water Development Board
September 17, 2018
Dear Flood Stakeholder:
P.O. Box 13231 , 1700 N. Congress Ave. Austin, TX 78711-3231 , www.twdb.texas.gov Phone (512) 463-7847, Fax (512) 475-2053
Thank you for your interest in the State Flood Assessment. Your information and thoughts on
flood mitiga tion in our state are vital to this firs t comprehensive assessment on flooding in
Texas. As such, please consider taking pa rt in the public review and comment period on the Draft State Flood Assessment.
Throughout this process, stakeholder input gathered through surveys, workshops, and meetings
has helped the Texas Water Development Board better understand flood risks, flood planning
efforts, and flood mitigation needs in Texas. This first statewide assessment uses that input to
communicate information that may inform decision-making regarding the need for, and benefits
of, future flood planning and financial investment.
The public review and comment period begins September 17, 2018, and ends a t 5:00 p.m. on
October 3, 2018. There are three options for providing comments:
1. Email comments to [email protected] 2. Provide public testimony at the October 3, 2018, Board meeting 3. Submit written comments to the following postal mail address:
State Flood Assessment Public Comments Texas Water Development Board 1700 North Congress Avenue, P.O. Box 13231 Austin, TX 78711-3231
We encourage you to participate in this final opportunity to contribute to the flood assessment.
All comments received by the deadline will be considered. For more information, visit
www.texasfloodassessment.com. If you have any questions, please contact Dr. Mindy Conyers of
our Surface Water staff at 512-463-5102 or [email protected].
rrll~ D ~271 Execu~ ministrator
Our Mission
To provide leadership, information, education, and support for planning, financial assistance, and outreach for the conservation and responsible
development of water for Texas
Board Members
Peter M. Lake, Chairman I Kathleen Jackson, Board Member I Brooke T. Paup, Board Member
Jeff Walker, Executive Administrator
DRAFT – State Flood Assessment – DRAFT
DRAFT – i – DRAFT
State Flood Assessment
Report to the 86th Texas Legislature
Peter M. Lake, Chairman
Kathleen Jackson, Member
Brooke T. Paup, Member
Jeff Walker, Executive Administrator
DRAFT – September 17, 2018
DRAFT – State Flood Assessment – DRAFT
DRAFT – i – DRAFT
Table of Contents
Executive Summary ..................................................................................................................................................... i
1 Introduction ......................................................................................................................................................... 1
2 Texas floods ......................................................................................................................................................... 5
2.1 Types of floods .......................................................................................................................................... 5
2.2 Precipitation influences .......................................................................................................................... 7
2.3 Geography of floods ............................................................................................................................... 8
3 Flood risk ........................................................................................................................................................... 10
3.1 Flood risk to Texans ............................................................................................................................. 10
3.2 Flood risk to the economy ................................................................................................................. 12
3.3 Future risk ................................................................................................................................................ 12
3.4 Awareness in Texas ............................................................................................................................... 14
4 Floodplain management and mapping ................................................................................................. 15
4.1 What is a floodplain? ........................................................................................................................... 15
4.2 Mapping a floodplain .......................................................................................................................... 17
4.3 Mapping the regulatory floodplain ................................................................................................ 17
4.4 Mapping needs in Texas ..................................................................................................................... 21
5 Planning for floods ........................................................................................................................................ 24
5.2 Current planning efforts in Texas .................................................................................................... 25
5.3 Approaches used in other states ..................................................................................................... 28
5.4 Elements of sound planning ............................................................................................................. 30
6 Flood mitigation in Texas ............................................................................................................................ 33
6.1 Types of flood mitigation activities ................................................................................................ 33
6.2 Cost of mitigation in Texas ................................................................................................................ 36
6.2.1 Anticipated mitigation costs .................................................................................................... 37
6.2.2 Available mitigation funding ................................................................................................... 37
6.2.3 Mitigation funding shortfall ..................................................................................................... 39
6.3 Funding sources ..................................................................................................................................... 40
6.3.1 Local funding ................................................................................................................................. 40
DRAFT – State Flood Assessment – DRAFT
DRAFT – ii – DRAFT
6.3.2 State and federal funding ......................................................................................................... 43
7 Roles and other considerations ................................................................................................................ 45
7.1 Responsibilities for flood mitigation .............................................................................................. 45
7.2 Barriers to implementation ................................................................................................................ 49
7.3 Synergies with water supply ............................................................................................................. 52
8 Preliminary findings and stakeholder priorities .................................................................................. 53
8.1 Preliminary findings .............................................................................................................................. 53
8.2 Limitations and uncertainties in estimating costs ..................................................................... 54
8.3 Stakeholder priorities........................................................................................................................... 55
8.4 Impact of doing nothing .................................................................................................................... 58
8.5 Benefits of acting now ......................................................................................................................... 58
8.6 Laying a foundation with science and data ................................................................................. 58
References .................................................................................................................................................................. 60
Appendix A – Estimating financial need for mitigation ............................................................................ 65

DRAFT – State Flood Assessment – DRAFT
DRAFT – i – DRAFT
Executive Summary
Though Texas has experienced flooding throughout its history, losses of life and property in
recent years—from the 2015 Memorial Day Flood in Wimberley to Hurricane Harvey along the
Gulf Coast in 2017—highlight the state’s vulnerabilities. These disasters, along with six other
federally-declared flood declarations since 2015, call attention to the need for a clearer
understanding of flooding in Texas, from the events themselves to the resources needed to
mitigate them.
This report provides an initial assessment of Texas’ flood risks, an overview of roles and
responsibilities, an estimate of flood mitigation costs, and a synopsis of stakeholder views on the
future of flood planning in Texas. It does not seek to fund specific strategies or projects related
to flood planning, mitigation, warning, or recovery. Preliminary findings summarized in this
assessment are derived from stakeholder input and organized according to three key pillars of
comprehensive flood risk management: (1) mapping, (2) planning, and (3) mitigation.
Flooding has never been assessed at the statewide level. Texas has a long and storied history
of flood events. Until this effort, the state has not comprehensively examined its flood risks,
flood impacts, or mitigation costs. For the foundation of this assessment, we conducted surveys,
workshops, and meetings with stakeholders across the state, the results of which, both
quantitative and qualitative, are integral to better preparing for future Texas floods.
Flood risks pose a serious threat to lives and livelihoods. Most communities in Texas use
Flood Insurance Rate Maps (FIRMs) to communicate local flood risk. These maps are created and
maintained by the Federal Emergency Management Agency (FEMA) to establish insurance rates.
However, these maps currently are the state’s best tool for assessing flood risk. Based on these
data and the State of Texas Hazard Mitigation Plan, we know that roughly 1 in every 10 Texans is
exposed to moderate or high risk of riverine flooding each year; coastal flooding is projected to
become the costliest weather-related hazard to the state; and, more than half of recent flood
insurance claims occurred outside of areas identified as high-risk flood zones.
Much of Texas is either unmapped or uses out-of-date maps, leading to widespread
confusion. Mapping is the first step in identifying and communicating flood risk. FEMA’s
insurance maps show the boundary of inundation for the 1 percent annual chance flood event—
commonly referred to as the 100-year flood and often misinterpreted as the line between safe
and not safe. However, these maps may not reflect flood conditions based on the most current
topographic, land use, or rainfall data. Creating flood risk maps using the most recently
collected scientific data and models for all watersheds in the state could cost up to $604 million.
Stakeholders prioritized up-to-date flood risk mapping, including collection and distribution of
supporting data and addressing local drainage issues.
DRAFT – State Flood Assessment – DRAFT
DRAFT – ii – DRAFT
Rainfall drives most flood events in Texas, but the rainfall data used to inform planning
and design are decades old. Historical rainfall records are used to model and predict how
frequently a specific flood event might reoccur. Unfortunately, the rainfall depth-duration-
frequency data that underlie such efforts have not been updated in 40 years. When a revised
version of this data is released later this year (Atlas 14, Volume 11), new analyses and modeling
will be needed to determine the impacts of updated rainfall estimates. In areas with significant
increases in estimated rainfall, flood risks are likely to be greater than previously thought.
Texas does not have a statewide strategic plan to address flood risk management. Flood
mitigation involves any combination of actions taken to prevent or reduce the impacts of flood
events. Though individual planning efforts take place across the state, there is not a unified,
coordinated process to assess and plan for the state’s flood-related needs. As such, project
implementation occurs piecemeal. Mitigation without sound scientific data, proper mapping,
and coordinated planning may be ineffective, or worse—may intensify flood impacts in
upstream or downstream communities. Stakeholders expressed a preference for locally-led
flood planning at a watershed-scale. This sentiment is consistent with stakeholder calls for
increased collaboration, coordination, and leadership among all entities with flood
responsibilities. A goal of watershed-based planning is to identify multi-benefit solutions to
common flooding problems and to bring about efficiency in implementing projects.
Significant funding is required to mitigate flooding in Texas. Though the responsibility to
prepare for and mitigate flood impacts is primarily local, most communities do not have the
economic resources required to accomplish their goals. Stakeholders engaged with this
assessment cited funding to support implementation of mitigation projects as their greatest
need. Anticipated statewide flood mitigation costs over the next 10 years are estimated to be
more than $31.5 billion. Due to potential shortfalls in local funding, communities may need
access to an estimated $18.0 to $26.6 billion in additional financial assistance. These estimates
account only for mitigation costs based on stakeholder input. They do not account for projects
associated with Hurricane Harvey recovery, other large federal projects, such as the Coastal
Spine or third reservoir being discussed for the Houston area, or rehabilitation of high hazard
dams within the state.
Stakeholders identified the need for additional resources directed toward floodplain
management and mitigation. Specifically, stakeholders requested, in order of priority: (1)
additional financial assistance for implementation of flood mitigation activities;
(2) improvements to flood risk mapping and modeling; and, (3) a preference for collaborative,
locally-led watershed-based flood planning. In addition, we heard a call to expand educational
outreach and technical assistance opportunities throughout the state. These priorities emerged
from myriad suggestions and reflect areas of broad consensus among stakeholders.
DRAFT – State Flood Assessment – DRAFT
DRAFT – iii – DRAFT
Sound science and data are the core elements of effective planning and flood mitigation.
Through support from the Office of the Governor and the Texas Legislature, the Texas Water
Development Board has implemented new initiatives in recent years to better prepare the state
for flood events. To continue expanding these efforts and to improve data collection, mapping,
and monitoring of conditions across the state, the agency has requested an additional $4.45
million in appropriations from the 86th Texas Legislature.

DRAFT – State Flood Assessment – DRAFT
DRAFT – 1 – DRAFT
1 Introduction
Floodwaters rise and fall on every creek,
draw, bayou, coast, and river shoreline in
Texas at some point in time. Floods, like
drought, are a natural part of the water
cycle. During a drought we anxiously
await a rain event big enough to finally
end the dry spell (the drought buster). It
arrives eventually. But rain events large
enough to end a drought, as well as
smaller events, can lead to flooding.
On September 9, 1921, an intense but short-lived downpour occurred in Williamson County. The
small town of Thrall received more than 36 inches of rain in 18 hours, setting a national record
that remains today (Slade and Patton, 2003; NWS, 2018a). Widespread rainfall in the spring of
1957 broke a statewide, multi-year “drought of record,” but also brought flooding along the
rivers of the state from the Pecos to the Sabine (TBWE, 1957; TWRI, 2011; Burnett, 2012). In
October 1998, a stalled front brought up to 30 inches of rain to south-central Texas in two days,
causing historic flooding along the San Marcos, Guadalupe and San Antonio rivers (Slade and
Patton 2003). Most recently in August and September 2017, Texans witnessed the continuous
rain bands of Hurricane Harvey unleash up to 60 inches of rain over 8 days, causing devastation
for residents from Rockport to Orange, some of whom are still recovering today (Watson et al.,
2018).
Anywhere it rains in Texas, it can flood—a lesson that we often forget too quickly. Despite
extensive flood awareness and mitigation efforts, flooding is a hazard that remains. Through
2023, three of the top five most expensive hazards in the state are anticipated to result from
severe coastal flooding, hurricanes and tropical storms, or riverine flooding. Coastal and riverine
flooding alone are expected to cause more than $6.87 billion in property losses—or 41 percent
of the projected economic loss from all natural hazards during this period (TGS, 2017).
On July 31, 2018, the President signed into law the Consolidated Appropriations Act of 2018
which reauthorized the National Flood Insurance Program (NFIP) through November 30, 2018,
but did not address the more than $20 billion shortfall facing the program (USGAO, 2018). The
federal government formalized the current framework for managing flood-prone lands in 1968
with the passage of the National Flood Insurance Act creating the NFIP. Through three
complementary efforts—flood hazard mapping, floodplain management regulations, and flood
insurance—the NFIP aims to reduce risk to human life and damage to property (44 CFR Chapter
• Until now, Texas has never conducted a
comprehensive, statewide assessment of
flood risks and needs.
• Input from stakeholders across Texas
forms the foundation of this report.
• Stakeholders identified a need for greater
investment in mapping, planning, and
mitigation—three pillars of
comprehensive flood risk management.
•
DRAFT – State Flood Assessment – DRAFT
DRAFT – 2 – DRAFT
I, Subchapter B). However, despite fifty years of concerted effort and extensive participation by
Texas communities, we find ourselves repairing and rebuilding instead of planning and
preventing.
Why a statewide assessment?
Texas is the second most populous state in the United States and the second largest in terms of
land area. Our economy is larger than that of Canada. We also currently rank second behind
Louisiana in terms of flood-related damage payments. Despite these facts, there has never been
a comprehensive statewide assessment of flood risk, flood planning, or the need for mitigation
activities and financial assistance in Texas. While aspects of flood risks are assessed in both local
hazard mitigation plans and the State of Texas Hazard Mitigation Plan (TDEM, 2013), neither
address the full spectrum of complexities that characterize our flood issues.
In the summer of 2016, discourse began with stakeholders and the legislature on the need for a
state flood plan—a long-term strategic document to identify flood mitigation needs and
solutions to reduce flood risk statewide. Subsequently, with funding provided by the 85th Texas
Legislature, the Texas Water Development Board (TWDB) conducted a survey of floodplain
administrators to better understand flood planning, mitigation needs, and associated costs for
communities across the state. This State Flood Assessment represents the outcome of that
process.
The information presented in this assessment is derived from stakeholder input and is organized
according to the three areas of need they described as being most important: (1) increased state
resources for implementation of mitigation activities, which may include support for policy
considerations, increased technical assistance, and data collection; (2) improved and updated
flood mapping activities; and (3) coordinated, watershed-based flood planning. Stakeholders
consistently voiced a need for the state to support investments in these areas. Though we
estimated financial costs for such investments from a variety of sources, we relied solely on
stakeholder input when deriving anticipated costs and funding shortfalls for mitigation and
infrastructure needs.
Captured as vignettes throughout, this assessment includes additional stakeholder input on
floodplain management and mitigation as well as on training and education needs. Often
constrained by a lack of financial resources, stakeholders believe that increased financial support
will enhance existing local floodplain management efforts and will allow for greater leverage of
funding from federal programs. Further, they suggest that the best approach for mitigating
flood risk involves a solid foundation of science and flood risk mapping upon which
collaborative planning can be used to better inform mitigation strategies. The TWDB concurs
with this viewpoint. Thus, this first State Flood Assessment is organized according to such a linear
DRAFT – State Flood Assessment – DRAFT
DRAFT – 3 – DRAFT
progression of effort—mapping, planning, mitigation—in order to serve as a roadmap for flood
risk management across Texas.
Stakeholder input
We conducted extensive outreach to floodplain administrators and stakeholders in
the spring of 2018 to gather both qualitative and quantitative information to form the
basis of this assessment. Two surveys, eight regional workshops, numerous
conversations at water-related conferences, and individual meetings with eight state
and federal agencies allowed many Texans to contribute to this effort.
We conducted surveys in two phases. First, we distributed an initial survey to all
stakeholders via email and online. Then, we sent a second, more detailed survey to
stakeholders who self-identified as willing to provide additional information,
particularly about the financial component of flood mitigation. For outreach
purposes, we divided the state into 12 watershed-based regions generally
corresponding to the state’s major river basins and conducted workshops in seven of
these regions (Figure 1.1).
Stakeholders from across Texas were well-represented by this process. Survey 1
received 1,026 individual responses, and Survey 2 received 208 individual responses.
Most respondents (69 percent) identified themselves primarily as public-sector
employees that hold flood-related responsibilities for their community; nearly 43
percent of whom identified as floodplain administrators. Both small communities and
urban centers were well represented in both surveys. Specifically, small communities
represented 38 percent and 40 percent of total respondents, respectively for Surveys
1 and 2. Across the 12 regions, Survey 1 captured responses representing up to 45
percent of communities within each region. Additionally, the eight workshops
attracted a total of 267 attendees.

DRAFT – State Flood Assessment – DRAFT
DRAFT – 4 – DRAFT
Figure 1.1. Stakeholder outreach was organized by 12 watershed-based regions generally
corresponding to the state’s major river basins. Stakeholder workshops were held in Arlington,
Austin, Corpus Christi, El Paso, Houston, Lubbock, McAllen, and Nacogdoches.
DRAFT – State Flood Assessment – DRAFT
DRAFT – 5 – DRAFT
2 Texas floods
Floods are a natural and regular
occurrence, having shaped the Texas
landscape for millennia. The main
attraction at the Waco Mammoth
National Monument is fossilized
remains of mammoths that perished in
flood waters—an estimated 67,000
years ago. Early settlers also
experienced flooding as a frequent
hazard. The Mission San Antonio (the
Alamo) was moved twice to avoid
destruction from floods (first in 1719
and again in 1724; Schoelwer, 2018). The City of Houston, incorporated in August 1836,
experienced its first recorded flood in April 1837 (Johnston, 1991). The first cabin in what would
eventually become the City of Dallas was damaged in a flood along the Trinity River in 1844
(Butler, 2011). Entire towns have been wiped off the map or moved. In 1882, the town of Ben
Ficklin (then the county seat of Tom Green County) experienced extreme flooding that killed 22
percent of the town’s residents and destroyed almost all structures (Tufts, 2017). The hurricane
that struck Galveston in 1900 killed an estimated 6,000 people and created a fifteen-foot storm
surge that destroyed most structures (Ramos, 1999). Historically, all areas of the state have been
and continue to be impacted by flooding. In fact, each of our 254 counties has endured at least
one federally-declared flood disaster, according to FEMA. Clearly, living in Texas comes with
some risk of flooding.
2.1 Types of floods
The water cycle, also called the hydrologic cycle, is the natural process by which moisture from
oceans and other water bodies moves into the atmosphere as evaporation and then falls back
down to land as precipitation in the form of rain, sleet, hail, or snow. Due to our state’s varied
landscape and location alongside the Gulf of Mexico, Texas’ version of the water cycle frequently
results in flooding, with rainfall serving as the driver of most events. The primary types of
flooding that impact the state are summarized below.
Riverine flooding – Abundant rainfall can result in more runoff entering a river channel than
can be contained within its banks. When water levels exceed the capacity of a channel, the river
overflows onto adjacent lands, called the floodplain. On steep, narrow floodplains, these excess
overflows can create flood conditions suddenly (see flash flooding below). Where land is flat and
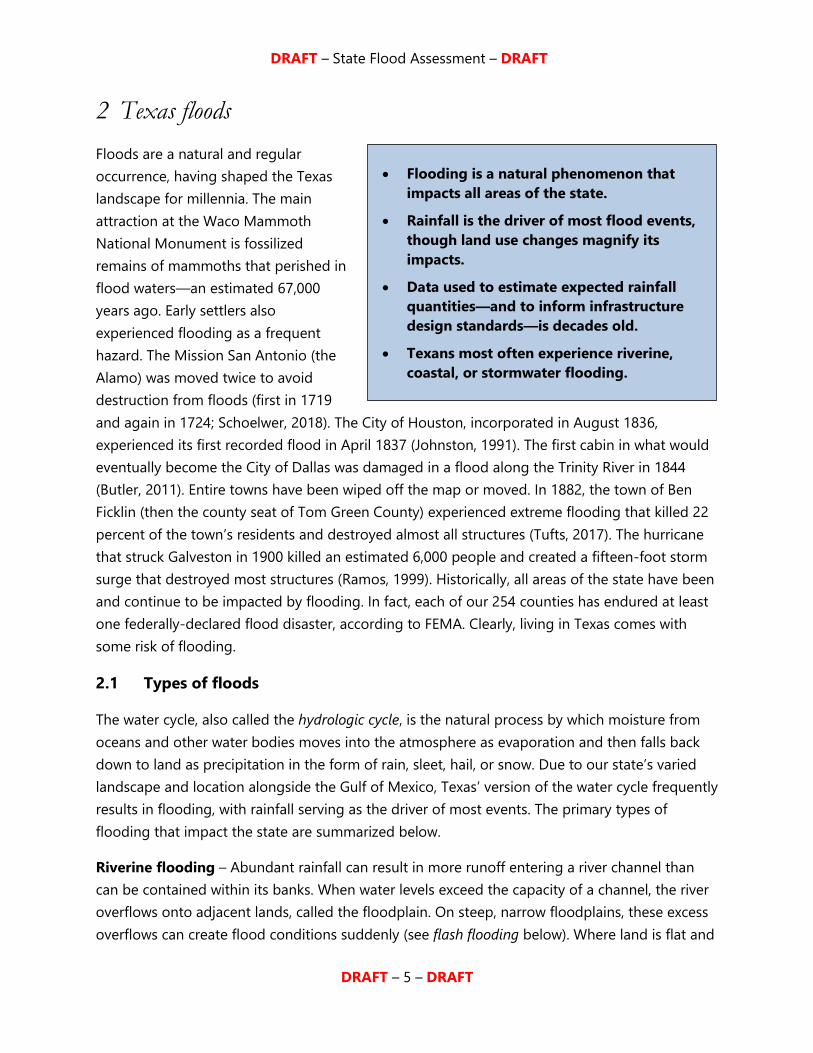
• Flooding is a natural phenomenon that
impacts all areas of the state.
• Rainfall is the driver of most flood events,
though land use changes magnify its
impacts.
• Data used to estimate expected rainfall
quantities—and to inform infrastructure
design standards—is decades old.
• Texans most often experience riverine,
coastal, or stormwater flooding.
DRAFT – State Flood Assessment – DRAFT
DRAFT – 6 – DRAFT
floodplains are more expansive, greater volumes of runoff are required to cause flooding, the
impacts of which may take hours or days to reach locations downstream (see slow-rise flooding
below).
Flash flooding – A type of riverine flooding, flash flooding is characterized by a short time-
lag (less than six hours) between the rain event and rapidly rising water levels (NWS, 2018b).
Flash flooding can occur anywhere rainfall intensity exceeds the infiltration capacity of the
soil, causing rapid surface runoff. Areas with large amounts of impervious cover, exposed
bedrock, or other solid surfaces that reduce infiltration and increase runoff, are especially
susceptible to flash flooding.
Slow-rise flooding – This second type of riverine flooding occurs when rain events near the
top of the watershed, or far upstream, cause flooding that continues unabated downstream,
impacting communities where no rain fell. For example, slow-rise flooding occurs along the
Guadalupe River. When intense rains in the Hill Country cause the river to swell in New
Braunfels, the City of Victoria, located 230 river miles downstream, can expect floodwater to
arrive roughly one to two days after it passes underneath IH-35.
Coastal flooding – Low pressure systems may gain strength as they travel across the warm
waters of the Gulf of Mexico, sometimes developing into tropical storms or hurricanes. As these
systems approach the Texas coast, stronger winds combined with changes in water surface
elevation can produce a storm surge that drives ocean water inland across the flat coastal plain.
High tide events also may cause frequent, localized flooding of low-lying coastal lands.
Stormwater flooding – This type of localized flooding occurs when rainfall overwhelms the
capacity of engineered drainage systems to carry away rapidly accumulating volumes of water. It
typically dissipates quickly, except in situations such as when pumping equipment fails due to
loss of power, inflows exceed pumping or conveyance capacity, or debris blocks the passage of
water. In urban settings, the solid surfaces of buildings and streets (also called impervious cover)
prevent rainfall from soaking into the ground. This creates runoff which contributes to
stormwater flooding.
Structural failure flooding – Though uncommon in Texas, failure of man-made infrastructure,
such as dams or levees, can occur when intense or extensive rainfall results in the uncontrolled
release of floodwaters. Failures may arise if a rain event exceeds the design capacity of a
structure, such as when Callaway and McGuire dams failed in Robertson County in May 2004
(TDEM, 2013).
DRAFT – State Flood Assessment – DRAFT
DRAFT – 7 – DRAFT
2.2 Precipitation influences
Culturally, Texas is viewed as a dry state perpetually lacking rain and plagued by drought. Yet,
Texas holds the record for the highest rainfall totals for an individual storm recorded in the
contiguous United States. The 60.58 inches of rainfall recorded at Nederland, Texas, during
Hurricane Harvey broke the single-storm record for the United States, which was set in 1950 in
Hawaii (Blake and Zelinsky, 2018; NWS, 2018c). Rainfall intensity and duration records in Texas
approach the maximum values recorded anywhere in the world (Slade, 1986; Asquith, 1998).
To better prepare, we rely on historical records and rainfall patterns to model and predict future
rainfall, subsequent flood events, and potential impacts. These data are also used to create
infrastructure design standards. However, the primary source of this rainfall data for Texas has
not been updated in 40 years.
Atlas 14, compiled by the National Weather Service, provides estimates of the maximum rainfall
that can be expected for most locations in the United States based on historical rainfall
measurements (NWS, 2018d). An update to Atlas 14 for Texas (Volume 11), due to be released in
2018 (NWS, 2018e), will incorporate four to five decades of additional rainfall data, improving
the accuracy of rainfall information. Once finalized, it will supersede all previous estimates for
rainfall events in the state (primarily USDC, 1961; USDC, 1964; NOAA, 1977).
The draft version of Atlas 14 Volume 11, which incorporates data from Hurricane Harvey, shows
increases of more than 5 inches for the 1 percent annual chance, 24‐hour rainfall event in areas
near Houston as compared to existing historical records (NWS, 2018e). Elsewhere in Texas, new
rainfall estimates may differ significantly. Del Rio, San Antonio, Austin, and Corpus Christi are
some of the areas where the depths of rainfall associated with many storms are expected to
increase.
Once an updated Atlas 14 Volume 11 is finalized, additional studies can determine the exact
consequences of the changes in rainfall estimates. New analyses will be required to determine
and revise the extent of flood inundation that can be expected and the appropriate design
standards for infrastructure. In general, in areas where rainfall estimates go down, there will be
greater confidence that existing infrastructure will perform as intended. In areas where estimates
of rainfall go up, flood risks are likely to be greater than previously anticipated. Increased rainfall
totals over a short time span means that storms will have more significant impacts than
previously predicted translating to larger discharges of water in drainage ditches and under
bridges, larger volumes of water in detention ponds and behind flood control structures, and
larger floodplains associated with a specific duration and frequency of storm.

DRAFT – State Flood Assessment – DRAFT
DRAFT – 8 – DRAFT
2.3 Geography of floods
Texas rivers are born of the water from surface runoff or groundwater discharge and take shape
as they erode, transport, and deposit sediments over many miles in their journey towards the
Gulf of Mexico. Beyond their headwaters and moving downstream, rivers widen and meander as
they drain more and more land area. Texas has 15 major river basins, each with unique
combinations of precipitation and evaporation patterns, geologic and topographic features, and
local soils, vegetation, and land use practices. In addition, eight designated coastal basins,
nested between each major river basin, drain the nearly-flat coastal plain (Figure 2.2).
In Far West Texas where intense but infrequent rains fall on steep slopes and crusted soils
hardened by the sun, water runs off quickly and powerfully—transporting large cobbles while
often carving new paths across the landscape. Flash flooding and local flooding events are most
common here. However, the history of extremely large flood events on the Rio Grande, a river
whose basin drains more than 48,000 square miles, is well documented and has led to the
development of numerous flood control structures (Wermund, 1996).
An area known as “Flash Flood Alley” stretches from Del Rio across to San Antonio then up
through Waco all the way to the Dallas-Fort Worth metroplex. In the southern portion of this
region, the steep terrain, shallow soils, and constricted river channels carved into the Edwards
Plateau result in runoff that is quickly concentrated in the river channels of narrow floodplains.
Floodwaters here tend to be deep, fast, and highly erosive (Caran and Baker, 1986). Moving
northward toward the metroplex, short-duration, high-intensity rain events also result in flash
flooding, especially in urbanized areas.
In the Panhandle, storms may cause local flooding in and around playa lakes and in the
urbanized areas of this region. In East Texas, flood events typically arrive slowly and can linger
for days or even weeks before swollen rivers return to normal.
Most of our major rivers drain the Coastal Plain as they meander toward the Gulf of Mexico. As
the rivers approach the flat topography of the coast, they typically slow down and spread out.
This can result in expansive but shallow flooding in this region. Living at or near sea level also
means exposure to the possibility of coastal flooding from wind-driven storm surge and extreme
precipitation associated with tropical storm systems. Elevated ocean and bay water surface levels
during such events may counteract the downstream flow of rivers and streams, slowing the
outflow of surface runoff from the land and further aggravating flooding in the low lying coastal
plain.

DRAFT – State Flood Assessment – DRAFT
DRAFT – 9 – DRAFT
Figure 2.2. Major Texas river basins and subbasins of Texas.
DRAFT – State Flood Assessment – DRAFT
DRAFT – 10 – DRAFT
3 Flood risk
Nearly every Texan faces some level of
risk related to flooding. The flood risk in
any community, regardless of the type of
flooding, reflects a combination of
natural and human-made factors. Though
flood risk is ever-present, flood events
usually only garner attention when
impacts affect our livelihood by
destroying crops, buildings, roads,
bridges, vehicles, or worse, causing injury
or death.
3.1 Flood risk to Texans
A key to understanding flood risk in Texas is the State of Texas Hazard Mitigation Plan, which is
updated every five years by the Texas Department of Emergency Management and investigates
weather-related hazards that regularly impact the state by examining financial and other
impacts to people and property (TDEM, 2013). Of particular interest to this assessment are the
data presented on riverine flooding and severe coastal flooding; stormwater and structural
failure flooding are not covered by that report.
The mitigation plan reveals that the Houston-Galveston-Beaumont region experiences the most
frequent and reoccurring property damage from severe coastal flooding compared to the rest of
the state, owing to its high population density and vast petrochemical industry. Central Texas,
well-known across the nation for flash flooding, experiences frequent flood losses as well, with
rapid growth in the area along the IH-35 corridor potentially exacerbating the risk.
About 95 percent of floodplain administrators surveyed reported that they determine and
communicate flood risk in their community using Flood Insurance Rate Maps (FIRMs). Created
and maintained by the Federal Emergency Management Agency (FEMA), and discussed in the
next chapter, FIRMs identify areas exposed to moderate or high-risk of riverine or coastal
flooding. We used data gleaned from FIRMs to describe flood risk in Texas and explore the
reasons why Texans cannot fully understand flood risk based on FIRMs alone.
Risk from riverine flooding
Based on available FIRMs and 2010 census data, an estimated 2.8 million people, or 11 percent,
of the state’s population are exposed to high or moderate risk of riverine flooding in any given
• Flood events are common but only capture
our attention when they impact lives and
livelihoods.
• At least 2.8 million people (11 percent of
Texas’ population) are exposed to high or
moderate riverine flood risk annually.
• A majority of recent flood insurance claims
occurred outside of high-risk flood zones.
• Severe coastal flooding is projected to
become the costliest hazard to Texas in the
coming years.
DRAFT – State Flood Assessment – DRAFT
DRAFT – 11 – DRAFT
year. The Houston-Coastal region has the most residents exposed with 23 percent of the 2010
population living or working in one of these risk zones. The Nueces-South Coastal Plains region
has nearly the same percentage of people facing such risk of riverine flooding, with most of
those Texans living in the high-growth Lower Rio Grande Valley (see Figure 2.1).
Of the 12 weather-related hazards investigated during development of the State of Texas Hazard
Mitigation Plan, riverine flooding accounted for 7 percent of average annual property losses
from 1996 through 2016. That study also includes hazard impact forecasts for the 2019 through
2023 time-period, during which riverine flooding is expected to account for 8 percent of all
annual property losses and 6 percent of all crop losses (TGS, 2017).
Risk from coastal flooding
High or moderate coastal flood risk, also displayed on FIRMs, poses the greatest threat, again, to
the Houston-Coastal and the Nueces-South Coastal Plains regions. Note that in the study by the
Texas Geographical Society (2017), storm surge damages are examined under severe coastal
flooding; whereas, hazards posed by hurricanes and tropical storms are associated with wind
impacts. Severe coastal flooding accounted for 25 percent of the average annual property loss
across the state from 1996 through 2016. This type of flooding is projected to surpass all other
weather-related hazards, including hurricanes and tropical storms, to become the costliest
hazard to the state in coming years (TGS, 2017). That study anticipates $5.6 billion in potential
property losses from coastal flooding during the period from 2019 through 2023, accounting for
34 percent of all expected weather-related losses (TGS, 2017).
Risk from stormwater flooding
Impacts from stormwater flooding—sometimes called nuisance flooding because of its frequent
but less severe nature—include damage to vehicles, structures, roads, and related drainage
infrastructure. Roadways pose an additional threat if drivers, unaware of the depth of flooding,
proceed through the water. Similarly, flooded roads prevent and limit emergency response
operations. FIRMs do not capture this type of localized flooding; therefore, historical impacts
and current risk posed by stormwater flooding are difficult to quantify. Communities typically
develop master drainage plans to identify and address issues related to stormwater flooding,
but the statewide picture of exposure from this hazard remains incomplete.
Residual Risk
Residual risk relates to the likelihood of flood impacts occurring within an area despite the
presence of a nearby flood control structure. Sources of residual risk are most often associated
with flood events that exceed the design capacity of a levee, dam, or drainage system as
opposed to those resulting from actual structural failure. Though quantifiable, it often is

DRAFT – State Flood Assessment – DRAFT
DRAFT – 12 – DRAFT
presumed to be negligible or non-existent, creating a false sense of security. The National Levee
Database identifies nearly 2 million Texans subject to residual flood risk associated with levees
(USACE, 2018). No such data exists for the residual risk to Texans associated with dams.
A non-conventional source of residual risk is related to the static nature of FIRMs and how
information is presented on these maps. Because FIRMs represent the flood risk associated with
conditions at the time the map was created, any land use, development, or mitigation changes
that occur after map publication are not accounted for. Further, the binary presentation of flood
risk on FIRMs erroneously conveys the sense that if one is outside the demarcated “100-year
flood zone” there is no risk of being flooded.
3.2 Flood risk to the economy
Commerce exists near water when flows are considered dependable, but flood events can
disrupt a local economy, both in the immediate aftermath of an event and over longer time-
periods. Damages to critical infrastructure, such as bridges, roads, water treatment plants, critical
care facilities, and power plants, may lead to vital service interruptions, causing ripple effects
upon the economy in the affected area and nearby region long after floodwaters recede. For
example, in 2010, flooding along the Rio Grande disrupted international trade for nearly a week
as the main highway between Laredo, Texas and Nuevo Laredo, Mexico remained submerged,
stranding people, trucks, and goods (USDA, 2010).
The loss of livelihoods, reduction in purchasing power, and loss of property values associated
with flooding may increase economic risks to communities. A recent analysis by Standard &
Poor’s Financial Services (2018) notes that improper planning for weather-related risks can
impact a municipality’s credit rating, with specific emphasis on hazard impacts to the local
population and the associated tax base. This analysis also calls out the importance of realistic
financial assumptions and projections that account for the disruptions caused by natural hazards
and the benefits from implementing mitigation strategies to increase resiliency. Further,
recurrent flooding may discourage long-term investments by the government and private sector
alike.
3.3 Future risk
The population in Texas is projected to increase to 41.9 million people by 2050 (TWDB, 2016).
Much of this growth will occur upstream and downstream of our major metropolitan areas
(Figure 3.1). According to U.S. Census data, Texas grows by 1,095 people each day. Without a
concerted focus on “encouraging sound land use by minimizing exposure of property to flood
losses” per Texas Water Code § 16.312, it stands to reason flood events will impact more lives
and cause more damage in the future.

DRAFT – State Flood Assessment – DRAFT
DRAFT – 13 – DRAFT
Figure 3.1. Population projections for 2050 by subwatersheds corresponding to U.S.
Geological Survey 8-digit Hydrologic Unit Code (HUC). Texas has 207 HUC-8 basins.
According to FEMA data, since 1978 Texans have filed more than 361,000 flood insurance claims
totaling just over $15.7 billion in damages. Just over half of those claims, representing $12.7
billion in damages, have been filed since 2008. Further, 53 percent of the more recent flood
insurance claims occurred outside of high-risk flood zones.
FEMA defines repetitive loss as properties that have flooded two or more times with a claim
payment of $1,000 or more. Between 1978 and 2018, 48 percent of repetitive loss claims
occurred outside of mapped high-risk flood zones. However, in the last 10 years, the percentage
of such claims increased to 64 percent. The Houston-Coastal and Nueces-South Coastal Plains
regions have the greatest number of repetitive loss properties within the state, with the San
Jacinto River basin being particularly hard hit. Other basins with a high number of repetitive loss
properties include, in descending rank order, the San Jacinto-Brazos and Neches-Trinity coastal
basins and the Trinity, Brazos, and Guadalupe river basins.

DRAFT – State Flood Assessment – DRAFT
DRAFT – 14 – DRAFT
Similarly, severe repetitive loss claims, as identified by FEMA, occur in every major river basin in
the state, except for the Canadian, totaling 6,776 such properties statewide. Frequency of claims
and losses for these perpetually flooded properties mirror those described above.
In the absence of a full statewide flood risk analysis, we rely on these insurance claims data plus
hazard impact projections to understand our risk. If the past is any indication of the future, these
numbers reveal a concerning trend. Stakeholders likewise noted that despite ongoing efforts,
more resources are devoted to disaster recovery than to proactive mitigation and damage
prevention. Further, recent flood events across the state and draft Atlas 14 revised precipitation
estimates suggest that the frequency—and therefore the risk—of being flooded may be greater
than Texans realize.
3.4 Awareness in Texas
Flood awareness encompasses knowledge of basic concepts of the water cycle, watershed
science, weather patterns, flood risks, and emergency preparedness and response. Most public
education campaigns, however, focus only on situational awareness and preparedness in the
event of a flood. Recent events across the state point to widespread confusion related to the
meaning of the “100-year flood” (explained more in Chapter 4).
Officially trademarked by NOAA since 2004, the National Weather Service’s (NWS) Turn Around,
Don't Drown™ campaign is perhaps most familiar to Texans. The campaign highlights the
danger of driving or wading into flood waters (NWS, 2014). The Texas Department of
Transportation employs the well-known message on road signs, social media, and other venues.
The Texas Floodplain Management Association (TFMA) also uses it in public outreach materials,
including a poster illustration contest for grade school students.
While these collective efforts encourage safe behaviors and reduce the need for emergency
response, the need to develop long-term educational campaigns to increase pre-situational
awareness remains. Efforts to teach the public to understand flood risk within their watershed
can be accomplished by developing user-friendly websites and publications based on observed
data from local, memorable events and general floodplain management concepts.
These campaigns could also re-interpret flood risk data to better communicate the true
potential for inundation by floodwaters. Flood maps for public education could display the full
spectrum of risk from various sized riverine and coastal flood events and—where possible—
communicate the potential risk of stormwater flooding. To prevent loss of life and damage to
property to the greatest extent possible, Texans must understand that the high-risk zone shown
on a flood insurance rate map relates to the requirement to purchase flood insurance. It does
not demarcate whether one is “safe” or “not safe” from the next flood event.

DRAFT – State Flood Assessment – DRAFT
DRAFT – 15 – DRAFT
4 Floodplain management and mapping
Floodplain management encompasses any
part of the strategic effort to identify areas
subject to flooding and to protect the
natural function of those areas. Flood risk
mapping represents the critical first step in
identifying flood prone lands and in
communicating that information to
residents, decision-makers, and emergency
responders. In Texas, complementary efforts
focused on flood-risk mapping, planning,
and mitigation do not exist. This chapter explains the differences between a natural and a
regulatory floodplain and describes the process and applications of flood risk mapping—the
first pillar of sound flood risk management.
4.1 What is a floodplain?
A floodplain is the land adjacent to a water body that is subject to inundation during a flood.
The size and shape of a floodplain influences the characteristics of a flood event. The boundaries
of a natural floodplain change with each flood event as sediments are scoured and deposited
within the river channel and upon adjacent lands. Similarly, the coastal shoreline changes
frequently. A regulatory floodplain, however, is determined by modeling a specific storm event
and depicting the boundaries of inundation resulting from that storm on a map. As a result, a
regulatory floodplain only changes when a new study or mapping effort is conducted.
For the past 50 years, regulatory oversight for floodplain management has followed the
principle that adequate flood protection for the public can be achieved by building
infrastructure and adopting floodplain ordinances to protect against a flood event with a 1
percent probability of occurring in any year. Because such an event has a 1-in-100 chance of
occurring or being exceeded in any given year, the phrases “100-year flood” and “100-year-
floodplain” are commonly used. However, these colloquial terms are misleading. Neither term is
meant to indicate that a flood of such magnitude will only occur only once per 100 years. In fact,
for a structure exposed to this likelihood of flooding, the statistical probability of flood damage
occurring during the span of a 30-year mortgage equals 26 percent.
Further, the boundary of the 1 percent annual chance flood event, shown on a FIRM as the
special flood hazard area (SFHA)—another name for the regulatory floodplain—often is
misinterpreted as a dichotomy between safe and not safe. That line, much like the demarcation
for a 0.2 percent annual chance flood event—commonly termed a “500-year flood”—instead
• Flood hazard mapping is the first step
in identifying flood-prone areas and
communicating risk to stakeholders.
• Floodplain maps are complex and are
often misinterpreted.
• Texas can invest financial resources to
expedite the production of floodplain
maps; an estimated $604 million could
map the state.

DRAFT – State Flood Assessment – DRAFT
DRAFT – 16 – DRAFT
shows the boundary of potential inundation from a very specific flood event based on the land
use conditions that existed when the modeling and mapping were completed. Beyond either
boundary line, the risk of flooding still exists, just with a lower probability of occurrence. As
noted previously, any land use changes subsequent to the modeling alter the movement of
water and thus the probability of flooding.
Purpose of the National Flood Insurance Program (NFIP)
The NFIP operates by voluntary agreement between the federal government and local
political subdivisions (cities, counties, villages, special purpose districts, and tribal nations,
hereafter referred to as communities). Established by Congress in 1968 and administered by
FEMA, the NFIP aims to mitigate future flood damage through three efforts:
Flood mapping: FEMA generates and approves flood insurance rate maps (FIRMs) which
identify areas of high, moderate, or low-risk of flooding along rivers, the coast, and other
water bodies but not for areas impacted by local drainage issues. FIRMs identify land areas
with a high-risk of flooding (areas subject to inundation during a 1 percent annual chance
event) denoted on the map as the regulatory floodplain or the Special Flood Hazard Area
(SFHA). Participants in FEMA’s Cooperating Technical Partners program assist by identifying
watersheds in need of mapping and by conducting mapping activities; however, the final
approval of a regulatory floodplain map is completed by FEMA. View approved FIRMs at
https://msc.fema.gov/
Community enforced regulation: NFIP communities must adopt and enforce floodplain
management regulations that meet or exceed FEMA’s minimum standards (for full criteria,
see 44 CFR 60.3), which include: issuing permits for development within SFHAs; conducting
field inspections and citing violations; maintaining records of floodplain development; and
assisting in the preparation and revision of FIRMs.
Flood insurance: Within NFIP communities, all residents gain the option to purchase
federally-backed flood insurance; however, certain homes and businesses in designated
SFHAs with mortgages from federally-regulated or insured lenders are required to maintain
insurance. Flood insurance also can be required as a condition for receiving federal disaster
aid. FIRMs are used to determine insurance premiums for properties in flood-prone areas.
DRAFT – State Flood Assessment – DRAFT
DRAFT – 17 – DRAFT
4.2 Mapping a floodplain
Understanding the extent of the natural floodplain can be accomplished by observing local
conditions. Rivers carry and leave behind fine sediments during floods. The presence of such
sediments, deposited repeatedly over time, denotes an area that was previously inundated and
may be subject to inundation in the future. Every county in Texas has a detailed soil survey
showing locations of frequently flooded soils (see the NRCS’s Web Soil Survey at
https://websoilsurvey.nrcs.usda.gov/). Similarly, the University of Texas Bureau of Economic
Geology maintains an archive of surface geology map sheets where alluvium, or sediments
deposited by moving water, can indicate the extent of historical flooding.
Along river edges, riparian ecosystems withstand, and in fact rely on, periodic inundation by
floodwaters. Similarly, stable dune systems along the coast support certain plant species that
when absent indicate shoreline areas subject to frequent change and thus flood risk from wave
action. In the aftermath of a flood, the height of floodwaters can be determined via high water
marks left on walls of homes or detritus left perched in trees, bridges, and even road signs.
Though useful to building a narrative of local flood hazards, on their own, these observational
signs are inadequate for certain mapping activities.
In floodplain management, engineers and hydrologists investigate channel or shoreline features
to determine how floodwaters will move. They also use hydrologic and hydraulic modeling to
provide the detailed analyses required for specific design, construction, and regulatory
applications. Hydrologic modeling considers how the unique characteristics of a watershed (the
soils, surface geology, terrain, land use, etc.) respond to a rain event or how much rain will soak
into the soil versus run off into drainage systems and rivers. These models also estimate the lag
time between when the rain falls and when the resulting runoff reaches the stream.
Whereas hydrologic models simulate the quantity and timing of the flow of water, hydraulic
models simulate the forces that affect water flow, specifically how friction and pressure interact
to determine the height to which floodwaters will rise. Here, the characteristics of the stream
channel itself—as opposed to the watershed—are most important. For coastal storm surge
analysis, three-dimensional hydrodynamic circulation models are used to evaluate wave height.
Together, these models can describe the inundation, or spread and depth of water over the
floodplain, associated with the storm event selected for analysis.
4.3 Mapping the regulatory floodplain
FEMA, with assistance from local partners, creates and maintains FIRMs and their modern
digitized equivalents, DFIRMs. Hydrologic and hydraulic or hydrodynamic models, using local
watershed and channel or coastal shoreline data as described above, are simulated to identify
DRAFT – State Flood Assessment – DRAFT
DRAFT – 18 – DRAFT
areas at high, moderate, or low-risk of flooding. FIRMs show land areas subject to inundation by
riverine flood events or coastal storm surge for the 1 percent annual chance event (high-risk or
special flood hazard area) and the 0.2 percent annual chance event (moderate risk area).
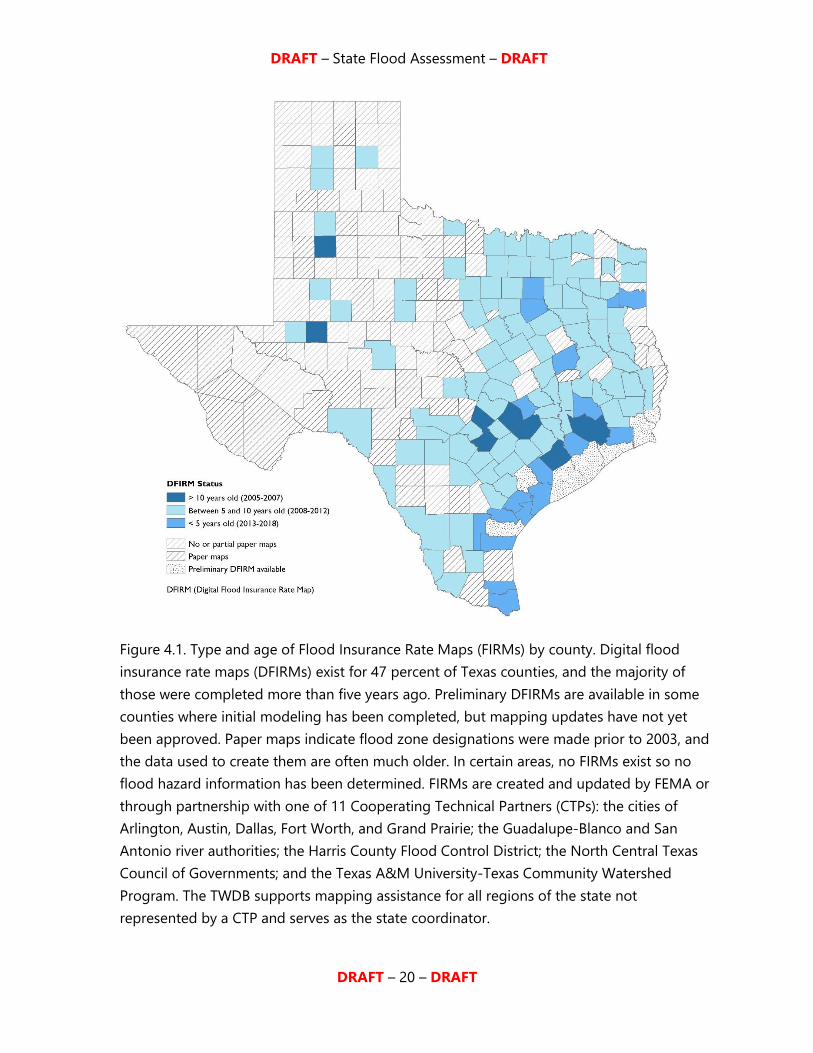
Beginning in 2003, FEMA’s map
modernization initiative sought to digitize
as many existing flood hazard maps as
possible. Figure 4.1 shows the status of
FIRMs in Texas as of April 2018.
Approximately half of the counties in
Texas have no digital flood insurance rate
maps and most of the remaining counties
have not updated FIRMs within the last five years.
FIRMs exist as individual panels corresponding to U.S. Geological Survey quadrangle and
quarter-quadrangle boundaries. At the county level, a FIRM can be comprised of panels forming
a mosaic of different dates corresponding to when specific mapping activities were completed
and adopted by FEMA. When a minor map revision within one panel is adopted, the effective
date of the FIRM changes even though the remainder of the panel reflects flood hazard
information derived from older data. Or, a FIRM may be revised based on recently acquired
elevation data (i.e., lidar or light detection and ranging) but still use precipitation data from a
previous decade. In certain instances, the date shown on a county FIRM may not reflect the
more recent updates of individual panels. Smith County, for example, shows an effective date of
2008, but the City of Tyler updated their panels in 2014. In short, the effective date of a FIRM
may not equate to the age of all data used to create the flood hazard zones displayed therein.
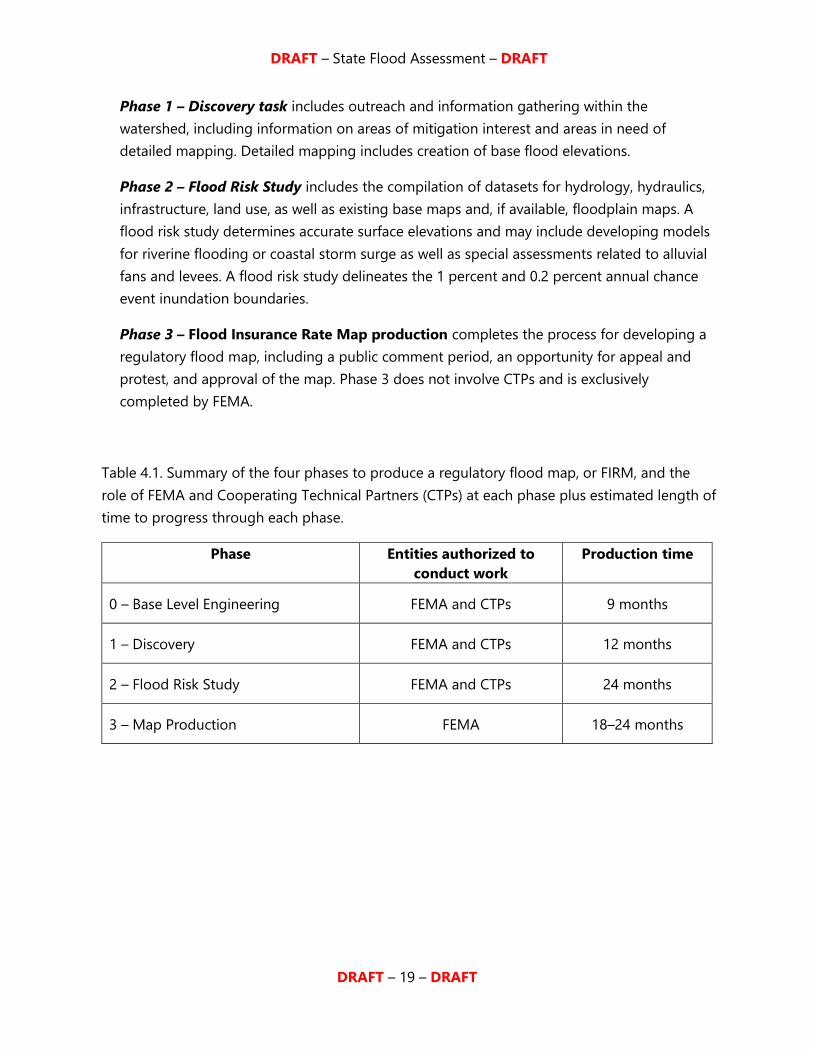
Cooperating Technical Partners Program
FEMA launched the Cooperating Technical Partners (CTP) Program in 1999 to enhance the rate
of mapping activities and to increase local involvement in the process. All mapping activities
follow a four-phase process which may take a minimum of 5 years to complete (Table 1). CTPs
assist in three of the four phases of mapping activities as laid out by FEMA and must follow
FEMA’s Guidelines and Standards for Flood Risk Analysis and Mapping.
Phase 0 – Base Level Engineering consists of compiling existing data, information, and
modeling to prioritize watersheds for further study and ultimately to produce regulatory
quality flood hazard boundaries. To proceed to Phase 1-Discovery, a watershed must have
base level engineering completed.
Only 20 percent of survey respondents
describe their FIRMs as recently updated.
The remaining described their maps as
old, outdated, incomplete, or insufficient.
DRAFT – State Flood Assessment – DRAFT
DRAFT – 19 – DRAFT
Phase 1 – Discovery task includes outreach and information gathering within the
watershed, including information on areas of mitigation interest and areas in need of
detailed mapping. Detailed mapping includes creation of base flood elevations.
Phase 2 – Flood Risk Study includes the compilation of datasets for hydrology, hydraulics,
infrastructure, land use, as well as existing base maps and, if available, floodplain maps. A
flood risk study determines accurate surface elevations and may include developing models
for riverine flooding or coastal storm surge as well as special assessments related to alluvial
fans and levees. A flood risk study delineates the 1 percent and 0.2 percent annual chance
event inundation boundaries.
Phase 3 – Flood Insurance Rate Map production completes the process for developing a
regulatory flood map, including a public comment period, an opportunity for appeal and
protest, and approval of the map. Phase 3 does not involve CTPs and is exclusively
completed by FEMA.
Table 4.1. Summary of the four phases to produce a regulatory flood map, or FIRM, and the
role of FEMA and Cooperating Technical Partners (CTPs) at each phase plus estimated length of
time to progress through each phase.
Phase Entities authorized to
conduct work
Production time
0 – Base Level Engineering FEMA and CTPs 9 months
1 – Discovery FEMA and CTPs 12 months
2 – Flood Risk Study FEMA and CTPs 24 months
3 – Map Production FEMA 18–24 months
DRAFT – State Flood Assessment – DRAFT
DRAFT – 20 – DRAFT
Figure 4.1. Type and age of Flood Insurance Rate Maps (FIRMs) by county. Digital flood
insurance rate maps (DFIRMs) exist for 47 percent of Texas counties, and the majority of
those were completed more than five years ago. Preliminary DFIRMs are available in some
counties where initial modeling has been completed, but mapping updates have not yet
been approved. Paper maps indicate flood zone designations were made prior to 2003, and
the data used to create them are often much older. In certain areas, no FIRMs exist so no
flood hazard information has been determined. FIRMs are created and updated by FEMA or
through partnership with one of 11 Cooperating Technical Partners (CTPs): the cities of
Arlington, Austin, Dallas, Fort Worth, and Grand Prairie; the Guadalupe-Blanco and San
Antonio river authorities; the Harris County Flood Control District; the North Central Texas
Council of Governments; and the Texas A&M University-Texas Community Watershed
Program. The TWDB supports mapping assistance for all regions of the state not
represented by a CTP and serves as the state coordinator.

DRAFT – State Flood Assessment – DRAFT
DRAFT – 21 – DRAFT
4.4 Mapping needs in Texas
Throughout Texas, flood risk remains largely undefined and unquantified. Though useful for
regulatory applications and flood insurance determinations, FIRMs show only the potential
hazards posed by a flood event as modeled for a very specifc set of conditions. Further, FIRMs
do not capture the risk of stormwater flooding unless a community chooses to conduct the
studies necessary to incorporate that data into their hazard map. A key purpose of this flood
assessment is to better understand the resources needed by communities in Texas to properly
manage floodplains and mitigate flood risks.
We heard from NFIP participating communities that the path to a FEMA approved FIRM is
arduous, often controversial, and lags behind the pace of growth in their communities, thereby
limiting their ability to protect lives and property. However, an NFIP community has the
authority to set and enforce local floodplain ordinances. Though typically based on FEMA
approved FIRMs, communities may choose to base their permitting and related requirements on
any other best available data, such as preliminary FIRMs, existing high-water marks, historical
accounts of inundation extents, and similar information. Some communities in Texas utilize this
type of data for local planning and emergency preparedness. Others do not have the resources
to acquire such information and instead wait for the FEMA approval process.
Several states have taken an alternate route to flood hazard mapping. The Iowa Flood Center
completed a statewide inundation mapping project over the course of six years by developing
their own hydraulic models and mapping all streams that drain an area greater than one square
mile. Iowa collected the elevation (lidar) and related channel-specific data necessary to complete
mapping studies that meet FEMA quality standards. In this way, the Iowa Flood Center ensured
the information was made available to the public relatively quickly (via a web portal used only
for non-regulatory purposes such as emergency response and preparedness planning) while
also advancing efforts by NFIP participating communities to pursue updating their local FIRMs.
North Carolina chose a different path to flood hazard mapping. In 2000, North Carolina became
a Cooperating Technical State, as opposed to partnering community, and undertook full
responsibility for collecting updated flood hazard data and for maintaining current FEMA-
Stakeholder’s Top 3: financial resources for flood hazard mapping
Stakeholders identified flood hazard mapping as the second most
important area for the state to invest resources.
DRAFT – State Flood Assessment – DRAFT
DRAFT – 22 – DRAFT
approved FIRMs. Through a three-phased Statewide Floodplain Mapping Program, local, state,
and federal partners committed the financial, staffing, and technical resources necessary to
successfully provide updated maps for every watershed within a ten-year time-frame.
Cost to produce regulatory FIRMs
An estimated cost for the state to conduct mapping activities following FEMA’s phased
approach towards producing FIRMs for riverine flooding in all watersheds is $604 million.
Calculated using published FEMA cost estimates (FEMA, 2017), this number includes an
estimated $62.4 million to conduct Base Level Engineering (Phase 0); $15.6 million for Discovery
(Phase 1); and $525.8 million to conduct Flood Risk Studies (Phase 2) for all watersheds in the
state. The U.S. Geological Survey uses the HUC (hydrologic unit code) designation to describe
the nested hierarchy of watersheds, from major river basin to small sub-watersheds. This cost
estimate is based on conducting mapping for the 207 8-digit HUC subbasins (often called HUC-
8 watersheds) in the state.
However, some watersheds have begun or have recently completed the mapping update
process (e.g., all of the Guadalupe and Neches river basins and other individual HUC-8
watersheds), reducing the need to invest in a complete remapping of the state, at this time. A
true cost for developing and updating all FIRMs in Texas is yet to be determined, but example
costs from recent mapping activities ranged from $1.2 million for the Lower Colorado Cummins
basin (most of Bastrop and Fayette counties) to $2.6 million for Upper Brushy Creek (most of
Williamson County). These estimates include both state or local in-kind services and existing
data and modeling products as well as federal grant funding. For these projects, federal grant
contributions provided an average of 26 percent of the overall cost.
As the state CTP coordinator, the TWDB focuses on areas in need of mapping assistance. In
2015, the TWDB partnered with FEMA to fund development of a prioritization tool to aid in the
selection of watersheds for study. Using this tool, the TWDB can identify areas with needs based
on an array of factors such as a high flood risk or a lack of resources to initiate mapping
activities. The TWDB prioritizes funding for flood mapping projects using weighted geospatial
data aggregated according to HUC-8 watershed boundaries. Thus far, the datasets used, in
order of relative importance, include lidar availability, number of flood insurance claims, number
of repetitive and severe repetitive loss claims, FIRM status, population, projected population
change, lack of a CTP, and available in-kind resources that can be leveraged for the study.
DRAFT – State Flood Assessment – DRAFT
DRAFT – 23 – DRAFT
National Flood Insurance Program in Texas
In 1999, the 76th Texas Legislature directed cities and counties to adopt ordinances or
orders necessary to be eligible for participation in the NFIP (Texas Water Code § 16.3145).
When communities meet eligibility requirements (44 CFR § 59.22), residents gain access to
federal assistance, including federally-backed flood insurance and post-disaster assistance.
As of September 2018, Texas has 1,252 NFIP participating communities: 1,011 cities, towns,
or villages; 220 counties; and 21 special purpose districts, including water control and
improvement districts, local improvement districts, bayou improvement districts, municipal
utility districts, and drainage districts. The State of Texas itself does not participate.
All political subdivisions have the authority to take all necessary actions to meet or exceed
the minimum requirements of the NFIP (Texas Water Code § 16.315). If desired,
communities can implement federal, state, or local initiatives and higher regulatory
standards. The Community Rating System (CRS), a voluntary FEMA program, encourages
efforts which exceed minimum standards by offering a discount of up to 45 percent to
flood insurance policy holders. Example activities that generate a discount include
preserving open spaces in flood-prone areas, monitoring flood conditions and issuing
warnings, and enforcing stricter development standards through flood damage prevention
ordinances.
As of September 2018, only 62 NFIP communities in Texas participate in the program.
Dallas, Grand Prairie, Houston, Pasadena, and Plano each earn a 25 percent discount, the
greatest in the state. Some Texas communities that do not participate in the CRS program
have adopted higher standards via flood damage prevention ordinances which could
translate into credits and associated insurance discounts if they chose to apply.

DRAFT – State Flood Assessment – DRAFT
DRAFT – 24 – DRAFT
5 Planning for floods
Texas first considered the idea of a
statewide planning process for
floodplain management in 2002.
Following a series of natural disasters,
the 76th Texas Legislature established a
Blue Ribbon Committee to examine
ways to improve state, federal, and
volunteer coordination and to provide
streamlined disaster assistance (BRC
2001). This was followed by a report
from the Senate Interim Committee on
Natural Resources which recommended
the idea of statewide planning for
floodplain management in its interim
report to the 78th Texas Legislature
(SICNR 2002). The report also recommended that flood mitigation programs be consolidated
within a single agency. The TWDB has served as the state’s NFIP coordinator since 2007.
Following the historic drought of the 1950s, the Texas Legislature enacted The Texas Water
Planning Act of 1957 to accomplish a vision for preparing the state to meet the projected future
water supply needs of its rapidly growing economy. This vision and its legacy have evolved over
time to a sophisticated, regionally comprehensive evaluation of future water availability and
needs, with recommended projects to specifically meet those needs. Not unlike the early
implementation of water supply projects prior to the 1961 State Water Plan, present day flood
mitigation and mapping projects tend to be locally-driven and are not coordinated at broader
regional scales. Although the state has yet to develop a common vision for flood risk
management or an associated flood planning process, this assessment reveals that initiatives are
already in motion in some parts of the state.
With broad consensus from floodplain administrators and other stakeholders, through this
assessment we learned about the need for more coordinated flood planning efforts and about
the numerous options available for supporting communities in evaluating their flood risks and
mitigation activities. Further, stakeholders requested increased support for and financial
investment in coordinated, watershed-based flood planning—a second pillar of flood risk
management.
• Mitigation without proper mapping and
coordinated planning may be ineffective, or
worse—intensify flood impacts in upstream
or downstream communities.
• Effective planning includes core elements:
o data, models, and sound science;
o an inclusive vetting structure;
o defined levels of acceptable risk and
standardized benchmarks; and
o quantifiable outcomes.
• Stakeholders strongly support watershed-
based flood planning driven by local
communities.
DRAFT – State Flood Assessment – DRAFT
DRAFT – 25 – DRAFT
5.2 Current planning efforts in Texas
Texas has several ongoing planning efforts which address some element of flood protection that
can be applied towards a more concerted statewide flood planning effort.
Hazard mitigation planning – The State of Texas Hazard Mitigation Plan provides a high-level
overview of statewide strategies to reduce exposure to all weather-related hazards, including
riverine and coastal flooding. Once every five years, with guidance from the State Hazard
Mitigation Team, the Texas Division of Emergency Management (TDEM) identifies the state’s
priorities for funding types of flood hazard mitigation actions (e.g., drainage projects, acquisition
and demolition of properties, etc.) and planning projects (e.g., watershed-level mitigation plans),
as well as a repetitive loss strategy of specific actions meant to reduce potential losses to
properties with a history of flood damages. TDEM is finalizing the 2018 update of the state plan,
which will be available fall 2018.
The state plan lays out priorities based on feasibility, cost effectiveness, capacity to be executed,
and conformance to the goals of the plan itself. The state plan does not compile or prioritize
specific projects, and there is no organized process to ensure the prioritized actions are
implemented. However, beyond local hazard preparedness benefits, the state and communities
have incentive for developing hazard mitigation plans, because the plans are required for
eligibility to receive federal assistance through FEMA’s Flood Mitigation Assistance (FMA), Pre-
Disaster Mitigation (PDM), and Hazard Mitigation (HMGP) grant programs. Once a community’s
plan is approved by FEMA, the community becomes eligible for federal assistance through these
programs (TDEM 2013).
As of July 2018, 117 counties have communities with FEMA-approved hazard mitigation plans
covering about 81 percent of the state’s population (D. Jackson, pers. comm.). Many
communities currently have an expired local plan or no approved plan (FEMA 2018). Barriers to
creation of local hazard mitigation plans are similar to those reflected in our survey of
stakeholders: limited financial resources, lack of staff dedicated to this process, and difficulty
navigating the process.
Stakeholder’s Top 3: financial assistance for flood mitigation planning
Stakeholders identified flood mitigation planning as the third most important
area for the state to invest resources.

DRAFT – State Flood Assessment – DRAFT
DRAFT – 26 – DRAFT
Local hazard mitigation planning, given its focus on addressing all types of natural hazards and
its voluntary nature, is not sufficiently scoped to provide collaborative, watershed-based
strategic flood planning. The process as carried out is important but limited. Further,
participating entities vary, leaving no guarantee that participants with flood risks or expertise will
be included.
River basin planning - Regional entities and partnerships, such as development councils, river
authorities, and councils of government, may conduct planning activities, guide development,
and assist local governments in implementing plans regarding land use, water supply, drainage,
and open spaces (Local Government Code Chapter 391). Each river authority’s enabling
legislation is unique, but generally all have powers related to flood control (Texas Constitution,
Article XVI, Section 59). Certain river authorities, including the San Jacinto River Authority and
the Trinity River Authority, publish basin-wide plans that include discussion of flood protection,
flood control reservoirs, and flood retarding structures. More specifically, the San Antonio River
Authority has implemented holistic watershed planning across the basin to manage land use
change and maintain water quality. Their effort also includes incorporating FEMA’s Risk
Mapping, Assessment, and Planning (RiskMAP) approach to identifying flood risk for every
watershed in the basin. Funding for these initiatives is supported by the river authority’s ability
to levy an ad valorem tax, which is limited to $0.02 per $100 of assessed property valuation.
The Texas State Soil and Water Conservation Board (with support from the NRCS Watershed and
Flood Prevention Operations Program) works with rural landowners to develop watershed
protection plans to address flood prevention, erosion and sediment control, and planning for
priority dams, among other activities. Similarly, Texas A&M University conducts training for
watershed planning to ensure plans meet the Environmental Protection Agency’s requirements
by identifying nonpoint source pollution and proposing local solutions to improve water quality.
Coastal resiliency planning - The Texas General Land Office has developed the Coastal
Resiliency Master Plan, a multi-year, stakeholder planning process to identify structural and non-
Only half of stakeholders reported that their jurisdiction has identified flood risk and
conducted local planning efforts to develop mitigation solutions. Communities, special
purpose districts, and multi-jurisdictional regions accomplish this through development
of plans addressing hazard mitigation, comprehensive land-use, drainage, watershed
protection, emergency operations, or some combination of these efforts.
DRAFT – State Flood Assessment – DRAFT
DRAFT – 27 – DRAFT
structural mitigation (termed “grey” and “green”, respectively) strategies, including policy
recommendations, to enhance resiliency and to better protect coastal infrastructure, natural
resources, and economic activities from natural hazards (TGLO, 2017). To date, this process has
yielded a suite of specific projects largely focused on habitat restoration and conservation that
can provide specific starting points for expanding comprehensive flood planning along the
coast.
The U.S. Army Corps of Engineers (USACE) recognizes that Texas’ natural and economic
resources are of national importance and may be significantly impacted by floods and storm
surge. The USACE, therefore, has committed to conducting planning studies within the state.
The Coastal Texas Protection and Restoration Feasibility Study (conducted in partnership with the
Texas General Land Office), is a long-term, comprehensive coastal planning effort focused on
coastal storm risk management and ecosystem restoration. As of late 2018, the USACE has
narrowed their list of viable projects to several storm risk management scenarios that provide a
barrier system for the Houston-Galveston and Galveston Bay region plus a suite of shoreline
protection and habitat restoration projects along the Texas coast. The final feasibility report is
anticipated to be delivered to Congress in 2021 for consideration to authorize and fund.
Additionally, the USACE has announced studies of Buffalo Bayou and its tributaries as well as the
Houston Regional Watershed Assessment to determine solutions for local flood issues. Other
USACE studies will consider resiliency solutions for the Brazos River in Fort Bend County and for
the Guadalupe and San Antonio river basins.
Flood protection planning – Since 1983, the TWDB has provided state financial assistance,
requiring up to a 50:50 cost share, to communities to conduct detailed studies of known or
potential flood-prone areas to better inform the development of flood protection strategies
through structural and non-structural solutions. The program allows communities to conduct
hydrologic and hydraulic studies of current and future conditions and to identify potential
mitigation solutions, including their estimated cost and benefit. The process ensures
opportunities for broad stakeholder education and input about the project as well as
consistency with relevant plans, laws, and regulations. Between 1995 and 2017, over $20 million
in state funding, in addition to $30 million provided in local matching funds, has been
committed to flood protection planning in Texas through this program.
Communities have used the results of their flood protection planning studies as leverage for
FEMA Flood Mitigation Assistance grants to continue additional flood mitigation planning or for
project implementation, to inform land-use planning, and in some cases to provide the
foundational data and models for modifying, updating, or creating local FIRMs. Considering any
future flood planning efforts, there are elements of the planning process used in this grant
program that can be modeled, such as inclusive stakeholder forums, multi-jurisdictional

DRAFT – State Flood Assessment – DRAFT
DRAFT – 28 – DRAFT
cooperation, modeling flood risk under future development conditions, identifying structural
and non-structural solutions, and requiring local financial contribution through dollars or in-kind
services.
5.3 Approaches used in other states
Coordinated watershed-based planning occurs throughout the nation but appears in different
forms among the states. Statewide flood planning, in the format of a cyclical, multi-regional
evaluation to identify projects, is a relatively uncommon process. Instead many states have
chosen to focus on specific tasks, such as statewide mapping or policy implementation, to build
strong floodplain management programs that can provide services and mitigation beyond those
of FEMA and the NFIP alone.
California, Illinois, Iowa, Maryland, Minnesota, Montana, Nebraska, New Jersey, Oklahoma, and
West Virginia have published formal plans related to watershed-based or statewide flooding
concerns, floodplain management, or flood hazard mitigation operations.
California, in partnership with the U.S. Army Corps of Engineers, has completed the most
extensive flood planning effort in the nation, the outcome of which yielded California’s Flood
Future Report, a comprehensive overview of the state’s risk of flooding, approaches for
mitigating risk, recommendations for action, and existing financial investment as well as an
estimate of future financial need based on input from regional entities (CDWR, 2013).
In 2014, using $4.9 million in state funding, Minnesota initiated a watershed-based pilot
program to comprehensively address water resources issues, to include flooding, within six
watersheds—with a goal of implementing the program statewide by 2025. The program
operates on a 10-year planning cycle, requires 10 percent local matching funds, and is based on
formal, voluntary partnership agreements among entities in a given watershed. The purpose is
to encourage these entities to work collaboratively to identify policies, projects, or strategies to
protect, enhance, or restore their basin. An approved plan (whether individually or as part of this
initiative) allows access to state funding. Without an approved plan, entities will only have access
to limited, competitive grant funding. Long-term funding for the program is provided by
revenue from a three-eighths of one percent increase in the state sales tax.
Nebraska similarly completed a statewide Flood Hazard Mitigation Plan, which is used in part to
determine whether local mitigation activities are effective (NDNR, 2013). The Iowa Watershed
Approach program coordinates watershed management authorities and encourages local
watershed-based planning through voluntary interlocal agreements (IWA, 2017).
Most existing flood plans, however, do not recommend specific projects for funding and are not
supported by dedicated state funding sources. Maryland’s flood damage vulnerability
DRAFT – State Flood Assessment – DRAFT
DRAFT – 29 – DRAFT
assessment, for example, requires communities to submit annual lists of projects and watershed-
wide flood damage plans to receive supplemental state funding, but the associated grant
program does not have a dedicated, reliable funding source (Joyce and Scott, 2005).
Other states without formal, comprehensive flood plans emphasize specific programs related to
flood warning or mapping. Iowa, for example, emphasizes real-time flood warning and
inundation mapping capabilities, published via web-based viewers for both the public and
decision-makers. North Carolina focuses on floodplain mapping; as a FEMA Cooperating
Technical State, they assume ownership of their FIRMs and publish associated hazard data,
models, maps, and risk assessments. Oklahoma and New York, on the other hand, developed
statewide mesonets (weather monitoring networks) focused on gathering and providing
weather data to inform both flood response and drought forecasting.
Some states conduct flood planning primarily through the FEMA hazard mitigation planning
process which can potentially increase access to additional resources from FEMA. As of June
2018, 12 states, including California, Florida, Iowa, North Carolina, Washington, and Wisconsin,
have comprehensive mitigation programs along with a FEMA approved Enhanced State
Mitigation Plans. Approval allows access to additional Hazard Mitigation Grant Program funds
(FEMA 2018). To achieve this status, a state must demonstrate an ability to effectively use
available funding and to manage increased funding (44 CFR § 201.5). Texas is currently seeking
to earn this same status. Florida also maintains a delegation of authority from FEMA to approve
local hazard mitigation plans via the Program Administration by States pilot initiative. Florida
thus requires all counties to update and seek approval for multi-jurisdictional, multi-hazard
plans on an annual basis. As a result, Florida is one of few states with 100 percent coverage of
approved local hazard mitigation plans (FEMA, 2018).
Through state code, Wisconsin, Washington, and Florida seek to lower flood risk by restricting
building construction in flood prone areas. For example, Wisconsin requires structures to be
constructed to the Flood Protection Elevation, which is 2 feet above the base flood elevation
(Mittler et al., 2006). Florida requires uniform, comprehensive land use policies of all jurisdictions
and enforcement of the state’s minimum building codes (Brody et al., 2009).
Funding sources used by states to implement and maintain floodplain management activities
are as varied as the programs described above. All states utilize available federal funding,
though some, such as Florida, have implemented activities which enable access to greater post-
disaster federal funding. Many strong state programs across the U.S. were developed following
natural disasters, whether directly through federal funding or through the state’s own
commitment to improve preparedness.

DRAFT – State Flood Assessment – DRAFT
DRAFT – 30 – DRAFT
Following disastrous flooding in 2008, Iowa used a combination of a $15 million grant from the
U.S. Department of Housing and Urban Development (HUD), $2.2 million from the U.S. Army
Corps of Engineers Planning Assistance to States, existing state and federal commitments for
lidar data collection, and a portion of $2 million in state floodplain management funds
(allocated over several years) to support floodplain mapping and the production of FIRMs for 86
percent of the state. Iowa also took advantage of a $97 million HUD disaster resilience grant to
create the Iowa Watershed Approach program. The Iowa Flood Center, founded following the
2008 floods, continues the state’s efforts to map floodplains, provide flood-inundation maps,
and maintain a network of stream flow sensors for communicating potential risk of flooding to
the public. The state provides an annual budget of approximately $1.2 million, which is
combined with significant funding from other federal and state agencies, to support the center’s
research and ongoing operations.
California has utilized bonds, a partnership with the U.S. Army Corps of Engineers, and state
investment to support their comprehensive regional and statewide planning process as well as
floodplain mapping program. North Carolina responded to Hurricane Floyd in 1999 by
allocating $25 million the following year to establish a floodplain mapping program. The state
has since partnered with FEMA to become a Cooperating Technical State. In the first nine years
of the program, the state mapped 100 percent of watersheds, investing a total of about $70
million and receiving $73 million from FEMA. The state maintains their program via a transaction
fee associated with the recording of deeds and mortgages.
5.4 Elements of sound planning
Natural resources planning represents an agreement among parties to identify the purpose,
objectives, and paths to implementation (Fallding 2008). The purpose of flood planning,
generally speaking, is to reduce flood risk. However, flood planning conducted at any scale,
whether at a project level or watershed level, is most successful when the objectives for reducing
risk are developed using the same standards and benchmarks, quality data, and when solutions
(or mitigation strategies) can be compared in the context of one another. Holistic or integrated
watershed management, as exemplified by the San Antonio River Authority’s basin-wide efforts
to develop watershed master plans that also promote flood risk management, offers an
opportunity to evaluate whether a specific objective or solution may negatively impact flood risk
for an upstream or downstream community and to consider potential impacts on water quality,
erosion, water supply, etc. Although the TWDB does not conduct flood planning, beyond
support of flood protection planning grants for communities, the TWDB does require grant
awardees to work at the watershed-scale and engage all stakeholders. Additionally, the TWDB
adheres to Texas Water Code §§ 17.774 and 17.776, requiring a determination that a requested
project will have no upstream or downstream effect before awarding financial assistance.
DRAFT – State Flood Assessment – DRAFT
DRAFT – 31 – DRAFT
Sound planning is based on a number of core elements. First, effective planning is based on
quality data, robust models, and sound science coupled with a vetting structure that is inclusive
of all interested parties (stakeholders). Second, appropriately-scaled planning areas must be
established. Stakeholders within these areas must be encouraged to participate, to determine
their vision for the future, and to set goals according to an established timeline. Third,
empowered by sound data and a common vision, stakeholders need to consider acceptable
levels of risk and use standardized benchmark(s) and protocols to consistently evaluate
alternative strategies to reduce or eliminate risk within the planning area. If prioritization of
strategies is a goal of the planning process, management outcomes must be quantifiable and
use a common set of metrics. Further, the planning process must be adaptable—able to
incorporate changes in population, data, models, project viability, and policies (TWDB, 2016).
Finally, consistent support of any planning process is important to ensure that plans are updated
and implemented according to stakeholder needs (Brody et al., 2009).
Texans’ views for future flood planning
Stakeholders strongly favor a watershed-scale planning process for coordinating and guiding
local efforts related to short-term and long-term flood planning, mitigation, and response (70
percent of responses).
Stakeholders noted a watershed-scale flood planning process should include opportunities to:
• Pro-actively identify and prioritize projects with the greatest ability to reduce flood risk;
• Assess both upstream and downstream effects of projects to minimize adverse impacts
and develop regionally-based, multi-benefit solutions;
• Develop consistent policies and guidelines for floodplain management within a
watershed; and,
• Evaluate the impact of future scenarios influenced by population growth and associated
land use changes, plus variations in the frequency and duration of rainfall events.
A stakeholder from the El Paso workshop described future flood planning as “an effective tool to
protect the well-being and property of Texans”.
DRAFT – State Flood Assessment – DRAFT
DRAFT – 32 – DRAFT
What about regional water planning?
It is no surprise that the effectiveness of the statewide regional water supply planning process in
Texas leads some to draw parallels between it and any potential statewide flood planning
process. However, there are critical, fundamental differences in the purpose and goals of each
effort.
Planning for water supply projects focuses on providing reliable water supply throughout
extended periods of low rainfall. Thus, planning for drought-of-record conditions, by definition,
does not consider or attempt to address flood risks. Flood risk assessment and mitigation
planning aims to achieve an entirely different purpose—reducing or preventing loss of life and
property during high precipitation events—using a set of parameters and technical analyses that
are distinct from those used in water supply planning.
Flood planning activities are best conducted at the watershed or basin-scale. Whereas the
geographic units for drought and water supply planning are based in part on river basins, they
also consider aquifer delineations, water utility development patterns, political subdivision
boundaries, and other factors that are not be as relevant for flood planning. Water supply
planning, even across basins, has a degree of predictability in terms of available sources and
target delivery location that typically does not exist when planning for flood events.
Flood planning requires different benchmarks, corresponding to high water levels created by, for
example, the 1 percent annual chance flood event under present day or future build-out
conditions. Flood planning also requires different datasets and models for evaluating potential
risk reduction strategies. Groundwater and surface water availability models used in regional
water planning are not applicable to evaluating the distribution and timing of flood events. For
reasons such as these, the water supply and flood planning processes are distinct; hence, flood
mitigation projects rarely appear in local water supply and wastewater infrastructure project lists.
Nonetheless, there may be benefits for both processes to at the least consider strategies that
simultaneously address water supply and flood risk reduction (e.g., aquifer storage and recovery
or variable reservoir flood pool capacity) or to evaluate proposed strategies in the context of
hydrological extremes from drought to flood (e.g., the siting of water supply or wastewater
infrastructure). Section 7.3 includes more discussion on the possible synergies between water
supply and flood mitigation.
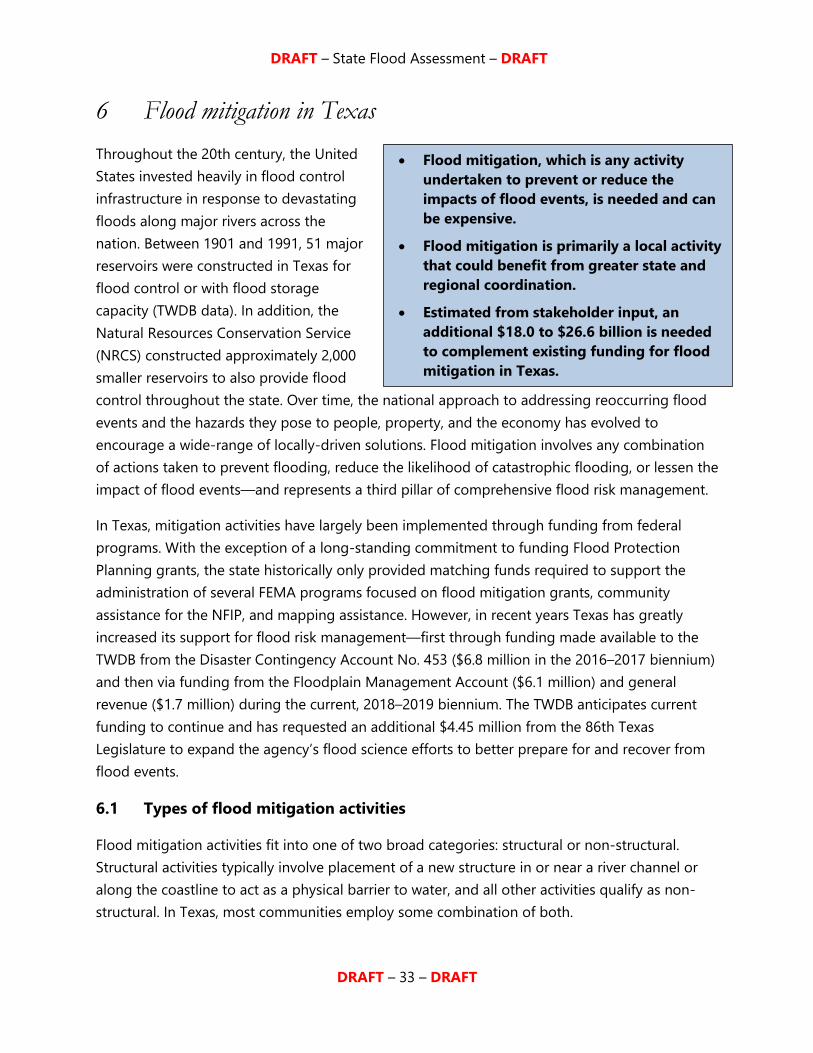
DRAFT – State Flood Assessment – DRAFT
DRAFT – 33 – DRAFT
6 Flood mitigation in Texas
Throughout the 20th century, the United
States invested heavily in flood control
infrastructure in response to devastating
floods along major rivers across the
nation. Between 1901 and 1991, 51 major
reservoirs were constructed in Texas for
flood control or with flood storage
capacity (TWDB data). In addition, the
Natural Resources Conservation Service
(NRCS) constructed approximately 2,000
smaller reservoirs to also provide flood
control throughout the state. Over time, the national approach to addressing reoccurring flood
events and the hazards they pose to people, property, and the economy has evolved to
encourage a wide-range of locally-driven solutions. Flood mitigation involves any combination
of actions taken to prevent flooding, reduce the likelihood of catastrophic flooding, or lessen the
impact of flood events—and represents a third pillar of comprehensive flood risk management.
In Texas, mitigation activities have largely been implemented through funding from federal
programs. With the exception of a long-standing commitment to funding Flood Protection
Planning grants, the state historically only provided matching funds required to support the
administration of several FEMA programs focused on flood mitigation grants, community
assistance for the NFIP, and mapping assistance. However, in recent years Texas has greatly
increased its support for flood risk management—first through funding made available to the
TWDB from the Disaster Contingency Account No. 453 ($6.8 million in the 2016–2017 biennium)
and then via funding from the Floodplain Management Account ($6.1 million) and general
revenue ($1.7 million) during the current, 2018–2019 biennium. The TWDB anticipates current
funding to continue and has requested an additional $4.45 million from the 86th Texas
Legislature to expand the agency’s flood science efforts to better prepare for and recover from
flood events.
6.1 Types of flood mitigation activities
Flood mitigation activities fit into one of two broad categories: structural or non-structural.
Structural activities typically involve placement of a new structure in or near a river channel or
along the coastline to act as a physical barrier to water, and all other activities qualify as non-
structural. In Texas, most communities employ some combination of both.
• Flood mitigation, which is any activity
undertaken to prevent or reduce the
impacts of flood events, is needed and can
be expensive.
• Flood mitigation is primarily a local activity
that could benefit from greater state and
regional coordination.
• Estimated from stakeholder input, an
additional $18.0 to $26.6 billion is needed
to complement existing funding for flood
mitigation in Texas.
DRAFT – State Flood Assessment – DRAFT
DRAFT – 34 – DRAFT
Structural approaches may be further divided into major and minor activities. Major structural
activities, also termed flood risk management infrastructure, include the construction of levees,
dikes, floodwalls, dams, and other channel alterations to provide larger-scale flood benefits.
These projects generally require more time and effort to complete due to regulatory
requirements related to environmental protection, their multi-jurisdictional nature, and the
project scale. Minor structural activities provide local-scale stormwater management benefits via
infrastructure, such as culverts, gates, diversions, and detention and retention basins, aimed at
protecting critical facilities (water supply infrastructure, utilities, sanitary sewer systems, roads,
and bridges) and other properties by retaining or diverting floodwater which accumulates
during rain events.
A wide array of flood mitigation activities is considered non-structural: educational efforts that
increase public awareness, professional training, or technical assistance related to flooding;
creation of local flood hazard mitigation plans; installation of flood early warning systems;
collection and analysis of geographic, hydrologic, and atmospheric data to identify flood risks or
monitor conditions; restoration and conservation of wetlands; and completion of local feasibility,
design, and engineering studies represent a few such activities.
Policy and regulation activities, also considered non-structural, include setbacks, building codes,
zoning ordinances, subdivision rules, and special purpose ordinances. The state periodically
adopts certain building codes related to scientific and safety standards for residential and
industrial construction. Local governments may adopt amended versions of these codes to fit
local needs. Zoning ordinances are enacted at the local level to regulate development and land-
use in flood-prone areas.
Participation in the NFIP is a non-structural mitigation activity. In fact, the NFIP requires
structures to be built “reasonably safe from flooding” (44 CFR 60.3) by either guiding
development (e.g., elevating structures or anchoring manufactured homes) or discouraging it in
flood-prone areas (e.g., through high insurance premiums or by designations of a floodway or
special coastal zone). Floodproofing and property buyouts, including acquisitions and
relocations, round out the list of non-structural activities to mitigate flood impacts.
Flood mitigation strategies considered by communities across Texas represent a wide variety of
project types, from non-structural, lower cost strategies such as open land preservation and
implementation of building codes to large-scale, higher cost infrastructure projects such as
reservoirs and drainage improvements. Between 1996 and 2016, FEMA’s Hazard Mitigation
Assistance grant program invested $1.4 billion in support of 753 mitigation projects in Texas.
This program includes post-disaster funding for Hazard Mitigation Grants, Pre-Disaster
Mitigation (both administered by TDEM) and pre-disaster Flood Mitigation Assistance grants
(administered by the TWDB). Projects included buyouts and elevation of structures (186 projects

DRAFT – State Flood Assessment – DRAFT
DRAFT – 35 – DRAFT
totaling $655.4 million), critical infrastructure and flood control (109 projects totaling $455
million), and mitigation planning (163 projects totaling $23 million). The program also funded
several other types of projects ranging from early warning systems (34 projects totaling $4.7
million), public awareness (23 projects totaling $6.4 million), to technical assistance at $438,000,
among other activities (Economist Intelligence Unit, 2018). This represents only some of the
activities that have been carried out in Texas.
Stakeholders implement a variety of mitigation activities*
*Rectangle size corresponds to frequency of responses

DRAFT – State Flood Assessment – DRAFT
DRAFT – 36 – DRAFT
6.2 Cost of mitigation in Texas
Flood mitigation is sometimes necessary and often expensive. The details and nuances related
to implementation also may be as complex as the funding mechanisms that make
implementation possible. For this report, we assessed the financial resources, both existing and
unavailable, that communities need to implement a variety of activities to reduce flood risk.
Analysis of the cost for project mitigation and the availability of local funding for this section is
derived exclusively from information provided by stakeholders through financial survey
questions which generally represent a 10-year planning horizon. As such, the financial analysis
does not include long-term cost or funding need projections for the state, does not yield a list
of ready-to-implement flood mitigation strategies, and involves estimates with certain
limitations (discussed in Chapter 8 and Appendix A). However, the analysis provides insight into
the overall anticipated costs for mitigating flood risks and the statewide funding shortfall which
prevents the implementation of strategies. We do this by accounting for the availability of local
funds and non-local (state and federal) financial programs. Details of the methodology are in
Appendix A.
Estimating financial need for flood mitigation
Financial information to estimate costs for flood mitigation activities comes from two sources:
(1) Reported estimates of mitigation costs and available funding based on survey responses
representing 60 percent of the state’s population, and
(2) A statistical analysis developed to estimate costs and available funding for the remaining
40 percent of the population not represented by survey responses.
More details are available in Appendix A, but the basic methodology is as follows:
𝑭𝒍𝒐𝒐𝒅 𝑭𝒖𝒏𝒅𝒊𝒏𝒈 𝑺𝒉𝒐𝒓𝒕𝒇𝒂𝒍𝒍
= 𝐴𝑛𝑡𝑖𝑐𝑖𝑝𝑎𝑡𝑒𝑑 𝐶𝑜𝑠𝑡𝑠 − 𝐴𝑣𝑎𝑖𝑙𝑎𝑏𝑙𝑒 𝐿𝑜𝑐𝑎𝑙 𝐹𝑢𝑛𝑑𝑠 − 𝐴𝑣𝑎𝑖𝑙𝑎𝑏𝑙𝑒 𝑁𝑜𝑛𝐿𝑜𝑐𝑎𝑙 𝐹𝑢𝑛𝑑𝑠
Stakeholder’s Top 3: financial assistance for flood mitigation
Stakeholders identified financial assistance for implementation of flood mitigation
projects as the number one most important area for the state to invest resources.

DRAFT – State Flood Assessment – DRAFT
DRAFT – 37 – DRAFT
6.2.1 Anticipated mitigation costs
Anticipated statewide mitigation costs $31.5 to $36.0 billion
Based on the mitigation needs reported by survey respondents, the estimated total statewide
cost for future flood mitigation ranges between $31.5 and $36.0 billion (Table 6.1). This range
comes from the amount reported by communities who responded to the survey, totaling about
$23.4 billion, combined with a range of $8.1 billion to $12.6 billion as estimated from a statistical
analysis to capture the costs associated with mitigation needs for the communities who were
not represented by survey responses (the non-responding communities).
We compared this estimate of anticipated mitigation costs for Texas to the flood funding needs
identified by California and found figures to be comparable. California has a stated need of $32
– $52 billion to implement projects identified in their current planning cycle, including $6 billion
in flood management projects recommended by the USACE (CDWR 2013). Because the methods
of this assessment are based solely on responses from the two stakeholder surveys, we did not
factor in cost estimates for very large federal projects or costs identified by the state for
rehabilitating high hazard dams, estimates which combined would add another $14 billion to
the state’s mitigation needs. We also recognize that the methods used in this assessment as well
as the mitigation activities needed to reduce flood risk differ between California and Texas.
6.2.2 Available mitigation funding
Locally available funding, $7.1 to $8.2 billion
The amount of local funding that communities may have available to contribute to flood
mitigation activities ranges from $7.1 to $8.2 billion (Table 6.1). We base this estimate on
information provided by respondents as well as the statistical estimates of available funding for
the non-responding communities. Specifically, survey respondents in cities and counties
reported having about $4.8 billion in local funds to implement flood mitigation activities, based
on their historical and anticipated availability of local funds.
Available non-local funding, $2.3 billion to $5.3 billion
We estimate the total funding available from existing state and federal financial assistance
programs to range from a low of $2.3 billion to as much as $5.3 billion over a 10-year period
(Table 6.1). Of the potential $5.3 billion of assistance available, approximately $2.3 billion is
estimated to be in the form of grants, generally requiring some degree of local cost-share. The
remaining $3.0 billion is in the form of loans from the TWDB with interest rates either
considerably below market levels or reflecting the state’s low cost of funds.
DRAFT – State Flood Assessment – DRAFT
DRAFT – 38 – DRAFT
Given that flood mitigation projects do not generate revenue, repayment of these loans likely
will require local fees or ad valorem taxes. Estimating the available funding for existing financial
programs is difficult, due in part to the fact that some federal funds are available only following
a presidentially-declared disaster. These estimates are further complicated as we must assume
continued availability at the current and historical rates of funding; speculate on the timing and
allocation of federal appropriations; and anticipate policy and funding choices made on behalf
of local, state, and federal programs. Limitations of the existing programs considered for this
analysis are discussed in Section 6.3, Funding sources, and a summary of these programs and the
range of funding availability is provided in Appendix A.
Cost of recovery versus mitigation
Since the focus of this assessment is mitigation of future flood events, we have not
considered costs related to disaster recovery. Given the extent of devastation from
Hurricane Harvey in late 2017, the costs of recovery from this event alone are
staggering. In October 2017, Governor Abbott’s Rebuild Texas Commission
requested $61 billion in federal appropriations above current federal expenditures
for rebuilding public infrastructure damaged or destroyed by Hurricane Harvey
and for projects designed to mitigate the impact of future storms on the Texas
Gulf Coast. Congress responded to this request with a significant amount of
federal funding in the Bipartisan Budget Act of 2018, which included $90 billion in
disaster aid for Texas, Florida, and Puerto Rico. Thus far, Texas has received
significant funding for Harvey recovery activities, including:
• The U.S. Army Corps of Engineers Civil Works Long-Term Disaster
Recovery Investment Program received $4.9 billion for 5 ongoing
construction projects and 5 new start construction projects in Texas, along
with $15.1 million for 5 studies.
• As administered by the Texas Department of Public Safety, FEMA will
provide an estimated $1 billion for hazard and flood mitigation projects
through the Hazard Mitigation Grant Program (HMGP).
• The Texas General Land Office is administering $5.024 billion in
Community Development Block Grant–Disaster Recovery funds provided
through the Department of Housing and Urban Development for
Hurricane Harvey Recovery.

DRAFT – State Flood Assessment – DRAFT
DRAFT – 39 – DRAFT
6.2.3 Mitigation funding shortfall
Statewide flood funding shortfall, $18.0 to $26.6 billion
After determining the statewide anticipated cost for mitigation and factoring in both local and
non-local funds that are potentially available to off-set this cost, we estimate the statewide flood
funding shortfall ranges from approximately $18.0 to $26.6 billion (Table 6.1). The lower value of
$18.0 billion accounts for access to the highest amount of available local and non-local funding,
while the upper value of $26.6 billion accounts for access to the least amount of available local
and non-local funding.
Table 6.1 – Summary of statewide flood funding needs (in $billion),
estimated using information on anticipated mitigation costs and local
funding availability as provided by stakeholders via financial survey
questions and information on available non-local funding from existing
state and federal financial programs.
Range (in $billion)
Anticipated mitigation costs $31.5 – $36.0
Available local funds $7.1 – $8.2
Available non-local funds $2.3 – $5.3
Statewide flood funding shortfall $18.0 – $26.6
Stakeholders need to implement a variety of mitigation activities
Stakeholders indicated that the majority of funds spent in the last 10 years went to local
drainage infrastructure. Roadway crossings, regional detention or retention basins, and
property buyouts also represent a large component of local spending.
Looking ahead, stakeholders indicated a need for more funding to support implementation
of local drainage improvements, local and regional detention and retention basins,
improvements to bridges/culverts/pipes and channel conveyance as well as non-structural
solutions such as buyouts, warning systems, and educational programs.
DRAFT – State Flood Assessment – DRAFT
DRAFT – 40 – DRAFT
6.3 Funding sources
Communities across the state use a variety of funding sources from local funding to state and
federal financial assistance to implement flood risk mapping and flood mitigation, planning, and
protection activities. However, the types and availability of funding vary widely. Though not
exhaustive, this section describes common financial programs and sources of funding available
to communities.
6.3.1 Local funding
Stakeholders identified the top three sources of local funding used in their communities to be
general funds, stormwater utility fees, and bonds (Figure 7.1). Below we describe the most
common local revenue sources used for flood management activities.
General fund: General fund revenue is largely from property, sales, and other taxes, which
provides a substantial amount of money. Though this is the number one sources of funds, as
reported by stakeholders (Figure 7.1), often it is not enough to adequately cover flood
management activities as well as all other municipal programs. Special tax districts are
sometimes used to tax only the portion of the population that will benefit from a specific
project. Our survey, however, indicates that only a few communities in Texas have implemented
such tax districts for flood mitigation.
Stakeholder preferences for types of non-local funding
Survey respondents describe needing anywhere from 0 to 100 percent of project costs
covered by outside financial assistance. Small communities and regions that are primarily
rural indicated the highest need for non-local funding.
When asked what types of financial assistance stakeholders might pursue, the most preferred
choices were either a 90/10 cost-share program (90 percent non-local contribution/10
percent local match) or a 75/25 cost-share program. Less popular, but of equal interest to
about 20 percent of respondents are programs with either a 50/50 cost-share or a zero
percent interest loan. Very few stakeholders opted for assistance via market rate loans,
subsidized loans, or state participation in projects. Nearly 40 percent of respondents did not
know what mechanism to choose.

DRAFT – State Flood Assessment – DRAFT
DRAFT – 41 – DRAFT
Figure 7.1 Sources of local funding used to support flood management activities as identified by
survey responses (percent (%) of respondents). In addition, 24 percent or respondents stated
they had no local funding source dedicated to such activities.
Stormwater utility fees: Over the past several decades, the stormwater utility model has
increasingly been used as a tool to raise local funding for stormwater management both in
Texas and the country. Creation of a stormwater utility allows a community to have a dedicated
revenue stream for stormwater management that is directly based on how much a property
contributes to stormwater runoff. Survey respondents reported this is the second highest source
of funding for flood management activities in their community (Figure 7.1). An annual survey
conducted by Western Kentucky University identified more than 1,600 stormwater utilities in the
country and at least 114 in Texas. Of the 40 cities in Texas with populations greater than
100,000, 31 have a stormwater utility. The statewide average stormwater fee is $4.28 per month
(Campbell, 2018; U.S. Census Bureau, 2018).
Bonds: Survey respondents selected bonds as the third most often used funding source (Figure
7.1). Communities typically use either stormwater revenue bonds or general obligation bonds
for this type of funding. Bonds can fund various activities, such as home buyouts, upgraded
early warning systems, and infrastructure repairs.

DRAFT – State Flood Assessment – DRAFT
DRAFT – 42 – DRAFT
Ad valorem taxes and other fees: Though less frequently a source of funding, some survey
respondents report using impact fees, permitting fees, or ad valorem taxes, respectively, to fund
activities (Figure 7.1). For example, communities can fund their floodplain management program
through floodplain development permitting fees. Impact fees are sometimes assessed as a one-
time payment for new developments to offset their anticipated impact to the community.
Another fee program, is a fee-in-lieu program in which developers pay a fee to the community,
rather than building a site-specific stormwater mitigation project in their development.
Facts about local funding for flood management activities
• 24 percent of respondents said their community does not fund flood management
activities with local funding.
• Rural communities are the most likely to not have local funding for these activities.
• 17 percent did not know if their community uses local funding for such activities.
• On a per capita basis, large cities spend more than twice as much as small cities on
flood mitigation activities.
• For communities with budgets allocated to flood management activities, expense
categories are as follows:
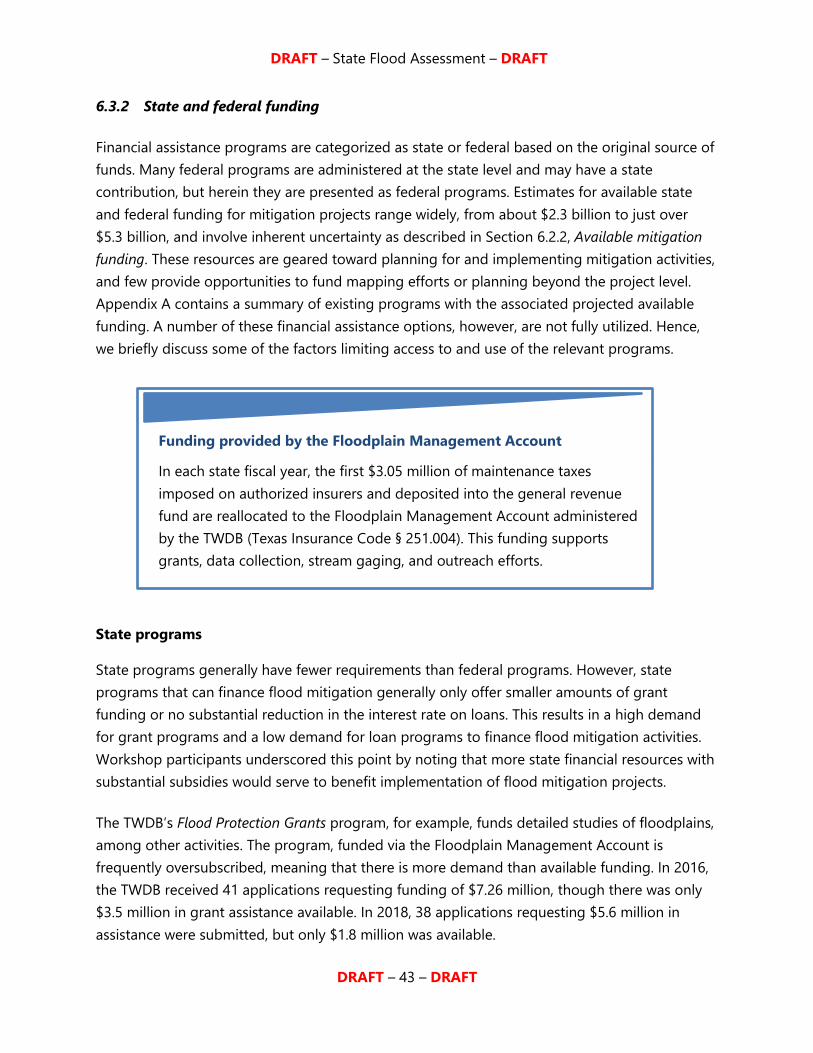
DRAFT – State Flood Assessment – DRAFT
DRAFT – 43 – DRAFT
6.3.2 State and federal funding
Financial assistance programs are categorized as state or federal based on the original source of
funds. Many federal programs are administered at the state level and may have a state
contribution, but herein they are presented as federal programs. Estimates for available state
and federal funding for mitigation projects range widely, from about $2.3 billion to just over
$5.3 billion, and involve inherent uncertainty as described in Section 6.2.2, Available mitigation
funding. These resources are geared toward planning for and implementing mitigation activities,
and few provide opportunities to fund mapping efforts or planning beyond the project level.
Appendix A contains a summary of existing programs with the associated projected available
funding. A number of these financial assistance options, however, are not fully utilized. Hence,
we briefly discuss some of the factors limiting access to and use of the relevant programs.
State programs
State programs generally have fewer requirements than federal programs. However, state
programs that can finance flood mitigation generally only offer smaller amounts of grant
funding or no substantial reduction in the interest rate on loans. This results in a high demand
for grant programs and a low demand for loan programs to finance flood mitigation activities.
Workshop participants underscored this point by noting that more state financial resources with
substantial subsidies would serve to benefit implementation of flood mitigation projects.
The TWDB’s Flood Protection Grants program, for example, funds detailed studies of floodplains,
among other activities. The program, funded via the Floodplain Management Account is
frequently oversubscribed, meaning that there is more demand than available funding. In 2016,
the TWDB received 41 applications requesting funding of $7.26 million, though there was only
$3.5 million in grant assistance available. In 2018, 38 applications requesting $5.6 million in
assistance were submitted, but only $1.8 million was available.
Funding provided by the Floodplain Management Account
In each state fiscal year, the first $3.05 million of maintenance taxes
imposed on authorized insurers and deposited into the general revenue
fund are reallocated to the Floodplain Management Account administered
by the TWDB (Texas Insurance Code § 251.004). This funding supports
grants, data collection, stream gaging, and outreach efforts.

DRAFT – State Flood Assessment – DRAFT
DRAFT – 44 – DRAFT
The Texas Water Development Fund (DFund), also administered by the TWDB, has funding
available through the agency’s existing $6 billion evergreen general obligation bonding
authority. But since the program offers a subsidy only in the form of a credit benefit which may
not be of value to many higher rated borrowers, it is typically not an attractive option for flood
mitigation projects. DFund has funded only two flood-related projects within the last 10 years.
The State Water Implementation Fund for Texas (SWIFT) program1, the state’s most prominent
financial assistance program for water projects, is designed for and restricted to addressing
water supply strategies. Though some synergies with flood mitigation may exist (see Section 7.3,
Synergies with existing programs), state water plan projects typically do not include components
that address flood mitigation and no flood-related projects have been funded through the
SWIFT program to date. Furthermore, opportunities for loan forgiveness or grants under this
program are expressly prohibited in statute (Texas Water Code § 15.435).
Federal programs
Federal programs related to flood mitigation and mapping typically offer much greater financial
assistance than is available at the local or state level, but the funding often has many limitations.
Funding is typically restricted to post-disaster projects located in federally-declared disaster
areas. For programs and projects not tied to disaster, Texas competes with other states such as
for Cooperating Technical Partners funding for mapping activities. In some cases, flood-related
projects also compete with other types of projects. Federal funding through the Clean Water
State Revolving Fund (CWSRF), administered by the TWDB, can fund flood-related (pre-disaster)
mitigation projects, but applicants must compete with wastewater and water supply projects.
However, following Hurricane Harvey, the TWDB set aside funds in the CWSRF, as well as in the
Drinking Water State Revolving Fund, to provide post-disaster funding options to communities
for projects related to water supply, wastewater, or stormwater management facilities for
disaster recovery and other urgent need situations.
Federal programs also have complicated and extensive application and reporting requirements
coupled with a high degree of uncertainty in both the timing and distribution of funds. These
factors make applying for funding and complying with associated requirements challenging for
communities, particularly for those who cannot support staff or contractors dedicated to these
tasks.
1 The SWIFT program includes two funds, the State Water Implementation Fund for Texas (SWIFT) and the State Water Implementation Revenue Fund for Texas (SWIRFT). Revenue bonds for the program are issued through SWIRFT.

DRAFT – State Flood Assessment – DRAFT
DRAFT – 45 – DRAFT
7 Roles and other considerations
Floodplain management encompasses a
broad spectrum of challenging issues and, as
is true of any interdisciplinary topic, requires
a diverse group of individuals working
collaboratively toward a common goal.
Whether before, during, or after a flood
event, a complex web of local, state, and
federal entities each contributes resources—
time, staff, data, funding—in an effort to
address flooding impacts to lives and
property. Here, we summarize those entities with responsibility for mitigation in Texas and
discuss barriers to floodplain management as well as potential synergies with water supply.
7.1 Responsibilities for flood mitigation
The responsibility of preparing for and mitigating flooding in Texas lies with local decision-
makers. Texas Water Code § 16.315 lists actions that political subdivisions of the state of Texas
are authorized to take related to the NFIP. For example, each community must designate a
floodplain administrator (often called a floodplain manager) who must understand, interpret,
and explain local floodplain management regulations and review them for compliance. Specific
to floodplain management (Texas Water Code § 16.315), communities in Texas also may:
• apply for grants and financing to support mitigation activities;
• collect reasonable fees to cover the cost of administering floodplain management
activities;
• use regional or watershed approaches to improve floodplain management; and
• cooperate with the state to assess the adequacy of local structural and non-structural
mitigation activities.
In reality, however, a diverse group of local communities, regional groups, and state and federal
entities plays a role in the collective effort to reduce flood impacts. In Texas, at least six federal
agencies, eight state agencies, and many more regional and private entities have some flood-
related role—in addition to the local communities on the frontline (Table 7.1). Overlapping
jurisdictions based on political rather than watershed boundaries and differing missions among
the various entities create a multi-layered, complex environment, which sometimes leads to
unclear responsibilities and uncoordinated efforts.
• Responsibilities for floodplain
management and mitigation lie with local
decision-makers.
• A diverse group of local, state, and
federal entities play a role in the
collective effort to mitigate flooding.
• Stakeholders cite lack of financial
assistance as the biggest barrier to
undertaking floodplain management
activities at the local level.
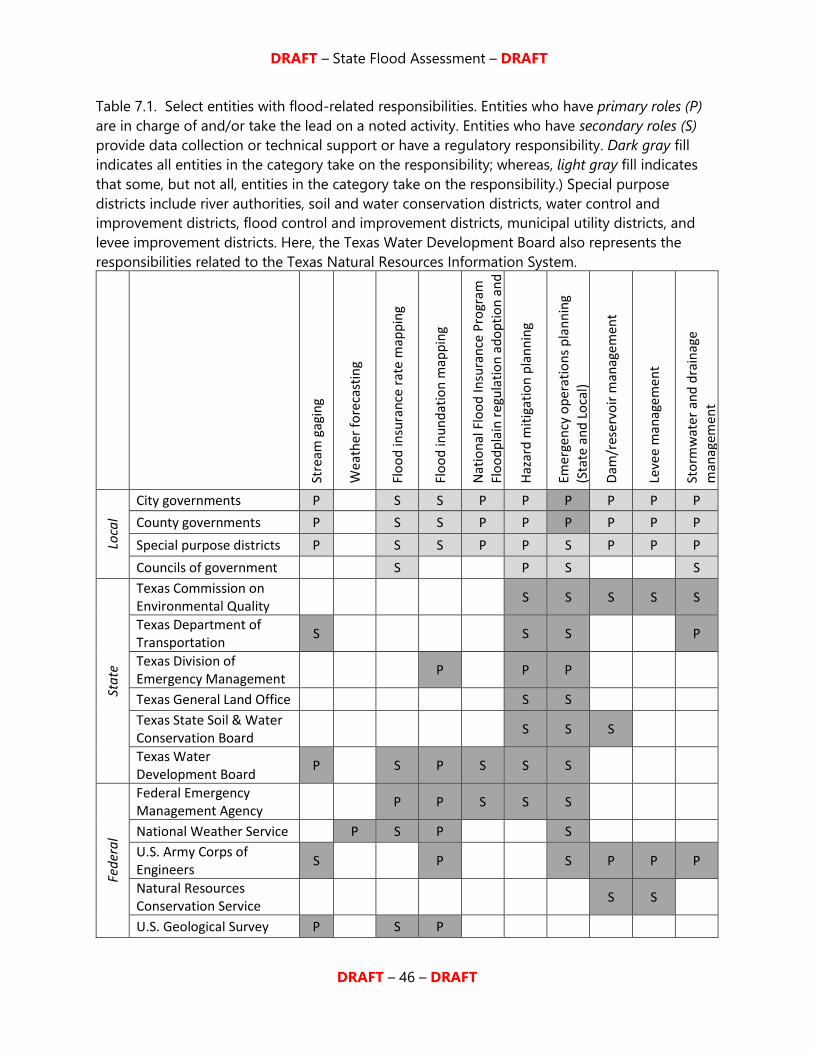
DRAFT – State Flood Assessment – DRAFT
DRAFT – 46 – DRAFT
Table 7.1. Select entities with flood-related responsibilities. Entities who have primary roles (P)
are in charge of and/or take the lead on a noted activity. Entities who have secondary roles (S)
provide data collection or technical support or have a regulatory responsibility. Dark gray fill
indicates all entities in the category take on the responsibility; whereas, light gray fill indicates
that some, but not all, entities in the category take on the responsibility.) Special purpose
districts include river authorities, soil and water conservation districts, water control and
improvement districts, flood control and improvement districts, municipal utility districts, and
levee improvement districts. Here, the Texas Water Development Board also represents the
responsibilities related to the Texas Natural Resources Information System.
Stre
am g
agin
g
We
ath
er f
ore
cast
ing
Flo
od
insu
ran
ce r
ate
map
pin
g
Flo
od
inu
nd
atio
n m
app
ing
Nat
ion
al F
loo
d In
sura
nce
Pro
gram
Fl
oo
dp
lain
re
gula
tio
n a
do
pti
on
an
d
enfo
rcem
ent
Haz
ard
mit
igat
ion
pla
nn
ing
Emer
gen
cy o
per
atio
ns
pla
nn
ing
(Sta
te a
nd
Lo
cal)
Dam
/res
ervo
ir m
anag
emen
t
Leve
e m
anag
emen
t
Sto
rmw
ater
an
d d
rain
age
man
agem
ent
Loca
l
City governments P S S P P P P P P
County governments P S S P P P P P P
Special purpose districts P S S P P S P P P
Councils of government S P S S
Sta
te
Texas Commission on Environmental Quality
S S S S S
Texas Department of Transportation
S S S P
Texas Division of Emergency Management
P P P
Texas General Land Office S S
Texas State Soil & Water Conservation Board
S S S
Texas Water Development Board
P S P S S S
Fed
era
l
Federal Emergency Management Agency
P P S S S
National Weather Service P S P S
U.S. Army Corps of Engineers
S P S P P P
Natural Resources Conservation Service
S S
U.S. Geological Survey P S P

DRAFT – State Flood Assessment – DRAFT
DRAFT – 47 – DRAFT
State agencies serve as intermediaries between local and federal partners, facilitating
cooperation, administering federal programs and grant dollars to local communities, and
offering technical assistance for certain floodplain management activities. The TWDB houses the
State Coordinator’s Office for the NFIP in Texas; is responsible for aiding, advising, and
coordinating the efforts of local communities who wish to participate in the program; and is
responsible for administering the following FEMA programs (44 CFR § 60.25; Texas Water Code
§ 16.316):
Community Assistance Program-State Support Services Element (CAP-SSSE) provides
technical assistance, floodplain management education, assistance meeting NFIP compliance
requirements, and post-disaster assistance—all to encourage floodplain management
expertise and capability in Texas communities.
Cooperating Technical Partners (CTP) Program enhances collaboration between communities,
FEMA, and other local partners in efforts toward creating or updating their FIRMs.
Flood Mitigation Assistance Grant Program provides planning grants to communities to
develop or update the flood hazard component of a jurisdiction’s Multi-Hazard Mitigation
Plan and project grants for mitigation through acquisitions (buyouts), relocations,
floodproofing, or elevations of structures insured under the NFIP.
The TWDB also has authority to evaluate floodplain management activities and flood control
programs within the state; to study the adequacy of existing public and private measures, laws,
regulations, and ordinances in flood-prone areas; to evaluate available engineering, hydrologic,
and geologic data; and to conduct and make available floodplain studies and mapping (Texas
Water Code § 16.316). These authorities are consistent with the agency’s Flood Protection grants
program and with more recent initiatives supported by funding from the Office of the Governor
and the Floodplain Management Account to enhance flood notification systems and support
Stakeholders call for increased collaboration and coordination
Stakeholders called for increased collaboration and coordination between
jurisdictions responsible for flood mitigation. Sixty percent of respondents
noted that they work with other entities in their region to address flood risk;
an additional 17 percent believe they would benefit from coordinated efforts.

DRAFT – State Flood Assessment – DRAFT
DRAFT – 48 – DRAFT
floodplain management planning. Requests from stakeholders to have access to more technical
support and updated flood hazard mapping align with these capacities.
Certain types of mitigation activities, such as the construction and ongoing maintenance of
dams and levees, dictate specific responsibilities. In Texas, more than 9,000 federal dams are
overseen or regulated by one of four federal agencies: the USACE, the U.S. Department of
Agriculture’s Natural Resources Conservation Service (NRCS), the International Boundary and
Water Commission (IBWC), and the U.S. Bureau of Reclamation.
Non-federal dams are maintained locally. Water districts such as soil and water conservation
districts or water control and improvement districts are responsible for dam maintenance and
safety as well as the enforcement of upstream flood easements. The Texas Commission on
Environmental Quality (TCEQ) sets regulatory safety standards for and is charged with inspection
of the more than 7,000 non-federal dams in Texas.
Per Texas Water Code Chapter 57, local levee improvement districts may construct and maintain
levees near rivers, creeks, and streams; provide for drainage and improvements to lands
reclaimed from overflows; and straighten or improve rivers to control water. Municipal utility
districts also have similar authority for the control and drainage management of excess
floodwater (Texas Water Code Chapter 54). The TCEQ is authorized to inspect levees under
construction, but there is currently no state funding or staff dedicated to a levee
safety/inspection program. An effort underway by the USACE seeks to develop a complete
inventory of levees as the first step toward certification of levees constructed to provide flood
protection.
Stormwater and drainage-related mitigation activities are carried out individually or
collaboratively by local entities such as cities, counties, river authorities, municipal utility districts,
drainage districts, stormwater control districts, and flood control districts across the state. The
U.S. Environmental Protection Agency’s Municipal Separate Storm Sewer System (MS4)
regulations require certain owners or operators of municipal separate storm sewer systems to
acquire permits to discharge stormwater into surface waters of the state. Though primarily
related to water quality, certain flood protection benefits do exist. Presently, Texas does not
have statewide standards to guide mitigation of local drainage issues; thus, adopted criteria for
local drainage standards vary across communities, even within the same watershed.
In a few cases, communities are moving towards an integrative approach that factors in
hydrology, hydraulics, water quality, and open land areas at the watershed-scale to collectively
address drainage issues. The North Central Texas Council of Governments developed a voluntary
16-county watershed management initiative with “a goal to allow for sound development through
regional consistency; to recognize cost savings associated with the investment in effective

DRAFT – State Flood Assessment – DRAFT
DRAFT – 49 – DRAFT
watershed management to reduce or prevent flooding; to slow water quality decline; and to avoid
loss of opportunity that is a result of rapid growth” (NCTCOG 2017).
7.2 Barriers to implementation
Stakeholders reported that financial assistance is the most essential resource needed by their
communities to implement floodplain mapping, mitigation, and management activities. Next to
this, the biggest barriers communities face include navigating available funding options and
associated application processes and protecting communities while waiting through the drawn-
out timelines for receiving funds or completing projects. If left unresolved, these barriers can
prevent communities from successfully implementing floodplain management, even if new
funding becomes available.
Local share funds: The local share requirement for state and federal financial assistance creates
a deterrent for communities that do not have access to a local funding source. Survey
respondents indicated needing non-local (outside) funding to cover up to 100 percent of total
cost for flood mitigation activities, including structural projects, mapping, early warning, and
public awareness activities. Only 1 in 5 floodplain administrators stated that their community has
a revenue stream to accumulate funds for the local share requirements of grant programs or to
repay loans provided by the state. Responses from urban areas and larger cities reported having
slightly better access to a local revenue stream (greater than 1 in 4 respondents); whereas,
county-level and small communities reported having substantially less access.
Stakeholders cited a range of limitations preventing communities from identifying risks
or solutions. Listed in order of relative importance, they are:
• lack of financial resources to conduct studies, update flood maps, hire staff, and
develop expert local knowledge for proper floodplain management and decision-
making;
• the prolonged timeframe and complex process for implementing projects;
• lack of public interest, competing local priorities, lack of coordination and
cooperation within a local area, lack of community leadership to implement
projects; and,
• lack of broad authority to enforce regulations.
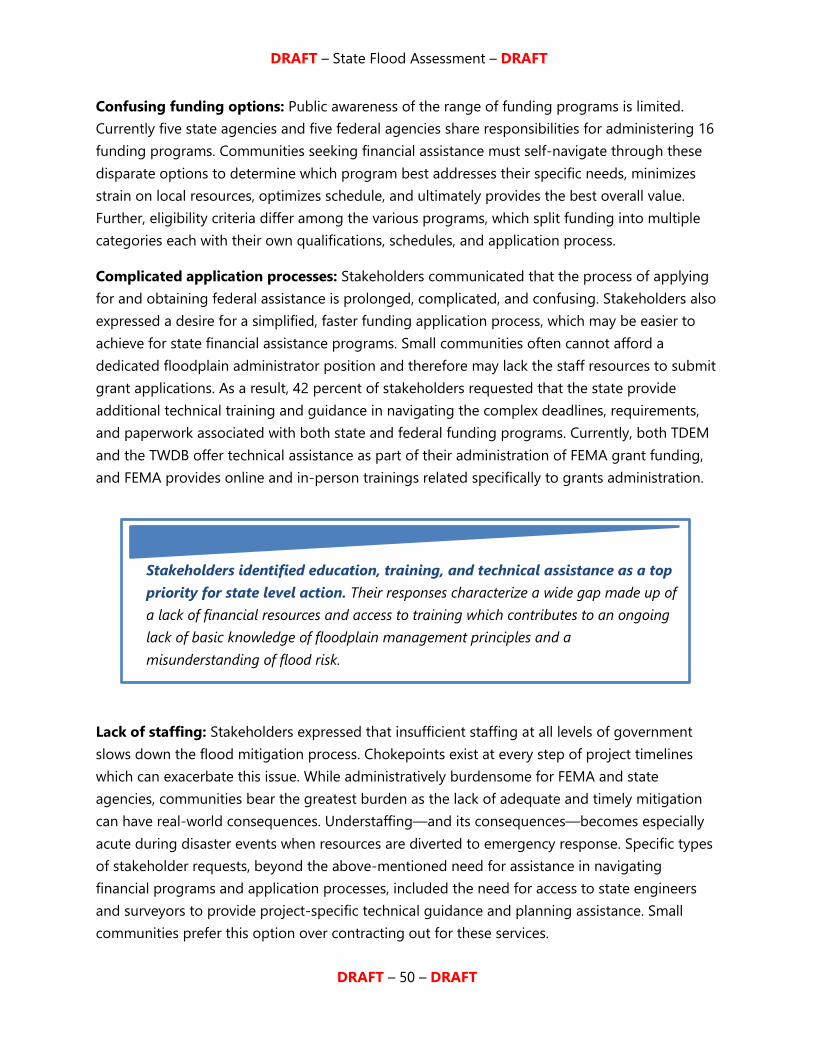
DRAFT – State Flood Assessment – DRAFT
DRAFT – 50 – DRAFT
Confusing funding options: Public awareness of the range of funding programs is limited.
Currently five state agencies and five federal agencies share responsibilities for administering 16
funding programs. Communities seeking financial assistance must self-navigate through these
disparate options to determine which program best addresses their specific needs, minimizes
strain on local resources, optimizes schedule, and ultimately provides the best overall value.
Further, eligibility criteria differ among the various programs, which split funding into multiple
categories each with their own qualifications, schedules, and application process.
Complicated application processes: Stakeholders communicated that the process of applying
for and obtaining federal assistance is prolonged, complicated, and confusing. Stakeholders also
expressed a desire for a simplified, faster funding application process, which may be easier to
achieve for state financial assistance programs. Small communities often cannot afford a
dedicated floodplain administrator position and therefore may lack the staff resources to submit
grant applications. As a result, 42 percent of stakeholders requested that the state provide
additional technical training and guidance in navigating the complex deadlines, requirements,
and paperwork associated with both state and federal funding programs. Currently, both TDEM
and the TWDB offer technical assistance as part of their administration of FEMA grant funding,
and FEMA provides online and in-person trainings related specifically to grants administration.
Lack of staffing: Stakeholders expressed that insufficient staffing at all levels of government
slows down the flood mitigation process. Chokepoints exist at every step of project timelines
which can exacerbate this issue. While administratively burdensome for FEMA and state
agencies, communities bear the greatest burden as the lack of adequate and timely mitigation
can have real-world consequences. Understaffing—and its consequences—becomes especially
acute during disaster events when resources are diverted to emergency response. Specific types
of stakeholder requests, beyond the above-mentioned need for assistance in navigating
financial programs and application processes, included the need for access to state engineers
and surveyors to provide project-specific technical guidance and planning assistance. Small
communities prefer this option over contracting out for these services.
Stakeholders identified education, training, and technical assistance as a top
priority for state level action. Their responses characterize a wide gap made up of
a lack of financial resources and access to training which contributes to an ongoing
lack of basic knowledge of floodplain management principles and a
misunderstanding of flood risk.

DRAFT – State Flood Assessment – DRAFT
DRAFT – 51 – DRAFT
Lack of training: No state-level requirement exists for training or certification of floodplain
administrators or others with flood-related responsibilities. However, more than 2,000 Texans
are professionally certified floodplain managers (CFMs) through the Texas chapter of the
Association of State Floodplain Managers (ASFPM), known at the Texas Floodplain Management
Association (TFMA). Accessibility to professional development appears to be easier and more
affordable for floodplain administrators in more populated or urban areas. Respondents from
small communities report difficulty in attending classes because of a lack in staff availability,
travel funding, or related resource constraints. In general, stakeholders requested increased
availability of low-cost or free training. Stakeholders also suggested including floodplain
management topics as part of the routine training required of state and local officials with job
duties related to emergency management within their first 180 days in office (per Texas
Government Code Chapter 418).
Prolonged timelines: Project timelines for flood mitigation grant programs can take anywhere
from months to years between the start of an application to the start of construction or project
implementation (if non-structural). A range of factors, particularly the source of funding and
required amount of documentation and authorization, determines the length of these timelines.
The more complex the processes, the lengthier the application review and disbursement period.
Stakeholders expressed frustration with this aspect of project implementation, requesting more
streamlined processes and increased transparency.
Patience is key to implementing a federally-funded project. The application review and approval
process can take up to one year. Once approved, project implementation may be further
delayed for a variety of reasons, including weather conditions or even unanticipated changes in
funding allocations. For structural activities, projects may require extensive permits for
environmental protection, historic preservation, and related land use development. If a
community does not have sufficient in-house staff to navigate these disparate permitting
requirements, it may be forced to hire an outside consultant and that procurement process can
add months to an already lengthy process.
State-funded programs typically have fewer requirements. For example, Flood Protection Grants
administered by the TWDB have a relatively fast path to funding. Aside from requiring
assurances that the principal applicant has the authority to plan and implement projects and
that the proposed project does not duplicate existing projects, these state funds do not require
federal coordination nor approval (beyond existing requirements such as those related to
wetlands permitting). However, these funds are limited and are only offered once a biennium.
Similarly, the federal timeline for creating or updating FIRMs through the FEMA adoption
process, requires years of participation and patience by communities. But as observed in this
DRAFT – State Flood Assessment – DRAFT
DRAFT – 52 – DRAFT
assessment, opportunities exist for the state to enhance flood hazard mapping for the benefit of
floodplain management, mitigation, and emergency response.
7.3 Synergies with water supply
Despite recent interest in managing floodwaters to augment water supplies, particularly in water
scarce areas, it is not easy to achieve such synergies. The type and scope of activities involved in
planning for floods can vary significantly from those that are designed for drought
preparedness. Droughts may begin slowly and develop over an extended time period; whereas,
floods are sudden, sometimes violent, events. Despite this, opportunities exist to simultaneously
increase flood protection for communities while providing additional water supply.
During times of flooding, the goal is to safely retain or divert excess water away from
communities. During drought, the goal is to provide communities with reliable water supplies,
which often requires storing water during times of plenty for later use. Despite these two distinct
goals, projects that can meet both flood protection and water supply objectives range the
spectrum from very large, such as reservoirs or aquifer storage and recovery facilities, to
relatively small, such as low impact development practices. For large projects, it may be difficult
or impossible to realize beneficial synergies post-construction. For example, once residential
areas develop around a reservoir, it may be impossible to expand flood storage capacity.
However, reservoirs may be operated to allow for seasonally adjustable flood and conservation
pool elevations to balance water supply and flood control objectives throughout the year.
Whether undertaken during project design or post-construction, balancing flood protection and
water supply objectives for big projects requires careful study of the physiographic setting of
the project. Even for large projects, improvements in secondary objectives while meeting
primary objectives can be modest. For example, reallocation of flood storage within Lake
Texoma added only 103,003 acre-feet per year to water supplies—less than 3 percent of the
total volume of the reservoir (Brougher and Carter, 2012).
At the other end of the spatial scale, small actions, such as adoption of low impact development
practices, can reduce excess runoff during storm events, and when stored may increase water
supplies or reduce water demands later. Examples of low impact development practices include
rooftop rainwater capture, v-cuts in curbs to allow stormwater to drain to landscaped areas, and
permeable pavements that allow infiltration to aquifers. Though individual projects may be
small, cumulative effects can be significant. Garrison et al. (2014) estimated such green
infrastructure projects could provide an additional 420,000 to 630,000 acre-feet per year to
water supplies in the state of California. The Texas Section of the American Society of Civil
Engineers recommends considering these types of practices and related alternative flood
mitigation strategies in their recently released report on flood risk (TexASCE, 2018).

DRAFT – State Flood Assessment – DRAFT
DRAFT – 53 – DRAFT
8 Preliminary findings and stakeholder priorities
For this statewide flood assessment, we
surveyed floodplain administrators and
many other stakeholders to better
understand local flooding issues, strategies
for mitigating flood risk, and the financial
resources allocated at all levels of
government toward the common goal of
protecting lives and property. Through
online surveys, workshops, and related
meetings, we also asked for input on the
future of flood planning. The preliminary
findings and stakeholder priorities provided
herein reflect the sentiments of the majority
of the more than one thousand Texans who contributed their time to this effort.
8.1 Preliminary findings
Stakeholder feedback and information gathered throughout the development of this report
suggest broad consensus around a number of key points.
• Flooding is a fact of life in Texas: Texas experiences some of the most severe flooding
impacts in the U.S., yet critical data sets and public awareness are lacking.
• Outdated maps: Smaller communities tend to either have outdated flood hazard maps
or no maps at all, and they often lack the data and models needed to create or update
the maps for use in floodplain management, planning, and emergency response.
• Local drainage issues: Stormwater flooding was identified as a top concern among
stakeholders from every corner of the state, but risk of this type of flooding is not
displayed on FIRMs. The statewide risk from stormwater flooding remains undetermined.
• Varying mitigation needs: Communities across the state experience different types of
flooding that require different mitigation strategies. Communities also are in different
stages of need or preparedness—some have completed local mapping and planning
efforts to inform their mitigation needs while others reported struggling with how to get
started.
• Need for collaboration and coordinated planning: A web of independent federal,
state, and local agencies and jurisdictions are involved in floodplain management.
• Texas stakeholders most strongly
recommended that the state
o Provide funding for flood mitigation
activities,
o Improve flood risk mapping,
o Establish watershed-based flood
planning, and
o Expand education outreach and
technical assistance.
• Failure to act continues to expose Texans to
significant levels of flood risk.

DRAFT – State Flood Assessment – DRAFT
DRAFT – 54 – DRAFT
Coordination and collaboration are needed to avoid redundancies, simplify
administrative processes, and increase the effectiveness of ongoing and future flood
mitigation efforts.
• Fiscal concerns: Two common impediments to more effective flood planning and
project implementation are meeting local cost-share requirements and lack of a
consistent revenue stream to pay off loans.
• Lack of access to trained professionals: Floodplain management and understanding
of flood risk in Texas are hindered by a lack of training at all levels. Stakeholder feedback
reveals that communities experience financial limitations in hiring and training local
floodplain administrators; need greater access to technical experts with knowledge of
financial programs, application processes, and science and engineering; and desire better
understanding of flood risk and floodplain management principles among state and
local officials.
8.2 Limitations and uncertainties in estimating costs
Limitation 1: Texas has no central repository of planned or implemented flood mitigation
projects or activities. Without an existing statewide catalog, this assessment relied primarily
upon two stakeholder surveys. Medium and large cities and special districts created for flood
management purposes typically have robust plans to address local and regional flood and
drainage issues. Cost data collected from these entities is considered reasonably reliable. Smaller
communities, in contrast, typically lack plans and do not have the resources required to produce
them. Cost estimates for mitigation activities in these communities are considered less reliable,
because they may not have been associated with detailed planning or feasibility studies.
Limitation 2: Sole reliance on voluntary survey responses weakens the source data for
estimating financial needs. Voluntary surveys tend to oversample the people who feel strongly
about a subject and under-sample the people who have less interest or opportunity to respond.
While our surveys have good geographic coverage and represent needs for over half the state’s
population, not every community was willing or able to participate. In total, Survey 1 gathered
responses from 34 percent of communities in the state. Survey 2 captured only a small subset of
those responding to the first survey, and thus represents 11 percent of communities in the state.
Limitation 3: Lack of comprehensive, up-to-date maps and information to aid
communities in their planning efforts. Without adequate maps, models, data, and
information, communities struggle to address flood issues. Without planning efforts and
identified solutions, many communities are unable to accurately estimate flood mitigation
funding needs. Without a thorough understanding of exactly how much of the state is in need
DRAFT – State Flood Assessment – DRAFT
DRAFT – 55 – DRAFT
of mapping (whether based on age of FIRM, unmapped stream miles, or watershed-scale
studies), it is difficult to estimate mapping costs.
Limitation 4: Lack of a standard benchmark for flood planning and mitigation. Flooding is
generally regarded as an event that causes property damage or loss of life, but communities
experience different types of flooding that require different mitigation strategies. Yet, there is no
standard to which all communities in Texas base their management efforts, representing another
difficulty in estimating costs. Unlike regional water planning groups, who develop water
management strategies to meet future needs during a repeat of the drought-of-record (the
benchmark) and use a standardized cost analysis methodology to ensure consistency, mitigation
costs provided by stakeholders for this assessment may be over or underestimated depending
on a community’s circumstances.
Limitation 5: Lack of framework for statewide planning. Texas has never undertaken
statewide planning for flood, and myriad options exist for how to do so. Additionally, the
timeframe for developing a planning process is yet to be determined. The high-level of
uncertainty surrounding future flood planning efforts—from timeframe, to scale, to structure—
and lack of precedent in this realm make estimating costs for any planning effort imprecise.
In our analysis, we took a variety of steps to minimize the impact of these limitations. We
present financial estimates for mitigation as ranges to reflect statistical confidence intervals and
to convey the uncertainty in both the source data and statewide totals as extrapolated.
Limitations from survey results were addressed with quality assurance and control measures,
including follow-up calls to verify responses and a statistical analysis of survey results to qualify
confidence in statewide estimates. These uncertainties must be kept in mind when considering
the cost estimates presented in this assessment.
8.3 Stakeholder priorities
Outreach across the state in March and April of 2018 provided valuable qualitative and
quantitative data on the status of flood risk, floodplain management, and flood mitigation in
Texas. After reviewing all responses, the following stakeholder priorities emerged. These
priorities reflect input received from stakeholders, not necessarily the opinions of the TWDB.
1 - Provide financial assistance for flood mitigation: Stakeholders resoundingly identified
access to more financial assistance as the most important factor to meeting flood hazard
mitigation goals. Access is limited primarily by (1) the availability of non-local funds, (2) the
difficulties associated with securing those funds, and (3) the limited ability to generate local
revenue to meet grant match requirements and support flood mitigation activities. As noted
herein, statewide flood mitigation costs over the next 10 years are anticipated to be more than

DRAFT – State Flood Assessment – DRAFT
DRAFT – 56 – DRAFT
$31.5 billion. Due to shortfalls in local funding streams, communities potentially need access to
more than $18.0 billion in additional financial assistance.
Communities depend heavily on state and federal dollars to supplement local flood budgets. As
a result, flood issues may persist and projects may remain on hold for years until a catastrophic
event results in an allocation of post-disaster funding. Stakeholders expressed a desire to
proactively address flooding issues rather than wait for post-disaster recovery funds.
Stakeholders also identified a lack of funding as an impediment to conducting the planning
studies necessary to identify solutions to known flooding issues. Many communities further lack
the staff and ability to hire for these services, a situation which leaves the risk of flooding
potentially unidentified as well as unresolved.
Ultimately, implementation of more robust financing for flood mitigation also will require broad
public support. The public must understand the benefits of flood mitigation and the risk of
inaction. Local and regional governments will need public support to finance costly projects as
well as to support wider implementation of flood mitigation and floodplain management
strategies.
2 - Improve flood risk mapping: Communities in Texas rely on FIRMs to identify and mitigate
flood risk in their community. The average age of a Texas FIRM is 13 years old, though FIRM age
varies widely across the state. An urban city typically has a FIRM that is less than 11 years old;
contrast this with a 27-year old FIRM in the Panhandle. Many FIRMs, therefore, do not account
for the last decade or more of development.
Stakeholders strongly supported all aspects of the flood risk mapping process—including
collection of updated topographic (lidar), rainfall, streamflow, and related data—on an ongoing
basis and with distribution of that data through an online repository. Efforts to improve flood
risk mapping would support the creation of new and updated FIRMs as well as the development
of inundation maps to aid in land-use planning and emergency response. In addition to updated
FIRMs, stakeholders desire additional modeling to determine base flood elevations and
floodway designations. This information is essential for floodplain administrators to develop and
enforce floodplain ordinances.
Stakeholders recognized the importance of improved mapping for use in communicating the
full spectrum of flood risk, beyond the simplified information provided by FIRMs. They also
listed the need to develop maps to represent the flood risk posed by stormwater flooding as a
top priority.
DRAFT – State Flood Assessment – DRAFT
DRAFT – 57 – DRAFT
3 - Encourage watershed-based flood planning: Stakeholders consistently expressed a
preference for a regional approach to flood planning, whereby watershed boundaries define the
planning areas. This sentiment is consistent with stakeholder calls for increased collaboration,
coordination, and leadership among all entities with flood responsibilities. Further, state and
federal agencies indicated that a regional process would increase the potential for greater inter-
agency collaboration.
Stakeholders strongly believe flood planning should be focused at the local level with funding
support from the state and administrative support carried out by a regional entity. The process
should include a wide variety of stakeholders and expertise, including local decision makers,
emergency managers, regional development councils, transportation planners, realtors,
scientists, engineers, businesses, industry, and private citizens to join floodplain administrators in
studying and determining the most appropriate solutions for their unique flooding issues. A
goal of watershed-based planning is to identify multi-benefit solutions to common flooding
problems and to bring about efficiency in implementing projects.
4 - Expand educational outreach and technical assistance: Stakeholders expressed consensus
about the need for flood-related education in Texas and the importance for the state to invest
resources for this purpose. Floodplain administrators, local officials, and emergency response
personnel all identified education—in the form of public awareness, floodplain management
training, and technical assistance—as a top concern.
Recent flood disasters highlight the lack of understanding of the true risks posed by flooding.
Risks are poorly communicated by our limited outreach tools and a misunderstanding of the
information provided on FIRMs. Effective outreach begins by reimagining FIRMs to
communicate gradients of risk, not simply boundaries between safe and not safe.
Floodplain administrators specifically voiced concerns about how misinformation leads to
questionable permitting decisions or even violations of existing floodplain development
ordinances. They recommended expanding floodplain management outreach for homeowners
and renters, home buyers and sellers, insurance agents, decision-makers, and everyone in
between via both broad public awareness campaigns and targeted professional training for
specific interest groups.
Technical assistance related to the NFIP, hazard mitigation planning, and grant procurement and
administration also featured prominently in stakeholder views. Floodplain administrators
requested access to more free and low-cost options for completing training courses for
continuing education purposes and for more technical guidance in navigating state and federal
financial programs.

DRAFT – State Flood Assessment – DRAFT
DRAFT – 58 – DRAFT
8.4 Impact of doing nothing
Due to a combination of population growth and related development, we can be certain that
without proper planning, flood events will impact more lives and cause more damages in the
future. This statement is just as true on the High Plains near Post as it is along Dickinson Bayou
near Galveston. We acknowledge the limitations of using only FIRMs while simultaneously
relying on them to communicate flood risk locally. In addition, FIRMs represent conditions at the
time the map was approved. Any changes related to land use or mitigation that occur after map
publication are not included, further limiting our view of risk. A recent analysis by Berg (2018)
highlights an additional consideration: peak flows at stream gages in urban areas have increased
in many areas across the state over the past several decades. As our population continues to
grow, and because most of that growth is projected to occur in and around our urban centers,
we must consider overlapping stormwater, riverine, and coastal hazards and the complexities
they pose for flood risk identification and mitigation. Our risk can only be reduced through
mitigation of existing problem areas and avoidance via proper planning and preparedness.
8.5 Benefits of acting now
Flood mitigation activities, not unlike scientifically supported water supply projects, can be
expensive but ultimately represent sound financial investments. Many of our state’s reservoirs,
originally built as flood control and water supply measures, have contained catastrophic floods,
sometimes shortly after their construction. These types of projects were cited and developed
using broadly accepted models and datasets that served as common foundations for project
development and evaluation, affording the opportunity to evaluate impacts on neighboring
communities. Using such sound science throughout the process ensures that projects have
long-term, positive benefits for communities.
Once implemented, many flood mitigation projects save far more money and provide more
benefits related to damage prevention than the cost to implement them. In fact, studies have
shown that mitigation strategies for riverine flooding save $7 for every $1 spent (Multihazard
Mitigation Council 2017). Implementation of flood mitigation strategies, developed through
sound mapping and modeling built on accurate, up-to-date data, can reduce or prevent
property damage and loss, death and injury, and impacts to all sectors of our economy.
8.6 Laying a foundation with science and data
Sound science and data, identified as core elements of effective planning, are needed to inform
flood-related decision making. As such, the TWDB has requested an additional $4.45 million in
appropriations from the 86th Texas Legislature to support the agency’s current efforts to gather
data and monitor conditions across the state and to develop new initiatives that will further our
DRAFT – State Flood Assessment – DRAFT
DRAFT – 59 – DRAFT
understanding of flooding in Texas and our capacity to share that information. Specifically, the
funding requested would allow the TWDB to develop hydraulic river models for priority
watersheds; update reservoir flood pool measurements; expand the TexMesonet earth
observation network; acquire high-resolution land surface (lidar) data to better predict
floodplains and flooding levels; develop coastal circulation and rainfall-runoff models; and
create a web-based flood dashboard/water data hub. The information developed through these
efforts will assist flood forecasters, emergency responders, local governments, and all Texans in
making informed decisions when preparing for, responding to, and recovering from floods. With
better data and better science, Texas can continue working toward the common goal of
protecting lives and property from the next flood event.

DRAFT – State Flood Assessment – DRAFT
DRAFT – 60 – DRAFT
References
Asquith, W.H., 1998, Depth-duration frequency of precipitation for Texas: U.S. Geological Survey
Water-Resources Investigations Report 98-4044. U.S. Geological Survey, 107 p., accessed
August 2018, at https://pubs.usgs.gov/wri/wri98-4044/.
Berg, M.D., 2018, Peak flow trends highlight emerging urban flooding hotspots in Texas: Texas
Water Journal, v. 9, no. 1, p. 78-29.
Blake, E.S., and Zelinsky, D.A., 2018, National Hurricane Center Tropical Cyclone Report,
Hurricane Harvey: National Oceanic and Atmospheric Administration and National
Weather Service, 77 p., accessed August 2018, at
https://www.nhc.noaa.gov/data/tcr/AL092017_Harvey.pdf.
BRC (Blue Ribbon Committee), 2001, Blue Ribbon Committee study: Interim report to the 77th
Texas Legislature.
Brody, S.D., Bernhardt, S.P., Zahran, S., and Kang, J.E., 2009, Evaluating local flood mitigation
strategies in Texas and Florida: Built Environment, v. 35, no. 4, p. 492-515.
Brougher, C., and Carter, N.T., 2012, Reallocation of water storage at federal water projects for
municipal and industrial water supply: Congressional Research Service, R42805, 21 p.,
accessed August 2018, at https://fas.org/sgp/crs/misc/R42805.pdf.
Burnett, J., 2012, How one drought changed Texas agriculture forever: NPR, accessed August
2018, at https://www.npr.org/2012/07/07/155995881/how-one-drought-changed-texas-
agriculture-forever.
Butler, S., 2011, Timeline of events in Dallas history: 1840s: A guide to the history of
Dallas, Texas, accessed July 2018, at http://www.watermelon-
kid.com/history/dallas/timelines/1840s.htm.
Campbell, C. W., 2018, The Western Kentucky University stormwater utility survey 2018: Western
Kentucky, 69 p., accessed August 2018 at
https://www.wku.edu/seas/undergradprogramdescription/swusurvey2018.pdf.
Caran, S.C., and Baker, V.R., 1986, Flooding along the Balcones Escarpment, Central Texas: The
Balcones Escarpment: Geology, Hydrology, Ecology, and Social Development in Central
Texas, Geological Society of America, p. 1-14.
CDWR (California Department of Water Resources), 2013, California’s flood future:
recommendations for managing the state’s flood risk (flood future report): California
Department of Water Resources and U.S. Army Corps of Engineers, 152 p.

DRAFT – State Flood Assessment – DRAFT
DRAFT – 61 – DRAFT
DRBC (Delaware River Basin Commission), 2006, Governor’s letter authorizing formation of a
task force, accessed August 2018, https://www.state.nj.us/drbc/programs/flood/task-
force_archives.html.
Economist Intelligence Unit (2018), Flood mitigation investment returns positive benefits: The
Economist, accessed August 2018 at https://floodeconomics.com/.
Fallding, M. 2008, What makes a good natural resource management plan?: Ecological
Management and Restoration, v. 1, no. 3, p. 185-194.
FEMA (Federal Emergency Management Agency), 2017, Estimating the value of partner
contributions to flood mapping projects “blue book”, version 4.1, 34 p.
FEMA (Federal Emergency Management Agency), 2018, Hazard Mitigation Plan Status, accessed
September 2018 at https://www.fema.gov/hazard-mitigation-plan-status.
Garrison, N., J. Sahl, A. Dugger, and R. P. Wilkinson, 2014, Stormwater capture potential in urban
and suburban California: Issue Brief IB: 14-05-G, National Resources Defense Council and
Pacific Institute, 8p.
IWA (Iowa Watershed Approach), 2017, About: Iowa Watershed Approach, accessed
August 2018 at http://www.iowawatershedapproach.org/about/.
Johnston, M., 1991, Houston: the unknown city, 1836-1946: Texas A&M University Press,
College Station, Texas, 464 p.
Joyce, J.M., and Scott, M.S., 2005, An assessment of Maryland’s vulnerability to flood
damage: Maryland Department of the Environment Flood Hazard Mitigation
Section, 82 p.
Mittler, E., Morgan, L., Shapiro, M., and Grill, K.Y., 2006, State roles and responsibilities in
the National Flood Insurance Program, American Institutes for Research,
Washington, D.C., 139 p.
Multihazard Mitigation Council, 2017, Natural hazard mitigation saves: 2017 interim
report: National Institute of Building Sciences, 325 p., accessed August 2018 at
http://www.wbdg.org/files/pdfs/MS2_2017Interim%20Report.pdf.
NDNR (Nebraska Department of Natural Resources), 2013, Flood hazard mitigation plan
– state of Nebraska: Nebraska Department of Natural Resources Floodplain and
Dam Safety Division, 135 p.
DRAFT – State Flood Assessment – DRAFT
DRAFT – 62 – DRAFT
NOAA (National Oceanic and Atmospheric Administration), 1977, Five- to 60-minute
precipitation frequency for the Eastern and Central United States: NOAA
Technical Memorandum NWS HYDRO-35, 37 p.
NCTCOG (North Central Texas Council of Governments), 2017, Resolution endorsing the
16-county watershed management initiative goal and encouraging county
government participation: North Central Texas Council of Governments, exhibit
2017-10-06-ED, accessed August 2018, at
https://www.nctcog.org/nctcg/media/BoardMeetingAssets-
DOCS/201710Resolutions.pdf?ext=.pdf.
NWS (National Weather Service), 2014, The national “turn around don’t drown” program turns
10 years old in 2014: accessed July 2018, at https://www.weather.gov/news/140207-turn.
NWS (National Weather Service), 2018a, Greatest observed point precipitation values for the
USA: accessed July 2018, at
http://www.nws.noaa.gov/oh/hdsc/record_precip/record_precip_us.html.
NWS (National Weather Service), 2018b, Flash flood definition: accessed July 2018, at
https://www.weather.gov/phi/FlashFloodingDefinition.
NWS (National Weather Service), 2018c, Advance hydrologic prediction service: accessed
July 2018, at https://water.weather.gov/precip/.
NWS (National Weather Service), 2018d, Precipitation frequency data server: accessed
July 2018, at https://hdsc.nws.noaa.gov/hdsc/pfds/index.html.
NWS (National Weather Service), 2018e, Progress Reports–Hydrometeorological Design
Studies Center, Office of Hydrologic Development, accessed August 2018, at
http://www.nws.noaa.gov/oh/hdsc/current_projects.html.
Ramos, M.G., 1999, Galveston’s response to the hurricane of 1900: Texas Almanac,
accessed July 2018, at https://texasalmanac.com/topics/history/galvestons-
response-hurricane-1900.
Schoelwer, S.P., 2018, San Antonio de Valero mission: Texas State Historical Association,
accessed July 2018, at https://tshaonline.org/handbook/online/articles/uqs08.
SICNR (Senate Interim Committee on Natural Resources), 2002, Analysis of state natural disaster
efforts: Interim report to the 78th Legislature.
Slade, R.M., Jr., 1986, Large rainstorms along the Balcones escarpment in central Texas in Abbott,
P.L., and Woodruff, C.M., Jr., eds., 1986, The Balcones escarpment, central Texas:
DRAFT – State Flood Assessment – DRAFT
DRAFT – 63 – DRAFT
Geological Society of America, p. 15–20, accessed August 2018, at
http://www.library.utexas.edu/geo/balcones_escarpment/pages15-19.html
Slade, R.M., Jr., and Patton, J., 2003, Major and catastrophic storms and floods in Texas: U.S.
Geological Survey Open-File Report 03-193, accessed July 2018, at
https://pubs.usgs.gov/of/2003/ofr03-193/.
Standard & Poor’s Financial Services, 2018, How our U.S. local government criteria weather
climate risk: S&P Global, accessed August 2018, at
https://www.spratings.com/documents/20184/4918240/HowOurUSLocalGovernmentCrit
eriaWeatherClimateRisk.pdf.
TBWE (Texas Board of Water Engineers), 1957, Texas floods – April, May, June 1957: Texas Water
Development Board Historical Report M278, 126 p.
TDEM (Texas Division of Emergency Management), 2013, State of Texas hazard mitigation plan
2013 update: Texas Department of Public Safety, Division of Emergency Management,
280 p., accessed August 2018 at
https://www.dps.texas.gov/dem/Mitigation/txHazMitPlan.pdf.
TexASCE (American Society of Civil Engineers – Texas Section: Task committee on post-
Hurricane Harvey Recommendations), 2018, Addressing flood risk: A path forward for
Texas after Hurricane Harvey, 24 p.
TGS (Texas Geographic Society), 2017, CHAMPS ’17: A hazard assessment for Texas, Hazard
Mitigation Grant Program 1791-107 Report: Texas Geographic Society, 234p.
TGLO (Texas General Land Office), 2017, Texas Coastal Resiliency Master Plan: Texas General
Land Office, 208 p.
Tufts, J. 2017, Ben Ficklin flood stories revealed in archives: San Angelo Standard Times, accessed
August 2018, at https://www.gosanangelo.com/story/news/local/2017/08/23/ben-ficklin-
flood-stories-revealed-archives/589975001/.
TWDB (Texas Water Development Board), 2016, Water for Texas: 2017 state water plan: Texas
Water Development Board, 133 p., available at
https://www.twdb.texas.gov/waterplanning/swp/2017/.
TWRI (Texas Water Resources Institute), 2011, Timeline of droughts in Texas: accessed July 2018,
at http://twri.tamu.edu/publications/txh2o/fall-2011/timeline-of-droughts-in-texas/.

DRAFT – State Flood Assessment – DRAFT
DRAFT – 64 – DRAFT
USACE (U.S. Army Corps of Engineers), 2018, National levee database: U.S. Army Corps of
Engineers, accessed August 2018 at
http://nld.usace.army.mil/egis/f?p=471:1:0::NO.
U. S. Census Bureau – American FactFinder, 2018, Annual estimates of the resident population:
April 1, 2010 to July 1, 2017: 2017 Population Estimates Program, accessed May 2018, at
https://factfinder.census.gov/faces/tableservices/jsf/pages/productview.xhtml?src=bkmk.
USDA (U.S. Department of Agriculture), 2010, Global Agricultural Information Network
Report MX0508: Trade disruption at Laredo border crossing due to floods,
accessed May 2018 at https://gain.fas.usda.gov/.
USDC (U.S. Department of Commerce, Weather Bureau), 1961, Rainfall frequency atlas of
the United States for durations from 30 minutes to 24 hours and return periods
from 1 to 100 years: Technical Paper No. 40, 65 p.
USDC (U.S. Department of Commerce, Weather Bureau), 1964, Two- to ten-day
precipitation for return periods of 2 to 100 years in the contiguous United States:
Technical Paper No. 49, 32 p.
USGAO (U.S. Government Accountability Office), 2018, Disaster assistance - National Flood
Insurance Program, accessed September 2018 at
https://www.gao.gov/key_issues/disaster_assistance/national-flood-insurance-program.
Watson, K.M., Harwell, G.R., Wallace, D.S., Welborn, T.L., Stengal, V.G., and McDowell, J.S., 2018,
Characterization of peak streamflows and flood inundation of selected areas in
southeastern Texas and southwestern Louisiana form the August and September 2017
flood resulting from Hurricane Harvey: U.S. Geological Survey Scientific Investigations
Report 2018-5070, 44 p.
Wermund, E.G., 1996, River basin map of Texas: Bureau of Economic Geology, The University of
Texas at Austin, available at
http://www.beg.utexas.edu/UTopia/images/pagesizemaps/river_basin.pdf.
DRAFT – State Flood Assessment – DRAFT
DRAFT – 65 – DRAFT
Appendix A – Estimating financial need for mitigation
Data sources
Financial information used to estimate mitigation needs comes from two sources: (1) reported
estimates of mitigation costs and available funding based on survey responses, which represent
60 percent of the state’s population, and (2) a statistical analysis to develop estimates for the
remaining 40 percent of the population not represented by survey responses.
Reported financial costs and funding levels for much of the state came from the information
obtained and analyzed from two stakeholder surveys (representing 299 communities).
Respondents to the surveys represent communities that collectively encompass 60 percent of
the state’s population, or 15 million people (based on the 2010 census). Funding estimates for
this portion of the state are based on responses from 268 cities and counties and 31 other
entities such as river authorities, special drainage districts, and councils of government.
In general, communities reported their known mitigation needs based on a combination of
existing local inventories of reported flood problems, master planning efforts, and capital
improvement program plans. We also followed-up with nine communities to validate their
survey responses with respect to the mitigation projects and financial information.
To ensure this report considers statewide anticipated flood mitigation costs and funding needs,
we used a statistical analysis to account for the 10 million people (or 40 percent of the state’s
population) that are not represented directly by survey responses. Specifically, we used a linear
regression analysis to create three predictive models. The first model correlated the population
of surveyed communities with their anticipated cost for mitigation. The second correlated the
same population to their available funding, and the third model correlated that population,
again, with the amount of non-local (state, federal, etc.) funding required.
We used these models to extrapolate funding estimates on a per capita basis for each
aforementioned funding category to represent the population that did not respond to the
survey (i.e., the non-responding population). This information was later combined with the
financial estimates of the surveyed population to provide an overall picture of financial needs for
flood mitigation projects for the state as a whole.
For this analysis, we had to match population size with each associated financial variable
(anticipated cost, available local funding, available non-local funding). Therefore, we used only
city and county data and so performed no extrapolation of costs for non-responding river
authorities or special districts, etc. We eliminated three outliers and data representing the seven

DRAFT – State Flood Assessment – DRAFT
DRAFT – 66 – DRAFT
largest communities in the state, all with populations exceeding 500,000, because this
information was not representative of the smaller-sized communities we were trying to estimate.
Ultimately, the analysis is based on information derived from survey responses for 258
communities.
Following the survey-based approach for estimating anticipated mitigation costs, we did not
factor in cost estimates for very large federal projects, such as a third flood control reservoir in
the Houston area or the Coastal Spine/Ike Dike—a coastal barrier system under consideration to
protect the Houston-Galveston region from hurricane storm surge. We also did not include cost
estimates identified by the state for the rehabilitation of high hazard dams.
Estimating the funding shortfall
A principle objective of this report is to estimate the shortfall between funding available from
local, state, and federal sources and the total cost to mitigate flooding. The following equation
serves as the basis for estimating this potential statewide funding shortfall:
𝑭𝒍𝒐𝒐𝒅 𝑭𝒖𝒏𝒅𝒊𝒏𝒈 𝑺𝒉𝒐𝒓𝒕𝒇𝒂𝒍𝒍
= 𝐴𝑛𝑡𝑖𝑐𝑖𝑝𝑎𝑡𝑒𝑑 𝐶𝑜𝑠𝑡𝑠 − 𝐴𝑣𝑎𝑖𝑙𝑎𝑏𝑙𝑒 𝐿𝑜𝑐𝑎𝑙 𝐹𝑢𝑛𝑑𝑠 − 𝐴𝑣𝑎𝑖𝑙𝑎𝑏𝑙𝑒 𝑁𝑜𝑛𝐿𝑜𝑐𝑎𝑙 𝐹𝑢𝑛𝑑𝑠
Anticipated costs are estimated based on reported and extrapolated costs to implement
mitigation activities for communities across the state. Reported estimates are derived from
Survey 1, which allowed communities to select a range of anticipated costs (e.g., less than $1
million; $1 million to $25 million; $25 million to $50 million, etc. up to greater than $1 billion),
and Survey 2, which allowed communities to report a specific anticipated cost for
implementation of all identified activities over the next 10 years. We used specific costs for a
community when possible. When not available, we used the midpoint of the range chosen by a
community as reported in Survey 1. These data were combined with extrapolated estimates
derived from the statistical analysis based on reported anticipated costs to provide an overall
anticipated cost of mitigation for the state.
Available local funds represent all locally-available financial resources that communities expect
to be able to contribute, at their discretion, to fund mitigation activities. We assume that a
portion of local funds will include bonds issued in the capital markets. The estimate of available
local funds comes from a combined dataset comprised of: (1) the information provided by
respondents related to their overall anticipated mitigation costs that cannot be covered by non-
local sources; (2) an estimate of available local funds in the future, based on their community’s
spending patterns over the past 10 years; and (3) an extrapolated estimate representing
available funds for the non-responding population.
DRAFT – State Flood Assessment – DRAFT
DRAFT – 67 – DRAFT
The difference between anticipated costs and the amount of locally-available funds paints a
broad picture of the non-local funding needs—whether state, federal, or other—needed by
communities to aid their mitigation activities.
𝑁𝑜𝑛𝐿𝑜𝑐𝑎𝑙 𝐹𝑢𝑛𝑑𝑖𝑛𝑔 𝑁𝑒𝑒𝑑𝑠 = 𝐴𝑛𝑡𝑖𝑐𝑖𝑝𝑎𝑡𝑒𝑑 𝐶𝑜𝑠𝑡𝑠 − 𝐴𝑣𝑎𝑖𝑙𝑎𝑏𝑙𝑒 𝐿𝑜𝑐𝑎𝑙 𝐹𝑢𝑛𝑑𝑠
Available non-local funds represent the total amount of funding from federal and state
financial assistance programs that each community will have access to for their flood mitigation
activities. We assume that a portion of the non-local funds will take the form of loans with some
measure of subsidy provided by the state as non-local financial assistance which ultimately
reduces the required financing cost at the local level. Our estimate of available non-local funds
for this analysis is based on programs that currently finance flood mitigation in Texas. Federal
funding through programs of the USACE is based on average annual funding in recent years.
Estimated funding from the Community Development Block Grant Program for Disaster
Recovery is based on 10 percent of the historical disaster funding for Texas over the period from
2008 through 2018. Estimates for other federal and state grant programs were generally based
on an analysis of funding available for Texas over the previous five to 10-year period, depending
on the availability of funding data for the program.
The TWDB has two financial assistance programs with significant capacity to offer primarily loans
for stormwater and flood control projects. The estimate of available funding from the Clean
Water State Revolving Fund over the next 10 years is based on two aspects, a percentage of the
total non-local funding needs for respondents indicating a willingness to receive subsidized
loans but capped at the capacity of the program net of expected demand for non-flood related
projects. The Texas Water Development Fund (DFund) has the constitutional authority to issue
bonds with up to $6 billion outstanding at any time. The estimate of available DFund funding
was similarly based on a percentage of total non-local funding needs for respondents willing to
receive market rate loans, which is well within the capacity of the DFund. Despite DFund offering
a credit subsidy, the market rate loan survey response was used, because the magnitude of the
subsidy can be small depending on the credit rating of the borrower.
Once these funding sources (Table A.1) were accounted for, we determined the total statewide
financial shortfall in funding that is needed to support flood mitigation activities in Texas. This
flood funding shortfall is based on the difference between the anticipated statewide mitigation
cost and the combination of all available local and non-local funding sources which are not
post-disaster funds and which are present within existing programs.

DRAFT – State Flood Assessment – DRAFT
DRAFT – 68 – DRAFT
Table A.1. Types of funding, cost share, and estimated amounts over the next 10 years.
Funding Type and Potential Cost Share Potential Funding
(2018-2028)
Funding Source Funding Type Matching Funds
In-Kind
Services
accepted
Estimated Funding
Loan /
Grant
Disaster/
Non-Disaster Standard
Special
Conditions Low High
Clean Water State Revolving Fund
(CWSRF) [TWDB]:
Loan and
Grant-like
Disaster &
Non-Disaster 100 / 0 - $1,755,000,000 $2,665,000,000
Cooperating Technical Partners Program
(CTP) [FEMA, TWDB] Grant Non-Disaster 50 / 50 Yes $2,400,000 $10,000,000
Technical Partners Program (CTP) [FEMA
directly] Grant Non-Disaster 50 / 50 Yes $12,000,000 $17,000,000
Flood Protection Planning Grant [TWDB] Grant Non-Disaster 50 / 50 75 / 25 Yes $11,000,000 $16,000,000
Pre-Disaster Mitigation (PDM) [FEMA,
TDEM] Grant Non-Disaster 75 / 25 90 / 10 No $17,000,000 $40,000,000
Texas Commission on Environmental
Quality [TCEQ] Grant Non-Disaster - - - $0 $1,000,000
Texas Department of Transportation
[TXDOT] Grant Non-Disaster - - - $0 $8,500,000
Texas State Soil and Water Conservation
Board [TSSWCB] Grant Non-Disaster 95 / 5 - No $45,000,000 $50,000,000
Texas Water Development Fund (DFund)
[TWDB] Loan Non-Disaster 100 / 0 - - $170,000,000 $335,000,000
U.S. Army Corps of Engineers Small
Continuing Authorities Program (USACE
CAP)
Grant Non-Disaster 65 / 351 75 / 251 Yes1 $0 Included with
line below1
U.S. Army Corps of Engineers Specific
Authorized Programs & Continuing
Authorities Program (CAP)
Grant Non-Disaster - - Yes $0 $450,000,000

DRAFT – State Flood Assessment – DRAFT
DRAFT – 69 – DRAFT
Funding Type and Potential Cost Share Potential Funding
(2018-2028)
Funding Source Funding Type Matching Funds
In-Kind
Services
accepted
Estimated Funding
Loan /
Grant
Disaster/
Non-Disaster Standard
Special
Conditions Low High
U.S. Department of Agriculture - Natural
Resources Conservation Service (NRCS) Grant Non-Disaster 50 / 50 - Yes $30,000,000 $60,000,000
Flood Mitigation Assistance [FEMA, TWDB] Grant Non-Disaster 75 / 25 90 / 10 RL
100 / 0 SRL
Yes (no
more than
50%)
$250,000,000 $300,000,000
Community Development Block Grant-
Disaster Recovery (CDBG-DR) [HUD, GLO] Grant Disaster 100 / 0 - - $0 $1,300,000,000
Hazard Mitigation Grant Program (HMGP)
[FEMA, TDEM] Grant Disaster 75 / 25 - - $0 $17,000,000
TOTALS $2,292,400,000 $5,269,500,000
1 USACE CAP funding is included in the total USACE Specific Authorized Programs Budget. Matching fund requirements only apply to the CAP funds,
which are not defined but would likely be a small percentage of the total.