texas. - plant physiology · a water-soluble transformation product ... reported herein is a study...
TRANSCRIPT

JAWORSKI ET AL-METABOLISM OF RADIOACTIV'E 2,4-D
A water-soluble transformation product of 2,4-D.Arch. Biochem. Biophys. 35: 171-175. 1952.
4. JAWORSKI, E. G. and BUTTS, J. S. Studies in plantmetabolism. II. The metabolism of C'4 labeled2,4-dichlorophenoxyacetic acid in bean plants.Arch. Biochem. Biophys. 38: 207-218. 1952.
5. MITCHELL, J. W. and BROW-N, J. W. Movement of2,4-dichlorophenoxyacetic acid stimulus and itsrelation to the translocation of organic food ma-terials in plants. Bot. Gaz. 107: 393-407. 1946.
6. MITCHELL, J. W., DUGGER, WA. M., JR., and GAUCH,H. G. Incrieased translocation of plant growthmodifying substances due to application of Boron.Science 118: 354-355. 1953.
7. RICE, E. L. Absorption and translocation of ammo-nium 2.4-dichlorophenoxyacetate by bean plants.Bot. Gaz. 109: 301-314. 1948.
8. ROHRBAUGH, L. M. and RICE, E. L. Effect of appli-cation of sugar on the translocation of sodium2,4-dichlorophenoxyacetate by bean plants in thedark. Bot. Gaz. 111: 85-89. 1949.
9. WEINTRAUB, R. L. and BROWN, J. W. Translocationof exogenous growth regulators in the bean seed-ling. Plant Physiol. 25: 140-149. 1950.
10. WAEINTRAUB, R. L., BROWN, J. W., FIELD, M., andROHAN, J. Metabolism of 2,4-dichloirophenoxy-acetic acid. I. C402 production by bean plantstreated with labeled 2,4-dichlorophenoxyaceticacids. Plant Physiol. 27: 293-301. 1952.
11. WAEINTRAUB, R. L., YEATMAN, J. N., LOCKHART, J. A.,REINHART, J. H., and FIELDS, M. Metabolism of2,4-dichlorophenoxyacetic acid. II. Metabolism ofthe side chain by bean plants. Arch. Biochem.Biophys. 40: 277-285. 1952.
PHOTOSYNTHESIS AND RESPIRATION OF THREE BLUE-GREEN ALGAE1'2
WILLIAM A. KRATZ 3 AND JACK MYERSDEPARTMENT OF ZOOLOGY, UNIVERSITY OF TEXAS, AUSTIN 12, TEXAS
Reported herein is a study of certain salientfeatures of photosynthesis and respiration in threeblue-green algae, Anabaena variabilis, Anacystis nzidu-lans, and Nostoc muscorum G. Histories and briefdescriptions of the three species are included in a
previous report (2) which presented methods of cul-ture and growth characteristics. Of the various blue-green algae available in pure culture the species usedwere chosen because they suspend readily to givehomogeneous suspensions which submit to ease ofmanipulation. The objectives of the study are two-fold: first, to obtain information on metabolism of theblue-green algae, a group which has received onlycursor- attention; and secondly, to develop a base ofinformation which would allow use of a blue-greenalga as a reliable experimental organism for studieson the process of photosynthesis. Because of the sim-plicity of their structure the blue-green algae appear
especially desirable for studies on photosynthesis pur-
stued to subeellular levels.
MIETHODSCellular material of Anabaena variabilis and Atia-
cystis nidulanis was obtained from bacteria-free cul-tures grown in a continuous-culture apparatus (6).The culture medium was medium C, described com-
pletely in a previous report (2), containing per liter0.25 gm -MgSO4 7 H20, 1.0 gm K2HPO4, 0.025 gmCa(NO3)2
- 4 H.O, 1.0 gm KNO3, 0.165 gm sodiumcitrate, 0.004 gm Fe2(SO4)3 - 6 H20, and 1.0 ml of an
A5 trace element solution; pH 7.3 to 7.5 when aeratedwith 0.5 % CO. in air. The cultures were maintainedat 25 or 390 C and illuminated by tungsten lamps.
1 Received January 19, 1955.2 Aided by Grant G259 from the National Science
Foundation.3 Present address: Trinity Univ-ersity, San Antonio,
Texas.
Pure cultures of Nostoc muscorum G (strain obtainedfrom G. C. Gerloff) were grown with the same me-dium and aerating gas in large test tube cultures inbaths held at 250 C and illuminated by 20-watt day-light fluorescent lamps. For all cultures rate ofgrowth was controlled by light intensity. However,since the illumination was multidirectional and theeffective light intensity not easily interpretable, amore useful description of the previous history of thecells is provided by the specific growth rate, k, whichwill be expressed in log10 units per day.
Photosynthesis measurements were made by War-burg manometry in a water bath with glass bottomthermostated at 25 or 390 C. Illumination was pro-vided by a bank of tungsten lamps operated at120 + 1 volts from a voltage stabilizer. Light in-tensity could be varied by use of Jena NG neutralfilters attached to the bottoms of the vessels byholders which also masked out stray light. Respira-tion measurements were made in conical flasks con-taining 2.0 ml cell suspension, 0.25 ml KOH in thecenter well, and 0.5 ml of buffer or buffer plus sub-strate in the sidearm.
In preparation for manometric experiments cellswere centrifuged out from a known volume of sus-pension, washed in the buffer to be used, and takenup in buffer. Because of its small size (ea 1.6 x 2.2 A)Anacystis nidulans does not sediment as easily asother algae; 3300 x g for 6 minutes in an angle centri-fuge were required for complete sedimentation. Cellquantity was determined routinely in terms of packedcell volume. Aliquots of original cell suspension werecentrifuged out, transferred to calibrated capillarytubes, and centrifuged at 2400 x g for one hour in anInternational centrifuge. Packed cell volume of allthree species attained a minimum volume after 45minutes. The relation between cell volume and dryweight was determined separately upon several differ-
275
www.plantphysiol.orgon July 20, 2018 - Published by Downloaded from Copyright © 1955 American Society of Plant Biologists. All rights reserved.
PLANT PHYS10LOGY
TABLE ICHARACTERISTICS OF THE CELLS USED
LIGHTALGA INTEN- TM H GROWTH DRY WT*SITY FOR TEMP PH RATE, K
GROWTH
fc ° C mg/cm cellsAnabeena
variabilis 55 25 7.8 0.30 0.206 ± 0.005Anacystis 75 25 7.7 0.55 0.278 0.006nidulans 90 39 7.8 1.00 t 0.271 ± 0.007
220 39 8.0 2.50 0.266 ± 0.005Nostoc mus-corumG** 200 25 7.7 0.20 0.194 + 0.003
* Variability shown is the maximum deviation fromthe mean in four determinations.
** Grown in large test tube cultures; other algaegrown in continuous culture apparatus.
t Lyophilized cells grown under these conditions con-tained 48.3 % C, 6.7 % H, 9.4 % N, 4.4 % ash.
ent samples of cell suspension by washing twice indistilled water, transferring to tared crucibles in aminimum quantity of water, and drying to constantweight at 1050 C. Rates of photosynthesis and respi-ration will be expressed in terms of QO2 with theusual dimensions of 14/hourxmmg dry weight; appar-ent rates of photosynthesis will be cited without cor-rection for respiration.
The growth conditions and characteristics of thecell suspensions studied are summarized in table I.
PHOTOSYNTHESISMETHODOLOGICAL PROBLEMS: The experience of
Emerson and Lewis (1) with Chroococcus and thepreceding study of growth requirements of the algaeused herein dictated an examination of the sodiumand potassium relation in the buffers to be used.Initial experiments with Anabaena variabilis andAnacystis nidulans in 0.0125 M KHCO3 plus 5 % CO2or in the KHCO3-K2CO3 Warburg buffer No. 9yielded similar results: rate of oxygen evolution de-
creased rapidly after a period of 20 to 30 minutes.Experiments with buffers of Na: K ratios 20: 80,50: 50, and 80: 20 gave photosynthetic rates whichwere steady and independent of the Na: K ratio.Subsequent studies on photosynthesis were conductedin equimolar Na- and K-buffer solutions.
Effects of centrifugation and washing were exam-
ined. Equivalent photosynthetic rates were achievedwhen the cells were centrifuged for one or three timesand when they were unwashed or washed twice in thefinal buffer solution.
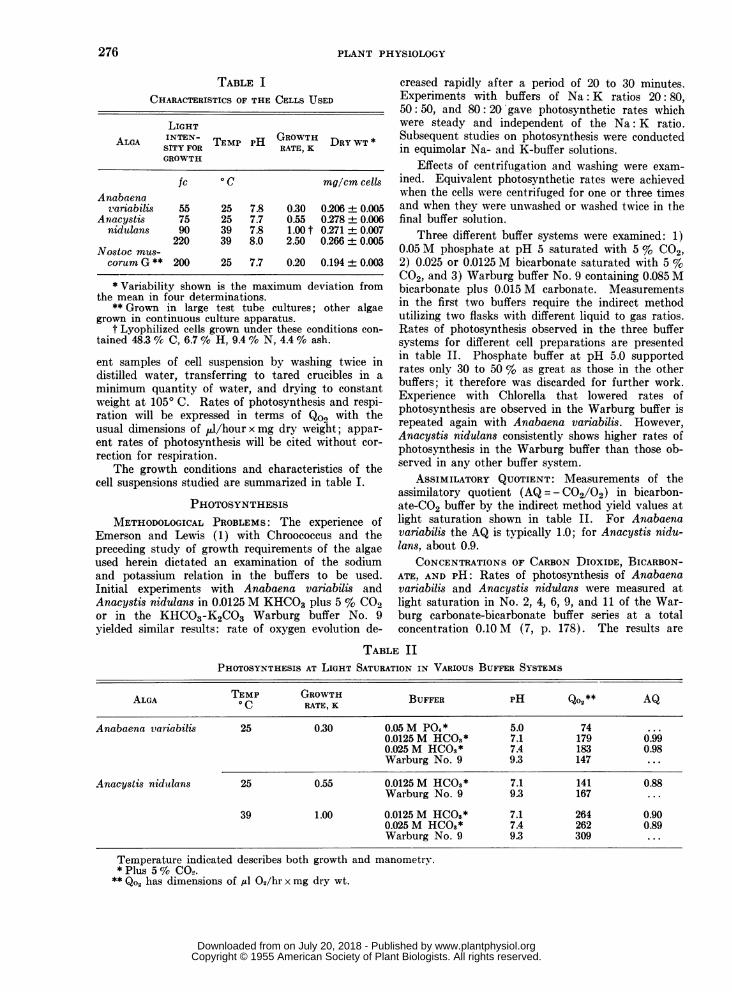
Three different buffer systems were examined: 1)0.05 M phosphate at pH 5 saturated with 5 % C02,2) 0.025 or 0.0125 M bicarbonate saturated with 5 %C02, and 3) Warburg buffer No. 9 containing 0.085 Mbicarbonate plus 0.015 M carbonate. Measurementsin the first two buffers require the indirect methodutilizing two flasks with different liquid to gas ratios.Rates of photosynthesis observed in the three buffersystems for different cell preparations are presentedin table II. Phosphate buffer at pH 5.0 supportedrates only 30 to 50 % as great as those in the otherbuffers; it therefore was discarded for further work.Experience with Chlorella that lowered rates ofphotosynthesis are observed in the Warburg buffer isrepeated again with Anabaena variabilis. However,Anacystis nidulans consistently shows higher rates ofphotosynthesis in the Warburg buffer than those ob-served in any other buffer system.
ASSIMILATORY QUOTIENT: Measurements of theassimilatory quotient (AQ = - C02/02) in bicarbon-ate-CO2 buffer by the indirect method yield values atlight saturation shown in table II. For Anabaenavariabilis the AQ is typically 1.0; for Anacystis nidu-lans, about 0.9.
CONCENTRATIONS OF CARBON DIOXIDE, BICARBON-ATE, AND PH: Rates of photosynthesis of Anabaenavariabilis and Anacystis nidulans were measured atlight saturation in No. 2, 4, 6, 9, and 11 of the War-burg carbonate-bicarbonate buffer series at a totalconcentration 0.10 M (7, p. 178). The results are
TABLE IIPHOTOSYNTHESIS AT LIGHT SATURATION IN VARIOUS BUFFER SYSTEMS
ALGA TEMP GOTH BUFFER PH Qo2** AQ
Anabaena variabilis 25 0.30 0.05 M P04* 5.0 74 ...0.0125M HCO3* 7.1 179 0.990.025 M HCOS* 7.4 183 0.98Warburg No. 9 9.3 147 ...
Anacystis nidulans 25 0.55 0.0125 M HCOS* 7.1 141 0.88Warburg No. 9 9.3 167 ...
39 1.00 0.0125M HCOS* 7.1 264 0.900.025 M HCOS* 7.4 262 0.89Warburg No. 9 9.3 309 ...
Temperature indicated describes both growth and manometry.*Plus 5% CO.
** Qo2 has dimensions of ,ul 02/hr x mg dry wt.
276
www.plantphysiol.orgon July 20, 2018 - Published by Downloaded from Copyright © 1955 American Society of Plant Biologists. All rights reserved.

KRATZ AND MYERS-PHYSIOLOGY OF BLUE-GREEN ALGAE
presented in figure 1; rate of photosynthesis is plottedin the conventional way as a function of concentra-tion of free carbon dioxide and also as a function ofbicarbonate eoncentration. Each point is an averageof three or more closely agreeing replicate valuesassembled from different experiments.
In figure 2 the same data used in figure 1 arereplotted as curve B describing rate of photosynthesisof Anabaena variabilis as a function of pH in thecarbonate-bicarbonate buffer series. The curves A offigure 2 are constructed from experiments in bicar-bonate-carbon dioxide buffers with the bicarbonate at0.001 to 0.025 M in equilibrium with gas phase con-centrations of 2.5, 5.0 and 10 % CO2. In such buffers
&^[CowI I 10
CO2 are about the same as those observed in 0.05 Mphosphate and 5 % CO2 at pH 5 where the bicarbon-ate concentration is about 0.0001 M (cf table II).Comparison with the behavior of Chlorella pyrenoid-osa is provided by curve C; rates are constant andmaximum from pH 6.0 to 7.5 and are equal to thatobtained in phosphate buffer at pH 4.5.
The data of figure 1 may be examined furtherwith regard to the hoary controversy (ef 8, 10)whether free carbon dioxide or bicarbonate ion is theprincipal form taken up by the cells to meet theirphotosynthetic demand. Unfortunately, use of theWarburg buffer series is not expected to yield anunequivocal answer since there are five concomitant
290 M-'- 200- C
-o ~
-. 50~~~~A
100- 45 0.005
0.00:- B
'.0.002
50~
IHCOJGo TO
U.V pH
FIG. 1 (left). Rate of photosynthesis of Anabaena variabilis and Anacystis nidulans in Warburg buffers No. 2,4, 6, 9, and 11 plotted as a function of carbon dioxide concentration (circles, upper scale) and as function of bicar-bonate concentration (triangles, lower scale). Temperature 250 C.
FIG. 2 (right). Rate of photosynthesis of Anabaena variabilis and Chlorella pyrenoidosa as a function of pH.Curves A: Anabaena in bicarbonate of the molarity shown on the curves in equilibrium with 2.5 %'c C02, circle-dot;5 c% C02, open circle; 10% C02, closed circle; X designates 0.025 M bicarbonate +5 % C02. Curve B: Anabaenain the Warburg carbonate-bicarbonate buffers. Curve C: Chlorella in different concentrations of bicarbonate +5 %AC02.
both oxygen and carbon dioxide are exchanged withthe gas phase. In any one experiment the amount ofcarbon dioxide bound as biearbonate remains sensiblyconstant, the earbonate concentration is negligible,and therefore the carbon dioxide exchange accuratelyrepresents cell activity, so long as the bicarbonateconcentration does not exceed about 0.025 I.
The overlapping curves A of figure 2 are inter-preted as a single continuous curve demonstratingeffects of lower pH on photosynthesis. Carbonateconcentration is negligible. Overlapping rates aresustained by varying bicarbonate and carbon dioxideconcentrations so that only their ratio, reflected inhydrogen ion concentration, becomes the controllingvariable. It will be noted further that rates observedin 0.001 an(l 0.002A1 bicarbonate and 2.5 to 10%
variables: the ionic strength and the concentrationsof carbon dioxide and bicarbonate, carbonate, andhydrogen ion. If rates are treated as a function offree carbon dioxide only, the resulting "carbon dioxidecurves" extrapolate to zero rate at zero concentra-tion and show saturation at about 10- M equivalentto 0.03 % in the gas phase. If rates are treated as afunction of bicarbonate concentration only, the result-ing "bicarbonate curves" do not extrapolate to zerorate at zero concentration; further the concentrationsrequired for saturation become far higher than thoserequired in the bicarbonate-carbon dioxide buffers (cffig 2). Rates might also be considered as inversefunctions of hydrogen ion (cf fig 2) or carbonate ionconcentrations but such treatment ignores the certainrequirement of a supply factor for carbon to the cell.
FIG. 2
277
www.plantphysiol.orgon July 20, 2018 - Published by Downloaded from Copyright © 1955 American Society of Plant Biologists. All rights reserved.

PLANT PHYSIOLOGY
Attempts were made to vary the total concentra-tion of bicarbonate plus carbonate in buffer mixtureNo. 4 in the steps 0.06, 0.10, and 0.20 MI. The planof experimentation failed because of prolonged varia-tions in rate of 0.20 MI which occurred also when thelower concentrations were brought up to 0.20 M byuse of chloride and sulfate as substituent ions. At0.10 M rates were constant over the entire 90 minuteperiod of observation; at 0.06 M the rates stabilizedafter about 30 minutes. At 0.06 M the observed ratewas 80 % of that in 0.10 M although the bicarbonatewas 60 % and the carbon dioxide 56 % as great.These observations lead to some suspicion of unto-ward effects of the rather high total concentration ofthe Warburg buffer system.
However inconclusive the results, they in no wayspeak against the general proposition of Rabinowitch(8, p. 891): that as a first approximation the rate ofphotosynthesis is a function of concentration of freecarbon dioxide in the suspending medium. Such aconclusion becomes significant only because the algaestudied are adapted to an alkaline environment andgrow only in a limited pH range (ca 7.2 to 9.2) wherethe bicarbonate concentration is 10 to 1000 timesgreater than that of free carbon dioxide (2).
LIGHT INTENSITY CURVES: Rate of photosynthesisin Warburg buffer No. 9 as a function of light in-tensity is shown by the curves of figure 3. Lightsaturation of the three blue-green algae is achievedwithin a range of light intensities similar to that
FIG. 3. Light intensity curves of photosynthesis at250 C. A, Chlorella pyrenoidosa, k =0.42. B, Anacystis
nidulans, k = 0.55. C, Anabaena variabilis, k = 0.30. D,
Nostoc muscorum G, k = 0.43. E, Nostoc muscorum G,
k = 0.12. Values of k indicate the previous specificgrowth rate of the cells used.
required by Chlorella. However, the shape of thelight-saturation curve in the blue-greens depends uponprevious culture conditions, particularly the lightintensity, as previously shown for Chlorella (5). Thephenomenon is demonstrated by the two curves forNostoc muscorum G. Further examination of effectsof temperature and light intensity of growth on cellpigment concentrations and light intensitv curves ofphotosynthesis will be the subject of a later report.
Maximum rates of photosynthesis of Anabaenavariabilis and Anacystis nidulans at 25° C are com-parable to that of Chlorella pyrenoidosa at 250 C.At 390 C Anacystis nidulans has a maximum rate ofphotosynthesis far greater than that of Chlorellapyrenoidosa and greater than that of any organismyet reported except for a high-temperature strain ofChlorella (9). The photosynthetic rates of the threespecies substantiate the previous conclusion fromgrowth studies (2) that the blue-green algae are notto be considered a metabolically sluggish group.
RESPIRATIONFor respiration studies two kinds of cell prepara-
tions were used. Growing cells were harvested froma growing culture and prepared for manometric ex-periments in a minimum time (35 to 45 minutes).Starved cells were obtained by aerobic incubation ofharvested suspensions in darkness for 24 hours andat the same temperature used for growth and ma-nometry.
The suspending fluid chosen for respiration meas-urements was 0.5 M phosphate buffer at pH 7.8.Equal rates were observed in 0.05 M phosphate bufferat pH 4.5, 6.0, and 9.0, in K, Na, or Na: K= 1: 1salts, or in original medium C. As also reported byWebster and Frenkel (11) for Anabaena variabilis,the pH and Na: K ratio effects so pronounced forphotosynthesis are negligible for respiration in thethree algae studied here.
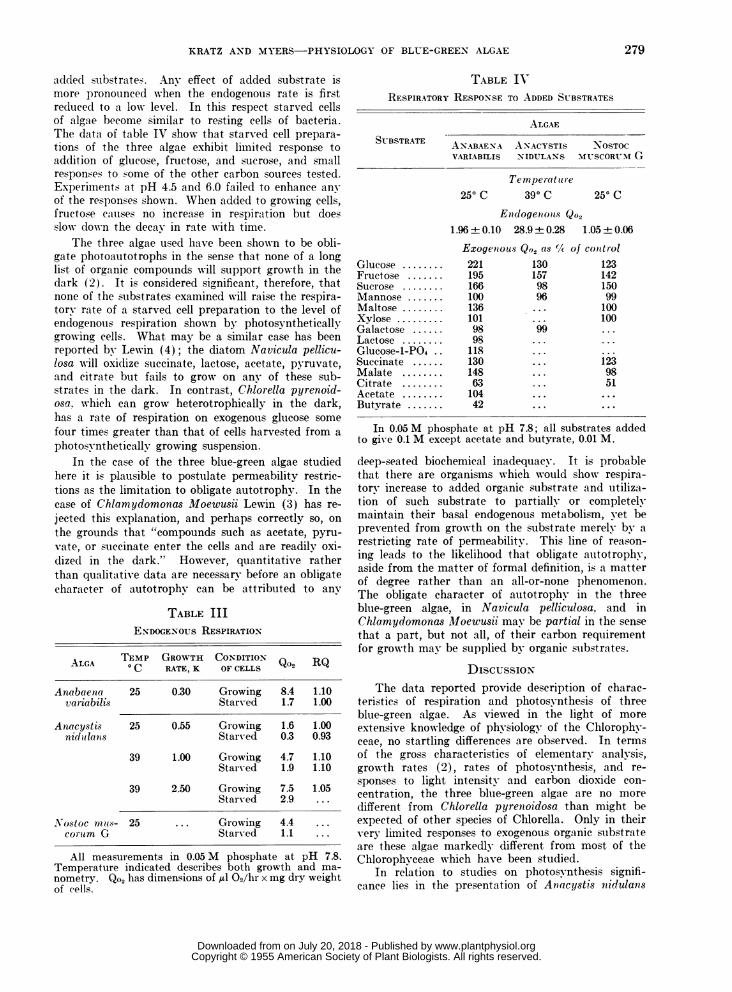
ENDOGENOUS RESPIRATION: Values for rates ofendogenous oxygen uptake and respiratory quotientsare given in table III. All three species show a rapiddecrease in rate of respiration during the first 24hours of dark starvation (growing vs starved cells)although there is only a slight decrease observed dur-ing the first hour of a manometric experiment. ForAnabaena variabilis and Nostoc muscorum G therates are within the range observed for Chlorellapyrenoidosa grown under similar conditions. Par-ticularly striking, therefore, is the low rate of Ana-cystis nidulans grown at 250 C; here rate of respira-tion is less than 1/100 of the rate of photosynthesis.The latter characteristic is a recommendation for usein quantum yield studies. The respiratory quotientsare close to unity and somewhat higher than thevalue 0.9 observed by Webster and Frenkel (11) forAnabaena variabilis.
EXOGENOUS RESPIRATION: Based upon past experi-ence with other algae, starved cell suspensions wereused for the examination of respiratory response to
278
www.plantphysiol.orgon July 20, 2018 - Published by Downloaded from Copyright © 1955 American Society of Plant Biologists. All rights reserved.
KRATZ AND MYERS-PHYSIOLOGY OF BLUE-GREEN ALGAE
a(dle(l su-bstrate.s. Any effect of added substrate ismore pronounced when the endogenous rate is firstreducedl to a low level. In this respect starved cellsof algae become similar to resting cells of bacteria.The data of table IV show that starved cell prepara-
tions of the three algae exhibit limited response toaddition of glucose, fructose, and sucrose, and smallresponses to some of the other carbon sources tested.Experiments at pH 4.5 and 6.0 failed to enhance any
of the responses shown. When added to growing cells,fructose causes no increase in respiration but doesslow dow-n the decay in rate with time.
The tlhree algae used have been shown to be obli-gate photoautotrophs in the sense that none of a longlist of organic compounds will support growth in thedark (2). It is considered significant, therefore, thatnone of the substrates examined will raise the respira-tory rate of a starved cell preparation to the level ofendogenous respiration shown by photosyntheticallygrowing cells. What may be a similar case has beenreported by Lewin (4); the diatom Navicula pellicu-losa will oxidize succinate, lactose, acetate, pyruvate,and citrate but fails to grow on any of these sub-strates in the dark. In contrast, Chlorella pyrenoid-osa, which can grow heterotrophically in the dark,has a rate of respiration on exogenous glucose some
four times greater than that of cells harvested from a
photosynthetically growing suspension.In the case of the three blue-green algae studied
here it is plausible to postulate permeability restric-tions as the limitation to obligate autotrophy. In thecase of Chlamydomonas Moewusii Lewin (3) has re-
jected this explanation, and perhaps correctly so, on
the grounds that "compounds such as acetate, pyru-
vate, or suiccinate enter the cells and are readily oxi-dizedl in the dark." However, quantitative ratherthan qualitative data are necessary before an obligatecharacter of autotrophy can be attributed to any
TABLE IIIENDOGENOUS RESPIRATION
ALGA TEMP GROWTH CONDITIONALGA oC RATE, K OF CELLS Q02 RQ
Anabaenia 25 0.30 Growing 8.4 1.10vaiiabilis Starved 1.7 1.00
A nacystis 25 0.55 Growing 1.6 1.00nidulanls Starved 0.3 0.93
39 1.00 Growing 4.7 1.10Starved 1.9 1.10
39 2.50 Growing 7.5 1.05Starved 2.9 ...
Nostoc nnus- 25 ... Growing 4.4 ...
co1-mm G Starv-ed 1.1 ...
All measurements in 0.05 M phosphate at pH 7.8.Temperature indicated describes both growth and ma-nometry. Qo2 has dimensions of ,ul 02/hr x mg dry weightof cells.
TABLE IVRESPIRATORY RESPONSE TO ADDED SUBSTRATES
ALGAE
SUBSTRATE ANABAE-NA AN-ACYSTIS NOSTOCVARIABILIS NIDULANS MUSCORU-ICG
Temperat 1 re
250 C 390C 250 C
Enzdogetnoius Qo21.96 + 0.10 28.9 + 0.28 1.05± 0.06
Exogewous Qo. as ¾A/ of contrtolGlucose ........ 221 130 123Fructose 195 195 157 142Sucrose .16 166 98 150Mannose 100 100 96 99Maltose.13 136 ... 100Xylose.10 101 ... 100Galactose 98...999Lactose 98 98 ... ...
Glucose-i-PG4 18 ... ...
Succinate 130 130 ... 123Malate 148 148 ... 98Citrate 63 63 ... 51Acetate ... 104 ... ...
Butyrate 42 42 ... ...
In 0.05 M phosphate at pH 7.8; all substrates addedto give 0.1 M except acetate and butyrate, 0.01 M.
deep-seated biochemical inadequacy. It is probablethat there are organisms which would show respira-tory increase to added organic substrate and utiliza-tion of such substrate to partially or completelymaintain their basal endogenous metabolism, yet beprevented from growth on the substrate merely by arestricting rate of permeability. This line of reason-ing leads to the likelihood that obligate autotrophy,aside from the matter of formal definition, is a matterof degree rather than an all-or-none phenomenon.The obligate character of autotrophy in the threeblue-green algae, in Navicula pelliculosa, and inChlamydomonas Moewusii may be partial in the sensethat a part, but not all, of their carbon requiirementfor growth may be supplied by organic suibstrates.
DISCUSSIONThe data reported provide description of charac-
teristics of respiration and photosynthesis of threeblue-green algae. As viewed in the light of moreextensive knowledge of physiology of the Chlorophy-ceae, no startling differences are observed. In termsof the gross characteristics of elementary analysis,growth rates (2), rates of photosynthesis, and re-sponses to light intensity and carbon dioxide con-centration, the three blue-green algae are no moredifferent from Chlorella pyretnoidosa than might beexpected of other species of Chlorella. Only in theirvery limited responses to exogenous organic substrateare these algae markedly different from most of theChlorophyceae which have been studied.
In relation to studies on photosynthesis signifi-cance lies in the presentation of An(acystis niidulanis
279
www.plantphysiol.orgon July 20, 2018 - Published by Downloaded from Copyright © 1955 American Society of Plant Biologists. All rights reserved.
PLANT PHYSIOLOGY
as a new experimental organism with many desirablecharacteristics. Its cells are small (- 2 ,u), it maybe grown as easily and reliably as Chlorella, it con-tains phycocyanin as an auxiliary photosynthetic pig-ment, it can be studied over a wide range of tempera-tures up to 410 C, it shows no inhibitory effects ofthe Warburg buffers, and it has an unusually low rateof dark respiration.
SUMMARYPhotosynthesis and respiration of three blue-green
algae, Anabaena variabilis, Anacystis nidulans, andNostoc muscortum G, have been studied by conven-tional Warburg manometry.
Rates of photosynthesis at light saturation weremeasured in the Warburg series of carbonate-bicar-bonate buffers and in bicarbonate-carbon dioxidebuffers in the pH range 6 to 10.5. Evidence wassought, but not found, that rate of photosynthesis isany simple function of bicarbonate concentration. Interms of their light intensity curves the three algaeshow no feature markedly different from those ofChlorella. Limited response of respiration to addedorganic substrates is considered related to the obligatephotoautotrophic character of the three algae.
Attention is directed to Anacystis nidulans whichhas several features making it particularly useful asan experimental organism for studies on photosyn-thesis.
LITERATURE CITED1. EMERSON, R. and LEWIS, C. M. The photosynthetic
efficiency of phycocyanin in Chroococcus, and theproblem of carotenoid participation in photosyn-thesis. Jour. Gen. Physiol. 25: 579-595. 1942.
2. KRATZ, W. A. and MYERS, J. Nutrition and growthof several blue-green algae. Amer. Jour. Bot. 42:282-287. 1954.
3. LEWIN, J. C. Obligate autotrophy in Chlamydomo-nas Moewusii. Science 112: 652-653. 1950.
4. LEWIN, J. C. Heterotrophy in diatoms. Jour. Gen.Microbiol. 9: 305-313. 1953.
5. MYERS, J. Influence of light intensity on photo-synthetic characteristics of Chlorella. Jour. Gen.Physiol. 29: 429-440. 1946.
6. MYERS, J. and CLARK, L. B. An apparatus for thecontinuous culture of Chlorella. Jour. Gen.Physiol. 28: 103-112. 1944.
7. RABINOWITCH, E. I. Photosynthesis, Vol. I. Pp.1-599. Interscience Publishers, Inc., New York.1945.
8. RABINOWITCH, E. I. Photosynthesis, Vol. II. Part1. Pp. 603-1208. Interscience Publishers, Inc.,New York. 1951.
9. SOROKIN, C. and MYERS, J. A high temperaturestrain of Chlorella. Science 117: 330-331. 1953.
10. STEEMAN-NIELSEN, E. Experimental carbon dioxidecurves in photosynthesis. Physiol. Plantarum 5:145-159. 1952.
11. WEBSTER, G. C. and FRENKEL, A. W. Some respira-tory characteristics of the blue-green alga, Ana-baena. Plant Physiol. 28: 63-69. 1953.
PERSISTENT RHYTHMS OF 02-CONSUMPTION IN POTATOES,CARROTS AND THE SEAWEED, FUCUS1,2
F. A. BROWN, JR., R. 0. FREELAND AND C. L. RALPHDEPARTMENT OF BIOLOGICAL SCIENCES, NORTHWESTERN UNIVERSITY, EVANSTON, ILLINOIS
AND THEMARINE BIOLOGICAL LABORATORY, WOODS HOLE, MASSACHUSETTS
It has been widely known for a long time thatnumerous plants and animals normally display overtdaily rhythms of various processes and, if they live inthe littoral regions of the seas, have also primarylunar cycles (tidal) of various physiological processes.In general, it has been customary to think of these as
direct responses to rhythmic external factors. Simi-larly, the numerous instances of semi-lunar and lunarbreeding cycles, common for marine animals andplants, have generally been considered to be simpleresponses to illumination or tides, or some combina-tion of these.
It is gradually becoming increasingly apparent,however, that daily rhythmicity in animals possesses
1 Received March 14, 1955.2 These studies were aided by contracts between the
Office of Naval Research, Department of the Navy, andNorthwestern University, NONR-122803, and the Ma-riniie Bio ogical Laboratory, NONR-1497(00).
an important persistent aspect. The rhythmic changespersist, more or less temperature-independent as tofrequency, under constant conditions of light, tem-perature, and humidity. It is also becoming evidentthat there are similarly temperature-independent per-sistent rhythms of primary lunar frequencies.
Beliefs- as to relationships between lunar phasesand human and other organismic behavior are as oldas the beginnings of the human cultural heritage, butthese have seldom found solid scientific support.Even when finally supported and used to predictaccurately such phenomena as occurrence of planktonpulses of the Illinois River (18), the swarming of thegrunion (24), or the palolo worm (17) the lack of an
adequate explanation has usually left the matter inthe hands of the naturalist rather than the experi-mentalist.
Biologists who have had occasion to concern them-selves with the measurement of 02-consumption in
280
www.plantphysiol.orgon July 20, 2018 - Published by Downloaded from Copyright © 1955 American Society of Plant Biologists. All rights reserved.