texas a&m university, department of civil engineering...
TRANSCRIPT

Texas A&M University, Department of Civil Engineering Instructor: Dr. Francisco Olivera
CVEN 658 Applications of GIS to Civil Engineering USING THE MODEL BUILDER
PRASHANT KRISHNAN, 12/04/06 Contents:
Brief overview of the Model Builder Goals of the exercise Computer and data requirements Procedure:
1. Developing a model 2. Adding data (DEM) to the model 3. Fill 4. Flow Direction tool 5. Flow Accumulation tool 6. Single Output Map Algebra tool 7. Stream Links tool 8. Watershed tool 9. Convert Raster to Polygon 10. Stream to Feature 11. Validate and Run 12. Viewing reports and properties 13. View the tool 14. Adding the tool to another Map document
Brief Overview of Model Builder
Model builder is an interface within ArcGIS 9.2 that allows users to build a flow path for the data and processes required in obtaining the results for an analysis. Many analyses carried out have different types of data and multiple tools operating on the data. The model builder helps in channelizing these repetitive processes into sort of a - flowchart of data, tool used on it and the result obtained. The model builder is a user-friendly interface with a few easy to learn functions. In this exercise, the emphasis is on learning to create a simple model to understand the principles model building.
Department of Civil Engineering 1 Texas A&M University

Full Zoom Select Copy Paste Extent Continuous
Zoom out Zoom Save Copy Add data Zoom in Pan Navigate Run
Print Auto Add Layout Connection
The Model builder toolbar
Goals of the exercise The goals of this exercise is to introduce you to the model builder.
Computer and data requirements This exercise was successfully performed using ArcGIS 9.0- ArcMap and ArcToolbox. Download the zip file containing the data. Uncompress the zip file to a folder on your drive. Go to the folder in ArcCatalog and you see the Digital Elevation Model (DEM). The DEM is named dem. Procedure 1. Developing a model
In this section of the exercise, you are going to learn how to add a toolbox to the ArcToolbox and adding a new model to this toolbox.
1) Open ArcMap from the start menu or from ArcCatalog. Save the new empty map document by clicking File/Save As. Now add the DEM (dem) to the data frame in the ArcMap document by using the Add Data tool. 2) Since we are working with raster data, it is important to activate the Spatial Analyst Extension. To make the extension active, click on Tools/Extensions. Check the Spatial Analyst box in the Extensions wizard that appears and then click Close. Insert a check to the Spatial Analyst in the Tools/Customize wizard to add the spatial analyst toolbar to the ArcMap document. Now set the Working
Department of Civil Engineering 2 Texas A&M University

Directory, Analysis Extent (same as layer “dem”) and the Cell Size (same a layer “dem”) by clicking on Spatial Analyst/Options.
3) Open ArcToolbox by clicking on the small red box on the standard menu of the ArcMap document. Once the ArcToolbox is active, right click on the ArcToolbox, and add a New Toolbox. A new toolbox is added to the ArcToolbox interface. Name this new toolbox as watershed-Delineation.
4) The next step is to create a new model. This can be done by right clicking the watershed-Delineation tool and adding a New/Model. A new model is added to your tool. Name this model as WSD.
Department of Civil Engineering 3 Texas A&M University

2. Adding Data (DEM) to the Model
In this section of the exercise, you will learn how to add data to your newly created model. First, you will open the model builder window and secondly add your data to this window.
1) Right click on the model WSD and select Edit. A new window opens; this is the Model Builder window.
2) Click on Add Data and direct the path to the folder containing the layer dem. Add the layer to the model. The layer will look like a blue bubble with the name of the layer in the center of the bubble.
Department of Civil Engineering 4 Texas A&M University

3) Alternatively, the dem layer can also be added by dragging the layer from the ArcMap document to the Model Builder window. Right click on the dem bubble and enable the Model Parameters.
3. Fill
In this section of the exercise, you will add the Fill tool and connect it to the dem layer. 1) In the ArcToolbox, open the Spatial Analysis/Hydrology toolbox. Drag the Fill tool to the model builder window. Two bubbles will be formed on the model builder window. One bubble will be called by default Fill and the other Output raster. Initially the two bubbles will have no color.
2) Using the connector tool connect the dem bubble with the Fill bubble. Automatically the Fill tool will turn Yellow and the Output raster will turn Green.
3) Double left click the Fill tool and check to see if the input raster field has
been populated with the dem raster. Change the name of the output raster by clicking on the Browse tab and directing it to the working directory, call this output raster as Fill_dem, and select ok.
Department of Civil Engineering 5 Texas A&M University

4) You will notice that the Green bubble is no more called Output raster but is called Fill_dem. Right click on the Fill_dem layer and enable Model. Parameters and Add to Display..
4. Flow Direction tool
In this section of the exercise, you will add the Flow Direction tool and connect it to the Fill_dem layer..
1) In ArcToolbox, open the Spatial Analysis/Hydrology toolbox. Drag the Flow. Direction tool to the model builder window. Three bubbles will be formed on the. model builder window. One bubble will be called by default Flow Direction, the. second one will be the Output drop raster, and the third one will be the Output raster..
2) Using the connector tool connect the Fill_dem bubble with the Flow Direction bubble. Automatically the Fill Direction tool will turn Yellow and the Output . raster will turn Green. The Output drop raster will still have no color since you .
are not using another layer as the Output drop. In this exercise you will not be . adding any Output drop rasters so let the Output raster bubble remain uncolored. .
Department of Civil Engineering 6 Texas A&M University

3) Double left click the Flow Direction tool and check to see if the input raster field
has been populated with the Fill_dem raster. Change the name of the output raster by clicking on the Browse tab and directing it to the working directory, call this output raster as Flow_dir, and select ok. You will notice that the Green bubble is no more called Output raster but is called Flow_dir. Right click on the Flow_dir layer and enable Model Parameters and Add to Display.
Department of Civil Engineering 7 Texas A&M University

5. Flow Accumulation tool
In this section of the exercise, you will add the Flow Accumulation tool and connect it to the Flow_dir layer.
1) In ArcToolbox, open the Spatial Analysis/Hydrology toolbox. Drag the Flow Accumulation tool to the model builder window. Two bubbles will be formed on the model builder window. One bubble will be called by default Flow Accumulation and the other one will be the Output raster. 2) Using the connector tool connect the Flow_dir bubble with the Flow Accumulation bubble. Automatically the Fill Accumulation tool will turn Yellow and the Output raster will turn Green. 3) Double left click the Flow Accumulation tool and check to see if the input raster
field has been populated with the Flow_dir raster. Change the name of the output raster by clicking on the Browse tab and directing it to the working directory, call this output raster as Flow_accu, and select ok. You will notice that the Green bubble is no more called Output raster but is called Flow_accu. Right click on the Flow_accu layer and enable Model Parameters and Add to Display.
Department of Civil Engineering 8 Texas A&M University

6. Single Output Map Algebra tool
In this section of the exercise, you will create the Streams layer by providing a threshold condition. This operation will be done by using the Single Output Map Algebra tool.
1) In ArcToolbox, open the Spatial Analysis/Map Algebra toolbox. Drag the Single Output Map Algebra tool to the model builder window. Two bubbles will be formed on the model builder window. One bubble will be called by default Single Output Map Algebra and the other one will be the Output raster.
2) Using the connector tool connect the Flow_accu bubble with the Single Output Map Algebra bubble. However, the two bubbles will not get the corresponding colors. This is because a particular value has not been set in the Single Output Map Algebra toolbox.
3) Double left click the Single Output Map Algebra tool and type in the following condition in the command box:
con(Flow_accu >= 10000,1) 4) This condition statement tells us the threshold value for this region is 10,000 cells. Pay a lot of attention while spelling out the Flow_accu layer and while typing the rest of the syntax.
Department of Civil Engineering 9 Texas A&M University

5) Change the name of the output raster by clicking on the Browse tab and directing it to the working directory, call this output raster as Streams, and select ok.
6) Automatically the Fill Accumulation tool will turn Yellow and the Streams (Output raster) will turn Green. 7) Right click on the Streams layer and enable Model Parameters and Add to Display.
7. Stream Links tool In this part of the exercise, you will create the Stream Links layer by using the flow direction and streams layer as input layers.
1) In ArcToolbox, open the Spatial Analysis/Hydrology toolbox. Drag the Streams Links tool to the model builder window. Two bubbles will be formed on the model builder window. One bubble will be called by default Stream Links and the other one will be the Output raster.
2) Using the connector tool first connect the Stream bubble with the Stream Links bubble and then connect the Flow_dir layer to the Stream Links bubble. Automatically the Stream Links tool will turn Yellow and the Output raster will turn Green.
Department of Civil Engineering 10 Texas A&M University

3) Double left click the Stream Links tool and check to see if the input raster field has been populated with the Flow_dir raster and the Streams raster in the correct fields. 4) Change the name of the output raster by clicking on the Browse tab and directing it to the working directory, call this output raster as Stream_lnks, and select ok. You will notice that the Green bubble is no more called Output raster but is called Stream_lnks. Right click on the Stream_lnks layer and enable Model Parameters and Add to Display.
Department of Civil Engineering 11 Texas A&M University
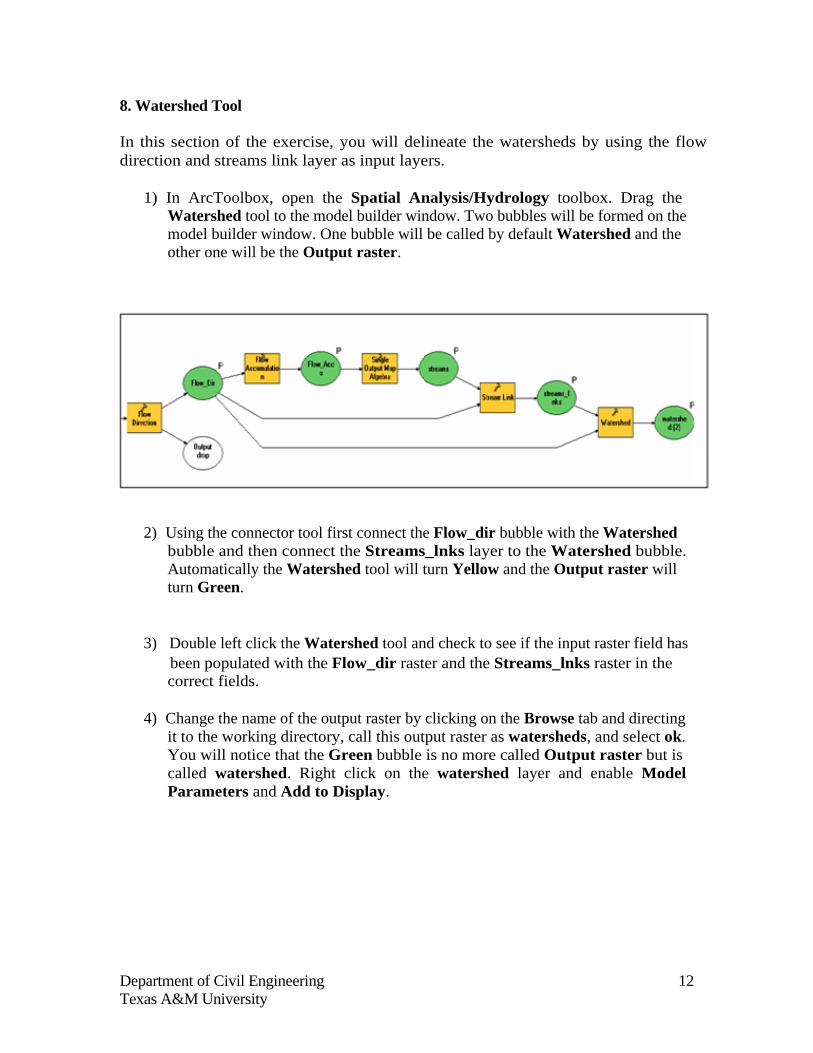
8. Watershed Tool
In this section of the exercise, you will delineate the watersheds by using the flow direction and streams link layer as input layers.
1) In ArcToolbox, open the Spatial Analysis/Hydrology toolbox. Drag the Watershed tool to the model builder window. Two bubbles will be formed on the model builder window. One bubble will be called by default Watershed and the other one will be the Output raster.
2) Using the connector tool first connect the Flow_dir bubble with the Watershed bubble and then connect the Streams_lnks layer to the Watershed bubble. Automatically the Watershed tool will turn Yellow and the Output raster will turn Green. 3) Double left click the Watershed tool and check to see if the input raster field has
been populated with the Flow_dir raster and the Streams_lnks raster in the correct fields.
4) Change the name of the output raster by clicking on the Browse tab and directing it to the working directory, call this output raster as watersheds, and select ok. You will notice that the Green bubble is no more called Output raster but is called watershed. Right click on the watershed layer and enable Model Parameters and Add to Display.
Department of Civil Engineering 12 Texas A&M University

9. Convert Raster to Polygon In this section of the exercise, you will convert the raster watershed layer into a polygon shapefile.
1) In ArcToolbox, open the Conversion/From Raster toolbox. Drag the Raster to Polygon tool to the model builder window. Two bubbles will be formed on the model builder window. One bubble will be called by default Raster to Polygon and the other one will be the Output shapefile.
2) Using the connector tool connect the watershed bubble with the Raster to Polygon tool. Automatically the Raster to Polygon tool will turn Yellow and the Output shapefile will turn Green.
Department of Civil Engineering 13 Texas A&M University

3) Double left click the Raster to Polygon tool and check to see if the input raster field has been populated with the watershed raster and also check the field bar to see that the Value has been inputted.
4) Change the name of the output shapefile by clicking on the Browse tab and directing it to the working directory, call this output raster as WSD_poly, and select ok. You will notice that the Green bubble is no more called Output raster but is called WSD_poly. Right click on the WSD_poly layer and enable Model Parameters and Add to Display.
10. Stream to feature
In this part of the exercise, you will add the Stream to Feature tool to the model builder. The input layers will be the Streams layer and the Flow Direction layer.
1) In ArcToolbox, open the Spatial Analysis/Hydrology toolbox. Drag the Stream to Feature tool to the model builder window. Two bubbles will be formed on the model builder window. One bubble will be called by default Stream to Feature and the other one will be the Output raster.
Department of Civil Engineering 14 Texas A&M University

2) Using the connector tool first connect the Streams bubble with the Stream to Feature bubble and then connect the Flow_dir layer to the Stream to Feature bubble. Automatically the Stream to Feature tool will turn Yellow and the Output shapefile will turn Green.
3) Double left click the Stream to Feature tool and check to see if the input raster field has been populated with the Streams raster and the Flow_dir raster in the correct fields.
4) Change the name of the output raster by clicking on the Browse tab and directing it to the working directory, call this output shapefile as Stream_lines, and select ok. You will notice that the Green bubble is no more called Output raster but is called Stream_lines. Right click on the Stream_lines layer and enable Model Parameters and Add to Display.
Department of Civil Engineering 15 Texas A&M University

11. Save and Run the Model
In this section of the exercise, you will save the model and then run it.
1) Click on the to save the model.
2) Click on the to run the model.
3) There are eight processes to complete. Hence, this will take some time. Be patient.
Department of Civil Engineering 16 Texas A&M University

4) After all the processes have been completed successfully, open ArcMap and view all the layers you have just created. 5) Drag the Stream_lines shapefile above the watershed_polygon shapefile. Change the Symbology of the WSD_polygon shapefile to Categories and add all the Gridcode values. Click ok.
12. Viewing reports and other properties In this section of the exercise, you will view reports, model properties and diagram properties.
1) Click on model in the main menu of the model builder window to view the reports, model properties and diagram properties.
Department of Civil Engineering 17 Texas A&M University

13. View the tool
In this section of the exercise, you will view the toolbox that you have just created using the model builder.
1) Close your model builder window
2) Double click on the WSD in ArcToolbox to open your toolbox. If the fields are already populated change the path to check your tool.
Department of Civil Engineering 18 Texas A&M University

14. Adding your tool to another Map document
In this section of the exercise, you will learn to add the newly created toolbox to another map document.
1) Right click on the toolbox watershed-delineation/properties.
2) Note the location. Open another Map document. Open ArcToolbox/Add Toolbox and direct it to the location of the toolbox, it will be in *.tbx format. Click ok to add the toolbox to a new map document.
Department of Civil Engineering 19 Texas A&M University