tevapharmaceuticalindustriesltd_20f_20130212
DESCRIPTION
TevaPharmaceuticalIndustriesLtd_20F_20130212TRANSCRIPT

Table of Contents
UNITED STATESSECURITIES AND EXCHANGE COMMISSION
WASHINGTON, D.C. 20549
FORM 20-F
¨ REGISTRATION STATEMENT PURSUANT TO SECTION 12(b) OR (g) OF THE SECURITIES EXCHANGE ACT OF 1934OR
x ANNUAL REPORT PURSUANT TO SECTION 13 OR 15(d) OF THE SECURITIES EXCHANGE ACT OF 1934For the fiscal year ended December 31, 2012
OR
¨ TRANSITION REPORT PURSUANT TO SECTION 13 OR 15(d) OF THE SECURITIES EXCHANGE ACT OF 1934For the transition period from to
Commission File number: 0-16174OR
¨ SHELL COMPANY REPORT PURSUANT TO SECTION 13 OR 15(d) OF THE SECURITIES EXCHANGE ACT OF 1934Date of event requiring this shell company report:
TEVA PHARMACEUTICAL INDUSTRIES LIMITED(Exact name of Registrant as specified in its charter)
Not Applicable(Translation of Registrant’s name into English)
ISRAEL(Jurisdiction of incorporation or organization)
5 Basel StreetP.O. Box 3190
Petach Tikva 49131, Israel(Address of principal executive offices)
Eyal DeshehChief Financial Officer
Teva Pharmaceutical Industries Limited5 Basel StreetP.O. Box 3190
Petach Tikva 49131, IsraelTel: 972-3-914-8171Fax: 972-3-914-8678
(Name, telephone, e-mail and/or facsimile number and address of Company contact person)Securities registered or to be registered pursuant to Section 12(b) of the Act.
Title of each class Name of each exchange on which registeredAmerican Depositary Shares, each representing one Ordinary Share New York Stock Exchange
Securities registered or to be registered pursuant to Section 12(g) of the Act.None
(Title of Class)Securities for which there is a reporting obligation pursuant to Section 15(d) of the Act.
None(Title of Class)
Indicate the number of outstanding shares of each of the issuer’s classes of capital or common stock as of the close of the period covered by the annual report.943,619,967 Ordinary Shares
696,251,654 American Depositary SharesIndicate by check mark if the registrant is a well-known seasoned issuer, as defined in Rule 405 of the Securities Act. Yes x No ¨If this report is an annual or transition report, indicate by check mark if the registrant is not required to file reports pursuant to Section 13 or 15(d) of the Securities Exchange Act of 1934. Yes ¨ No xNote—Checking the box above will not relieve any registrant required to file reports pursuant to Section 13 or 15(d) of the Securities Exchange Act of 1934 from their obligations under those Sections.Indicate by check mark whether the registrant (1) has filed all reports required to be filed by Section 13 or 15(d) of the Securities Exchange Act of 1934 during the preceding 12 months (or for such shorter period that
the registrant was required to file such reports), and (2) has been subject to such filing requirements for the past 90 days. Yes x No ¨Indicate by check mark whether the registrant has submitted electronically and posted on its corporate Web site, if any, every Interactive Data File required to be submitted and posted pursuant to Rule 405 of
Regulation S-T during the preceding 12 months (or for such shorter period that the registrant was required to submit and post such files). Yes x No ¨Indicate by check mark whether the registrant is a large accelerated filer, an accelerated filer, or a non-accelerated filer. See definition of accelerated filer and large accelerated filer in Rule 12b-2 of the Exchange Act.
(Check one):Large accelerated filer x Accelerated filer ¨ Non-accelerated filer ¨
Indicate by check mark which basis of accounting the registrant has used to prepare the financial statements included in this filing:
US GAAP
¨ International Financial Reporting Standards as issued by the International Accounting Standards Board
¨ OtherIf “Other” has been checked in response to the previous question, indicate by check mark which financial statement item the registrant has elected to follow.
¨ Item 17
¨ Item 18If this is an annual report, indicate by check mark whether the registrant is a shell company (as defined in Rule 12b-2 of the Exchange Act). Yes ¨ No x

Table of Contents
INDEX Page Introduction and Use of Certain Terms 1 Forward-Looking Statements 1
Part I Item 1: 2 Item 2: 2 Item 3: Key Information 2
Selected Financial Data 2 Operating Data 3 Balance Sheet Data 3 Dividends 4 Risk Factors 5
Item 4: Information on the Company 17 Introduction 17 Strategy 18 Product Offerings 20 Teva’s Markets 28 Operations and R&D 37 Research and Development 37 Operations 44 Environment 46 Organizational Structure 47 Properties and Facilities 48 Regulation 51
Item 4A: Unresolved Staff Comments 5 5 Item 5: Operating and Financial Review and Prospects 5 6
Introduction 5 6 Highlights 5 6 Results of Operations 58 Revenues 5 9 Other Income Statement Line Items 6 9 Supplemental Non-GAAP Income Data 74 Impact of Currency Fluctuations and Inflation 78 Critical Accounting Policies 78 Recently Issued Accounting Pronouncements 84 Liquidity and Capital Resources 84 Trend Information 87 Off-Balance Sheet Arrangements 88 Aggregated Contractual Obligations 88
Item 6: Directors, Senior Management and Employees 89 Directors and Senior Management 89 Executive Officers 89 Directors 89 Compensation 9 5 Board Practices 97 Statutory Independent Directors/Financial Experts 98 Committees of the Board 9 9 Employees 102 Share Ownership 102
Item 7: Major Shareholders and Related Party Transactions 103
(i)

Table of Contents
Page Item 8: Financial Information 104 Item 9: The Offer and Listing 105
ADSs 105 Ordinary Shares 105
Item 10: Additional Information 107 Memorandum and Articles of Association 107 Taxation 112 Documents on Display 117
Item 11: Quantitative and Qualitative Disclosures about Market Risk 118 General 118 Exchange Rate Risk Management 119 Interest Rate Risk Management 121
Item 12D: Description of Teva American Depositary Shares 123
Part II Item 15: Controls and Procedures 129 Item 16: [Reserved] 129 Item 16A: Audit Committee Financial Experts 129 Item 16B: Code of Ethics 129 Item 16C: Principal Accountant Fees and Services 130
Policy on Pre-Approval of Audit and Non-Audit Services of Independent Auditors 130 Principal Accountant Fees and Services 130
Item 16D: Exemptions from the Listing Standards for Audit Committees 131 Item 16E: Purchases of Equity Securities by the Issuer and Affiliated Purchasers 131 Item 16F: Change in Registrant’s Certifying Accountant 131 Item 16G: Corporate Governance 131 Item 16H: Mine Safety Disclosure 131
Part III Item 17: Financial Statements 132 Item 18: Financial Statements 132
Consolidated Financial Statements 132 Financial Statement Schedule 132
Item 19: Exhibits 133
Consolidated Financial Statements F-1 Financial Statement Schedule S-1
(ii)

Table of Contents
INTRODUCTION AND USE OF CERTAIN TERMSUnless otherwise indicated, all references to the “Company,” “we,” “our” and “Teva” refer to Teva Pharmaceutical Industries Limited and its
subsidiaries, and references to “revenues” refer to “net revenues.” References to “U.S. dollars,” “USD” and “$” are to the lawful currency of the United Statesof America, and references to “NIS” are to New Israeli shekels. Market share data is based on information provided by IMS Health Inc., a provider of marketresearch to the pharmaceutical industry (“IMS”), unless otherwise stated. References to “ROW” are to Rest of the World markets. References to “P&G” are toThe Procter & Gamble Company and references to “PGT” are to PGT Healthcare, the joint venture we formed with P&G.
FORWARD-LOOKING STATEMENTSThis annual report contains forward-looking statements, which express management’s current beliefs or expectations with regard to future events. You
can identify these statements by the fact that they do not relate strictly to historical or current facts. Such statements may include words such as “anticipate,”“estimate,” “expect,” “project,” “intend,” “plan,” “believe” and other words and terms of similar meaning in connection with any discussion of futureoperating or financial performance. In particular, these statements relate to, among other things:
• our business strategy;
• the development and launch of our products, including product approvals and results of clinical trials;
• projected markets and market size;
• anticipated results of litigation;
• our projected revenues, market share, expenses, net income margins and capital expenditures; and
• our liquidity.
The forward-looking statements contained herein involve a number of known and unknown risks and uncertainties that could cause our future results,performance or achievements to differ significantly from the results, performance or achievements expressed or implied by such forward-looking statements.
You should understand that many important factors, in addition to those discussed or incorporated by reference in this report, could cause our results todiffer materially from those expressed in the forward-looking statements. Potential factors that could affect our results include, in addition to others notdescribed in this report, those described under “Item 3—Key Information—Risk Factors.” These are factors that we think could cause our actual results todiffer materially from expected results.
Forward-looking statements speak only as of the date on which they are made, and we undertake no obligation to update any forward-looking statementsor other information contained in this report, whether as a result of new information, future events or otherwise. You are advised, however, to consult anyadditional disclosures we make in our reports on Form 6-K filed with the U.S. Securities and Exchange Commission (“SEC”). Please also see the cautionarydiscussion of risks and uncertainties under “Item 3—Key Information—Risk Factors” starting on page 5 of this report. This discussion is provided aspermitted by the Private Securities Litigation Reform Act of 1995.
1

Table of Contents
PART I ITEM 1: Identity of Directors, Senior Management and Advisors
Not applicable ITEM 2: Offer Statistics and Expected Timetable
Not applicable ITEM 3: KEY INFORMATION
Selected financial dataThe Israeli Securities Law allows Israeli companies, such as Teva, whose securities are listed both on the Tel Aviv Stock Exchange and on certain stock
exchanges in the U.S. (including the New York Stock Exchange), to report exclusively under the rules of the SEC and generally accepted accounting principlesin the United States (“U.S. GAAP”). Except as otherwise indicated, all financial statements and other financial information included in this annual report arepresented solely under U.S. GAAP.
The following selected operating data for each of the years in the three-year period ended December 31, 2012 and selected balance sheet data atDecember 31, 2012 and 2011 are derived from our audited consolidated financial statements set forth elsewhere in this report, which have been prepared inaccordance with U.S. GAAP. The selected operating data for each of the years in the two-year period ended December 31, 2009 and selected balance sheet dataat December 31, 2010, 2009 and 2008 are derived from our audited financial statements not appearing in this report, which have also been prepared inaccordance with U.S. GAAP.
The selected financial data should be read in conjunction with our consolidated financial statements, related notes and other financial informationincluded in this report.
The currency of the primary economic environment in which our operations in Israel and the United States are conducted is the U.S. dollar. Thefunctional currency of some subsidiaries and associated companies is their local currency.
2

Table of Contents
Operating Data
For the year ended December 31, 2012 2011 2010 2009 2008 U.S. dollars in millions (except per share amounts) Net revenues 20,317 18,312 16,121 13,899 11,085 Cost of sales 9 ,665 8,797 7,056 6,532 5,117 Gross profit 10,652 9,515 9,065 7,367 5,968 Research and development expenses—net 1,283 1,080 933 802 786 Selling and marketing expenses 3,879 3,478 2,968 2,676 1,842 General and administrative expenses 1,238 932 865 823 6 6 9 Impairments, loss contingencies, restructuring and others—net 1,974 901 410 638 124 Purchase of research and development in process 73 15 18 23 1,402 Operating income 2,205 3,109 3,871 2,405 1,145 Financial expenses—net 386 153 225 202 345 Income before income taxes 1,819 2,956 3,646 2,203 800 Provision for income taxes (137) 127 283 166 184 Share in losses of associated companies—net 46 61 24 33 1 Net income 1,910 2,768 3,339 2,004 615 Net income (loss) attributable to non-controlling interests (53) 9 8 4 6 Net income attributable to Teva 1,963 2,759 3,331 2,000 609 Earnings per share attributable to Teva:
Basic ($) 2.25 3.10 3.72 2.29 0.78 Diluted ($) 2.25 3.09 3.67 2.23 0.75
Weighted average number of shares (in millions): Basic 872 890 896 872 780 Diluted 873 893 921 896 820
Balance Sheet Data
As at December 31, 2012 2011 2010 2009 2008 (U.S. dollars in millions) Financial assets (cash, cash equivalents and marketable securities) 3,089 1,748 1,549 2,465 2,065 Working capital (operating assets minus liabilities) 3,589 3,937 3,835 3,592 3,944 Total assets 50,609 50,142 38,152 33,210 32,520
Short-term debt, including current maturities 3,006 4,280 2,771 1,301 2,906 Long-term debt, net of current maturities 11,712 10,236 4,110 4,311 5,475
Total debt 14,718 14,516 6,881 5,612 8,381 Total equity 22,867 22,343 22,002 19,259 16,438
3

Table of Contents
DividendsWe have paid dividends on a regular quarterly basis since 1986. Our dividend policy is regularly reviewed by the Board of Directors based upon
conditions then existing, including our earnings, financial condition, capital requirements and other factors. Our ability to pay cash dividends may berestricted by instruments governing our debt obligations. Dividends are declared and paid in NIS. Dividends are converted into U.S. dollars and paid by thedepositary of our American Depositary Shares (“ADSs”) for the benefit of owners of ADSs, and are subject to exchange rate fluctuations between the NIS andthe U.S. dollar between the declaration date and the date of actual payment.
Dividends paid by an Israeli company to shareholders residing outside Israel are generally subject to withholding of Israeli income tax at a rate of up to25%. Such tax rates apply unless a lower rate is provided in a treaty between Israel and the shareholder’s country of residence. In our case, the applicablewithholding tax rate will depend on the particular Israeli production facilities that have generated the earnings that are the source of the specific dividend and,accordingly, the applicable rate may change from time to time. A 15% tax will be withheld on the dividend declared for the fourth quarter of 2012.
The following table sets forth the amounts of the dividends declared in respect of each period indicated prior to deductions for applicable Israeliwithholding taxes (in cents per share). 2012 2011 2010 2009 2008 In cents per share 1st interim 26.3 23.2 18.8 14.5 13.1 2nd interim 25.0 23.5 18.1 15.1 12.9 3rd interim 25.7 21.9 19.3 15.9 11.8 4th interim 31.1 26.8 21.8 18.7 14.7
4

Table of Contents
Risk FactorsOur business faces significant risks. You should carefully consider all of the information set forth in this annual report and in our other filings with the
SEC, including the following risk factors which we face and which are faced by our industry. Our business, financial condition and results of operationscould be materially adversely affected by any of these risks. This report also contains forward-looking statements that involve risks and uncertainties. Ourresults could materially differ from those anticipated in these forward-looking statements, as a result of certain factors including the risks described below andelsewhere in this report and our other SEC filings. See “Forward-Looking Statements” on page 1.
Our success depends on our ability to develop and commercialize additional pharmaceutical products.Our financial results depend upon our ability to commercialize additional generic and innovative pharmaceutical products. Commercialization requires
that we successfully develop, test and manufacture both generic and innovative products. All of our products must receive regulatory approval and meet (andcontinue to comply with) regulatory and safety standards; if health or safety concerns arise with respect to a product, we may be forced to withdraw it fromthe market.
The development and commercialization process, particularly with respect to innovative products, is both time-consuming and costly and involves ahigh degree of business risk. Our products currently under development, if and when fully developed and tested, may not perform as we expect. Necessaryregulatory approvals may not be obtained in a timely manner, if at all, and we may not be able to produce and market such products successfully andprofitably. Delays in any part of the process or our inability to obtain regulatory approval of our products could adversely affect our operating results byrestricting or delaying our introduction of new products.
Our ability to introduce new generic products also depends upon our success in challenging patent rights held by third parties or in developing non-infringing products. Due to the emergence and development of competing products over time, our overall profitability depends on, among other things, ourability to introduce new products in a timely manner, to continue to manufacture products cost-effectively and to manage the life cycle of our product portfolio.
Sales of our innovative products, especially Copaxone , face increasing competition, including new orally-administered therapies andpotential generic versions.Any substantial decrease in the revenues derived from our innovative products would have an adverse effect on our results of operations. Several of our
innovative products currently face, or will soon face, intense competition.
For example, Copaxone , our leading innovative product, was responsible for a very significant contribution to our profits and cash flow fromoperations in 2012. To date, we have been successful in our efforts to establish Copaxone as the leading therapy for multiple sclerosis and have increased ourglobal market share among the currently available major therapies for multiple sclerosis. However, Copaxone faces intense competition from existinginjectable products, such as Avonex , Betaseron , Rebif , Extavia and Tysabri . In addition, competition from the rapidly developing market segment of oraltreatments, such as Gilenya , which was introduced in 2010 by Novartis, and Biogen’s BG-12, which is currently near commercialization, is expected to beespecially intense in light of the substantial convenience afforded by oral products in comparison to injectables such as Copaxone . Also, as discussed below,our patents on Copaxone have been challenged, and we may face generic competition prior to 2014, when the U.S. Orange Book patents covering Copaxonewould otherwise expire.
Our revenues and profits from generic pharmaceutical products typically decline as a result of competition, both from other pharmaceuticalcompanies and as a result of increased governmental pricing pressure.Our generic drugs face intense competition, Prices of generic drugs typically decline, often dramatically, especially as additional generic pharmaceutical
companies (including low-cost generic producers based in China
5
®
®
®
®
® ® ® ® ®
®
®
® ®

Table of Contents
and India), receive approvals and enter the market for a given product and competition intensifies. Consequently, our ability to sustain our sales andprofitability on any given product over time is affected by the number of new companies selling such product and the timing of their approvals.
In addition, intense pressure from government healthcare authorities, particularly in highly regulated European markets, to reduce their expenditures onprescription drugs has resulted in lower pharmaceutical pricing, causing decreases in revenues and profits.
Furthermore, brand pharmaceutical companies continue to defend their products vigorously. For example, brand companies often sell or license theirown generic versions of their products, either directly or through other generic pharmaceutical companies (so-called “authorized generics”). No significantregulatory approvals are required for authorized generics, and brand companies do not face any other significant barriers to entry into such market. Brandcompanies may also seek to delay introductions of generic equivalents, by:
• obtaining and enforcing new patents on drugs whose original patent protection is about to expire;
• filing patent infringement suits that automatically delay the approval of generic versions by the U.S. Food and Drug Administration (“FDA”);
• filing citizens’ petitions with the FDA contesting generic approvals on alleged health and safety grounds;
• questioning the quality and bioequivalence of generic pharmaceuticals;
• developing controlled-release or other slightly modified versions, which often reduce demand for the generic version of the existing product for
which we are seeking approval;
• making arrangements with managed care companies and insurers to reduce economic incentives to purchase generic versions;
• changing product claims and product labeling; and
• developing and marketing over-the-counter versions of brand products that are about to face generic competition.
These actions may increase the costs and risks of our efforts to introduce generic products and may delay or prevent such introduction altogether.
Our specialty pharmaceuticals business faces intense competition from companies that have greater resources and capabilities.We face intense competition in our specialty pharmaceutical business. Many of our competitors have substantially greater experience in the development
and marketing of branded, innovative and consumer-oriented products. They may be able to respond more quickly to new or emerging market preferences orto devote greater resources to the development and marketing of new products and/or technologies than we can. As a result, any products and/or innovationsthat we develop may become obsolete or noncompetitive before we can recover the expenses incurred in connection with their development. In addition, for theseproduct categories we must demonstrate to physicians, patients and third-party payors the benefits of our products relative to competing products that are oftenmore familiar or otherwise more well-established. If competitors introduce new products or new variations on their existing products, our marketed products,even those protected by patents, may be replaced in the marketplace or we may be required to lower our prices.
In addition, our increased focus on innovative and specialty pharmaceuticals requires much greater use of a direct sales force than does our core genericbusiness. Our ability to realize significant revenues from direct marketing and sales activities depends on our ability to attract and retain qualified salespersonnel. Competition for qualified sales personnel is intense. We may also need to enter into co-promotion, contract sales force or
6

Table of Contents
other such arrangements with third parties, for example, where our own direct sales force is not large enough or sufficiently well-aligned to achieve maximumpenetration in the market. Any failure to attract or retain qualified sales personnel or to enter into third-party arrangements on favorable terms could prevent usfrom successfully maintaining current sales levels or commercializing new innovative and specialty products.
Research and development efforts invested in our innovative pipeline may not achieve expected results.We must invest increasingly significant resources to develop innovative pharmaceuticals (including our strategic focus on developing new therapeutic
entities), both through our own efforts and through collaborations, in-licensing and acquisition of products from or with third parties. The development ofinnovative drugs involves processes and expertise different from those used in the development of generic drugs, which increases the risks of failure that weface. For example, the time from discovery to commercial launch of an innovative product can be 15 years or even longer, and involves multiple stages: notonly intensive preclinical and clinical testing, but also highly complex, lengthy and expensive approval processes which can vary from country to country.The longer it takes to develop a product, the less time there will be for us to recover our development costs and generate profits.
During each stage, we may encounter obstacles that delay the development process and increase expenses, leading to significant risks that we will notachieve our goals and may be forced to abandon a potential product in which we have invested substantial amounts of time and money. These obstacles mayinclude: preclinical failures; difficulty enrolling patients in clinical trials; delays in completing formulation and other work needed to support an applicationfor approval; adverse reactions or other safety concerns arising during clinical testing; insufficient clinical trial data to support the safety or efficacy of theproduct candidate; and failure to obtain, or delays in obtaining, the required regulatory approvals for the product candidate or the facilities in which it ismanufactured.
Because of the amounts required to be invested in augmenting our innovative pipeline, we are reliant on partnerships and joint ventures with thirdparties, and consequently face the risk that some of these third parties may fail to perform their obligations, or fail to reach the levels of success that we arerelying on to meet our revenue and profit goals. There is a trend in the innovative pharmaceutical industry of seeking to “outsource” drug development byacquiring companies with promising drug candidates, and we face substantial competition from historically innovative companies for such acquisitiontargets. Accordingly, our investment in research and development of innovative products can involve significant costs with no assurances of future revenues orprofits.
The success of our innovative products depends on the effectiveness of our patents, confidentiality agreements and other measures to protectour intellectual property rights.The success of our innovative products depends substantially on our ability to obtain patents and to defend our intellectual property rights. If we fail to
protect our intellectual property adequately, competitors may manufacture and market products identical or similar to ours. We have been issued numerouspatents covering our innovative products, and have filed, and expect to continue to file, patent applications seeking to protect newly developed technologies andproducts in various countries, including the United States. Currently pending patent applications may not result in issued patents or be approved on a timelybasis or at all. Any existing or future patents issued to or licensed by us may not provide us with any competitive advantages for our products or may bechallenged or circumvented by competitors.
We are currently engaged in lawsuits with respect to generic company challenges to the validity and/or enforceability of the patents covering Copaxone ,our leading innovative product, Azilect , Amrix , Fentora and Nuvigil . While we intend to defend the validity of these patents vigorously, and will seek touse all appropriate methods to prevent their infringement, such efforts are expensive and time consuming. Due to the nature of litigation, there can be noassurance that such efforts will be successful. Our ability to enforce our patents also depends on the laws of individual countries and each country’s practicesregarding the enforcement of intellectual property rights. The loss of patent protection or regulatory exclusivity on these or other innovative products couldmaterially impact our business, results of operations, financial conditions or prospects.
7
®
® ® ® ®

Table of Contents
We also rely on trade secrets, unpatented proprietary know-how, trademarks, data exclusivity and continuing technological innovation that we seek toprotect, in part by confidentiality agreements with licensees, suppliers, employees and consultants. If these agreements are breached, it is possible that we willnot have adequate remedies. Disputes may arise concerning the ownership of intellectual property or the applicability of confidentiality agreements.Furthermore, our trade secrets and proprietary technology may otherwise become known or be independently developed by our competitors or we may not beable to maintain the confidentiality of information relating to such products.
Decreasing opportunities to obtain U.S. market exclusivity for generic versions of significant products may adversely affect our revenuesand profits.Our ability to achieve continued growth and profitability through sales of generic pharmaceuticals is dependent on our success in challenging patents,
developing non-infringing products or developing products with increased complexity to provide launch opportunities with U.S. market exclusivity or limitedcompetition. The failure to continue to develop such opportunities could adversely affect our sales and profitability.
To the extent that we succeed in being the first to market a generic version of a significant product, and particularly if we are the only companyauthorized to sell during the 180-day period of exclusivity in the U.S. market, as provided under the Hatch-Waxman Act, our sales, profits and profitabilitycan be substantially increased in the period following the introduction of such product and prior to a competitor’s introduction of an equivalent product. Evenafter the exclusivity period ends, there is often continuing benefit from being the first generic product in the market.
The number of significant new generic products for which Hatch-Waxman exclusivity is available, and the size of those product opportunities, varysignificantly over time and are expected to decrease over the next several years in comparison to those available in the past. Patent challenges have become moredifficult in recent years. Additionally, we increasingly share the 180-day exclusivity period with other generic competitors, which diminishes the commercialvalue of the exclusivity.
The 180-day market exclusivity period is triggered by commercial marketing of the generic product or, in certain cases, can be triggered by a final courtdecision that is no longer subject to appeal holding the applicable patents to be invalid, unenforceable or not infringed. However, the exclusivity period can beforfeited by our failure to launch a product following such a court decision. The Hatch-Waxman Act also contains other forfeiture provisions that may deprivethe first “Paragraph IV” filer of exclusivity if certain conditions are met, some of which may be outside our control. Accordingly, we may face the risk that ourexclusivity period is triggered or forfeited before we are able to commercialize a product and therefore may not be able to exploit a given exclusivity period forspecific products.
We may not be able to find or successfully bid for suitable acquisition targets, or consummate and integrate future acquisitions.A core part of our strategy has been, and remains, growth through acquisitions as well as joint ventures and licensing and other transactions. For
example, we acquired Cephalon, Inc. in October 2011, Taiyo in July 2011, the ratiopharm-Merckle Group in August 2010, Barr Pharmaceuticals, Inc. inDecember 2008 and IVAX Corporation in January 2006, among others. Our rationale for acquisitions is, in part, predicated on our ability to realize certainrevenue and cost synergies. Achieving these synergies is dependent upon a number of factors, some of which are beyond our control. These synergies may notbe realized in the amount or time frame that we currently anticipate.
8

Table of Contents
We continue to be engaged in various stages of evaluating or pursuing potential acquisitions and other transactions and may in the future acquire otherpharmaceutical businesses and seek to integrate them into our own operations. Our reliance on acquisitions and other transactions as a means of growthinvolves risks that could adversely affect our future revenues and operating results. For example:
• We may fail to identify acquisitions and other transactions that would enable us to execute our business strategy.
• We compete with others for acquisitions and other transactions. We believe that this competition has intensified and may result in decreased
availability of, or increased prices for, suitable candidates.
• We may not be able to obtain necessary regulatory approvals, including those of competition authorities, and as a result, or for other reasons, we
may fail to consummate an announced acquisition.
• Potential acquisitions may divert management’s attention from our existing business operations, resulting in the loss of key customers and/or
personnel and exposing us to unanticipated liabilities.
• We may fail to integrate acquisitions successfully in accordance with our business strategy or achieve expected synergies.
• We may not be able to retain experienced management and skilled employees from the businesses we acquire and, if we cannot retain such
personnel, we may not be able to attract new skilled employees and experienced management to replace them.
• We may purchase a company that has excessive known or unknown contingent liabilities, including, among others, patent infringement or
product liability claims.
We significantly increased our leverage as a result of recent acquisitions.As a result of indebtedness we incurred in connection with acquisitions, our principal and interest payment obligations have increased substantially and
may increase further. The degree to which we are leveraged could affect our ability to obtain additional financing for working capital, acquisitions or otherpurposes and could make us more vulnerable to industry downturns and competitive pressures. In addition, due to the continuing effects of the worldwidefinancial crisis, capital markets have been more volatile in recent times. Such volatility may adversely affect our ability to obtain financing on favorableterms. Our ability to meet our debt service obligations will be dependent upon our future performance and access to financing, which will be subject tofinancial, business and other factors affecting our operations, many of which are beyond our control.
Manufacturing or quality control problems may damage our reputation for high quality production, demand costly remedial activities andnegatively impact our financial results.The pharmaceutical industry is subject to regulation by various governmental authorities. For instance, we must comply with requirements of the FDA,
European Medicines Agency and other healthcare regulators with respect to the manufacture, labeling, sale, distribution, marketing, advertising, promotionand development of pharmaceutical products. Failure to comply with these requirements may lead to financial penalties, compliance expenditures, the recall orseizure of products, total or partial suspension of production and/or distribution, suspension of the applicable regulator’s review of our submissions,enforcement actions, injunctions and criminal prosecution. We must register our facilities, whether located in the United States or elsewhere, with the FDA aswell as regulators outside the United States, and our products must be made in a manner consistent with current good manufacturing practices (“cGMP”), orsimilar standards in each territory in which we manufacture. In addition, the FDA and other agencies periodically inspect our manufacturing facilities.Following an inspection, an agency may issue a notice listing conditions that are believed to violate cGMP or other regulations, or a warning letter for violationsof “regulatory significance” that may result in enforcement action if not promptly and adequately corrected.
In recent years, there has been increasing regulatory scrutiny of pharmaceutical manufacturers, resulting in product recalls, plant shutdowns and otherrequired remedial actions. Several of our facilities have been the
9

Table of Contents
subject of significant regulatory actions, requiring substantial expenditures of resources to ensure compliance with more stringently applied production andquality control regulations. These regulatory actions also adversely affected our ability to supply various products worldwide and to obtain new productapprovals at such facilities. If any regulatory body were to require one or more of our significant manufacturing facilities to cease or limit production, ourbusiness could be adversely affected. In addition, because regulatory approval to manufacture a drug is site-specific, the delay and cost of remedial actions, orobtaining approval to manufacture at a different facility also could have a material adverse effect on our business, financial position and results of operations.
We may be susceptible to product liability claims that are not covered by insurance.Our business inherently exposes us to claims for injuries allegedly resulting from the use of our products. As we continue to expand our portfolio of
available products (including products sold by companies we have acquired), we have experienced a significant increase in both the number of productliability claims asserted against us and the number of products attracting personal injury claims, and we expect that trend to continue. During 2010 and 2011,juries awarded compensatory and punitive damages of approximately $800 million against us and our distributors in cases involving our propofol product.Although we have settled some of these cases, in the event of additional significant judgments, our financial results, financial condition and access to sourcesof liquidity could be materially adversely affected.
Moreover, we sell, and will continue to sell, certain pharmaceutical products that are not covered by insurance. In addition, products for which wecurrently have coverage may be excluded from coverage in the future. Recent insurance loss experience, including pharmaceutical product liability exposures,has increased the cost of, and narrowed the coverage afforded by, insurance for pharmaceutical companies, including us. In order to contain insurance costs,in recent years we have adjusted our coverage profile to accept a greater degree of un-insured exposure. Accordingly, certain claims may be subject to self-insurance retention, exceed our policy limits or relate to damages that are not covered by our policy. Because of the nature of these claims, we are generally notpermitted under U.S. GAAP to establish reserves in our accounts for such contingencies. Product liability coverage for pharmaceutical companies is becomingmore expensive and increasingly difficult to obtain and, as a result, we may not be able to obtain the type and amount of coverage we desire or to maintain ourcurrent coverage. In addition, where claims are made under insurance policies, insurers may reserve the right to deny coverage on various grounds.
Our agreements with brand pharmaceutical companies, which are important to our business, are facing increased government scrutiny inboth the U.S. and Europe.We are involved in numerous patent litigations in which we challenge the validity or enforceability of innovator companies’ listed patents and/or their
applicability to our products, and therefore settling patent litigations has been and is likely to continue to be an important part of our business. Parties to suchsettlement agreements in the U.S., including us, are required by law to file them with the Federal Trade Commission (“FTC”) and the Antitrust Division of theDepartment of Justice (“DOJ”) for review. The FTC has publicly stated that, in its view, some of the brand-generic settlement agreements violate the antitrustlaws and has brought actions against some brand and generic companies that have entered into such agreements. Accordingly, we may receive formal orinformal requests from the FTC for information about a particular settlement agreement, and there is a risk that the FTC may commence an action against usalleging violation of the antitrust laws.
Similarly, the EU Commission has placed our European operations, as well as those of several brand and generic companies, under intense scrutiny inconnection with its inquiry into possible anticompetitive conditions in the European pharmaceutical sector. Beginning in January 2008 and continuing through2010, for example, the EU Commission has conducted high-profile, unannounced raids on our European offices and those of many of our brand and genericcompetitors. In its July 2009 report, the EU Commission found that between 2000 and 2007, generic medicines did not reach the market on average until sevenmonths after expiration of the relevant patent, and it has asserted that the delays were due to settlement agreements with generic companies that delayed entry ofgeneric competition. The EU Commission has since then opened proceedings with respect to a number
10

Table of Contents
of settlement agreements, including two agreements Teva entered into in 2005 and 2006, for evidence of anticompetitive practices. Although Teva vigorouslyargues that those agreements did not restrict competition, the EU Commission may rule against Teva, possibly imposing fines. It is also possible that the EUCommission would open investigations relating to subsequent agreements Teva has entered into. More generally, there is a risk that the increased scrutiny ofthe European pharmaceutical sector may lead to changes in the regulation of our business that would have an adverse impact on our results of operations inEurope.
We have sold and may in the future elect to sell generic products prior to the final resolution of outstanding patent litigation, and, as a result,we could be subject to liability for damages in the U.S., Europe and other markets where we do business.Our ability to introduce new products depends in large part upon the success of our challenges to patent rights held by brand companies or our ability to
develop non-infringing products. Based upon a variety of legal and commercial factors, we may elect to sell a generic product even though patent litigation isstill pending, either before any court decision is rendered or while an appeal of a lower court decision is pending. The outcome of such patent litigation could,in certain cases, materially adversely affect our business. For example, we launched a generic version of Protonix (pantoprazole), despite the fact that litigationwith the company that sells the brand versions is still pending. Although the case remains subject to appeal, we received adverse decisions in the pantoprazolelitigation in 2011, and in 2012 we recorded a provision of $670 million related to this matter.
If we sell products prior to a final court decision, whether in the United States, Europe or elsewhere, and such decision is adverse to us, we could berequired to cease selling the infringing products, causing us to lose future sales revenue from such products and to face substantial liabilities for patentinfringement, in the form of either payment for the innovator’s lost profits or a royalty on our sales of the infringing products. These damages may besignificant, and could materially adversely affect our business. In the event of a finding of willful infringement, the damages may be up to three times theprofits lost by the patent owner. Because of the discount pricing typically involved with generic pharmaceutical products, patented brand products generallyrealize a significantly higher profit margin than generic pharmaceutical products. In addition, even if we do not suffer damages, we may incur significant legaland related expenses in the course of successfully defending against infringement claims.
Because we have substantial international operations, our sales and profits may be adversely affected by currency fluctuations andrestrictions as well as credit risks.In 2012, over 52% of our revenues came from sales outside the United States, a percentage that we expect to increase as we expand our non-U.S.
operations. As a result, we are subject to significant foreign currency risks, including repatriation restrictions in certain countries. An increasing amount of oursales, particularly in Latin America, Central and Eastern European countries and Asia, is recorded in local currencies, which exposes us to the direct risk ofdevaluations, hyperinflation or exchange rate fluctuations. We may also be exposed to credit risks in some of these markets. The imposition of price controlsor restrictions on the conversion of foreign currencies could also have a material adverse effect on our financial results.
In particular, although the majority of our net sales and operating costs is recorded in, or linked to, the U.S. dollar, our reporting currency, in 2012 werecorded sales and expenses in 34 other currencies. Approximately 57% of our operating costs in 2012 were incurred in currencies other than the U.S. dollar,particularly in euros, Israeli shekels, Hungarian forints, Canadian dollars, Japanese yen and the British pound. As a result, fluctuations in exchange ratesbetween the currencies in which such costs are incurred and the U.S. dollar may have a material adverse effect on our results of operations, the value ofbalance sheet items denominated in foreign currencies and our financial condition.
We use derivative financial instruments to manage some of our net exposure to currency exchange rate fluctuations in the major foreign currencies inwhich we operate. We do not use derivative financial instruments or other “hedging” techniques to cover all of our potential exposure, and some elements of ourconsolidated financial statements, such as our equity position or operating profit, are not fully protected against foreign currency exposures. Therefore, wecannot assure you that we will be able to limit all of our exposure to exchange rate fluctuations that could affect our financial results.
11
®

Table of Contents
Reforms in healthcare regulation and the uncertainty associated with pharmaceutical pricing, reimbursement and related matters couldadversely affect the marketing, pricing and demand for our products.The continuing increase in expenditures for healthcare has been the subject of considerable government attention almost everywhere we conduct
business, particularly as public resources have been stretched by significant financial and economic crises in the United States and Western Europeancountries. Both private health insurance funds and government health authorities are seeking ways to reduce or contain healthcare costs. In many countriesand regions where we operate, including the United States, Western Europe, Israel, Russia, certain countries in Central and Eastern Europe and severalcountries in Latin America, pharmaceutical prices are subject to new government policies. These changes may cause delays in market entry or adversely affectpricing and profitability. We cannot predict which measures may be adopted or their impact on the marketing, pricing and demand for our products.
In addition, “tender systems” for generic pharmaceuticals have been implemented (by both public and private entities) in a number of significantmarkets in which we operate, such as Germany and Russia, in an effort to lower prices. Under such tender systems, manufacturers submit bids thatestablish prices for generic pharmaceutical products. These measures impact marketing practices and reimbursement of drugs and may further increasepressure on competition and reimbursement margins. Certain other countries may consider the implementation of a tender system. Failing to win tenders, or theimplementation of similar systems in other markets leading to further price declines, could have a material adverse affect on our business, financial positionand results of operations.
Any failure to comply with the complex reporting and payment obligations under the Medicare and Medicaid programs may result in furtherlitigation or sanctions, in addition to the lawsuits that we have previously announced.The U.S. laws and regulations regarding Medicare and/or Medicaid reimbursement and rebates and other governmental programs are complex. Some of
the applicable laws may impose liability even in the absence of specific intent to defraud. The subjective decisions and complex methodologies used in makingcalculations under these programs are subject to review and challenge, and it is possible that such reviews could result in material changes. A number of stateattorneys general and others have filed lawsuits alleging that we and other pharmaceutical companies reported inflated average wholesale prices, leading toexcessive payments by Medicare and/or Medicaid for prescription drugs. Such allegations could, if proven or settled, result in additional monetary penalties(beyond the lawsuits we have already settled) and possible exclusion from Medicare, Medicaid and other programs. In addition, we are notified from time totime of governmental investigations regarding drug reimbursement or pricing issues.
Governmental investigations into sales and marketing practices, particularly for our specialty pharmaceutical products, may result insubstantial penalties.We operate around the world in complex legal and regulatory environments, and any failure to comply with applicable laws, rules and regulations may
result in civil and/or criminal legal proceedings. As those rules and regulations change or as interpretations of those rules and regulations evolve, our priorconduct or that of companies we have acquired may be called into question. In the United States, we are currently responding to federal investigations into ourmarketing practices with regard to several of our specialty pharmaceutical products, which could result in civil litigation brought on behalf of the federalgovernment. Responding to such investigations is costly and involves a significant diversion of management’s attention. Such proceedings are unpredictableand may develop over lengthy periods of time. Consequently, we have in the past entered into settlement agreements with governmental authorities, includingcorporate integrity agreements, and may do so in the future. Future settlements may involve large cash penalties that could have a material adverse effect on ourresults of operations or cash flows.
12

Table of Contents
Regulations to permit the sale of biotechnology-based products as biosimilar drugs, primarily in the United States, may be delayed, or mayotherwise jeopardize our investment in such products.We have made, and expect to continue to make, substantial investments in our ability to develop and produce biotechnology-based products, which
require significantly greater early-stage financial commitments than “small-molecule” generic product development. Although some of these products may besold as innovative products, one of our strategic goals in making these investments is to position Teva at the forefront of the development of biosimilar genericversions of currently marketed biotechnology products. To date, in many markets, there does not yet exist a legislative or regulatory pathway for theregistration and approval of such “biogeneric” products. Significant delays in the development of such pathways, or significant impediments that may bebuilt into such pathways, could diminish the value of the investments we have made and will continue to make in our biotechnology capabilities. For example,in the healthcare reform legislation adopted in the United States, biosimilar products may not be approved for twelve years following approval of the brandedbiotechnology product. As a result, generic competition may be delayed significantly, adversely affecting our ability to develop a successful biosimilarsbusiness. The FDA is in the process of establishing regulations relating to biosimilars to implement the new healthcare legislation. These regulations, whenultimately adopted, could further complicate the process of bringing biosimilar products to market on a timely basis and could thus adversely affect ourability to develop a successful biosimilars business. While the FDA has issued guidelines, their guidelines contained features that could significantly prolongthe biosimilar development process and failed to address other important concerns.
We have significant operations in countries that may be adversely affected by political or economic instability, corruption, major hostilities oracts of terrorism.We are a global pharmaceutical company with worldwide operations. Although over 78% of our sales are in North America and Western Europe, we
expect to derive an increasing portion of our sales and future growth from other regions such as Latin America and Central and Eastern Europe, which may bemore susceptible to political and economic instability and corruption. There has been a substantial increase in law enforcement activity related to the U.S.Foreign Corrupt Practices Act (the “FCPA”) and similar anti-corruption laws in other jurisdictions. Our policies mandate compliance with these laws, but ourinternal controls may not always protect us from actions taken by our employees or third-party intermediaries that may violate the FCPA or other anti-corruption laws. Any violations by our employees or third-party intermediaries of anti-corruption laws during the performance of their obligations for us mayhave a material adverse effect on our reputation and our business, financial condition or results of operations.
As previously reported, beginning in 2012, Teva received subpoenas and informal document requests from the SEC and the Department of Justice toproduce documents with respect to compliance with the FCPA in certain countries. Teva has identified issues that could potentially rise to the level of FCPAviolations and has brought them to the attention of the SEC and the Department of Justice. These matters are in their early stages and no conclusions can bedrawn at this time as to any likely outcomes.
Significant portions of our operations are conducted outside the markets in which our products are sold, and accordingly we often import a substantialnumber of products into such markets. We may, therefore, be denied access to our customers or suppliers or denied the ability to ship products from any ofour sites as a result of a closing of the borders of the countries in which we sell our products, or in which our operations are located, due to economic,legislative, political and military conditions, including hostilities and acts of terror, in such countries.
Our executive offices and a substantial percentage of our manufacturing capabilities are located in Israel. Our Israeli operations are dependent uponmaterials imported from outside Israel. We also export significant amounts of products from Israel. Accordingly, our operations could be materially andadversely affected by acts of terrorism or if major hostilities were to occur in the Middle East or trade between Israel and its present trading partners werecurtailed, including as a result of acts of terrorism in the U.S. or elsewhere.
13
Table of Contents
The manufacture of our products is highly complex, and an interruption in our supply chain or problems with internal or third partyinformation technology systems could adversely affect our results of operations.Our products are either manufactured at our own facilities or obtained through supply agreements with third parties. Many of our products are the result
of complex manufacturing processes, and some require highly specialized raw materials. For some of our key raw materials, we have only a single, externalsource of supply, and alternate sources of supply may not be readily available. For example, we purchase raw materials for most of our oral contraceptiveproducts, which make up a substantial portion of our women’s health business, exclusively or primarily from the same external source. If our supply ofcertain raw materials or finished products is interrupted from time to time, or proves insufficient to meet demand, our results of operations could be adverselyimpacted.
We also rely on complex shipping arrangements throughout the various facilities of our supply chain spectrum. Customs clearance and shipping byland, air or sea routes rely on and may be affected by factors that are not in our full control or are hard to predict.
In addition, we rely on complex information technology systems, including Internet-based systems, to support our supply-chain processes as well asinternal and external communications. The size and complexity of our systems make them potentially vulnerable to breakdown or interruption, whether due tocomputer viruses or other causes that may result in the loss of key information or the impairment of production and other supply chain processes. Suchdisruptions and breaches of security could adversely affect our business.
The failure to recruit or retain key personnel, or to attract additional executive and managerial talent, could adversely affect our business .Given the increasing size, complexity and global reach of our business and our multiple areas of focus, each of which would be a significant stand-alone
company, we are especially reliant upon our ability to recruit and retain highly qualified management and other employees. In 2012 we transformed much ofour senior management team including a new chief executive officer, chief scientific officer, head of global operations, head of Americas generics and head ofour European operations, among others, who will have a significant effect upon our business results. In addition, the success of our research and developmentactivities depends on our ability to attract and retain sufficient numbers of skilled scientific personnel. Any loss of service of key members of ourorganization, or any diminution in our ability to continue to attract high-quality employees, may delay or prevent the achievement of major business objectives.
Sales of our products may be adversely affected by the continuing consolidation of our customer base.A significant proportion of our sales is made to relatively few U.S. retail drug chains, wholesalers, managed care purchasing organizations, mail order
distributors and hospitals. These customers are continuing to undergo significant consolidation. Net sales to one such customer in 2012 accounted for 14% ofour total consolidated sales. Such consolidation has provided and may continue to provide them with additional purchasing leverage, and consequently mayincrease the pricing pressures that we face. Additionally, the emergence of large buying groups representing independent retail pharmacies, and the prevalenceand influence of managed care organizations and similar institutions, enable those groups to extract price discounts on our products.
Our net sales and quarterly growth comparisons may also be affected by fluctuations in the buying patterns of retail chains, major distributors andother trade buyers, whether resulting from seasonality, pricing, wholesaler buying decisions or other factors. In addition, since such a significant portion ofour U.S. revenues is derived from relatively few customers, any financial difficulties experienced by a single customer, or any delay in receiving paymentsfrom a single customer, could have a material adverse effect on our business, financial condition and results of operations.
Because our facilities are located throughout the world, we are subject to varying patent laws that may adversely affect our ability tomanufacture our products.We are subject to legislation in all countries where we have manufacturing facilities relating to patents. Modifications of such legislation or court
decisions regarding such legislation may adversely affect us and may impact our ability to export product manufactured in any such country in a timelyfashion. Additionally, the
14

Table of Contents
existence of third-party patents in such countries, with the attendant risk of litigation, may cause us to move production to a different country (with potentiallyserious timing delays) or otherwise adversely affect our ability to export certain products from such countries. For example, legislation is currently pending inIsrael that may affect the duration of patent term extension provisions.
The increasing amount of intangible assets and goodwill recorded on our balance sheet may continue to lead to significant impairmentcharges in the future.We regularly review our long-lived assets, including identifiable intangible assets and goodwill, for impairment. Goodwill and acquired indefinite life
intangible assets are subject to impairment review at least annually. Other long-lived assets are reviewed when there is an indication that an impairment mayhave occurred. The amount of goodwill and identifiable intangible assets on our consolidated balance sheet has increased significantly to $26.6 billion as aresult of our acquisitions, and may increase further following future acquisitions. For example, in 2012, we recorded impairment charges of $1.1 billion.Impairment testing under U.S. GAAP may lead to further impairment charges in the future. In addition, we may from time to time sell assets that we determineare not critical to our strategy or execution. Future events or decisions may lead to asset impairments and/or related charges. Certain non-cash impairments mayresult from a change in our strategic goals, business direction or other factors relating to the overall business environment. Any significant impairment chargescould have a material adverse effect on our results of operations.
Our tax liabilities could be larger than anticipated.We are subject to tax in many jurisdictions, and significant judgment is required in determining our provision for income taxes. Likewise, we are subject
to audit by tax authorities in many jurisdictions. In such audits, our interpretation of tax legislation might be challenged and tax authorities in variousjurisdictions may disagree with, and subsequently challenge, the amount of profits taxed in such jurisdictions under our inter-company agreements. Forexample, the Israeli Tax Authority has issued decrees for an additional $903 million in taxes with respect to the years 2005-2007. Although we believe ourestimates are reasonable, the ultimate outcome of such audits and related litigation could be different from our provision for taxes and might have a materialadverse effect on our consolidated financial statements.
Termination or expiration of governmental programs or tax benefits could adversely affect our overall effective tax rate.Our tax expenses and the resulting effective tax rate reflected in our consolidated financial statements are likely to increase over time as a result of
changes in corporate income tax rates, other changes in the tax laws of the various countries in which we operate or changes in the mix of countries where wegenerate profit. We have benefited or currently benefit from a variety of Israeli and other government programs and tax benefits that generally carry conditionsthat we must meet in order to be eligible to obtain such benefits. If we fail to meet the conditions upon which certain favorable tax treatment is based, we wouldnot be able to claim future tax benefits and could be required to refund tax benefits already received. Additionally, some of these programs and the related taxbenefits are available to us for a limited number of years, and these benefits expire from time to time.
Any of the following could have a material effect on our overall effective tax rate:
• some governmental programs may be discontinued,
• we may be unable to meet the requirements for continuing to qualify for some programs,
• these programs and tax benefits may be unavailable at their current levels,
• upon expiration of a particular benefit, we may not be eligible to participate in a new program or qualify for a new tax benefit that would offset the
loss of the expiring tax benefit, or
• we may be required to refund previously recognized tax benefits if we are found to be in violation of the stipulated conditions.
15

Table of Contents
Our failure to comply with applicable environmental laws and regulations worldwide could adversely impact our business and results ofoperations.We are subject to laws and regulations concerning the environment, safety matters, regulation of chemicals and product safety in the countries where we
manufacture and sell our products or otherwise operate our business. These requirements include regulation of the handling, manufacture, transportation,storage, use and disposal of materials, including the discharge of pollutants into the environment. In the normal course of our business, we are exposed torisks relating to possible releases of hazardous substances into the environment, which could cause environmental or property damage or personal injuries,and which could require remediation of contaminated soil and groundwater. Under certain laws, we may be required to remediate contamination at certain ofour properties, regardless of whether the contamination was caused by us or by previous occupants of the property.
16

Table of Contents
ITEM 4: INFORMATION ON THE COMPANY
IntroductionTeva Pharmaceutical Industries Limited (“Teva”) is a fully-integrated global pharmaceutical company. Our business includes three primary areas:
generic, specialty and over-the-counter (“OTC”) medicines. As the world’s largest generic company with an established specialty medicines portfolio, Teva isstrategically positioned to benefit from the current changes in the global healthcare environment.
Teva’s business strategy seeks to capitalize on the growing global need for medicines and evolving market, economic and legislative dynamics. Thesechanges include aging populations, increased spending on pharmaceuticals in emerging market countries, economic pressures on governments and privatepayors to provide cost-effective healthcare solutions, global evolution in healthcare, legislative reforms, unmet patient needs, an increase in patient awarenessand the growing importance of OTC medicines.
We believe that our strategy, dedicated employees, world-leading generic expertise and portfolio, global reach, integrated R&D capabilities, globalinfrastructure and scale position us at the forefront of a changing industry and will enable us to take advantage of opportunities created by these dynamics.These strengths are expressed across our business, as follows:
• Teva is a leader in the global generic drug industry. We have held the leading position in the United States for almost a decade, and are also the
leading generic drug company in Europe, where we have a balanced presence throughout the region. In addition, we have a major presence inRussia, are growing in Latin America, have begun to establish a major presence in Japan and recently entered the South Korean market.
• We have a specialty pharmaceutical business with a growing late-stage pipeline, focused on the central nervous system (“CNS”) and respiratory
therapeutic areas, with selective investments in oncology, women’s health and certain other areas.
• We have an important and growing global OTC business, primarily through our joint venture with The Procter & Gamble Company (“P&G”),
which combines our production capabilities and market reach with P&G’s marketing expertise and expansive global platform.
• We are one of the world’s leading manufacturers of active pharmaceutical ingredients (“APIs”), with operations around the globe, and we produce
APIs not only for our own use but also for many other pharmaceutical companies. Our growing API business and extensive access to importanttherapeutic molecules provides a basis for expansion into new product areas.
• Our broad technological capabilities enable us to provide an unparalleled array of products. These capabilities include solid dose manufacturing,
formulation expertise, complex APIs and injectable, inhalation and other delivery devices.
• Our specialty medicines business provides a range of key products to patients in significant areas of medical need, and is complemented by ourindustry-leading support services organization, “Shared Solutions,” which helps patients with critical diseases secure reimbursement, ensurestimely arrival and administration of medicines and assists with adherence. This program, which originated in the United States for patients withmultiple sclerosis, is being introduced in other regions for patients with other diseases.
In 2012, approximately 51% of our revenues were generated from generic medicines, including APIs sold to third parties. Approximately 40% of ourrevenues were generated from specialty medicines, primarily Copaxone for relapsing remitting multiple sclerosis, as well as Azilect for Parkinson’s disease,Provigil and Nuvigil for sleep disorders, ProAir HFA, Qvar and other respiratory products, our women’s health products, Treanda for certainhematological cancers, and others. Our remaining revenues were generated from our OTC business, primarily our joint venture with P&G, and our otheractivities, primarily our Hungarian and Israeli distribution services for third parties.
17
® ®
® ® ® ® ®

Table of Contents
In 2012, we generated approximately 51% of our revenues in the United States, approximately 28% in Europe (which for the purpose of this reportincludes all European Union (“EU”) member states, Norway and Switzerland) and approximately 21% in our ROW markets (primarily Japan, Canada,Latin America, Israel and Russia). For a three year breakdown of our revenues by business line and by geography, see “Item 5—Operating and FinancialReview and Prospects—Results of Operations.”
Teva was incorporated in Israel on February 13, 1944, and is the successor to a number of Israeli corporations, the oldest of which was established in1901. Our executive offices are located at 5 Basel Street, P.O. Box 3190, Petach Tikva 49131, Israel, and our telephone number is +972-3-926-7267. Ourwebsite is www.tevapharm.com.
StrategyFollowing the appointment in mid-2012 of our new Chief Executive Officer, Dr. Jeremy M. Levin, and with the support of our Board of Directors, we
undertook a thorough review of our business to improve current performance and best position Teva for the future. This review identified existing strengths,capabilities and opportunities throughout the organization and enabled a deeper understanding of the evolution of the pharmaceutical market and the resultingnew opportunities. These findings were used to define a strategy that positions Teva to take advantage of opportunities throughout the global markets where weoperate.
The core principle of our approach is a commitment to tailoring our specialty, generic and OTC medicines to the needs of individual markets and toproviding relevant options for patients, physicians and customers. We recognize that fundamental changes are required to meet the changing demands of aglobal healthcare landscape. We will seek to meet the needs of all of our stakeholders by leveraging our geographic reach, focused specialty medicines portfolio,integrated R&D programs, world-class manufacturing and distribution capabilities and pricing flexibility to achieve a balanced and integrated approach togeneric, specialty and OTC medicines.
Our strategy is designed to make Teva the most indispensable medicines company in the world, and consists of six major pillars:
• Accelerating our growth platforms. In our generics business, we plan to focus on high-value medicines, medicines with higher barriers to entryand branded generics. In the United States, we will continue to extract maximum value from Paragraph IV patent challenge opportunities, and weintend to establish a leadership position in high-value generics by pursuing first-to-market opportunities and by developing complex genericproducts, as well as by enhancing the value of our portfolio by concentrating on high-margin, low competition markets. In Europe, we will focuson profitable growth, leveraging the synergies with our specialty and OTC medicines. In our ROW markets, we will make use of our globalfootprint, portfolio, branded generics and market knowledge to ensure sustainable and profitable growth. In all markets, we will work closelywith our customers to strengthen and maintain high value, mutually beneficial relationships.
We will augment our commercial growth strategy in generics with our R&D capabilities in order to sustain our advantages in complex oral andinhalation delivery methods and grow our capabilities in other complex technologies, such as injectables, liposomal drug delivery, long-actingrelease and others.
• Extending our global presence. In countries where we already have a strong presence, such as Russia and Japan, we plan to enhance and refineour portfolio to meet local needs, and seek to increase our presence in order to achieve market leadership. In other markets, we will grow ourexisting business to obtain a critical mass. We will also expand our early stage businesses in markets such as South Korea, China and India, andseek to enter new markets such as Brazil and certain South East Asia markets. In some cases we will implement these efforts throughpartnerships and in other cases, through direct investment in local markets. In our specialty business, we are continuing the global expansion ofour
18

Table of Contents
existing products into new markets, leveraging on our proven success, technologies, patient understanding and capabilities originally developed inthe United States market. For OTC medicines, we are planning to increase the presence of our joint venture with P&G in emerging markets, andto expand existing local brands into new geographies.
• Executing strategic business development. Our approach to business development will be highly strategic, disciplined and focused onenhancing our core specialty franchises, primarily in the “CNS” and respiratory therapeutic areas, and making selective investments in new orgrowing geographies. We will balance investment in growth with return to investors and allocate our capital resources accordingly. In the near term,we plan to focus on executing a constellation of related small to mid-size transactions, alliances in key areas and licensing opportunities. Inaddition, we will continue to divest assets that are not part of our core strategy.
• Protecting and expanding our core franchises. We will vigorously protect and expand our multiple sclerosis (“MS”) franchise and exploreopportunities to expand into other neurodegenerative and CNS diseases. Our intent remains, as always, to provide patients with the best and safesttreatments for their diseases. Building on our record of supporting and helping patients with chronic conditions, we will also enhance our presencein pain treatment with our current and new opioid-based assets and investigate other non-opioid alternatives. In the respiratory therapeutic area, wewill improve the life cycle of our current products, develop existing molecules on our innovative Spiromax platform, and investigate newtechnological platforms and disease areas. Finally, for biologic medicines, we will seek to create a differentiated program, based on novel biologicsand bio-betters, and selectively invest in bio-similars. In addition, we will make selective investments in women’s health, oncology and otherareas.
As part of our strategy to expand our specialty business, we plan to focus on new therapeutic entities (“NTEs”), which are known molecules thatare formulated, delivered or used in a novel way to address specific patient needs. As a result of our strength in integrated generic and specialtyR&D, our scalable production network and market access and knowledge, we believe this area represents a substantial opportunity for growth.We are also seeking to improve our existing medicines and make them more convenient and potentially more efficacious.
• Reducing our operating costs. We will also introduce initiatives designed to reduce our overall operating costs and complexity through a wide-
scale cross-functional effort to create a more efficient organization. We are focusing particular attention on improving our procurement systems byleveraging our purchasing power and improving our production network, supply chain, and resource deployment processes.
• Developing, retaining and recruiting world-class employees. We will build on and sustain our culture of execution, excellence, cultural
diversity, cross-company collaboration and successful entrepreneurism to support the continued growth and development of Teva as a truly globalpharmaceutical company.
Transaction Highlights
The transactions described below are some of the important steps we took during the past two years to advance our long-term goals:
• Animal Health: In January 2013, we sold our U.S.-based animal health business, exiting the business.
• South Korea Business Venture: In December 2012, we formed a business venture in South Korea with Handok Pharmaceutical Co., Ltd.
(“Handok”). We will be responsible for manufacturing and supplying a wide range of generic and innovative medicines, and Handok will beresponsible for sales and marketing, distribution, and regulatory affairs.
• XEN402: In December 2012, we entered into a collaborative development and exclusive worldwide license agreement with Xenon Pharmaceuticals
Inc. (“Xenon”) for its compound XEN402. XEN402 targets sodium channels found in sensory nerve endings that can increase in chronic painfulconditions, and is currently in Phase II clinical development for a variety of pain-related disorders.
19
®

Table of Contents
• Neurosearch A/S Assets: In October 2012, we acquired from Neurosearch A/S, a Danish company, the rights, assets and obligations relating to
Huntexil (pridopidine / ACR16), a drug candidate being developed for the symptomatic treatment of hand movement, balance and gaitdisturbances in patients with Huntington’s disease.
• PGT Consumer Healthcare: In November 2011, we formed a consumer health care joint venture with P&G, combining our OTCpharmaceutical businesses in all markets outside North America. We manufacture products to supply the joint venture’s markets as well asP&G’s existing North American OTC business. We own 49% of the joint venture, and P&G owns 51%. As of December 2012, the OTCproducts of Cephalon (Mepha) were included in the joint venture.
• Cephalon: In October 2011, we acquired Cephalon, Inc. (“Cephalon”), a global biopharmaceutical company with a marketed portfolio and
pipeline of specialty products. This acquisition helped to diversify our specialty portfolio and enhance our innovative pipeline.
• CureTech: In September 2011, we exercised an option to invest $19 million in CureTech Ltd. (“CureTech”), a biotechnology company. We also
agreed to make further investments in CureTech’s research and development activities. As a result of the option exercise, our ownership stake inCureTech increased from 33% to 75%. In January 2013, we announced the termination of our collaboration with CureTech.
• Japanese Transactions: In July 2011, we acquired Taiyo Pharmaceutical Industry Co. Ltd. (“Taiyo”). Taiyo had developed a large portfolio ofgeneric products in Japan, with over 550 marketed products, and had advanced production facilities. In September 2011, we acquired theremaining shares in Taisho Pharmaceutical Industries, Ltd. and the remaining 50% of our Japanese joint venture with Kowa Company Ltd. thatwe did not already own. Since April 2012, the majority of our Japan-based companies have operated under a single company known as TevaSeiyaku.
• Corporación Infarmasa: In January 2011, we acquired Corporación Infarmasa, a company in Peru with over 500 branded and unbranded
generic pharmaceuticals.
• Laboratoire Théramex: In January 2011, we acquired Laboratoire Théramex, whose product portfolio includes a variety of women’s health
products sold in over 50 countries, primarily in Europe.
Product Offerings
Generic ProductsGeneric pharmaceuticals are the chemical and therapeutic equivalents of originator pharmaceuticals and are typically sold at prices substantially below
those of the originator’s product. Generics are required to meet similar governmental regulations as their brand-name equivalents offered or sold by theoriginator, such as those relating to manufacturing processes and U.S. Food and Drug Administration (“FDA”) inspections, and must receive regulatoryapproval prior to their sale in any given country. In the United States, the world’s largest generic market, generic pharmaceuticals may be manufactured andmarketed if relevant patents on their brand-name equivalents (and any additional government-mandated market exclusivity periods) have expired or have beenchallenged and invalidated or otherwise circumvented.
We manufacture and sell generic pharmaceutical products in a variety of dosage forms, including tablets, capsules, ointments, creams, liquids,injectables and inhalants. We offer a broad range of basic chemical entities, as well as specialized product families such as sterile products, hormones,narcotics, high-potency drugs and cytotoxic substances, in both parenteral and solid dosage forms.
Sales of generic pharmaceuticals have benefitted from increased awareness and acceptance on the part of healthcare insurers and institutions,consumers, physicians and pharmacists globally. Factors contributing to this
20
®

Table of Contents
increased awareness are the passage of legislation permitting or encouraging generic substitution and the publication by regulatory authorities of lists ofequivalent pharmaceuticals, which provide physicians and pharmacists with generic alternatives. In addition, various government agencies and many privatemanaged care or insurance programs encourage the substitution of generics for brand-name pharmaceuticals as a cost-savings measure in the purchase of, orreimbursement for, prescription pharmaceuticals. Further, in countries as diverse as France, Japan and Brazil, governments are issuing regulations designedto increase generic penetration. We believe that these factors, together with an aging population, an increase in global spending on pharmaceuticals, economicpressure on governments to provide less expensive healthcare solutions, legislative reforms and a shift of decision-making power to payors, should lead tocontinued expansion of the global generic pharmaceuticals market.
In markets such as the United States, the United Kingdom, the Netherlands and Israel, generic pharmaceuticals are substituted by the pharmacist fortheir brand name equivalent. In these so-called “pure generic” markets, physicians or patients have little control over the choice of generic manufacturer, andconsequently generic drugs are not actively marketed or promoted to physicians. Instead, the relationship between the manufacturer and pharmacy chains anddistributors, health funds, and other health insurers is critical. In contrast, in Russia, some Asian and Latin American countries as well as certain Europeanmarkets, generics are sold under brand names alongside the originator brand. In many of these “branded generic” markets, pharmacists dispense the specificpharmaceutical product prescribed by the physician, and substitution between originator brand, branded generic and/or generic manufacturers is often limitedwithout the physician’s consent. In some of these markets, branded generic products are actively promoted and a sales force is necessary. Other markets, suchas Germany, France, Italy and Spain, are hybrid markets with elements of both approaches.
Through coordinated global research and development activities, we seek to establish leadership in high-value generics, both by pursuing first-to-marketopportunities and by developing complex generic products. Our generic product development strategy is to continue to extract maximum value from ParagraphIV patent challenges opportunities in the United States and early launches globally, while establishing a leadership position in high-barrier, complex products.We intend to further enhance the value of our remaining portfolio by focusing on high-margin, low competition products.
When considering whether to develop a generic medicine, we take into account a number of factors including our overall strategy, regional and localpatient and customer needs, R&D recommendations, manufacturing capabilities, regulatory considerations, commercial factors and intellectual propertyrestrictions. We actively seek opportunities to challenge patents, if we believe they are either invalid or would not be infringed by a generic version. We mayseek alliances to acquire rights to products we do not have or to otherwise share development costs or litigation risks, or to resolve patent barriers to entry.
Our generic R&D organization, which has capabilities in a wide range of dosage forms and therapeutic areas as well as in specialized product families,has been integrated with our specialty R&D organization in order to maximize our ability to identify and act upon new opportunities.
Our position in the generics market is supported by our API R&D and manufacturing activities, which provide significant vertical integration for ourown products. APIs used in pharmaceutical products are subject to regulatory oversight by national health authorities. We produce approximately 300 APIs forour own use and for sale to third parties in many therapeutic areas, including respiratory, cardiovascular, anti-cholesterol, central nervous system,dermatological, hormones, anti-inflammatory, oncology, immunosuppressants and muscle relaxants. We utilize a variety of production technologies, includingchemical synthesis, semi-synthetic fermentation, enzymatic synthesis, high potency manufacturing, plant extract technology and peptides synthesis. Ouradvanced technology and expertise in the field of solid state particle technology enable us to meet specifications for particle size distribution, bulk density,specific surface area, polymorphism, as well as other characteristics. In selling our API products, we compete globally with other specialty chemicalproducers.
21

Table of Contents
Specialty ProductsOur specialty medicines business, which is focused on delivering innovative solutions to patients and providers via medicines, devices and services in
all key regions and markets around the world, includes several core franchises, most significantly medicines for CNS disorders (with a strong emphasis onMS, neurodegenerative disorders, and pain) and respiratory medicines. We also have specialty products in oncology (including biologics), women’s health,and other areas. Our specialty business also includes our emerging NTE activity, which focuses on enhancing known molecules through new deliverymethods, unique combinations or device innovations to address specific patient needs.
Our specialty medicines business faces intense competition from both branded and generic pharmaceutical companies. We believe that our primarycompetitive advantage is the body of scientific evidence substantiating the safety and efficacy of our various medicines, physician and patient experience withour medicines, and our medical and marketing capabilities tailored to product and market needs.
Central Nervous SystemOur CNS portfolio includes Copaxone for the treatment of multiple sclerosis, Azilect for the treatment of the symptoms of Parkinson’s disease and
Provigil and Nuvigil for the treatment of sleep disorders, as well as several novel therapies for the treatment of pain.
Copaxone (glatiramer acetate injection), our largest specialty medicine, is the leading multiple sclerosis therapy worldwide and is approved andmarketed in more than 50 countries, including the United States, all European countries, Russia, Canada, major Latin American markets, Australia andIsrael. Copaxone is indicated for the reduction of the frequency of relapses in relapsing-remitting multiple sclerosis (“RRMS”), including in patients who haveexperienced a first clinical episode and have MRI features consistent with multiple sclerosis.
Multiple sclerosis is the most common cause of neurological disability in young adults and affects more than 2.5 million people worldwide. In themajority of patients, the disease is of the relapsing-remitting form, which is manifested by relapses and slow progression of the disease that can affect thefunctioning of multiple systems. Our MS portfolio consists of Copaxone as well as laquinimod, a Phase III compound currently under development.
Copaxone , the first non-interferon immunomodulator approved for the treatment of RRMS, is believed to have a unique mechanism of action thatworks with the immune system, unlike many therapies that are believed to rely on general immune suppression or cell sequestration to exert their effect. Byworking with the immune system to help restore its balance, Copaxone provides both efficacy and safety for the long term. Both preclinical and clinicalresearch indicates that Copaxone may reduce brain volume loss and increases the production of factors that enhance neuronal repair. Copaxone provides asustainable treatment approach with confirmed long-term efficacy and safety as proven by more than one million patient-years of treatment and 20 years ofclinical experience.
At the beginning of 2012, we completed the phased assumption from Sanofi of marketing and distribution responsibilities for Copaxone in allEuropean countries, Australia and New Zealand. Sanofi is entitled to receive 6% of the in-market sales of Copaxone in each applicable country in Europe fortwo years following our assumption of responsibilities in that country. Although we have recorded higher revenues as a result of these changes, we also becameresponsible for certain marketing and administrative expenses, which are no longer shared with Sanofi.
In the United States, we have Orange Book-listed patents relating to Copaxone with terms expiring in May 2014 as well as a non-Orange Book patentexpiring in September 2015. Additionally, we have patents expiring in May 2015 in most of the rest of the world. We also hold patents protecting variousaspects of the process of
22
® ®
® ®
®
®
®
®
®
® ®
®
®
®

Table of Contents
preparing Copaxone and methods of analyzing this product, which expire between 2019 and 2024. Copaxone is subject to various patent challenges in theUnited States and Europe.
In October 2012, we announced positive results of the GALA trial, a Phase III trial including 1,400 patients that was designed to examine the efficacy,safety and tolerability of glatiramer acetate 40 mg/ml injection administered three times a week compared to placebo in patients with RRMS. This dose is higherthan the currently marketed Copaxone 20 mg/ml product, which is injected daily. Based on the positive results of the study, including the favorable safetyand tolerability profile demonstrated, we intend to file a supplemental NDA with the FDA in 2013. Teva remains committed to the continued research anddevelopment of Copaxone . Future trials of Copaxone will be conducted based on our evaluation of the potential of the medicine to address further unmetneeds of patients and will take into account responses from the relevant regulatory bodies. In August 2012, Teva decided to discontinue the development of areduced-volume glatiramer acetate formulation (20mg/0.5ml) and therefore terminated the GLOW clinical trial. The discontinuation was based on businessconsiderations; no safety issues were identified with the administration of this formulation.
The principal therapies that compete with Copaxone are the four first-line beta-interferon products: Avonex , Betaseron , Extavia and Rebif .Tysabri , another MS therapy, is currently positioned as a second-or third-line agent; however, Biogen recently filed an application with the FDA andEuropean Medicines Agency (“EMA”) for first-line use in John Cunningham-virus-negative patients, which represent approximately 45% of all RRMSpatients. We expect that in the next few years, the MS treatment landscape will change significantly as a result of new and emerging therapies. In September2010, the first oral drug, Gilenya (fingolimod), was approved by the FDA for the treatment of RRMS patients and included a risk evaluation and mitigationstrategies (REMS) program to inform healthcare providers about serious safety risks, including bradyarrhythmia and atrioventricular block at treatmentinitiation, infections, macular edema, respiratory effects, hepatic effects, and fetal risk. Gilenya has been authorized in the European Union since March2011. In January 2012, the EMA initiated a formal review of Gilenya , following cases of death and serious cardiovascular events in patients who hadrecently started treatment with the medicine. In December 2012, we filed a “citizen’s petition” with the FDA requesting that an advisory committee ofspecialists be convened to weigh the benefits against the side effects of all new molecule MS products.
Provigil (modafinil), which was launched by Cephalon in 1999, is indicated for the treatment of excessive sleepiness associated with narcolepsy,obstructive sleep apnea (“OSA”) and shift work disorder (“SWD”). Provigil began to face generic competition in the United States in March 2012 and, as aresult, sales decreased substantially. Outside the United States, Provigil is approved under various trade names in more than 30 countries, including France,the United Kingdom, Ireland, Italy and Germany, for the treatment of excessive daytime sleepiness associated with narcolepsy. In certain of these countries, wealso have approval to market Provigil to treat excessive sleepiness in patients with OSA and/or SWD.
Nuvigil (armodafinil), the R-isomer of modafinil, is indicated for the treatment of excessive sleepiness associated with narcolepsy, OSA and SWD. Itwas launched by Cephalon in June 2009.
Following the positive results of a Phase II clinical trial of Nuvigil as adjunctive therapy for treating major depressive disorder in adults with bipolar Idisorder, Cephalon initiated three Phase III clinical trials. The first of these trials had positive results reported in July 2012. As reported in January 2013, thesecond trial demonstrated a numerical improvement, but did not reach statistical significance in meeting its primary endpoint. We expect results from the thirdof these trials to become available during the third quarter of 2013. The results of this study must be statistically significant in order to support an NDA filingfor this indication.
Several products, including generic versions of Provigil and methylphenidate products, compete with Provigil and Nuvigil .
In early 2012, Teva reached an agreement with Mylan Pharmaceuticals, providing Mylan the ability to sell its generic version of Nuvigil in the UnitedStates beginning in June 2016, or earlier under certain
23
® ®
®
® ®
® ® ® ® ®
®
®
®
®
®
®
®
®
®
®
® ® ®
®

Table of Contents
circumstances. Nuvigil is protected by several patents, the latest of which expires in 2024, with a pediatric extension. Cephalon’s polymorph patent iscurrently the subject of patent litigation in the United States, and we are currently awaiting a trial decision with respect to several of the generic challengers.Teva is vigorously defending this patent.
Azilect (rasagiline tablets) is indicated as initial monotherapy and as an adjunct to levodopa for the treatment of the signs and symptoms ofParkinson’s disease, the second most common neurodegenerative disorder.
Azilect is a second-generation, irreversible monoamine oxidase type B (MAO-B) inhibitor. Although other symptom-reducing therapies are available,many of them have efficacy, safety and tolerability concerns.
Azilect was launched in its first market, Israel, in March 2005, followed by a rolling launch in various European markets, and became available inthe United States in 2006. Currently, Azilect is approved for marketing in 45 countries. We market Azilect jointly with H. Lundbeck A/S in certain keyEuropean countries. We exclusively market Azilect in the United States and certain other markets, while Lundbeck exclusively markets Azilect in theremaining European countries and certain other markets.
Azilect is protected in the United States by several patents that will expire between 2013 and 2027. We hold European patents covering Azilect that willexpire in 2014. Supplementary Protection Certificates have been granted in a number of European countries with respect to the patent expiring in 2014, therebyextending its term to 2019. Azilect has data exclusivity protection in EU countries until 2015. Azilect is subject to various patent challenges in the UnitedStates and Canada, and a trial is scheduled to begin in May 2013 in the United States litigation.
Azilect ’s competitors include both specialty and generic versions of the newer non-ergot dopamine agonists class, including Mirapex /Sifrol(pramipexole), Requip (ropinirole) and Neupro (rotigotine), which are indicated for all stages of Parkinson’s disease, as well as Comtan , a COMTinhibitor, indicated only for adjunct therapy in moderate to advanced stages of the disease.
Pain therapy Our CNS portfolio also includes Fentora (fentanyl citrate buccal tablets) and Actiq (oral transmucosal fentanyl citrate) for the treatmentof breakthrough pain in opioid-tolerant adult patients with cancer, and Amrix (cyclobenzaprine hydrochloride extended-release capsules) for relief of musclespasm in acute, painful, musculoskeletal conditions.
Oncology ProductsOur oncology product line, led by Treanda in the United States and by Tevagrastim /Ratiograstim outside the United States, was recently bolstered
by the approvals of Synribo and tbo-filgrastim in the United States. Our oncology portfolio also includes several late-stage development programs. Inaddition to our current focus on hematology, we are developing treatments for solid tumors through new chemical entities or innovative biological approaches.
Treanda (bendamustine hydrochloride for injection) is approved in the United States for the treatment of patients with chronic lymphocytic leukemia(“CLL”) and patients with indolent B-cell non-Hodgkin’s lymphoma (“NHL”) that has progressed during or within six months of treatment with rituximab ora rituximab-containing regimen.
In October 2012, we received a complete response letter (“CRL”) from the FDA addressing our supplemental new drug application (“sNDA”) for the useof Treanda as a first-line treatment of patients with NHL in combination with rituximab. Although the BRIGHT study had met its endpoint of non–inferiority, the
24
®
®
®
®
® ®
® ®
® ®
® ®
® ® ®
® ® ®
® ®
®
® ® ®
TM
®
®

Table of Contents
FDA requested additional data, specifically progression-free survival (“PFS”) data, which was not available from this trial. No further registration trials areplanned in the United States.
Treanda ’s competitors include other combination therapies such as R-CHOP (a combination of cyclophosphamide, vincristine, doxorubicin andprednisone in combination with rituximab) and CVP-R (a combination of cyclophosphamide, vincristine and prednisolone in combination with rituximab) forthe treatment of NHL, as well as FCR (a combination of fludarabine, doxorubicin and rituximab) for the treatment of CLL.
Treanda is protected by new chemical entity exclusivity until September 2013 based on a pediatric extension received in 2012. We hold rights toTreanda in the United States and certain other countries.
Tevagrastim (filgrastim) (also marketed as Ratiograstim or tbo-filgrastim) is a Granulocyte Colony Stimulating Factor (“G-CSF”)-based medicinethat stimulates the production of white blood cells and is primarily used to reduce the risk of infections in oncology patients receiving chemotherapy. InSeptember 2008, Tevagrastim and Ratiograstim , jointly developed by Teva and ratiopharm, became the first biosimilar G-CSF to be approved by the EMA.Tbo-filgrastim was approved in the United States on August 29, 2012, the first G-CSF to be approved in the United States in more than 10 years. We expectto launch tbo-filgrastim as early as November 2013, in accordance with the terms of a settlement agreement with Amgen. Clinical trials have demonstrated thatour filgrastim products have an efficacy and safety profile equivalent to that of Amgen’s European version of Neupogen , the first G-CSF product.Tevagrastim and Ratiograstim have been approved for the entire range of Neupogen ’s therapeutic indications and are available in most European countries.Tbo-filgrastim is indicated for the reduction in the duration of severe neutropenia in certain oncology patients.
Competitors to Tevagrastim /Ratiograstim /tbo-filgrastim include Neupogen , and in Europe, also Zarzio and Nivestim , which are also G-CSFproducts.
Eporatio (erythropoietin) stimulates the production of red blood cells and is indicated for the treatment of renal anemia or chemotherapy-inducedanemia. Clinical trials have demonstrated that Eporatio has an efficacy and safety profile equivalent to that of Roche’s NeoRecormon . Eporatio is nowapproved in all 27 EU member states, Norway, Switzerland and Iceland.
Synribo™ (omacetaxine mepesuccinate for injection) was granted accelerated approval by the FDA on October 26, 2012, for the treatment of adultpatients with chronic phase or accelerated phase chronic myeloid leukemia (“CML”) with resistance and/or intolerance to two or more tyrosine kinaseinhibitors. It was launched in the United States in November 2012. We have granted marketing rights for Synribo™ to Hospira in Europe, the Middle Eastand certain African countries.
Synribo™ is protected by new chemical entity exclusivity until October 2017 and by orphan drug exclusivity until October 2019. It is also covered bypatents in the United States expiring in 2019 and 2023. A term extension has been requested for the patent expiring in 2023.
Synribo provides a new treatment option in the CML treatment landscape and is administered subcutaneously. It is dosed twice daily for 14consecutive days of a 28-day cycle at treatment induction, and twice daily for seven consecutive days of a 28-day cycle during maintenance once a response isachieved. Synribo acts independently of direct Bcr-Abl binding to reduce protein levels of both Bcr-Abl and Mcl-1, an inhibitor of apoptosis, in vitro.
The FDA recently approved three new treatments for CML including bosutinib and ponatinib.
Respiratory ProductsTeva is committed to achieving a leading presence in the respiratory market by delivering a range of medicines for asthma, chronic obstructive
pulmonary disease (“COPD”) and allergic rhinitis. Our portfolio is
25
®
®
®
® ®
® ®
®
® ® ®
® ® ® TM TM
®
® ® ®
TM
TM

Table of Contents
centered on optimizing respiratory therapies for patients through novel delivery systems and therapies that address unmet needs.
In recent years, we have continued to build upon our experience in the development, manufacture and marketing of inhaled respiratory drugs deliveredby metered-dose and dry powder inhalers, primarily for bronchial asthma, COPD and allergic rhinitis. In addition, we have invested in high qualitymanufacturing capability for press and breathe metered-dose inhalers, nasal sprays and nebulizers.
Below is a description of our main respiratory medicines:
ProAir hydrofluoroalkane (“HFA”) inhalation aerosol with dose counter (albuterol sulfate) is indicated in patients four years of age and older for thetreatment or prevention of bronchospasm with reversible obstructive airway disease and for the prevention of exercise-induced bronchospasm. In March 2012,the FDA approved the addition of a dose counter, an innovation designed to help patients, as well as their caregivers, keep track of the number of dosesremaining in the inhaler. The efficacy and safety profile of albuterol, which is used by millions of patients every day around the world, is well established.ProAir HFA, which is marketed in the United States only and is the leading reliever therapy, is protected by various patents expiring between 2014 and 2028.It is subject to patent challenges in the United States.
Three major brands compete with ProAir HFA in the United States in the short-acting beta agonist market: Ventolin HFA (albuterol) byGlaxoSmithKline, Proventil HFA (albuterol) by Merck and Xopenex HFA (levalbuterol) by Sunovion.
QVAR (beclomethasone diproprionate HFA) is indicated as a maintenance treatment for asthma as a prophylactic therapy in patients five years of ageor older. QVAR is also indicated for asthma patients who require systemic corticosteroid administration, where adding QVAR may reduce or eliminate theneed for systemic corticosteroids. QVAR is the fastest growing inhaled corticosteroid in the United States, capturing 26.9% of the market. We marketQVAR , which is manufactured by 3M, directly in the United States and major European markets. QVAR is protected by various patents in the UnitedStates expiring in 2014 and 2015.
Four major brands compete with QVAR in the mono inhaled corticosteroid segment: Flixotide/Flovent (fluticasone) by GlaxoSmithKline, PulmicortFlexhaler (budesonide) by AstraZeneca, Asmanex (mometasone) by Merck and Alvesco (ciclesonide) by Sunovion
Qnasl Nasal Aerosol (beclomethasone diproprionate HFA in a nasal actuator) is a synthetic corticosteroid medication indicated for the treatment ofseasonal nasal and year-round nasal allergy symptoms in adults and adolescents 12 years of age and older. It is administered as a nonaqueous or “dry” spraydelivered by HFA, an environmentally friendly propellant. This medicine was launched in 2012 in the United States, and is currently being studied in a PhaseIII trial for a pediatric indication. Qnasl is protected by various patents in the United States expiring between 2014 and 2027.
Major competitors of Qnasl are Veramyst (fluticasone furoate) and Flonase (fluticasone propionate) by GlaxoSmithKline, Rhinocort Aqua(budesonide) by AstraZeneca, Nasonex (mometasone) by Schering, and Omnaris and Zetonna (ciclesonide) by Dainippon Sumitomo.
Women’s Health ProductsCurrently, our women’s health product line focuses on several therapeutic areas, including oral contraceptives, intrauterine contraception, hormone
therapy treatments for menopause/perimenopause, and therapies for use in infertility and urinary incontinence. We expect to broaden this focus over time.
Below is a description of our main women’s health products:
Plan B One-Step OTC/Rx (levonorgestrel) is an emergency oral contraceptive that consists of a single tablet dose of levonorgestrel for emergencycontraception. Plan B One-Step is intended to prevent pregnancy
26
®
®
® ®
® ®
®
® ®
®
® ®
® ®
® ® ®
®
®
® ® ® ®
® ® ®
®
®

Table of Contents
when taken within 72 hours after unprotected intercourse or contraceptive failure and is available over-the-counter in the United States for women 17 years ofage and older and by prescription for women under 17. Generic competition for this product already exists in the market.
ParaGard T380 A (intrauterine copper contraceptive) is a non-hormonal intrauterine contraceptive marketed in the United States. ParaGard provideswomen with a highly effective, long-term, reversible, non-hormonal contraceptive option. It is the only intrauterine contraceptive approved for up to ten years ofcontinuous use and is more than 99% effective at preventing pregnancy.
Zoely is a 28-day regimen combination contraceptive oral pill (consisting of 24 active pills and four placebo pills). Zoely is the first and onlymonophasic contraception combining E2 physiological estrogen (17ß-estradiol) with NOMAC (nomegestrol acetate) progestin, which has a strong anti-gonadotropic activity, having minimal effect on metabolism and less impact on metabolic and haemostasis parameters than currently marketed products.
Zoely is a joint development between Théramex and Merck & Co. We hold the marketing rights for Zoely in several European countries. Zoely isprotected by patents in Europe with supplementary protection certificates extending to 2022.
Enjuvia is an oral treatment of moderate to severe vasomotor symptoms associated with menopause. Enjuvia is a plant-derived formulation of tensynthetic conjugated estrogens, including sodium D -dehydroestrone sulfate, and is available in five dosage strengths. The Enjuvia delivery system allowsslow release of estrogens over several hours due to its Surelease technology. We have Orange Book listed patents for Enjuvia expiring in 2021.
We also market the following products in Europe: Orocal , a calcium supplement for the treatment of osteoporosis; Colpotrophine , for vaginal atrophy;Lutenyl , for menopause; Monazol , for fungal dermatitis; Estreva , for estrogen deficiencies; Antadys , for dysmenorrhea; and Leeloo Gé , an oralcontraceptive.
The oral contraceptives market is highly competitive and fragmented. The main competitors to our women’s health line are the Yasmin and Yazfranchise from Bayer, which was recently expanded to include the Yaz Flex flexible dosage regimen oral contraceptive, which was launched in Australia inSeptember 2012 and is expected to be launched in Europe later in 2013. There are numerous other brands and generic medications available, including genericversions made by Teva. In addition, there are other competing forms of contraceptives, such as intrauterine devices and vaginal hormonal contraceptive rings.
In the intrauterine device (“IUD”) market, Bayer’s Hormonal IUD Mirena is the market leader. The follow-on product (called Jaydess in Europe andSkyla in the United States) recently received marketing authorizations for both markets. NuvaRing from Merck is a vaginal hormonal contraceptive ring,and we expect the competitive landscape to continue to evolve towards non-oral deliveries.
Consumer Healthcare Joint VenturePGT is our consumer healthcare joint venture with P&G. The joint venture includes the branded OTC medicines of the two companies in categories
such as cough/cold and allergy, digestive wellness, vitamins, minerals and supplements, analgesics and skin medications, and operates in all markets outsideNorth America. Its leading brands are Vicks , Metamucil , Pepto-Bismol , and ratiopharm. The joint venture also develops new brands for the NorthAmerican market and certain global markets. We own 49% and P&G holds 51%.
PGT’s strengths include P&G’s strong brand-building, consumer-led innovation and go-to-market capabilities; and our broad geographic reach,experience in R&D, regulatory and manufacturing expertise and extensive portfolio of products, and each company’s scale and operational efficiencies. Itintends to introduce the partners’ product and brand portfolios into additional countries and to expand into new OTC categories (such as prescription productsthat have become OTC products).
27
® ®
® ®
® ® ®
® ®
8,9 ®
® ®
® ®
® ® ® ® ®
® ®
®
® ®
® ®
® ® ®

Table of Contents
Other RevenuesWe have other sources of revenues, primarily sales of third-party products for which we act as distributor, mostly in Israel and Hungary, as well as
sales of medical devices and other miscellaneous items.
Teva’s MarketsUnited States
In the United States, Teva has a strong presence in both the generic and branded markets.
Generic PharmaceuticalsWe are the leading generic drug company in the United States. We market over 400 generic products in more than 1,300 dosage strengths and packaging
sizes, including oral, injectables and inhaled products. We believe that the breadth of our product offerings has been and will continue to be of strategicsignificance as the generics industry grows and as consolidation continues among purchasers, including large drugstore chains, wholesaling organizations,buying groups and managed care providers.
In 2012, we led the U.S. generic market in total prescriptions and new prescriptions, with total prescriptions amounting to approximately 530 million in2012, representing 16.2% of total U.S. generic prescriptions. We intend to continue our U.S. market leadership based on our ability to introduce new genericequivalents for brand-name products on a timely basis, deep emphasis on customer service, the breadth of our product line, our commitment to quality andregulatory compliance and cost-effective production.
We expect that our revenues in the United States will continue to be fueled by our strong U.S. generic pipeline, which, as of January 22, 2013, had 147product registrations awaiting FDA approval (including some products through strategic partnerships), including 38 tentative approvals. Collectively, thebranded versions of these products had U.S. sales in 2012 exceeding $91 billion. Of these applications, 103 were “Paragraph IV” applications challengingpatents of branded products. We believe we are the first to file with respect to 62 of these products, the branded versions of which had U.S. sales of more than$45 billion in 2012. IMS reported brand sales are one of the many indicators of future potential value of a launch, but equally important are the mix andtiming of competition, as well as cost effectiveness. However, potential advantages of being the first filer with respect to some of these products may be subjectto forfeiture, shared exclusivity or competition from so-called “authorized generics,” which may ultimately affect the value derived.
Marketing and Sales. In 2012, our generics sales in the United States by channel were as follows:
2012 Drug store chains 41% Drug wholesalers* 36% Managed care organizations 12% Generic distributors 7% Governmental facilities and others 4%
* A major portion of the products sold to wholesalers ends up in drug store chains and therefore is not reflected in the data presented above.
In the United States, our wholesale selling efforts are supported by professional journal advertising and exhibitions at key medical and pharmaceuticalconventions. From time to time, we also bid for U.S. government contracts.
Competitive Landscape . In the United States we are subject to intense competition in the generic drug market from other domestic and foreign genericdrug manufacturers, brand-name pharmaceutical companies
28

Table of Contents
through lifecycle management initiatives, authorized generics, existing brand equivalents and manufacturers of therapeutically similar drugs. We believe thatour primary competitive advantages are our ability to continually introduce new generic equivalents for brand-name drug products on a timely basis, qualityand cost-effective production, our customer service and the breadth of our product line.
A significant proportion of our U.S. generic sales are made to a relatively small number of retail drug chains and drug wholesalers. These customershave undergone and continue to undergo significant consolidation, which has resulted in customers gaining more purchasing power. Consequently, there isheightened competition among generic drug producers for the business in this smaller and more selective customer base. On the other hand, this trend favorslarge suppliers that are capable of providing quality, a wide range of products and cost-efficient quantities. We are committed to the success of our customersin this segment and focus closely on them as important business partners.
Price competition from additional generic versions of the same product typically results in significant reductions in sales and margins over time. Tocompete on the basis of price and remain profitable, a generic drug manufacturer must manufacture its products in a cost-efficient manner. New drugs andfuture developments in improved and/or advanced drug delivery technologies or other therapeutic techniques may provide therapeutic or cost advantages tocompeting products.
Specialty PharmaceuticalsWe have continued to expand our specialty branded portfolio. Copaxone , our multiple sclerosis treatment, has been the market leader since 2008 and
has a U.S. market share of approximately 40%. Our respiratory products ProAir HFA for the treatment of bronchial spasms, and Qvar for long-term controlof chronic bronchial asthma, maintained their leading positions within their respective indications. Our branded portfolio includes Nuvigil for excessivesleepiness associated with narcolepsy, OSA and SWD and Treanda for chronic lymphocytic leukemia and indolent B-cell non-Hodgkin’s lymphoma thathas progressed during or within six months of treatment with rituximab or a rituximab-containing regimen.
Our specialty marketing and sales organization concentrates on the therapeutic areas of CNS, respiratory, oncology and women’s health. Within eachtherapeutic area, our trained sales representatives seek to address the needs and preferences of patients as well as healthcare professionals. We are able to tailorour patient support, payor relations and medical affairs functions to the characteristics of each market, which differ according to the specific product.
Our U.S. business has built a specialized capability to help patients comply with their treatments, ensure timely delivery of medicines and assist insecuring reimbursement. This capability, called “Shared Solutions,” is a critical part of our success in this market and has been recognized as industry-leading. It also reflects the growing understanding of the role of integrating patients and medicines through the capabilities now available in communications,internet and other modalities. We believe this capability is an important competitive advantage in the specialty medicines market.
Regulatory Highlights. All pharmaceutical manufacturers selling products in the U.S. are subject to extensive governmental regulation, principally bythe FDA and the Drug Enforcement Administration (“DEA”).
The Hatch-Waxman Act established the procedures for obtaining FDA approval for generic forms of brand-name drugs, and includes market exclusivityprovisions that can delay the approval of ANDAs as well as a potential 180-day period of generic exclusivity for the first company to submit an ANDA with aParagraph IV certification that challenges the validity or enforceability of an existing listed patent or asserts that the proposed product does not infringe anexisting listed patent.
29
®
® ®
®
®

Table of Contents
EuropeEurope, which we define as the 27 countries in the European Union plus Norway and Switzerland, is a diverse region that has a population of over
300 million people. In anticipation of the addition of Croatia to the European Union, we began including, as of January 1, 2013, the countries of the formerYugoslavia and Albania, which increases the number of European countries to 36. Despite their diversity, the European markets share many characteristicsthat allow us to leverage our pan-European presence and broad portfolio.
We have a leading or significant presence serving patients in all European countries. No single market in Europe represents more than 25% of our totalEuropean revenues, and as a result we are not dependent on any single market that could be affected by pricing reforms or changes in public policy.
Our strategy in Europe is to be flexible and focused on the needs of our customers and their patients. In generics, we focus on differentiation, in whichwe leverage our strengths (a comprehensive portfolio, partnership capabilities or competitive pricing) according to market conditions, seeking profitablebusiness, rather than market share. In our specialty business, we seek to address unmet clinical needs in our chosen specialty franchises, especially in CNSand respiratory disorders. We leverage, where relevant, our understanding of patient needs and requirements, both in the United States and globally, tounderstand how best to improve and enhance our specialty medicines capability in Europe.
The pharmaceutical market in each European country has distinct prescribing and dispensing habits, varying pricing and reimbursement mechanismsand different product ranges. Most markets are generally characterized by highly developed, government-funded healthcare and social planning, in whichmost healthcare is funded and often directly managed and provided by the public sector.
Generic PharmaceuticalsThe generic market in Europe is characterized by a very gradual transition from branded generics, where the physician plays a key decision-making
role in choosing the supplier of a generic drug, towards a generic model where the key decision maker is the pharmacist. This transition is likely to take manyyears to complete. In the meantime, generic penetration in European countries varies widely, driven by government policy or reimbursement mechanisms,rather than by patient or healthcare professional preference.
Some European countries, such as Germany, the United Kingdom, the Netherlands, Poland and the Czech Republic, have relatively high levels ofgeneric penetration of over 50% in volume. Other markets in Southern Europe have not yet attained such a high level of generic penetration but are moving inthis direction. In 2012, government action in some markets with lower generic penetration rates created an immediate increase in generic market share, as aresponse to the need to reduce overall healthcare costs while preserving the quality of health outcomes. These measures were implemented in some Spanishregions and Italy as well as in France, where the introduction of the ‘Tiers Payant’ system to encourage generic dispensing resulted in an increase of genericpenetration of some 20% in the second half of the year.
Despite the Eurozone financial crisis, Europe remains a fundamentally affluent region with a growing need for healthcare as its population ages and isunwilling to compromise on the quality of care. The financial crisis, which led to government spending reductions, also resulted in growth for genericpharmaceuticals in many countries since generics were used to help contain healthcare costs. Pricing and reimbursement mechanisms in Europe are typicallyset by government regulation and are used to regulate or influence market behavior, for example, by encouraging the use of generics. In many markets, such asSpain, Germany, Italy and Finland, reimbursement for generic prescription pharmaceuticals is usually based on the price of a reference (or comparable)branded pharmaceutical. Other markets, such as Italy and Austria, require the price of a new generic product to be a certain percentage lower than theoriginator brand. In the United Kingdom, retail generic pricing is set by the market, but reimbursement is determined by regulations based on pharmacypurchase profit.
30

Table of Contents
We are the leading generic pharmaceutical company in Europe overall, and the generic market leader in a number of European countries including theUnited Kingdom, Italy, Spain, the Netherlands, Portugal and Switzerland. We are one of the top three companies in many other countries, includingGermany, France, Poland and Hungary. During 2012, Teva received 1,103 generic approvals in Europe relating to 231 compounds in 429 formulations,including six EMA approvals valid in all EU member states. In addition, Teva had approximately 2,131 marketing authorization applications pendingapproval in various European countries, relating to 244 compounds in 499 formulations, including three applications pending with the EMA.
We intend to continue to register products in the EU, using both the mutual recognition procedure (submission of applications in other member statesfollowing approval by a so-called reference member state) and the decentralized procedure (simultaneous submission of applications to chosen member states).We continue to use the centralized procedure to register our generic equivalent version of reference products that originally used this procedure.
Our European pipeline includes generic versions of branded products with approximately $4 billion of total annual branded market sales in 2012. In2012, the European pharmaceutical market grew overall. The impact of the continuing pricing and reimbursement reforms has been to reduce some prices butto increase generic market penetration, and in many markets stock levels at wholesalers have been reduced, without detriment to customer service, as theimplementation of reforms has helped to reduce market uncertainty. We have managed market conditions by taking a selective approach to competing forbusiness, focusing on sustainable business and not business at any price.
In 2012, we declined to participate in certain hospital tenders because the procurement model reduced profitability in this market, and the marketexperienced product shortages in some instances due to manufacturers’ reducing their exposure to unsustainable contracts. We are now starting to see the startof an upward trend in prices as payors recognize the need to build stability and resilience into the supply of these medicines to patients.
Specialty PharmaceuticalsOur assumption of marketing responsibility for Copaxone from Sanofi was completed in the remaining European markets on February 1, 2012. We
market a wide range of specialty medications in Europe including Copaxone , Azilect , Provigil , Effentora (fentanyl buccal tablet), Spasfon(phloroglucinol), Myocet (liposomal doxorubicin), Actiq (solid fentanyl) and Zoely (nomegestrol acetate/estradiol). These products are sold in manymarkets across Europe but notably in France, the United Kingdom, Germany, Spain and Italy, either directly by us or through third-party distributors.
Other ActivitiesOur other activities in Europe comprise mainly PGT, our OTC joint venture with P&G, with Germany, Poland, Hungary and the Czech Republic being
our main OTC markets; and our pharmaceutical distribution activities in Hungary. In 2012, PGT successfully launched the Vicks brand in Poland,Hungary and the Czech Republic.
Our largest European operations are described below:
Germany is the largest European pharmaceutical market. We have a product portfolio of approximately 480 molecules. In terms of generic marketshare, we continue to compete for leadership in the German retail market with our ratiopharm brand. In Germany, our most important specialty medicine isCopaxone . In 2012, we maintained patient share and implemented a patient-centric model to safeguard supply for patients.
We continue to compete successfully for health insurance tenders, which are now a principal factor in the German retail generics market. In 2012, wefocused strongly on a selective approach to this market, where we
31
®
® ® ® ® ®
® ® ®
®
®

Table of Contents
competed on the basis of winning sustainable and profitable business. This resulted in some reduction in value and market share in the tender market, butmeant that profitability was maintained.
In 2012, we successfully launched a number of generic products, such as Atacand (candesartan), Atacand Plus (candesartan HCTZ), Seroquel(quetiapine) and Seroquel Prolong (quetiapine ER), Aricept (donepezil) and Lipitor (atorvastatin).
Our OTC business in Germany performed especially well, recording significant growth during the year against a background of an overall decliningOTC market.
In France, we have a portfolio of over 300 molecules. Key specialty products marketed in France include Spasfon (phloroglucinol), Modiodal(modafinil), Vogalene (metopimazine), and Vogalib (metopimazine). Our activities in France are well balanced between specialty and generic medicines. Ingenerics, we profited from the recent regulatory changes and strongly focused on a selective approach to generate sustainable business.
In 2012, we launched 52 new products or new dosage forms, including the generic versions of Lipitor (atorvastatin), Nexium (esomeprazole),Diovan (valsartan), CoDiovan (valsartan HCTZ) and JOSIR LP (tamsulosine).
In the United Kingdom, we are the largest supplier by volume to the National Health Service. We have a portfolio of more than 300 molecules andsupply one in six prescriptions dispensed, focusing on independent retail pharmacies.
In 2012, we launched 52 new products, including the generic versions of Seroquel (quetiapine), Aricept (donepezil), Agopton (lansoprazole) andDetrol (tolterodine).
In Italy, we have a generic portfolio of over 250 molecules. Our business in Italy continues to be the generic market leader, supplying about a fifth ofthe country’s generic medicines needs. The market experienced challenging conditions in 2012, but in the latter part of the year government measures designedto increase generic penetration had a significant positive effect on market growth in volume and value. In 2012, we launched 32 new products, including thegeneric versions of Lipitor (atorvastatin), Seroquel (quetiapine), Atacand (candesartan), Epivir (lamivudine) and Actonel (risedronate sodium).
In addition to the generic launches, we enlarged our women’s healthcare franchise with the launch of our new oral contraceptive Zoely (nomegestrolacetate/estradiol).
In Spain, our generic product portfolio has approximately 250 molecules. The Spanish market was characterized in 2012 by continuing pricing andreimbursement reforms, sometimes frequent and sudden. We used our differentiation strategy to meet our customers’ needs effectively.
During 2012, we launched 61 new products, including generic versions of Keppra (levetiracetam), Aricept (donepezil), Atacand (candesartan) andReminyl (galantamine).
In addition to the generic launches, we enhanced our women’s health portfolio in Spain with the launch of our new oral contraceptive Zoely (nomegestrolacetate / estradiol). We are now the second largest provider of oral contraception in Spain, despite having only entered this category one year ago.
Competitive LandscapeThe generic market in Europe is very competitive, with the main factors being price, time to market, reputation, customer service and breadth of
product line. In addition, as in the United States, brand pharmaceutical companies try to prevent or delay approval of generic equivalents through severaltactics.
In Germany, there is a high rate of generic penetration with a relatively large number of competitors of varying sizes and capabilities. Tenders are animportant feature of the German market, operated by
32
® ® ®
® ® ®
® ®
® ®
® ®
® ® ®
® ® ®
®
® ® ® ® ®
®
® ® ®
®
®

Table of Contents
approximately 200 statutory healthcare funds across Germany, and are a result of reforms initiated by the government that have shifted the market from aphysician-influenced branded model to a payor-influenced substitution model, representing a key opportunity for generics. Although tenders in Germany donot represent the majority of all pharmaceutical purchasing, they are a significant market influence and have contributed to pricing pressure in the Germanretail market.
In France there is an increasingly competitive landscape, with many competitors and strong pricing pressure. In 2012, the government introduced a new‘Tiers Payant’ scheme designed to increase generic penetration, in which co-payment increases for the patient if a branded product prescription is choseninstead of an available generic version. This scheme immediately increased generic market penetration.
The United Kingdom is a ‘pure’ generic market with low barriers to entry and very high generic penetration. In general, retail pricing of generics to thepharmacy is unregulated leading to very strong price-led competition although pricing is heavily influenced by the ‘Category M’ scheme that limitspharmacies’ reimbursement profit.
In Italy, there is a relatively low but growing rate of generic penetration with an increasing level of influence, and ability to substitute, by the pharmacist.The market consists of 20 semi-autonomous regional governments and is influenced by regional independent pharmacy groups. The pace of governmentreforms to encourage generic penetration has been slower than expected, but the government austerity program and its consequent encouragement of genericpenetration is beginning to offset the reduction in growth in the overall Italian pharmaceutical market.
In Spain, the generic pharmaceutical market largely consists of domestic companies. Growth in this market stalled for part of 2012 due to thecontinuing economic situation, but overall government and regional reforms have, despite price decreases, encouraged the use of generic medicines.
Regulatory and legislative developmentsIn Europe, marketing authorizations for pharmaceutical products may be obtained through a centralized procedure involving the EMA, a mutual
recognition procedure which requires submission of applications in other member states following approval by a so-called reference member state, or adecentralized procedure that entails simultaneous submission of applications to chosen member states.
During 2012, we continued to register products in the EU, using both the mutual recognition procedure and the decentralized procedure. We continue touse the centralized procedure to register our generic equivalent version of reference products that originally used this procedure.
The European pharmaceutical industry is highly regulated and much of the legislative and regulatory framework is driven by the European Parliamentand the European Commission. This has many benefits including the potential to harmonize standards across the complex European market, but it also hasthe potential to create difficulties affecting the whole of the European market.
The implementation of some elements of the European Falsified Medicines Directive, which are due to be enacted into national laws during 2013, couldcreate disruption in the European medicines supply chain and affect the welfare of patients. The provisions of the Directive are intended to reduce the risk ofcounterfeit medicines entering the supply chain, but if interpreted strictly, it will become more difficult to import APIs for many important medicines intoEuropean Union countries in the second half of 2013. Teva believes that this represents a significant threat to the security of supply of medicines for the wholeindustry, affecting patients in many therapy areas across the whole of Europe. We continue to highlight the risks associated with the Directive at European andcountry level, and will continue to work to safeguard supplies of medicines to the patients who depend on them.
The implementation of new European pharmacovigilance legislation has changed our global pharmacovigilance obligations. These new requirements areintended to improve patient safety. However, they increased our administrative burden and therefore costs, and there are proposals from the EuropeanCommission to increase the fees that industry pays for the maintenance of the pharmacovigilance system. This proposal has so far been rejected by memberstates as well as industry, but discussions are ongoing that could lead to increased costs.
33

Table of Contents
The procurement model in parts of Europe for the supply of important secondary care products such as oncology injectable medicines creates achallenge for governments and the pharmaceutical industry. We do everything we can to supply medicines for life-threatening conditions, while at the sametime the market creates few incentives for us to do so. Until the procurement model recognizes that stability and sustainability, and the need to allowmanufacturers to earn a return on their investment, are important components in purchasing decisions, shortages will be almost impossible to avoid. In 2012,we declined to participate in certain tenders and ended our supply in others since the procurement model for this segment was not sustainable. If the situationremains unchanged, we may withdraw certain products from the market because they are commercially nonviable. We continue to work with governments andour customers on ensuring that the patient’s needs are protected, but we believe that governments can do more to insure security of supply by creating adequateincentives for manufacturers to maintain manufacturing capacity.
Rest of the World MarketsOur ROW markets include all countries other than the United States and those we include under Europe. Our key ROW markets are Japan, Russia,
Latin America, Canada and Israel. The countries in this category range from highly regulated, pure generic markets such as Canada, to hybrid markets suchas Japan and Brazil, to branded generics markets such as certain Commonwealth of Independent States markets and Latin American markets. We considerJapan, Russia and the Latin American countries to be “emerging” generics markets that are characterized by rapid growth and relatively high sales of brandedgenerics and OTC products, while Canada and Israel are “mature” generics markets that have higher generic penetration rates and therefore lower growth rates.We intend to expand our ROW market presence by growing our early stage businesses in markets such as South Korea. We further seek to enter new marketsor enhance our existing presence in countries such as China, India, Brazil and South East Asia, either via partnership or by creating a direct presence.
Below are details of our operations in these markets:
JapanWe increased our presence in Japan through the acquisition of several generics companies beginning in 2009 and culminating in the 2011 acquisition of
Taiyo, the third largest generics manufacturer in Japan, with a broad portfolio of products in solid, sterile and injectable technologies, and a presence in allmajor channels of the Japanese pharmaceutical market. In April 2012, we integrated our Japanese operations into a single entity, Teva Seiyaku (Teva PharmaJapan Inc.), which includes sales force, production and R&D capabilities.
Japan is the second largest pharmaceutical market in the world, with annual sales estimated at approximately $115 billion in 2012. Generic penetrationis estimated at 26% of volume and 11% of value, based on National Health Insurance prices, and is expected to increase further following a number of keypatent expirations and the further introduction of government initiatives expected over the next few years. The Japanese pharmaceutical market is in the processof transforming from a branded generics market, driven by physicians’ choice of brands, to a pharmacy substitution market with an increased proportion ofgeneric prescriptions. In addition, pharmacy chains are slowly emerging, which we expect will result in additional generic penetration. At present, almost halfof all generic drugs are sold in pharmacies, a quarter are dispensed by hospitals, and a fifth are sold by physicians.
Generic drugs are distributed by large wholesalers, which distribute both branded and generic products, and by hanshas, or small agents, specializingin the sale of generics. Direct sales are extremely limited due to the highly fragmented nature of the market. Teva has established strategic partnerships with keynational and regional wholesalers and the top hanshas in order to ensure distribution of our products to all customer segments.
Competitive Landscape . The Japanese generic pharmaceutical market is relatively fragmented but is in the process of consolidating. The four leadinggeneric pharmaceutical companies now capture approximately 50% of
34

Table of Contents
the market. The market is being further transformed by the entry of global companies (branded and generics) as well as local branded companies into thegenerics business.
Regulatory Highlights. The registration of existing or new generic drugs in Japan is subject to Pharmaceutical and Medical Device Agency approval andrequires carrying out local bioequivalence studies, as well as upholding stringent quality, stability and stable supply requirements. Generic prices are regulatedby the Ministry of Health, Labor and Welfare and set at 60%-70% of the equivalent branded drug prices (depending on the dosage form and number ofcompetitors), with additional price reductions of approximately 8%-10% every two years.
The Japanese government provides fully comprehensive healthcare coverage, and more than 85% of healthcare expenses are paid by the government. Inorder to control growing healthcare costs due to an aging population, in 2008 the Japanese regulator initiated a coordinated policy to promote the usage of genericdrugs via a series of targeted incentive programs, with the goal of reaching 30% generic penetration by 2012. This led to a significant increase in genericpenetration by volume (from 18% to 26% currently). The next reform, which is scheduled for April 2014, is likely to further increase generic penetration. InApril 2010 and 2012, new financial incentive schemes were established, encouraging pharmacies to substitute generic drugs for branded ones, and doctors towrite generic prescriptions.
RussiaWe market a diverse portfolio of generic products, OTC pharmaceutical products, and branded products (primarily Copaxone ) in Russia. We have a
portfolio of approximately 130 products sold to both retail and hospital channels. Today we are one of the largest pharmaceutical companies in Russia.
Russia is primarily a branded generic, out-of-pocket, cash-pay market, although selected government-funded products included for reimbursement areprocured using a tender process. The life-saving products that are included in the reimbursement list, including Copaxone , are subject to tenders and price-setting by the government.
The government seeks to encourage the use of generic products in order to reduce the cost of pharmaceuticals. Russian pharmaceutical law is currentlyunder review, with a focus on increasing access and controlling pricing of products.
Competitive Landscape . The Russian market includes large local manufacturers as well as international pharmaceutical companies, both generic andinnovative. As part of Russia’s 2020 pharmaceutical strategy, companies with a local manufacturing presence will receive favorable treatment. In 2011, Tevaannounced its commitment to build a manufacturing facility in Yaroslavl, Russia, which is expected to be operational by 2015.
Regulatory Highlights. The Russian government is implementing its 2020 pharmaceutical sector strategy, which emphasizes localization of productionand aims to harmonize the Russian pharmaceutical regulations with international principles and standards. Russia’s new pricing regulations, which tookeffect in 2010, impose price restrictions on pharmaceuticals listed on the new Essential Drug List (EDL). In accordance with this new legislation, as ofJanuary 1, 2010, EDL manufacturers must perform an annual price review calculated according to the methodology of the Ministry of Health. The law doesnot regulate prices for non-essential medicines. The new legislation also includes safety measures, including obligatory GMP requirements, to be implementedby January 1, 2014, with the goal of ensuring production of high-quality pharmaceuticals.
Latin AmericaWe market a broad portfolio of products in most Latin American countries. Our products are generally manufactured in our facilities in Mexico, Chile,
Argentina and Peru. We have a strong presence in most major
35
®
®

Table of Contents
markets leveraging our local, regional and global supply chain for generics, branded generics, OTC, and specialty medicines. During 2012, we continued toexpand our presence in the largest markets by adding new therapeutic classes and strong performance in our existing product portfolio.
Brazil, Mexico, Venezuela, Chile and Argentina are the largest pharmaceutical markets in the region, with substantial local manufacturing and, due tothe historical absence of effective patent protections for innovative drugs, a history of reliance on generic and branded generic products.
Total pharmaceutical retail sales in the region exceeded $74 billion in 2012 and, according to IMS forecasts, the Latin American pharmaceutical marketis expected to grow at an average annual rate of approximately 15% through 2016. We intend to further expand our operations in Latin America, takingadvantage of the expected increases in spending on healthcare (and on pharmaceuticals in particular), stronger regional economic performance and growingpopulations, leveraging our strong local presence, global product portfolio and manufacturing expertise.
Competitive Landscape . In Latin America, the pharmaceutical market is generally fragmented, with no single company enjoying market leadership inthe region. Local generic companies predominate, especially in Brazil, Argentina and Chile. These local companies, as well as multinational brand companies,compete with our local operations in all of the markets. Our strengths in the region include our comprehensive range of products, which cover a wide range oftherapeutic categories, strong sales forces and the opportunity to leverage our global product portfolio.
Regulatory Highlights. Historically in Latin America, local governments did not distinguish between innovative pharmaceuticals, OTC and genericmedicines, and many pharmaceutical companies in the region engaged in the production of drugs still under patent in their countries of origin or off-patentdrugs sold under a local brand name, in accordance with local laws that may not have required bioequivalence testing. In recent years, however, Latin Americahas seen increased enforcement of intellectual property and data protection rights. The market has also been characterized by an increased demand for high-quality pharmaceutical products as the major markets in the region have adopted more stringent regulations governing pharmaceutical product safety andquality. Nevertheless, pricing pressures for pharmaceutical products, which are subject to direct or indirect price controls in many countries in Latin America,are expected to continue to exert political and budgetary constraints that may foster the continued growth of generics but may have a negative impact on pricing.With respect to biosimilars or follow-on biologics, new regulatory pathways for approval have either been approved or are in development in the region.
CanadaIn Canada, we manufacture and market prescription pharmaceuticals and continue to be one of the two leading generic pharmaceutical companies in
terms of prescriptions and sales. Our generic product portfolio includes over 300 products in various dosage forms and packaging sizes. Our specialtyportfolio is primarily comprised of Copaxone and Azilect .
Our generic sales force in Canada markets generic products to retail chains, retail buying groups and independent pharmacies, reaching approximately8,800 outlets across Canada. We continue to see consolidation of independent retail pharmacies and increased expansion of retail chains and buying groups:the top five retail chain customers in Canada represent approximately half the market (in terms of value). Our customer base continues to change as thenumber of non-aligned independent community pharmacies join pharmacy banner store groups or sell their operations to larger chain drug operators. Theselarger corporate accounts work closely with selected suppliers, listing products as part of a chain-wide formulary. We continue to experience increasedgovernment regulation on pricing, including a recent Canada-wide announcement indicating that the top six products in the market would be reduced in priceto 18% of the referenced brand product on April 1, 2013.
Customers look to generic suppliers to timely launch cost effective generic products, maintain high levels of product availability and provide increasedlevels of overall customer value and service.
36
® ®

Table of Contents
Competitive Landscape . In Canada, the competitive landscape continues to intensify with the increasing presence of multinational companies. The fivemajor generic companies (including Teva), are either subsidiaries of global manufacturers or privately held, Canadian owned firms. These top manufacturerssatisfy approximately 80% of the Canadian demand for generic pharmaceuticals. In addition, the major branded pharmaceutical companies have intensifiedtheir efforts to compete with the generic players, and are now offering incentives to patients and customers to offset generic cost savings. In addition, several ofour customers have intensified their efforts to provide private label products, which have the potential to compete with our products; however, our strategy isto become a key supplier to these retail chains and add to value through our core supply chain competency.
Regulatory Highlights. The Canadian Federal Government, under the Food and Drugs Act and the Controlled Drug and Substances Act, regulates thetherapeutic products that may be sold in Canada and the applicable level of control. The Therapeutic Products Directorate (“TPD”) is the national authoritythat evaluates and monitors the safety, effectiveness and quality of drugs, medical devices and other therapeutic products.
IsraelWe are the leading provider of professional healthcare products and services in the Israeli market. In addition to generic and specialty pharmaceutical
products, we sell and distribute a wide range of healthcare products and services, including OTC, vitamins, minerals and supplements, baby formulaproducts and other consumer healthcare products (as part of PGT’s activities), hospital supplies, dialysis equipment and disposables, diagnostics and homecare services. Our Israeli product portfolio also includes products sold under licensing arrangements. Our distribution company provides logistical supportand distributes third-party products.
The Israeli generic pharmaceutical market is a full substitution market (by regulation) and is dominated by four government mandated health fundswhich provide an extensive range of healthcare services, including pharmaceuticals, to all citizens. Prices for our products in Israel are significantly affectedby pricing regulations and governmental policies, as well as the structure of the market. Israeli pricing regulations use a reference pricing mechanism whichtakes into account pricing in several European countries, leading to relatively low prices in the market.
Competitive Landscape . Generic competition, which has increased in recent years, is expected to continue, with additional pressure on prices comingfrom the healthcare funds and other institutional buyers. The health funds are increasing their market share in the OTC market, holding over 25%, resultingin a decrease of the average selling price. Introduction of private labels into the retail market has increased competition in the OTC market, a trend that isexpected to intensify.
Regulatory Highlights. The Israeli Ministry of Health requires pharmaceutical companies to conform to internationally recognized standards. Otherlegal requirements prohibit the manufacturing, importation and marketing of any medicinal product unless it is approved in accordance with theserequirements. Significant regulatory changes and updates have been issued regarding GMP including a new set of importers’ responsibilities for the release ofbatches and the designation of a new function: QP (Qualified Person), following EU standards.
Operations and R&D
Research and DevelopmentOur research and development activities span the full breadth of our business, including generic medicines (finished goods and API), specialty
pharmaceuticals, new therapeutic entities (“NTEs”), which are known molecules that are formulated, delivered or used in a novel way to address unmetpatient needs, and OTC
37

Table of Contents
medicines. All research and development activities, except for API, have been integrated into a single unit, Teva Global R&D.
A major area of focus is the development of new generic medicines. We develop products in all therapeutic areas that are equivalent to innovativepharmaceuticals. Our emphasis is on developing high-value products, such as those with complex technologies and formulations. Generic R&D activities,which are carried out in development centers located throughout the world, include product formulation, analytical method development, stability testing,management of bioequivalence and other clinical studies, and registration of generic drugs in all of the markets where we operate.
Over the past several years, our generic R&D capabilities have expanded beyond tablets, capsules, liquids, ointments and creams to other dosage formsand delivery systems, such as matrix systems, special coating systems for sustained release products, orally disintegrating systems, sterile systems such asvials, syringes and blow-fill-seal systems, and more recently capability build-up in long-acting release injectables, transdermal patches, oral thin film, drugdevice combinations and nasal delivery systems for generic drugs. We have more than one thousand generic products in our pipeline (each product beingequivalent to a molecule, dosage form and market combination).
In addition, Teva’s generic R&D supports PGT in developing OTC products, as well as in overseeing the work performed by contract developers ofproducts selected by PGT.
Another major area of focus for Teva Global R&D is the development of novel specialty products in our key therapeutic areas of CNS and respiratory,with select projects in additional areas. These specialty R&D activities range from the discovery of new compounds, preclinical studies (including toxicology,pharmacokinetics, pharmacodynamics and pharmacology studies) to clinical pharmacology and the design, execution and analysis of clinical trials. Weconduct these activities for both small molecules and biologics. Our specialty R&D activities also include process development.
Our specialty pipeline includes product candidates in several therapeutic areas, with a focus on CNS and respiratory products, and selective innovationin the areas of oncology, women’s health, and biologics. We focus our investments on novel drug candidates, specialty compounds that utilize specificproprietary devices or technology, biosimilars and bio-betters. We intend to continue to supplement our specialty pipeline, as necessary, by in-licensing oracquiring products including small molecules, biologics, biosimilars and bio betters, focused in critical therapeutic areas. This approach to investing, whichwill result in “constellations” of related opportunities, is designed to create a robust and sustainable pipeline. We also hold a small number of investments incertain early stage companies that we believe have promising technologies or products.
Below is a table listing selected pipeline products in clinical development:
Project / Compound Potential Indication Formulation
Clinical Phase(month and year ofentering Phase III)
CNS MULTIPLE SCLEROSIS Glatiramer acetate 40mg (Copaxone ) Relapsing remitting multiple sclerosis Subcutaneous Phase III completedLaquinimod
Relapsing remitting multiple sclerosis
Oral
US—III (Nov 2007)EU—Pre-submission
Pridopidine (Huntexil ) Motor disorders Oral II/IIIXEN402
Painful disorders
Oral andtopical
II
OTHER CNS Tamper deterrent hydrocodone Chronic pain Oral III (Oct 2010)
38
®
®

Table of Contents
Armodafinil (Nuvigil )
Adjunctive therapy for treating bi-polardepression disorder in adults
Oral
III (Feb 2009)
RESPIRATORY Beclomethasone dipropionate HFA Nasal (Qnasl ) Pediatric allergic rhinitis Nasal III (Oct 2012)Albuterol Spiromax Asthma/COPD Inhalation III (Oct 2012)Reslizumab Severe asthma with eosinophilia Intravenous III (Feb, 2011)Budesonide Formoterol Spiromax Asthma/COPD Inhalation EU—pre-submissionFluticasone Propionate Salmeterol Spiromax Asthma/COPD Inhalation IIFluticasone Propionate Spiromax Asthma/COPD Inhalation IIFluticasone Propionate Salmeterol HFA Asthma/COPD Inhalation I (Bioequivalence)ONCOLOGY Balugrastim—albumin fused G-CSF Neutropenia cancer Subcutaneous US—submittedXM 22—glycoPEGylated G-CSF (Lonquex )
Neutropenia cancer Subcutaneous
US, EU, Russia—submitted
OGX-011/TV-1011
Metastatic castrate resistant prostate cancer
Intravenous
III (1st line: Dec2010; 2nd line: Oct2012)
OGX-011/TV-1011 Non-small cell lung cancer Intravenous III (Oct 2012)WOMEN’S HEALTH Progesterone Vaginal Ring (Milprosa™) Luteal support for in vitro fertilization Vaginal ring US—submittedOxybutynin Vaginal Ring (DR-3001) Overactive bladder Vaginal ring III (May 2008)XM17—Follitropin alfa
Female infertility; anovulation; assistedreproductive techniques; hypogonadism
Subcutaneous
EU—submitted
Desogestrel and ethinyl estradiol (LeCette™) 28-day oral contraceptive Oral III (Aug 2010)Levonorgestrel desogestrel andethinyl estradiol (Quartette™) 91-day extended regimen oral contraceptive Oral FDA submissionCARDIOVASCULAR Mesynchymal precursor cells (Revascor )
Congestive heart failure
IntracardiacInjection II
Mesynchymal precursor cells (revascor ) Acute myocardial infarction
IntracardiacInjection II
OTHER Laquinimod Crohn’s disease Oral IILaquinimod Lupus nephritis and Lupus arthritis Oral I/II
39
®
®
®
®
®
®
®
®
®

Table of Contents
CNSLaquinimod is a once-daily, orally administered immunomodulatory compound being developed for treatment of relapsing-remitting multiple sclerosis.
We acquired the exclusive rights to develop, register, manufacture and commercialize laquinimod worldwide from Active Biotech. Under the agreement, wemade an upfront payment to Active Biotech and will be required to make additional payments upon the achievement of various sales targets and othermilestones, up to a maximum of $92 million. Active Biotech will also receive tiered double-digit royalties on sales of the product.
In April 2011, we announced the final results of the ALLEGRO Phase III study. The results demonstrated that relapsing-remitting multiple sclerosispatients treated with 0.6 mg daily oral laquinimod experienced a statistically significant reduction in annualized relapse rate compared to placebo. Additionalclinical endpoints, including significant reduction in disability progression, as measured by EDSS, were also achieved. In August 2011, we announced theresults of BRAVO, a second Phase III study. In this study, the primary endpoint of reduction in annualized relapse rates compared to placebo did not reachstatistical significance. The observed safety and tolerability profile of laquinimod in both the ALLEGRO and the BRAVO trials was considered favorable. Weare in the process of initiating a third Phase III study of laquinimod, CONCERTO, scheduled to begin in early 2013, with the primary endpoint of impact ondisability progression.
In June 2012, we submitted a Marketing Authorization Application to EMA and in August 2012 we submitted a New Drug Submission to HealthCanada. We are planning additional submissions during 2013.
Based on laquinimod’s novel mechanism of action, which has been manifested clinically in a statistically significant reduction of disability asmeasured by the Expanded Disability Status Scale and brain volume loss, as demonstrated in pooled data from the Phase III studies conducted to date, we areplanning further clinical studies of laquinimod as add-on therapy in patients with relapsing-remitting multiple sclerosis and as monotherapy in patients withprogressive forms of MS.
Laquinimod is currently in Phase II development for Crohn’s Disease (“CD”) and in Phase I/II studies for lupus nephritis and lupus arthritis. In October2012, we announced the results of the Phase IIa study of laquinimod in moderate to severe CD. The findings demonstrated that treatment with orallyadministered laquinimod 0.5 mg/day resulted in an early and consistent effect on remission (48.3% vs. 15.9% of patients, respectively) and response rates(62.1% vs. 34.9% of patients, respectively) in patients with moderate-to-severe CD versus placebo. Further clinical studies in CD are under review. Results ofthe Phase I/II studies for lupus are expected in early 2013.
Laquinimod is protected by patents expiring in 2019 worldwide, with potential for extensions in various markets.
Tamper Deterrent Hydrocodone is our formulation of hydrocodone utilizing our OraGuard™ technology, which we believe provides deterrenceagainst various tampering methods, including chewing, aqueous extraction for IV dosing and alcohol extraction. A Phase III study was completed in August2011, but did not demonstrate a statistically significant difference between the hydrocodone and placebo treatment groups. A newly designed Phase III studywill be initiated in early 2013.
Huntexil (pridopidine) is an oral small molecule dopamine stabilizer being developed for the symptomatic treatment of motor disorders (includingHuntington’s disease, or “HD”), which we licensed from Neurosearch A/S in late 2012. We intend to design and complete new clinical studies of pridopidineto assess its potential for symptomatic relief of HD. NeuroSearch A/S performed advanced-stage clinical studies of pridopidine in the United States, Europeand Canada in patients with HD, in which a significant treatment effect on Total Motor Score was demonstrated, but the primary endpoint of Modified TotalMotor score was not met. Data from the
40
®

Table of Contents
clinical studies were presented to the FDA and EMA in the first half of 2011, but were found insufficient to file for marketing approval.
XEN402 is a small molecule intended to treat pain locally at its source through blocking of Nav1.7 and Nav1.8 sodium channels, which are found insensory nerve endings that can increase in chronic painful conditions. XEN402 was licensed from Xenon Pharmaceuticals Inc. in December 2012. XEN402has been studied in human subjects as both oral and topical forms. XEN402 is currently in Phase II clinical development for a variety of pain-relateddisorders. In an early study, oral XEN402 was shown to be effective at relieving the pain associated with the rare neuropathic pain condition, erythromelalgia.Topical XEN402 was studied in a Phase II trial to evaluate for effectiveness in alleviating the pain of post herpetic neuralgia. In this study the proportion ofpatients reporting clinically meaningful reductions in pain was significantly greater for topical XEN402 than for placebo.
RespiratoryA primary area of focus of our respiratory R&D is the development of products based on our proprietary delivery systems, including Easi-Breathe ,
our advanced breath-actuated inhaler (“BAI”), Spiromax /Airmax , our novel inhalation-driven multi-dose dry powder inhaler, and Steri-Neb , the advancedsterile formulations for nebulizers. This strategy is intended to result in “device consistency,” allowing physicians to choose which device best matches apatient’s needs both in terms of ease of use and effectiveness of delivery of the prescribed molecule. In addition, we develop novel molecules for respiratorydisease.
Albuterol Spiromax is a dry-powder inhaler formulation of albuterol in our Spiromax device that is designed to be an improvement to our ProAirHFA. Results of two safety and efficacy studies have confirmed the safety, efficacy, pharmacokinetic and pharmacodynamic profile of albuterol Spiromax .The Phase III program is ongoing.
Reslizumab is an investigational humanized monoclonal antibody (mAb) against interleukin-5 (IL-5). IL-5 has been shown to play a crucial role in thematuration, growth and chemotaxis (movement) of eosinophils, inflammatory white blood cells implicated in a number of allergic diseases. We areinvestigating reslizumab in Phase III studies as a possible treatment for severe asthma with eosinophilia. Results of these studies are expected in 2014.
Budesonide Formoterol Spiromax is a combination utilizing our proprietary Spiromax device. Results of our studies confirm that we havedemonstrated bio-equivalence to the marketed product (Symbicort Turbohaler ). We submitted a European marketing authorization application in January2013.
Fluticasone Propionate Salmeterol Spiromax is a new formulation of this combination using our Spiromax device, with an enhanced lungdelivery that is designed to allow lower doses to achieve the same clinical outcomes as Advair Diskus. Phase II trials commenced in 2012.
Fluticasone Propionate Spiromax is a new formulation of this combination using our Spiromax device, with an enhanced lung delivery that isdesigned to allow lower doses to achieve the same clinical outcomes as Flovent Diskus. Phase II trials commenced in 2012.
Fluticasone Propionate Salmeterol HFA MDI is designed to be comparable to Advair /Seretide HFA, delivered in a well established press-and-breath device. We expect to complete clinical studies in 2014.
OncologyBalugrastim is a long-acting G-CSF using albumin-fusion technology initially developed by Human Genome Sciences to prolong plasma half-life.
Balugrastim is designed to provide clinical efficacy and safety
41
®
® ® ®
® ® ®
®
® ®
® ®
® ®
®
® ®
®
® ®

Table of Contents
profiles comparable to Neulasta . In July 2011, we entered into a settlement agreement with Amgen to resolve litigation concerning certain of our G-CSFproducts in the United States. We agreed to an entry date of November 10, 2013 for our balugrastim product in the United States. In exchange, we consented tovalidity and enforceability of the patent in dispute. We submitted balugrastim for registration in the United States in December 2012 and expect to file forsubmission in Europe in 2013. Balugrastim is protected by a patent in the United States until 2014, with the potential for patent term extension.
Lonquex (lipegfilgrastim) is a long-acting G-CSF based on glycopegylation technology. Glycopegylation of G-CSF leads to a prolonged plasma half-life. Lonquex was shown in clinical trials to provide clinical efficacy and safety profiles which are comparable to Neulasta . Lonquex was submitted forregistration in Europe, the United States, and Russia. Lonquex is protected by patents expiring in 2023 in the United States and in 2024 in Europe, with thepotential for patent term extensions.
Custirsen/TV-1011 (OGX-011) is an antisense drug. In December 2009, Teva and OncoGenex entered into a global license and collaboration agreementto develop and commercialize custirsen/TV-1011/OGX-011. Custirsen was developed by Isis Pharmaceuticals Inc. and licensed to OncoGenex, and is designedto inhibit the production of clusterin, a protein associated with cancer treatment resistance. Custirsen was developed to increase the efficacy ofchemotherapeutic drugs and may have broader market potential to treat various indications and disease stages.
In November 2012, enrollment was completed in a large Phase III randomized trial of custirsen in combination with docetaxel and prednisone in theinitial chemotherapy treatment of patients with castrate resistant prostate cancer. In addition, enrollment started in two new Phase III studies: a randomized trialof custirsen in combination with cabazitaxel and prednisone for the second-line treatment of patients with castrate-resistant prostate cancer, and a randomizedtrial of custirsen in combination with docetaxel for the second-line treatment of patients with non-small cell lung cancer.
Obatoclax is a Pan Bel-2 inhibitor with particular potency for the dominant protein Mel-1. Final data from the randomized Phase II trial of obatoclaxevidenced a lower than expected treatment effect in lung cancer, as well as CNS activity. Based on these results, we decided not to pursue the Phase III trial inthe non-small cell lung cancer indication and the product is currently being investigated in pre-clinical studies for other indications.
Women’s HealthProgesterone vaginal ring (Milprosa™) is a silicone-based, flexible ring designed to be dosed weekly for luteal support for in vitro fertilization.
Clinical studies indicated that Milprosa™ is not inferior to the approved progesterone gel and that the product was safe and well-tolerated, with a profileconsistent with the known profile of progesterone. We filed an NDA with the FDA in 2010 and received a complete response letter in 2011 requiring asafety/efficacy study in women aged over 34 years prior to approval or as a post-marketing commitment. We plan to file a response to the FDA’s letter in 2013.Our patent applications for the product are pending.
Oxybutynin vaginal ring (DR-3001) is a silicone-based, flexible ring designed to be dosed once a month to treat overactive bladder (OAB). This newand innovative delivery system for the intravaginal delivery of oxybutynin has been developed to minimize side effects caused when taking treatments orally.Results of our Phase III trials for treatment of patients with OAB symptoms demonstrate statistically significant reductions for active treatment relative toplacebo in total weekly incontinence episodes and average daily urinary frequency. The product was generally well-tolerated with a safety profile favorable tooral treatments and comparable to other non-oral treatments. However, due to limitations surrounding a manufacturing site transfer, a contemporaneously-controlled bridging study to demonstrate the bioequivalence of the “to be marketed” product to the product used in the clinical studies, based onpharmacokinetic characteristics, could not be conducted, and an additional Phase III safety/efficacy study may be required.
XM17 (follitropin alfa) is a biosimilar product to Gonal-f for the treatment of female infertility. We submitted XM17 for registration in Europe in 2012.
42
®
®
® ® ®
®
®

Table of Contents
LeCette™ is a 28-day oral contraceptive with 21-day regimen of desogestrel and ethinyl estradiol (“EE”) followed by a 7-day regimen of EE alone. Weare currently conducting a Phase III study and, assuming positive results, expect to file an NDA with the FDA in 2013. In clinical trials, LeCette™ hasdemonstrated a safety profile similar to that of other 28-day oral contraceptives.
Quartette™ is a 91-day extended regimen oral contraceptive, with an 84-day phasic regimen of a constant levonorgestrel dose and an increasing EEdose, followed by a seven-day regimen of EE alone. In 2012, we filed an NDA with the FDA. In clinical trials, Quartette™ demonstrated a safety profilesimilar to that of Seasonique and other 28-day oral contraceptives. Our patent applications for the product are pending.
CardiovascularRevascor (mesynchymal precursor cells) consists of human stem cells, the immature cells that give rise to different types of mature cells that make up
the organs and tissues of the human body. In December 2010, Cephalon entered into a strategic alliance with Mesoblast Ltd. to develop and commercializeMesoblast’s mesynchymal precursor cell therapeutics for hematopoietic stem cell transplantation in cancer patients, certain central nervous system disorders,as well as certain cardiovascular conditions, including congestive heart failure and acute myocardial infarction.
Congestive heart failure remains a leading cause of hospital admissions, morbidity and mortality in the Western world. Heart failure affects as many as20 million people worldwide.
In January 2011, interim results from the ongoing multi-center Phase II trial of Revascor for patients with congestive heart failure were announced.Based on these Phase II results, and assuming timely finalization of the chemistry and manufacturing controls requirements, we are planning to initiate aPhase III study in 2013. This study will include an interim analysis, after an initial cohort of patients has completed six months of follow up.
New Therapeutic Entities (“NTEs”)A new area of focus of Teva Global R&D is the development of new therapeutic entities. NTEs are known molecules that are formulated, delivered or
used in a novel way to address unmet patient needs. Examples of NTEs include fixed-dose-combinations that improve adherence and therefore efficacy (for usein HIV, for example), drugs with prolonged half-lives to reduce frequency of administration, drugs with modified pharmacokinetic profiles to reduce sideeffects, drugs that are administered orally instead of by injection, drugs that are delivered in ways that address the needs of special patient populations (forexample, children and the elderly), and drugs that are approved for new indications.
Many NTEs have achieved significant commercial successes (e.g., J&J’s Duregesic fentanyl patch, Purdue’s Oxycontin , and Lundbeck’s Namendafor Alzheimer’s disease). However, without a systematic effort, the development of successful NTE products will continue to be sporadic.
Teva’s approach to the development of NTEs will be unprecedented in terms of scale, scope and dedication of resources. The successful development ofNTEs requires access to a wide range of specialty and generic R&D capabilities: an understanding of medical needs, clinical and regulatory development,formulation know-how and special technologies, intellectual property and access to a large portfolio of generic molecules. The integration of our specialty andgeneric R&D groups into a single organizational unit—Teva Global R&D—creates a unique infrastructure that includes the entire range of capabilitiesrequired for the development of NTEs.
This unique organization is supported by a dedicated process for generating and screening ideas for NTEs. Drawing on a wide range of internal andexternal sources, we are generating more than 100 NTE ideas per year, of which we expect ten to be approved for development each year. To date, severalNTEs have already been internally approved for development.
Because NTEs involve proven targets with known efficacy and safety profiles, we expect their development to involve reduced risks and costs, andshorter timelines compared to novel drugs. On the other hand, there are multiple avenues to exclusivity for NTEs, leveraging both regulatory and patentexclusivity to protect novel formulations, combinations and indications. Therefore, we believe that rewards from an NTE can be sustained over long periods.
43
®
®
®
® ® ®

Table of Contents
We believe that the combination of our unique organization, dedicated processes and the planned scale of our effort to generate NTEs, together with theirfavorable risk/ reward profiles, will create significant opportunities for Teva.
API R&DOur API R&D division operates independently from Teva Global R&D, and focuses on the development of processes for the manufacturing of API,
including intermediates, chemical and biological (fermentation), which are of interest to the generic drug industry, as well as for our proprietary drugs. Ourfacilities include a large center in Israel (synthetic products and peptides), a large center in Hungary (fermentation and semi-synthetic products), a facility inIndia and additional sites in Italy, Croatia, Mexico and the Czech Republic (for development of high-potency API). Our substantial investment in API R&Dgenerates a steady flow of API products, enabling the timely introduction of generic products to market. The API R&D division also seeks methods tocontinuously reduce API production costs, enabling us to improve our cost structure.
Other ProjectsDuring 2012, we also developed or participated in the development of the compounds listed below, which are no longer included in our pipeline.
StemEx (allogeneic stem cell) was developed in a joint venture with Gamida Cell for the expansion of cord blood to be used in transplants. We havedecided not to market the product, and the joint venture is seeking another partner for this program.
CEP-37247 is an anti-tumor necrosis factor domain-based antibody for the treatment of sciatica with a lower molecular weight than traditionalantibodies. The compound is intended for the treatment of sub-acute sciatica (chronic radicular pain) in patients who have not responded to conventionaltherapy. CEP-37247 was evaluated in a randomized, double-blind, placebo-controlled, ascending-dose study to evaluate the safety and efficacy of thecompound.
DiaPep-277 is a 24 amino acid synthetic peptide believed to induce anti-inflammatory T-cells, block destruction of beta cells and preserve insulinsecretion. We have a license agreement with Andromeda Biotech Ltd. with respect to Diapep 277 , which is currently in Phase III clinical development as atreatment for newly diagnosed Type I diabetes patients. We have decided not to market the product and are cooperating with Andromeda to find a new partnerfor this program.
NexoBrid was developed by MediWound for the enzymatic removal of burn-injured tissue. We terminated the joint development agreements in 2012.
OperationsWe believe that our global product infrastructure provides us with the following capabilities:
• global research and development facilities that enable us to have the broadest product line and the most extensive generic pipeline in the United
States, as well as a leading global generic pipeline;
• finished-dose manufacturing facilities approved by the FDA, EMA and other regulatory authorities and located in countries around the world,
which offer a broad range of production technologies and the ability to concentrate production to achieve economies of scale;
• API capabilities that offer a stable, high-quality supply of key active ingredients, as well as vertical integration efficiencies; and
• high-volume, technologically advanced distribution facilities that allow us to deliver new products to our customers quickly and efficiently,
providing a cost-effective, safe and reliable supply.
44
®
®
®
®

Table of Contents
These capabilities provide us the means to respond on a global scale to a wide range of requirements (both therapeutic and commercial) of patients,customers and healthcare providers.
Pharmaceutical ProductionWe operate 52 finished dosage pharmaceutical plants in North America, Europe, Latin America, Asia and Israel. These plants manufacture solid dosage
forms, sterile injectables, liquids, semi-solids, inhalers and medical devices. In 2012, Teva produced approximately 73 billion tablets and capsules and over720 million sterile units. Twenty-six of our plants are FDA approved, and thirty-one of our plants have EMA approval.
Our two primary manufacturing technologies, solid dosage forms and injectables, are available in North America, Latin America, Europe and Israel.The main manufacturing site for respiratory inhaler products is located in Ireland. The manufacturing sites located in Israel, Germany, Hungary and theCzech Republic make up a significant percentage of our production capacity.
We strive to optimize our manufacturing network, in order to maintain our goal of supplying high quality, cost-competitive products on a timely basis toall of our customers globally. In addition, we also use several external contract manufacturers to achieve operational and cost benefits.
In connection with our consumer healthcare joint venture with P&G, we acquired two OTC-dedicated plants in the United States from P&G, whichmanufacture solid dosage forms, powders, liquids, semi-solids, nasal products and lozenges.
During 2012, we continued to expand our manufacturing capabilities, focusing on strategic growth areas. We started the construction of a new oral soliddosage facility in Russia and a new OTC manufacturing facility in India. We invested in expanding our manufacturing facility in Japan and in our globalsterile manufacturing centers in Hungary and Croatia. In addition, our new state-of-the art logistics center in Shoham, Israel, began to operate during 2012,significantly increasing our technological and logistical capabilities. We constantly review these capabilities and our capacity utilization to ensure that theyalign with our ability to deliver the highest quality, best in class and most efficient products.
Our policy is to maintain multiple supply sources for our strategic products and APIs to the extent possible, so that we are not dependent on a singlesupply source. However, our ability to do so may be limited by regulatory or other requirements.
45

Table of Contents
Our principal pharmaceutical manufacturing facilities in terms of size and number of employees are listed below:
Facility Location Total Number ofSite Employees Principal Market(s) Served
Ulm, Weiler and Merckle, Germany 1,787 Europe and other non-U.S. marketsTakayama, Japan 1,648 AsiaOpava, Czech Republic 1,050 North America, Europe and other marketsDebrecen, Hungary 1,043 Europe and other non-U.S. marketsKfar Saba, Israel 1,021 North America, Europe and other marketsZagreb, Croatia 915 North America, Europe and other marketsGodollo, Hungary 814 North America, Europe and other marketsJerusalem, Israel 717 North America and EuropeToronto, Canada 609 North America and EuropeKrakow, Poland 5 9 6 North America, Europe and other marketsForest, VA, U.S. 579 North AmericaMaipu, Santiago, Chile 548 Latin AmericaHaarlem, The Netherlands 496 North America, Europe and other marketsRuncorn, U.K. 480 North America, Europe and other marketsSellersville, PA, U.S. 472 North AmericaCincinnati, OH, U.S. 430 North AmericaIrvine, CA, U.S. 403 North AmericaWaterford, Ireland 360 North America, Europe and other markets
Raw Materials for Pharmaceutical ProductionWe source a major portion of our APIs from our own manufacturing facilities. Additional APIs are purchased from suppliers located in Europe, Asia and
the United States. We have implemented a supplier audit program to ensure that our suppliers meet our high standards, and take a global approach tomanaging our commercial relations with these suppliers.
We have 21 API production facilities located in Israel, Hungary, Italy, the United States, the Czech Republic, India, Mexico, Puerto Rico, Monaco,China and Croatia. We produce approximately 300 APIs covering a wide range of products, including respiratory, cardiovascular, anti-cholesterol, centralnervous system, dermatological, hormones, anti-inflammatory, oncology, immunosuppressants and muscle relaxants. Our API intellectual property portfolioincludes over 800 granted patents and pending applications worldwide.
We have expertise in a variety of production technologies, including chemical synthesis, semi-synthetic fermentation, enzymatic synthesis, high potentmanufacturing, plant extract technology, and peptides synthesis, vitamin D derivatives synthesis and prostaglandins synthesis. Our advanced technology andexpertise in the field of solid state particle technology enable us to meet specifications for particle size distribution, bulk density, specific surface area,polymorphism, as well as other characteristics.
Our API facilities meet all applicable current Good Manufacturing Practices (cGMP) requirements under U.S., European, Japanese and other applicablequality standards. Our API plants are regularly inspected by the FDA, European agencies or other authorities as applicable. During 2012, all inspections ofour API facilities worldwide found our manufacturing practices at all sites to be in compliance.
Environment
As part of our overall corporate responsibility, we are committed to environmental, health and safety matters in all aspects of our business. In 2012, wereorganized our environment, health and safety (“EHS”)
46

Table of Contents
division, which is now headed by a newly-appointed Global Environment Director. We further updated and enhanced our EHS policy on a variety ofenvironmental issues, and have prepared a new set of standards that we intend to implement in 2013.
As a vertically integrated pharmaceutical company with worldwide operations, we believe that our adherence to applicable laws and regulations, togetherwith proactive management which goes beyond mere compliance, enhances our manufacturing competitive advantage, minimizes business and operationalrisks and helps us to avoid adverse environmental effects in the communities where we operate. We believe that we are in substantial compliance with allapplicable environmental, health and safety requirements.
ORGANIZATIONAL STRUCTUREAs of December 31 2012, we are organized into four commercial units, by region: (1) the Americas, (2) Europe, (3) Eastern Europe, Middle East, Israel
and Africa (“EMIA”) and Asia-Pacific (“APAC”), and (4) Japan and South Korea. These units coordinate all sales of generic, specialty and OTC medicineswithin their regions, as well as all other regional commercial activities.
In addition to these regional commercial units, our activities are conducted by two global divisions, Teva Global Operations (“TGO”) and Teva GlobalR&D, and by general corporate functions that include finance, legal, information system, business development and human resources. TGO’s responsibilitiesinclude manufacturing and commercialization of APIs, manufacturing of pharmaceuticals, procurement and our supply chain. Teva Global R&D isresponsible for our overall research and development for generic medications, NTEs and specialty products. In 2012, we established a global women’s healthorganization. We expect continued refinements of this structure over the next year to align it more closely with our new strategy and expect, among otherchanges, to establish a global specialty pharmaceuticals unit to ensure the most effective and efficient operations worldwide.
47

Table of Contents
Our worldwide operations are conducted through a network of global subsidiaries primarily located in North America, Europe, Latin America, Asia andIsrael. We have direct operations in approximately 60 countries, as well as 52 finished dosage pharmaceutical manufacturing sites in 25 countries, 21 APIsites and 17 pharmaceutical R&D centers. The following sets forth, as of December 31, 2012, our principal operating subsidiaries in terms of sales to thirdparties: Name of Subsidiary CountryTeva Canada Limited CanadaPliva Hrvatska d.o.o. CroatiaTeva Czech Industries s.r.o. Czech RepublicTeva Santé S.A.S. FranceCephalon France S.A.S. FranceMerckle GmbH GermanyTeva GmbH Germanyratiopharm GmbH GermanyCT- Arzneimittel GmbH GermanyTeva Pharmaceutical Works Private Limited Company HungaryNorton (Waterford) Limited IrelandTeva Pharmaceutical Industries Ltd IsraelTeva Italia S.r.l. ItalyTeva Pharma Japan, Inc. JapanTeva Pharmaceuticals Polska sp. z o.o PolandTeva LLC RussiaTeva Pharma S.L. SpainTeva Pharmaceuticals Europe B.V The NetherlandsPharmachemie Holding B.V The NetherlandsTeva UK Limited United KingdomIvax UK Limited United KingdomTeva Pharmaceuticals USA, Inc. United StatesTeva API, Inc. United States
In addition to the subsidiaries listed above, we have operations in various strategic and important locations, including China, India, Turkey and otheremerging and smaller markets.
Properties and FacilitiesListed below are our principal facilities and properties in various regions of the world and their size in square feet as of December 31, 2012:
Facility Location Square Feet
(in thousands)* Main FunctionIsrael Ramat Hovav 1,355 API (chemical) manufacturing and R&DKfar Saba 757 Pharmaceutical manufacturing, research laboratories, warehousing, and officesJerusalem (3 sites) 516 Pharmaceutical manufacturing, research laboratories and officesShoham Logistics Center 538 Distribution centerNetanya (3 sites)
508
API (chemical) manufacturing, pharmaceutical warehousing, laboratories,distribution center and offices
Petach Tikva 291 Corporate headquartersAshdod 130 Manufacturing of hospital suppliesAssia—Petach Tikva 118 R&D laboratories
48

Table of Contents
Facility Location Square Feet
(in thousands)* Main FunctionUnited States North Wales area, PA (4 sites) 808 Teva USA headquarters, warehousing and distribution centerPhoenix, AZ (2 sites) 296 Manufacturing, packaging and officesForest, VA 408 Manufacturing, packaging and officesIrvine, CA (8 sites) 342 Pharmaceutical manufacturing and R&D laboratoriesCincinnati, OH 305 Pharmaceutical manufacturing, R&D laboratories and packagingMiami, FL (3 sites) 223 Manufacturing, R&D laboratories, warehousing and officesKutztown, PA 211 WarehousingSellersville, PA 206 Pharmaceutical manufacturing, packaging and R&D laboratoriesGreensboro, SC 500 Manufacturing, packaging and officesSalt Lake City, UT 194 Manufacturing, packaging and officesFrazer, PA 188 OfficesPomona, NY 181 Pharmaceutical manufacturing and R&D laboratoriesGuayama, Puerto Rico 170 API (chemical) manufacturingWest Chester, PA 165 LaboratoriesMexico, MO (4 sites) 144 API (chemical) manufacturingKansas City MO 117 OfficesCanada Toronto, Ontario
335
Offices, pharmaceutical packaging, warehousing, distribution center andlaboratories
Stouffville, Ontario 155 Pharmaceutical manufacturing and R&D laboratoriesMarkham, Ontario 122 Pharmaceutical manufacturing and warehousingEurope Debrecen, Hungary
2,711
Pharmaceutical manufacturing, API (chemical) manufacturing, R&D laboratoriesand warehousing
Ulm, Germany 1,675 Pharmaceutical manufacturing and officesOpava, Czech Republic
1,466
Pharmaceutical and API (chemical) manufacturing, warehousing and distributioncenter
Zagreb, Croatia (5 sites)
869
Pharmaceutical manufacturing, packaging and warehousing, API (chemical)manufacturing and R&D laboratories
Savski Marof, Croatia 581 API (chemical) manufacturingGödöllõ, Hungary
183
Pharmaceutical manufacturing, hospital supplies manufacturing, R&Dlaboratories, distribution center, packaging and warehousing
Kutno, Poland 290 Pharmaceutical manufacturing, warehousing and packagingKrakow, Poland 939 Pharmaceutical manufacturing and warehousingWaterford, Ireland (2 sites) 435 Pharmaceutical manufacturing, warehousing and packaging
49

Table of Contents
Facility Location Square Feet
(in thousands)* Main FunctionWeiler, Germany 425 Pharmaceutical manufacturing and packagingHaarlem, The Netherlands 232 LaboratoriesGlasshoughton, England 247 Warehousing and distribution centerZaragoza, Spain 239 Pharmaceutical manufacturing, R&D laboratoriesEastbourne, England 163 Warehousing and packagingRuncorn, England (2 sites) 241 Pharmaceutical manufacturing, warehousing, laboratories and officesSanthia, Italy 177 API (chemical) manufacturing, R&D laboratories and warehousingVilnius, Lithuania (2 sites) 97 Pharmaceutical manufacturing and R&D laboratoriesTallinn, Estonia 174 OfficesSajababony, Hungary 374 Mixed useDublin, Ireland (2 sites) 188 Marketing, manufacturingAsia Takayama, Japan 1,009 Pharmaceutical manufacturingGajraula (U.P.), India 1,200 API (chemical) manufacturingGoa, India 285 Pharmaceutical manufacturing and R&D laboratoriesMalanpur, India 302 API (chemical) manufacturingHangzhou, China 609 API (chemical) manufacturingKasukabe, Japan 169 Pharmaceutical manufacturingKoka, Japan 151 Pharmaceutical manufacturingTeda, China
193
Marketing, manufacturing, warehousing and R&D laboratories, offices, API(chemical) manufacturing
Nagoya, Japan (2 sites) 141 OfficesLatin America Santiago, Chile 240 Pharmaceutical manufacturing, warehousing and R&D laboratoriesLima, Peru (3 sites) 221 Pharmaceutical manufacturing, warehousing and R&D laboratoriesMunro, Argentina 155 Pharmaceutical manufacturing, warehousing, R&D laboratories and packagingMexico City, Mexico 240 Pharmaceutical manufacturing, warehousing and R&D laboratories
We lease certain of our facilities. In Israel, our principal executive offices and corporate headquarters in Petach Tikva are leased until December 2014. InNorth America, our principal leased properties are the facilities in North Wales, Pennsylvania, which have lease terms expiring between 2013 and 2016, and awarehouse in New Britain, Pennsylvania, of which the initial lease term expires in 2013. We own and lease various other facilities worldwide.
50

Table of Contents
Regulation
United StatesFood and Drug Administration and the Drug Enforcement Administration
All pharmaceutical manufacturers selling products in the United States are subject to extensive regulation by the United States federal government,principally by the FDA and the Drug Enforcement Administration, and, to a lesser extent, by state and local governments. The federal Food, Drug, andCosmetic Act, the Controlled Substances Act and other federal statutes and regulations govern or influence the development, manufacture, testing, safety,efficacy, labeling, approval, storage, distribution, recordkeeping, advertising, promotion and sale of our products. Our facilities and products are periodicallyinspected by the FDA, which has extensive enforcement powers over the activities of pharmaceutical manufacturers. Noncompliance with applicablerequirements may result in fines, criminal penalties, civil injunction against shipment of products, recall and seizure of products, total or partial suspensionof production, sale or import of products, refusal of the government to enter into supply contracts or to approve NDAs and criminal prosecution by theDepartment of Justice. The FDA also has the authority to deny or revoke approvals of drug active ingredients and dosage forms and the power to halt theoperations of non-complying manufacturers. Any failure to comply with applicable FDA policies and regulations could have a material adverse effect on ouroperations.
FDA approval is required before any “new drug” (including generic versions of previously approved drugs) may be marketed, including new strengths,dosage forms and formulations of previously approved drugs. Applications for FDA approval must contain information relating to bioequivalence (forgenerics), safety, toxicity and efficacy (for new drugs), product formulation, raw material suppliers, stability, manufacturing processes, packaging, labelingand quality control. FDA procedures generally require that commercial manufacturing equipment be used to produce test batches for FDA approval. The FDAalso requires validation of manufacturing processes before a company may market new products. The FDA conducts pre-approval and post-approval reviewsand plant inspections to implement these requirements. Generally the generic drug development and the ANDA review process takes about three to five years.
The Drug Price Competition and Patent Term Restoration Act of 1984 (the “Hatch-Waxman Act”) established the procedures for obtaining FDA approvalfor generic forms of brand-name drugs. This Act also provides market exclusivity provisions that can delay the approval of ANDAs. One such provisionallows a five-year data exclusivity period for NDAs involving new chemical entities and a three-year data exclusivity period for NDAs (including differentdosage forms) containing a new clinical trial essential to the approval of the application. The Orphan Drug Act of 1983 grants seven years of exclusivemarketing rights to a specific drug for a specific orphan indication. The term “orphan drug” refers to a product that treats a rare disease affecting fewer than200,000 Americans. Market exclusivity provisions are distinct from patent protections and apply equally to patented and non-patented drug products. Anotherprovision of the Hatch-Waxman Act extends certain patents for up to five years as compensation for the reduction of effective life of the patent which resultedfrom time spent in clinical trials and time spent by the FDA reviewing a drug application.
Under the Hatch-Waxman Act, a generic applicant must make certain certifications with respect to the patent status of the drug for which it is seekingapproval. In the event that such applicant plans to challenge the validity or enforceability of an existing listed patent or asserts that the proposed product doesnot infringe an existing listed patent, it files a “Paragraph IV” certification. The Hatch-Waxman Act provides for a potential 180-day period of genericexclusivity for the first company to submit an ANDA with a Paragraph IV certification. This filing triggers a regulatory process in which the FDA is requiredto delay the final approval of subsequently filed ANDAs containing Paragraph IV certifications 180 days after the first commercial marketing of the drug bythe first applicant. Submission of an ANDA with a Paragraph IV certification can result in protracted and expensive patent litigation. When this occurs, theFDA generally may not approve the ANDA until the earlier of 30 months or a court decision finding the patent invalid, not infringed or unenforceable.
The Best Pharmaceuticals for Children Act, signed into law in 2002, continues the so-called “pediatric exclusivity” program begun in the FDAModernization Act of 1997. This pediatric exclusivity program provides
51

Table of Contents
a six-month extension both to listed patents and to regulatory exclusivities for all formulations of an active ingredient, if the sponsor performs and submitsadequate pediatric studies on any one single dosage form. An effect of this program has been to delay the launch of numerous generic products by anadditional six months.
The Medicare Prescription Drug, Improvement and Modernization Act (the “Medicare Modernization Act”) of 2003 modified certain provisions of theHatch-Waxman Act. Under the Medicare Modernization Act, the 180 day period of generic exclusivity rights may be forfeited under certain specifiedcircumstances, including if the product is not marketed within 75 days of a final court decision. With the growing backlog of applications, and the resultingincrease in the median time to approval of ANDAs, the number of forfeitures of exclusivity is likely to increase unless additional resources are provided withinthe FDA’s Office of Generic Drugs. To address these and other issues, members of industry and FDA met in 2011 to develop a generic drug user fee programin order to augment FDA’s congressional appropriations. User fee funding is anticipated to be sufficient to eliminate the backlog by 2017 as well as provideenhanced review metrics over the five-year period. Additionally, generic drug user fees are intended to bring parity between the U.S. and foreign inspections by2017 in order to ensure a consistent standard of quality for all drugs intended for the U.S. market. Implementation of the program began on October 1, 2012.In July 2012, Congress passed legislation that allowed the FDA to continue to collect user fees, payments to supplement the appropriations that the agencyreceives from Congress, for brand products and new user fee programs for generic and biosimilar products. As part of this legislation, Congress included aprovision that extended the period of time that a generic applicant has to receive tentative approval. Applications that were filed by the effective date of the bill,October 2012, and had not already forfeited generic exclusivity are entitled to a 40-month period to receive FDA review before triggering a forfeiture. Thisprovision sunsets over the five-year timeframe of the bill. However, for the applications to which this applies, the benefit is significant. Prospectively, the FDAwill be collecting the newly created user fee for generic products, funding new resources and improving future review times.
The passage of the Food and Drug Administration Amendments Act (FDAAA) in 2007 strengthened the FDA’s regulatory authority on post-marketingsafety and granted them the authority to control drug marketing and labeling, to require post-approval studies, to establish active surveillance systems, and tomake clinical trial operations and results more available to the public. Another provision provides for a six-month review clock for citizen petitions submittedto delay the approval of generic applications. A key provision also allows the FDA to require a risk evaluation and mitigation strategy for drugs associatedwith greater safety risks.
The Generic Drug Enforcement Act of 1992 established penalties for wrongdoing in connection with the development or submission of an ANDA byauthorizing the FDA to permanently or temporarily debar such companies or individuals from submitting or assisting in the submission of an ANDA, and totemporarily deny approval and suspend applications to market generic drugs. The FDA may suspend the distribution of all drugs approved or developed inconnection with wrongful conduct and also has authority to withdraw approval of an ANDA under certain circumstances. The FDA may also significantlydelay the approval of a pending NDA or ANDA under its “Fraud, Untrue Statements of Material Facts, Bribery, and Illegal Gratuities Policy.” Manufacturersof generic drugs must also comply with the FDA’s current Good Manufacturing Practices (cGMP) standards or risk sanctions such as the suspension ofmanufacturing or the seizure of drug products and the FDA’s refusal to approve additional ANDAs.
Products manufactured outside the United States and marketed in the United States are subject to all of the above regulations, as well as to FDA andUnited States customs regulations at the port of entry. Products marketed outside the United States that are manufactured in the United States are additionallysubject to various export statutes and regulations, as well as regulation by the country in which the products are to be sold.
Our products also include biopharmaceutical products that are comparable to brand-name drugs. Of this portfolio, only one, Tev-Tropin , is sold in theUnited States, while others are distributed outside of the United States. We plan to introduce additional products into the United States marketplace. As part ofthese efforts we filed a BLA for our GCSF product in 2009, which was approved by the FDA during 2012, and is expected, to be
52
®

Table of Contents
launched in November 2013. While regulations are still being developed relating to the Biologics Price Competition and Innovation Act of 2009 (“BPCI”), theFDA issued three substantial guidance documents in February 2012 that are intended to provide a roadmap for development of biosimilar products. Theseguidance documents address quality considerations, scientific considerations and questions and answers regarding commonly posed issues. These guidancedocuments are comprehensive documents that provide significant information on developing a product through the 351(k) (biosimilar) pathway. Theyrecommend a “stepwise approach” to development, including numerous meetings with FDA review staff during the development process. Most of therecommendations, however, are contingent on the FDA’s making subjective decisions during the development process on the scientific rigor employed tojustify decisions. While there is a benefit to having a flexible development process, the lack of concrete recommendations will significantly prolong thedevelopment process of these products. The guidance documents do not address the naming issue or intellectual property concerns , and provide very limitedinformation on the development of interchangeable products.
Government Reimbursement ProgramsIn early 2010, the United States enacted the Patient Protection and Affordable Care Act of 2010 (the “PPACA”), a comprehensive plan to decrease health
care costs and improve the quality of patient care. The PPACA seeks to reduce the federal deficit and the rate of growth in health care spending through, amongother things, stronger prevention and wellness measures, increased access to primary care, changes in health care delivery systems and the creation of healthinsurance exchanges. In addition, the PPACA requires the pharmaceutical industry to share in the costs of reform, by increasing Medicaid rebates, narrowingsales definitions for average manufacturer price purposes and expanding Medicaid rebates to cover Medicaid managed care programs. Other components ofhealthcare reform include funding of pharmaceutical costs for Medicare patients in excess of the prescription drug coverage limit and below the catastrophiccoverage threshold. Under the PPACA, certain pharmaceutical companies are now obligated to fund 50% of the patient obligation in this gap, or “donut hole.”Additionally, commencing in 2011, an excise tax was levied against certain branded pharmaceutical products. The tax is specified by statute to beapproximately $3 billion in 2012 through 2016, $3.5 billion in 2017, $4.2 billion in 2018, and $2.8 billion each year thereafter. The tax is to be apportionedto qualifying pharmaceutical companies based on an allocation of their governmental programs as a portion of total pharmaceutical government programs.
The Centers for Medicare and Medicaid Services (“CMS”) administer the Medicaid drug rebate program, in which pharmaceutical manufacturers payquarterly rebates to each state Medicaid agency. Generally, for generic drugs marketed under ANDAs, manufacturers (including Teva) are required to rebate13% of the average manufacturer price, and for products marketed under NDAs, manufacturers are required to rebate the greater of 23.1% of the averagemanufacturer price or the difference between such price and the best price during a specified period. An additional rebate for products marketed under NDAsis payable if the average manufacturer price increases at a rate higher than inflation, and other methodologies apply to new formulations of existing drugs.
In addition, the PPACA revised the methodologies for calculating the rebates, including the definition of “average manufacturer price.” CMS hasproposed, but not yet promulgated, a regulation implementing aspects of the PPACA in the Medicaid drug rebate program.
Various state Medicaid programs have adopted supplemental drug rebate programs that provide states with additional manufacturer rebates for patientpopulations that are not included in the traditional Medicaid drug benefit coverage.
European UnionThe medicines regulatory framework of the EU requires that medicinal products, including generic versions of previously approved products and new
strengths, dosage forms and formulations of previously approved
53

Table of Contents
products, must receive a marketing authorization before they can be placed on the market in the EU. Authorizations are granted after a favorable assessment ofquality, safety and efficacy by the respective health authorities. In order to obtain authorization, application must be made to the competent authority of themember state concerned. Besides various formal requirements, the application must contain the results of pharmaceutical (physico-chemical, biological ormicrobiological) tests, pre-clinical (toxicological and pharmacological) tests and clinical trials. All of these tests must have been conducted in accordance withrelevant European regulations and must allow the reviewer to evaluate the quality, safety and efficacy of the medicinal product.
During 2012, we continued to register products in the EU, using both the mutual recognition procedure (submission of applications in other memberstates following approval by a so-called reference member state) and the decentralized procedure (simultaneous submission of applications to chosen memberstates). We continue to use the centralized procedure to register our generic equivalent version of reference products that originally used this procedure.
In 2005, a legal pathway was established to allow approval of Similar Biological Medicinal Products (“biosimilars”) using abbreviated marketingapplications. Appropriate tests for demonstration of safety and efficacy include preclinical or clinical testing or both. The reference product for this testing isthe brand-name drug, and the scientific principles and regulatory requirements for comparability are followed. Guidelines have been issued providing a moredetailed interpretation of the data requirements for specific products, and further guidance is being developed by the respective authorities in conjunction withthe pharmaceutical industry.
In order to control expenditures on pharmaceuticals, most member states of the EU regulate the pricing of such products and in some cases limit therange of different forms of a drug available for prescription by national health services. These controls can result in considerable price differences amongmember states.
In addition to patent protection, exclusivity provisions in the EU may prevent companies from applying for marketing approval for a generic product foreither six or ten years (the period is selected by each country) from the date of the first market authorization of the original product in the EU. The 2005legislation, applicable to all members of the EU, changes and harmonizes the exclusivity period for new products where the application for marketing approvalwas submitted after October 2005 for products filed via the national pathway or November 2005 for products filed via the centralized procedure. The periodbefore marketing approval for a generic product can be pursued (known as data exclusivity) is eight years (from either six or ten years before) followingapproval of the reference product in the EU. Further, the generic product will be barred from market entry (marketing exclusivity) for a further two years, withthe possibility of extending the market exclusivity by one additional year under certain circumstances for novel indications. Given that reference productssubmitted after October or November 2005 will take at least one year to be assessed and approved, the 2005 exclusivity provisions of ‘8+2+1’ years willaffect only generic submissions for marketing approval lodged in late 2014 onwards.
The term of certain pharmaceutical patents may be extended in the EU by up to five years upon grant of Supplementary Patent Certificates (“SPC”).The purpose of this extension is to increase effective patent life (i.e., the period between grant of a marketing authorization and patent expiry) to fifteen years.Previously, longer extensions had been available; for example, French and Italian patents granted before the current SPC legislation came into force wereextended by up to eight and eighteen years, respectively.
Subject to the respective pediatric regulation, the holder of an SPC may obtain a further patent term extension of up to six months under certainconditions. This six month period cannot be claimed if the license holder claims a one-year extension of the period of marketing exclusivity based on thegrounds that a new pediatric indication brings a significant clinical benefit in comparison with other existing therapies.
Orphan designated products, which receive, under certain conditions, a blanket period of ten years market exclusivity, may receive an additional twoyears of market exclusivity instead of an extension of the SPC if the requirements of the pediatric regulation are met.
54

Table of Contents
The legislation also allows for research and development work during the patent term for the purpose of developing and submitting registration dossiers.
CanadaThe Canadian Federal Government, under the Food and Drugs Act and the Controlled Drug and Substances Act, regulates the therapeutic products that
may be sold in Canada and the applicable level of control. The Therapeutic Products Directorate is the national authority that evaluates and monitors thesafety, effectiveness and quality of drugs, medical devices and other therapeutic products. The TPD requires companies to make an abbreviated new drugsubmission in order to receive approval to manufacture and market generic pharmaceuticals.
The issuance of a market authorization or “Notice of Compliance” is subject to the Food and Drug Regulations, which provide, among other things, upto eight and one-half years of data exclusivity for innovative new drugs not previously approved for sale in Canada. Issuance of a Notice of Compliance forgeneric drug products is also subject to the Patented Medicines (Notice of Compliance) Regulations under the Patent Act. The Therapeutic Products Directoratewill not issue a Notice of Compliance if there are any patents relevant to the brand and generic drug products listed on the Patent Register maintained by HealthCanada, which were listed prior to the filing of the generic submission. Generic pharmaceutical manufacturers can serve a notice of allegation upon the brandcompany and, as is frequently the case, the brand company may commence litigation in response to the notice of allegation. In such cases a Notice ofCompliance will not be issued until the earlier of the expiration of a 24-month stay or resolution of the litigation in the generic company’s favor.
Every province in Canada offers a comprehensive public drug program for seniors and welfare recipients, and regulates the reimbursement price ofdrugs listed on their formularies for all patients. Most provinces in Canada have implemented price reforms aimed at reducing the reimbursement price ofgeneric products. Canadian provinces have been working separately and collectively to effect price reforms on a select number of high volume genericproducts. Ontario and Quebec regulations (representing 60% of the Canadian market) also include certain limitations related to trade allowances paid topharmacy customers and require generic companies to report the details of their transactions.
Miscellaneous Regulatory MattersWe are subject to various national, regional and local laws of general applicability, such as laws regulating working conditions. In addition, we are
subject to various national, regional and local environmental protection laws and regulations, including those governing the emission of material into theenvironment.
As discussed above, data exclusivity provisions exist in many countries worldwide and may be introduced in additional countries in the future,although their application is not uniform. In general, these exclusivity provisions prevent the approval and/or submission of generic drug applications to thehealth authorities for a fixed period of time following the first approval of the brand-name product in that country. As these exclusivity provisions operateindependently of patent exclusivity, they may prevent the submission of generic drug applications for some products even after the patent protection hasexpired.
ITEM 4A: UNRESOLVED STAFF COMMENTS
None.
5 5

Table of Contents
ITEM 5: OPERATING AND FINANCIAL REVIEW AND PROSPECTS
IntroductionWe are a fully-integrated global pharmaceutical company. Our business includes three primary areas: generic, specialty and OTC medicines. As the
world’s largest generic company with an established specialty medicines portfolio, we are strategically positioned to benefit from the current changes in theglobal healthcare environment.
Our business strategy seeks to capitalize on the growing global need for medicines and evolving market, economic and legislative dynamics. Thesechanges include aging populations, increased spending on pharmaceuticals in emerging market countries, economic pressures on governments and privatepayors to provide cost-effective healthcare solutions, global evolution in healthcare, legislative reforms, unmet patient needs, an increase in patient awarenessand the growing importance of OTC medicines.
We believe that our strategy, dedicated employees, world-leading generic expertise and portfolio, global reach, integrated R&D capabilities, globalinfrastructure and scale, position us at the forefront of a changing industry and will enable us to take advantage of opportunities created by these dynamics.
HighlightsSignificant highlights of 2012 included:
• Our revenues grew to $20.3 billion, an increase of approximately $2.0 billion, or 11%, over 2011. This growth was primarily the result of the
inclusion of a full year of revenues from Cephalon and Taiyo, which were included in our consolidated financial statements commencing Octoberand July 2011, respectively. In addition, global revenues from Copaxone grew to nearly $4 billion.
• Revenues increased in all geographies compared to 2011: by 19% in the United States, by 9% in our ROW region, and slightly in Europe.
• Global generics revenues reached $10.4 billion, an increase of 2% over 2011. The increase was due to higher revenues in the United States and our
ROW region, which were partially offset by lower revenues in Europe.
• Our specialty medicines portfolio generated revenues of $8.2 billion, an increase of 26% compared to 2011. The increase was due to the inclusion
of a full year of revenues from the Cephalon portfolio, as well as higher sales of Copaxone and Azilect . During the year we launched several newspecialty products, including Synribo™ and Qnasl .
• Net R&D spending amounted to $1.4 billion, 64% of which was invested in our specialty portfolio.
• G&A expenses amounted to $1.2 billion and net financial expenses amounted to $386 million, compared to $932 million and $153 million,
respectively, in 2011.
• Impairments, loss contingencies, restructuring and others amounted to $2.0 billion for the year, compared to $901 million for 2011.
• Operating income amounted to $2.2 billion, a decrease of $904 million compared to 2011, primarily as a result of increases in loss contingencies
and impairment charges.
• Cash flow from operating activities amounted to $4.6 billion, an increase of $438 million compared to 2011.
• Net income attributable to Teva in 2012 amounted to $2.0 billion, compared to $2.8 billion in 2011.
5 6
®
® ®
®

Table of Contents
• Exchange rate differences between 2012 and 2011 had a negative impact of approximately $572 million on revenues and a net positive impact on
operating income.
• During 2012, we refinanced $5 billion of debt, extending our average debt maturity to six years at December 31, 2012.
Acquisitions and Other Transactions
Sale of animal health unitIn January 2013, we sold our U.S.-based animal health business, exiting the business. We received approximately $50 million at closing and are entitled
to receive up to a further $91 million in milestone payments.
South Korea ventureIn December 2012, we formed a business venture in South Korea with Handok. We will be responsible for manufacturing and supplying a wide range
of generic and innovative medicines, and Handok will be responsible for sales and marketing, distribution, and regulatory affairs. Under the agreement, thereis a voting split of 60% and 40% and a profit split of 51% and 49% by Teva and Handok, respectively. This agreement had no effect on our 2012 financialresults.
XenonIn December 2012, we entered into a collaborative development and exclusive worldwide license agreement with Xenon for its compound XEN402.
XEN402 targets sodium channels found in sensory nerve endings that can increase in chronic painful conditions, and is currently in Phase II clinicaldevelopment for a variety of pain-related disorders. Under the agreement, we paid Xenon an upfront fee of $41 million. In addition, we may be required to paydevelopment, regulatory and sales-based milestones of up to $335 million. Xenon is also entitled to royalties on sales and has an option to participate incommercialization in the United States.
Acquisition of Neurosearch A/S assetsIn October 2012, we acquired from Neurosearch A/S, a Danish company, the rights, assets and obligations relating to Huntexil (pridopidine/ACR16),
a drug candidate being developed for the symptomatic treatment of hand movement, balance and gait disturbances in Huntington’s disease. Under theagreement, we paid NeuroSearch an upfront fee of $26 million. The achievement of regulatory and commercialization milestones may result in additionalpayments of up to approximately $10 million to NeuroSearch.
2011 Acquisitions and Other Transactions
Consumer Health Care Joint Venture with Procter & GambleIn November 2011, we formed a consumer health care joint venture with P&G, combining our OTC pharmaceutical businesses in all markets outside
North America. We manufacture products to supply the joint venture’s markets as well as P&G’s existing North American OTC business. We own 49% ofthe joint venture, and P&G owns 51%. As of December 2012, the OTC products of Cephalon (Mepha) were included in the joint venture.
CephalonIn October 2011, we acquired Cephalon for total consideration of $6.5 billion in cash. This acquisition diversified our specialty portfolio and enhanced
our innovative pipeline.
CureTechIn September 2011, we exercised an option to invest $19 million in CureTech, a biotechnology company. We also agreed to make further investments in
CureTech’s research and development activities. As a result of the
57
®

Table of Contents
option exercise, our ownership stake in CureTech increased from 33% to 75%. In January 2013, we announced the termination of our collaboration withCureTech.
Japanese TransactionsIn September 2011, we acquired the remaining shares in Taisho and the remaining 50% of our Japanese joint venture with Kowa Company Ltd. that we
did not already own. In July 2011, we acquired Taiyo for $1.1 billion in cash. Taiyo had developed a large portfolio of generic products in Japan, with over550 marketed products, and had advanced production facilities. Since April 2012, the majority of our Japan-based companies have operated under a singlecompany known as Teva Seiyaku.
Corporación InfarmasaIn January 2011, we acquired Corporación Infarmasa, a company in Peru with over 500 branded and unbranded generic pharmaceuticals.
Laboratoire ThéramexIn January 2011, we acquired Laboratoire Théramex for €267 million paid at closing and certain limited performance-based milestone payments.
Théramex’s product portfolio included a variety of women’s health products sold in over 50 countries, primarily in Europe.
2010 Acquisition
RatiopharmIn August 2010, we acquired the Merckle ratiopharm Group (“ratiopharm”), a global pharmaceutical company with operations in more than 20
countries, for a total cash consideration of $5.2 billion.
Results of OperationsThe following table sets forth, for the periods indicated, certain financial data derived from our U.S. GAAP financial statements, presented as
percentages of net revenues, and the percentage change for each item as compared to the previous year.
Percentage of Net RevenuesYear Ended December 31,
Percentage ChangeComparison
2012 2011 2010 2012-2011 2011-2010 % % % % % Net revenues 100.0 100.0 100.0 11 14 Gross profit 52.4 52.0 56.2 12 5 Research and development expenses—net 6.7 6.0 5.9 24 15 Selling and marketing expenses 19.1 19.0 18.4 12 17 General and administrative expenses 6.1 5.1 5.4 33 8 Impairments, loss contingencies, restructuring and others—net 9.7 4.9 2.5 119 120 Operating income 10.8 17.0 24.0 (29) (20) Financial expenses—net 1.9 0.9 1.4 152 (32) Income before income taxes 8.9 16.1 22.6 (38) (19) Provision for income taxes (0.7) 0.7 1.8 (208) (55) Share in losses of associated companies—net 0.2 0.3 0.1 (25) 154 Net income (loss) attributable to non-controlling interests (0.3) * * (689) 13 Net income attributable to Teva 9.7 15.1 20.7 (29) (17) * Represents an amount of less than 0.05%.
58

Table of Contents
Revenues
GeneralRevenues in 2012 were $20.3 billion, an increase of 11% over 2011. The increase was primarily the result of the inclusion of a full year of revenues of
Cephalon and Taiyo. Growth was also driven by higher generics revenues, mainly in the United States, and higher revenues of our specialty products,primarily Copaxone . The increase was partially offset by lower generics revenues in Europe as well as exchange rate fluctuations.
Revenues by Geographic AreaThe following table presents revenues by geographic area for the past three years:
Year Ended December 31, %
of2012
% of
2011
% of
2010 2012 2011 2010 U.S. $ in millions United States:
Generic $ 4,381 $ 3,957 $ 5,789 21% 22% 36% Specialty 5,857 4,804 3,600 29% 26% 22% Others 200 39 5 1% § §
Total United States 10,438 8,800 9,394 51% 48% 58% Europe*:
Generic 3,387 3,810 2,637 17% 21% 16% Specialty 1,563 1,101 746 7% 6% 5% Others 723 749 564 4% 4% 3%
Total Europe 5,673 5,660 3,947 28% 31% 24% Rest of the World:
Generic 2,617 2,429 1,481 13% 13% 9% Specialty 730 588 509 4% 3% 3% Others 859 835 790 4% 5% 6%
Total Rest of the World 4,206 3,852 2,780 21% 21% 18% Total Revenues $20,317 $18,312 $16,121 100% 100% 100% * All members of the European Union as well as Switzerland and Norway.§ Less than 0.5%.
United StatesRevenues in the United States in 2012 amounted to $10.4 billion, an increase of 19% compared to 2011. We significantly increased our presence in
specialty medicines as a result of the acquisition of Cephalon, and maintained our leading position in the generics business. Total prescriptions for the yearamounted to 564 million, representing 14.1% of total U.S. prescriptions, and new prescriptions amounted to 307 million. We expect that our U.S. marketleadership position will continue to increase due to the enhancement of our specialty business, as a result of our ability to introduce new generic equivalents forbrand-name products on a timely basis, our emphasis on customer service, the breadth of our product line, our commitment to regulatory compliance andquality and our cost-effective production. We will continue to seek to capitalize on Paragraph IV launches, and we intend to establish a leading position inhigh-value generics by pursuing first-to-market opportunities and by developing complex generic products, as well as by enhancing the value of our portfolioby concentrating on high-margin, low competition markets.
5 9
®
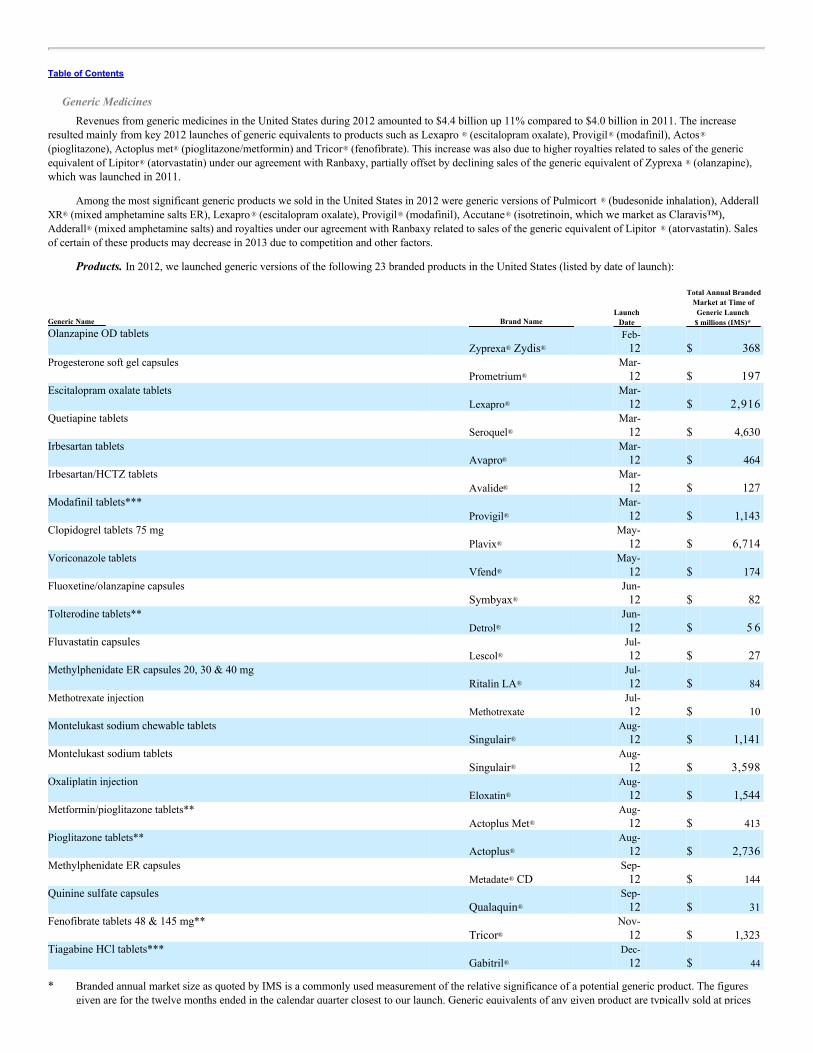
Table of Contents
Generic MedicinesRevenues from generic medicines in the United States during 2012 amounted to $4.4 billion up 11% compared to $4.0 billion in 2011. The increase
resulted mainly from key 2012 launches of generic equivalents to products such as Lexapro (escitalopram oxalate), Provigil (modafinil), Actos(pioglitazone), Actoplus met (pioglitazone/metformin) and Tricor (fenofibrate). This increase was also due to higher royalties related to sales of the genericequivalent of Lipitor (atorvastatin) under our agreement with Ranbaxy, partially offset by declining sales of the generic equivalent of Zyprexa (olanzapine),which was launched in 2011.
Among the most significant generic products we sold in the United States in 2012 were generic versions of Pulmicort (budesonide inhalation), AdderallXR (mixed amphetamine salts ER), Lexapro (escitalopram oxalate), Provigil (modafinil), Accutane (isotretinoin, which we market as Claravis™),Adderall (mixed amphetamine salts) and royalties under our agreement with Ranbaxy related to sales of the generic equivalent of Lipitor (atorvastatin). Salesof certain of these products may decrease in 2013 due to competition and other factors.
Products. In 2012, we launched generic versions of the following 23 branded products in the United States (listed by date of launch):
Generic Name Brand Name Launch
Date
Total Annual BrandedMarket at Time of
Generic Launch$ millions (IMS)*
Olanzapine OD tablets Zyprexa Zydis
Feb-12 $ 368
Progesterone soft gel capsules Prometrium
Mar-12 $ 197
Escitalopram oxalate tablets Lexapro
Mar-12 $ 2,916
Quetiapine tablets Seroquel
Mar-12 $ 4,630
Irbesartan tablets Avapro
Mar-12 $ 464
Irbesartan/HCTZ tablets Avalide
Mar-12 $ 127
Modafinil tablets*** Provigil
Mar-12 $ 1,143
Clopidogrel tablets 75 mg Plavix
May-12 $ 6,714
Voriconazole tablets Vfend
May-12 $ 174
Fluoxetine/olanzapine capsules Symbyax
Jun-12 $ 82
Tolterodine tablets** Detrol
Jun-12 $ 5 6
Fluvastatin capsules Lescol
Jul-12 $ 27
Methylphenidate ER capsules 20, 30 & 40 mg Ritalin LA
Jul-12 $ 84
Methotrexate injection Methotrexate
Jul-12 $ 10
Montelukast sodium chewable tablets Singulair
Aug-12 $ 1,141
Montelukast sodium tablets Singulair
Aug-12 $ 3,598
Oxaliplatin injection Eloxatin
Aug-12 $ 1,544
Metformin/pioglitazone tablets** Actoplus Met
Aug-12 $ 413
Pioglitazone tablets** Actoplus
Aug-12 $ 2,736
Methylphenidate ER capsules Metadate CD
Sep-12 $ 144
Quinine sulfate capsules Qualaquin
Sep-12 $ 31
Fenofibrate tablets 48 & 145 mg** Tricor
Nov-12 $ 1,323
Tiagabine HCl tablets*** Gabitril
Dec-12 $ 44
* Branded annual market size as quoted by IMS is a commonly used measurement of the relative significance of a potential generic product. The figures
given are for the twelve months ended in the calendar quarter closest to our launch. Generic equivalents of any given product are typically sold at prices
® ® ®
® ®
® ®
®
® ® ® ®
® ®
® ®
®
®
®
®
®
®
®
®
®
®
®
®
®
®
®
®
®
®
®
®
®

given are for the twelve months ended in the calendar quarter closest to our launch. Generic equivalents of any given product are typically sold at pricessubstantially lower than the branded product price.
** Authorized generic of a third party’s branded drug.*** Authorized generic of a Teva specialty product.
60

Table of Contents
We expect that our revenues in the United States will continue to benefit from our strong generic pipeline, which, as of January 22, 2013, had 147product registrations awaiting FDA approval, including 38 tentative approvals. Collectively, the branded versions of these 147 products had U.S. sales in2012 exceeding $91 billion. Of these applications, 103 were Paragraph IV applications challenging patents of branded products. We believe we are first to filewith respect to 62 of these products, the branded versions of which had U.S. sales of more than $45 billion in 2012. IMS reported brand sales are one of themany indicators of future potential value of a launch, but equally important are the mix and timing of competition, as well as cost effectiveness. However,potential advantages of being the first filer with respect to some of these products may be subject to forfeiture and/or shared exclusivity.
The FDA requires companies to submit abbreviated new drug applications (“ANDAs”) for approval to manufacture and market generic forms of brand-name drugs. In most instances, FDA approval is granted upon the expiration of the underlying patents. However, companies may be rewarded with a 180-dayperiod of marketing exclusivity, as provided by law, for being the first generic applicant to successfully challenge these patents. As part of our strategy, weactively review pharmaceutical patents and seek opportunities to challenge patents that we believe are either invalid or not infringed by our generic version. Inaddition to the commercial benefit of obtaining marketing exclusivity, we believe that our patent challenges ultimately improve healthcare by allowingconsumers earlier access to more affordable, high-quality medications.
In 2012 we received, in addition to 28 final generic drug approvals, nine tentative approvals which remain tentative at December 31, 2012. A “tentativeapproval” letter indicates that the FDA has substantially completed its review of an application and final approval is expected once the relevant patent expires,a court decision is reached, a 30-month regulatory stay lapses or a 180-day exclusivity period awarded to another manufacturer either expires or is forfeited.The outstanding tentative approvals received are for generic equivalents of the following products:
Generic Name Brand Name Total Branded Market
$ millions (IMS)* Palonosetron injection Aloxi $ 480 Duloxetine DR capsules Cymbalta $ 4,461 Celecoxib capsules Celebrex $ 1,920 Atomoxetine capsules Strattera $ 557 Methylphenidate ER capsules 10 mg Ritalin LA $ 16 Carbamazepine ER capsules Equetro $ 7 Aripiprazole tablets Abilify $ 5,617 Aripiprazole OD tablets Abilify Discmelt $ 15 Candesartan/HCTZ tablets Atacand HCT $ 5 6 * The figures given are for the twelve months ended September 30, 2012.
In December 2009, the FDA issued a warning letter relating to our Irvine, California injectable products manufacturing facility. We voluntarily ceasedproduction at the facility during the second quarter of 2010 and executed a remediation plan required by the FDA. In April 2011, we resumed limitedmanufacturing activity. We have been working closely with the FDA and are gradually releasing more products for distribution. On October 23, 2012, wereceived a letter from the FDA acknowledging that our corrective actions addressed the violations noted in the December 2009 warning letter. During 2012, weincurred uncapitalized production costs, consulting expenses and write-offs of inventory of approximately $88 million relating to this facility. As a result of arecent decision to explore our options regarding divestment of this facility, we have further impaired its property, plant and equipment by approximately $65million. We decided to discontinue several products, and as a result impaired intangible assets by approximately $33 million. Although the impairments wererecorded based on a fair value assessment, further impairments or losses could occur as additional information becomes available regarding the ultimatedisposition of the facility.
61
®
®
®
®
®
®
®
®
®
Table of Contents
Specialty MedicinesRevenues from specialty medicines in the United States in 2012 amounted to $5.9 billion, an increase of 22% over 2011. The main factors affecting
revenues of our specialty products in the United States include:
• the inclusion of a full year of Cephalon’s specialty sales (as opposed to one quarter only in 2011), primarily of Provigil , Nuvigil , Treanda and
Fentora ; and
• higher sales of Copaxone , which increased by $122 million due to price increases. Copaxone continued to account for a very significant
contribution to our profits and cash flow from operations in 2012.
Other RevenuesOther revenues in the United States in 2012 amounted to $200 million compared to $39 million in 2011. These revenues were mainly generated from
sales of OTC products to P&G pursuant to a manufacturing agreement.
Comparison of 2011 to 2010. In 2011, our revenues in the United States amounted to $8.8 billion compared to $9.4 billion in 2010. Generics revenuesin 2011 amounted to $4.0 billion, and revenues of our specialty products amounted to $4.8 billion. This 6% decrease from 2010 to 2011 was attributableprimarily to a decline in generics revenues due to declining sales of key products launched during 2010, which was partially offset by higher sales ofCopaxone and the inclusion of Cephalon revenues in the fourth quarter of 2011.
EuropeRevenues in Europe in 2012 amounted to $5.7 billion, flat compared to 2011. In local currency terms, revenues grew 8%, primarily due to the inclusion
of a full year of Cephalon sales and completion of the transition of distribution and marketing responsibility for Copaxone from Sanofi to Teva, partiallyoffset by the effects of our renegotiations with some of the wholesalers in the region. During 2012, the main European currencies affecting our sales (the euro,British pound and Hungarian forint) weakened in value against the U.S. dollar (on an annual average compared to annual average basis).
As in previous years, European regulatory measures aimed at reducing healthcare and drug expenditures have led to slower growth in the genericmedicines market, and have adversely affected our revenues in some markets while in other markets governmental action has led to increases in genericpenetration. In France, Spain, Italy, Poland, Hungary and Portugal, governmental measures have reduced reimbursement rates. In several countries,particularly Spain, Italy, Portugal and Hungary, reductions in reimbursement rates have been combined with other reforms aimed at reducing drugexpenditures, such as mandatory prescription by International Nonproprietary Name (“INN”) for select product groups. In addition, in certain countries,mainly Hungary and Italy, mandatory rebates were increased or introduced. We have adjusted our strategy to address these changes, shifting from a marketshare-driven approach to a model emphasizing profitable and sustainable growth.
We are monitoring closely, on an ongoing basis, activities in the countries which, based on our internal assessment, are experiencing significanteconomic stress, and are taking action to limit our exposure in these countries. Among the countries that are most affected by the crisis in Europe are Greece,Italy, Portugal, Spain and Hungary. We are taking measures to limit our risks in some of these countries by securitizing receivables without recourse andpurchasing credit insurance. In addition, we are preparing contingency plans for various Eurozone crisis scenarios of different severity.
Generic MedicinesRevenues for generic medicines in Europe in 2012 amounted to $3.4 billion, a decrease of 11%. In local currency terms, sales decreased by 3%,
primarily due to the unusually high revenues recorded in 2011 relating to
62
® ® ®
®
® ®
®
®

Table of Contents
the launch of a generic version of Lipitor (atorvastatin), our more selective approach to competing for generics business and the impact of market factors insome countries. This decrease was partially offset by a number of successful product launches across Europe, increased business in certain countries and theinclusion of a full year’s sales of Cephalon’s generic subsidiary Mepha.
As of December 31, 2012, Teva had received 1,103 generic approvals in Europe relating to 231 compounds in 429 formulations, including sixEuropean Medicines Agency (“EMA”) approvals valid in all EU member states. In addition, Teva had approximately 2,131 marketing authorizationapplications pending approval in 30 European countries, relating to 244 compounds in 499 formulations, including three applications pending with the EMA.During 2012, we continued to register products in the EU, using both the mutual recognition procedure (submission of applications in other member statesfollowing approval by a so-called reference member state) and the decentralized procedure (simultaneous submission of applications to chosen member states).We continue to use the centralized procedure to register our generic equivalent version of reference products that originally used this procedure.
Specialty MedicinesRevenues from specialty medicines in Europe in 2012 amounted to $1.6 billion, an increase of 42% compared to 2011. In local currency terms, sales
increased by 53%, primarily driven by the inclusion of full year sales of Cephalon, the completion of the transition of the distribution and marketing rightsfor Copaxone to us from Sanofi, and the launch of Zoely .
Other RevenuesOther revenues in Europe in 2012 amounted to $723 million, compared to $749 million in 2011, a decrease of 3% due to a decrease in distribution
revenues. In local currency terms, sales remained stable. Our OTC revenues increase was mainly due to higher sales of several European brands, as well asthe launch of Vicks in several countries.
Listed below are highlights for 2012 in our most significant European operations in terms of size:
• Germany: Revenues in 2012 decreased by 8%. In local currency terms, revenues remained stable compared to 2011. Generic revenues decreaseddue to our new selective approach to participation in tenders, with a focus on sustainable and profitable opportunities. Our specialty productsrevenues increased due to the inclusion of Cephalon’s revenues for a full year and to the assumption of the distribution and marketingresponsibility for Copaxone , as well as the growth of Azilect .
• France: Revenues in 2012 increased by 16%. In local currency terms, revenues increased by 25% compared to 2011, primarily due to higherrevenues of specialty products, largely due to the inclusion of Cephalon revenues and the assumption of the distribution and marketingresponsibility for Copaxone . This growth was partially offset by a slight decline in our generic business. In 2012, we maintained our leadingposition in the French generic pharmaceutical market.
• United Kingdom: Revenues in 2012 decreased by 10% and by 9% in local currency terms, compared to 2011. This was mainly due to unusuallyhigh revenues recorded in 2011 relating to the launch of a generic version of Lipitor (atorvastatin). In 2012, we maintained our market share,despite increased competition. In addition, the market was impacted by further price reductions for the more widely available generic products andby decreases in prices of generic pharmaceuticals generally in 2012. This was partially offset by new product launches.
• Italy: Revenues in 2012 decreased by 19%. In local currency terms, revenues decreased by 12%, primarily due to a decline in our generics
revenues. The Italian generic pharmaceutical market grew by approximately 10% in 2012, despite market uncertainty in advance of anticipatedreforms. We made
63
®
® ®
®
® ®
®
®

Table of Contents
adjustments to our relationships with wholesalers (including the termination of some relationships) during the year. Although we remain theleading generic pharmaceutical company in Italy, the result of these adjustments was a decrease in revenues. The inclusion of Cephalon and theassumption of the distribution and marketing responsibility for Copaxone partially offset the decrease in revenues from generic medicines.Zoely , our new oral contraceptive, was successfully launched in Italy in March 2012.
• Spain: Revenues in 2012 decreased by 1%. In local currency terms, revenues increased by 7%, primarily due to the effect of governmentalmeasures aimed at reducing healthcare spending, which resulted in significant increased usage of generic pharmaceuticals (although a slightdecrease in value). An amendment to Spanish legislation was implemented in May 2012, allowing dispensing of only the lowest priced productswithin certain product groups. We increased our market share and maintained our leading position in the Spanish generic market. We alsobenefited from the inclusion of Cephalon and the assumption of the distribution and marketing responsibility for Copaxone .
Comparison of 2011 to 2010. Total sales in Europe in 2011 amounted to approximately $5.7 billion, an increase of 43% compared to 2010. The maincontributors to this increase were the inclusion of a full year of ratiopharm’s revenues, the acquisitions of Theramex and Cephalon and the transition ofdistribution and marketing responsibility for Copaxone from Sanofi to Teva in many European markets. During 2011, the main European currenciesaffecting our revenues (the euro, British pound and Hungarian forint) strengthened in value against the U.S dollar (on an annual average compared to annualaverage basis).
Rest of the World (“ROW”) MarketsThese markets include all countries other than the United States and the countries we include under “Europe,” and range from pure generic markets,
such as Canada and Israel, to markets where generic medicines are marketed and sold under brand names, as in several Asian and Latin American countries.Revenues of branded generic medicines usually generate higher gross margins but also involve considerably higher marketing expenditures than do non-branded generics. These markets also vary widely in size, growth rates, availability of biosimilar approval pathways and the importance and acceptance ofOTC products.
We consider Japan, Russia and the Latin American countries to be “emerging” generics markets characterized by rapid growth and relatively highrevenues of branded generics and OTC products, while Canada and Israel are “mature” generics markets that have higher generic penetration rates andtherefore lower growth rates.
Revenues in ROW markets in 2012 amounted to $4.2 billion, an increase of 9% compared to 2011. In local currency terms, revenues grew 13%. Totalrevenues in our emerging generics markets in 2012 amounted to $2.9 billion (including $626 million of revenues from all other ROW markets), an increaseof 19% from $2.5 billion in 2011. Revenues in our mature generics markets amounted to $1.3 billion for the year, a decrease of 9% compared to 2011.
Revenues of generic medicines in 2012 amounted to $2.6 billion, which represents 62% of the total revenues in the region; revenues of specialtyproducts in 2012 amounted to $730 million, or 17% of total revenues in the region; and other revenues, in 2012 were $859 million, or 21% of total revenuesin the region.
In Russia our revenues in 2012 grew by 14% (21% in local currency terms), as compared to 2011. The growth was mainly attributable to unusuallyhigh revenues of Copaxone , due to the fact that Russian government tenders for Copaxone in 2012 also included supplies for a significant portion of 2013.We expect that changes in the Russian government tender system in 2013 will result in significant variations from year to year in our future Copaxonerevenues. Growth was also driven by higher revenues from specialty medicines and OTC products, supported by the launch of Vicks in July 2012. Wemaintained our leading position in the Russian generic pharmaceutical market and increased our market share.
64
®
®
®
®
® ®
®
®

Table of Contents
In Japan, our revenues in 2012 grew by 49% (50% in local currency terms) compared to 2011. Our results in Japan mainly reflect the inclusion of a fullyear of revenues of Taiyo and our other Japanese ventures. The Japanese generics market as a whole has been growing as a result of the healthcare reformsinstituted by the government in April 2012, which included additional incentives to prescribe generics as well as price reductions for generic products.
In Latin America, our revenues in 2012 grew by 9% (13% in local currency terms) compared to 2011. The increase was primarily driven by higherrevenues of generic medicines, the performance of our OTC products and growth in revenues of Copaxone and other specialty medicines. We achieved growthin most markets and continued to maintain our market share across the region. In the near term, revenues are expected to be negatively affected by drug pricelegislation, as well as by exchange rate fluctuations in certain Latin American markets.
Generic glatiramer acetate was approved recently in Argentina, and is expected to be launched in the first quarter of 2013. In addition, we understand thata local manufacturer was allowed to bid on generic glatiramer acetate in a government tender in Mexico and was awarded part of the tender. Although the localcompany’s product has been approved, we are pursuing legal action.
In Canada, where we are one of the two leading generic pharmaceutical companies, our revenues in 2012 decreased by 16% primarily due to pricereforms and lower generics revenues, partially offset by sales from new generic product launches. As of December 31, 2012, we had 69 product registrationsawaiting approval by the Therapeutic Products Directorate of Health Canada. Collectively, the branded versions of these products had Canadian sales in 2012of approximately $3 billion.
Comparison of 2011 to 2010. Our revenues in ROW markets amounted to $3.9 billion in 2011, an increase of 39% as compared to 2010. Totalrevenues in our emerging generics markets for 2011 amounted to $2.5 billion, which includes $572 million of revenues from all other ROW markets.Revenues from our mature generics markets amounted to $1.4 billion for 2011.
Revenues by Product LineThe following table presents revenues by product line for the past three years:
Year Ended December 31, Percentage
Change
2012 2011 2010 % of2012
% of2011
% of2010
2012-2011
2011-2010
U.S. $ in millions Generic Medicines $ 10,385 $ 10,196 $ 9,907 51% 56% 61% 2% 3% API 796 747 641 4% 4% 4% 7% 17% Specialty Medicines 8,150 6,493 4,855 40% 35% 30% 26% 34% CNS 5,464 4,412 3,202 27% 24% 20% 24% 38%
Copaxone 3,996 3,570 2,958 20% 19% 18% 12% 21% Provigil 417 350 — 2% 2% — 19% — Nuvigil 347 86 — 2% § — 303% — Azilect 330 290 244 2% 2% 2% 14% 19%
Oncology 860 268 74 4% 1% § 221% 262% Treanda 608 131 — 3% 1% 0% 364% —
Respiratory 856 878 747 4% 5% 5% (3%) 18% ProAir 406 436 396 2% 2% 2% (7%) 10% Qvar 297 305 250 1% 2% 2% (3%) 22%
Women’s Health 448 438 374 2% 2% 2% 2% 17% Other Specialty 522 497 458 3% 3% 3% 5% 9% All Others 1,782 1,623 1,359 9% 9% 9% 10% 19% OTC 936 765 496 5% 4% 3% 22% 54% Other Revenues 846 858 863 4% 5% 5% (1%) (1%) Total $20,317 $18,312 $16,121 100% 100% 100% 11% 14% § Less than 0.5%.
6 5
®
®
®
®
®
®
®
®

Table of Contents
Generic MedicinesOur generic medicines category includes sales of our generic medicines as well as API sales to third parties.
Sales of generic medicines grew by $189 million, or 2%, in 2012 over 2011. Our largest market for generics is the United States, with revenues ofapproximately $4.4 billion, up 11% from 2011, which represents approximately 42% of total generics revenues in 2012. The increase in sales of generics inthe United States resulted from new launches in 2012.
Revenues from generic medicines in Europe in 2012 amounted to $3.4 billion, a decrease of 11% over 2011. The decrease was primarily due to theinclusion of unusually high revenues recorded in 2011 relating to the launch of a generic version of Lipitor (atorvastatin) in the U.K. and our more selectiveapproach to competing for sustainable and profitable generics business as well as changes in currency exchange rates. The decrease was partially offset bysuccessful new product launches across Europe, by increased business in certain countries and by the inclusion of a full year of sales of Cephalon’s genericsubsidiary Mepha. In local currency terms, sales declined by 3%.
Active Pharmaceutical Ingredients (“API”)API sales to third parties in 2012 amounted to $796 million, an increase of 7% over 2011. The increase was mainly due to growth in the United States
and Europe, and was largely attributable to increased demand from existing customers as well as several new product launches.
Comparison of 2011 to 2010. Sales to third parties in 2011 amounted to $747 million, an increase of 17% compared to 2010. The increase in sales in2011 occurred mainly due to growth in our principal geographical markets.
Specialty MedicinesOur revenues from specialty medicines amounted to approximately $8.2 billion in 2012, an increase of 26% over 2011.
In 2011, we revised our classification of certain products and grouped our specialty medicines into five categories: Central Nervous System,Respiratory, Women’s Health, Oncology and Other.
Central Nervous SystemOur CNS specialty product line includes Copaxone and Azilect as well as Provigil and Nuvigil for the treatment of sleep disorders and Fentora for
the treatment of pain. In 2012, our CNS sales reached approximately $5.5 billion, an increase of 24% over 2011, primarily due to the inclusion of a full yearof revenues of Cephalon products and an increase in Copaxone and Azilect revenues.
Comparison of 2011 to 2010. In 2011, sales of our CNS products amounted to $4.4 billion, compared to $3.2 billion in 2010.
Copaxone . In 2012, Copaxone (glatiramer acetate injection) continued to be the leading multiple sclerosis therapy in the United States and globally.Our sales of Copaxone in 2012 grew by 12% compared to 2011, reaching $4.0 billion. In local currency terms, Copaxone sales grew by 14%.
Until February 2012, global in-market sales included sales of Copaxone by both Sanofi and us. In February 2012, we completed the assumption fromSanofi of the marketing and distribution rights of Copaxone . Therefore, commencing with the second quarter of 2012, all global sales were made by us.Global in-market sales for 2012 amounted to $4.0 billion, an increase of 3% over the in-market sales of the comparable period.
6 6
®
® ® ® ® ®
® ®
® ®
® ®
®
®

Table of Contents
Revenues from Copaxone in the United States in 2012 increased by 4% to $2.9 billion due to price increases, which were partially offset by a decreasein volume due mainly to adjustments related to the renegotiation of our distribution service agreements in the first quarter of the year. U.S. market share interms of new and total prescriptions was 39.9% and 40.8% respectively, according to December 2012 IMS data.
U.S. revenues amounted to 72% of global in-market sales of Copaxone in 2012, similar to 2011.
Our non-U.S. Copaxone revenues in 2012 amounted to $1.1 billion, an increase of 39% compared to 2011, and an increase of 49% in local currencyterms. The increase was driven primarily by our assumption of distribution and marketing responsibility for Copaxone from Sanofi in Europe, which wascompleted in February 2012, and by volume growth, particularly in Russia due to unusually high tender sales. Sanofi is entitled to receive 6% of the in-market sales of Copaxone in the applicable European countries for a period of two years from our assumption of the distribution and marketingresponsibilities. This termination of our arrangements with Sanofi has resulted in increases both in our net revenues and in our selling and marketingexpenses.
Non-U.S. in-market sales remained stable compared to 2011. In local currency terms, non-U.S. in-market sales increased 8% compared to 2011. Theincrease in local currency terms in non-U.S. in-market sales was driven by unit growth primarily in Russia, due to the timing of tenders, in Spain and inItaly.
Generic glatiramer acetate was approved recently in Argentina, and is expected to be launched in the first quarter of 2013.
In a government tender in Mexico, a local manufacturer was allowed to bid on generic glatiramer acetate and was awarded part of the tender. Although thelocal company’s product has been approved, we are pursuing legal action. We do not expect this to materially affect our sales of Copaxone .
Comparison of 2011 to 2010. In 2011, in-market global sales of Copaxone were approximately $3.9 billion, an increase of 18% over 2010. U.S.revenues in 2011 accounted for 72% of global in-market sales of Copaxone . The growth of in-market sales of Copaxone in the United States in 2011reflected the impact of a price increase of 14.9% in January 2011 as well as unit growth.
Provigil . Our 2012 sales of Provigil amounted to $417 million. Provigil began to face generic competition in the United States in March 2012 and, asa result, sales decreased substantially.
Nuvigil . Our 2012 global Nuvigil sales amounted to $347 million.
Azilect . Our once-daily treatment for Parkinson’s disease, Azilect (rasagiline tablets), continued to grow during the year. We market Azilect jointlywith Lundbeck in certain key European countries. We exclusively market Azilect in the United States and certain other markets, while Lundbeck exclusivelymarkets Azilect in the remaining European countries and certain other international markets.
Global in-market sales, which represent sales by Teva and Lundbeck to third parties, reached $420 million in 2012 compared to $393 million in 2011,an increase of 7%. Our sales of Azilect amounted to $330 million, an increase of 14% compared to 2011. The increase in sales reflects both price increasesand volume growth in the United States, as well as volume growth in Europe (mainly in Germany, France and Spain), partially offset by exchange rate effects.
Comparison of 2011 to 2010. In 2011, in-market global sales of Azilect were approximately $393 million, an increase of 24% over 2010.
67
®
®
®
®
®
®
® ®
® ® ®
® ®
® ® ®
®
®
®
®

Table of Contents
Oncology ProductsOur specialty oncology product line includes certain legacy Cephalon products as well as our biosimilar products indicated mainly for the treatment of
side effects of oncology treatments. Sales of these products amounted to $860 million in 2012 as compared to $268 million in 2011. The increase resultedprimarily from the inclusion of a full year of Cephalon’s cancer treatments, the largest of which is Treanda . The sales of biosimilar products, marketedmainly in Europe, continued to grow in 2012. In November 2012, we launched Synribo™, in the United States.
Sales of Treanda amounted to $608 million in 2012.
In August 2012, Treanda was approved in Canada. Lundbeck, who hold the rights to market Treanda in Canada, launched the product in September2012.
Comparison of 2011 to 2010. In 2011, sales amounted to $268 million, an increase of 262% from $74 million in 2010.
Respiratory ProductsOur respiratory product line includes only specialty respiratory products, mainly ProAir and Qvar . During 2012 we launched a new respiratory
product, Qnasl for the treatment of nasal allergy symptoms. Sales of generic products indicated for the treatment of respiratory disease are reported as part ofour generic medicines sales.
Revenues from our specialty respiratory products in 2012 amounted to $856 million, a decrease of 3% from 2011. The decrease was primarily due tolower revenues in the United States, mainly due to adjustments related to the renegotiation of our distribution service agreements (DSA) and to additionalMedicaid rebates. The decrease was partially offset by sales growth in Russia.
ProAir (albuterol HFA), which we sell only in the United States, is a short-acting beta-agonist (SABA) for the treatment of bronchial spasms linked toasthma or COPD and exercise-induced bronchospasm. ProAir revenues amounted to $406 million, a decrease of 7% compared to 2011, mainly due to theimpact of the DSA re-negotiations and to additional Medicaid rebates. ProAir maintained its leadership in the SABA market, with a market share of 51.9%in terms of total number of prescriptions during the fourth quarter of 2012, an increase of 1.2 points compared to the fourth quarter of 2011.
Qvar (beclomethasone diproprionate HFA) is an inhaled corticosteroid for long-term control of chronic bronchial asthma. Qvar global sales amountedto $297 million, a decrease of 3% from the prior year due to decreased sales in several markets in Europe. Qvar maintained its second-place position in theinhaled corticosteroids category in the United States, with a market share of 26.9% in terms of total number of prescriptions during the fourth quarter of2012, an increase of 3.3 points compared to the fourth quarter of 2011.
Comparison of 2011 to 2010. In 2011, sales of our respiratory products amounted to approximately $878 million, compared to $747 million in 2010.
Women’s Health ProductsOur women’s health product line includes our specialty women’s health products, but does not include generic women’s health products, sales of which
are reported as part of our generic medicines revenues.
Revenues from our global women’s health products in 2012 amounted to $448 million, an increase of 2% from $438 million in 2011. The growth wasprimarily attributable to increases in sales of women’s health products in Europe and Latin America.
68
®
®
® ®
® ®
®
®
®
®
® ®
®

Table of Contents
Revenues in the United States declined, mainly as a result of generic competition to our oral contraceptive product, Seasonique , starting in the thirdquarter of 2011. This decline was partially offset by growth in sales of our contraceptive products Paragard and Plan B One-Step .
Comparison of 2011 to 2010. In 2011, sales of our women’s health products amounted to $438 million, an increase of 17% from $374 million in2010.
All Others
OTCOur revenues from OTC products in 2012 amounted to $936 million compared to $765 million in 2011. Our revenues related to PGT amounted to
$747 million, an increase of 2%, compared to $734 million in the previous year. In local currency terms, revenues grew by 7%. The increase was mainly dueto growth in sales in Latin America and Europe. During the year, the Vicks product line was launched in Hungary, Poland, Russia and the Czech Republic.
PGT’s in-market sales in 2012 amounted to $1.3 billion. This amount represents sales of the combined OTC portfolios of Teva and P&G outside NorthAmerica. Sales grew in Europe, Asia and Latin America, mainly due to increased sales forces and price increases.
Revenues from the sales of OTC products in the United States to P&G, which commenced in the fourth quarter of 2011 pursuant to a manufacturingagreement, amounted to $189 million in 2012, as compared to $31 million in 2011.
Comparison of 2011 to 2010. In 2011, our OTC revenues amounted to $765 million, an increase of 54% over 2010, primarily due to thecontributions of the ratiopharm business.
Other RevenuesOther revenues include sales of third party products for which we act as distributors (mostly in Israel and Hungary), animal health products and
medical products, as well as miscellaneous items.
Our other revenues amounted to $846 million in 2012, a slight decline from 2011. The decline was due to the divestment of our pharmacy chain in Peruin February 2011, which was almost completely offset by the growth in our distribution services in Israel and Hungary. As noted above, we sold our animalhealth unit in January 2013.
Comparison of 2011 to 2010. In 2011, our other revenues amounted to $858 million, a slight decrease over 2010.
Other Income Statement Line ItemsGross Profit
Gross profit amounted to $10.7 billion in 2012, an increase of 12%, or $1.2 billion, compared to 2011.
The higher gross profit was mainly a result of an increase in revenues, particularly of specialty medicines and generic medicines in the United Statesand in Japan, and of decreased inventory step-up charges and decreased costs related to regulatory actions taken in various facilities. These factors werepartially offset by higher charges related to the amortization of purchased intangible assets, which increased from $668 million in 2011 to $1,228 million in2012, and the negative effect of changes in currency exchange rates.
Gross profit margin was 52.4% in 2012, up from 52.0% in 2011. The increase in gross margin primarily reflects higher contributions from Treanda ,Nuvigil , Provigil and Copaxone (which increased gross margin
6 9
®
® ®
®
®
® ® ®

Table of Contents
by approximately 3.5 points). In addition, reduced inventory step-up charges and costs related to regulatory actions taken in various manufacturing facilitiesincreased gross margin by approximately 1.9 points. These factors were partially offset by the effects of charges related to the amortization of purchasedintangible assets (which decreased gross margin by approximately 2.4 points) and a reduction in gross margin from sales of other medicines (which decreasedgross margin by approximately 2.4 points).
Comparison of 2011 to 2010. Gross profit increased in 2011 to $9.5 billion from $9.1 billion in 2010, an increase of 5%. Gross profit margins were52.0% in 2011 and 56.2% in 2010.
Research and Development (R&D) ExpensesNet R&D expenses, including the purchase of in-process R&D, amounted to $1.4 billion in 2012, an increase of 24% compared to 2011, primarily as a
result of the acquisition of Cephalon. As a percentage of revenues, R&D spending was 6.7% in 2012, compared to 6.0% in 2011.
In 2012, we increased our specialty R&D spending, primarily as a result of the acquisition of Cephalon. Our specialty R&D activities focus primarilyon product candidates in the CNS and respiratory therapeutic areas, with selective investments in oncology, women’s health and biologics. Specialty R&Dactivities represented approximately 64% of our total R&D expenditures in 2012, while the balance was for generic R&D activities.
A portion of our R&D activities is conducted through joint ventures. Our share in the R&D expenses of these joint ventures is reflected in the incomestatement under “share in losses of associated companies—net.”
Comparison of 2011 to 2010. R&D expenses increased in 2011 to $1.1 billion from $1.0 billion in 2010, an increase of 15%. Approximately 57% ofour 2011 R&D expenditures was for specialty R&D activities, and the balance was for our generic R&D activities.
Selling and Marketing (S&M)S&M expenses in 2012 amounted to $3.9 billion, an increase of 12% over 2011. As a percentage of revenues, S&M expenses were 19.1% in 2012
compared to 19.0% in 2011.
The increase in dollar terms was primarily due to the consolidation of Taiyo (commencing July 2011) and Cephalon (commencing October 2011) as wellas the assumption of distribution and marketing responsibility for Copaxone in Europe. The increase was partially offset by currency fluctuations as well aslower royalty payments made on generic medicines in the United States (mainly on generic versions of Effexor XR , Zyprexa , Pulmicort and Yaz , partiallyoffset by higher payments primarily on the generic version of Provigil ).
The slight increase as a percentage of revenues resulted from an increase in the proportion of specialty medicines sold, which have higher than averageselling and marketing expenses, largely offset by reduced selling and marketing expenses for our generic medicines and a reduction in royalty payments madeon certain generic medicines in the United States.
Copaxone was originally co-promoted with Sanofi in Germany, France, Spain, the Netherlands and Belgium, and was marketed solely by Sanofi incertain other European markets, Australia and New Zealand. Effective as of February 1, 2012, we completed the assumption of marketing and distributionresponsibility for Copaxone in Europe from Sanofi. As of March 1, 2012, CSL Limited has assumed the marketing and distribution responsibility inAustralia and New Zealand. Sanofi is entitled to receive, on a country-by-country basis, 6% of the in-market sales of Copaxone in the applicable Europeancountries until 2014. Although we record higher revenues as a result of this change, we have also become responsible for certain marketing and administrativeexpenses, which are no longer shared with Sanofi.
70
®
® ® ® ®
®
®
®
®

Table of Contents
Comparison of 2011 to 2010. S&M expenses in 2011 amounted to $3.5 billion, an increase of 17% over 2010. As a percentage of revenues, S&Mexpenses increased from 18.4% in 2010 to 19.0% in 2011.
General and Administrative Expenses (G&A)G&A expenses in 2012 amounted to $1.2 billion compared with $0.9 billion in 2011, an increase of 33%. As a percentage of revenues, G&A expenses
increased to 6.1% for 2012 from 5.1% for 2011.
The dollar increase in G&A expenses resulted primarily from gains recorded in 2011, which reduced our expenses in that period, as well as higherexpenses in 2012 due to the inclusion of Cephalon and Taiyo and transactions related to our joint venture with P&G for a full year in 2012, as compared toparts of the year in 2011. The gains recorded in 2011 were mainly due to our acquisition of additional holdings in CureTech and in our Japanese venture,which allowed us to gain control of these entities, triggering a gain of $135 million, relating to our prior holdings in these companies, as well as the sale of ourPeruvian pharmacy chain. The increase in expenses in 2012 was partially offset by exchange rate differences and lower patent litigation and product liabilitycosts.
Comparison of 2011 to 2010. G&A expenses in 2011 amounted to $0.9 billion, an increase of 8% over 2010, and as a percentage of revenues, G&Aexpenses decreased to 5.1% for 2011 from 5.4% for 2010.
Impairments, Loss Contingencies, Restructuring and OthersExpenses for impairments, loss contingencies, restructuring and others amounted to $2.0 billion, as compared to $901 million in 2011.
Impairments of long-lived assets in 2012 were $1.1 billion, related primarily to:
1. Identifiable intangible assets of $858 million comprised of:
a. In-process R&D write-downs amounted to $625 million, including $268 million relating to obatoclax for the treatment of small cell lungcancer and $96 million relating to CEP-37247 anti-tumor necrosis factor for the treatment of sciatica. Armodafinil (Nuvigil ) for thetreatment of bi-polar disorder was also impaired in the amount of $79 million to reflect a settlement agreement with Mylan. We furtherimpaired CureTech’s in-process R&D by $127 million.
b. Impairment of existing product rights of $233 million, which included mainly Enjuvia , a women’s health marketed product, for a total
of $62 million, Gabatril for $43 million, and Ivax’s verapamil for $20 million.
2. Property, plant and equipment of $190 million, which included various impairments to manufacturing and research and development facilities.
3. Non-current investments of $23 million.
For 2011, impairment of long-lived assets amounted to $201 million related mainly to the divestiture of a Cephalon fentanyl product and the assets ofour recently sold animal health unit.
Loss contingencies and legal settlements for 2012 are composed mainly of a provision for a loss contingency of $670 million relating to pending patentlitigation concerning our generic pantoprazole. In 2011, legal expenses and loss contingencies amounted to $471 million and were primarily due to the Pfizersettlement, the Novartis settlement and the propofol product liability cases.
Restructuring and other expenses were $221 million and $192 million for 2012 and 2011, respectively, comprised mainly of severance costs of $154million and $187 million, respectively. These expenses for 2012 include costs related to the ongoing restructuring of Cephalon France and Théramex.
71
®
®
®

Table of Contents
Contingent consideration benefit was recorded as a result of impairing long lived assets during 2012, which decreased associated milestone paymentliabilities previously recorded in connection with the Cephalon acquisition.
Acquisition expenses of $7 million and $37 million in 2012 and 2011, respectively, were primarily related to the Cephalon acquisition.
As part of our new long term strategy, we plan to introduce initiatives designed to reduce our overall operating costs and complexity through a wide-scalecross-functional effort to create a more efficient organization. We are focusing our attention, in particular, on improving our procurement systems by leveragingour purchasing power and improving our production network, supply chain, and resources deployment processes. Consequently, we expect to incursignificant restructuring and impairment expenses associated with the plan over the next few years.
Operating IncomeOperating income was $2.2 billion in 2012, as compared to $3.1 billion in 2011. As a percentage of revenues, operating margin was 10.8% in 2012
compared to 17.0% in 2011.
The decrease in operating income was due to factors previously discussed, primarily higher impairments of long-lived assets, higher S&M expenses,higher G&A expenses, higher R&D expenses, increased provisions for loss contingency and expenses in connection with legal settlements and reserves as wellas higher restructuring and other expenses. This decrease was partially offset by higher revenues, higher gross profit and income from contingent considerationas well as lower acquisition expenses. Foreign exchange rate fluctuations had a net positive effect compared to 2011.
The decrease of 6.2 points in operating income as a percentage of revenues was mainly due to the higher impairments of long-lived assets (4.2 points),higher general and administrative margin (1.0 points), increased provisions for loss contingency and legal settlements and reserves (0.9 points), higher R&Dmargin (0.7 points) and higher selling and marketing margin (0.1 points), partially offset by higher gross margin (0.4 points) and income from contingentconsideration (0.2 points) as well as lower acquisition expenses (0.2 points).
Comparison of 2011 to 2010. Operating income in 2011 amounted to $3.1 billion, a decrease of 20% over 2010, and as a percentage of revenues,operating income decreased to 17.0% for 2011 from 24.0% for 2010.
Financial ExpensesFinancial expenses amounted to $386 million in 2012, compared to $153 million in 2011. The increase resulted from the inclusion of Cephalon-related
financing expenses for a full year and higher interest expenses due to the longer duration of our debt following refinancings in 2012 (including the redemptionof our 1.7% Senior Notes due 2014), partially offset by gains resulting from the termination during 2011 of the interest rate swap agreements relating to our6.15% senior notes due 2036.
Comparison of 2011 to 2010. In 2011, financial expenses amounted to $153 million, compared to $225 million in 2010. The decrease resultedprimarily from gains resulting from the termination during 2011 of interest rate swap agreements relating to the 6.15% senior notes due 2036 and hedgingcosts in connection with the ratiopharm acquisition that were recorded in 2010, partially offset by interest expenses on the Taiyo and Cephalon-relatedfinancings. In 2011 interest expenses were higher as a result of an increase in debt.
Tax RateIn 2012, we booked a negative provision for tax in the amount of $137 million, primarily as a result of the significant impairments and higher
amortization expenses of intangible assets. Such impairments and
72

Table of Contents
amortization expenses were in jurisdictions with a higher tax rate than our average group tax rate, resulting in such provision. In 2011, the provision for taxesamounted to $127 million, or 4% of pre-tax income of $3.0 billion. In 2010, the provision for taxes amounted to $283 million, or 8% of pre-tax income of $3.6billion. The effective tax rate is the result of the geographic mix and type of products sold during the year, and a variety of factors, including different effectivetax rates applicable to non-Israeli subsidiaries that have tax rates above Teva’s average tax rates (including the impact of impairment, restructuring and legalsettlement charges on such subsidiaries). In addition, the release of reserves for uncertain tax positions and tax benefits as a result of mergers between recentlyacquired companies and our subsidiaries further reduced the effective tax rate for 2012.
The statutory Israeli corporate tax rate was 25% in 2012. However, our effective consolidated tax rates have historically been, and are in 2012,considerably lower than the statutory rate because of tax incentives we benefit from in Israel and other countries. Most of our investments in Israel were grantedApproved Enterprise status, which confers certain tax benefits. These benefits include a long-term tax exemption for undistributed income generated by suchprojects, and lower tax rates on dividends distributed from other projects, the source of which is approved enterprise income, for the periods set forth in thelaw, as described in “Item 10—Additional Information—Israeli Taxation.” We also benefit from other investment-related and R&D-related tax incentives inmany of our facilities around the world.
In the future, the effective tax rate is expected to fluctuate as a result of various factors, including changes in the product mix and geographicaldistribution of our income, the effect of any mergers and acquisitions, and the effects of statutes of limitations and legal settlements which may affectprovisions for uncertain tax positions. We expect that the tax rate in future years will be significantly higher than this year’s, as a result of the product mixprojected for these years.
Net Income and Share CountNet income attributable to Teva in 2012 was $2.0 billion compared to $2.8 billion in 2011. This decrease was due to the factors previously discussed,
primarily our lower operating income and higher financial expenses, partially offset by lower provision for taxes.
Comparison of 2011 to 2010. Net income attributable to Teva amounted to $2.8 billion in 2011, as compared with $3.3 billion in 2010.
Diluted earnings per share reached $2.25 in 2012, a decrease of 27% compared to diluted earnings per share of $3.09 in 2011.
During 2012, we repurchased approximately 28.1 million shares at a weighted average price of $41.64 per share, for an aggregate purchase price of$1.2 billion. These purchases were made pursuant to the $3 billion repurchase plan announced in December 2011. This repurchase program has no time limitand is expected to be completed over a three-year period.
During 2011, we repurchased approximately 19.6 million shares at a weighted average price of $45.84 per share, for an aggregate purchase price of$899 million. These purchases completed the $1 billion repurchase plan authorized in December 2010, in which we purchased a total of 21.6 million sharesat a weighted average price of $46.3 per share.
The share count used for the fully diluted calculation for 2012, 2011 and 2010 was 873 million, 893 million and 921 million shares, respectively.
At December 31, 2012, and 2011, the share count for calculating Teva’s market capitalization was approximately 857 million and 883 million shares,respectively.
73

Table of Contents
Supplemental Non-GAAP Income DataThe tables on the following pages present supplemental non-GAAP data, in U.S. dollar terms, as a percentage of revenues and the change by item as a
percentage of the amount for the comparable period, which we believe facilitates an understanding of the factors affecting our business. In these tables, weexclude the following amounts:
Year Ended December 31, 2012 2011 2010 U.S. dollars in millions Amortization of purchased intangible assets 1,272 706 527 Impairment of long-lived assets 1,071 201 124 Provision for loss contingency 670 30 — Restructuring and other expenses 221 192 260 Costs related to regulatory actions taken in facilities 128 170 — Purchase of research and development in process 73 15 18 Inventory step-up 63 352 107 Expense in connection with legal settlements and reserves 45 441 2 Changes in contingent consideration related to business combination (40) — — Acquisition expenses 7 37 24 Financial expenses related to early repayment of senior notes and other 32 — 71 Net of corresponding tax effect (798) (465) (330) Minority interest changes related to impairments of co-owned assets (36) — —
The data so presented—after these exclusions—are the results used by management and our board of directors to evaluate our operational performance,to compare against work plans and budgets, and ultimately to evaluate the performance of management. For example, each year we prepare detailed work plansfor the next three succeeding fiscal years. These work plans are used to manage the business and are the plans against which management’s performance ismeasured. All such plans are prepared on a basis comparable to the presentation below, in that none of the plans take into account those elements that arefactored out in our non-GAAP presentations. In addition, at quarterly meetings of the Board at which management provides financial updates to the Board,presentations are made comparing the current fiscal quarterly results against: (a) the comparable quarter of the prior year, (b) the immediately preceding fiscalquarter and (c) the work plan. Such presentations are based upon the non-GAAP approach reflected in the table below. Moreover, while there are alwaysqualitative factors and elements of judgment involved in the granting of annual cash bonuses, the principal quantitative element in the determination of suchbonuses is performance targets tied to the work plan, and thus tied to the same non-GAAP presentation as set forth below.
In arriving at our non-GAAP presentation, we have in the past factored out items, and would expect in the future to continue to factor out items, thateither have a non-recurring impact on the income statement or which, in the judgment of our management, are items that, either as a result of their nature orsize, could, were they not singled out, potentially cause investors to extrapolate future performance from an improper base. While not all inclusive, examples ofthese items include: legal settlements and reserves; purchase accounting expense adjustments related to acquisitions, including adjustments for write-offs ofR&D in-process, amortization of intangible assets and inventory “step-ups” following acquisitions; changes in the fair value of contingent consideration;restructuring expenses related to efforts to rationalize and integrate operations; certain financial hedging expenses; material tax and other awards or settlements—both in terms of amounts paid or amounts received; impairment charges related to intangible and other assets such as intellectual property, product rights orgoodwill; the income tax effects of the foregoing types of items when they occur; and costs related to regulatory actions taken at our facilities (such asuncapitalized production costs, consulting expenses or write-offs of inventory related to remediation). Included in restructuring expenses are severance, shutdown costs, contract termination costs and other costs that we believe are sufficiently large that their exclusion is important to understanding trends in ourfinancial results.
74

Table of Contents
These data are non-GAAP financial measures and should not be considered replacements for GAAP results. We provide such non-GAAP data becausemanagement believes that such data provide useful information to investors. However, investors are cautioned that, unlike financial measures prepared inaccordance with GAAP, non-GAAP measures may not be comparable with the calculation of similar measures for other companies. These non-GAAPfinancial measures are presented solely to permit investors to more fully understand how management assesses our performance. The limitations of using thesenon-GAAP financial measures as performance measures are that they provide a view of our results of operations without including all events during a period,such as the effects of acquisition, merger-related, restructuring and other charges, and may not provide a comparable view of our performance to othercompanies in the pharmaceutical industry.
Investors should consider non-GAAP financial measures in addition to, and not as replacements for, or superior to, measures of financialperformance prepared in accordance with GAAP.
The following table presents the GAAP measures, the corresponding non-GAAP amounts and related non-GAAP adjustments for theapplicable periods:
Year ended
December 31, 2012
U.S. dollars and shares in millions
(except per share amounts)
GAAP Non-GAAPAdjustments Non-GAAP
% of NetRevenues
Gross profit 10,652 1,419 12,071 5 9% Operating income 2,205 3,510 5,715 28% Net income attributable to Teva 1,963 2,708 4,671 23% Earnings per share attributable to Teva—diluted 2.25 3.10 5.35
(1) Amortization of purchased intangible assets 1,228 Costs related to regulatory actions taken in facilities 128 Inventory step-up 63
Gross profit adjustments 1,419 (2) Impairment of long-lived assets 1,071
Provision for loss contingency 670 Restructuring, acquisition and other expenses 261 Expense in connection with legal settlements and reserves 45 Amortization of purchased intangible assets 44
2,091
Operating income adjustments 3,510 (3) Tax effect and other items (802)
Net income adjustments 2,708
(4)
The weighted average number of shares was 873 million for the year ended December31, 2012. Non-GAAP earnings per share can be reconciled with GAAP earnings pershare by dividing each of the amounts included in footnotes 1-3 above by theapplicable weighted average share number.
75
1
1,2
1,2,3
4

Table of Contents
Year ended
December 31, 2011
U.S. dollars and shares in millions
(except per share amounts)
GAAP Non-GAAPAdjustments
Non-GAAP
% ofNet
Revenues
Gross profit 9,515 1,190 10,705 58% Operating income 3,109 2,144 5,253 29% Net income attributable to Teva 2,759 1,679 4,438 24% Earnings per share attributable to Teva—diluted 3.09 1.88 4.97
(1) Amortization of purchased intangible assets 668 Costs related to regulatory actions taken in facilities 170 Inventory step-up 352
Gross profit adjustments 1,190 (2) Impairment of long-lived assets 201
Provision for loss contingency 30 Restructuring, acquisition and other expenses 244 Expense in connection with legal settlements and reserves 441 Amortization of purchased intangible assets 38
954
Operating income adjustments 2,144 (3) Tax effect and other items (465)
Net income adjustments 1,679
(4)
The weighted average number of shares was 893 million for the year ended December 31,2011. Non-GAAP earnings per share can be reconciled with GAAP earnings per share bydividing each of the amounts included in footnotes 1-3 above by the applicable weightedaverage share number.
76
1
1,2
1,2,3
4

Table of Contents
Year ended
December 31, 2010
U.S. dollars and shares in millions
(except per share amounts)
GAAP Non-GAAPAdjustments Non-GAAP
% of NetRevenues
Gross profit 9,065 604 9 ,669 60% Operating income 3,871 1,062 4,933 31% Net income attributable to Teva 3,331 803 4,134 26% Earnings per share attributable to Teva—diluted 3.67 0.87 4.54
(1) Amortization of purchased intangible assets 497 Inventory step-up 107
Gross profit adjustments 604 (2) Provision for loss contingency —
Impairment of long-lived assets 124 Restructuring, acquisition and other expenses 302 Amortization of purchased intangible assets 30 Expense in connection with legal settlements and reserves 2
458
Operating income adjustments 1,062 (3) Tax effect and other items (259)
Net income adjustments 803
(4)
The weighted average number of shares was 921 million for the year endedDecember 31, 2010. Non-GAAP earnings per share can be reconciled with GAAPearnings per share by dividing each of the amounts included in footnotes 1-3 aboveby the applicable weighted average share number.
For 2010, the difference between the add back for diluted earnings per share calculations represents potential dilution of convertible senior debentures,which had an anti-dilutive effect on the reported earnings per share while being dilutive on a non-GAAP basis.
Non-GAAP Effective Tax RateThe provision for non-GAAP taxes for 2012 amounted to $661 million on pre-tax non-GAAP income of $5.4 billion. The provision for taxes in the
comparable period of 2011 was $592 million on pre-tax income of $5.1 billion, and in 2010, was $613 million on pre-tax income of $4.8 billion. The non-GAAP tax rate for 2012 and 2011 was 12% as compared to 13% in 2010. The annual non-GAAP effective tax rate for 2012 was primarily the result of the mixof products (both type and location of production) sold during the year. In general, we benefit more from tax incentives on products for which we also producethe API. In addition, the release of reserves for uncertain tax positions and tax benefits as a result of mergers between recently acquired companies and oursubsidiaries further reduced the effective tax rate for 2012.
In the future, the effective tax rate is expected to fluctuate as a result of various factors, including changes in the products and geographical distributionof our income, the effect of any mergers and acquisitions, and the effects of statutes of limitations and legal settlements which may affect provisions foruncertain tax positions. We expect that the tax rate in future years will be significantly higher than this year, as a result of the product mix projected for theseyears.
77
1
1,2
1,2,3
4

Table of Contents
Trend InformationThe following factors are expected to have an effect on our 2013 results:
• a small decrease in sales of Copaxone as a result of changes in the competitive landscape;
• continuation of the generic competition for Provigil in the United States, which began in April 2012, resulting in a material decrease in sales of
this product when compared to 2012 sales;
• increases in operating expenses, due to higher levels of sales and marketing activities for our specialty pharmaceuticals;
• continued, substantial amortization of intangible assets throughout the year;
• the impact of currency fluctuations on revenues and net income, as well as on various balance sheet line items; and
• substantial restructuring and impairment expenses relating to improvements in our production network, supply chain and resource deployment
processes.
Impact of Currency Fluctuations and InflationBecause our results are reported in U.S. dollars, changes in the rate of exchange between the U.S. dollar and the local currencies in the markets in which
we operate (primarily the euro, Israeli shekel, Russian ruble, Canadian dollar, British pound, Japanese yen and Hungarian forint) affect our results. During2012, the following main currencies relevant to our operations decreased in value against the U.S. dollar (each on an annual average compared to annualaverage basis): the euro by 8%, Israeli shekel by 7%, Russian ruble by 5%, Canadian dollar by 1%, British pound by 1% and Hungarian forint by 11%,while the Japanese yen was unchanged.
As a result, exchange rate movements during 2012 in comparison with 2011 negatively impacted overall revenues by approximately $572 million. Werecorded lower expenses due to these currency fluctuations, and as a result our operating income increased.
Exchange rates also had a significant impact on our balance sheet, as approximately 65% of our net assets, including both non-monetary and monetaryassets that were translated from the functional currencies into U.S. dollar, were in non U.S. dollar currencies. When compared with the end of 2011, certainchanges in currency rates had a positive impact of $0.6 billion on our equity, mainly due to the increase in value against the U.S. dollar of: the euro by 2%,the Hungarian forint by 10%, the Polish zloty by 10%, the Czech koruna by 4%, the Chilean peso by 8% and the British pound by 4%. All comparisons areon the basis of end of year rates.
Critical Accounting PoliciesThe preparation of our consolidated financial statements in conformity with U.S. GAAP requires management to make estimates and assumptions in
certain circumstances that affect the amounts reported in the accompanying consolidated financial statements and related footnotes. Actual results may differfrom these estimates. To facilitate the understanding of our business activities, certain accounting policies that are more important to the portrayal of ourfinancial condition and results of operations and that require management’s subjective judgments are described below. We base our judgments on ourexperience and on various assumptions that we believe to be reasonable under the circumstances. Please refer to note 1 to our consolidated financial statementsfor a summary of all of our significant accounting policies.
Revenue Recognition and Sales Reserves and Allowances (“SR&A”)Revenue is recognized from product sales, including sales to distributors when persuasive evidence of an arrangement exists, delivery has occurred, the
selling price is fixed or determinable and collectability is reasonably assured. This generally occurs when products are shipped and title risk and rewards forthe products are transferred to the customer.
78
®
®

Table of Contents
Revenues from product sales are recorded net of provisions for estimated chargebacks, rebates, returns, cash discounts and other deductions, such asshelf stock adjustments, which can be reasonably estimated. When sales provisions are not considered reasonably estimable by Teva, the revenue is deferredto a future period when more information is available to evaluate the impact. These provisions primarily relate to sales of pharmaceutical products in theUnited States.
Provisions for chargebacks, rebates including Medicaid and other governmental program discounts, rebates and other promotional items, such as shelfstock adjustments, are included in “sales reserves and allowances” under “current liabilities.” These provisions are recognized concurrently with the sales ofproducts. Provisions for doubtful debts and prompt payment discounts are netted against “Accounts receivable.”
We adjust these provisions in the event that it appears that the actual amounts may differ from the estimated provisions. The following briefly describesthe nature of each deduction and how provisions are estimated in our consolidated financial statements.
Rebates and Other Sales Reserves and Allowances:Rebates and Other Sales Reserves and Allowances includes rebates for customer programs and government, shelf stock adjustments and other
promotional programs. Rebates represent the majority of the reserve.
Customer Volume Rebates. Rebates are primarily related to volume incentives and are offered to key customers to promote loyalty. These rebateprograms provide that, upon the attainment of pre-established volumes or the attainment of revenue milestones for a specified period, the customerreceives a rebate. Since rebates are contractually agreed upon, they are estimated based on the specific terms in each agreement. Externally obtainedinventory levels are evaluated in relation to estimates made for rebates payable to indirect customers.
Medicaid and Other Governmental Rebates. Pharmaceutical manufacturers whose products are covered by the Medicaid program are requiredto rebate to each state a percentage of their average manufacturer’s price for the products dispensed. Many states have also implemented supplementalrebate programs that obligate manufacturers to pay rebates in excess of those required under federal law. We estimate these rebates based on historicaltrends of rebates paid as well as on changes in wholesaler inventory levels and increases or decreases in sales. Included in the 2012 and 2011 provisionsare estimates for the impact of changes to Medicaid rebates and associated programs related to U.S. healthcare reform.
Shelf Stock Adjustments. The custom in the pharmaceutical industry is generally to grant customers a shelf stock adjustment based on thecustomers’ existing inventory contemporaneously with decreases in the market price of the related product. The most significant of these relate toproducts for which an exclusive or semi-exclusive period exists. Provisions for price reductions depend on future events, including price competition,new competitive launches and the level of customer inventories at the time of the price decline. We regularly monitor the competitive factors that influencethe pricing of our products and customer inventory levels and adjust these estimates where appropriate.
Other Promotional Arrangements. Other promotional or incentive arrangements are periodically offered to customers specifically related to thelaunch of products or other targeted promotions. Provisions are made or expenses recorded in the period for which the customer earns the incentive inaccordance with the contractual terms.
Prompt Pay Discounts. Prompt pay discounts are offered to most customers to encourage timely payment. Discounts are estimated at the time ofinvoice based on historical discounts in relation to sales. Prompt pay discounts are almost always utilized by customers. As a result, the actualdiscounts do not vary significantly from the estimated amount.
Chargebacks. We have arrangements with various third parties, such as managed care organizations and drug store chains, establishing pricesfor certain of our products. While these arrangements are made
79
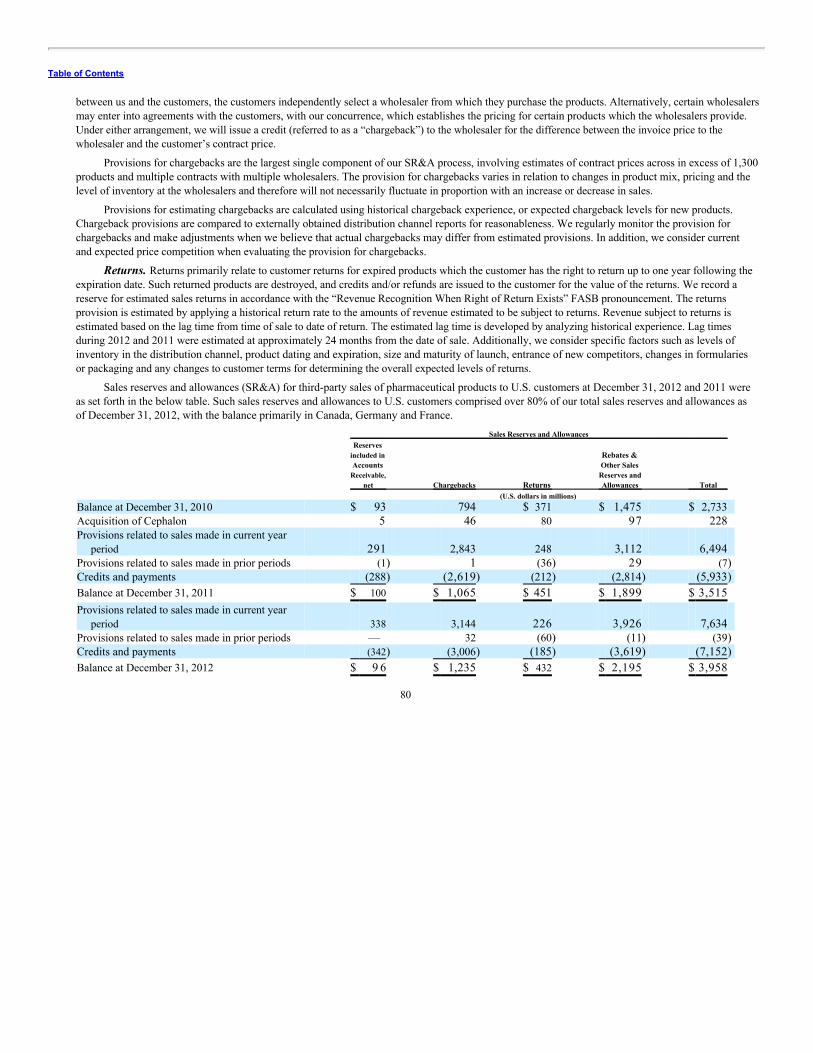
Table of Contents
between us and the customers, the customers independently select a wholesaler from which they purchase the products. Alternatively, certain wholesalersmay enter into agreements with the customers, with our concurrence, which establishes the pricing for certain products which the wholesalers provide.Under either arrangement, we will issue a credit (referred to as a “chargeback”) to the wholesaler for the difference between the invoice price to thewholesaler and the customer’s contract price.
Provisions for chargebacks are the largest single component of our SR&A process, involving estimates of contract prices across in excess of 1,300products and multiple contracts with multiple wholesalers. The provision for chargebacks varies in relation to changes in product mix, pricing and thelevel of inventory at the wholesalers and therefore will not necessarily fluctuate in proportion with an increase or decrease in sales.
Provisions for estimating chargebacks are calculated using historical chargeback experience, or expected chargeback levels for new products.Chargeback provisions are compared to externally obtained distribution channel reports for reasonableness. We regularly monitor the provision forchargebacks and make adjustments when we believe that actual chargebacks may differ from estimated provisions. In addition, we consider currentand expected price competition when evaluating the provision for chargebacks.
Returns. Returns primarily relate to customer returns for expired products which the customer has the right to return up to one year following theexpiration date. Such returned products are destroyed, and credits and/or refunds are issued to the customer for the value of the returns. We record areserve for estimated sales returns in accordance with the “Revenue Recognition When Right of Return Exists” FASB pronouncement. The returnsprovision is estimated by applying a historical return rate to the amounts of revenue estimated to be subject to returns. Revenue subject to returns isestimated based on the lag time from time of sale to date of return. The estimated lag time is developed by analyzing historical experience. Lag timesduring 2012 and 2011 were estimated at approximately 24 months from the date of sale. Additionally, we consider specific factors such as levels ofinventory in the distribution channel, product dating and expiration, size and maturity of launch, entrance of new competitors, changes in formulariesor packaging and any changes to customer terms for determining the overall expected levels of returns.
Sales reserves and allowances (SR&A) for third-party sales of pharmaceutical products to U.S. customers at December 31, 2012 and 2011 wereas set forth in the below table. Such sales reserves and allowances to U.S. customers comprised over 80% of our total sales reserves and allowances asof December 31, 2012, with the balance primarily in Canada, Germany and France.
Sales Reserves and Allowances
Reservesincluded inAccounts
Receivable,net Chargebacks Returns
Rebates &Other Sales
Reserves andAllowances Total
(U.S. dollars in millions) Balance at December 31, 2010 $ 93 794 $ 371 $ 1,475 $ 2,733 Acquisition of Cephalon 5 46 80 97 228 Provisions related to sales made in current year
period 291 2,843 248 3,112 6,494 Provisions related to sales made in prior periods (1) 1 (36) 29 (7) Credits and payments (288) (2,619) (212) (2,814) (5,933) Balance at December 31, 2011 $ 100 $ 1,065 $ 451 $ 1,899 $ 3,515 Provisions related to sales made in current year
period 338 3,144 226 3,926 7,634 Provisions related to sales made in prior periods — 32 (60) (11) (39) Credits and payments (342) (3,006) (185) (3,619) (7,152) Balance at December 31, 2012 $ 9 6 $ 1,235 $ 432 $ 2,195 $ 3,958
80

Table of Contents
Reserves at December 31, 2012 increased by approximately $443 million from December 31, 2011. The most significant variances were an increase inrebates and other sales reserves of approximately $296 million, and an increase to chargebacks of $170 million. Chargebacks have increased due to overallmix of products sold. The increase in rebates and other sales reserves is primarily related to the impact of pricing actions during the year and higher rebates tocustomers, as well as additional Medicaid and other governmental rebates related to U.S. healthcare reform.
Actual inventory on hand with our customers may be higher or lower due to differences between actual and projected demand. We monitor inventorylevels to minimize risk of excess quantities. As is customary in the industry, we may provide additional incentives to wholesalers for the purchase of certaininventory items or in relation to wholesale trade shows.
Expenses in Connection with Collaboration AgreementsExpenses incurred in relation to third party cooperation arrangements are recorded and generally included in cost of sales where the third party is a
supplier of product or related product components. In other cases, payments are generally considered marketing costs and are included in selling andmarketing expenses. When payments or royalties are received, they are included in revenue.
Income TaxesThe provision for income tax is calculated based on our assumptions as to our entitlement to various benefits under the applicable tax laws in the
jurisdictions in which we operate. The entitlement to such benefits depends upon our compliance with the terms and conditions set out in these laws.
Accounting for uncertainty in income taxes requires that tax benefits recognized in the financial statements must be at least more likely than not of beingsustained based on technical merits. The amount of benefits recorded for these positions is measured as the largest benefit more likely than not to be sustained.Significant judgment is required in making these determinations.
Deferred taxes are determined utilizing the asset and liability method based on the estimated future tax effects of differences between the financialaccounting and tax bases of assets and liabilities under the applicable tax laws. Valuation allowances are provided if, based upon the weight of availableevidence, it is more likely than not that some or all of the deferred tax assets will not be realized. In the determination of the appropriate valuation allowances wehave considered the most recent projections of future business results and prudent tax planning alternatives that may allow us to realize the deferred tax assets.Taxes that would apply in the event of disposal of investments in subsidiaries have not been taken into account in computing deferred taxes, as it is ourintention to hold these investments, rather than realize them.
Income derived from our tax exempt Approved Enterprises in Israel triggers tax payments only upon declaration of dividend from such income, exceptfor income of an Approved Enterprise under the Strategic Investment Track, which is exempt upon distribution as well. In 2012 we distributed dividends inthe amount of $115 million out of our Approved Enterprise income earned in 2012 and paid the corporate tax due on such distributions. In future years weexpect to have sufficient income from other sources to fund our dividend distributions. Accordingly, we intend to permanently reinvest the amounts of taxexempt income (other than income from the strategic Approved Enterprise) earned up to 2012 and do not intend to declare further dividend distributions fromsuch income. Therefore, no deferred taxes have been provided in respect of such tax exempt income. In general, we do not expect our non-Israeli subsidiaries todistribute taxable dividends in the foreseeable future, as their earnings are needed to fund their growth while we expect to have sufficient resources in the Israelicompanies to fund our cash needs in Israel. An assessment of the tax that would have been payable had the Company’s foreign subsidiaries distributed theirincome to the Company is not practicable because of the multiple levels of corporate ownership and multiple tax jurisdictions involved in each hypotheticaldividend distribution.
81

Table of Contents
ContingenciesFrom time to time we are subject to claims arising in the ordinary course of our business, including patent, product liability and other litigation. In
determining whether liabilities should be recorded for pending litigation claims, we assess the allegations made and the likelihood that we will be able to defendagainst the claim successfully. We record provisions to the extent that we conclude that a contingent liability is probable and the amount thereof is estimable.Because litigation outcomes and contingencies are unpredictable, and because excessive verdicts can occur, these assessments involve complex judgmentsabout future events and can rely heavily on estimates and assumptions.
InventoriesInventories are stated at the lower of cost or market. Cost is determined as follows: raw and packaging materials and purchased products—mainly on a
“moving average” basis; finished products and products in process; raw material and packaging component—mainly on a “moving average” basis;capitalized production costs component—on an average basis over the production period.
Our inventories generally have a limited shelf life and are subject to impairment as they approach their expiration dates. We regularly evaluate thecarrying value of our inventories and when, in our opinion, factors indicate that impairment has occurred, we establish a reserve against the inventories’carrying value. Our determination that a valuation reserve might be required, in addition to the quantification of such reserve, requires us to utilize significantjudgment. Although we make every effort to ensure the accuracy of forecasts of future product demand, any significant unanticipated decreases in demandcould have a material impact on the carrying value of our inventories and reported operating results.
Our policy is to capitalize saleable product for unapproved inventory items when economic benefits are probable. We evaluate expiry, legal risk andlikelihood of regulatory approval on a regular basis. If at any time approval is deemed to not be probable, the inventory is written down to its net realizablevalue. To date, inventory allowance adjustments in the normal course of business have not been material. However, from time to time, due to a regulatoryaction or lack of approval or delay in approval of a product, we may experience more significant impact.
Valuation of Intangible Assets, Marketable Securities and Long-Lived AssetsIntangible assets
Goodwill reflects the excess of the consideration paid or transferred plus the fair value of any noncontrolling interest in the acquiree at the acquisitiondate over the fair values of the identifiable net assets acquired. Goodwill is not amortized but rather is tested for impairment annually per reporting unit at theend of each year, or whenever events or circumstances present an indication of impairment.
Identifiable intangible assets are comprised of definite life intangible assets and indefinite life intangible assets.
Definite life intangible assets consist mainly of acquired product rights and other rights relating to products in respect of which an approval formarketing was received from the FDA or the equivalent agencies in other countries.
Definite life intangible assets are amortized using mainly the straight-line method over their estimated period of useful life which is determined byidentifying the period in which substantially all of the cash flows are expected to be generated. Impairment might be triggered whenever events or circumstancespresent an indication of impairment.
82

Table of Contents
Indefinite life intangible assets are comprised of trade names and acquired research and development in-process. Indefinite life intangible assets are notamortized but rather are tested for impairment annually at December 31 of each year, or whenever events or circumstances present an indication of impairment.Research and development in-process will continue to be tested for impairment until the related research and development efforts are either completed orabandoned. Upon completion of the related research and development efforts, management determines the remaining useful life of the intangible assets andamortizes them accordingly. In case of abandonment, the related research and development efforts are impaired.
Our judgments regarding the existence of impairment indicators are based on legal factors, market conditions and operating performances of ourbusinesses and products. Future events could cause us to conclude that impairment indicators exist and that the carrying values of our intangible assets orgoodwill are impaired. Any resulting impairment loss could have a material adverse impact on our financial position and results of operations.
In addition, we evaluate the recoverability and measure the possible impairment of goodwill. The goodwill impairment test is applied by performing aqualitative assessment before calculating the fair value of the reporting unit. If, on the basis of qualitative factors, it is not more likely than not that the fairvalue of the reporting unit is less than the carrying amount, further testing of goodwill for impairment would not be required. If it is determined that it is morelikely than not that the fair value of the reporting unit fair value is less than the carrying amount of the goodwill, the goodwill impairment test is applied usinga two-step approach. In the two-step approach, the first step screens for potential impairment, and the second step measures the amount of the impairment, ifany. The first step begins with the estimation of the fair value of the reporting unit. Our estimate of fair value considers publicly available informationregarding the market capitalization of the company, as well as (1) publicly available information regarding comparable publicly traded companies in thepharmaceutical industry, (2) the financial projections and future prospects of our business, including its growth opportunities and likely operationalimprovements, and (3) comparable sales prices, if available. As part of the first step to assess potential impairment, we compare, on an operating unit level,our estimate of fair value for such operating unit to the book value of the operating unit. If the book value of any of the operating units is greater than theestimate of its fair value, we would then proceed to the second step to measure the impairment, if any. The second step measures the amount of impairment bycomparing the implied fair value of goodwill with its carrying value. Such implied fair value is determined by allocating the fair value of the operating unit toall of the assets and liabilities of that unit as if the operating unit had been acquired in a business combination and the fair value of the reporting unit was thepurchase price paid to acquire the operating unit. The excess of the fair value of the operating unit over the amounts assigned to its assets and liabilities is theimplied fair value of goodwill. If the carrying amount of the operating unit’s goodwill is greater than its implied fair value, an impairment loss will berecognized in the amount of the excess. Any resulting impairment loss could have a material adverse impact on our financial position and results of operations.
Marketable securitiesMarketable securities consist mainly of money market funds, debt securities and equity securities classified as available-for-sale and are recorded at fair
value. The fair value of quoted securities is based on current market value. When securities do not have an active market, fair value is determined using avaluation model. This model is based on reference to other instruments with similar characteristics, or a discounted cash flow analysis, or other pricingmodels making use of market inputs and relying as little as possible on entity-specific inputs. Changes in fair value, net of taxes, are reflected in othercomprehensive income (loss).
Factors considered in determining whether a loss is temporary include the extent to which fair value has been less than the cost basis, the financialcondition and near-term prospects of the investee based on the credit rating, and our intent and ability to hold the investment for a period of time sufficient toallow for any anticipated recovery in market value. If an other-than-temporary impairment exists for debt securities, we separate the other-than-temporaryimpairment into the portion of the loss related to credit factors, or the credit loss portion, and the
83

Table of Contents
portion of the loss that is not related to credit factors, or the non-credit loss portion. The credit loss portion is the difference between the amortized cost of thesecurity and our best estimate of the present value of the cash flows expected to be collected from the debt security. The non-credit loss portion is the residualamount of the other-than-temporary impairment. The credit loss portion is recorded as a charge to earnings, and the non-credit loss portion is recorded as aseparate component of other comprehensive income (loss).
Long-lived assetsWe test long-lived assets for impairment whenever events or circumstances present an indication of impairment. The impairment test consists of a
comparison of the fair value of the intangible assets and fixed assets to their carrying amounts. If the sum of expected future cash flows (undiscounted andwithout interest charges) of the long-lived assets is less than the carrying amount of such assets, an impairment would be recognized and the assets would bewritten down to their estimated fair values, based on expected future discounted cash flows.
Recently Issued Accounting PronouncementsSee note 1ab to our consolidated financial statements.
Liquidity and Capital ResourcesTotal assets amounted to $50.6 billion at December 31, 2012, compared to $50.1 billion at December 31, 2011. The increase is mainly due to an
increase in our cash balances as a result of the short period between the debt issuance at the end of 2012 and the redemption of $1.0 billion of debt in earlyJanuary 2013. In addition, inventories increased as a result of growth in our business and the effect of foreign exchange fluctuations, and goodwill increaseddue to foreign exchange fluctuations and growth in our fixed assets. This was partially offset by a decrease in intangible assets, mainly due to amortization ofproduct rights and impairment of intangibles.
Our working capital balance, which includes accounts receivable, inventories and other current assets net of SR&A, accounts payable and other currentliabilities, was $3.6 billion at December 31, 2012, down from $3.9 billion at December 31, 2011.
Inventory balances amounted to $5.5 billion at December 31, 2012, compared with $5.0 billion at December 31, 2011. During 2012, Teva improvedits inventory controls, thereby slowing down the trend of increasing inventories Teva faced in 2011. Accounts receivable, net of SR&A, was $0.6 billion atDecember 31, 2012, compared to $1.8 billion at December 31, 2011. The decrease was mainly due to high collection rates in several countries during 2012,which more than offset the lower rate of securitization of accounts receivable during 2012, as compared to 2011.
Accounts payable and accruals decreased to $3.6 billion at December 31, 2012, compared to $3.9 billion at December 31, 2011, mainly due to legalsettlements and tax payments made in 2012.
We are monitoring closely, on an ongoing basis, the accounts receivable balances in countries that, based on our internal assessment, are experiencingsignificant economic stress, and are taking action to limit our exposure in these countries. Among these are Greece, Italy, Portugal, and Spain, which areaffected by the crisis in Europe and where we face an increase in the length of time it takes to collect receivables. We are taking measures to limit our risks insome of these countries by securitizing receivables without recourse and purchasing credit insurance. In addition, we are preparing contingency plans forvarious Eurozone crisis scenarios of varying severity.
Investment in property, plant and equipment amounted to $1,104 million in 2012, compared to $1,053 million in 2011. Depreciation amounted to $428million in 2012, compared to $358 million in 2011. The increase in depreciation was mainly due to the acquisition of Taiyo as well as to investments inoperation facilities and equipment.
84

Table of Contents
Cash and cash equivalents, short term and long term investments at December 31, 2012 increased by $1.3 billion to $3.1 billion, reflecting cashgenerated during 2012 and cash on hand resulting from debt issuances, less cash paid for the debt repayments described below. In addition, on January 7,2013, Teva prepaid $1 billion of its senior notes.
At December 31, 2012, $31 million of our marketable securities were auction rate securities, with a face value of $44 million, compared to a totalholding of auction rate securities with a face value of $216 million as of December 31, 2011. During 2012, we sold auction rate securities for consideration of$16 million.
2012 Debt MovementsTotal debt increased by $0.2 billion in 2012. During January 2013, Teva prepaid approximately $1.0 billion of its 1.7% senior notes due 2014.
In December 2012, Teva issued senior notes in an aggregate principal amount of $2.0 billion; $1.3 billion due 2022 bearing interest of 2.95%, and $0.7billion due 2020 bearing interest of 2.25%. The proceeds of this offering were used to pay down $0.7 billion of bank term loan at LIBOR+0.85% taken inconnection with the Cephalon acquisition and to redeem $1.0 billion 1.7% senior notes in January 2013, that were also issued in connection with the Cephalonacquisition.
In December 2012, we entered into a five-year $3.0 billion unsecured syndicated credit facility, which replaced the previous $2.5 billion facility.
In November 2012, we prepaid $0.3 billion of our three-year bank term loan, which we entered into in connection with the Cephalon acquisition.
In June and August 2012, Teva repaid an aggregate amount of $1.0 billion of bank term loan at LIBOR plus 0.55% entered into in connection with theCephalon acquisition.
In April 2012, we issued CHF 450 million 1.5% senior notes due October 2018 and senior notes in an aggregate principal amount of EUR 1 billion due2019 bearing interest of 2.875%. The proceeds of these offerings were used to repay the 1.5% senior notes due in June 2012, which were issued in connectionwith the ratiopharm acquisition, as well as the $500 million principal balance of our credit facility with HSBC. The remaining balance is to be used forgeneral corporate purposes.
In March 2012, we entered into a JPY 100.5 billion senior unsecured fixed rate term loan credit agreement for five and seven years with 0.99% and1.42% interest rates, respectively. In April 2012, we drew down the entire amount available under the facility and repaid the borrowings used to finance theacquisition of Taiyo.
Prior Years’ Debt MovementsTotal debt increased by $7.6 billion in 2011, primarily due to the financing of the Taiyo and Cephalon acquisitions, as further described below.
In June and July 2011, we entered into new and revised syndicated credit agreements providing an aggregate of $6.5 billion for use in financing theacquisition of Cephalon, among other things. In September 2011, we entered into a bridge loan facility of $1.5 billion in connection with Cephalon financing.On October 11, 2011, we borrowed approximately $6.5 billion under the June and September credit facilities to finance the acquisition of Cephalon. InNovember 2011, in connection with the Cephalon acquisition, our finance subsidiaries issued
85

Table of Contents
notes in an aggregate principal amount of $5.0 billion. The proceeds were used to repay short term indebtedness used to finance the Cephalon acquisition andto repay approximately $2.1 billion of convertible notes that were assumed with the acquisition of Cephalon. Following these financing transactions, we had$2 billion of term loans outstanding (in addition to the $5 billion of notes). These term loans were fully repaid during 2012.
In March 2011, we issued notes in an aggregate principal amount of $750 million. The proceeds of this offering were used mainly to repay $814 millionof our 1.75% senior convertible debentures due 2026.
In connection with the ratiopharm acquisition, we issued $2.5 billion in notes in June 2010, including $1 billion of 3.0% fixed rate senior notesmaturing in June 2015, $1 billion of 1.5% fixed rate senior notes maturing in June 2012 and $500 million of LIBOR+0.40% floating rate senior notes thatmatured in December 2011. As of December 31, 2012, the only outstanding note is the 3.0% fixed rate senior notes maturing in June 2015.
In December 2008 and September 2009, a Teva subsidiary signed two credit agreements with the European Investment Bank (EIB), pursuant to whichwe borrowed from the EIB €200 million at a rate of Euribor plus a spread and another $147 million at a rate of LIBOR plus a spread for a six year term.
In connection with the Ivax acquisition in January 2006, Teva finance subsidiaries issued an aggregate of $817.5 million of 1.75% convertible seniordebentures due 2026 and $575 million of 0.25% convertible senior debentures due 2026. The holders of the 0.25% debentures have the right to cause Teva toredeem the notes in February 2016. In addition, such holders currently have the right to convert their debentures into shares at a rate of $44.42 per share. InFebruary 2011, Teva elected to exercise its right to redeem the 1.75% debentures, which resulted in substantially all of the holders tendering their debenturesfor conversion. As a result, Teva paid an aggregate of $814 million in cash and issued approximately 1.2 million shares upon conversion and/or redemption ofsuch debentures.
In addition to the above convertible senior debentures, in January 2006, a Teva finance subsidiary issued an aggregate of $1 billion of 6.15% seniornotes due 2036 and $500 million of 5.55% senior notes due 2016. During 2008, Teva repurchased $13 million and $7 million of those notes, respectively.
The remaining debt consists of floating-rate bank loans. These borrowings, which are in currencies other than Israeli shekel, are usually linked to therelevant LIBOR plus a spread of 0.2% – 1.5%.
The portion of total debt classified as short term at December 31, 2012 was 20%, down from 29% at December 31, 2011 as a result of long termrefinancing during 2012.
Teva’s financial leverage has been steady at 39% as of December 31, 2012.
During 2012, we had less than $0.5 million of conversion of senior convertible debentures, compared to $12 million during 2011.
Shareholders’ Equity, Cash Flow and DividendsOur shareholders’ equity was $22.9 billion at December 31, 2012 compared to $22.3 billion at December 31, 2011. The increase resulted primarily
from net income attributable to us for the year of $2.0 billion and approximately $630 million in positive translation differences as a result of the weakening ofthe U.S. dollar relative to most of the major currencies in the end of 2012. The increase was partially offset by approximately $1.2 billion in share repurchasesand dividend payments of approximately $0.9 billion.
Cash flow generated from operating activities during 2012 was $4,572 million, an increase of approximately $440 million from 2011. In 2012, cashflow was influenced by increased collection level, as well as better control of inventories, offset by high payments related to legal settlements and net incomeadjustments.
86

Table of Contents
Cash flow generated from operating activities, net of cash used for capital investments and dividends paid, amounted to approximately $2,738 millionin 2012, an increase of $368 million from 2011. The increase resulted mainly from higher operating cash flow as well as higher proceeds from divestitures ofcertain assets, partially offset by higher capital expenditures and higher dividend payments (an additional $55 million paid compared to 2011).
We announced a dividend for the fourth quarter of 2012 of NIS 1.15 (31.1 cents according to the rate of exchange on February 6, 2013) per share, anincrease of 15% from NIS 1.00, which was the dividend declared for the third quarter of 2012. The dividend payment of the fourth quarter of 2012, which isexpected to take place on March 7, 2013, will be made with respect to ADSs on the basis of the then current U.S. dollar-NIS exchange rate.
CommitmentsIn addition to financing obligations under short-term debt and long-term senior notes and loans, debentures and convertible debentures, our major
contractual obligations and commercial commitments include leases, royalty payments and participation in joint ventures associated with research anddevelopment activities.
We are committed to pay royalties to owners of know-how, partners in alliances and certain other arrangements and to parties that financed research anddevelopment, at a wide range of rates as a percentage of sales of certain products, as defined in the agreements. In some cases, the royalty period is not defined;in other cases, royalties will be paid over various periods not exceeding 20 years, commencing on the date of the first royalty payment. We are also obligated tomake various contingent payments related to achievement of regulatory or sales milestones.
In connection with certain development, supply and marketing, and research and collaboration or services agreements, we are required to indemnify, inunspecified amounts, the parties to such agreements against third-party claims relating to (1) infringement or violation of intellectual property or other rights ofsuch third party; or (2) damages to users of the related products. Except as described in our consolidated financial statements, we are not aware of anymaterial pending action that may result in the counterparties to these agreements claiming such indemnification.
Certain of our loan agreements and debentures contain restrictive covenants, mainly the requirement to maintain certain financial ratios. We are currentlywell in compliance with all applicable financial ratios.
Our principal sources of short-term liquidity are our existing cash investments, liquid securities, and available credit facilities; primarily our recent $3.0billion syndicated revolving line of credit, as well as internally generated funds, which we believe are sufficient to meet our on-going operating needs. Our cashin hand is generally invested in bank deposits as well as liquid securities that bear fixed and floating rates.
In 2012, we repaid approximately $4.5 billion, mainly through refinancing. In January 2013, we redeemed an additional $1.0 billion of the 1.7% seniornotes due 2014 related to the Cephalon acquisition.
Trend InformationPlease see “Item 5—Operating and Financial Review and Prospects” and in particular “Supplemental Non-GAAP Income Data,” as well as “Item 4
—Information on the Company.”
87

Table of Contents
Off-Balance Sheet ArrangementsWe do not have any material off-balance sheet arrangements as defined in Item 5.E of Form 20-F. During 2011 and 2012, we securitized approximately
$535 million (net) of our trade receivables. The deal was accounted for as a sale transaction.
Aggregated Contractual ObligationsThe following table summarizes our contractual obligations and commitments as of December 31, 2012:
Payments Due By Period
Total Less than
1 year 1-3 years 3-5 years More than
5 years (U.S. dollars in millions) Long-term debt obligations, including estimated interest $17,559 $ 3,231* $2,934** $ 2,749*** $8,645**** Operating lease obligations 425 9 9 150 77 9 9 Purchase obligations (including purchase orders) 1,555 1,548 7 — — Total $ 19,539 $ 4,878 $3,091 $2,826 $ 8,744 * Includes $1.1 billion of LIBOR +0.9% Senior Notes due 2013, $1 billion of 1.7% Senior Notes due 2014 (which were redeemed in January 2013),
$200 million of LIBOR +0.8% Senior Notes due 2013 and $530 million of 0.25% Convertible Senior Debentures due 2026.** Includes $250 million of 1.7% Senior Notes due 2014, $500 million of LIBOR +0.5% Senior Notes due 2014 and $1 billion of 3.0% Senior Notes due
2015.*** Includes $950 million of 2.4% Senior Notes due 2016, $493 million of 5.55% Senior Notes due 2016 and JPY 65.5 billion loan assumed in
connection with Taiyo acquisition refinancing.**** Includes $987 million of 6.15% Senior Notes due 2036, $1.75 billion of 3.65% Senior Notes due 2021, Euro 1 billion of 2.875% Senior Notes due
2019, CHF 450 million of 1.5% Senior Notes due 2018, $1.3 billion of 2.95% Senior Notes due 2022, $0.7 billion of 2.25% Senior Notes due 2020and JPY 35 billion loan assumed in connection with Taiyo acquisition refinancing.
The total amount of unrecognized tax benefits for uncertain tax positions was $903 million at December 31, 2012. Payment of these obligations wouldresult from settlements with taxing authorities. Due to the difficulty in determining the timing of settlements, these obligations are not included in the abovetable. We do not expect a significant tax payment related to these obligations within the next year.
We have committed to future expenditures relating to joint ventures in accordance with the terms of the applicable agreements. These commitments willamount to approximately $400 million over the next five years unless the joint ventures are prematurely terminated.
We have committed to make potential future “milestone” payments to third parties under various agreements. Such payments are contingent upon theachievement of certain regulatory milestones and sales targets. The total contingent payments, were all milestones and targets to be achieved, presentingobligations with Phase II and more advanced stages, as of December 31, 2012, could reach an aggregate of up to approximately $1.3 billion. Such amountdoes not include additional sales-based milestone payments or royalties. Due to the uncertainty of the timing of these payments, these amounts, and theamounts described in the previous paragraph, are not included in the above table.
88

Table of Contents
ITEM 6: DIRECTORS, SENIOR MANAGEMENT AND EMPLOYEES
Directors and Senior ManagementThe following tables set forth information regarding the executive officers and directors of Teva as of February 11, 2013:
Executive Officers Name Age Officer Since PositionDr. Jeremy Levin 5 9 2012 President and Chief Executive OfficerIsaac Abravanel
58
2007
Group Executive Vice President, Human Resources & Chief IntegrationOfficer
Eyal Desheh 60 2008 Group Executive Vice President, Chief Financial OfficerRichard S. Egosi
50
2010
Group Executive Vice President, Chief Legal Officer and CompanySecretary
Dr. Michael Hayden 61 2012 President of Global R&D and Chief Scientific OfficerDr. Robert Koremans 50 2012 President and Chief Executive Officer of Teva EuropeProf. Itzhak Krinsky
60
2005
Chairman of Teva Japan, Chairman of Teva South Korea and Head ofBusiness Development Asia Pacific
Dr. Carlo de Notaristefani 5 5 2012 President and Chief Executive Officer—Global OperationsAllan Oberman 5 5 2012 President and Chief Executive Officer of Teva Americas GenericsJudith Vardi 54 2012 President and Chief Executive Officer of Teva EMIA and Asia PacificAharon Yaari 61 2002 Group Executive Vice President, Institutional and Community Affairs
Directors Name Age Director Since Term Ends
Dr. Phillip Frost—Chairman 76 2006 2015Prof. Moshe Many—Vice Chairman 84 1987 2013Roger Abravanel 6 6 2007 2015Dr. Arie Belldegrun 63 2013 2013Amir Elstein 57 2009 2013Chaim Hurvitz 52 2010 2014Prof. Roger Kornberg 6 5 2007 2013Prof. Richard A. Lerner 74 2012 2015Galia Maor 70 2012 2015Joseph Nitzani (1) 6 6 2008 2014Prof. Yitzhak Peterburg 62 2012 2013Dan Propper 71 2012 2014Prof. Dafna Schwartz (1) 62 2011 2014Ory Slonim 70 2008 2014Dan S. Suesskind 6 9 2010 2014Erez Vigodman 53 2009 2015 (1) Statutory independent director elected in accordance with the Israeli Companies Law.
89

Table of Contents
Executive OfficersDr. Jeremy Levin became President and CEO of Teva Pharmaceutical Industries Ltd. on May 9, 2012. Prior to joining Teva, Dr. Levin was a member
of the senior management team at Bristol-Myers Squibb (BMS), as Senior Vice President of Strategy, Alliances and Transactions. Before joining BMS,Dr. Levin served as Global Head of Strategic Alliances at Novartis Institutes of Biomedical Research. In addition, Dr. Levin has served on the executivecommittees and boards of numerous international bioscience, biotechnology, venture funds and research organizations. He received a BA in zoology fromOxford in 1974, and an MA and doctorate (DPhil) in cell biology and chromatin structure from the University of Oxford in 1976 and 1978, respectively. Healso received an MB, BChir degree (Bachelor of Medicine, Bachelor of Surgery) from the University of Cambridge in 1981. Dr. Levin has served as apracticing physician at university hospitals in South Africa, the United Kingdom and Continental Europe. In 2005 Dr. Levin was awarded the Albert EinsteinPrize for Leadership in Life Sciences by Mr. Shimon Peres.
Isaac Abravanel became Group Executive Vice President, Human Resources and Chief Integration Officer in 2012. From 2007 to 2012, Mr. Abravanelserved as Teva’s Corporate Vice President, Human Resources, and from 2009 to 2012, he also served as Teva’s Chief Integration Officer. Prior to joiningTeva, from 2005 to 2007, Mr. Abravanel was Deputy Chief Executive Officer of Bezeq Israel Telecommunications Co. Ltd., and from 2001 to 2005, he wasSenior Vice President of Operations & Customer Service at Pelephone Communications Ltd. Mr. Abravanel received a B.A. and an M.A. in political sciencefrom Haifa University in 1988 and 1989, respectively.
Eyal Desheh became Group Executive Vice President, Chief Financial Officer in 2012. From 2008 to 2012, Mr. Desheh served as Teva’s ChiefFinancial Officer. From 2000 until 2008, he served as Executive Vice President and Chief Financial Officer of Check Point Software Technologies Ltd.Mr. Desheh served as Deputy Chief Financial Officer at Teva from 1989 to 1996. Mr. Desheh received a B.A. in economics in 1978 and an M.B.A. infinance in 1981, both from the Hebrew University.
Richard S. Egosi became Group Executive Vice President, Chief Legal Officer and Company Secretary in 2012. From 2010 to 2012, Mr. Egosi servedas Teva’s Corporate Vice President, Chief Legal Officer and Company Secretary. Mr. Egosi has been with Teva since 1995, previously serving as Teva’sDeputy Chief Legal Officer and as Senior Vice President and General Counsel of Teva Americas. Mr. Egosi received a B.S. in economics from ClemsonUniversity in 1984 and a J.D. and M.B.A. from Emory University in 1988.
Dr. Michael Hayden joined Teva as President of Global R&D and Chief Scientific Officer in May 2012. He is also currently the Killam Professor ofMedical Genetics at the University of British Columbia and Canada Research Chair in Human Genetics and Molecular Medicine. He is also the founder andSenior Scientist of the Centre for Molecular Medicine and Therapeutics at the University of British Columbia. Prior to joining Teva, he founded threebiotechnology companies (NeuroVir, Aspreva Pharmaceuticals and Xenon Pharmaceuticals Inc.) and served as Chief Scientific Officer of Xenon from 2000 to2012. He has received numerous awards, including the Canada Gairdner Wightman Award in 2011, the Order of Canada Award in 2010, which is the highesthonor that Canada can give its citizens for exceptional achievement, and the Distinguished Scientist Award of the Canadian Society of Clinical Investigation in1998, and in 2008 he was named Canada’s Health Researcher of the Year. Dr. Hayden received his MB ChB in Medicine in 1975, PhD in Genetics in 1979and DCH Diploma in Child Health in 1979 from the University of Cape Town. He received his American Board Certification in both internal medicine andclinical genetics from Harvard Medical School in 1982 and an FRCPC in internal medicine from the University of British Columbia in 1984.
Dr. Rob Koremans joined Teva as President and CEO of Teva Pharmaceuticals Europe in March 2012. Prior to joining Teva, Dr. Koremans was amember of the Global Leadership Team of Sanofi and served as CEO of Zentiva and as Senior Vice President Generics, Strategy and Development at Sanofi.Before joining Sanofi on 2009, Dr. Koremans served as CEO of Cryo-Save, Europe’s leading stem cell company, as a member of the Executive
90

Table of Contents
Board in charge of Global Commercial Operations for Grunenthal GmbH and as Vice President Europe, Middle-East and Africa for Serono. Dr. Koremansreceived a medical degree from the Erasmus University of Rotterdam, the Netherlands in 1988.
Prof. Itzhak Krinsky became Chairman of Teva Japan, Chairman of Teva South Korea and Head of Business Development Asia Pacific in October2012. From 2005 to 2012, Prof. Krinsky served as Corporate Vice President—Corporate Business Development. Prior to joining Teva, from 2003 to 2005,Prof. Krinsky served as a managing director with the Silverfern Group, Inc., from 1998 to 2001, and managing director with Deutsche Bank (BankersTrust) and as a managing director of Trenwith Securities, LLC, all investment banks in New York City. Prof. Krinsky was a Professor of Finance &Business Economics at the Michael G. DeGroote School of Business, McMaster University from 1993 to 2000. Prof. Krinsky received his B.A and M.A. ineconomics from Tel Aviv University in 1976 and 1978, respectively, and his Ph.D. in economics from McMaster University in 1983.
Dr. Carlo de Notaristefani joined Teva as President and Chief Executive Officer—Global Operations in August 2012. Prior to joining Teva, from 2004to 2012, Dr. de Notaristefani was a member of the senior management team at BMS, where he served as President Technical Operations and Global SupportFunctions, with responsibility for global supply chain operations, quality and compliance, procurement and information technology. Before joining BMS, Dr.de Notaristefani held several senior positions of increasing responsibility in the areas of global operations and supply chain management with Aventis, HoechstMarion Roussell and Marion Merrell Dow. Dr. de Notaristefani holds a Ph.D. in chemical engineering from the University of Naples.
Allan Oberman became President and Chief Executive Officer of Teva Americas Generics in November 2012, after serving as the head of Teva’s NorthAmerica Generics division. From 2010 to 2012, Mr. Oberman served as President of Teva EMIA, where he had responsibility for Eastern Europe, MiddleEast, Israel and Africa. From 2008 to 2010, Mr. Oberman served as the Chief Operating Officer of the Teva International Group. From 2000 to 2008,Mr. Oberman served as the President and CEO of Novopharm Ltd., which is now Teva Canada. Prior to joining Teva, from 1996 to 2000, Mr. Oberman wasthe President of Best Foods Canada Inc. Mr. Oberman holds a MBA from the Schulich School of Business, York University and a BA from the Universityof Western Ontario.
Judith Vardi became President and Chief Executive Officer of Teva EMIA and Asia Pacific in 2012. From 2010 to 2012, Ms. Vardi served as VicePresident and General Manager of TEVA Latin America. Ms. Vardi has held a variety of other senior positions in Teva, including Vice President for the IMATRegion (Israel, Middle East, Africa, Turkey), General Manager of Teva Israel, and as Senior Director of Multiple Sclerosis Products in the Global ProductsDivision. Ms. Vardi received a B.A. in statistics and an M.B.A. from Tel Aviv University.
Aharon Yaari became Group Executive Vice President, Institutional and Community Affairs in 2012. From 2009 to 2012, Mr. Yaari served as GroupVice President—Teva Generics System. From 2006 to 2009, he served as Group Vice President, Global API Division, and from 2002 to 2006 he served asVice President—Global API division. Mr. Yaari joined Teva in 1981, and among his various assignments at Teva served as Vice President—Marketing andSales of Teva’s API Division from 1999 to 2002 and as President of Plantex USA from 1996 to 1999. Mr. Yaari received his B.A. and M.A. in economics(cum laude) from the Hebrew University in 1981 and 1988, respectively.
DirectorsDr. Phillip Frost has served as Chairman of the Board of Directors of Teva since March 2010, after serving as Vice Chairman of the Board of
Directors since January 2006 and as Chairman of the Board and Chief Executive Officer of IVAX Corporation from 1987 until 2006, when it was acquiredby Teva. Dr. Frost is Chairman of the Board and Chief Executive Officer of OPKO Health, Inc., a specialty pharmaceutical and diagnostics company,Chairman of the Board of PROLOR Biotech Inc. and Chairman of the Board of Ladenburg Thalmann Financial Services, Inc. Dr. Frost serves as a director ofCastle Brands Inc., Cocrystal Discovery Inc.
91

Table of Contents
and Coconut Grove Bank. He is also a member of the Board of Trustees of Mount Sinai Medical Center and the Board of Trustees of the University ofMiami. Dr. Frost received a B.A. in French literature from the University of Pennsylvania in 1957 and an M.D. from the Albert Einstein College of Medicinein 1961.
Prof. Moshe Many, M.D., Ph.D. has served as Vice Chairman of the Board of Directors of Teva since March 2010, having served as a director of Tevasince 1987. Prof. Many has served as president of the Ashkelon Academic College from January 2002 until July 2012 and was previously President of TelAviv University. He served as Chief of Urology from 1976 until 1987 and as Chairman of Surgery from 1983 until 1987 at Sheba Medical Center. Prof.Many serves as Chairman of the Board of Real Imaging Ltd. and a director of BiondVax Pharmaceuticals Ltd. He also served as a director of RosettaGenomics from 2002 to 2011. In January 2010, he received the Israel Ministry of Health Lifetime Achievement Award in recognition of his outstanding andunique contributions to the promotion and support of health matters in Israel. Prof. Many received his M.D. degree from Geneva University in 1952 and hisPh.D. in renal physiology from Tufts University in 1969.
Roger Abravanel joined Teva’s Board of Directors in 2007. In 2006 Mr. Abravanel retired from McKinsey & Company, which he joined in 1972 andwhere he had become a principal in 1979 and a director in 1984. Mr. Abravanel serves as a director of Admiral Group plc., Banca Nazionale del Lavoro (asubsidiary of BNP Paribas), Luxottica Group S.p.A. and COFIDE—Gruppo De Benedetti SpA. Mr. Abravanel received a bachelor’s degree in chemicalengineering from the Politechnic University in Milan in 1968 and an M.B.A. from INSEAD in 1972.
Dr. Arie Belldegrun joined Teva’s Board of Directors in 2013. Dr. Belldegrun is a director of the UCLA Institute of Urologic Oncology and has beenProfessor and Chair of Urologic Oncology at the David Geffen School of Medicine at the University of California, Los Angeles since 1996. Dr. Belldegrunwas the founder and founding Chairman of Agensys, Inc. and the co-founder, Vice Chairman of the Board and Chairman of the Scientific Advisory Board ofCougar Biotechnology. Dr. Belldegrun has also held the positions of Chairman of the Molecular and Biological Technology Committee of the AmericanUrological Association and member of its Technology Assessment Council; member of the Governor’s Council on Bioscience for the State of California; andthe biotechnology group leader and member of The Los Angeles Economy and Jobs Committee. Dr. Belldegrun is currently the Founder and ExecutiveChairman of Kite Pharma, Inc. and is the Chairman of Arno Therapeutics Inc. and of TheraCoat, Ltd. and a director of Nile Therapeutics Inc. Dr. Belldegrunreceived his medical degree at the Hebrew University of Hadassah Medical School and conducted his post-doctoral studies at the Weizmann Institute ofScience in Israel. He completed his residency in urologic surgery at Harvard Medical School and his surgical oncology fellowship at the National CancerInstitute (NIH).
Amir Elstein rejoined Teva’s Board of Directors in January 2009. From 2004 to 2008, Mr. Elstein was a member of Teva’s senior management, wheremost recently he held the position of Executive Vice President, Global Pharmaceutical Resources. From 1995 to 2004, Mr. Elstein served on Teva’s Board ofDirectors. Prior to joining Teva as an executive in 2004, Mr. Elstein held a number of executive positions at Intel Corporation, most recently as GeneralManager of Intel Electronics Ltd., an Israeli subsidiary of Intel Corporation. Mr. Elstein serves as Chairman of the Board of Israel Corporation Ltd., TowerSemiconductor Ltd., the Jerusalem College of Engineering and Chairman of the Board of the Israel Democracy Institute. Mr. Elstein also serves as Chairmanand/or as a member of the board of directors of several academic, scientific, educational, social and cultural institutions. Mr. Elstein received a B.Sc. inphysics and mathematics from the Hebrew University in Jerusalem in 1980, an M.Sc. in solid state physics from the Hebrew University in 1982 and adiploma of Senior Business Management from the Hebrew University in 1992.
Chaim Hurvitz joined Teva’s Board of Directors in 2010. Mr. Hurvitz currently serves as CEO of CH Health, a private venture capital firm, a positionhe has held since May 2011. Previously, he was a member of Teva’s senior management, serving as the President of Teva International Group from 2002 until2010, as President and CEO of Teva Pharmaceuticals Europe from 1992 to 1999 and as Vice President—Israeli Pharmaceutical Sales from 1999 until 2002.Mr. Hurvitz presently serves as a director of Aposense Ltd. He is a member of management of the Manufacturers Association of Israel and head of itspharmaceutical branch. He received a B.A. in political science and economics from Tel Aviv University in 1985.
92

Table of Contents
Prof. Roger D. Kornberg joined Teva’s Board of Directors in 2007. Prof. Kornberg is the Winzer Professor in Medicine in the Department ofStructural Biology at Stanford University, where he has taught since 1978. He has received many awards, including the Welch Prize (2001), the highestaward in chemistry in the U.S., the Leopold Mayer Prize (2002), the highest award in biomedical sciences of the French Academy of Sciences, and the NobelPrize in Chemistry (2006). Prof. Kornberg is a recipient of honorary degrees from universities in Europe and Israel, including the Hebrew University, where heis a visiting professor. Prof. Kornberg is a member of the National Academy of Sciences and an honorary member of other academies and professionalsocieties in the U.S., Europe and Japan. Prof. Kornberg serves as a director of Protalix BioTherapeutics, Inc, Cocrystal Discovery, Inc. and OphthaliX Inc.Prof. Kornberg received a B.A. in chemistry from Harvard in 1967 and a Ph.D. in chemistry from Stanford in 1972.
Prof. Richard Alan Lerner, M.D., joined Teva’s Board of Directors in February 2012. Prior to joining Teva, he served as President of The ScrippsResearch Institute from 1987 until January 2012, and is currently a member of its Skaggs Institute for Chemical Biology, where he is an Institute Professorand the Lita Annenberg Hazen Professor of Immunochemistry. Prof. Lerner served as a director of Kraft Foods, Inc from 2005 until 2012. He currently servesas a director of Opko Health, Inc. and Sequenom, Inc. Prof. Lerner has been the recipient of numerous honors and prizes, including the Parke-Davis Award in1978, the San Marino Prize in 1990 and the Wolf Prize in Chemistry for 1995. Prof. Lerner was awarded the California Scientist of the Year Award in 1996and the University of California Presidential Medal in 2002. Prof. Lerner is a member of the Royal Swedish Academy of Sciences and the United StatesNational Academy of Sciences, and holds honorary doctorates from esteemed academic institutions including the Technion-Israel Institute of Technology andOxford University. Prof. Lerner did undergraduate work at Northwestern University, received B.M.S and M.D. degrees from Stanford University MedicalSchool in 1964, and interned at Palo Alto Stanford Hospital from 1964 to 1965.
Galia Maor joined Teva’s Board of Directors in 2012. Prior to joining Teva, Ms. Maor served as President and Chief Executive Officer of the BankLeumi le-Israel B.M. Group from 1995 until 2012 after serving as Deputy General Manager of Bank Leumi from 1991 to 1995. She began her professionalcareer at Bank of Israel, serving in several senior management positions from 1963 to 1989, including Supervisor of Banks and Chairperson of theAdvisory Committee on Banking Issues from 1982 to 1987. Ms. Maor serves as a director on the board of Equity One, Inc. Over the years, Ms. Maor hascontributed to various committees on matters of legislation, structure and financial reporting within the Israeli capital markets and the banking system.Ms. Maor holds honorary doctorates from the Technion-Israel Institute of Technology, Ben Gurion University and Bar Ilan University. She received a B.A. ineconomics and statistics from the Hebrew University in 1964 and an M.B.A. from the Hebrew University in 1967. Ms. Maor was determined by the Boardof Directors to be a financial and accounting expert under Israeli law and applicable SEC and NYSE regulations.
Joseph Nitzani joined Teva’s Board of Directors in 2008, serving as a statutory independent director. Between 2001 and 2007, Mr. Nitzani held variousmanagement positions at Mizrahi-Tefachot Bank Ltd., most recently as Head of the Capital Markets Division. Previously, he served as Managing Director ofThe Government Companies Authority from 1991 to 1995 and CEO of The Tel-Aviv Stock Exchange from 1980 to 1991. Mr. Nitzani has served as adirector of three subsidiaries of Migdal Capital Markets Group since December 2009 (and as a Chairman of one of them since 2010). Mr. Nitzani also servedas a director of The Tel-Aviv Stock Exchange and of S&P Maalot, both from 2001 to 2007, of Adanim Mortgage Bank from 2006 to 2008 and of HadassahMedical Center from 1996 (as Chairman since June 2008) to 2010. Mr. Nitzani received a B.A. in economics from Bar-Ilan University in 1971 and anM.B.A. (with distinction) from Tel Aviv University in 1974. Mr. Nitzani qualifies as a statutory independent director under Israeli law and was determinedby the Board of Directors to be a financial and accounting expert under Israeli law and applicable SEC and NYSE regulations.
Prof. Yitzhak Peterburg rejoined Teva’s Board of Directors in January 2012. Prof. Peterburg was Teva’s Group Vice President—Global BrandedProducts from October 2010 until October 2011, after serving on Teva’s Board of Directors from 2009 until July 2010. Previously he served as President andCEO of Cellcom Israel Ltd. from 2003 to 2005 and as Director General of Clalit Health Services, the leading healthcare provider in Israel,
93

Table of Contents
from 1997 to 2002. He is a professor at the School of Business, Ben-Gurion University, and served as Chairman of the Board of Applisonix Ltd. from 2007until 2010. Prof. Peterburg currently serves as a director on the board of Rosetta Genomics Ltd. Prof. Peterburg received an M.D. degree from HadassahMedical School in 1977 and is board-certified in Pediatrics and Health Services Management. Prof. Peterburg received a doctoral degree in HealthAdministration from Columbia University in 1987 and an M.Sc. degree in Information Systems from the London School of Economics in 1990.
Dan Propper rejoined Teva’s Board of Directors in March 2012. Mr. Propper had previously been a director of Teva from 2007 until February 2011.Mr. Propper is the Chairman of the Board of Osem Investments Ltd., a leading Israeli manufacturer of food products. Mr. Propper served as the ChiefExecutive Officer of Osem for 25 years until April 2006. In addition to his role at Osem, from 1993 until 1999, Mr. Propper served as President of theManufacturers Association of Israel, an independent umbrella organization representing industrial enterprises in Israel, and as Chairman of the Federation ofEconomic Organizations in Israel. Mr. Propper has received awards for his contributions to Israeli industry and its economy, including an honorary doctoratefrom the Technion-Israel Institute of Technology in 1999. Mr. Propper serves as Chairman of the Supervisory Council of the Bank of Israel. He is a directorof Check Point Software Technologies Ltd. and a member of the Boards of Trustees of the Technion-Israel Institute of Technology, Ben-Gurion University andWeizmann Institute of Science. Mr. Propper received a B.S. (summa cum laude) in Chemical Engineering and Food Technology from the Technion-IsraelInstitute of Technology.
Prof. Dafna Schwartz joined Teva’s Board of Directors in December 2011, serving as a statutory independent director. Since 1999, Prof. Schwartzhas been a faculty member at Ben Gurion University, where she is the head of the MBA track in Entrepreneurship and High-Tech Management at theDepartment of Business Administration and the director of the Bengis Center for Entrepreneurship and High-Tech Management, Faculty of Business andManagement. Prof. Schwartz is an economic consultant in Israel and abroad. Prior to joining the University in 1999, she was Director General of theDevelopment Study Center. Prof. Schwartz currently serves as a member of the board of directors of Strauss Group Ltd. and Bank Hapoalim B.M.Previously, she served as a member of the board of directors of Oil Refineries Ltd. from 2007 to 2012, Rotem Industries Ltd. during 2012, Al-Bad MassuotYitzhak Ltd. from 2010 to 2011 and from 1999 to 2004, Israel Discount Bank Ltd. from 2007 to 2010 and from 1995 to 2002, Giron Development andBuilding Ltd. from 2007 to 2010, The Phoenix Insurance Company Ltd. from 2003 to 2008 and others. Prof. Schwartz is a member of the Israel NationalCouncil for Research and Development and of the EU Expert Group on Policy Relevant Research on Entrepreneurship and SME’s. Prof. Schwartz received aB.A. in Economics from Tel Aviv University in 1973, an M.Sc. in Agricultural Economics and Management from the Hebrew University in 1977 and aPh.D. in Economics from the Hebrew University in 1990. Prof. Schwartz qualifies as a statutory independent director under Israeli law and was determinedby the Board of Directors to be a financial and accounting expert under Israeli law and applicable SEC and NYSE regulations.
Ory Slonim rejoined Teva’s Board of Directors in June 2008. Mr. Slonim is an attorney who has been in private practice since 1970. Mr. Slonimpreviously served on Teva’s Board of Directors from 1998 to 2003 as a statutory independent director. Between 1987 and 2007, he was a director at MigdalInsurance Company Ltd., serving as Deputy Chairman from 2000 until 2007 and as Chairman of the company’s audit committee from 2001 until 2007.Between 1993 and 2011, he served as a director and Chairman of the audit committee of U. Dori Group Ltd., between 2007 and 2012 as a director of OilRefineries Ltd and from 2008 until January 2013 as a director of Harel Insurance Investments and Financial Services Ltd. Mr. Slonim has served asChairman of the Variety Club in Israel since 2006 and as Chairman of the Ethics Tribunal of the Israeli Press Council since 1994. Mr. Slonim is also alecturer at Tel Aviv University (Lahav Plan) in Executives and Directors Risks Management Plans since 2005. Mr. Slonim received an LL.B degree from theHebrew University in 1968. Mr. Slonim was determined by the Audit Committee to be an independent director under Israeli law.
Dan S. Suesskind joined Teva’s Board of Directors in January 2010. He was Teva’s Chief Financial Officer from 1977 until 2008. Mr. Suesskindpreviously served as a director of Teva from 1981 to 2001. From 2004 to 2011 he was a director of Ness Technologies Inc. Currently, Mr. Suesskind servesas a director of several
94

Table of Contents
companies, including Israel Corporation Ltd., Migdal Insurance Company Ltd., Gefen Biomed Investments Ltd., Redhill Biopharma Ltd. and SyneronMedical Ltd., as well as a member of the board of directors (and finance and investment committee) of the Jerusalem Foundation, a member of the InvestmentCommittee of the Israel Academy of Science and Humanities and the Board of Trustees of the Hebrew University. Mr. Suesskind is one of the founders and amember of the steering committee of the Israeli Forum of Chief Financial Officers. Mr. Suesskind received a B.A. in economics and political science from theHebrew University in 1965 and an M.B.A. from the University of Massachusetts in 1969. Mr. Suesskind was determined by the Board of Directors to be afinancial and accounting expert under Israeli law and qualifies as such under the applicable SEC and NYSE regulations.
Erez Vigodman joined Teva’s Board of Directors in 2009. Since January 2010, he has been President and Chief Executive Officer of MakhteshimAgan, the world’s leading generic crop protection (agrochemical) company. From 2001 through June 2009, Mr. Vigodman served as President and ChiefExecutive Officer of Strauss Group Ltd. Mr. Vigodman is a member of the Advisory Committee to the Israel National Economic Council and member of theInternational Advisory Board of the Israel Science Technology & Innovation Policy Institute. Mr. Vigodman received a B.A. in accounting and economics fromTel Aviv University in 1987 and is a graduate of the program of Management Development at Harvard Graduate School of Business Administration.Mr. Vigodman is a certified public accountant. Mr. Vigodman was determined by the Board of Directors to be a financial and accounting expert under Israelilaw and applicable SEC and NYSE regulations.
CompensationThe aggregate direct cash compensation paid to or accrued on behalf of all directors (including those directors whose service ended during the year) as a
group during 2012 was $3,178,140. Pursuant to the requirements of the Israeli Companies Law, remuneration of our directors generally requires shareholderapproval. Compensation and reimbursement for statutory independent directors is determined pursuant to the Israeli Companies Law. None of the directorshave agreements with us that provide for benefits upon termination of service.
Effective as of September 12, 2012, our shareholders approved the payment to each of our directors, including our statutory independent directors, butexcluding our Chairman and the Vice Chairman of the Board of Directors, of an annual fee in the NIS equivalent of $190,000 (an increase from the averageannual fee paid in connection with their 2011 service of $76,283) plus a per meeting fee of $2,000 (in lieu of the previous per meeting fees ranging fromapproximately $2,000 to $3,000, depending on whether the meeting required air travel). This remuneration is paid plus value added tax (as applicable) and isadjusted to the Israeli Consumer Price Index. Directors are reimbursed for expenses incurred as part of their service as directors.
Effective as of September 12, 2012, our shareholders approved the payment to Dr. Phillip Frost, our Chairman of the Board of Directors, of an annualfee in the NIS equivalent of $900,000 plus value added tax (as applicable), adjusted to the Israeli Consumer Price Index. Dr. Frost does not receive any permeeting fees. This annual fee represents an increase from the payments made in connection with Dr. Frost’s 2011 service of $516,677 (including per meetingfees). We also reimburse Dr. Frost for his out of pocket transportation costs related to the use of his airplane for the purpose of participation in meetings of theBoard of Directors, committees of the Board and other Teva activities, up to an annual amount of $700,000, for such time as Dr. Frost continues to serve asChairman of the Board of Directors. We provide Dr. Frost with an office and secretarial services and also reimburse him for other reasonable and necessaryexpenses incurred in the course of his service to us.
Effective as of September 12, 2012, our shareholders approved the payment to Prof. Moshe Many, our Vice Chairman of the Board, of an annual fee inthe NIS equivalent of $400,000 plus value added tax (as applicable), adjusted based on the Israeli Consumer Price Index. Prof. Many does not receive any permeeting fees. This annual fee represents an increase from the payments made in connection with Prof. Many’s 2011 service of
9 5

Table of Contents
$313,700 (including per meeting fees). We provide Prof. Many with an office and secretarial services and also reimburse him for other reasonable andnecessary business expenses incurred in the course of his service to us.
The aggregate direct cash compensation paid to or accrued on behalf of current executive officers as a group during 2012 was $12,671,978.
The aggregate direct cash compensation paid to or accrued during 2012 on behalf of the five executive officers whose service ended in 2012 as a groupwas $14,690,831.
We have adopted a number of stock option or stock incentive programs covering either ordinary shares or ADSs including our 2010 Long-Term EquityBased Incentive Plan approved by our shareholders in June 2010.
In 2012, our current executive officers exercised previously granted stock options or restricted share units (RSUs) with a gain of $4,038,298.
In 2012, the five executive officers whose service ended in 2012 exercised previously granted stock options or restricted share units (RSUs) with a gainof $1,785,263.
In 2012, options to purchase an aggregate of 1,302,756 ordinary shares were awarded to current executive officers at a weighted average exercise price of$43.59 per share/ADS and a weighted average grant date fair value of $8.25, with expiration dates in 2022, as well as 260,730 RSUs with a weighted averagegrant date fair value of $41.02.
As of December 31, 2012, options exercisable for an aggregate of approximately 36.6 million shares, with a weighted average exercise price of $44.40 pershare or ADS, and approximately 3.7 million RSUs, with a weighted average grant date fair value of $41.04, were outstanding under our stock option andincentive programs. For further information regarding our options and RSUs, see note 13 to our consolidated financial statements.
In December 2012, an amendment to the Israeli Companies Law (“Amendment 20”) became effective, requiring companies to appoint a compensationcommittee. Teva’s existing human resources and compensation committee meets this requirement, as applicable to Teva. See “—Committees of the Board—Human Resources and Compensation Committee” below.
Amendment 20 also requires that companies adopt a compensation policy by September 11, 2013, which will set forth company policy regarding theterms of office and employment of office holders, including compensation, equity awards, severance and other benefits, exemption from liability andindemnification (“Terms of Office and Employment”). The term “office holder,” as defined in the Israeli Companies Law, includes directors, executiveofficers and any manager directly subordinate to the chief executive officer.
The compensation policy must be approved by the board of directors, after considering the recommendations of the compensation committee. Thecompensation policy must also be approved by a majority of the company’s shareholders, provided that (i) such majority includes at least a majority of theshareholders who are not controlling shareholders and who do not have a personal interest in the matter, present and voting (abstentions are disregarded), or(ii) the non-controlling shareholders and shareholders who do not have a personal interest in the matter who were present and voted against the policy hold twopercent or less of the voting power of the company. The compensation policy must be approved by the board of directors and the shareholders every threeyears. If the compensation policy is not approved by the shareholders, the compensation committee and the board of directors may nonetheless approve thepolicy, following further discussion of the matter and for specified reasons.
Under Amendment 20, the Terms of Office and Employment of office holders require the approval of the compensation committee and the board ofdirectors. The Terms of Office and Employment of directors and the chief executive officer must also be approved by shareholders.
9 6

Table of Contents
Changes to existing Terms of Office and Employment of office holders (other than directors) can be made with the approval of the compensationcommittee only, if the committee determines that the change is not substantially different from the existing terms.
Under certain circumstances, the compensation committee and the board of directors may approve an arrangement that deviates from the compensationpolicy, provided that such arrangement is approved by the special majority of the company’s shareholders mentioned above. Such shareholder approval willalso be required with respect to determining the Terms of Office and Employment of a director or the chief executive officer during the transition period untilthe company adopts a compensation policy. Notwithstanding the foregoing, a company may be exempted from receiving shareholder approval with respect tothe Terms of Office and Employment of a candidate for chief executive officer if such candidate meets certain independence criteria, the terms are in line withthe compensation policy and the compensation committee has determined for specified reasons that shareholder approval would prevent the engagement.
Under the Israeli Companies Law and related regulations, the compensation payable to statutory independent directors and independent directors issubject to certain further limitations. See “—Statutory Independent Directors/Financial Experts” below.
Board PracticesOur Board consists of 16 persons, of whom 12 have been determined to be independent within the meaning of applicable NYSE regulations. The Board
includes two statutory independent directors as mandated under Israeli law, who are subject to additional criteria to help ensure their independence. See“Statutory Independent Directors/Financial Experts” below. The directors’ terms are set forth in the table above. In accordance with NYSE regulations, we donot consider the following directors to be independent: Dr. Phillip Frost, Chaim Hurvitz, Prof. Roger Kornberg and Prof. Yitzhak Peterburg. All directors aregenerally entitled to review and retain copies of our documentation and examine our assets, as required to perform their duties as directors, and to receiveassistance, in special cases, from outside experts at our expense (subject to approval by the Board or by court).
Principles of Corporate Governance. We have adopted a set of corporate governance principles. The full document is available on our website atwww.tevapharm.com.
Annual Meetings. We encourage our directors to attend annual shareholder meetings.
Board Practices and Procedures . Our directors are generally elected in classes for terms of three years. We believe that overlapping multi-year termsallow our directors to acquire and provide us with the benefit of a high level of expertise with respect to our complex business. We provide an orientationprogram and a continuing education process for our directors, which includes business briefings, provision of materials, meetings with key management, andvisits to company facilities.
Board Meetings. At least six meetings of the Board are held throughout the year, with additional meetings scheduled when required. Informationregarding the number of meetings of the Board and Board committees and attendance rates for 2012 is presented in the table below.
Executive Sessions of the Board . Currently, none of our directors are members of management, but selected members of management are typicallyinvited by the Board to attend regularly scheduled Board meetings (or portions thereof). Our directors meet in executive session (i.e., without the presence ofmanagement) generally after each regularly scheduled meeting of the Board and as needed. In addition, our independent directors meet separately in executivesession at least once per year and as needed.
Director Service Contracts . We do not have any contracts with any of our non-employee directors that provide for benefits upon termination ofservices.
97

Table of Contents
Communications with the Board . Shareholders, employees and other interested parties can contact any director or committee of the Board by writingto them care of Teva Pharmaceutical Industries Ltd., 5 Basel Street, Petach Tikva, Israel, Attn: Corporate Secretary or Internal Auditor. Comments orcomplaints relating to Teva’s accounting, internal controls or auditing matters will also be referred to members of the audit committee as well as otherappropriate Teva bodies. The Board has adopted a global “whistleblower” policy, which provides employees and others with an anonymous means ofcommunicating with the audit committee.
Nominees for Directors. In accordance with the Israeli Companies Law, a nominee for service as a director must submit a declaration to Teva, prior tohis or her election, specifying that he or she has the requisite qualifications to serve as a director and the ability to devote the appropriate time to performing hisor her duties as such.
Statutory Independent Directors/Financial ExpertsUnder Israeli law, publicly held Israeli companies such as Teva are required to appoint at least two statutory independent directors, who must also serve
on the audit and compensation committees. All other Board committees exercising powers delegated by the Board must include at least one such statutoryindependent director. Statutory independent directors are appointed at the general meeting of shareholders and must meet certain non-affiliation criteria, all asprovided under Israeli law. A statutory independent director is appointed for an initial term of three consecutive years, and may be reappointed for additionalthree-year terms, subject to certain conditions (including approval by our shareholders at a general meeting) as provided under the Israeli Companies Law andthe regulations promulgated thereunder. Prof. Dafna Schwartz and Joseph Nitzani currently serve in this capacity. In addition, under the Israeli CompaniesLaw and regulations promulgated thereunder, a director in a company such as Teva, who qualifies as an independent director under the relevant non-Israelirules relating to independence standards could be considered an independent director pursuant to the Israeli Companies Law if such director meets certainconditions listed therein, provided such director has been designated as such by the audit committee. The Audit Committee has designated Mr. Ory Slonim asTeva’s designated independent director under Israeli law.
Regulations promulgated under the Israeli Companies Law set minimum and maximum amounts and other rules regarding compensation that may bepaid to statutory independent directors and the designated independent director. These regulations further provide that the remuneration of these independentdirectors may be determined relative to that of other directors of the company, as is the case with Teva’s statutory independent directors and designatedindependent directors.
Israeli law further requires that a statutory independent director have either financial and accounting expertise or professional competence, as determinedby the company’s board of directors. Under relevant regulations, a director having financial and accounting expertise is a person who, due to his or hereducation, experience and talents, is highly skilled in respect of, and understands, business and accounting matters and financial reports, in a manner thatenables him or her to have an in-depth understanding of the company’s financial information and to stimulate discussion in respect of the manner in which thefinancial data are presented. Under the regulations, a director having professional competence is a person who meets any of the following criteria: (i) has anacademic degree in either economics, business administration, accounting, law or public administration; (ii) has a different academic degree or has completedhigher education in an area relevant to the company’s business or in an area relevant to his or her position; or (iii) has at least five years experience in any ofthe following, or has a total of five years experience in at least two of the following: (a) a senior position in the business management of a corporation with asubstantial scope of business, (b) a senior public position or a senior position in public service, or (c) a senior position in the main field of the company’sbusiness.
Under Israeli law, at least one of the statutory independent directors is required to qualify as a financial and accounting expert, as determined by theboard of directors. Teva has adopted a policy requiring that at least two directors qualify as, and be determined, financial and accounting experts, in additionto the statutory independent
98

Table of Contents
director holding such expertise. In accordance with Israeli law and this policy, the Board has determined that Galia Maor, Joseph Nitzani, Prof. DafnaSchwartz, Dan S. Suesskind and Erez Vigodman are financial and accounting experts under Israeli law.
Committees of the BoardOur Articles of Association provide that the Board may delegate its powers to one or more committees of the Board as it deems appropriate to the extent
such delegation is permitted under the Israeli Companies Law. Each committee exercising powers delegated by the Board must include at least one statutoryindependent director, and the audit and compensation committees must include all statutory independent directors. The Board has appointed the standingcommittees listed below, as well as committees appointed from time to time for specific purposes determined by the Board. Membership on these Boardcommittees is presented in the table below.
We have adopted charters to all of our committees, other than the scientific advisory committee, formalizing the committees’ procedures and duties.These committee charters are available on our website at www.tevapharm.com.
Audit CommitteeThe Israeli Companies Law mandates the appointment of an audit committee comprising at least three directors. Under the Israeli Companies Law, the
audit committee must include all of the statutory independent directors, one of which shall serve as the chairman of the committee, must be comprised of amajority of directors meeting certain independence criteria and may not include certain directors. As a NYSE-listed company, Teva’s audit committee must becomprised solely of independent directors, as defined by the SEC and NYSE regulations.
Under the Israeli Companies Law, the audit committee is responsible for: (a) identifying flaws in the management of a company’s business and makingrecommendations to the board of directors as to how to correct them; (b) making determinations and considering providing approvals concerning certainrelated party transactions and actions involving conflicts of interest; (c) reviewing the internal auditor’s work program; (d) examining the company’s internalcontrol structure and processes, the performance of the internal auditor and whether the internal auditor has the tools and resources required to perform his orher duties; (e) examining the independent auditor’s scope of work as well as the independent auditor’s fees and providing the corporate body responsible fordetermining the independent auditor’s fees with its recommendations; and (f) implementing procedures concerning employee complaints on deficiencies in theadministration of the company’s business and the protection to be provided to such employees.
Furthermore, the audit committee discusses the financial statements and presents to the Board its recommendations with respect to the proposedfinancial statements.
In accordance with the Sarbanes-Oxley Act and NYSE requirements, the audit committee is directly responsible for the appointment, compensation andoversight of the work of our independent auditors. In addition, the audit committee is responsible for assisting the Board in monitoring our financialstatements, the effectiveness of our internal controls and our compliance with legal and regulatory requirements. The audit committee also discusses Tevapolicies with respect to risk assessment and risk management, including any off-balance sheet arrangements, and reviews contingent liabilities and risks thatmay be material to Teva and major legislative and regulatory developments that could materially impact Teva’s contingent liabilities and risks.
The audit committee charter sets forth the scope of the committee’s responsibilities, including its structure, processes and membership requirements; thecommittee’s purpose; and its specific responsibilities and authority
9 9

Table of Contents
with respect to registered public accounting firms, complaints relating to accounting, internal accounting controls or auditing matters, and its authority toengage advisors as determined by the audit committee.
All of the audit committee members have been determined to be independent as defined by the applicable NYSE and SEC rules and Ory Slonim hasbeen designated by the audit committee as an independent director under the Israeli Companies Law.
The Board has determined that Prof. Dafna Schwartz, Joseph Nitzani and Erez Vigodman are “audit committee financial experts” as defined byapplicable SEC regulations. See “Item 16A—Audit Committee Financial Expert” below.
Human Resources and Compensation CommitteeThe Israeli Companies Law mandates the appointment of a compensation committee comprising at least three directors. Under the Israeli Companies
Law, the compensation committee must include all of the statutory independent directors, one of which must serve as the chairman of the committee, and thecommittee must include only additional members that satisfy the criteria for remuneration applicable to the statutory independent directors. Teva’s humanresources and compensation committee includes only independent directors, as defined by the SEC and NYSE regulations.
Under the Israeli Companies Law, the compensation committee is responsible for: (i) making recommendations to the board of directors with respect tothe approval of the Compensation Policy and any extensions thereto; (ii) periodically reviewing the implementation of the Compensation Policy and providingthe board of directors with recommendations with respect to any amendments or updates thereto; (iii) reviewing and resolving whether or not to approvearrangements with respect to the Terms of Office and Employment of office holders; and (iv) determining whether or not to exempt a transaction with acandidate for chief executive officer from shareholder approval.
Furthermore, Teva’s human resources and compensation committee oversees, on behalf of the Board, the management of Teva’s compensation and otherhuman resources-related issues and otherwise carries out on behalf of the Board its responsibilities relating to these issues. The committee is responsible forestablishing annual and long-term performance goals and objectives for Teva’s executive officers, as well as reviewing Teva’s overall compensation philosophyand policies and the implementation thereof, including with respect to executive officers and directors. In addition, the human resources and compensationcommittee reviews and approves any arrangement as to the terms of service and/or employment of executive officers or directors.
Corporate Governance and Nominating CommitteeThe role of the corporate governance and nominating committee is to (i) identify individuals who are qualified to become directors; (ii) recommend to the
Board director nominees for each annual meeting of shareholders; and (iii) assist the Board in establishing and reviewing corporate governance principles andpromoting good corporate governance at Teva.
All of the committee members must be determined to be independent as defined by the applicable NYSE rules and those of the SEC.
Corporate Responsibility CommitteeThe role of the corporate responsibility committee is to oversee, on behalf of the Board Teva’s; (i) commitment to being a responsible corporate citizen,
(ii) policies and practices for complying with laws, regulations and internal procedures; (iii) policies and practices regarding issues that have the potential toseriously impact Teva’s business and reputation; (iv) global public policy positions; and (v) community outreach.
A majority of committee members must be determined to be independent as defined by the applicable NYSE rules and those of the SEC. TheChairperson of the audit committee must serve as a member of the committee.
100

Table of Contents
Finance and Investment CommitteeThe role of the finance and investment committee is to assist the Board in fulfilling its responsibilities with respect to Teva’s financial and investment
strategies and policies, including determining policies and guidelines on these matters and monitoring implementation. It is also authorized to approve certainfinancial transactions and review risk factors associated with management of Teva’s finances and the mitigation of such risks as well as various otherfinance-related matters. At least one of the committee’s members must be qualified as a financial and accounting expert under applicable SEC regulation and/orthe Israeli Companies Law.
Scientific Advisory CommitteeThe scientific advisory committee is primarily engaged in the review of Teva’s strategies with regard to its research and development activities, major
research and development projects and sourcing opportunities from academic institutions and other parties, and brings its recommendations, when applicable,to the Board.
Current Members of Board Committees
Name Audit Human Resourcesand Compensation
CorporateGovernance and
Nominating
Financeand
Investment
CorporateResponsibility
Committee ScientificAdvisory
Dr. P. Frost ü * Prof. M. Many ü ü ü + R. Abravanel ü A. Elstein ü ü ü * C. Hurvitz ü ü + Prof. R. Kornberg ü ü Prof. R. Lerner ü ü ü Galia Maor ü * J. Nitzani ü * ü + ü ü ü Prof. Y. Peterburg ü ü Dan Propper ü ü Prof. D. Schwartz ü + ü * ü O. Slonim ü ü ü * ü D. S. Suesskind ü ü E. Vigodman ü ü +
Key: “ü” Member; “*” Chairperson; “+” Vice Chairperson
Board and Committee Meetings
Name of Body No. of Meetings in 2012
AverageAttendance
Rate Board of directors 13 91% Audit committee 14 91% Human resources and compensation committee 10 92% Corporate governance and nominating committee 4 85% Finance committee 6 98% Community affairs committee 2 93% Scientific advisory committee 1 67%
101

Table of Contents
EmployeesAs of December 31, 2012, we employed 45,948 full-time-equivalent employees. In certain countries, we are party to collective bargaining agreements
with certain groups of employees. We consider our labor relations with our employees around the world to be good.
December 31, Geographic Area 2012 2011 2010 Europe (West & East) 19,749 20,019 17,098 North America 9,483 9,543 8,393 Israel 7,397 7,110 6,774 Latin America 4,374 4,513 5,536 Asia 4,893 4,549 1,849 Other countries 52 20 10 Total 45,948 45,754 39,660
Share OwnershipAs of December 31, 2012, our directors and executive officers as a group beneficially held 22,795,166 ordinary shares (representing approximately
2.42% of the outstanding shares as of such date). These figures include options to purchase ordinary shares that were vested on such date or that werescheduled to vest within the following 60 days. These figures also include 14,587,204 shares beneficially owned by Dr. Phillip Frost, representingapproximately 1.54% of the outstanding shares. Dr. Frost is the only director or officer who held 1% or more of our outstanding shares as of December 31,2012.
For information regarding equity awards granted to our executive officers, see “—Compensation” above and, with respect to our stock-basedcompensation plans in general, see note 13 to our consolidated financial statements.
102

Table of Contents
ITEM 7: MAJOR SHAREHOLDERS AND RELATED PARTY TRANSACTIONS
Major ShareholdersAccording to a notification received on February 5, 2013, Wellington Management Company, LLP beneficially owned 58,091,146 Teva shares as of
such date, representing approximately 6.1% of Teva’s outstanding shares. To the best knowledge of Teva, as of February 5, 2013, no other shareholderbeneficially owned 5% or more of Teva’s ordinary shares. All holders of Teva ordinary shares have one vote per share.
As of December 31, 2012, there were approximately 3,215 record holders of ADSs, whose holdings represented approximately 74% of the totaloutstanding ordinary shares. Substantially all of the record holders are residents of or domiciled in the U.S.
Related Party TransactionsIn December 2012, Teva entered into a collaborative development and exclusive worldwide license agreement with Xenon for its compound XEN402.
XEN402 targets sodium channels found in sensory nerve endings that can increase in chronic painful conditions, and is currently in Phase II clinicaldevelopment for a variety of pain-related disorders. Under the agreement, Teva paid Xenon an upfront fee of $41 million. In addition, Teva may be required topay development, regulatory and sales-based milestones of up to $335 million. Xenon is also entitled to royalties on sales and has an option to participate incommercialization in the United States. Dr. Michael Hayden, Teva’s President of Global R&D and Chief Scientific Officer, is the founder, a shareholder anda member of the board of directors of Xenon.
In September 2011, Teva entered into an agreement with CoCrystal Discovery, Inc., a company focusing on the discovery and development of noveltherapeutics, utilizing an innovative drug discovery technology. According to the agreement, Teva will fund the company’s R&D under the Research Agreementby investing into the company two tranches of $7.5 million each per target (the latter one being discretionary). The first tranche was invested by Teva in 2011.Dr. Phillip Frost, Teva’s Chairman of the Board, and Prof. Roger Kornberg, a member of the board, are both investors in and members of the board ofdirectors of CoCrystal Discovery. Prof. Kornberg is also Chief Scientific Officer of CoCrystal Discovery.
CTG Weld Limited, a privately owned contract research organization, has rendered services to Teva in connection with clinical trials since 2002. In2011, Chaim Hurvitz, a director of Teva, acquired a personal interest in, and became a member of the board of directors of, CTG Weld. In 2011, Tevaengaged CTG Weld in connection with certain clinical studies, for overall payments of €2.1 million. In 2012, Teva paid CTG Weld €1.3 million in connectionwith various clinical studies.
Teva leases 13,500 square feet of office space located in Miami, Florida from an entity controlled by Dr. Frost, Teva’s Chairman of the Board. The termof the lease extends until April 2015, with options to renew for two additional three-year terms. Annual rent was $305,000 until April 1, 2012 and is $412,000since April 1, 2012 to March 31, 2013, increasing 4% per year for the remainder of the initial term and each renewal term.
All of the related party transactions described above were approved in accordance with the process described in “Item 10—Conflicts of Interest—Approval of Related Party Transactions.”
103

Table of Contents
ITEM 8: FINANCIAL INFORMATIONConsolidated Statements and Other Financial Information
See “Item 18—Financial Statements.”
Legal ProceedingsTeva is subject to various litigation and other legal proceedings. For a discussion of these matters, see “Contingent Liabilities” included in note 12 to our
consolidated financial statements.
Dividend PolicySee “Item 3—Key Information—Selected Financial Data—Dividends.”
Significant ChangesNo significant changes have occurred since December 31, 2012, except as otherwise disclosed in this annual report and in our consolidated financial
statements.
104

Table of Contents
ITEM 9: THE OFFER AND LISTING
ADSsTeva’s American Depositary Shares (“ADSs”), which have been traded in the United States since 1982, were admitted to trade on the Nasdaq National
Market in October 1987 and subsequently traded on the Nasdaq Global Select Market. On May 30, 2012 Teva transferred the listing of its ADSs to the NewYork Stock Exchange (the “NYSE”). The ADSs are quoted under the symbol “TEVA.” J.P. Morgan Chase Bank serves as depositary for the shares. As ofDecember 31, 2012, Teva had 696,251,654 ADSs outstanding. Each ADS represents one ordinary share.
The following table sets forth, for the periods indicated, the high and low intraday prices of our ADSs on NASDAQ (until May 29, 2012) and on theNYSE (since May 30, 2012), in U.S. dollars.
Period High Low Last seven months: February 2013 (until February 7) 38.30 37.40 January 2013 38.97 36.97 December 2012 42.83 36.63 November 2012 41.98 38.05 October 2012 41.81 39.30 September 2012 41.74 39.28 August 2012 41.37 39.16
Last nine quarters: Q1 2013 (until February 7) 38.97 36.97 Q4 2012 42.83 36.63 Q3 2012 42.52 38.92 Q2 2012 46.38 37.40 Q1 2012 46.65 41.83 Q4 2011 43.12 35.16 Q3 2011 49.72 35.00 Q2 2011 51.30 44.86 Q1 2011 57.08 47.30
Last five years: 2012 46.65 36.63 2011 57.08 35.00 2010 64.95 46.99 2009 56.88 41.05 2008 50.00 35.89
On February 7, 2013, the last reported sale price for our ADSs on the NYSE was $37.96 per ADS. The Chicago Board Options Exchange, ChicagoBoard Options Exchange C2, International Securities Exchange, NASDAQ, NASDAQ OMX Boston, Boston Options Exchange, MIAX Options Exchange,NASDAQ OMX Philadelphia, BATS, NYSE Amex and NYSE Arca quote options on our ADSs under the symbol “TEVA”.
Teva’s ADSs are also traded on various stock exchanges in Germany.
Ordinary SharesTeva’s ordinary shares have been listed on the Tel Aviv Stock Exchange (TASE) since 1951. As of December 31, 2012, Teva had 943,619,967
ordinary shares outstanding, including ordinary shares underlying outstanding ADSs.
105

Table of Contents
The following table sets forth, for the periods indicated, the high and low intraday sale prices of our ordinary shares on the TASE, in NIS and U.S.dollars. The translation into dollars is based on the daily representative rate of exchange published by the Bank of Israel.
Period High Low NIS US$ NIS US$ Last seven months: February 2013 (through February 7) 141.00 38.18 136.60 36.99 January 2013 145.50 38.48 137.70 36.96 December 2012 163.70 42.66 137.10 36.70 November 2012 163.40 41.90 152.00 38.23 October 2012 162.60 41.46 150.10 39.13 September 2012 161.60 40.64 154.70 39.70 August 2012 165.80 40.87 155.30 38.95
Last nine quarters: Q1 2013 (through February 7) 145.50 38.48 136.60 36.99 Q4 2012 163.70 42.66 137.10 36.70 Q3 2012 169.00 42.45 152.90 39.08 Q2 2012 174.30 46.05 145.20 37.58 Q1 2012 173.90 45.91 155.20 40.63 Q4 2011 163.60 43.04 132.50 35.21 Q3 2011 170.80 49.84 129.80 34.99 Q2 2011 178.50 51.43 155.20 45.44 Q1 2011 205.90 55.70 168.70 47.66
Last five years: 2012 174.30 46.05 137.10 36.70 2011 205.90 55.70 129.80 34.99 2010 242.70 64.95 176.90 48.82 2009 215.20 56.55 160.30 42.40 2008 188.80 49.56 136.00 40.22
On February 7, 2013, the last reported sale price of our ordinary shares on the TASE was NIS 138.00 per share. The TASE also quotes options on ourordinary shares.
106

Table of Contents
ITEM 10: ADDITIONAL INFORMATION
Memorandum and Articles of AssociationSet forth below is a summary of certain provisions of Teva’s Memorandum of Association (the “Memorandum”) and Articles of Association (the
“Articles”) and the Israeli Companies Law. This description does not purport to be complete and is qualified in its entirety by reference to the full textof the Memorandum and Articles, which are filed as exhibits to this report and incorporated by reference herein, and by Israeli law.
RegisterTeva’s registration number at the Israeli registrar of companies is 52-001395-4.
Objectives and PurposesOur Articles and Memorandum provide that our purpose is to engage in any lawful endeavor, including, without limitation, to carry on the business of
chemists, drugs, manufacturer of, and dealership in pharmaceuticals.
Board of DirectorsTeva’s board of directors consists of three classes of directors (not including the two statutory independent directors, who do not form part of any
class), with one class being elected each year by the shareholders at Teva’s annual meeting for a term of approximately three years. Directors so elected cannotbe removed from office until the expiration of their term of office, except for cause.
Pursuant to the Israeli Companies Law, Teva is required to appoint at least two statutory independent directors. Such appointment is for an initial termof three years.
The holders of Teva’s ordinary shares representing a majority of the voting power represented at a shareholders’ meeting and voting at the meeting havethe power to elect all of the directors up for election, provided that statutory independent directors must also receive the approval of a certain majority of thevotes of the shareholders who are not controlling shareholders and do not have a personal interest in the matter (other than a personal interest which is not theresult of an affiliation with a controlling shareholder).
In general, the Board must formulate company policy and supervise the performance of the duties and operations of the chief executive officer. Subject tothe provisions of the Israeli Companies Law and the Articles, any Teva power which has not been conferred upon another body may be exercised by theBoard.
Neither Teva’s Memorandum or Articles, nor Israeli law, mandate retirement or non-retirement of directors at a certain age, or share ownership for adirector’s qualification.
Conflicts of InterestApproval of Related Party Transactions
The Israeli Companies Law requires that an “office holder” (as defined in the Israeli Companies Law) of a company promptly disclose any personalinterest that he or she may have and all related material information known to him or her, in connection with any existing or proposed transaction of thecompany.
Pursuant to the Israeli Companies Law, any transaction with an office holder or in which the office holder has a personal interest must be brought beforethe audit committee, in order to determine whether such transaction is an “extraordinary transaction” (defined as a transaction not in the ordinary course ofbusiness, not on market terms or likely to have a material impact on the company’s profitability, assets or liabilities).
107

Table of Contents
Pursuant to the Articles and Teva policy, in the event the audit committee determines that the transaction is not an extraordinary transaction, thetransaction will require only audit committee approval; if, however, it is determined to be an extraordinary transaction, the approval of the Board is alsorequired. Such a transaction may only be approved if it is determined to be not adverse to Teva.
A person with a personal interest in the matter generally may not be present at the Board or certain committees where the matter is being considered and,if a member of the Board or a committee, may not vote on the matter.
Approval of Director and Executive Officer CompensationThe Terms of Office and Employment of office holders other than the chief executive officer and directors, require the approval of both Teva’s human
resources and compensation committee and the Board. The Terms of Office and Employment of the chief executive officer and the directors require theapproval of the human resources and compensation committee, the Board and shareholders. (See “Item 6—Directors, Senior Management and Employees;Compensation”).
Transactions with Controlling Shareholders
Extraordinary transactions and Terms of Office and Employment as an office holder or other employee with a controlling shareholder or in which acontrolling shareholder has a personal interest generally require the approval of the audit committee (or with respect to Terms of Office and Employment, thehuman resources and compensation committee), the board of directors and the shareholders. If required, shareholder approval must include at least a majorityof the shareholders who do not have a personal interest in the transaction and are present and voting at the meeting (abstentions are disregarded), or that thetotal shareholdings of the disinterested shareholders who vote against the transaction must not represent more than two percent of the voting rights in thecompany. Transactions for a period of more than three years generally need to be brought for approval in accordance with the above procedures every threeyears.
A shareholder that holds 25% or more of the voting rights in a company is considered a controlling shareholder for these purposes if no othershareholder holds more than 50% of the voting rights. If two or more shareholders are interested parties in the same transaction, their shareholdings arecombined for the purposes of calculating percentages.
Insurance, Exemption and Indemnification of Directors and Executive OfficersTeva indemnifies its directors and executive officers , and has resolved to exempt such directors and executive officers from any liability for damages
caused as a result of a breach of their duty of care to Teva, to the fullest extent permitted by law, pursuant to the terms set forth in Teva’s indemnification andrelease agreements which were approved in our 2012 annual general meeting of shareholders. Teva’s directors and executive officers are covered by a directors’and officers’ liability insurance policy.
The Israeli Companies Law provides that a company may not exempt or indemnify a director or an executive officer, or enter into an insurance contract,which would provide coverage for any liability incurred as a result of any of the following: (i) a breach by the director and/or executive officer of his or herduty of loyalty unless, with respect to insurance coverage or indemnification, due to a breach of his or her duty of loyalty to the company committed in goodfaith and with reasonable grounds to believe that such act would not prejudice the interests of the company; (ii) a breach by the director and/or the executiveofficer of his duty of care to the company committed intentionally or recklessly (other than if solely done in negligence); (iii) any act or omission done with theintent of unlawfully realizing personal gain; or (iv) a fine, monetary sanction, forfeit or penalty imposed upon a director and/or executive officer. In addition,the Israeli Companies Law provides that directors
108

Table of Contents
and executive officers can only be exempted in advance with respect to liability for damages caused as a result of a breach of their duty of care to the company(but not for such breaches committed intentionally or recklessly, as noted above, or in connection with a distribution (as defined in the Companies Law)).
CEO and Center of ManagementUnder Teva’s Articles, Teva’s chief executive officer as well as the majority of the members of the Board are required to be residents of Israel, unless
Teva’s center of management shall have been transferred to another country in accordance with the Articles. The Articles require that Teva’s center ofmanagement be in Israel, unless the Board otherwise resolves, with a supermajority of three-quarters of the participating votes.
DividendsDividends may be distributed only out of profits available for dividends, provided that there is no reasonable concern that the distribution will prevent
Teva from being able to meet its existing and anticipated obligations when they become due. In accordance with the Israeli Companies Law and the Articles asamended at the 2012 annual meeting of shareholders, the decision to distribute dividends and the amount to be distributed is made by the board of directors.Interim dividends declared by Teva’s Board prior to such 2012 amendment to the Articles will require shareholder approval.
Description of Teva SharesThe par value of Teva’s ordinary shares is NIS 0.10 per share, and all issued and outstanding ordinary shares are fully paid and non-assessable.
Holders of ordinary shares are entitled to participate equally in the payment of dividends and other distributions and, in the event of liquidation, in alldistributions after the discharge of liabilities to creditors. All ordinary shares represented by the ADSs will be issued in registered form only. Ordinary sharesdo not entitle their holders to preemptive rights. Voting is on the basis of one vote per share.
Neither the Memorandum, nor the Articles or the laws of the State of Israel restrict the ownership or voting of Teva’s ordinary shares by nonresidents orpersons who are not citizens of Israel, except with respect to citizens or residents of countries that are in a state of war with Israel.
Meetings of ShareholdersUnder the Israeli Companies Law and the Articles, Teva is required to hold an annual meeting every year no later than 15 months after the previous
annual meeting. In addition, the Board is required to hold a special meeting:
(i) upon the demand of two directors or one-quarter of the serving directors;
(ii) upon the demand of one or more shareholders holding not less than 5% of Teva’s issued share capital and 1% or more of its voting rights; and
(iii) upon the demand of one or more shareholders holding at least 5% of Teva’s voting rights;
provided that a demand by a shareholder for a shareholder meeting must set forth the items to be considered at that meeting and comply with all otherrequirements of the Articles and applicable law.
Pursuant to the Articles, such requirements include, among others:
(i) the number of shares held by the demanding shareholder, directly or indirectly, and, if any of such shares are held indirectly, an explanation of
how they are held and by whom;
(ii) if such demanding shareholder is not the holder of record of any such shares, a written statement from the holder of record or authorized bank,
broker, depository or other nominee, as the case may be, indicating the number of shares the demanding shareholder is entitled to vote;
109

Table of Contents
(iii) the demanding shareholder’s purpose in making the request;
(iv) any agreements, arrangements, understandings or relationships between the demanding shareholder and any other person with respect to any
securities of Teva or the subject matter of the request;
(v) the complete text of the resolution that the demanding shareholder proposes to be voted upon; and
(vi) if the demanding shareholder wishes to include a statement in support of his or her proposal in Teva’s proxy statement, if provided or published,
a copy of such statement.
If the board of directors receives a demand to convene a special meeting, it must announce the scheduling of the meeting within 21 days after the demandwas delivered.
The agenda at a general meeting is determined by the Board. The agenda must also include proposals for which the convening of a special meeting wasdemanded, as well as any proposal requested by one or more shareholders who hold at least 1% of the voting rights of Teva, provided that all such demandsmust comply with the requirements of the Articles, the Israeli Companies Law and any other applicable law. Pursuant to the Articles, these requirementsinclude requirements similar to those mentioned above with respect to a demand by a shareholder for a shareholders meeting.
Pursuant to the Israeli Companies Law and regulations thereunder, shareholder meetings generally require prior notice of not less than 21 days. Pursuantto the Articles, Teva is not required to deliver personal notices of a general meeting or of any adjournment thereof to any shareholder. However, Teva willpublish its decision to convene a general meeting in a manner reasonably determined by Teva, including by publishing a notice in one or more dailynewspapers in Israel or in one or more international wire services, and such notice will be deemed to have been duly given on the date of such publication. Theshareholders entitled to participate and vote at the meeting are the shareholders as of the record date set forth in the decision to convene the meeting. Israeliregulations further require public companies to send voting cards and position papers to their shareholders if certain issues, as provided by the IsraeliCompanies Law, are included in the agenda of such meeting.
The quorum required for a meeting of shareholders consists of at least two shareholders present in person or by proxy or represented by an authorizedrepresentative, who jointly hold 25% or more of Teva’s paid-up share capital. A meeting adjourned for lack of a quorum generally is adjourned to the sameday in the following week at the same time and place or at another date, time and place as shall be set forth by the Board in a notice to all persons who areentitled to receive notice of general meetings. At such reconvened meeting the required quorum consists of any two shareholders present, in person or by proxy,who jointly hold 20% or more of Teva’s paid-up share capital.
A shareholder who intends to vote at a meeting must demonstrate that he, she or it owns the shares in accordance with the Israeli Companies Law andthe regulations thereunder. Under these regulations, a shareholder whose shares are registered with a member of the Tel Aviv Stock Exchange must provideTeva with an authorization from such member regarding his ownership as of the record date.
The Israeli Companies Law provides that resolutions on certain matters, such as amending a company’s articles of association, assuming the authorityof the board of directors in certain circumstances, appointing auditors, appointing statutory independent directors, approving certain transactions, increasingor decreasing the registered share capital and approving most mergers must be made by the shareholders at a general meeting. A company may determine in itsarticles of association certain additional matters in respect of which resolutions by the shareholders at a general meeting will be required.
Generally, under the Articles, shareholder resolutions (for example, resolutions for the appointment of auditors) are deemed adopted if approved by theholders of a simple majority of the voting rights represented at a general meeting in person or by proxy and voting, unless a different majority is required bylaw or pursuant to
110

Table of Contents
the Articles. Pursuant to the Israeli Companies Law (and a predecessor statute) and the Articles, certain resolutions (for example, resolutions amending many ofthe provisions of the Articles) require the affirmative vote of at least 75% of the shares voting in person or by proxy, and certain amendments of the Articlesrequire the affirmative vote of at least 85% of the shares voting in person or by proxy, unless a lower percentage shall have been established by the Board by amajority of three-quarters of those directors voting at a meeting of the Board which shall have taken place prior to that general meeting.
Change of ControlSubject to certain exceptions, the Israeli Companies Law provides that a merger requires approval both by the board of directors and by the shareholders
of each of the merging companies. Similarly, unless an Israeli court determines otherwise, a merger will not be approved if it is objected to by shareholdersholding a majority of the voting rights participating and voting at the meeting (abstentions are disregarded), after excluding the shares held by the other party tothe merger, by any person who holds 25% or more of the other party to the merger or by anyone on their behalf, including the relatives of or corporationscontrolled by these persons.
In approving a merger, the board of directors of both merging companies must determine that there is no reasonable concern that, as a result of themerger, the surviving company will not be able to satisfy its obligations to its creditors. Similarly, upon the request of a creditor of either party to the proposedmerger, an Israeli court may prevent or delay the merger if it concludes that there exists a reasonable concern that, as a result of the merger, the survivingcompany will not be able to satisfy the obligations of the merging parties. A court may also issue other instructions for the protection of the creditors’ rights inconnection with a merger. Further, a merger may not be completed unless at least (i) 50 days have passed from the time that the requisite proposals for theapproval of the merger were filed with the Israeli registrar of companies and (ii) 30 days have passed since the merger was approved by the shareholders ofeach party.
Under the Israeli Companies Law, subject to certain exceptions, an acquisition of shares in a public company must be made by means of a tender offerif, as a result of the acquisition, the purchaser would hold (i) 25% or more of the voting rights in the company if there is no other holder of 25% or more of thecompany’s voting rights, or (ii) more than 45% of the company’s voting rights if there is no other holder of more than 45% of the company’s voting rights.This rule does not apply to a purchase of shares in a “private placement” by the company that receives shareholder approval. The board of directors mustprovide the shareholders with its opinion as to the advisability of the purchase offer, or if it is unable to do so, may refrain from providing such opinion,provided that it reports the reasons for not so doing. The board of directors must also disclose any personal interest of any of its members in the proposedacquisition. The tender offer may be consummated only if (i) at least 5% of the company’s voting rights will be acquired and (ii) the majority of the offereeswho responded to the offer, accepted the offer, excluding offerees who are controlling shareholders of the offerer, offerees who hold 25% or more of the votingrights in the company or who have a personal interest in accepting the tender offer or anyone on their behalf or on behalf of the offerer including the relatives ofor corporations controlled by these persons.
Exchange ControlsNon-residents of Israel who purchase ADSs with U.S. dollars or other non-Israeli currency will be able to receive dividends, if any, and any amounts
payable upon the dissolution, liquidation or winding up of the affairs of Teva, in U.S. dollars at the rate of exchange prevailing at the time of conversion.Dividends to non-Israeli residents are subject to withholding. See “Israeli Taxation-Withholding Taxes on Dividends Distributed by Teva to Non-IsraeliResidents” below.
Our ADSs may be freely held and traded pursuant to applicable Israeli law. The ownership or voting of ADSs by non-residents of Israel, except withrespect to citizens of countries that are in a state of war with Israel, are not restricted in any way by our Memorandum or Articles or by the laws of the State ofIsrael.
111

Table of Contents
Taxation
U.S. Federal Income Tax ConsiderationsThe following is a summary of material U.S. federal income tax consequences to U.S. Holders of ADSs who hold such securities as capital assets. For
purposes of this summary, a “U.S. Holder” means a beneficial owner of an ADS that is for U.S. federal income tax purposes:
• a citizen or resident of the United States;
• a corporation (or another entity taxable as a corporation for U.S. federal income tax purposes) created or organized in the United States or under the
laws of the United States or any political subdivision thereof;
• an estate, the income of which is subject to U.S. federal income tax regardless of its source; or
• a trust, if a U.S. court is able to exercise primary supervision over the administration of the trust and one or more U.S. persons have the authority
to control all substantial decisions of the trust, or if the trust was in existence on August 20, 1996 and has elected to continue to be treated as aU.S. person.
If an entity that is classified as a partnership for U.S. federal tax purposes holds ADSs, the U.S. federal income tax treatment of its partners willgenerally depend upon the status of the partners and the activities of the partnership. Entities that are classified as partnerships for U.S. federal tax purposesand persons holding ADSs through such entities should consult their own tax advisors.
This summary is based on the U.S. Internal Revenue Code of 1986, as amended (the “Code”), existing final, temporary and proposed regulationsthereunder, judicial decisions and published positions of the Internal Revenue Service, and the treaty between the U.S. and Israel relating to income taxes, allas of the date of this annual report and all of which are subject to change (including changes in interpretation), possibly with retroactive effect. It is also basedin part on representations by the depositary and assumes that each obligation under the deposit agreement and any related agreement will be performed inaccordance with its terms.
This summary does not purport to be a complete analysis of all potential tax consequences of owning ADSs. In particular, this discussion does not takeinto account the specific circumstances of any particular investor (such as tax-exempt entities, certain insurance companies, broker-dealers, investors subjectto the alternative minimum tax, investors that actually or constructively own 10% or more of Teva’s voting securities, investors that hold ordinary shares orADSs as part of a straddle or hedging or conversion transaction, traders in securities that elect to mark to market, banks or other financial institutions,partnerships or other entities classified as partnerships for U.S. federal income tax purposes or investors whose functional currency is not the U.S. dollar),some or all of which may be subject to special rules. Investors are advised to consult their own tax advisors with respect to the tax consequences of theownership of ADSs, including the consequences under applicable state and local law and federal estate tax law, and the application of foreign laws or the effectof nonresident status on U.S. taxation.
U.S. Holders of ADSs will be treated as owners of the ordinary shares underlying their ADSs. Accordingly, deposits and withdrawals of ordinaryshares in exchange for ADSs will not be taxable events for U.S. federal income tax purposes.
The U.S. Treasury has expressed concerns that parties to whom ADSs are released may be taking actions that are inconsistent with the claiming offoreign tax credits for U.S. Holders of ADSs. Such actions would also be inconsistent with the claiming of the reduced rate of tax, described below, applicableto dividends received by certain non-corporate U.S. Holders. Accordingly, the analysis of the availability of foreign tax credits and the reduced tax rate fordividends received by certain non-corporate U.S. Holders, described below, could be affected by actions taken by parties to whom the ADSs are released.
112

Table of Contents
Taxation of DistributionsThe amount of any distribution paid to a U.S. Holder, including any Israeli taxes withheld from the amount of such distribution, will be subject to U.S.
federal income taxation as ordinary income from sources outside the U.S. to the extent paid out of current or accumulated earnings and profits, as determinedfor U.S. federal income tax purposes. Subject to applicable limitations, dividends paid to non-corporate U.S. Holders, which are included in income afterDecember 31, 2012, are generally subject to tax at a maximum rate of 15% or 20%, in case of taxpayers with annual taxable income which exceeds certainthresholds. The amount of any distribution of property other than cash will be the property’s fair market value on the date of the distribution. To the extent thatan amount received by a U.S. Holder exceeds that U.S. Holder’s allocable share of current and accumulated earnings and profits, such excess will be appliedfirst to reduce that U.S. Holder’s tax basis in the shares and then, to the extent the distribution exceeds that U.S. Holder’s tax basis, will be treated as a capitalgain. Any dividend received will not be eligible for the dividends-received deduction generally allowed to U.S. corporations in respect of dividends receivedfrom other U.S. corporations.
Dividends paid in NIS will be included in a U.S. Holder’s income in a U.S. dollar amount calculated by reference to the exchange rate in effect on thedate of the U.S. Holder’s (or, in the case of ADSs, the depositary’s) receipt of the dividend, regardless of whether the payment is in fact converted into U.S.dollars. If the dividend is converted into U.S. dollars on the date of receipt, a U.S. Holder should generally not be required to recognize foreign currency gain orloss in respect of the dividend income. A U.S. Holder may have foreign currency gain or loss, which will be treated as income from sources within the U.S., ifhe or she does not convert the amount of such dividend into U.S. dollars on the date of receipt. The amount of any distribution of property other than cash willbe the property’s fair market value on the date of the distribution.
Subject to applicable limitations that may vary depending on a U.S. Holder’s circumstances, Israeli taxes withheld from dividends on Teva ADSs at therate provided by the U.S.-Israel tax treaty will be creditable against a U.S. Holder’s U.S. federal income tax liability. The limitation on foreign taxes eligible forcredit is calculated separately with respect to specific classes of income. The rules governing foreign tax credits are complex, and, therefore, you shouldconsult your own tax advisor regarding the availability of foreign tax credits in your particular circumstances. Instead of claiming a credit, a U.S. Holder mayelect to deduct such otherwise creditable Israeli taxes in computing taxable income, subject to generally applicable limitations.
Taxation of the Disposition of ADSsUpon the sale or exchange of ADSs, a U.S. Holder will generally recognize capital gain or loss for U.S. federal income tax purposes in an amount equal
to the difference between the amount realized and the U.S. Holder’s tax basis determined in U.S. dollars in the ADSs. The gain or loss will generally be gain orloss from sources within the U.S. for foreign tax credit limitation purposes. In general, a capital gain realized after December 31, 2012, by a non-corporateU.S. Holder is subject to tax at ordinary rates for ADSs held for one year or less and at the long-term capital gains rate (of up to 15% or 20%) for ADSs heldfor more than one year. A U.S. Holder’s ability to deduct capital losses is subject to limitations.
The surrender of ADSs in exchange for ordinary shares, or vice versa, will not be a taxable event for U.S. federal income tax purposes, and U.S.Holders will not recognize any gain or loss upon such an exchange.
Medicare TaxIn addition to the taxes on dividends and dispositions of ADSs described above, legislation enacted in 2010 requires certain U.S. Holders that are
individuals, estates or trusts to pay up to an additional 3.8% tax on net investment income which may include dividends and capital gains, for taxable yearsbeginning after December 31, 2012.
113

Table of Contents
U.S. Information Reporting and Backup WithholdingA U.S. Holder generally will be subject to information reporting with respect to dividends paid on, or proceeds from the sale or other disposition of, an
ADS unless the U.S. Holder is a corporation or comes within another category of exempt recipients. If it is not exempt, a U.S. Holder may also be subject tobackup withholding with respect to dividends or proceeds from the sale or disposition of an ADS unless a taxpayer identification number is provided and theother applicable requirements of the backup withholding rules are complied with. Any amount withheld under these rules will be creditable against the U.S.Holder’s U.S. federal income tax liability or refundable to the extent that it exceeds such liability, provided that the required information is timely furnished tothe Internal Revenue Service.
U.S. Holders should review the summary below under “Israeli Taxation” for a discussion of the Israeli taxes which may be applicable to them.
Israeli Taxation
Corporate Tax RateThe regular corporate tax rate in Israel for 2012 was 25%. However, Teva’s effective consolidated tax rates (before deduction of certain charges) for the
years ended December 31, 2012, 2011 and 2010 were -8%, 4% and 8%, respectively, since a major portion of Teva’s income is derived from ApprovedEnterprises (as discussed below), the applicable tax rates for which have been lower than the statutory rate, and from operations outside of Israel, where Tevahas enjoyed lower tax rates.
The Company elected to compute its taxable income in accordance with Income Tax Regulations (Rules for Accounting for Foreign Investors Companiesand Certain Partnerships and Setting their Taxable Income), 1986. Accordingly, the Company’s taxable income or loss is calculated in U.S. dollars terms.Applying these regulations reduces the effect of foreign exchange rate fluctuations (of NIS against the U.S. dollar) on the Company’s Israeli taxable income.
Law for the Encouragement of Industry (Taxes), 1969 (the “Industry Encouragement Law”)Teva and certain of its Israeli subsidiaries currently qualify as “Industrial Companies” pursuant to the Industry Encouragement Law. As such, Teva
and these subsidiaries qualify for certain tax benefits, including amortization of the purchase price of a good-faith acquisition of a patent or of certain otherintangible property rights at a rate of 12.5% per annum and the right to file consolidated tax returns. Currently, Teva files consolidated tax returns togetherwith certain Israeli subsidiaries. The tax laws and regulations provide that industrial enterprises such as those of Teva and its subsidiaries which qualify asIndustrial Companies can claim special rates of depreciation of up to 40% on a straight line basis for industrial equipment.
Eligibility for benefits under the Industry Encouragement Law is not subject to receipt of prior approval from any government authority. There can be noassurance that Teva or any of its Israeli subsidiaries that presently qualify as Industrial Companies will continue to qualify as such in the future, or that thebenefits will be granted in the future.
Law for the Encouragement of Capital Investments, 1959 (the “Investment Law”)Industrial projects of Teva and certain of its Israeli subsidiaries are eligible to be granted “Approved Enterprise” status under the Investment Law.
The Investment Law empowers the Israeli Investment Center to grant Approved Enterprise status to capital investments in production facilities that meetcertain relevant criteria. In general, such capital investments will
114

Table of Contents
receive Approved Enterprise status if the enterprise is expected to contribute to the development of the productive capacity of the economy, absorption ofimmigrants, creation of employment opportunities, or improvement in the balance of payments.
The tax benefits derived from any such Approved Enterprise relate only to taxable profits attributable to the specific program of investment to which thestatus was granted. In the event that Teva and its subsidiaries that have been granted Approved Enterprise status are operating under more than one approval,or in the event that their capital investments are only partly approved, their effective corporate tax rate will be the result of a weighted combination of thevarious rates applicable.
Most of Teva’s projects in Israel have been granted Approved Enterprise status. For the vast majority of such Approved Enterprises, the companieselected to apply for alternative tax benefits—the waiver of government grants in return for tax exemptions on undistributed income. Upon distribution of suchexempt income, the distributing company will be subject to corporate tax at the rate ordinarily applicable to the Approved Enterprise’s income. Such taxexemption on undistributed income applies for a limited period of between two to ten years, depending upon the location of the enterprise. During the remainderof the benefits period (generally until the expiration of ten years), a corporate tax rate not exceeding 25% will apply.
Teva is a foreign investors company, or FIC, as defined by the Investment Law. FICs are entitled to further reductions in the tax rate normally applicableto Approved Enterprises, depending on the level of foreign ownership. Depending on the foreign ownership in each tax year, the tax rate can range between 10%(when foreign ownership exceeds 90%) to 25% (when the foreign ownership is below 49%). There can be no assurance that Teva will continue to qualify as anFIC in the future or that the benefits described herein will be granted in the future.
Dividends paid by a company owning an Approved Enterprise, the source of which dividends is income derived from the Approved Enterprise accruedduring the benefits period, are generally taxed at a rate of 15% (which is withheld and paid by the company paying the dividend) if such dividends are paidduring the benefits period or at any time up to 12 years thereafter. The 12-year limitation does not apply to a FIC.
In April 2005, a major amendment to the Investment Law came into effect, which is intended to provide expanded tax benefits to local and foreigninvestors and to simplify the bureaucratic process relating to the approval of investments that qualify under the Investment Law. Under the amendment,certain minimum qualifying investment requirements, time restrictions in which the investment is made and other conditions were established for newapproved enterprises or expansions. Moreover, with a view to simplifying the bureaucratic process, the amendment provides that, in the event that aninvestment project meets all of the eligibility criteria under one of the Alternative Tracks (Standard Alternative Track, Ireland Track or Strategic InvestmentTrack), as discussed further below, a project will automatically qualify for Approved Enterprise taxation benefits under the Investment Law with no need forprior approval from the Investment Center.
The amendment generally does not apply retroactively to investment programs having an Approved Enterprise approval certificate from the InvestmentCenter issued prior to December 31, 2004 (even when investments under these programs are made after January 1, 2005). The amendment will only apply to anew Approved Enterprise and to an Approved Enterprise expansion for which the first year of benefits is 2004 or any year thereafter.
The Amendment provides two additional tracks—“The Ireland Track” and “The Strategic Investment Track”—in addition to those previouslyavailable.
The Strategic Investment Track applies to companies that have an Approved Enterprise in a certain location in the country, which enterprise has(i) investments of at least NIS 600 million or NIS 900 million (approximately $160 or $240 million) depending on the location in the country; and (ii) annualrevenues (measured for the company’s consolidated group) for the tax year prior to the year the new investment begins (or the annual average
115

Table of Contents
for the three years prior to the year of investment) of at least NIS 13 billion or NIS 20 billion (approximately $3.5 billion or $5.4 billion). Income accruedunder this track during the benefits period will be exempt from a corporate tax liability. In addition, dividends distributed from such income will also beexempt from Israeli tax. The Israeli government, in certain cases, may reduce these minimum requirements if it determines that the investments will result inmaterial contributions to the Israeli economy. Teva has one approved program under this track.
Benefits under the Investment Law are granted with respect to qualified investments made in the period until December 31, 2012. However, aspreviously mentioned, eligibility for benefits under the Investment Law with respect to Approved Enterprises and expansions of Approved Enterprises from2004 and onwards, is not subject to receipt of prior approval from any governmental authority. There can be no assurance that Teva or any of its subsidiarieswill continue to qualify for Approved Enterprise taxation benefits or that the benefits described above will continue to be granted in the future .
Pursuant to a recent amendment to the Investments Law which became effective on November 12, 2012, a company that elects by November 11, 2013to pay a corporate tax rate as set forth in that amendment (rather than the regular corporate tax rate applicable to approved enterprise income) with respect toundistributed exempt income accumulated by the company up until December 31, 2011, will be entitled to distribute a dividend from such income withoutbeing required to pay additional corporate tax with respect to such dividend. A company that has so elected must make certain qualified investments in Israelover the five-year period commencing in 2013. A company that has elected to apply the amendment cannot withdraw from its election. Teva is currentlyreviewing the new amendment and its implications to the company. If Teva elects to take advantage of the amendment, it will be required to pay up toapproximately $700 million as a one-time payment.
The New Incentives Regime—Amendment 68 to the Investment LawUnder a new amendment to the law effective January 1, 2011, upon an irrevocable election made by the Company, a uniform corporate tax rate will
apply to all qualifying income of certain Industrial Companies, as opposed to the previous law’s incentives, which are limited to income from ApprovedEnterprises during their benefits period. Under the law, when the election is made, the uniform tax rate will be 10% in areas in Israel designated asDevelopment Zone A and 15% elsewhere in Israel during 2011-2012, 7% and 12.5%, respectively, in 2013-2014, and 6% and 12%, respectively, thereafter.Certain “Special Industrial Companies” that meet certain criteria (somewhat equivalent to the criteria for the Strategic Investment Track noted above) will enjoyfurther reduced tax rates of 5% in Zone A and 8% elsewhere. The profits of these Industrial Companies will be freely distributable as dividends, subject to a15% withholding tax (or lower, under an applicable tax treaty).
Teva may decide in the future to make the above-mentioned election with respect to each of its Israeli companies, or to remain subject to the current law.Teva does not expect the changes in the law to have a material effect on the tax payable by its Israeli operations.
Taxation of Non-Israeli SubsidiariesNon-Israeli subsidiaries are generally taxed based upon tax laws applicable in their countries of residence. In accordance with the provisions of Israeli-
controlled foreign corporation rules, certain income of a non-Israeli subsidiary, if the subsidiary’s primary source of income is passive income (such asinterest, dividends, royalties, rental income or income from capital gains), may be deemed distributed as a dividend to the Israeli parent company andconsequently is subject to Israeli taxation. An Israeli company that is subject to Israeli taxes on such deemed dividend income of its non-Israeli subsidiariesmay generally receive a credit for non-Israeli income taxes paid by the subsidiary in its country of residence or are to be withheld from the actual dividenddistributions.
116

Table of Contents
Withholding Taxes on Dividends Distributed by Teva to Non-Israeli ResidentsDividends distributed by an Israeli company to non-Israeli residents are generally subject to a 25% tax to be withheld at the source, unless a lower rate is
provided in a treaty between Israel and the shareholder’s country of residence. In the case of dividends distributed from taxable income attributable to anApproved Enterprise the rate applied is 15% and when the dividend is distributed from income attributed to the Strategic Investment Track the rate applied is0%.
Under the U.S.-Israel tax treaty, the maximum Israeli tax and withholding tax on dividends paid to a holder of ordinary shares or ADSs who is aresident of the U.S. is generally 25%, but is reduced to 12.5% if the dividends are paid to a corporation that holds in excess of 10% of the voting rights ofTeva during Teva’s taxable year preceding the distribution of the dividend and the portion of Teva’s taxable year in which the dividend was distributed.Dividends of an Israeli company derived from the income of an Approved Enterprise will still be subject to a 15% dividend withholding tax; provided that, ifthe dividend is attributable partly to income derived from an Approved Enterprise, and partly to other sources of income, the withholding rate will be a blendedrate reflecting the relative portions of the two types of income. The withheld tax is the final tax in Israel on dividends paid to non-residents who do not conductbusiness in Israel. The rate of tax to be withheld on Teva’s dividends for the fourth quarter of 2012 is 15%.
A non-resident of Israel who has interest or dividend income derived from or accrued in Israel, from which tax was withheld at the source, is generallyexempt from the duty to file tax returns in Israel in respect of such income, provided such income was not derived from a business conducted in Israel by thetaxpayer.
Capital Gains and Income Taxes Applicable to Non-Israeli ShareholdersIsraeli law generally imposes a capital gains tax on the sale of securities and any other capital asset.
Gains on the sale of ordinary shares traded on a recognized stock exchange (including the Tel Aviv Stock Exchange and NYSE) by non-Israeli taxresident investors will generally be exempt from Israeli capital gains tax. Notwithstanding the foregoing, dealers in securities in Israel are taxed at regular taxrates applicable to business income.
In addition, the U.S.-Israel tax treaty exempts U.S. residents who hold an interest of less than 10% in an Israeli company, including Teva, and who didnot hold an interest of 10% or more in the company at any time during the 12 months prior to a sale of their shares, from Israeli capital gains tax in connectionwith such sale. Certain other tax treaties to which Israel is a party also grant exemptions from Israeli capital gains taxes.
Documents on DisplayTeva files annual and special reports and other information with the SEC. You may inspect and copy such material at the public reference facilities
maintained by the SEC, 100 F Street, N.E., Washington, D.C. 20549. You may also obtain copies of such material from the SEC at prescribed rates bywriting to the Public Reference Section of the SEC, 100 F Street, N.E., Washington, D.C. 20549. Please call the SEC at 1-800-SEC-0330 for furtherinformation on the public reference room.
The SEC maintains an Internet website at http://www.sec.gov that contains reports, proxy statements, information statements and other material that arefiled through the SEC’s Electronic Data Gathering, Analysis and Retrieval (“EDGAR”) system. Teva began filing through the EDGAR system beginning onOctober 31, 2002.
Teva also files annual and special reports and other information with the Israeli Securities Authority through its fair disclosure electronic system calledMAGNA. You may review these filings on the website of the MAGNA system operated by the Israeli Securities Authority at www.magna.isa.gov.il or on thewebsite of the TASE at www.tase.co.il.
Teva’s ADSs are quoted on the New York Stock Exchange. Information about Teva is also available on its website at http://www.tevapharm.com. Suchinformation on its website is not part of this annual report.
117

Table of Contents
ITEM 11: QUANTITATIVE AND QUALITATIVE DISCLOSURES ABOUT MARKET RISK
GeneralA significant portion of our revenues are from sales outside the United States and are recorded in local currencies. Similarly, much of our operating
costs are incurred in currencies other than the U.S. dollar. Through our financial assets and liabilities, we are also exposed to interest rate risk.
We take various measures to compensate for the effects of fluctuations in both exchange and interest rates. These measures include traditional currencyhedging transactions as well as transactions intended to maintain a balance between monetary assets and liabilities in each of our principal operatingcurrencies, mainly the U.S. dollar (where the U.S. dollar is not the functional currency), the new Israeli shekel (NIS), the euro, the Canadian dollar (CAD),the British pound (GBP), the Hungarian forint (HUF), the Russian ruble (RUB), the Croatian kuna (HRK), the Czech koruna (CZK), other Europeancurrencies and Latin American currencies such as the Brazilian real (BRL) and the Mexican peso (MXN). The costs and gains resulting from suchinstruments, to the extent they do not qualify for hedge accounting, are included under the caption “financial expenses—net.”
Although we are typically able to borrow funds in U.S. dollars, NIS or any other major currency, we generally prefer to borrow in U.S. dollars.However, the loan is subject to the functional currency of the borrowing subsidiary in order to reduce the volatility of financial expenses.
We use financial instruments and derivatives in order to limit our exposure to risks deriving from changes in exchange and interest rates. The use ofsuch instruments does not expose us to additional exchange or interest rate risks because the derivatives are covered in the corresponding underlying asset orliability. No derivative instruments are entered into for trading purposes.
Our derivative transactions during 2012 were executed through international as well as Israeli and Hungarian banks and other financial institutions. Inthe opinion of management, in light of our diversified derivative transaction portfolio, any credit risk associated with any of these banks or financialinstitutions is minimal.
118

Table of Contents
Exchange Rate Risk ManagementBalance Sheet Exposure
We hedge against exposures arising from the gap between current assets and current liabilities that are recorded in currencies other than the U.S. dollar(“balance sheet exposure”) in subsidiaries whose functional currency is the U.S. dollar. The majority of the balance sheet exposures in such subsidiaries are inEuropean currencies, Canadian dollars and NIS. In our European and Latin American subsidiaries, we protect against balance sheet exposures that aregenerally in U.S. dollars and European currencies. We strive to limit our exposure through “natural” hedging, i.e., by matching levels of assets and liabilitiesin any given currency. The remaining exposure is substantially covered by the use of derivative instruments. To the extent possible, this is done on aconsolidated basis.
Net exposure as of December 31, 2012(in USD, millions)
GBP/ USD 372 HUF/USD 362 USD/ CAD 255 EUR/HUF 173 EUR/CHF 145 CZK/USD 136 USD/ RUB 129 HRk/RUB 113 NIS/USD 105 USD/CHF 104 HRk/USD 104 CZK/EUR 85 EUR/RON 6 6 EUR/ GBP 57 EUR/RUB 5 6 USD/PLN 52 Total 2,314
Notes
1. The table presents only exposures above $50 million.
2. Net exposure is the sum of the absolute value figures.
3. The first currency in the table is the liability, the second is the asset.
4. Most of the functional currencies are the local currencies other than Israel, where Teva uses the U.S. dollar as the functional currency.
5. The above exposure does not include shareholder’s equity exposure.
Cash Flow ExposureTotal revenues amounted to $20.3 billion in 2012. Of these revenues, 54% were in U.S. dollars, 18% in euros, 4% in Japanese yen and the rest in other
currencies, none of which accounted for more than 4% of total revenues in 2012. In most currencies, we record expenses against these revenues.
119

Table of Contents
In certain currencies, primarily the euro, our expected revenues exceed our expected expenses. Conversely, in other currencies, primarily the new Israelishekel and the Hungarian forint, our expected expenses are higher than our expected revenues. For those currencies which do not have a sufficient natural hedgewithin our operations, we may choose to hedge in order to reduce the impact of currency fluctuations on our operating results.
In Europe, a significant portion of our profits may be at risk if the euro depreciates. In 2012, we entered into hedging transactions to protect ourEuropean subsidiaries from potential exposure resulting from the strengthening of the U.S. dollar against the euro in 2012 and 2013. In Israel, we are exposedto the risk of appreciation of the NIS against the U.S. dollar. Accordingly, in 2012, we entered into hedging transactions to reduce the exposure resulting fromexcess costs denominated in NIS.
Specific Transaction ExposureIn certain cases, we protect in whole or in part against exposure arising from a specific transaction, such as an acquisition of a company or assets
effected in a currency other than the relevant functional currency, by entering into forward contracts and by using the “cylinder strategy” (purchasing call orput options on the U.S. dollar, often together with writing put or call options on the U.S. dollar at a lower exchange rate). In order to reduce costs, Teva alsouses “knock-in” strategies as well as writing put options. Teva usually limits hedging transactions to three-month terms.
Foreign Exchange HedgingAt December 31, 2012, we had long and short forwards and currency option contracts with corresponding value of approximately $1.9 billion and
$265 million, respectively. At December 31, 2011, we had long and short forwards and currency option contracts with corresponding values of $2.2 millionand $545 million, respectively.
The table below presents derivative instruments purchased to limit exposures to foreign exchange rate fluctuations for all exposure types, as ofDecember 31, 2012.
Currency
CrossCurrency
Hedging Value* Fair Value 2012 WeightedAverage Cross
CurrencyPrices or
Strike Prices 2012 2011 2012 2011 (U.S. dollars in millions) Forward: USD HUF 359.0 346.0 (3.5) (22.0) 218.60 GBP USD 175.0 187.0 2.0 — 1.62 Euro USD 113.0 40.0 (1.5) — 1.30 Canadian dollar USD 288.0 149.0 2.5 (1.0) 0.99 Swiss franc EUR 145.0 29.0 0.5 — 1.21 Swiss franc USD 126.0 87.0 (1.0) (1.0) 0.92 Romanian leu EUR 68.0 33.0 (1.0) — 4.53 Russian ruble USD 246.0 136.0 (6.0) 2.5 31.27
Options: Czech koruna USD 57.0 45.0 0.5 — N/A Euro USD 50.0 91.0 — (0.5) 1.32 GBP USD 95.0 57.0 0.5 — 1.62
Total 1722.0 1200.0 (7.0) (22.0) * The table presents only hedging transactions with a value above $50 million.
120

Table of Contents
Interest Rate Risk ManagementWe raise capital through various debt instruments, including straight notes that bear a fixed or variable interest rate, syndicated bank loans bearing
floating interest rates, securitizations and convertible debentures that bear a fixed interest rate. In some cases, as described below, we have swapped from afixed interest rate to a floating interest rate, and vice versa, thereby reducing overall interest expenses or hedging risks associated with interest rate fluctuations.
In December 2012, we issued notes in an aggregate principal amount of $2.0 billion, including $1.3 billion 2.95% senior notes maturing in December2022 and $0.7 billion 2.25% senior notes maturing in March 2020. We entered into interest rate swap agreements with respect to these 2.95% senior notes due2022. As a result, we pay an effective interest rate of one month LIBOR plus an average 1.31% on the $1.3 billion principal amount instead of a fixed rate of2.95% on such amount.
In November 2011, in connection with financing for the Cephalon acquisition, we entered into an interest rate and cross-currency swap agreement withrespect to one series of senior notes due 2021, converting the notes’ denomination from dollars to euros, resulting in an effective interest rate of 3.85% on theeuro principal balance. We also entered into interest rate swap agreements with respect to the senior notes due November 2013, changing the interest rate from afloating rate of LIBOR plus a spread of 0.90% to a fixed rate of 1.61%.
In March 2011, we issued notes in an aggregate principal amount of $0.75 billion, including $0.25 billion 1.7% senior notes maturing in March 2014.We entered into an interest rate swap agreement with respect to these notes, changing the interest rate from a fixed rate of 1.7% to a floating rate of LIBOR plus aspread of 0.39%.
In June 2010, in connection with the financing for the ratiopharm acquisition, we entered into an interest rate and cross-currency swap agreement withrespect to the $1 billion of 3.0% fixed rate senior notes due 2015, converting the notes’ denomination from dollars to euros, resulting in an effective interest rateof 2.36% on the euro principal balance.
Our cash is invested in bank deposits and money market funds bearing an interest rate which is mostly dependent on floating rates. The bank depositsare spread among several banks, primarily international, U.S. and European banks. We also hold long term investments in the amount of $0.1 billion.
We currently hold two range accrual notes with a total face value of $100 million that pay high interest as long as LIBOR remains below a certainthreshold.
121

Table of Contents
Our indebtedness, the interest rate range it bears and its repayment schedule by currency as at December 31, 2012 are set forth in the table below in U.S.dollar equivalent terms, taking into account the above-described swap transactions.
Currency Total
Amount Interest Rate
Range 2013 2014 2015 2016 2017 2018 &
thereafter (U.S. dollars in millions) Fixed Rate:
USD straight bonds 6,181 1.61% 7.20% 2,128 11 1,469 2,573 Euro 3,280 2.36% 3.85% 1,073 2,207 JPY 1,530 1.40% 2.27% 111 75 5 5 43 792 454 USD convertible debentures** 530 0.25% 0.50% 530 CHF 493 1.50% 493
Floating Rate: USD 2,398 0.70% 1.45% 200 754 147 1,297 Euro 264 1.50% 2.36% * * 263 JPY 35 0.52% 0.70% 35 Others 7 0.25% 2.50% 1 * * * 4
Total: 14,718 3,006 840 1,539 1,513 792 7,028 * Represents an amount of less than $0.5 million.** 0.25% $530 convertible senior debentures were classified under short term debt.
122

Table of Contents
ITEM 12D:DESCRIPTION OF TEVA AMERICAN DEPOSITARY SHARES
Set forth below is a summary of the deposit agreement, as amended, among Teva, JPMorgan Chase Bank N.A. as depositary, which we refer to as thedepositary, and the holders from time to time of ADSs. This summary is not complete and is qualified in its entirety by the deposit agreement, a copy ofwhich has been filed as an exhibit to the Registration Statement on Form F-6 filed with the SEC on October 30, 2012. Additional copies of the depositagreement are available for inspection at the principal office of the depositary, One Chase Manhattan Plaza, New York, New York, 10005.
American Depositary Shares and ReceiptsEach ADS represents one ordinary share of Teva deposited with the custodian. ADSs may be issued in uncertificated form or may be evidenced by an
American Depositary Receipt, or ADR. ADRs evidencing a specified number of ADSs are issuable by the depositary pursuant to the deposit agreement.
Deposit and Withdrawal of Ordinary SharesThe depositary has agreed that, upon deposit with the custodian of ordinary shares of Teva accompanied by an appropriate confirmation or
confirmations of a book-entry transfer or instrument or instruments of transfer or endorsement in a form satisfactory to the custodian and any certificates asmay be required by the depositary or the custodian, the depositary will execute and deliver at its principal office, upon payment of the fees, charges and taxesprovided in the deposit agreement, to or upon the written order of the person or persons entitled thereto, uncertificated securities or an ADR registered in thename of such person or persons for the number of ADSs issuable with respect to such deposit.
Every person depositing ordinary shares under the deposit agreement shall be deemed to represent and warrant that such ordinary shares are validlyissued, fully paid and non-assessable ordinary shares and that such person is duly authorized to make such deposit, and that the deposit of such ordinaryshares or sale of ADSs by such person is not restricted under the Securities Act.
Upon surrender of ADSs at the principal office of the depositary, and upon payment of the fees provided in the deposit agreement, ADS holders areentitled to delivery to them or upon their order at the principal office of the custodian or at the principal office of the depositary of certificates representing theordinary shares and any other securities, property or cash represented by the surrendered ADSs. Delivery to the principal office of the depositary shall bemade at the risk and expense of the ADS holder surrendering ADSs.
The depositary may deliver ADSs prior to the receipt of ordinary shares or “pre-release.” The depositary may deliver ordinary shares upon the receiptand surrender of ADSs that have been pre-released, whether or not such surrender is prior to the termination of such pre-release or the depositary knows thatsuch ADSs have been pre-released. Each pre-release will be:
• accompanied by a written representation from the person to whom ordinary shares or ADSs are to be delivered that such person, or its customer,
owns the ordinary shares or ADSs to be remitted, as the case may be;
• at all times fully collateralized with cash or such other collateral as the depositary deems appropriate;
• terminable by the depositary with no more than five business days’ notice; and
• subject to such further indemnities and credit regulations as the depositary deems appropriate.
The number of ADSs outstanding at any time as a result of pre-releases will not normally exceed 30% of the ordinary shares outstanding with thedepositary; provided, however, that the depositary reserves the right to change or disregard such limit from time to time as it deems appropriate.
123

Table of Contents
Dividends, Other Distributions and RightsThe depositary shall, as promptly as practicable, convert or cause to be converted into U.S. dollars, to the extent that in its judgment it can reasonably
do so and transfer the resulting U.S. dollars to the United States, all cash dividends and other cash distributions denominated in a currency other than U.S.dollars that it or the custodian receives in respect of the deposited ordinary shares, and to distribute the amount received, net of any fees of the depositary andexpenses incurred by the depositary in connection with conversion, to the holders of ADSs. The amount distributed will be reduced by any amounts to bewithheld by Teva or the depositary for applicable taxes, net of expenses of conversion into U.S. dollars. For a more detailed discussion regarding taxconsiderations, you should carefully review the section above entitled “—U.S. Federal Income Tax Considerations.” If the depositary determines that anyforeign currency received by it or the custodian cannot be so converted on a reasonable basis and transferred, or if any required approval or license of anygovernment or agency is denied or not obtained within a reasonable period of time, the depositary may distribute such foreign currency received by it or holdsuch foreign currency uninvested and without liability for interest thereon for the respective accounts of the ADS holders. If any conversion of foreigncurrency, in whole or in part, cannot be effected for distribution to some of the holders of ADSs entitled thereto, the depositary may make such conversion anddistribution in U.S. dollars to the extent permissible to such holders of ADSs and may distribute the balance of the currency received by the depositary to, orhold such balance uninvested and without liability for interest thereon for, the respective accounts of such holders of ADSs.
If any distribution upon any ordinary shares deposited or deemed deposited under the deposit agreement consists of a dividend in, or free distributionof, additional ordinary shares, the depositary shall, only if Teva so requests, distribute to the holders of outstanding ADSs, on a pro rata basis, additionalADSs that represent the number of additional ordinary shares received as such dividend or free distribution subject to the terms and conditions of the depositagreement and net of any fees and expenses of the depositary. In lieu of delivering fractional ADSs in the event of any such distribution, the depositary will sellthe amount of additional ordinary shares represented by the aggregate of such fractions and will distribute the net proceeds to holders of ADSs. If additionalADSs are not so distributed, each ADS shall thereafter also represent the additional ordinary shares distributed together with the ordinary shares representedby such ADS prior to such distribution.
If Teva offers or causes to be offered to the holders of ordinary shares any rights to subscribe for additional ordinary shares or any rights of any othernature, the depositary, after consultation with Teva, shall have discretion as to the procedure to be followed in making such rights available to holders ofADSs or in disposing of such rights for the benefit of such holders and making the net proceeds available to such holders or, if the depositary may neithermake such rights available to such holders nor dispose of such rights and make the net proceeds available to such holders, the depositary shall allow therights to lapse; provided, however, that the depositary will, if requested by Teva, take action as follows:
• if at the time of the offering of any rights the depositary determines at its discretion that it is lawful and feasible to make such rights available toall holders of ADSs or to certain holders of ADSs but not other holders of ADSs, the depositary may distribute to any holder of ADSs to whom itdetermines the distribution to be lawful and feasible, on a pro rata basis, warrants or other instruments therefore in such form as it deemsappropriate; or
• if the depositary determines at its discretion that it is not lawful and feasible to make such rights available to certain holders of ADSs, it may sellthe rights, warrants or other instruments in proportion to the number of ADSs held by the holder of ADSs to whom it has determined it may notlawfully or feasibly make such rights available, and allocate the net proceeds of such sales (net of the fees of the depositary and all taxes andgovernmental charges) for the account of such holders of ADSs otherwise entitled to such rights, warrants or other instruments, upon an averagedor other practical basis without regard to any distinctions among such holders of ADSs because of exchange restrictions or the date of delivery ofany ADS or otherwise.
In circumstances in which rights would not otherwise be distributed, if a holder of ADSs requests the distribution of warrants or other instruments inorder to exercise the rights allocable to the ADSs of such holder,
124

Table of Contents
the depositary will make such rights available to such holder upon written notice from Teva to the depositary that Teva has elected at its sole discretion topermit such rights to be exercised and such holder has executed such documents as Teva has determined at its sole discretion are reasonably required underapplicable law. Upon instruction pursuant to such warrants or other instruments to the depositary from such holder to exercise such rights, upon payment bysuch holder to the depositary for the account of such holder of an amount equal to the purchase price of the ordinary shares to be received upon the exercise ofthe rights, and upon payment of the fees of the depositary as set forth in such warrants or other instruments, the depositary shall, on behalf of such holder,exercise the rights and purchase the ordinary shares, and Teva shall cause the ordinary shares so purchased to be delivered to the depositary on behalf of suchholder. As agent for such holder, the depositary will cause the ordinary shares so purchased to be deposited under the deposit agreement, and shall issue anddeliver to such holder legended ADRs or confirmations with respect to uncertificated ADSs, restricted as to transfer under applicable securities laws.
The depositary will not offer to the holders of ADSs any rights to subscribe for additional ordinary shares or rights of any other nature, unless and untilsuch a registration statement is in effect with respect to the rights and the securities to which they relate, or unless the offering and sale of such securities to theholders of such ADSs are exempt from registration under the provisions of the Securities Act and an opinion of counsel satisfactory to the depositary and Tevahas been obtained.
The depositary shall not be responsible for any failure to determine that it may be lawful and feasible to make such rights available to holders of ADSsin general or any holder in particular.
If the depositary determines that any distribution of property is subject to any tax or other governmental charge that the depositary is obligated towithhold, the depositary may by public or private sale in Israel dispose of all or a portion of such property in such amounts and in such manner as thedepositary deems necessary and practicable to pay any such taxes or charges, and the depositary will distribute the net proceeds of any such sale and afterdeduction of any taxes or charges to the ADS holders entitled thereto.
Upon any change in nominal value, change in par value, split-up, consolidation or any other reclassification of ordinary shares, or upon anyrecapitalization, reorganization, merger or consolidation or sale of assets affecting Teva or to which it is a party, any securities that shall be received by thedepositary or the custodian in exchange for or in conversion of or in respect of ordinary shares shall be treated as newly deposited ordinary shares under thedeposit agreement, and ADSs shall thenceforth represent, in addition to the existing deposited securities, the right to receive the new ordinary shares so receivedin respect of ordinary shares, unless additional ADSs are delivered or the depositary calls for the surrender of outstanding ADRs to be exchanged for newADRs.
Record DatesWhenever any cash dividend or other cash distribution shall become payable, any distribution other than cash shall be made or rights shall be issued
with respect to the ordinary shares, or whenever for any reason the depositary causes a change in the number of ordinary shares that are represented by eachADS, or whenever the depositary shall receive notice of any meeting of holders of ordinary shares, the depositary shall fix a record date which shall be as closeas practicable to the record date applicable to the ordinary shares, provided that the record date established by Teva or the depositary shall not occur on a dayon which the shares or ADSs are not traded in Israel or the U.S.:
• for the determination of the holders of ADSs who shall be:
• entitled to receive such dividend, distribution or rights, or the net proceeds of the sale, or
• entitled to give instructions for the exercise of voting rights at any such meeting; or
• on or after which each ADS will represent the changed number of ordinary shares.
125

Table of Contents
Reports and Other CommunicationsTeva will furnish to the depositary and the custodian all notices of shareholders’ meetings and other reports and communications that are made generally
available to the holders of ordinary shares and English translations of the same. The depositary will make such notices, reports and communications availablefor inspection by ADS holders at its principal office when furnished by Teva pursuant to the deposit agreement and, upon request by Teva, will mail suchnotices, reports and communications to ADS holders at Teva’s expense.
Voting of the Underlying Ordinary SharesUpon receipt of notice of any meeting or solicitation of consents or proxies of holders of ordinary shares, if requested in writing, the depositary shall, as
soon as practicable thereafter, mail to the ADS holders a notice containing:
• such information as is contained in the notice received by the depositary;
• a statement that the holders of ADSs as of the close of business on a specified record date will be entitled, subject to applicable law and the
provisions of Teva’s memorandum and articles of association, as amended, to instruct the depositary as to the exercise of voting rights, if any,pertaining to the amount of ordinary shares represented by their respective ADSs; and
• a statement as to the manner in which such instructions may be given, including, when applicable, an express indication that instructions may be
given to the Depositary to give a discretionary proxy to a person designated by Teva.
Upon the written request of an ADS holder on such record date, received by the ADR department of the depositary (the address of which shall beprovided to the owners by the depositary in the notice described above) on or before the time the date established by the depositary for such purpose, thedepositary shall endeavor, insofar as is practicable and permitted under applicable law and the provisions of Teva’s memorandum and articles of association,as amended, to vote or cause to be voted the amount of ordinary shares represented by the ADSs in accordance with the instructions set forth in such request.If no instructions are received by the depositary from a holder of an ADS, the depositary shall give a discretionary proxy for the ordinary shares representedby such holder’s ADS to a person designated by Teva. The depositary may, to the extent not prohibited by the deposit agreement, law or regulation or by therequirements of the stock exchange on which the ADSs are listed, in lieu of distribution of the materials provided to the depositary in connection with anymeeting of, or solicitation of consents or proxies from, holders of deposited securities, distribute to the owners a notice that provides owners with instructionson how to retrieve such materials or receive such materials upon request.
Amendment and Termination of the Deposit AgreementThe form of the ADRs and the terms of the deposit agreement may at any time be amended by written agreement between Teva and the depositary,
without the consent of the ADS holders. Any amendment that imposes or increases any fees or charges (other than taxes or other governmental charges,registration fees, cable, telex or facsimile transmission costs, delivery costs or other such expenses), or that otherwise prejudices any substantial existing rightof holders of ADSs shall, however, not become effective until the expiration of thirty days after notice of such amendment has been given to the holders ofoutstanding ADSs. Every holder of an ADS at the time such amendment becomes effective will be deemed, by continuing to hold such ADS, to consent andagree to such amendment and to be bound by the deposit agreement as amended thereby. In no event will any amendment impair the right of any ADS holder tosurrender the ADSs held by such holder and receive therefore the underlying ordinary shares and any other property represented thereby, except in order tocomply with mandatory provisions of applicable law. However, if any governmental body or regulatory body should adopt new laws, rules or regulationswhich would require amendment or supplement of the deposit agreement or any receipt to ensure compliance therewith, Teva and the depositary may amend orsupplement the deposit agreement and the receipts at any time in accordance with such changed laws, rules or regulations. Such amendment or supplement tothe deposit agreement in such circumstances may become effective before a notice of such amendment or supplement is given to owners or within any otherperiod of time as required for compliance.
126

Table of Contents
Whenever so directed by Teva, the depositary has agreed to terminate the deposit agreement by mailing notice of such termination to the holders of allADSs then outstanding at least 30 days prior to the date fixed in such notice for such termination. The depositary may likewise terminate the deposit agreementby mailing notice of such termination to Teva and the holders of all ADSs then outstanding if at any time 60 days shall have expired after the depositary shallhave delivered to Teva a written notice of its election to resign and a successor depositary shall not have been appointed and accepted its appointment.
If any ADSs remain outstanding after the date of termination, the depositary thereafter will discontinue the registration of transfers of ADSs, willsuspend the distribution of dividends to the holders and will not give any further notices or perform any further acts under the deposit agreement, except:
• the collection of dividends and other distributions;
• the sale of rights and other property; and
• the delivery of ordinary shares, together with any dividends or other distributions received with respect thereto and the net proceeds of the sale of
any rights or other property, in exchange for surrendered ADSs, subject to the terms of the deposit agreement.
At any time after the expiration of one year from the date of termination, the depositary may sell the underlying ordinary shares and hold uninvested thenet proceeds, together with any cash then held by it under the deposit agreement, unsegregated and without liability for interest, for the pro rata benefit of theholders of ADSs that have not theretofore surrendered their ADSs, and such holders shall become general creditors of the depositary with respect to such netproceeds. After making such sale, the depositary shall be discharged from all obligations under the deposit agreement, except to account for net proceeds andother cash (after deducting fees of the depositary) and except for obligations for indemnification set forth in the deposit agreement. Upon the termination of thedeposit agreement, Teva will also be discharged from all obligations thereunder, except for certain obligations to the depositary.
Charges of DepositaryTeva will pay the fees and out-of-pocket expenses of the depositary and those of any registrar only in accordance with agreements in writing entered into
between the depositary and Teva from time to time. The following charges shall be incurred by any party depositing or withdrawing ordinary shares or by anyparty surrendering ADSs or to whom ADSs are issued (including, without limitation, issuance pursuant to a stock dividend or stock split declared by Teva oran exchange of stock regarding the ADSs or deposited ordinary shares or a distribution of ADSs pursuant to the terms of the deposit agreement):
• any applicable taxes and other governmental charges;
• any applicable transfer or registration fees;
• certain cable, telex and facsimile transmission charges as provided in the deposit agreement;
• any expenses incurred in the conversion of foreign currency;
• a fee of $5.00 or less per 100 ADSs (or a portion of such amount of ADSs) for the delivery of ADSs in connection with the deposit of ordinary
shares, distributions in ordinary shares on the surrender of ADSs or the distribution of rights on the ordinary shares;
• a fee of $0.02 or less per ADS for any cash distributions on the ordinary shares;
• a fee of $5.00 or less per 100 ADSs (or a portion of such amount of ADSs) for the distribution of securities on the ordinary shares (other than
ordinary shares or rights thereon); and
• a fee $0.02 or less per ADS annually for depositary services performed by the depositary and/or the custodian (which may be charged directly to
the owners or which may be withheld from cash distributions, at the sole discretion of the depositary).
The depositary may own and deal in any class of securities of Teva and its affiliates and in ADSs.
127

Table of Contents
Transfer of American Depositary SharesThe ADSs are transferable on the books of the depositary, except during any period when the transfer books of the depositary are closed, or if any such
action is deemed necessary or advisable by the depositary or Teva at any time or from time to time because of any requirement of law or of any government orgovernmental body or commission or under any provision of the deposit agreement. The surrender of outstanding ADSs and withdrawal of deposited ordinaryshares may not be suspended subject only to:
• temporary delays caused by closing the transfer books of the depositary or Teva, the deposit of ordinary shares in connection with voting at a
shareholders’ meeting or the payment of dividends;
• the payment of fees, taxes and similar charges; and
• compliance with the U.S. or foreign laws or governmental regulations relating to the ADSs or to the withdrawal of the deposited ordinary shares.
The depositary shall not knowingly accept for deposit under the deposit agreement any ordinary shares required to be registered under the provisions ofthe Securities Act, unless a registration statement is in effect as to such ordinary shares. As a condition to the delivery, registration of transfer, split-up,combination or surrender of any ADS or withdrawal of ordinary shares, the depositary, the custodian or the registrar may require payment from the personpresenting the ADS or the depositor of the ordinary shares of a sum sufficient to reimburse it for any tax or other governmental charge and any stock transferor registration fee with respect thereto, payment of any applicable fees payable by the holders of ADSs, may require the production of proof satisfactory to thedepositary as to the identity and genuineness of any signature and may also require compliance with any regulations the depositary may establish consistentwith the provisions of the deposit agreement. The depositary may refuse to deliver ADSs, register the transfer of any ADS or make any distribution on, orrelated to, ordinary shares until it or the custodian has received proof of citizenship or residence, exchange control approval or other information as it maydeem necessary or proper. Holders of ADSs may inspect the transfer books of the depositary at any reasonable time, provided, that such inspection shall notbe for the purpose of communicating with holders of ADSs in the interest of a business or object other than Teva’s business or a matter related to the depositagreement or ADSs.
GeneralNeither the depositary nor Teva nor any of their respective directors, employees, agents or affiliates will be liable to the holders of ADSs if any present or
future law, rule, or regulation of the United States, Israel or any other country or of any governmental or regulatory authority or any securities exchange ormarket or automated quotation system, the provisions of or governing any deposited securities, any present or future provision of Teva’s memorandum andarticles of association, any act of God, war, terrorism or other circumstance beyond its control shall prevent or delay or shall cause any of them to be subjectto any civil or criminal charges in connection with any act which the deposit agreement or a receipt provides shall be done or performed by it or them or byreason of any exercise or failure to exercise any discretion given it in the deposit agreement or a receipt. The deposit agreement contains certain additionallimitations of the depositary’s liability. The obligations of Teva and the depositary under the deposit agreement are expressly limited to performing theirobligations specifically set forth in the deposit agreement without negligence, bad faith or willful misconduct.
128

Table of Contents
PART II ITEM 15: CONTROLS AND PROCEDURES
(a) Disclosure Controls and Procedures. Teva’s chief executive officer and chief financial officer, after evaluating the effectiveness of Teva’sdisclosure controls and procedures (as defined in Exchange Act Rule 13a-15(e)) as of the end of the period covered by this annual report, have concluded that,as of such date, Teva’s disclosure controls and procedures were effective to ensure that the information required in the reports that it files or submits under theExchange Act is recorded, processed, summarized and reported, within the time periods specified in the SEC’s rules and forms, and such information isaccumulated and communicated to its management, including its chief executive officer and chief financial officer, as appropriate to allow timely decisionsregarding required disclosure.
(b) Report of Teva Management on Internal Control over Financial Reporting . Teva’s board of directors and management are responsible forestablishing and maintaining adequate internal control over financial reporting. Teva’s internal control system was designed to provide reasonable assurance toTeva’s management and board of directors regarding the reliability of financial reporting and the preparation and fair presentation of its published consolidatedfinancial statements.
Because of its inherent limitations, internal control over financial reporting may not prevent or detect misstatements. Also, projections of any evaluationof effectiveness to future periods are subject to the risk that controls may become inadequate because of changes in conditions, or that the degree of compliancewith the policies or procedures may deteriorate.
Teva’s management assessed the effectiveness of the Company’s internal control over financial reporting as of December 31, 2012. In making thisassessment, it used the criteria established in Internal Control—Integrated Framework issued by the Committee of Sponsoring Organizations of the TreadwayCommission (COSO). Based on such assessment, management has concluded that, as of December 31, 2012, Teva’s internal control over financial reportingis effective based on those criteria.
(c) Attestation Report of the Registered Public Accounting Firm . Teva’s internal control over financial reporting as of December 31, 2012 has beenaudited by Kesselman & Kesselman, an independent registered public accounting firm in Israel and a member of PricewaterhouseCoopers InternationalLimited (“PwC”), as stated in their report which is included under “Item 18—Financial Statements” on page F-2 of this annual report.
(d) Changes in Internal Control over Financial Reporting . There were no changes to Teva’s internal control over financial reporting that occurredduring the period covered by this annual report that have materially affected, or are reasonably likely to materially affect, Teva’s internal control over financialreporting. ITEM 16: [RESERVED] ITEM 16A: AUDIT COMMITTEE FINANCIAL EXPERTS
Teva’s Board of Directors has determined that Prof. Dafna Schwartz, Mr. Joseph Nitzani and Mr. Erez Vigodman, members of its audit committee, are“audit committee financial experts”, as defined by applicable SEC regulations, and are independent in accordance with applicable SEC and NYSEregulations. ITEM 16B: CODE OF ETHICS
Teva has adopted a code of business conduct applicable to its directors, executive officers, and all other employees. A copy of the code is available toevery Teva employee on Teva’s intranet site, upon request to its human resources department, and to investors and others on Teva’s website athttp://www.tevapharm.com or by
129

Table of Contents
contacting Teva’s investor relations department, legal department or the internal auditor. Any waivers of this code for executive officers or directors will bedisclosed through the filing of a current report on Form 6-K or on Teva’s website. The Board has approved a whistleblower policy which functions incoordination with Teva’s code of business conduct and provides an anonymous means for employees and others to communicate with various bodies of Teva,including the audit committee. Teva has also implemented a training program for new and existing employees concerning the code of business conduct andwhistleblower policy. ITEM 16C: PRINCIPAL ACCOUNTANT FEES AND SERVICES
Policy on Pre-Approval of Audit and Non-Audit Services of Independent AuditorsTeva’s audit committee is responsible for overseeing its independent auditors’ work. The audit committee’s policy is to pre-approve all audit and non-
audit services provided by PwC and other members of PricewaterhouseCoopers International Limited. These services may include audit services, audit-relatedservices, tax services and other services, as further described below. The audit committee sets forth the basis for its pre-approval in detail, listing the particularservices or categories of services which are pre-approved, and setting forth a specific budget for such services. Additional services may be pre-approved by theaudit committee on an individual basis. Once services have been pre-approved, PwC and management then report to the audit committee on a periodic basisregarding the extent of services actually provided in accordance with the applicable pre-approval, and regarding the fees for the services performed. Such feesfor 2012 and 2011 were pre-approved by the audit committee in accordance with these procedures.
Principal Accountant Fees and ServicesTeva paid the following fees for professional services rendered by PwC and other members of PricewaterhouseCoopers International Limited, for the
years ended December 31:
2012 2011 (U.S. $ in thousands) Audit Fees $11,949 $12,981 Audit-Related Fees 1,125 2,122 Tax Fees 7,700 7,504 All Other Fees 1,342 1,357
Total $22,116 $ 23,964
The audit fees for the years ended December 31, 2012 and 2011 were for professional services rendered for the integrated audit of Teva’s annualconsolidated financial statements and its internal control over financial reporting as of December 31, 2012 and 2011, review of consolidated quarterlyfinancial statements, statutory audits of Teva and its subsidiaries, issuance of comfort letters, consents and assistance with review of documents filed withthe SEC.
The audit-related fees for the years ended December 31, 2012 and 2011 were for services in respect of due diligence related to mergers and acquisitions,accounting consultations and audits in connection with acquisitions, employee benefit plan audits, internal control reviews, attest services that are not requiredby statute or regulation and consultations concerning financial accounting and reporting standards.
Tax fees for the years ended December 31, 2012 and 2011 were for services related to tax compliance, including the preparation of tax returns and claimsfor refund, and tax planning and tax advice, including assistance with tax audits and appeals, advice related to mergers and acquisitions, tax services foremployee benefit plans and assistance with respect to requests for rulings from tax authorities.
All other fees for the years ended December 31, 2012 and 2011 were for general guidance related to accounting issues, the purchase of accountingsoftware and human resources benchmarking software and providing assistance in respect of a risk management program relating to one of the Company’sproducts.
130

Table of Contents
ITEM 16D: EXEMPTIONS FROM THE LISTING STANDARDS FOR AUDIT COMMITTEESNot Applicable.
ITEM 16E: PURCHASES OF EQUITY SECURITIES BY THE ISSUER AND AFFILIATED PURCHASERS
On December 21, 2011, our Board of Directors authorized us to repurchase up to an aggregate amount of $3 billion of our ordinary shares/ADSs. Therepurchase program has no time limit and is expected to be completed over a three-year period. As of the end of 2012, we repurchased shares and ADSs for anaggregate amount of $1.2 billion, so that the outstanding amount available for purchase under this program is $1.83 billion.
Set forth below is a summary of the shares repurchased by us during 2012 under the December 2011 program, and the approximate dollar value ofsecurities that may yet be purchased under this program:
Number of sharespurchased during
the month(in thousands)
Average price paid pershare (U.S. dollars)
Total number ofshares purchased
(in thousands)
Approximatedollar value of
securities remainingthat may be
purchased(in millions)
February 2012 6,573 $ 44.60 6,573 $ 2,707 March 2012 5,358 $ 44.75 11,931 $ 2,467 May 2012 2,386 $ 38.98 14,317 $ 2,374 June 2012 1,061 $ 38.28 15,378 $ 2,333 December 2012 12,726 $ 39.58 28,104 $ 1,829
Total 28,104 $ 41.64 28,104 $ 1,829
ITEM 16F: CHANGE IN REGISTRANT’S CERTIFYING ACCOUNTANT
Not Applicable. ITEM 16G: CORPORATE GOVERNANCE
Teva complies with all corporate governance standards applicable to Teva under Israeli, U.S., SEC and NYSE laws and regulations. ITEM 16H: MINE SAFETY DISCLOSURE
Not Applicable.
131

Table of Contents
PART III ITEM 17: FINANCIAL STATEMENTS
See “Item 18—Financial Statements.” ITEM 18: FINANCIAL STATEMENTS
The following financial statements are filed as part of this annual report on Form 20-F: Page REPORT OF INDEPENDENT REGISTERED PUBLIC ACCOUNTING FIRM F-2
CONSOLIDATED FINANCIAL STATEMENTS:
Statements of income F-4
Statements of comprehensive income F-5
Balance sheets F-6
Statements of changes in equity F-7
Statements of cash flows F-8
Notes to consolidated financial statements F-10
132

Table of Contents
ITEM 19: EXHIBITS
1.1 Memorandum of Association (1)(2)
1.2 Amendment to Memorandum of Association (1)(3)
1.3 Articles of Association (1)(4)
2.1
Amended and Restated Deposit Agreement, dated November 5, 2012, among Teva Pharmaceutical Industries Limited, JPMorgan Chase BankN.A., as depositary, and the holders from time to time of shares (5)
2.2 Form of American Depositary Receipt (5)
2.3
Senior Indenture, dated as of January 31, 2006, by and among Teva Pharmaceutical Finance Company LLC, Teva Pharmaceutical IndustriesLimited and The Bank of New York, as Trustee (6)
2.4
First Supplemental Senior Indenture, dated as of January 31, 2006, by and among Teva Pharmaceutical Finance Company LLC, TevaPharmaceutical Industries Limited and The Bank of New York, as Trustee (6)
2.5
Second Supplemental Senior Indenture, dated as of January 31, 2006, by and among Teva Pharmaceutical Finance Company LLC, TevaPharmaceutical Industries Limited and The Bank of New York, as Trustee (6)
2.6 Form of Global Debentures (included in Exhibits 2.4 and 2.5)
2.7
Senior Indenture, dated as of June 18, 2010, by and among Teva Pharmaceutical Finance II B.V., Teva Pharmaceutical Industries Limited andThe Bank of New York Mellon, as Trustee (7)
2.8
First Supplemental Senior Indenture, dated as of June 18, 2010, by and among Teva Pharmaceutical Finance II B.V., Teva PharmaceuticalIndustries Limited and The Bank of New York Mellon, as Trustee (7)
2.9 Form of Global Notes (included in Exhibit 2.8)
2.10
Senior Indenture, dated as of March 21, 2011, by and among Teva Pharmaceutical Finance III B.V., Teva Pharmaceutical Industries Limitedand The Bank of New York Mellon (8)
2.11
First Supplemental Senior Indenture, dated as of March 21, 2011, by and among Teva Pharmaceutical Finance III B.V., Teva PharmaceuticalIndustries Limited and The Bank of New York Mellon (8)
2.12 Form of Global Notes (included in Exhibit 2.11)
2.13
Senior Indenture, dated as of November 10, 2011, by and among Teva Pharmaceutical Finance IV, LLC, Teva Pharmaceutical IndustriesLimited and The Bank of New York Mellon (9)
2.14
First Supplemental Senior Indenture, dated as of November 10, 2011, by and among Teva Pharmaceutical Finance IV, LLC, TevaPharmaceutical Industries Limited and The Bank of New York Mellon (9)
2.15 Forms of Global Notes (included in Exhibit 2.14)
2.16
Second Supplemental Senior Indenture, dated as of December 18, 2012, by and among Teva Pharmaceutical Finance IV, LLC, TevaPharmaceutical Industries Limited and The Bank of New York Mellon (10)
2.17 Form of Global Notes (Included in Exhibit 2.16)
2.18
Senior Indenture, dated as of November 10, 2011, by and among Teva Pharmaceutical Finance Company B.V., Teva PharmaceuticalIndustries Limited and The Bank of New York Mellon (9)
133
Table of Contents
2.19
First Supplement Senior Indenture, dated as of November 10, 2011, by and among Teva Pharmaceutical Finance Company B.V., TevaPharmaceutical Industries Limited and The Bank of New York Mellon (9)
2.20 Forms of Global Notes (included in Exhibit 2.19)
2.21
Second Supplemental Senior Indenture, dated as of December 18, 2012, by and among Teva Pharmaceutical Finance Company B.V., TevaPharmaceutical Industries Limited and The Bank of New York Mellon (10)
2.22 Forms of Global Notes (included in Exhibit 2.21)
2.23
Senior Indenture, dated as of November 10, 2011, by and among Teva Pharmaceutical Finance IV B.V., Teva Pharmaceutical IndustriesLimited and The Bank of New York Mellon (9)
2.24
First Supplemental Senior Indenture, dated as of November 10, 2011, by and among Teva Pharmaceutical Finance IV B.V., TevaPharmaceutical Industries Limited and The Bank of New York Mellon (9)
2.25 Form of Global Notes (included in Exhibit 2.24)
2.26
Second Supplemental Senior Indenture, dated as of April 4, 2012, by and among Teva Pharmaceutical Finance IV B.V, Teva PharmaceuticalIndustries Limited and The Bank of New York Mellon (11)
2.27 Form of Global Notes (included in Exhibit 2.25)
2.28 Permanent Global Certificate, dated as of April 25, 2012 and the Terms of the CHF 450,000,000 1.5% Notes due 2018 (12)
2.29 Guarantee, dated as of April 25, 2012, by Teva Pharmaceutical Industries Limited (12)
2.30
Amended and Restated Senior Unsecured Revolving Credit Agreement dated as of June 13, 2011 among Teva Pharmaceutical IndustriesLimited, Teva Pharmaceuticals USA, Inc., Teva Finance Services B.V., Teva Finance Services II B.V. and Teva Capital ServicesSwitzerland GmbH, as borrowers, Citibank, N.A., as administrative agent and HSBC Bank PLC, as documentation agent, the Lendersparty thereto (13)
2.31
Senior Unsecured Fixed Rate Japanese Yen Term Loan Credit Agreement dated as of March 28, 2012 among Teva Pharmaceutical IndustriesLimited, as guarantor, Teva Holdings GK, as initial borrower, Sumitomo Mitsui Banking Corporation, as administrative agent and theLenders party thereto (14)
2.32
Senior Unsecured Revolving Credit Agreement dated as of December 18, 2012 among Teva Pharmaceutical Industries Limited, TevaPharmaceuticals USA, Inc., Teva Finance Services B.V., Teva Finance Services II B.V. and Teva Capital Services Switzerland GMBH, asborrowers, Citibank, N.A., as administrative agent and HSBC Bank PLC, as documentation agent and the Lenders party thereto (15)
2.33
Other long-term debt instruments: The registrant hereby undertakes to provide the Securities and Exchange Commission with copies uponrequest.
8 Subsidiaries of the Registrant
10 Consent of Kesselman & Kesselman
12(i) Certification of the Chief Executive Officer pursuant to Section 302 of the Sarbanes-Oxley Act of 2002
12(ii) Certification of the Chief Financial Officer pursuant to Section 302 of the Sarbanes-Oxley Act of 2002
134

Table of Contents
13
Certification of the Chief Executive Officer and Chief Financial Officer pursuant to 18 U.S.C. Section 1350, as adopted pursuant to Section 906of the Sarbanes-Oxley Act of 2002
101
The following financial information from Teva Pharmaceutical Industries Limited’s Annual Report on Form 20-F for the year ended December 31,2012 formatted in XBRL (eXtensible Business Reporting Language): (i) Consolidated Statements of Income for the years ended December 31,2012, 2011 and 2010; (ii) Consolidated Balance Sheets at December 31, 2012 and 2011; (iii) Consolidated Statements of Changes in Equity forthe years ended December 31, 2012, 2011 and 2010; (iv) Consolidated Statements of Cash Flows for the years ended December 31, 2012, 2011and 2010; and (v) Notes to Consolidated Financial Statements, tagged as blocks of text. Users of this data are advised, in accordance with Rule406T of Regulation S-T promulgated by the Securities and Exchange Commission, that this Interactive Data File is deemed not filed or part of aregistration statement or prospectus for purposes of sections 11 or 12 of the Securities Act of 1933, is deemed not filed for purposes of section 18of the Securities Exchange Act of 1934, and otherwise is not subject to liability under these sections.
1. English translation or summary from Hebrew original, which is the official version.2. Incorporated by reference to Exhibit 3.1 to Teva’s Registration Statement on Form F-1 (Reg. No. 33-15736).3. Incorporated by reference to Teva’s Form 6-K filed on July 28, 2011.4. Incorporated by reference to Teva’s Form 6-K filed on November 1, 2012.5. Incorporated by reference to Teva’s Registration Statement on Form F-6 (Reg. No. 333-184652).6. Incorporated by reference to Teva’s Registration Statement on Form 6-K filed on January 31, 2006.7. Incorporated by reference to Teva’s Form 6-K filed on June 18, 2010.8. Incorporated by reference to Teva’s Form 6-K filed on March 21, 2011.9. Incorporated by reference to Teva’s Form 6-K filed on November 10, 2011.10. Incorporated by reference to Teva’s Form 6-K filed on December 18, 2012.11. Incorporated by reference to Teva’s Form 6-K filed on April 4, 2012.12. Incorporated by reference to Teva’s Form 6-K filed on April 25, 2012.13. Incorporated by reference to Teva’s Form 6-K filed on July 28, 2011.14. Incorporated by reference to Teva’s Form 6-K filed on May 9, 2012.15. Incorporated by reference to Teva’s Form 6-K filed on December 20, 2012.
135

Table of Contents
SIGNATURES
The registrant hereby certifies that it meets all of the requirements for filing on Form 20-F and that it has duly caused and authorized the undersigned tosign this annual report on its behalf.
TEVA PHARMACEUTICAL INDUSTRIES LIMITED
By: /s/ EYAL DESHEH Name: Eyal DeshehTitle: Chief Financial Officer
Date: February 12, 2013
136

Table of Contents
TEVA PHARMACEUTICAL INDUSTRIES LIMITEDCONSOLIDATED FINANCIAL STATEMENTSFOR THE YEAR ENDED DECEMBER 31, 2012
Page REPORT OF INDEPENDENT REGISTERED PUBLIC ACCOUNTING FIRM F-2
CONSOLIDATED FINANCIAL STATEMENTS:
Statements of income F-4
Statements of comprehensive income F-5
Balance sheets F-6
Statements of changes in equity F-7
Statements of cash flows F-8
Notes to consolidated financial statements F-10
F-1

Table of Contents
REPORT OF INDEPENDENT REGISTERED PUBLIC ACCOUNTING FIRM
To the Shareholders ofTEVA PHARMACEUTICAL INDUSTRIES LIMITED
We have completed integrated audits of Teva Pharmaceutical Industries Limited’s (the “Company”) consolidated financial statements and of its internalcontrol over financial reporting as of December 31, 2012, in accordance with the standards of the Public Company Accounting Oversight Board (UnitedStates). Our opinions, based on our integrated audits, are presented below.
Consolidated financial statementsWe have audited the consolidated balance sheets of Teva Pharmaceutical Industries Limited and its subsidiaries as of December 31, 2012 and 2011 and
the related consolidated statements of income, of comprehensive income, of changes in equity and of cash flows for each of the three years in the period endedDecember 31, 2012.
These consolidated financial statements are the responsibility of the Company’s Board of Directors and management. Our responsibility is to express anopinion on these financial statements based on our integrated audits.
We conducted our audits in accordance with auditing standards of the Public Company Accounting Oversight Board (United States). Those standardsrequire that we plan and perform the audit to obtain reasonable assurance about whether the consolidated financial statements are free of material misstatement.An audit includes examining, on a test basis, evidence supporting the amounts and disclosures in the consolidated financial statements. An audit also includesassessing the accounting principles used and significant estimates made by the Company’s Board of Directors and management, as well as evaluating theoverall financial statement presentation. We believe that our audits provide a reasonable basis for our opinion.
In our opinion, the consolidated financial statements referred to above, present fairly, in all material respects, the financial position of TevaPharmaceutical Industries Limited and its subsidiaries at December 31, 2012 and 2011, and the results of their operations, changes in comprehensive income,changes in equity and their cash flows for each of the three years in the period ended December 31, 2012, in conformity with accounting principles generallyaccepted in the United States of America.
Internal control over financial reportingAlso, in our opinion, the Company maintained, in all material respects, effective internal control over financial reporting as of December 31, 2012,
based on criteria established in Internal Control-Integrated Framework issued by the Committee of Sponsoring Organizations of the Treadway Commission(COSO).
The Company’s Board of Directors and management are responsible for maintaining effective internal control over financial reporting and managementis responsible for the assessment of the effectiveness of internal control over financial reporting included in the accompanying ‘‘ Report of Teva Managementon Internal Control Over Financial Reporting ’’ appearing under Item 15(b). Our responsibility is to express an opinion on the effectiveness of theCompany’s internal control over financial reporting based on our integrated audit. We conducted our audit in accordance with the standards of the PublicCompany Accounting Oversight Board (United States). Those standards require that we plan and perform the audit to obtain reasonable assurance aboutwhether effective internal control over financial reporting was maintained in all material respects. Our audit of internal control over financial reporting includesobtaining an understanding of internal control over financial reporting, assessing the risk that a material weakness exists and testing and evaluating the designand operating
F-2

Table of Contents
effectiveness of internal control based on the assessed risk. Our audit also includes performing such other procedures as we consider necessary in thecircumstances. We believe that our audit provides a reasonable basis for our opinion.
A company’s internal control over financial reporting is a process designed to provide reasonable assurance regarding the reliability of financial reportingand the preparation of financial statements for external purposes in accordance with generally accepted accounting principles. A company’s internal controlover financial reporting includes those policies and procedures that (i) pertain to the maintenance of records that, in reasonable detail, accurately and fairlyreflect the transactions and dispositions of the assets of the company; (ii) provide reasonable assurance that transactions are recorded as necessary to permitpreparation of financial statements in accordance with generally accepted accounting principles, and that receipts and expenditures of the company are beingmade only in accordance with authorizations of management and directors of the company; and (iii) provide reasonable assurance regarding prevention ortimely detection of unauthorized acquisition, use, or disposition of the company’s assets that could have a material effect on the financial statements.
Because of its inherent limitations, internal control over financial reporting may not prevent or detect misstatements. Also, projections of any evaluationof effectiveness to future periods are subject to the risk that controls may become inadequate because of changes in conditions, or that the degree of compliancewith the policies or procedures may deteriorate. Tel-Aviv, IsraelFebruary 12, 2013
/s/ Kesselman & KesselmanCertified Public Accountants (Isr.)
A member of PricewaterhouseCoopersInternational Limited
F-3

Table of Contents
TEVA PHARMACEUTICAL INDUSTRIES LIMITEDCONSOLIDATED STATEMENTS OF INCOME
(U.S. dollars in millions, except share and per share data) Year ended December 31, 2012 2011 2010 Net revenues $ 20,317 $18,312 $16,121 Cost of sales 9 ,665 8,797 7,056 Gross profit 10,652 9,515 9,065 Research and development expenses—net 1,356 1,095 951 Selling and marketing expenses 3,879 3,478 2,968 General and administrative expenses 1,238 932 865 Impairments, loss contingencies, restructuring and others—net 1,974 901 410 Operating income 2,205 3,109 3,871 Financial expenses—net 386 153 225 Income before income taxes 1,819 2,956 3,646 Provision for income taxes (137) 127 283 Share in losses of associated companies—net 46 61 24 Net income 1,910 2,768 3,339 Net income (loss) attributable to non-controlling interests (53) 9 8 Net income attributable to Teva $ 1,963 $ 2,759 $ 3,331 Earnings per share attributable to Teva:
Basic $ 2.25 $ 3.10 $ 3.72 Diluted $ 2.25 $ 3.09 $ 3.67
Weighted average number of shares (in millions): Basic 872 890 896 Diluted 873 893 921
The accompanying notes are an integral part of the financial statements.
F-4

Table of Contents
TEVA PHARMACEUTICAL INDUSTRIES LIMITEDCONSOLIDATED STATEMENTS OF COMPREHENSIVE INCOME
(U.S. dollars in millions) Year ended December 31, 2012 2011 2010 Net income $ 1,910 $2,768 $ 3,339 Other comprehensive income (loss), net of tax:
Currency translation adjustment 632 (844) (145) Unrealized gain (loss) on derivative financial instruments (63) 40 (70) Unrealized gain (loss) from available-for-sale securities 6 5 (115) 37 Other (60) (23) (27)
Total other comprehensive income (loss) 574 (942) (205) Total comprehensive income 2,484 1,826 3,134 Comprehensive income (loss) attributable to the non-controlling interests (51) 6 8 Comprehensive income attributable to Teva 2,535 1,820 3,126
The accompanying notes are an integral part of the financial statements.
F-5
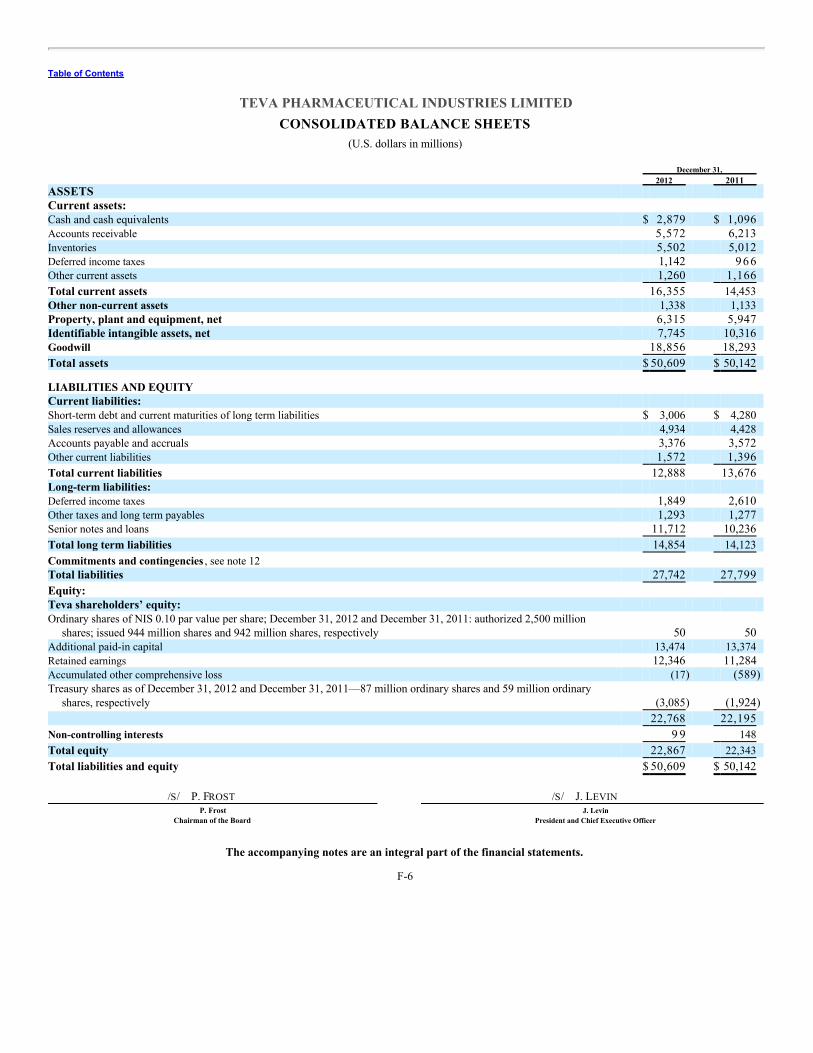
Table of Contents
TEVA PHARMACEUTICAL INDUSTRIES LIMITEDCONSOLIDATED BALANCE SHEETS
(U.S. dollars in millions) December 31, 2012 2011 ASSETS Current assets: Cash and cash equivalents $ 2,879 $ 1,096 Accounts receivable 5,572 6,213 Inventories 5,502 5,012 Deferred income taxes 1,142 9 6 6 Other current assets 1,260 1,166 Total current assets 16,355 14,453 Other non-current assets 1,338 1,133 Property, plant and equipment, net 6,315 5,947 Identifiable intangible assets, net 7,745 10,316 Goodwill 18,856 18,293 Total assets $ 50,609 $ 50,142
LIABILITIES AND EQUITY Current liabilities: Short-term debt and current maturities of long term liabilities $ 3,006 $ 4,280 Sales reserves and allowances 4,934 4,428 Accounts payable and accruals 3,376 3,572 Other current liabilities 1,572 1,396 Total current liabilities 12,888 13,676 Long-term liabilities: Deferred income taxes 1,849 2,610 Other taxes and long term payables 1,293 1,277 Senior notes and loans 11,712 10,236 Total long term liabilities 14,854 14,123 Commitments and contingencies , see note 12 Total liabilities 27,742 27,799 Equity: Teva shareholders’ equity: Ordinary shares of NIS 0.10 par value per share; December 31, 2012 and December 31, 2011: authorized 2,500 million
shares; issued 944 million shares and 942 million shares, respectively 50 50 Additional paid-in capital 13,474 13,374 Retained earnings 12,346 11,284 Accumulated other comprehensive loss (17) (589) Treasury shares as of December 31, 2012 and December 31, 2011—87 million ordinary shares and 59 million ordinary
shares, respectively (3,085) (1,924) 22,768 22,195
Non-controlling interests 9 9 148 Total equity 22,867 22,343 Total liabilities and equity $ 50,609 $ 50,142
/S/ P. FROST /S/ J. LEVIN P. Frost J. Levin
Chairman of the Board President and Chief Executive Officer
The accompanying notes are an integral part of the financial statements.
F-6

Table of Contents
TEVA PHARMACEUTICAL INDUSTRIES LIMITEDCONSOLIDATED STATEMENTS OF CHANGES IN EQUITY
Teva shareholders’ equity Ordinary shares
Number ofshares
(in millions) Statedvalue
Additionalpaid-incapital
Retainedearnings
Accumulatedother
compre-hensiveincome(loss)
Treasuryshares
TotalTeva’sshare-
holders’equity
Non-controlling
interests Total
equity (U.S. dollars in millions) Balance at January 1, 2010 923 $ 49 $12,880 $ 6,662 $ 5 5 5 $ (924) $ 19,222 $ 37 $19,259 Changes during 2010: Comprehensive income 3,331 (205) 3,126 8 3,134 Conversion of convertible senior debentures 3 * 92 92 92 Exercise of options and RSUs by employees 7 * 180 180 180 Stock-based compensation expense 80 80 80 Dividends (668) (668) (5) (673) Acquisition of non-controlling interests — 15 15 Treasury shares (99) (99) (99) Other 4 * 14 14 14 Balance at December 31, 2010 937 49 13,246 9,325 350 (1,023) 21,947 5 5 22,002 Changes during 2011: Comprehensive income 2,759 (939) 1,820 6 1,826 Exercise of options and RSUs by employees 3 * 71 71 71 Conversion of convertible senior debentures 2 * 12 12 12 Stock-based compensation expense 91 91 91 Dividends (800) (800) (800) Non-controlling interests arising from business
combinations 129 129 Acquisition of non-controlling interests (55) (55) (20) (75) Disposition of non-controlling interests (15) (15) Treasury shares (901) (901) (901) Other * 1 9 10 (7) 3 Balance at December 31, 2011 942 50 13,374 11,284 (589) (1,924) 22,195 148 22,343 Changes during 2012: Comprehensive income 1,963 572 2,535 (51) 2,484 Exercise of options and RSUs by employees 2 * 14 14 14 Stock-based compensation expense 82 82 82 Dividends (901) (901) (901) Treasury shares (1,161) (1,161) (1,161) Other * * 4 4 2 6 Balance at December 31, 2012 944 $ 50 $ 13,474 $12,346 $ (17) $ (3,085) $ 22,768 $ 9 9 $ 22,867
*Represents an amount of less than 0.5 million.
The accompanying notes are an integral part of the financial statements.
F-7

Table of Contents
TEVA PHARMACEUTICAL INDUSTRIES LIMITEDCONSOLIDATED STATEMENTS OF CASH FLOWS
(U.S. dollars in millions) Year ended December 31, 2012 2011 2010 Operating activities: Net income $ 1,910 $ 2,768 $ 3,339 Adjustments to reconcile net income to net cash provided by operations: Depreciation and amortization 1,708 1,069 977 Impairment of long lived assets 1,071 201 124 Deferred income taxes—net and uncertain tax positions (690) (500) (199) Net change in operating assets and liabilities 414 594 (205) Stock-based compensation 82 91 80 Research and development in process 73 15 18 Gain from sale of long lived assets and investments (3) (72) (55) Gain from revaluation of investments — (135) — Other non-cash items 7 103 57 Net cash provided by operating activities 4,572 4,134 4,136
Investing activities: Purchases of property, plant and equipment (1,104) (1,053) (710) Proceeds from sales of long lived assets and investments 264 279 700 Purchases of investments and other assets (201) (217) (436) Acquisitions of subsidiaries, net of cash acquired — (6,561) (4,951) Other investing activities (93) (49) (58) Net cash used in investing activities (1,134) (7,601) (5,455)
Financing activities: Proceeds from senior notes—net 3,783 5,723 2,492 Net change in short-term credit (2,492) (124) 626 Repayment of long-term loans and other long-term liabilities (2,213) (751) (1,972) Proceeds from long-term loans and other long-term liabilities 1,241 1,000 45 Purchases of treasury shares (1,161) (899) (99) Dividends paid (855) (800) (668) Proceeds from exercise of options by employees 14 71 180 Redemption of convertible debentures — (814) (45) Purchase of non-controlling interest — (75) — Other financing activities 5 5 14 Net cash provided by (used in) financing activities (1,678) 3,336 573 Translation adjustment on cash and cash equivalents 23 (21) (1) Net change in cash and cash equivalents 1,783 (152) (747) Balance of cash and cash equivalents at beginning of year 1,096 1,248 1,995 Balance of cash and cash equivalents at end of year $ 2,879 $ 1,096 $ 1,248
The accompanying notes are an integral part of the financial statements.
F-8

Table of Contents
TEVA PHARMACEUTICAL INDUSTRIES LIMITEDCONSOLIDATED STATEMENTS OF CASH FLOWS (Continued)
(U.S. dollars in millions) Supplemental disclosure of cash flow information: Year ended December 31, 2012 2011 2010 Interest paid $ 297 $ 230 $ 186 Income taxes paid, net of refunds $ 614 $ 276 $ 354
Net change in operating assets and liabilities: Year ended December 31, 2012 2011 2010 Accounts receivable net of sales reserves and allowances $ 936 $ 701 $ 5 5 Inventories (511) (762) (124) Inventory step-up 62 352 108 Other current assets (54) (240) 51 Accounts payable and accruals and other current liabilities (19) 543 (295)
$ 414 $ 594 $ (205)
As disclosed in note 11, in 2012, 2011 and 2010, $0.3 million, $12 million and $136 million, respectively, principal amount of convertible seniordebentures were converted into approximately 9 thousand, 2 million and 3 million Teva shares, respectively.
The accompanying notes are an integral part of the financial statements.
F-9

Table of Contents
TEVA PHARMACEUTICAL INDUSTRIES LIMITEDNotes To Consolidated Financial Statements
NOTE 1—SIGNIFICANT ACCOUNTING POLICIES: a . General:
OperationsTeva Pharmaceutical Industries Limited (the “Parent Company”), headquartered in Israel, together with its subsidiaries and associated companies (the
“Company”, “Teva” or the “Group”), is engaged in the development, manufacturing, marketing and distribution of pharmaceuticals. The majority of theGroup’s revenues are in the United States and Europe. The Group’s main manufacturing facilities are located in Israel, Hungary, United States, Germany,Canada, Japan, Ireland, the United Kingdom, the Czech Republic, Croatia and Poland.
Accounting principlesThe consolidated financial statements are prepared in accordance with accounting principles generally accepted in the United States (“US GAAP”).
Functional currencyA major part of the Group’s operations is carried out by the Company and its subsidiaries in the United States and Israel. The functional currency of
these entities is the U.S. dollar (“dollar” or “$”).
The functional currency of certain subsidiaries and associated companies is their local currency. The financial statements of those companies areincluded in consolidation, based on translation into U.S. dollars. Assets and liabilities are translated at year-end exchange rates, while revenues and expensesare translated at monthly average exchange rates during the year. Differences resulting from translation are presented in the consolidated statements ofcomprehensive income.
The financial statements of subsidiaries in a highly inflationary economy are remeasured as if the functional currency was the U.S. dollar, Teva’sreporting currency. A highly inflationary economy is one that has cumulative inflation of approximately 100 percent or more over a 3-year period.
Use of estimates in the preparation of financial statementsThe preparation of financial statements in conformity with US GAAP requires management to make estimates and assumptions that affect the reported
amounts of assets and liabilities and disclosure of contingent liabilities at the dates of the financial statements and the reported amounts of revenues andexpenses during the reported years. Actual results could differ from those estimates.
As applicable to these consolidated financial statements, the most significant estimates and assumptions relate to uncertain tax positions, intangibleassets, purchase price allocation on acquisitions, contingencies, valuation of goodwill and sales and reserves allowances. b. Principles of consolidation:
The consolidated financial statements include the accounts of the Company and its majority-owned subsidiaries and Variable Interest Entities (“VIEs”)for which the Company is considered the primary beneficiary.
Intercompany transactions and balances are eliminated in consolidation; profits from intercompany sales, not yet realized outside the Group, are alsoeliminated.
F-10

Table of Contents
TEVA PHARMACEUTICAL INDUSTRIES LIMITEDNotes To Consolidated Financial Statements
c. Investee companies:
Investments in entities in which the Company has a significant influence are accounted for using the equity method and included within “other non-current assets”. Under the equity method, the Company generally recognizes its proportionate share of income or loss of the entity. Other non-marketableequity investments are carried at cost. The Company also reviews these investments for impairment whenever events indicate the carrying amount may not berecoverable.
d. Cash and cash equivalents:
All highly liquid investments, which include short-term bank deposits and money market instruments, that are not restricted as to withdrawal or use,and short-term debentures, the period to maturity of which did not exceed three months at the time of investment, are considered to be cash equivalents. e. Inventories:
Inventories are valued at the lower of cost or market. Cost of raw and packaging materials and purchased products is determined mainly on a “movingaverage” basis. Cost of finished products and products in process is determined as follows: the raw and packaging materials component—mainly on a“moving average” basis; the capitalized production costs component—mainly on an average basis over the production period.
Inventories acquired in a business combination are stepped-up to their estimated fair value less profit for sales efforts and amortized to cost of sales asthat inventory is sold. f. Marketable securities:
Marketable securities consist mainly of money market funds, debt securities and equity securities classified as available-for-sale and are recorded at fairvalue. The fair value of quoted securities is based on current market value. When debt securities do not have an active market, fair value is determined using avaluation model. This model is based on reference to other instruments with similar characteristics, or a discounted cash flow analysis, or other pricingmodels making use of market inputs and relying as little as possible on entity-specific inputs. Changes in fair value, net of taxes, are reflected in othercomprehensive income.
For declines in the fair value of equity securities that are considered other-than-temporary, impairment losses are charged to financial expense, net. TheCompany considers available evidence in evaluating potential impairments of its investments, including the duration and extent to which fair value is less thancost, and for equity securities, the Company’s ability and intent to hold the investment for the length of time necessary to allow for the recovery of the marketvalue. For debt securities, an other-than-temporary impairment has occurred if the Company does not expect to recover the entire amortized cost basis of thedebt security. If the Company does not intend to sell the impaired debt security, and it is not more likely than not it will be required to sell the debt securitybefore the recovery of its amortized cost basis, the amount of the other-than-temporary impairment recognized in earnings, recorded in financial expense, net, islimited to the portion attributed to credit loss. The remaining portion of the other-than-temporary impairment related to other factors is recognized in othercomprehensive income. Realized gains and losses for both debt and equity securities are included in financial expense, net. g. Property, plant and equipment:
Property, plant and equipment are stated at cost, after deduction of the related investment grants, and depreciated using the straight-line method over theestimated useful life of the assets: buildings, mainly 40 years; machinery and equipment, between 15 to 20 years; and other assets, between 5 to 10 years.
F-11

Table of Contents
TEVA PHARMACEUTICAL INDUSTRIES LIMITEDNotes To Consolidated Financial Statements
h. Goodwill:
Goodwill reflects the excess of the consideration paid or transferred plus the fair value of any non-controlling interest in the acquiree at the acquisitiondate over the fair values of the identifiable net assets acquired. Goodwill is not amortized but rather is tested for impairment annually per reporting unit at theend of each year, or whenever events or circumstances present an indication of impairment.
The Company applies the FASB’s guidance when testing goodwill for impairment, which permits the Company to make a qualitative assessment ofwhether goodwill is impaired, or opt to bypass the qualitative assessment and proceed directly to performing the first step of the two-step impairment test. If theCompany performs a qualitative assessment and concludes it is more likely than not that the fair value of a reporting unit exceeds its carrying value, goodwillis not considered impaired and the two-step impairment test is unnecessary. However, if the Company concludes otherwise, it is then required to perform thefirst step of the two-step impairment test. i. Identifiable intangible assets:
Identifiable intangible assets are comprised of definite life intangible assets and indefinite life intangible assets.
Definite life intangible assets consist mainly of acquired product rights and other rights relating to products in respect of which an approval formarketing was received from the U.S. Food and Drug Administration (“FDA”) or the equivalent agencies in other countries.
Definite life intangible assets are amortized using mainly the straight-line method over their estimated period of useful life which is determined byidentifying the period in which substantially all of the cash flows are expected to be generated. Amortization of acquired developed products is recorded undercost of sales. Amortization of marketing and distribution rights is recorded under selling and marketing expenses.
Indefinite life intangible assets are mainly comprised of trade names and research and development in-process. Indefinite life intangible assets are notamortized but rather are tested for impairment annually at December 31 of each year, or whenever events or circumstances present an indication of impairment.
Research and development in-process acquired in a business combination is capitalized. Upon initial recognition, these assets are treated similarly toindefinite life intangible assets until the related research and development efforts are either completed or abandoned. In the reporting period where they aretreated as indefinite life intangible assets, they are not amortized but rather are tested for impairment annually at the end of each year, or whenever events orcircumstances present an indication of impairment. Upon completion of the related research and development efforts, management determines the remaininguseful life of the intangible assets and amortizes them accordingly. In case of abandonment, the related research and development efforts are impaired. j. Contingencies:
The Company and certain of its subsidiaries are involved in various patent, product liability, consumer, commercial, and environmental claims;government investigations; and other legal proceedings that arise from time to time in the ordinary course of our business. Except for income tax contingencies,we record accruals for these type of contingencies to the extent that we conclude their occurrence is probable and that the related liabilities are estimable. Werecord anticipated recoveries under existing insurance contracts that are probable of occurring and at the gross amount that is expected to be collected.
F-12

Table of Contents
TEVA PHARMACEUTICAL INDUSTRIES LIMITEDNotes To Consolidated Financial Statements
k. Tax contingencies:
The Company records accruals for uncertain tax positions. Those accruals are recorded to the extent that the Company concludes that a tax position isnot sustainable under a “more-likely-than-not” standard. In addition, the Company classifies interest and penalties recognized in the financial statementsrelating to uncertain tax positions under the provision for income taxes. l. Impairment in value of long-lived assets:
The Company tests long-lived intangible and tangible assets, other than goodwill, for impairment, whenever events or circumstances present anindication of impairment. For indefinite life intangible assets, the impairment test is performed annually, and consists of a comparison of the fair value of theintangible assets to their carrying amounts. When required, the Company records charges for impairment of long-lived assets for the amount by which thepresent value of future cash flows, or some other fair value measure, is less than the carrying value of these assets (see also notes 6, 7 and 17). m. Convertible senior debentures:
The Company separates the liability and equity components of convertible debt instruments that may be settled in cash upon conversion (includingpartial cash settlement) so that the interest on the Company’s convertible debt is at a market rate. This accounting treatment results in the bifurcation of theconvertible debt security into a debt component (which is recorded at an amount lower than its face amount) and an equity component. The debt component isaccreted over the period until the debt is first due or putable by the holder, with accretion of the resulting discount on the debt recognized as part of interestexpense in the consolidated statements of income. n. Treasury shares:
Treasury shares are presented as a reduction of Teva shareholders’ equity and carried at their cost to Teva, under “Treasury shares”. o. Stock-based compensation:
The Company measures and recognizes compensation expense for share-based awards based on estimated fair values on the date of grant using theBlack-Scholes option-pricing model. This option pricing model requires estimates as to the option’s expected life and the price volatility of the underlyingstock.
Teva values restricted stock units (“RSUs”) based on the market value of the underlying stock at the date of grant, less an estimate of dividends thatwill not accrue to RSUs holders prior to vesting. Teva recognizes the estimated fair value of option-based awards and RSUs, net of estimated forfeitures, understock-based compensation costs. p. Revenue recognition:
The Company recognizes revenues from product sales, including sales to distributors when persuasive evidence of an arrangement exists, delivery hasoccurred, the selling price is fixed or determinable and collectability is reasonably assured. This generally occurs when products are shipped and title and riskand rewards for the products are transferred to the customer.
F-13

Table of Contents
TEVA PHARMACEUTICAL INDUSTRIES LIMITEDNotes To Consolidated Financial Statements
Revenues from product sales are recorded net of provisions for estimated chargebacks, rebates, returns, cash discounts and other deductions, such asshelf stock adjustments, which can be reasonably estimated. When sales provisions are not considered reasonably estimable by Teva, the revenue is deferredto a future period when more information is available to evaluate the impact.
Provisions for chargebacks, rebates including Medicaid and other governmental program discounts, including those required by the U.S. health carereform, rebates and other promotional items, such as shelf stock adjustments, are included in “sales reserves and allowances” under “current liabilities”.These provisions are recognized concurrently with the sales of products. Provisions for doubtful debts and prompt payment discounts are netted against“accounts receivable.”
Calculations for these deductions from sales are based on historical experience and the specific terms in the individual agreements. Chargebacks andrebates are the largest components of sales reserves and allowances. Provisions for estimating chargebacks are determined using historical chargebackexperience, or expected chargeback levels and wholesaler sales information for new products, which are compared to externally obtained distribution channelreports for reasonableness. Rebates are recognized based on contractual obligations in place at the time of sales with consideration given to relevant factors thatmay affect the payment as well as historical experience for estimated market activity. Shelf-stock adjustments are granted to customers based on the existinginventory of a customer following decreases in the invoice or contract price of the related product and are estimated based on expected market performance.Teva records a reserve for estimated sales returns by applying historical experience of customer returns to the amounts invoiced and the amount of returnedproducts to be destroyed versus products that can be placed back in inventory for resale.
Revenue resulting from the achievement of milestone events stipulated in the agreements is recognized when the milestone is achieved. Milestones arebased upon the occurrence of a substantive element specified in the contract or as a measure of substantive progress towards completion under the contract.
Revenues and other arrangements from licensees, sales of licensed products and technology, are recorded in accordance with the contract terms, whenthird-party sales can be reliably measured and collection of the funds is reasonably assured.
Other revenues, which include royalty income and income from services, amounted to $438 million, $383 million and $162 million in the years endedDecember 31, 2012, 2011 and 2010, respectively. q. Research and development:
Research and development expenses are charged to income as incurred. Participations and grants in respect of research and development expenses arerecognized as a reduction of research and development expenses as the related costs are incurred, or as the related milestone is met. Upfront fees received inconnection with cooperation agreements are deferred and recognized over the period of the applicable agreements as a reduction of research and developmentexpenses.
Advance payments for goods or services that will be used or rendered for future research and development activities are deferred and capitalized. Suchamounts are recognized as an expense as the related goods are delivered or the services are performed.
Research and development in-process acquired as part of an asset purchase, which has not reached technological feasibility and has no alternative futureuse, is expensed as incurred.
F-14

Table of Contents
TEVA PHARMACEUTICAL INDUSTRIES LIMITEDNotes To Consolidated Financial Statements
r. Shipping and handling costs:
Shipping and handling costs, which amounted to $230 million, $236 million and $202 million for the years ended December 31, 2012, 2011 and2010, respectively, are included in selling and marketing expenses. s . Advertising expenses:
Advertising expenses are charged to income as incurred. Advertising expenses for the years ended December 31, 2012, 2011 and 2010 were $337million, $248 million and $243 million, respectively. t. Deferred income taxes:
Deferred income taxes are determined utilizing the “asset and liability” method based on the estimated future tax effects of temporary differences betweenthe financial accounting and tax bases of assets and liabilities under the applicable tax laws, and on tax rates anticipated to be in effect when the deferredincome taxes are expected to be paid or realized. A valuation allowance is provided if, based upon the weight of available evidence, it is “more likely than not”that a portion of the deferred income tax assets will not be realized. Deferred income tax liabilities and assets are classified as current or non-current based onthe classification of the related asset or liability for financial reporting, or according to the expected reversal dates of the specific temporary differences whereappropriate.
Deferred tax has not been provided on the following items:
(1) Taxes that would apply in the event of disposal of investments in subsidiaries, as it is generally the Company’s intention to hold these investments,not to realize them.
(2) Amounts of tax-exempt income generated from the Company’s current Approved Enterprises and unremitted earnings from foreign subsidiariesretained for reinvestment in the Group (see note 14f). u. Earnings per share:
Basic earnings per share are computed by dividing the net income attributable to Teva by the weighted average number of ordinary shares (includingfully vested RSUs) outstanding during the year, net of treasury shares.
In computing diluted earnings per share, basic earnings per share are adjusted to take into account the potential dilution that could occur upon: (i) theexercise of options and non-vested RSUs granted under employee stock compensation plans and one series of convertible senior debentures, using the treasurystock method; and (ii) the conversion of the remaining convertible senior debentures using the “if-converted” method, by adding to net income interest expenseon the debentures and amortization of issuance costs, net of tax benefits, and by adding the weighted average number of shares issuable upon assumedconversion of the debentures. v. Concentration of credit risks:
Most of Teva’s cash, cash equivalents and marketable securities (which amounted to $3.1 billion at December 31, 2012) were deposited with European,U.S. and Israeli banks and financial institutions and were comprised mainly of cash deposits.
The pharmaceutical industry, particularly in the U.S., has been significantly affected by consolidation among managed care providers, large pharmacychains, wholesaling organizations and other buyer groups. The
F-15

Table of Contents
TEVA PHARMACEUTICAL INDUSTRIES LIMITEDNotes To Consolidated Financial Statements
U.S. market constitutes approximately 51% of our consolidated revenues and a relatively small portion of total trade accounts net of sales reserves andallowances. The exposure of credit risks relating to other trade receivables is limited, due to the relatively large number of group customers and their widegeographic distribution. Teva performs ongoing credit evaluations of its customers for the purpose of determining the appropriate allowance for doubtfulaccounts and generally does not require collateral. An appropriate allowance for doubtful accounts is included in the accounts. w. Derivatives:
Teva carries out transactions involving foreign exchange derivative financial instruments (mainly forward exchange contracts, written and purchasedcurrency options and swaps). The transactions are designed to hedge the Company’s currency exposure and interest exposure.
Derivatives that do not qualify for hedge accounting are recognized on the balance sheet at their fair value, with changes in the fair value recognized as acomponent of “financial expenses—net” in the statements of income.
Derivatives that qualify as a fair value hedge are recognized on the balance sheet at their fair value, with changes in the fair value reported with thecarrying amount of the hedged asset or liability.
For derivatives that qualify as cash-flow hedges, the effective portion of these derivatives’ fair value is initially reported as a component of othercomprehensive income.
For derivatives that do not qualify for hedge accounting, the cash flows associated with these derivatives are reflected as cash flows from operatingactivities in the consolidated statements of cash flows.
For derivatives that qualify for hedge accounting, the cash flows associated with these derivatives are reported in the consolidated statements of cashflows consistently with the classification of cash flows from the underlying hedged items that these derivatives are hedging. x. Fair value measurement:
The Company measures fair value and discloses fair value measurements for financial assets and liabilities. Fair value is based on the price that wouldbe received to sell an asset or paid to transfer a liability in an orderly transaction between market participants at the measurement date.
The accounting standard establishes a fair value hierarchy that prioritizes observable and unobservable inputs used to measure fair value into threebroad levels, which are described below:
Level 1: Quoted prices (unadjusted) in active markets that are accessible at the measurement date for assets or liabilities. The fair value hierarchy givesthe highest priority to Level 1 inputs.
Level 2: Observable inputs that are based on inputs not quoted on active markets, but corroborated by market data.
Level 3: Unobservable inputs are used when little or no market data is available. The fair value hierarchy gives the lowest priority to Level 3 inputs.
In determining fair value, the Company utilizes valuation techniques that maximize the use of observable inputs and minimize the use of unobservableinputs to the extent possible and considers credit risk in its assessment of fair value. See note 3.
F-16

Table of Contents
TEVA PHARMACEUTICAL INDUSTRIES LIMITEDNotes To Consolidated Financial Statements
y. Collaborative arrangements:
Collaborative agreements are contractual arrangements in which the parties are active participants to the arrangement and are exposed to the significantrisks and rewards that are dependent on the ultimate commercial success of the endeavor. See note 2(12).
The Company recognizes revenue generated and costs incurred on sales to third parties as it relates to a collaborative agreement as gross or net, based onaccounting guidance relating to “Reporting Revenue Gross as a Principal versus Net as an Agent.” If the Company is the principal participant in a transaction,revenues are recorded on a gross basis; otherwise, revenues are recorded on a net basis. z. Segment reporting:
Teva evaluates its organizational structure under a notion of “One Teva” with functional based units of a front-end (products offerings) and back-end(supply, operations and research and development) unified organization. Accordingly, Teva concluded that it has one operating segment. Entity-widedisclosures on net revenues and property, plant and equipment are presented in note 18. a a . Reclassifications:
Certain comparative figures have been reclassified to conform to the current year presentation. ab. Recently issued accounting pronouncements:
In July 2012, the Financial Accounting Standards Board (“FASB”) issued Accounting Standard Update 2012-02, “Intangibles—Goodwill and Other(Topic 350): Testing Indefinite Intangibles Assets for Impairment,” which amended the guidance in ASC 350-30 on testing indefinite-lived intangibleassets, other than goodwill, for impairment allowing an entity to perform a qualitative impairment assessment. If the entity determines that it is not more likelythan not that the fair value of the reporting unit is less than the carrying amount, further testing of indefinite-lived intangible assets for impairment is notrequired and the entity would not need to calculate the fair value of the asset and perform a quantitative impairment test. In addition, the standard did notamend the requirement to test these assets for impairment between annual tests if there is a change in events or circumstances; however, it revised the examplesof events and circumstances that an entity should consider in interim periods, which are identical to those assessed in the annual qualitative assessmentdescribed above. ASU 2012-02 was effective for annual and interim impairment tests performed for fiscal years beginning after September 15, 2012, withearly adoption being permitted. Teva believes that the adoption of this standard will not have a material impact on its consolidated statements.
In December 2011, the FASB issued Accounting Standard Update No. 2011-11 , “Balance Sheet (210): Disclosures about Offsetting Assets andLiabilities,” which requires additional disclosures about the nature of an entity’s rights of setoff and related arrangements associated with its financialinstruments and derivative instruments. The disclosure requirements are effective for annual reporting periods beginning on or after January 1, 2013, andinterim periods therein, with retrospective application required. In January 2013, the FASB issued Accounting Standard Update No. 2013-01, “Clarifying theScope of Disclosures about Offsetting Assets and Liabilities.” Teva believes that the adoption of both the standard and the update will not have a materialimpact on Teva’s consolidated financial statements.
F-17

Table of Contents
TEVA PHARMACEUTICAL INDUSTRIES LIMITEDNotes To Consolidated Financial Statements
NOTE 2—CERTAIN TRANSACTIONS:
1) Sale of animal health unit:On September 14, 2012, Teva entered into an agreement to sell its U.S.-based animal health unit for up to $145 million. The purchase price included a
payment of $50 million at closing and up to $91 million in milestone payments. The transaction closed in January 2013 and has not materially affected ourfinancial results.
2) South Korea venture:In December 2012, Teva entered into an agreement with Handok Pharmaceutical Co. (“Handok”), Ltd. to form a business venture in South Korea,
allowing Teva to gain entrance into the Korean pharmaceutical market. Teva will contribute its global resources, with responsibilities for manufacturing andsupplying a wide range of affordable and innovative medicines, and Handok’s primary responsibility will be in sales and marketing, distribution, andregulatory affairs. Under the terms of the agreement, we will have a voting split of 60% and 40% and a profit split of 51% and 49% to Teva and Handok,respectively. This agreement had no effect on our 2012 financial results.
3) Xenon:
On December 11, 2012, Teva entered into a collaborative development and exclusive worldwide license for XEN402 with Xenon Pharmaceuticals Inc.(“Xenon”). XEN402 is currently in clinical development for a variety of painful disorders. Under the agreement, Teva paid Xenon an upfront fee of $41million. In addition, Teva may be required to pay development, regulatory and sales-based milestones of up to $335 million. Xenon is also entitled to royaltieson sales and has an option to participate in commercialization in the United States.
4) Acquisition of Neurosearch A/S assets:On October 25, 2012, Teva acquired from NeuroSearch A/S (“NeuroSearch”), a Danish company, the rights, assets and obligations relating to
Huntexil (pridopidine/ACR16), a drug candidate being developed for the symptomatic treatment of hand movement, balance and gait disturbances inHuntington’s disease. Under the agreement, Teva paid NeuroSearch approximately $26 million. Regulatory and commercialization milestone payments mayresult in additional payments of approximately $10 million to NeuroSearch.
5) PGT Consumer Healthcare:In November 2011, we formed PGT Healthcare, a consumer healthcare joint venture with The Procter & Gamble Company (“P&G”). Headquartered in
Geneva, Switzerland, the joint venture focuses on branded OTC medicines in categories such as cough/cold and allergy, digestive wellness, vitamins,minerals and supplements, analgesics and skin medications, and operates in all markets outside North America. Its leading brands are Vicks , Metamucil ,Pepto-Bismol , and ratiopharm. The joint venture also develops new brands for the North American market and certain global markets. PGT Healthcare’sstrengths include P&G’s strong brand-building, consumer-led innovation and go-to-market capabilities; our broad geographic reach, experience in R&D,regulatory and manufacturing expertise and extensive portfolio of products, and each company’s scale and operational efficiencies.
We own 49% of the joint venture, and P&G holds a controlling financial interest of 51%. We recognize profits of the joint venture based on ourownership percentage. The joint venture has certain independent operations and contracts for other services from its two partners in an effort to leverage theirscale and capabilities and thereby maximize efficiencies. Such services include research and development, manufacturing,
F-18
®
® ®
®

Table of Contents
TEVA PHARMACEUTICAL INDUSTRIES LIMITEDNotes To Consolidated Financial Statements
sales and distribution, administration and other services, provided under agreements with the joint venture. The partners have certain rights to terminate thejoint venture after seven years and earlier under other circumstances. As of December 2012, the OTC products of Cephalon (Mepha) were included in the jointventure.
6) Cephalon acquisition:In October 2011, Teva acquired Cephalon, Inc. (“Cephalon”) for total cash consideration of $6.5 billion. Cephalon was a global biopharmaceutical
company with a strong marketed portfolio and a pipeline of branded products. The acquisition diversified Teva’s specialty portfolio and enhanced Teva’s late-stage innovative pipeline.
The acquisition was financed by borrowing under credit facilities and by the issuance of long term debt. See note 10.
At the closing, Cephalon had two outstanding series of convertible debt: $820 million of 2.0% notes due 2015 and $500 million of 2.5% notes due2014. Both series became convertible as a result of the acquisition. The aggregate amount payable upon conversion was approximately $2.1 billion. By the endof 2011, holders of effectively 100% of Cephalon’s convertible debt had submitted their debt for conversion.
Cephalon’s results of operations and balance sheet were included in Teva’s consolidated reports commencing October 2011.
At the closing, Cephalon had contingent consideration liabilities related to future milestones payments due to the acquisition of Gemin XPharmaceuticals, Inc. in April 2011, the acquisition of Ception Therapeutics, Inc. in February 2010, the acquisition of BioAssets Development Corporation inNovember 2009, and the inclusion of Alba Therapeutics Corporation in February 2011. The aggregate fair value amount of Cephalon’s contingentconsideration liabilities at the date of the Cephalon acquisition was $171 million.
We determined the fair value of the liability for the contingent consideration based on a probability-weighted discounted cash flow analysis. This fairvalue measurement is based on significant inputs not observable in the market and thus represents a Level 3 measurement within the fair value hierarchy. Thefair value of the contingent consideration liability associated with future milestone payments was based on several factors including:
• estimated cash flows projected from the success of unapproved product candidates in the U.S. and Europe;
• the probability of success for product candidates including risks associated with uncertainty, achievement and payment of milestone events;
• the time and resources needed to complete the development and approval of product candidates;
• the life of the potential commercialized products and associated risks of obtaining regulatory approvals in the U.S. and Europe; and
• the risk adjusted discount rate for fair value measurement.
The contingent consideration payments have been recorded as a liability, and their fair value is evaluated quarterly, or more frequently if circumstancesdictate. Changes in the fair value of contingent consideration are recorded in earnings.
F-19

Table of Contents
TEVA PHARMACEUTICAL INDUSTRIES LIMITEDNotes To Consolidated Financial Statements
The table below summarizes the fair value of assets acquired, liabilities assumed and resulting goodwill in Cephalon.
U.S. $
in millions Current assets $ 2,850 Investment and non-current assets 426 Property, plant and equipment 359 Identifiable intangible assets:
Existing product rights and trade name 2,564 Research and development in-process 1,296 Goodwill 3,279
Total assets acquired 10,774 Current liabilities 832 Short term debt 2,082 Long-term liabilities, including deferred taxes 1,099 Contingent consideration 171 Total liabilities assumed 4,184 Non controlling interest 79
Net assets acquired $ 6,511
Adjustments during the measurement period did not have a significant impact on Teva’s consolidated statements of income, balance sheets or cashflows and, therefore, we have not retrospectively adjusted our financial statements. Adjustments for identifiable intangible assets recognized during themeasurement period reflected changes in the estimated fair value of certain acquired intangibles, principally in-process research and developed assets. Theadjustments did not result from intervening events subsequent to the acquisition date.
An amount of $1,296 million of the purchase price was allocated to the estimated fair value of purchased research and development in-process that asof the closing date of the acquisition had not reached technological feasibility. This amount, upon initial recognition, has been treated as an indefinite lifeintangible asset until the related research and development efforts are either completed or abandoned. See note 1i.
The research and development in-process related to ten products. A probability of success factor was used to reflect inherent technological and regulatoryrisks. The net cash inflows were discounted to present values, using a discount rate of 13% and other assumptions, which take into account the stage ofcompletion, nature and timing of efforts for completion, risks and uncertainties, among other key factors, which vary among the individual products.Material net cash inflows are expected to commence during 2015. During 2012, four of these ten products have been impaired as disclosed in note 17, andSynribo (omacetaxine) was launched during 2012.
Product rights and purchased research and development in process were valued using a variation of the income approach known as the “Multi-PeriodExcess Earnings Approach”. This method utilized a forecast of expected cash inflows (including adjustments, as appropriate, for regulatory and commercialrisks), cash outflows and contributory charges for economic returns on tangible and intangible assets employed.
An amount of $2,555 million of the purchase price was allocated to existing products. The Company is amortizing existing products over a range ofperiods of between 3 to 12 years. An amount of $9 million of the
F-20
™

Table of Contents
TEVA PHARMACEUTICAL INDUSTRIES LIMITEDNotes To Consolidated Financial Statements
purchase price was allocated to a trade name. The excess of cost of acquisition over the fair value of net tangible and identifiable intangible assets onacquisition amounted to $3,279 million, and represented goodwill, which is primarily due to the expected synergies and economies of scale.
Below are certain unaudited pro forma combined statement of income data for the years ended December 31, 2011 and 2010, as if the acquisition ofCephalon had occurred on January 1, 2010 after giving effect to: (a) purchase accounting adjustments, including amortization of identifiable intangible assets;(b) exclusion of $288 million of nonrecurring expense related to inventory step up in 2011 and inclusion of $355 million of nonrecurring expense in 2010;(c) estimated additional finance expenses due to: (i) borrowings under credit facilities from banks in connection with the acquisition; (ii) the issuance of seniornotes in connection with the acquisition; (iii) elimination of Cephalon’s equity investment mark-to-market effect (an exclusion of income of $198 million and$8 million in 2011 and 2010 supplemental pro forma net income, respectively); and (iv) elimination of Cephalon’s finance expense relating to convertibledebentures; (d) pharmaceutical products divested as part of the regulatory requirements for approving the deal; (e) elimination of intercompany sales;(f) elimination of net revenues related to the divestiture of certain overlapping products; and (g) elimination of net revenues and income related to Cephalon’sdivested businesses (Middle East, Africa, Latin America and Asia); and (h) certain adjustments with regards to the amortization of Cephalon’s Provigilproduct.
This unaudited pro forma financial information is not necessarily indicative of the combined results that would have been attained had the acquisitiontaken place at the beginning of 2010 nor is it necessarily indicative of future results.
Year ended December 31, 2011 2010
(U.S. $ in millions, except
earnings per share) (Unaudited) Net revenues $20,443 $18,792 Net income attributable to Teva $ 2,681 $ 2,907 Earnings per share:
Basic $ 3.01 $ 3.24 Diluted $ 3.00 $ 3.20
7) Japanese transactions:In September 2011, Teva acquired all non-controlling interests of its investment in Taisho, as well as gained 100% control on its former equity
investment in Teva-Kowa, for a total purchase price of $150 million. This acquisition, together with the Taiyo acquisition, enabled Teva to expand itsJapanese operations.
In July 2011, Teva acquired all of Taiyo Pharmaceutical Industry Co. Ltd. (“Taiyo”) outstanding shares for $1,092 million in cash. Taiyo haddeveloped a large portfolio of generic products in Japan with over 550 marketed products, and its advanced production facilities enabled it to produce a widerange of dosage forms on a large scale.
The acquisition consideration was attributed to net assets on the basis of the fair value of assets acquired and liabilities assumed based on an appraisalperformed by management, which included a number of factors, including the assistance of independent appraisers. Taiyo’s results of operations wereincluded in Teva’s consolidated financial statements commencing July 2011.
F-21
®

Table of Contents
TEVA PHARMACEUTICAL INDUSTRIES LIMITEDNotes To Consolidated Financial Statements
Since April 2012, the majority of Teva’s Japan based companies have operated under a single company—Teva Seiyaku.
8) CureTech:In September 2011, we exercised an option to invest $19 million in CureTech Ltd. (“CureTech”), a biotechnology company. We also agreed to make
further investments in CureTech’s research and development activities. As a result of the option exercise, our ownership stake in CureTech increased from 33%to 75%. In January 2013, we announced the termination of our collaboration with CureTech. See also note 17.
9) Laboratoire Theramex acquisition:In January 2011, Teva completed the acquisition of Laboratoire Theramex (“Theramex”), Merck KGaA’s European-based women’s health business, for
€267 million in cash (approximately $355 million) and certain limited performance-based milestone payments. Theramex has a broad portfolio of women’shealth and gynecology products sold in over 50 countries, primarily France and Italy.
10) Corporación Infarmasa acquisition:In January 2011, Teva acquired Corporación Infarmasa (“Infarmasa”), a top ten pharmaceutical company in Peru, from The Rohatyn Group and Altra
Investments. Infarmasa manufactures and commercializes branded and unbranded generic drugs, primarily corticosteroids, antihistamines, analgesics andantibiotics. Infarmasa’s product offerings have enhanced Teva’s portfolio in the market, especially in the area of antibiotics, where Infarmasa has the leadingbrand in Peru.
11) Ratiopharm acquisition:On August 10, 2010, Teva acquired Merckle ratiopharm Group (“ratiopharm”) for a total cash consideration of $5.2 billion. The transaction was
accounted for as a business combination. Ratiopharm’s results of operations were included in Teva’s consolidated financial statements commencing August2010.
The cash consideration was financed through Teva’s internal resources, the issuance of $2.5 billion in senior notes and credit lines, including creditagreements for an aggregate amount of $1.5 billion.
An amount of $501 million of the purchase price was allocated to the estimated fair value of purchased research and development in-process that as ofthe closing date of the acquisition had not reached technological feasibility and had no alternative future use. This amount, upon initial recognition, has beentreated as an indefinite life intangible asset until the related research and development efforts are either completed or abandoned (refer to note 1i).
Research and development in-process related to approximately 42 products and product groups, which included one product with a value ofapproximately one third of the total value of research and development in-process. A probability of success factor was used to reflect inherent technological andregulatory risks. The net cash inflows were discounted to present values, using a range of discount rates of between 10.5% and 15% and other assumptions,which take into account the stage of completion, nature and timing of efforts for completion, risks and uncertainties, and other key factors, which varyamong the individual products. Material net cash inflows are expected to commence during 2014. Of the 42 products and product groups mentioned above,through December 31, 2012, all products but two were launched in some markets.
F-22

Table of Contents
TEVA PHARMACEUTICAL INDUSTRIES LIMITEDNotes To Consolidated Financial Statements
Product rights and purchased research and development in process were valued using a variation of the income approach known as the “Multi-Period
Excess Earnings Approach”. This method utilized a forecast of expected cash inflows (including adjustments, as appropriate, for regulatory and commercialrisks), cash outflows and contributory charges for economic returns on tangible and intangible assets employed. A trade name was valued using a variation ofthe income approach known as the “Relief from Royalty Method”. This method is based on the concept that a company owns the trade name and licenses it toan operating company. The theoretical price paid by the operating company to the company that owns the trade name is expressed as a royalty rate. The netpresent value of all forecasted royalties represents the value of the trade name.
An amount of $1,658 million of the purchase price was allocated to existing products. The Company is amortizing existing products over a period ofapproximately 10 years. An amount of $139 million of the purchase price was allocated to a trade name. The excess of cost of acquisition over the fair value ofnet tangible and identifiable intangible assets on acquisition amounted to $2,795 million, and represented goodwill.
Below is a certain unaudited pro forma statement of income data for the year ended December 31, 2010, as if the acquisition of ratiopharm had occurredon January 1, 2010, after giving effect to: (a) purchase accounting adjustments, including amortization of identifiable intangible assets; (b) estimatedadditional interest expense due to: (i) borrowings under the one year credit facilities from banks in connection with the acquisition; (ii) the issuance of seniornotes in connection with the acquisition; (iii) elimination of interest income on Teva’s cash and cash equivalents and marketable securities used as cashconsideration in the acquisition; and (iv) elimination of financial expenses of $102 million resulting from the hedging of the euro-denominated purchase pricefor the acquisition; and (c) elimination of intercompany sales.
The pro forma information below is given in accordance with the accepted accounting standards at the date of the acquisition.
This unaudited pro forma financial information is not necessarily indicative of the combined results that would have been attained had the acquisitiontaken place at the beginning of 2010, nor is it necessarily indicative of future results.
Year ended December 31, 2010
(U.S. $ in millions, except
earnings per share) (Unaudited) Net revenues $ 17,396 Net income attributable to Teva $ 3,421 Earnings per share:
Basic $ 3.82 Diluted $ 3.76
12) Significant collaborative agreements:The Company has entered into alliances and other arrangements with third parties to acquire rights to products it does not have, to access markets it
does not operate in and to otherwise share development cost or business risks. The Company’s most significant agreements of this nature are summarizedbelow.
a) With Lonza:
On January 20, 2009, Teva signed a definitive agreement with Lonza Group Ltd. to establish a joint venture to develop, manufacture and market anumber of affordable, effective and safe generic equivalents of a selected portfolio of biologic pharmaceuticals. The joint venture commenced activities in May2009.
F-23

Table of Contents
TEVA PHARMACEUTICAL INDUSTRIES LIMITEDNotes To Consolidated Financial Statements
Each of Teva and Lonza Group Ltd. has a 50% stake in the joint venture. Teva records its share of the joint venture under share in losses of associated
companies—net.
b) With Sanofi:
Teva has an agreement with Sanofi that had provided for the marketing of Copaxone in Europe and other markets. Copaxone was co-promoted withSanofi in Germany, France, Spain, the Netherlands and Belgium, and was marketed solely by Sanofi in certain other European markets, Australia andNew Zealand. In 2010, we assumed the distribution and marketing responsibilities for Copaxone in the United Kingdom, the Czech Republic and Poland.On February 1, 2012, we assumed the marketing responsibilities for Copaxone in all other European countries, and also in Australia and New Zealandeffective March 1, 2012. Following termination, Sanofi is entitled to an agreed-upon termination consideration of 6% of the in-market sales of Copaxone inthe applicable countries for an additional two-year period. Although we have recorded higher revenues as a result of this change, we also became responsible forcertain marketing and administrative expenses, which are no longer shared with Sanofi.
13) Agreements with related parties:Teva leases 13,500 square feet of office space located in Miami, Florida from an entity controlled by Dr. Frost, Teva’s Chairman of the Board. The term
of the lease extends until April 2015, with options to renew for two additional three-year terms. Annual rent was $305,000 until April 1, 2012 and $412,000from April 1, 2012 to March 31, 2013, increasing 4% per year for the remainder of the initial term and each renewal term.
In December 2012, Teva entered into an agreement with Xenon Pharmaceuticals Inc. as discussed in note 2 (3). Dr. Michael Hayden, Teva’s President ofGlobal R&D and Chief Scientific Officer, is the founder, a shareholder and a member of the board of directors of Xenon.
CTG Weld Limited, a privately owned contract research organization, has rendered services to Teva in connection with clinical trials since 2002. In2011, Chaim Hurvitz, a director of Teva, acquired a personal interest in, and became a member of the board of directors of, CTG Weld. In 2012, Tevaengaged CTG Weld in connection with certain clinical studies, for overall charges of €1.3 million (approximately $1.7 million).
In September 2011, Teva entered into an agreement with CoCrystal Discovery, Inc., a company focusing on the discovery and development of noveltherapeutics, utilizing an innovative drug discovery technology. According to the agreement, Teva will fund the company’s R&D under the Research Agreementby the investment into the company of two tranches of $7.5 million each per target (the latter one being discretionary). The first tranche was invested by Tevain 2011. Dr. Phillip Frost, the Chairman of the board of directors of Teva, and Prof. Roger Kornberg, a member of the board, are both investors in andmembers of the board of directors of CoCrystal Discovery. Prof. Kornberg is also Chief Scientific Officer of CoCrystal Discovery.
F-24
® ®
®
®
®

Table of Contents
TEVA PHARMACEUTICAL INDUSTRIES LIMITEDNotes To Consolidated Financial Statements
NOTE 3—FAIR VALUE MEASUREMENT:
Financial items carried at fair value as of December 31, 2012 and 2011 are classified in the tables below in one of the three categories described in note1x:
December 31, 2012
U.S. $ in millions Level 1 Level 2 Level 3 Total Cash and cash equivalents:
Money markets $ 331 $ — $ — $ 331 Cash deposits and other 2,548 — — 2,548
Marketable securities: Auction rate securities — — 32 32 Collateral debt obligations — — 1 1 Equity securities 72 — — 72 Structured investment vehicles — 100 — 100 Other—mainly debt securities 5 — — 5
Derivatives: Liability derivatives-mainly options and forward contracts — (29) — (29) Interest rate and cross-currency swaps (liabilities) — (109) — (109) Asset derivatives-mainly options and forward contracts — 20 — 20 Interest rate swaps (assets) — 4 — 4
Contingent consideration in connection with Cephalon acquisition — — (131) (131) Total $2,956 $ (14) $ (98) $ 2,844
December 31, 2011
U.S. $ in millions Level 1 Level 2 Level 3 Total Cash and cash equivalents:
Money markets $ 73 $— $ — $ 73 Cash deposits and other 1,023 — — 1,023
Marketable securities: Auction rate securities — — 31 31 Collateral debt obligations 4 — 1 5 Equity securities 505 — — 505 Structured investment vehicles — 91 — 91 Other—mainly debt securities 20 — — 20
Derivatives: Liability derivatives—mainly options and forward contracts — (57) — (57) Interest rate and cross-currency swaps (liabilities) — (53) — (53) Asset derivatives—mainly options and forward contracts — 17 — 17 Interest rate and cross currency swaps (assets) — 25 — 25
Contingent consideration in connection with Cephalon acquisition — — (171) (171) Total $1,625 $ 23 $(139) $1,509
F-25

Table of Contents
TEVA PHARMACEUTICAL INDUSTRIES LIMITEDNotes To Consolidated Financial Statements
The following table summarizes the activity for those financial assets where fair value measurements are estimated utilizing Level 3 inputs.
2012 2011 U.S. $ in millions Carrying value as of January 1 $ (139) $ 78 Amount realized (10) (61) Contingent consideration in connection with Cephalon acquisition 40 (171) Net change to fair value:
Included in earnings—finance expense—net 4 22 Included in other comprehensive income (loss) 7 (7)
Carrying value as of December 31 $ (98) $ (139)
Changes in fair value of available for sale securities, net of taxes, are reflected in other comprehensive income. Unrealized losses considered to betemporary are reflected in other comprehensive income; unrealized losses that are considered to be other-than-temporary are charged to income as an impairmentcharge. In April 2010, the Company adopted an accounting pronouncement that changes the method for determining whether other-than-temporary impairmentexists for debt securities and the amount of the impairment to be recorded in earnings. At December 31, 2012 and 2011, the credit loss was $5 million and$164 million, respectively.
Financial Instruments Not Measured at Fair ValueTeva’s financial instruments consist mainly of cash and cash equivalents, marketable securities, current and non-current receivables, short-term credit,
accounts payable and accruals, long-term loans and other long-term senior notes and loans, convertible senior debentures and derivatives.
The fair value of the financial instruments included in working capital and non-current receivables approximates their carrying value. The fair value oflong-term bank loans mostly approximates their carrying value, since they bear interest at rates close to the prevailing market rates.
The fair value of the financial instruments that are measured on a basis other than fair value are presented in the table below:
Estimated fair value* December 31, 2012 2011 U.S. $ in millions Senior notes included under long term liabilities $(10,494) $ (8,662) Senior notes and convertible senior debentures included under short term
liabilities (2,870) (1,555) Fair value at the end of the period $(13,364) $(10,217)
* The fair value was estimated based on quoted market prices, where available.
F-26

Table of Contents
TEVA PHARMACEUTICAL INDUSTRIES LIMITEDNotes To Consolidated Financial Statements
NOTE 4—MARKETABLE SECURITIES:
1) Available-for-sale securities: Comprised mainly of money market funds, debt securities and equity securities.
At December 31, 2012 and 2011, the fair value, amortized cost and gross unrealized holding gains and losses of such securities were as follows:
Fair value Amortized
cost
Grossunrealized
holdinggains
Grossunrealized
holdinglosses
(U.S. $ in millions) December 31, 2012 $ 541 $ 533 $ 27 $ 19 December 31, 2011 $ 725 $ 836 $ 26 $ 137
2) The marketable securities which are comprised substantially of available-for-sale money market funds, debt and equity securities, are classifiedas long-term or short-term based on the intended time of realizing the security.
Marketable securities are presented in the balance sheets as follows:
December 31, 2012 2011 (U.S. $ in millions) Cash and cash equivalents, mainly money market funds $ 331 $ 75 Short-term investments 5 22 Other non-current assets 205 628
$ 541 $ 725
3) The contractual maturities of debt securities are as follows:
December 31,
2012 (U.S. $ in millions) 2013 $ 336 2014 — 2015 — 2016 — 2017 — 2018 and thereafter 133
$ 469
F-27

Table of Contents
TEVA PHARMACEUTICAL INDUSTRIES LIMITEDNotes To Consolidated Financial Statements
NOTE 5—INVENTORIES:
Inventories consisted of the following:
December 31, 2012 2011 (U.S. $ in millions) Finished products $ 2,871 $ 2,502 Raw and packaging materials 1,754 1,589 Products in process 751 781 Materials in transit and payments on account 126 140
$5,502 $ 5,012
NOTE 6—PROPERTY, PLANT AND EQUIPMENT:Property, plant and equipment, net, consisted of the following:
December 31, 2012 2011 (U.S. $ in millions) Machinery and equipment $ 4,220 $ 3,857 Buildings 2,521 2,429 Computer equipment and other assets 1,196 1,063 Payments on account 726 574 Land* 475 453
9,138 8,376 Less—accumulated depreciation 2,823 2,429
$ 6,315 $5,947 * Land includes long-term leasehold rights in various locations, with useful lives of between 30 and 99 years.
Following recent acquisitions, during 2011 the Company reassessed its estimates of the useful lives of property and machinery used in the determinationof depreciation, based on management’s review of actual physical condition and usage, normal wear and tear, technological change, and industry practice.Following these changes in estimates, the estimated useful life of buildings was changed from a range of 25 to 50 years to an aggregate useful life of 40 years,and the estimated useful life of machinery was changed to a range of useful life of 15 to 20 years from a range of 7 to 15 years. The impact of the change inestimates is not material to the financial statements.
Depreciation expenses were $428 million, $358 million and $448 million in the years ended December 31, 2012, 2011 and 2010, respectively. Duringthe years ended December 31, 2012 and 2011, we had impairment of property, plant and equipment in the amount of $190 million and $52 million,respectively, see note 17.
F-28

Table of Contents
TEVA PHARMACEUTICAL INDUSTRIES LIMITEDNotes To Consolidated Financial Statements
NOTE 7—GOODWILL AND IDENTIFIABLE INTANGIBLE ASSETS: a . Goodwill:
The changes in the carrying amount of goodwill for the years ended December 31, 2012 and 2011 are as follows:
2012 2011 (U.S. $ in millions) Balance as of January 1 $ 18,293 $15,232 Changes during year: Goodwill acquired* 302 3,358 Translation differences and other 261 (297) Balance as of December 31 $18,856 $18,293
* Represents adjustments made in 2012 to the goodwill of Cephalon, which was acquired in 2011, with respect to changes in estimates during the
allocation period relating mainly to intangible assets, property, plant and equipment, sales reserves and allowances, equity investments and otheraccruals. These goodwill adjustments did not materially affect our 2012 opening balances.
b. Identifiable intangible assets:
1. Identifiable intangible assets consisted of the following:
Original amount
net of impairment Accumulatedamortization Amortized balance
December 31, 2012 2011 2012 2011 2012 2011 (U.S. $ in millions) Product rights $ 9,983 $ 10,237 $3,429 $2,316 $6,554 $ 7,921 Trade names 258 251 5 5 34 203 217 Research and development in process 988 2,178 — — 988 2,178 Total $11,229 $12,666 $ 3,484 $ 2,350 $ 7,745 $10,316 2. The weighted average life of product rights is approximately 10 years.
3. Amortization of intangible assets amounted to $1,272 million, $707 million and $527 million in the years ended December 31, 2012, 2011 and
2010, respectively.
4. Impairment of identifiable intangible assets amounted to $858 million, $143 million and $109 million in the years ended December 31, 2012,
2011 and 2010, respectively. See note 17.
5. As of December 31, 2012, the estimated aggregate amortization of intangible assets for the years 2013 to 2017 is as follows: 2013—$1,117
million; 2014—$1,065 million; 2015—$801 million; 2016—$734 million and 2017—$730 million.
c . As of December 31, 2012, 2011 and 2010, the Company determined that there was no impairment with respect to goodwill.
F-29

Table of Contents
TEVA PHARMACEUTICAL INDUSTRIES LIMITEDNotes To Consolidated Financial Statements
NOTE 8—SHORT TERM DEBT: a . Short term debt and current maturities of long term liabilities:
December 31, 2012 2011 (U.S. $ in millions) Banks and financial institutions $ 45 $2,591 Convertible debentures (see note 11) 530 531 Current maturities of long term liabilities 2,431 1,158 Total $3,006 $ 4,280
Loans were obtained from banks at a weighted average interest rate of 1.5% and 1.0% at December 31, 2012 and 2011, respectively. b. Lines of credit:
In January 2011, Teva entered into a new three-year $1.5 billion unsecured syndicated credit facility, which replaced the separate bilateral revolvingcredit agreements for an aggregate of $1.1 billion that Teva had entered into in 2009 and early 2010. This facility was amended to a $2.5 billion facility inJune 2011.
In December 2012, Teva entered into a new five-year $3.0 billion unsecured syndicated credit facility, which replaced the separate bilateral revolvingcredit agreements for an aggregate of $2.5 billion that Teva had entered into in 2011.
NOTE 9—LONG-TERM EMPLOYEE-RELATED OBLIGATIONS: a . Long-term employee-related obligations consisted of the following:
December 31, 2012 2011 (U.S. $ in millions) Accrued severance pay $ 135 $ 131 Defined benefit plans 160 108 Total $ 295 $ 239
As of December 31, 2012 and 2011, the Group had $134 million and $129 million, respectively, deposited in funds managed by financial institutionsthat are earmarked by management to cover severance pay liability mainly in respect of Israeli employees. Such deposits are not considered to be “plan assets”and are therefore included in long-term investments and receivables.
Most of the change in these obligations resulted from an actuarial decrease in the discount rate in several European countries.
The Company expects to contribute approximately $94 million in 2013 to the pension funds and insurance companies in respect of its severance andpension pay obligations.
F-30

Table of Contents
TEVA PHARMACEUTICAL INDUSTRIES LIMITEDNotes To Consolidated Financial Statements
The main terms of the different arrangements with employees are described in b. below.
b. Terms of arrangements:
1) Israel
Israeli law generally requires payment of severance pay upon dismissal of an employee or upon termination of employment in certain othercircumstances. The Parent Company and its Israeli subsidiaries make ongoing deposits into employee pension plans to fund its severance liabilities.According to the general collective pension agreement in Israel, Company deposits with respect to employees who were employed by the Company afterthe agreement took effect are made in lieu of the Company’s severance liability, therefore no obligation is provided for in the financial statements.Severance pay liabilities with respect to employees who were employed by the Parent Company and its Israeli subsidiaries prior to the collective pensionagreement effective date, and also employees who have special contractual arrangements, are provided for in the financial statements based upon thenumber of years of service and the latest monthly salary.
2) Europe
Many of the employees in the Company’s European subsidiaries are entitled to a retirement grant when they leave. In the consolidated financialstatements, the liability of the subsidiaries is accrued, based on the length of service and remuneration of each employee at the balance sheet date. Otheremployees in Europe are entitled to a pension according to a defined benefit scheme providing benefits based on final or average pensionable pay oraccording to a hybrid pension scheme that provides retirement benefits on a defined benefit and a defined contribution basis. Independent certifiedactuaries value these schemes, the rates of contribution payable being determined by the actuaries. Pension costs for the defined benefit section of thescheme are accounted for on the basis of charging the expected cost of providing pensions over the period during which the subsidiaries benefit from theemployees’ services. The Company uses December 31 as the measurement date for most of its material defined benefit plans.
3) North America
The Company’s North American subsidiaries mainly provide various defined contribution plans for the benefit of their employees. Under theseplans, contributions are based on specified percentages of pay. Additionally, a multi-employer plan is maintained in accordance with various unionagreements.
4) Latin America
The majority of the employees in Latin America are entitled to severance under local law. The severance payments are calculated based on serviceterm and employee remuneration and accruals are maintained to reflect these amounts.
The Company expects to pay the following future minimum benefits to its employees: $22 million in 2013; $16 million in 2014; $13 million in 2015;$14 million in 2016; $17 million in 2017 and $96 million between 2018 to 2022. These amounts do not include amounts that might be paid to employeeswho cease working with the Company before their normal retirement age.
F-31

Table of Contents
TEVA PHARMACEUTICAL INDUSTRIES LIMITEDNotes To Consolidated Financial Statements
NOTE 10—SENIOR NOTES AND LOANS:
a . Senior notes and loans consisted of the following:
Interest rate as ofDecember 31,
2012
December 31,
2012 2011 % U.S. $ in millions Senior notes (1) 0.8 to 6.15 $12,152 $ 9,317 Loans, mainly from banks (2)(3) 1 to 2.5 1,976 2,062 Debentures (3) 7.2 15 15
14,143 11,394 Less—current portion (included under “short-term debt”) (2,431) (1,158)
$ 11,712 $10,236 1) During 2012, the Company issued the following senior notes (all guaranteed by Teva):
Issuer
Annualinterest
rate Principal
amount issued Due % (U.S. $ in millions)Teva Pharmaceutical Finance IV B.V.* 2.875 $ 1,316 April 2019Teva Pharmaceutical Finance V B.V.** 1.5 $ 493 October 2018Teva Pharmaceutical Finance IV, LLC 2.25 $ 700 March 2020Teva Pharmaceutical Finance Company B.V.*** 2.95 $ 1,300 December 2022
* Principal amount issued Euro 1 billion.** Principal amount issued CHF 450 million.*** In December 2012, the Company entered into interest rate swap agreements with respect to these notes (see note 15).
In March 2011, a finance subsidiary of the Company issued an aggregate of $750 million principal amount of senior notes. All such notes areguaranteed by Teva.
In November 2011, finance subsidiaries of the Company issued an aggregate of $5.0 billion principal amount of senior notes. All such notes areguaranteed by Teva.
In June 2012, Teva redeemed $1.0 billion principal amount of its 1.5% senior notes due 2012.
In January 2013, Teva redeemed $1.0 billion principal amount of its 1.7% senior notes due 2014.
2) The balance as of December 31, 2012 and 2011 is mainly composed of:
(i.) Loans from the European Investment Bank (EIB) denominated in Euro (mainly) and USD in the amount of $410 million and $405 million,
respectively. The loans are due in 2015 and bear interest determined on the basis of Euro LIBOR (mainly) and USD LIBOR.
(ii.) A ¥100.5 billion senior unsecured fixed rate term loan credit agreement for 5 and 7 years with interest rates of 0.99% and 1.42%, respectively. In
April 2012, Teva drew down the entire amount available under the facility ($1.2 billion) and repaid the borrowings used to finance the acquisitionof Taiyo (approximately $1 billion).
(iii.) Japan debt of $376 million mainly related to the Taiyo acquisition comprised of bank loans, capital leases and other loans.
F-32

Table of Contents
TEVA PHARMACEUTICAL INDUSTRIES LIMITEDNotes To Consolidated Financial Statements
3) Certain loan agreements and debentures contain restrictive covenants, mainly the requirement to maintain certain financial ratios. As of December 31,
2012, the Company met all financial covenants. b. The Company and certain subsidiaries entered into negative pledge agreements with certain banks and institutional investors. Under the agreements, the
Company and such subsidiaries have undertaken not to register floating charges on assets in favor of any third parties without the prior consent of thebanks, to maintain certain financial ratios and to fulfill other restrictions, as stipulated by the agreements.
c. The required annual principal payments of long-term debt, starting with the year 2014, are as follows:
December 31,
2012 (U.S. $ in millions) 2014 $ 840 2015 1,539 2016 1,486 2017 792 2018 and thereafter 7,028
$ 11,685
As of December 31, 2012, the fair value of the interest rate swap transactions, which were terminated, included under senior notes and loans were $27million.
The above does not include the convertible senior debentures described in note 11.
NOTE 11—CONVERTIBLE SENIOR DEBENTURES:Convertible senior debentures amounted to $530 million and $531 million at December 31, 2012 and 2011, respectively, comprised primarily of the
0.25% convertible senior debentures due 2026. These convertible senior debentures include a “net share settlement” feature according to which the principal ofthe debenture will be paid in cash and in case of conversion, only the residual conversion value above the principal will be paid in Teva shares. Due to the “netshare settlement” feature, these convertible senior debentures are classified in the balance sheet under short term debt and current maturities of long term debt.The earliest redemption by its holders is February 1, 2016.
NOTE 12—COMMITMENTS AND CONTINGENCIES:
a . Commitments:
1) Operating leases:
As of December 31, 2012, minimum future rentals under operating leases of buildings, machinery and equipment for periods in excess of oneyear were as follows: 2013—$99 million; 2014—$91 million; 2015—$59 million; 2016—$41 million; 2017—$36 million; 2018 and thereafter—$99 million.
The lease fees expensed in each of the years ended December 31, 2012, 2011 and 2010 were $132 million, $115 million and $90 million,respectively, of which an amount of less than $0.5 million, was to related parties in the years ended December 31, 2012, 2011 and 2010.
2) Royalty commitments:
The Company is committed to pay royalties to owners of know-how, partners in alliances and other certain arrangements and to parties thatfinanced research and development, at a wide range of rates as a
F-33

Table of Contents
TEVA PHARMACEUTICAL INDUSTRIES LIMITEDNotes To Consolidated Financial Statements
percentage of sales or of the gross margin of certain products, as defined in the agreements. In some cases, the royalty period is not defined; in othercases, royalties will be paid over various periods.
b. Contingencies:
GeneralFrom time to time, Teva and its subsidiaries are subject to claims for damages and/or equitable relief arising in the ordinary course of business. In
addition, as described below, in large part as a result of the nature of its business, Teva is frequently subject to patent litigation. Teva believes that it hasmeritorious defenses to all actions brought against it and vigorously pursues the defense or settlement of each such action. Except as described below, Tevadoes not currently have a reasonable basis to estimate the loss, or range of loss, that is reasonably possible with respect to such actions.
Teva records a provision in its financial statements to the extent that it concludes that a contingent liability is probable and the amount thereof isestimable. Based upon the status of these cases, management’s assessment of the likelihood of damages, and the advice of counsel, no provisions have beenmade except as noted below. Because litigation outcomes and contingencies are unpredictable, and because excessive verdicts can occur, these assessmentsinvolve complex judgments about future events and can rely heavily on estimates and assumptions.
Based on currently available information, Teva believes that none of the proceedings brought against it described below is likely to have a materialadverse effect on its financial condition. However, if one or more of such proceedings were to result in final judgments against Teva, such judgments could bematerial to its results of operations and cash flow in a given period. In addition, Teva may incur significant legal and related expenses in the course ofdefending its positions even if the facts and circumstances of a particular litigation do not give rise to a provision in the financial statements.
From time to time, Teva seeks to develop generic versions of patent-protected pharmaceuticals for sale prior to patent expiration in various territories. Inthe United States, to obtain approval for most generics prior to the expiration of the originator’s patent(s), Teva must challenge the patent(s) under theprocedures set forth in the Hatch-Waxman Act of 1984, as amended. To the extent that Teva seeks to utilize such patent challenge procedures, Teva is andexpects to be involved in patent litigation regarding the validity, enforceability or infringement of the originator’s patent(s). Teva may also be involved in patentlitigation involving the extent to which its products or manufacturing processes may infringe originator or third-party process patents. From time to time, Tevais also involved in litigation regarding patents in other countries where it does business. The laws concerning generic pharmaceuticals and patents differ fromcountry to country.
Additionally, depending upon a complex analysis of a variety of legal and commercial factors, Teva may, in certain circumstances, elect to market ageneric version even though litigation is still pending. This could be before any court decision is rendered or while an appeal of a lower court decision ispending. To the extent Teva elects to proceed in this manner, it could face substantial liability for patent infringement if the final court decision is adverse toTeva.
The general rule for damages in patent infringement cases is that the patentee should be compensated by no less than a reasonable royalty, and it mayalso be able in certain circumstances to be compensated for its lost profits. The amount of a reasonable royalty award would be calculated based on the sales ofTeva’s generic product. The amount of lost profits would be based on the lost sales of the branded product. The launch of an authorized generic and othergeneric competition may be relevant to the damages calculation. In addition, in some jurisdictions, such as the United States, the patentee may seekconsequential damages as well as enhanced damages of up to three times the profits lost by the patent holder for willful infringement, although courts havetypically awarded much lower multiples.
F-34

Table of Contents
TEVA PHARMACEUTICAL INDUSTRIES LIMITEDNotes To Consolidated Financial Statements
Although Teva currently has insurance coverage for certain products and types of damages for patent infringement, a claim for coverage may be subject
to a deductible, involve a co-insurance participation, exceed policy limits or ultimately be found to relate to damages that are not covered by Teva’s policy, andinsurance for additional products may be difficult to obtain. Furthermore, any insurance recovery would not be recognized for financial statement purposesuntil collection is assured.
Teva’s business inherently exposes it to potential product liability claims. As Teva’s portfolio of available medicines continues to expand, the number ofproduct liability claims asserted against Teva has increased. Teva maintains product liability insurance coverage in amounts and with terms that it believes arereasonable and prudent in light of its business and related risks. However, Teva sells, and will continue to sell, pharmaceuticals that are not covered byinsurance; in addition, it may be subject to claims for which insurance coverage is denied as well as claims that exceed its policy limits. Product liabilitycoverage for pharmaceutical companies is becoming more expensive and increasingly difficult to obtain. As a result, Teva may not be able to obtain the typeand amount of coverage it desires.
In connection with third-party agreements, Teva may under certain circumstances be required to indemnify, and may be indemnified by, in unspecifiedamounts, the parties to such agreements against third-party claims. Teva’s agreements with third parties may require Teva to indemnify them, or require themto indemnify Teva for the costs and damages incurred in connection with product liability claims, in specified or unspecified amounts.
Except as otherwise noted, all of the litigation matters disclosed below involve claims arising in the United States. All third-party sales figures givenbelow are based on IMS data.
Intellectual Property MattersIn June 2007, Teva Canada commenced sales of its 2.5 mg, 5 mg, 7.5 mg, 10 mg and 15 mg olanzapine tablets, which are the generic versions of Eli
Lilly’s Zyprexa . Zyprexa had annual sales in Canada of approximately $180 million for the twelve months ended May 2007. Following the launch, Lillysued Teva Canada for patent infringement. In October 2009, the patent at issue (which expired in April 2011) was held by the Federal Court to be invalid. InJuly 2010, the Federal Court of Appeal set aside the judgment and sent back two grounds of invalidity for reconsideration. In November 2011, the FederalCourt again held the patent to be invalid. Lilly’s subsequent appeal of the Federal Court’s reconsideration decision was heard and dismissed from the bench bythe Federal Court of Appeal on September 10, 2012. On November 8, 2012, Lilly filed an application for leave to appeal the decision to the Supreme Court ofCanada.
In December 2007, Teva commenced sales of its 20 mg and 40 mg pantoprazole sodium tablets. Pantoprazole sodium tablets are the AB-rated genericversions of Wyeth’s Protonix , which had annual sales of approximately $2.5 billion for the twelve months ended September 2007. Altana Pharma and WyethPharmaceuticals (collectively, “Wyeth”) had previously sued Teva for patent infringement, and in September 2007, the United States District Court for theDistrict of New Jersey had denied Wyeth’s motion for a preliminary injunction. In May 2009, the Court of Appeals for the Federal Circuit affirmed the DistrictCourt’s denial of the preliminary injunction. Subsequently, a jury trial was held, and in April 2010, the jury returned a verdict finding that the patent, whichTeva had infringed, was not invalid. In July 2010, the District Court denied Teva’s motion to overturn the verdict. Teva intends to appeal the jury verdict andthe District Court’s decision, but cannot do so until after completion of the trial of the damages phase of the case, which is scheduled to begin June 3, 2013.
The patent at issue expired in July 2010, and Wyeth was granted pediatric exclusivity, which expired in January 2011. Teva’s sales of pantoprazolesodium tablets prior to January 2011 were approximately $1.1 billion.
F-35
® ®
®

Table of Contents
TEVA PHARMACEUTICAL INDUSTRIES LIMITEDNotes To Consolidated Financial Statements
In January 2012, Wyeth filed confidential expert reports asserting claims for damages and prejudgment interest of approximately $2.1 billion. Wyeth
has also asserted that Teva may be responsible for some or all of the damages allegedly caused by co-defendant Sun Pharmaceutical Industries, Ltd. Tevasubmitted its expert reports in April 2012, which estimated damages significantly below Wyeth’s assessment. Although Wyeth’s complaint alleged thatdefendants’ infringement was willful, its subsequent written discovery responses stated that it did not intend to seek increased damages for willfulinfringement. Teva vigorously disputes Wyeth’s claims as well as any liability for damages allegedly caused by Sun. Teva also disputes the amount ofWyeth’s alleged damages and will contend that any damages allegedly caused by Teva are substantially less than asserted by Wyeth. Various motions forpartial summary judgment are pending which could have an effect on the outcome.
In light of a legal development in the third quarter of 2012 in an unrelated case pertaining to one of Teva’s patent infringement defenses, managementrecorded a provision in the amount of $670 million in the financial statements for this matter. Management estimates that the ultimate resolution of this mattercould result in a loss of up to $1.4 billion in excess of the amount accrued.
***
Teva’s leading specialty medicine, Copaxone (glatiramer acetate), which is responsible for a very significant contribution to Teva’s profits and cashflow from operations, faces patent challenges in various jurisdictions, including the United States and various European countries. In August 2008, followingthe submission by Sandoz Inc. and Momenta Pharmaceuticals, Inc. of an ANDA for a generic version of Copaxone , Teva sued Sandoz, its parent NovartisAG and Momenta in the United States District Court for the Southern District of New York for infringement of four Orange Book patents, which expire onMay 21, 2014. An additional five patents are at issue in the litigation, including one process patent that expires on September 1, 2015. This case has beenconsolidated with a subsequently-filed patent infringement suit against Mylan Laboratories and Natco Pharma Limited. In August 2011, the District Courtissued its claim construction opinion, which adopted all relevant interpretations by Teva and rejected all of the interpretations put forth by Sandoz/Momentaand Mylan/Natco (collectively, the “Defendants”). A trial on inequitable conduct took place in June 2011, and a trial on validity and infringement took placein September 2011. On June 22, 2012, the District Court issued its trial decision, in which it upheld the validity and enforceability of the nine patents at issueand found that Defendants’ purported generic products would infringe all nine patents. As a result of this decision, on July 24, 2012, the District Courtenjoined the FDA from granting final approval to the Defendants’ ANDAs prior to May 24, 2014, and enjoined the Defendants from selling their purportedgeneric products until September 1, 2015. The Defendants have appealed the District Court’s rulings. The appellate briefing is ongoing.
In April 2012, Teva filed suit in the United States District Court for the Southern District of New York against Synthon Pharmaceuticals (“Synthon”)following Synthon’s submission of an ANDA for a generic version of Copaxone . The filing of this action led to a 30-month stay of FDA approval ofSynthon’s ANDA. The litigation against Synthon remains stayed pending the resolution of the appeal in the Sandoz and Mylan action.
Mylan has also challenged the patents on Copaxone in Europe. On March 1, 2011, Generics UK Limited (a Mylan subsidiary) initiated proceedingsbefore the UK High Court challenging the validity of the U.K. counterpart to the Orange Book patents, which expires on May 23, 2015, and asserting that itsproposed product does not infringe. On July 11, 2012, the court ruled in favor of Teva. Mylan has appealed the court’s ruling, and an appellate hearing isscheduled for June 2013. On August 4, 2011, Mylan SAS, initiated revocation proceedings challenging the validity of the French counterpart to the OrangeBook patents, which expires on May 23, 2015. No trial date has been scheduled. On September 20, 2012, Mylan B.V. initiated revocation proceedingschallenging the validity of the Dutch counterpart to the Orange Book patents, which expires on May 23, 2015. A trial is scheduled for the end of June 2013.Mylan has also applied for a declaration of non-infringement for its proposed product, and a trial is scheduled for November 2013.
F-36
®
®
®
®

Table of Contents
TEVA PHARMACEUTICAL INDUSTRIES LIMITEDNotes To Consolidated Financial Statements
Although Teva believes that Copaxone has strong patent protection and that an equivalent generic version would be difficult to develop, if the FDA were
to approve one or more generic versions of Copaxone and Teva’s patents were successfully challenged, or if there were a launch at risk, Teva would facegeneric competition for Copaxone , which would be likely to affect its results of operations adversely.
Other Teva innovative, branded or specialty medicines, including Azilect , Nuvigil , Amrix , Fentora and ProAir HFA, are also subject to patentchallenges.
Product Liability MattersOn June 23, 2011, the United States Supreme Court held, in Pliva, Inc. v. Mensing, one of the metoclopramide cases mentioned below, that federal law
preempts state law product liability claims brought against generic pharmaceutical manufacturers under a “failure to warn” theory. Teva believes that thisdecision is likely to reduce its aggregate exposure in currently pending product liability lawsuits, including those described below, although the extent of suchreduction is uncertain at this time. On November 30, 2012, the United States Supreme Court granted certiorari in Mutual Pharmaceutical Company, Inc. v.Bartlett after the United States Court of Appeals for the First Circuit held in that case that “design defect” claims against a generic manufacturer are notpreempted by federal law because the manufacturer could have refrained from selling the product. The Supreme Court’s decision in Bartlett could also affectTeva’s aggregate exposure in its pending product liability lawsuits.
Teva subsidiaries Barr Pharmaceuticals and Duramed have been named as defendants in approximately 6,000 personal injury product liability casesbrought against them and other manufacturers by plaintiffs claiming injuries from the use of certain estrogen and progestin products. The cases primarilyinvolve medroxyprogesterone acetate (a progestin that has been prescribed to women receiving estrogen-containing hormone therapy). A much smaller numberof cases involves Cenestin (an estrogen-containing medicine sometimes prescribed to treat symptoms associated with menopause). A high percentage of theplaintiffs were unable to demonstrate actual use of a Barr or Duramed product. As a result, approximately 5,500 cases have been dismissed on that basis.There are approximately 335 cases pending, and additional dismissals are possible. Of the 335 pending cases, approximately 250 are in multidistrict litigationin an Arkansas federal court and involve the alleged ingestion of generic drugs. The vast majority of the claims are covered by insurance.
Teva and its subsidiaries have been named as defendants in over 3,000 product liability lawsuits brought against them and other manufacturers byapproximately 4,300 plaintiffs claiming injuries (including allegations of neurological disorders, such as tardive dyskinesia) from the use of metoclopramide(the generic form of Reglan ). Certain of these claims are covered by insurance. For over twenty years, the FDA-approved label for metoclopramide hascontained warning language about the risk of tardive dyskinesia, and that the risk of developing this disorder increased with duration of treatment and totalcumulative dose. In February 2009, the FDA announced that manufacturers of metoclopramide would be required to revise the label, including the addition ofa “black box” warning about the risk of tardive dyskinesia from long-term exposure to metoclopramide. It has not yet been determined how many plaintiffsactually used a Teva product. If the plaintiffs cannot demonstrate that they used a Teva product, Teva expects to be dismissed from at least some of thosecases. Approximately 40% of plaintiffs are parties to cases against Teva that are part of a mass tort proceeding in the Philadelphia County Court of CommonPleas. All of the cases in the Philadelphia court have been stayed with respect to the generic defendants pending resolution of appeals regarding whether theclaims should be dismissed due to federal preemption. Oral argument for those appeals was held on November 28, 2012. In addition to the Philadelphia masstort proceeding, there are mass tort proceedings underway in state courts in California and New Jersey. In the California litigation, which now includes abouthalf of the total plaintiffs, the trial court denied an attempt by the defendants to dismiss the case. The California Court of Appeals and the
F-37
®
®
®
® ® ® ® ®
®
®

Table of Contents
TEVA PHARMACEUTICAL INDUSTRIES LIMITEDNotes To Consolidated Financial Statements
California Supreme Court declined to review the trial court’s ruling. In the New Jersey proceeding, the trial court granted the defendants’ motion to dismiss, onfederal preemption grounds, all claims other than those based on an alleged failure to timely update the label.
Competition MattersIn April 2006, Teva Pharmaceuticals USA, Inc. (“Teva USA”), Barr Laboratories, Inc. and Cephalon, Inc. (all subsidiaries of Teva) were named,
along with Mylan Laboratories, Inc., Ranbaxy Laboratories Ltd. and Ranbaxy Pharmaceuticals, Inc., in a class action lawsuit filed in the United StatesDistrict Court for the Eastern District of Pennsylvania. The case alleges generally that the settlement agreements entered into between the different genericpharmaceutical companies and Cephalon, in their respective patent infringement cases involving finished modafinil products (the generic version of Provigil ),were unlawful because the settlement agreements resulted in the exclusion of generic competition. The case was brought by King Drug Company of Florence,Inc. on behalf of itself and as a proposed class action on behalf of any other person or entity that purchased Provigil directly from Cephalon from January2006 until the alleged unlawful conduct ceases. Similar allegations have been made in a number of additional complaints, including those filed on behalf ofproposed classes of direct and indirect purchasers, by an individual indirect purchaser, by certain retail chain pharmacies and by Apotex, Inc. These casesseek various forms of injunctive and monetary relief, including damages based on the difference between the brand price and what the generic price wouldhave been, as well as disgorgement of profits, trebled under the relevant statutes, plus attorneys’ fees and costs. In February 2008, following an investigationof these matters, the Federal Trade Commission (“FTC”) sued Cephalon, alleging that Cephalon violated Section 5 of the Federal Trade Commission Act,which prohibits unfair or deceptive acts or practices in the marketplace, by unlawfully maintaining a monopoly in the sale of Provigil and improperlyexcluding generic competition. In March 2010, the District Court denied defendants’ motions to dismiss the federal antitrust claims and some of the relatedstate law claims. Another class action lawsuit with essentially the same allegations was initiated by an independent pharmacy in Tennessee in November 2009and dismissed in December 2010. In May 2010, another independent pharmacy also filed suit in Ohio with the same allegations. This case has beentransferred to the Eastern District of Pennsylvania.
On October 31, 2011, the District Court hearing the antitrust cases described above, as well as patent claims brought by plaintiff Apotex, issued itsdecision regarding Apotex’s invalidity claims as to Cephalon’s Patent No. RE 37,516, finding the patent to be invalid based on obviousness, among otherthings, and unenforceable based on inequitable conduct. On March 29, 2012, the District Court ruled that Apotex’s product does not infringe Cephalon’spatent. Cephalon appealed the invalidity and inequitable conduct decisions on May 7, 2012. Plaintiffs in the antitrust case have asked the District Court toapply the inequitable conduct and invalidity findings to the antitrust cases in an effort to establish antitrust liability, but the District Court has not yet ruled onthose requests.
On July 16, 2012, the United States Court of Appeals for the Third Circuit issued its decision in the In re K-Dur Antitrust Litigation, finding thatpatent settlement agreements between generic and branded pharmaceutical manufacturers should be analyzed not under a “scope of the patent” test that otherfederal Courts of Appeals have applied, but under a “quick look rule of reason” analysis. In doing so, it found that if a brand pharmaceutical companymakes a payment to a generic pharmaceutical company under a settlement agreement in order to resolve patent litigation, the payment creates a rebuttablepresumption that the agreement is an unreasonable restraint on trade. Because of the split in the Courts of Appeal, it is unclear what effect, if any, this rulingwill have on the modafinil antitrust litigation or on other litigations listed herein. The defendants in the K-Dur case have filed petitions for a writ of certiorarito the United States Supreme Court On December 7, 2012, the United States Supreme Court granted certiorari in Federal Trade Commission v. WatsonPharmaceuticals, Inc. , (the “AndroGel case”), in which the United States Court of Appeals for the Eleventh Circuit held that settlement agreements betweengeneric and branded pharmaceutical manufacturers should be analyzed under the
F-38
®
®
®

Table of Contents
TEVA PHARMACEUTICAL INDUSTRIES LIMITEDNotes To Consolidated Financial Statements
“scope of the patent” test. The District Court in the modafinil antitrust cases has stayed further proceedings pending resolution of the K-Dur certioraripetition, which will be resolved after a decision in the AndroGel case. The District Court has not yet set a schedule for pretrial or trial proceedings in theantitrust litigation.
In April 2011, the European Commission opened a formal investigation against both Cephalon and Teva to assess whether the 2005 settlement agreementbetween the parties may have had the object or effect of hindering the entry of generic modafinil. The opening of proceedings indicates that the Commissionwill investigate the case as a matter of priority, but does not mean that there has been a definitive finding of violation of law.
Barr has been named as a co-defendant with Bayer Corporation, The Rugby Group, Inc. and others in approximately 38 class action complaints filed instate and federal courts by direct and indirect purchasers of ciprofloxacin (Cipro ) from 1997 to the present. The complaints allege that a 1997 Bayer-Barrpatent litigation settlement agreement was anti-competitive and violated federal antitrust laws and/or state antitrust and consumer protection laws. In March2005, the court in the federal multi-district litigation granted summary judgment in Barr’s favor and dismissed all of the federal actions before it. Followingunsuccessful appeals and petitions for certiorari that were denied by the United States Supreme Court, the federal actions have effectively ended. In addition,all but three state cases (California, Kansas and Florida) have been dismissed. In the California case, the trial court granted defendants’ summary judgmentmotions, and the California Court of Appeal affirmed in October 2011. Plaintiffs petitioned for review by the California Supreme Court, which has decided tohear the appeal; however, the California Supreme Court has suspended the briefing pending the Supreme Court’s disposition of the K-Dur petition forcertiorari, which will be resolved after a decision in the AndroGel case. The Kansas action is stayed, and the Florida action is in the very early stages, withno hearings or schedule set to date.
In December 2011, three groups of plaintiffs sued Wyeth and Teva for alleged violations of the antitrust laws in connection with their settlement of patentlitigation involving venlafaxine ER (generic Effexor ER). The cases were filed by a purported class of direct purchasers, by a purported class of indirectpurchasers and by certain chain pharmacies. Plaintiffs claim that the settlement agreement between Wyeth and Teva unlawfully delayed generic entry.Plaintiffs also have asserted claims against Wyeth alone for fraud on the United States Patent Office. The cases seek unspecified damages. Teva filed motionsto dismiss on April 6, 2012. The Court has stayed the cases in their entirety pending the Supreme Court’s disposition of the K-Dur petition for certiorari,which will be resolved after a decision in the AndroGel case.
In February 2012, two purported classes of direct-purchaser plaintiffs sued GlaxoSmithKline and Teva for alleged violations of the antitrust laws inconnection with their settlement of patent litigation involving lamotrigine (generic Lamictal ). In August 2012, a purported class of indirect purchaser plaintiffsfiled a nearly identical complaint against GSK and Teva. Plaintiffs claim that the settlement agreement unlawfully delayed generic entry. The cases seekunspecified damages. GSK and Teva filed motions to dismiss on August 15, 2012, and on December 6, 2012, the court dismissed the cases. Plaintiffs haveappealed that decision.
Starting in September 2012, plaintiffs in eleven cases, including overlapping purported class actions, sued AstraZeneca and Teva, as well as Ranbaxyand Dr. Reddy’s, for violating the antitrust laws by entering into settlement agreements to resolve the esomeprazole (generic Nexium ) patent litigation. Thesecases have all been consolidated and transferred to the District of Massachusetts. The cases are on the running trial list for February 2014.
Teva believes that the agreements at issue in the foregoing matters are valid settlements to patent lawsuits which do not form the basis of an antitrustclaim. However, if the Supreme Court were to decide the AndroGel case by rejecting or restricting the “scope of the patent” test, it could potentially lead toincreased scrutiny of Teva’s patent settlements, additional administrative action by the FTC and increased risk of liability in Teva’s currently pendingantitrust litigations.
F-39
®
®
®
®

Table of Contents
TEVA PHARMACEUTICAL INDUSTRIES LIMITEDNotes To Consolidated Financial Statements
Government Reimbursement Investigations and Drug Pricing Litigation
Together with many other pharmaceutical manufacturers, Teva and/or its subsidiaries in the United States, including Teva USA, Sicor Inc., IVAXPharmaceuticals, Inc., and Barr (collectively, the “Teva parties”), have been named as defendants in one or more of a number of cases in state and federalcourts throughout the country that relate generally to drug price reporting by manufacturers. Such price reporting is alleged to have caused governments andothers to pay inflated reimbursements for covered drugs. These drug pricing cases, which variously seek unspecified amounts in money damages, civilpenalties, treble damages, punitive damages, attorneys fees, and other administrative, injunctive, equitable or other relief, are at various stages of litigation.
A number of state attorneys general and others have filed various actions against the Teva parties (either collectively or individually) relating toreimbursements or drug price reporting under Medicaid or other programs. The Teva parties reached settlements in most of these cases, and remain parties tolitigation in Illinois, Missouri and Wisconsin. A settlement in principle was reached in the Missouri case. Trial in the Illinois case is scheduled to begin onOctober 23, 2013. A provision for the cases, including the settlements and settlements in principle, was included in the financial statements.
In December 2009, the United States District Court for the District of Massachusetts unsealed a complaint alleging that numerous drug manufacturers,including Teva USA and other subsidiaries, violated the federal False Claims Act in connection with Medicaid reimbursement for certain vitamins, dietarysupplements and DESI products that were allegedly ineligible for reimbursement. The Department of Justice declined to join in the matter. The defendants,including Teva USA, filed a motion to dismiss, which has not yet been decided.
Other Government InvestigationsIn 2008, Cephalon entered into settlement agreements with the U.S. government and various parties and states relating to allegations of off-label
promotion of Actiq , Provigil and Gabitril . In connection with the settlements, Cephalon agreed to plead guilty to one misdemeanor violation of the U.S.Food, Drug, and Cosmetic Act, pay a fine and settlement, and enter into a five-year corporate integrity agreement with the Office of the Inspector General of theDepartment of Justice. Cephalon continues to defend against putative class action and other complaints regarding its sales and marketing practices with respectto such products. For example, Cephalon is a defendant in a putative class action filed in United States District Court for the Eastern District of Pennsylvaniaclaiming that the plaintiffs suffered monetary losses because Actiq was promoted and prescribed for uses not approved by the FDA when there were allegedlyless expensive pain management drugs that were more appropriate for patients’ conditions. A separate set of plaintiffs allege similar claims against Cephaloninvolving the drugs Provigil and Gabitril . Cephalon is also a defendant in a lawsuit filed by the State of South Carolina alleging violations of the state’sunfair trade practices law in connection with the alleged off-label promotion of Actiq , Provigil and Gabitril . Additionally, Cephalon has received and hasresponded to subpoenas related to Treanda , Nuvigil and Fentora .
Beginning in 2012, Teva received subpoenas and informal document requests from the SEC and the Department of Justice to produce documents withrespect to compliance with the Foreign Corrupt Practices Act (“FCPA”) in certain countries. Teva is cooperating with the government. Teva is also conducting avoluntary investigation into certain business practices that may have FCPA implications and has engaged independent counsel to assist in its investigation. Inthe course of its investigation, which is continuing, Teva has identified issues that could potentially rise to the level of FCPA violations and has brought themto the attention of the SEC and DOJ. These matters are in their early stages, and no conclusion can be drawn at this time as to any likely outcomes.
F-40
® ® ®
®
® ®
® ® ®
® ® ®

Table of Contents
TEVA PHARMACEUTICAL INDUSTRIES LIMITEDNotes To Consolidated Financial Statements
Environmental Matters
Teva’s subsidiaries, including those in the United States and its territories, are parties to a number of proceedings, including some brought pursuant tothe Comprehensive Environmental Response, Compensation and Liability Act (commonly known as the Superfund law) or other national, federal, provincialor state and local laws imposing liability for alleged non-compliance with various environmental laws and regulations or for the investigation and remediationof releases of hazardous substances and for natural resource damages. Many of these proceedings seek to require the generators of hazardous wastes disposedof at a third-party owned site, or the party responsible for a release of hazardous substances into the environment that impacted a site, to investigate and cleanup the sites or to pay for such activities, including for oversight by governmental authorities, the response costs associated with such oversight and for anyrelated damages to natural resources. Teva and/or certain of its subsidiaries have been made a party to these proceedings, along with other potentiallyresponsible parties, as an alleged generator of wastes that were disposed of or treated at third-party waste disposal sites, or as a result of an alleged release fromone of Teva and/or its subsidiaries’ (or its predecessors’) facilities or former facilities that may have adversely impacted the environment.
In many of these cases, the government or private litigants allege that the responsible parties are jointly and severally liable for the investigation andcleanup costs. Although the liability among the responsible parties may be joint and several, these proceedings are frequently resolved so that the allocation ofcleanup and other costs among the parties reflects the relative contributions of the parties to the site conditions and takes into account other pertinent factors.Teva’s potential liability varies greatly at each of the sites in the proceedings; for some sites the costs of the investigation, cleanup and natural resourcedamages have not yet been determined, and for others Teva’s allocable share of liability has not been determined. At other sites, Teva has been paying a shareof the costs, the amounts of which have not been, and are not expected to be, material. Teva has taken an active role in identifying those costs, to the extentthey are identifiable and estimable, which do not include reductions for potential recoveries of cleanup costs from insurers, indemnitors, former site owners oroperators or other potentially responsible parties. In addition, civil proceedings relating to alleged federal and state regulatory violations at some of Teva’sfacilities may result in the imposition of significant civil penalties (in amounts not expected to materially adversely affect Teva’s results of operations) and therecovery of certain state costs and natural resource damages, and may require that corrective action measures be implemented.
NOTE 13—EQUITY:
a . Share capital:As of December 31, 2012, there were 944 million ordinary shares issued (December 31, 2011—942 million). Teva shares are traded on the Tel-Aviv
Stock Exchange (“TASE”) and, in the form of American Depository Shares, each of which represents one ordinary share, on the New York Stock Exchangein the United States.
Share repurchase programIn December 2010, Teva’s board of directors authorized the Company to repurchase up to an aggregate of $1 billion of its ordinary shares/ADSs over a
period of 12 months.
In December 2011, Teva’s board of directors authorized the Company to repurchase up to an aggregate of $3 billion of its ordinary shares/ADSs. Thisrepurchase authorization has no time limits.
During the years ended December 31, 2012, 2011 and 2010, the Company spent approximately $1.2 billion, $899 million and $99 million,respectively, to repurchase approximately 28 million, 20 million and 2 million of its shares, respectively.
F-41

Table of Contents
TEVA PHARMACEUTICAL INDUSTRIES LIMITEDNotes To Consolidated Financial Statements
b. Registered offerings:
In December 2011, the Company filed a shelf registration statement with the U.S. Securities and Exchange Commission. Under this registrationstatement, Teva may, from time to time, sell shares, debt securities and/or any other securities described in the registration statement in one or more offerings. c. Stock-based compensation plans:
Stock-based compensation plans comprise employee stock option plans and restricted stock units (“RSUs”) and other equity-based awards toemployees, officers and directors. The purpose of the plans is to enable the Company to attract and retain qualified personnel and to motivate such persons byproviding them with an equity participation in the Company.
On June 29, 2010, Teva Long-Term Equity-Based Incentive Plan was approved by the shareholders, under which 70 million equivalent stock units,including both options exercisable into ordinary shares and RSUs, were approved for grant. As of December 31, 2012, 32 million equivalent stock unitsremain available for future awards.
In the past, we had various employee stock and incentive plans under which stock options and other share-based awards were granted. Stock optionsand other share-based awards granted under such prior plans continue in accordance with the terms of the respective plans.
The vesting period of the outstanding options and RSUs is generally 1 to 4 years from the date of grant. The rights of the ordinary shares obtained fromthe exercise of options or RSUs are identical to those of the other ordinary shares of the Company. The contractual term of these options is primarily for sevenyears in prior plans and ten years for options granted under the newly approved plan described above.
Status of optionsA summary of the status of the option plans as of December 31, 2012, 2011 and 2010, and changes during the years ended on those dates, is presented
below (the number of options represents ordinary shares exercisable in respect thereof). Year ended December 31, 2012 2011 2010
Number(in
thousands)
Weightedaverage
exercise price
Number(in
thousands)
Weightedaverage
exercise price
Number(in
thousands)
Weightedaverage
exercise price $ $ $ Balance outstanding at beginning of year 33,298 44.92 28,164 44.77 30,057 38.66 Changes during the year:
Granted 7,231 40.50 9,550 42.56 6,062 50.62 Exercised (704) 33.36 (2,295) 30.21 (7,273) 24.53 Forfeited (3,245) 44.76 (2,121) 48.61 (682) 43.29
Balance outstanding at end of year 36,580 44.40 33,298 44.92 28,164 44.77 Balance exercisable at end of year 14,230 44.30 11,456 41.01 9,862 36.17
F-42

Table of Contents
TEVA PHARMACEUTICAL INDUSTRIES LIMITEDNotes To Consolidated Financial Statements
The weighted average fair value of options granted during the years were estimated by using the Black-Scholes option-pricing model:
Year ended December 31, 2012 2011 2010 Weighted average fair value $ 7.4 $ 9.2 $ 9.7
The fair value of these options was estimated on the date of grant, based on the following weighted average assumptions:
Year ended December 31, 2012 2011 2010 Dividend yield 2.6% 2.0% 1.7% Expected volatility 24% 27% 24% Risk-free interest rates (in dollar terms) 1.3% 1.3% 1.7% Expected life 8 years 6 years 5 years
The expected term was estimated based on the weighted average period the options granted are expected to be outstanding, taking into consideration thecurrent vesting of options and the historical exercise patterns of existing option plans. The expected volatility assumption used is based on a blend of thehistorical and implied volatility of the Company’s stock. The risk-free interest rate used is based on the yield of U.S Treasuries with a maturity closest to theexpected term of the options granted. The dividend yield assumption reflects the expected dividend yield based on historical dividends. Pre-vesting forfeiturerates of between 2% and 9% were estimated based on pre-vesting forfeiture experience.
The following tables summarize information at December 31, 2012 regarding the number of ordinary shares issuable upon: (1) outstanding options and(2) vested options:
(1) Number of ordinary shares issuable upon exercise of outstanding options
Range of exercise prices Balance at end of
period (in thousands) Weighted average
exercise price Weighted average
remaining life Aggregate intrinsicvalue (in thousands)
Number of shares $ Years $ $10.30 - $15.20 5 6 13.99 1.15 1,297 $15.21 - $22.50 8 21.59 1.53 125 $22.51 - $32.30 808 32.19 0.93 4,159 $32.31 - $38.00 1,959 32.54 0.96 9,403 $38.01 - $43.00 15,935 40.79 8.15 — $43.01 - $45.00 3,932 44.16 3.82 — $45.01 - $52.00 9,419 49.43 6.56 — $52.01 - $65.00 4,463 54.70 3.97 —
Total 36,580 44.40 6.21 14,984
F-43

Table of Contents
TEVA PHARMACEUTICAL INDUSTRIES LIMITEDNotes To Consolidated Financial Statements
(2) Number of ordinary shares issuable upon exercise of vested options
Range of exercise prices
Balance at end ofperiod
(in thousands) Weighted average
exercise price Weighted average
remaining life Aggregate intrinsicvalue (in thousands)
Number of shares $ Years $ $10.30 - $15.20 5 6 13.99 1.15 1,297 $15.21 - $22.50 8 21.59 1.53 125 $22.51 - $32.30 808 32.19 0.93 4,159 $32.31 - $38.00 1,959 32.54 0.96 9,403 $38.01 - $43.00 2,802 41.62 2.91 — $43.01 - $45.00 2,836 44.01 2.05 — $45.01 - $52.00 3,223 49.85 5.03 — $52.01 - $65.00 2,538 54.17 3.96 —
Total 14,230 44.30 3.02 14,984
The aggregate intrinsic value in the above tables represents the total pre-tax intrinsic value, based on the Company’s closing stock price of $37.34 onDecember 31, 2012, less the weighted average exercise price per range. This represents the potential amount receivable by the option holders had all optionholders exercised their options as of such date. The total number of in-the-money options exercisable as of December 31, 2012 was 2.8 million.
The total intrinsic value of options exercised during the years ended December 31, 2012, 2011 and 2010 was $6 million, $35 million and $222million, respectively, based on the Company’s average stock price of $41.63, $45.49 and $55.09 during the years then ended, respectively.
Status of non-vested RSUsThe fair value of RSUs is estimated based on the market value of the Company’s stock on the date of award, less an estimate of dividends that will not
accrue to RSU holders prior to vesting.
The following table summarizes information about the number of RSUs issued and outstanding: Year ended December 31, 2012 2011 2010
Number(in
thousands)
Weightedaverage grant
date fairvalue$
Number(in
thousands)
Weightedaverage grant
date fairvalue$
Number(in
thousands)
Weightedaverage grant
date fairvalue$
Balance outstanding at beginning of year 3,093 43.23 2,290 45.78 2,063 43.51 Granted 1,320 38.00 1,295 39.41 672 47.57 Vested (519) 45.65 (389) 44.43 (379) 37.20 Forfeited (150) 43.97 (103) 45.49 (66) 42.22 Balance outstanding at end of year 3,744 41.04 3,093 43.23 2,290 45.78
F-44

Table of Contents
TEVA PHARMACEUTICAL INDUSTRIES LIMITEDNotes To Consolidated Financial Statements
The Company has expensed compensation costs, net of estimated forfeitures, based on the grant-date fair value. For the years ended December 31, 2012,
2011 and 2010, the Company recorded stock-based compensation costs as follows:
Year ended December 31, 2012 2011 2010 (U.S. in millions) Employee stock options $ 58 $ 63 $ 5 6 Restricted stock units (“RSUs”) 24 28 24 Total stock-based compensation expense 82 91 80 Tax effect on stock-based compensation expense 13 13 11 Net effect $6 9 $ 78 $ 6 9
The total unrecognized compensation cost before tax on employee stock options and RSUs amounted to $129 million and $92 million, respectively, atDecember 31, 2012, and is expected to be recognized over a weighted average period of 1.4 years for stock options and a weighted average period of 1.5 yearsfor RSUs. d. Dividends and accumulated other comprehensive income (loss):
1. Dividends are declared and paid in New Israeli Shekels (“NIS”). Dividends paid per share in the years ended December 31, 2012, 2011
and 2010 were $1.03, $0.89 and $0.74, respectively. Subsequent to December 31, 2012, the Company declared an additional dividend of1.15 NIS per share in respect of the fourth quarter of 2012.
2. Components of accumulated other comprehensive income (loss) attributable to Teva:
December 31, 2012 2011 2010 (U.S. in millions) Currency translation adjustment, net of tax $175 $ (455) $386 Unrealized gain (loss) from available-for-sale securities, net of tax (7) (72) 43 Unrealized loss from cash flow hedge (93) (30) (70) Other (92) (32) (9) Comprehensive income (loss) attributable to Teva $ (17) $(589) $ 350
NOTE 14—INCOME TAXES:
a . Income before income taxes is composed of the following:
Year ended December 31, 2012 2011 2010 (U.S. $ in millions ) The Parent Company and its Israeli subsidiaries $1,660 $ 2,051 $2,511 Non-Israeli subsidiaries 159 905 1,135
$1,819 $2,956 $ 3,646
F-45

Table of Contents
TEVA PHARMACEUTICAL INDUSTRIES LIMITEDNotes To Consolidated Financial Statements
b. Provision for income tax:
Year ended December 31, 2012 2011 2010 (U.S. $ in millions ) In Israel $ 5 $ 71 $ 139 Outside Israel (142) 5 6 144
$(137) $ 127 $ 283 Current $ 564 $ 689 $ 560 Deferred (701) (562) (277)
$(137) $ 127 $ 283
Reconciliation of the statutory tax rate of the Parent Company in Israel to the effective consolidated tax rate:
Year ended December 31, 2012 2011 2010 Statutory tax rate in Israel 25% 24% 25% Increase (decrease) in effective tax rate due to:
The Parent Company and its Israeli subsidiaries—mainly tax benefits arising fromreduced tax rates under benefit programs and deferred income taxes on net operatinglosses (29%) (17%) (18%)
Different effective tax rates applicable to non-Israeli subsidiaries (5%) (5%) (1%) Increase in uncertain tax positions—net 1% 2% 2%
Effective consolidated tax rate (8)% 4% 8%
In 2012, we booked a negative provision for tax which amounted to $137 million primarily due to a reduction in deferred tax liabilities as a result of thesignificant impairments and higher amortization expenses of intangible assets. Such impairments and amortization expenses were in jurisdictions with a taxrate that is higher than our average group tax rate, resulting in this unusual outcome. In 2011, the provision for taxes amounted to $127 million, or 4% of pre-tax income of $3.0 billion. In 2010, the provision for taxes amounted to $283 million, or 8% of pre-tax income of $3.6 billion. The effective tax rate is theresult of the geographic mix and type of products sold during the year, and a variety of factors, including different effective tax rates applicable to non-Israelisubsidiaries that have tax rates above Teva’s average tax rates (including the impact of impairment, restructuring and legal settlement charges on suchsubsidiaries). In addition, the release of reserves for uncertain tax positions and tax benefits as a result of mergers between recently acquired companies andour subsidiaries further reduced the effective tax rate for 2012.
F-46

Table of Contents
TEVA PHARMACEUTICAL INDUSTRIES LIMITEDNotes To Consolidated Financial Statements
c. Deferred income taxes:
Year ended December 31, 2012 2011 (U.S. $ in millions) Short-term deferred tax assets—net:
Inventory related $ 533 $ 299 Sales reserves and allowances 300 268 Provision for legal settlements 128 199 Provisions for employee-related obligations 79 49 Carryforward losses and deductions 68 113 Other 20 13
1,128 941 Valuation allowance—in respect of carryforward losses and deductions that may not be
utilized (5) (21) $ 1,123 $ 920
Long-term deferred tax assets (liabilities)—net: Intangible assets $ (1,883) $(2,562) Carryforward losses and deductions* 949 591 Property, plant and equipment (122) (185) Provisions for employee related obligations 14 40 Other 24 (1)
(1,018) (2,117) Valuation allowance—in respect of carryforward losses and deductions that may not be
utilized (721) (431) $(1,739) $ (2,548) $ (616) $ (1,628)
* This amount represents the tax effect of carry forward losses and deductions and expires as follows: 2014-2015—$36 million; 2016-2022—$119
million; 2023 and thereafter—$467 million. The remaining balance—$327 million—can be utilized with no expiration date.
The deferred income taxes are reflected in the balance sheets among:
December 31, 2012 2011 (U.S. $ in millions) Current assets—deferred income taxes $ 1,142 $ 9 6 6 Current liabilities—other current liabilities (19) (46) Other non-current assets 110 62 Long-term liabilities—deferred income taxes (1,849) (2,610)
$ (616) $(1,628)
Deferred income taxes have not been provided for tax-exempt profits earned by the Company from Approved Enterprises through December 31, 2012, asthe Company intends to permanently reinvest these profits and does not currently foresee a need to distribute dividends out of these earnings. For the samereason, deferred taxes have not been provided for distributions of income from the Company’s foreign subsidiaries. See Note 14f.
F-47

Table of Contents
TEVA PHARMACEUTICAL INDUSTRIES LIMITEDNotes To Consolidated Financial Statements
d. Uncertain tax positions:
The following table summarizes the activity of our unrecognized tax benefits:
Year ended December 31, 2012 2011 2010 (U.S. $ in millions) Balance at the beginning of the year $ 907 $795 $ 726 Increase (decrease) related to prior year tax positions, net (10) (45) 20 Increase related to current year tax positions 151 131 47 Decrease related to settlements with tax authorities and lapse of applicable statutes of
limitations (146) (20) (15) Liabilities assumed in acquisitions — 52 13 Other 1 (6) 4 Balance at the end of the year $ 903 $ 907 $795
Uncertain tax positions, mainly of a long-term nature, included accrued potential penalties and interest of $144 million, $115 million and $94 million,at December 31, 2012, 2011 and 2010, respectively. The total amount of interest and penalties in the consolidated statements of income was $29 million, $21million and $25 million for the years ended December 31, 2012, 2011 and 2010, respectively. Substantially all the above uncertain tax benefits, if recognized,would reduce our annual effective tax rate. Teva does not expect uncertain tax positions to change significantly over the next 12 months, except in the case ofsettlements with tax authorities, the likelihood of which is difficult to estimate. e. Tax assessments:
We file income tax returns in various jurisdictions with varying statutes of limitations. The Parent Company and its subsidiaries in Israel have receivedfinal tax assessments through tax year 2004.
Following audits of our 2005, 2006 and 2007 Israeli corporate tax returns, the Israeli Taxes Authority (the “ITA”) issued decrees for 2005 and 2006, anda tax assessment for 2007, challenging our positions on several issues, including matters related to the usage of funds earned by our Approved Enterprise forinvestments outside of Israel, deductibility of management stock option expenses, deductibility of research and development expenses and classification ofcertain dividends received from our subsidiary in Singapore. The decrees and assessment demand the payment of additional taxes in the aggregate amount ofNIS 530 million (approximately $142 million) with respect to 2005, NIS 2,137 million (approximately $573 million) with respect to 2006 and NIS700 million (approximately $188 million) with respect to 2007. The Parent Company intends to appeal the decrees and protest the assessment. We believe wehave adequately provided for these items and that any adverse results would have an immaterial impact on our financial statements.
The Company’s subsidiaries in North America and Europe have received final tax assessments mainly through tax year 2005. f. Basis of taxation:
The Company and its subsidiaries are subject to tax in many jurisdictions, and a certain degree of estimation is required in recording the assets andliabilities related to income taxes. The Company believes that its accruals for tax liabilities are adequate for all open years. The Company considers variousfactors in making these assessments, including past history, recent interpretations of tax law, and the specifics of each matter. Because tax regulations aresubject to interpretation and tax litigation is inherently uncertain, these assessments can involve a series of complex judgments regarding future events.
F-48

Table of Contents
TEVA PHARMACEUTICAL INDUSTRIES LIMITEDNotes To Consolidated Financial Statements
Most of the Parent Company’s industrial projects and several of its Israeli subsidiaries have been granted “Approved Enterprise” status under the Israeli
Law for the Encouragement of Capital Investments. For the vast majority of such Approved Enterprises, the companies elected to apply for alternative taxbenefits—the waiver of government grants in return for tax exemptions on undistributed income. Upon distribution of such exempt income, the distributingcompany will be subject to corporate tax at the rate ordinarily applicable to the Approved Enterprise’s income. Such tax exemption on undistributed incomeapplies for a limited period of between two to ten years, depending upon the location of the enterprise. During the remainder of the benefits period (generallyuntil the expiration of ten years), a corporate tax rate not exceeding 25% will apply. One Approved Enterprise of an Israeli subsidiary enjoys special benefitsunder the “Strategic Investment Track”; income accrued under this track during the benefits period is exempt from tax, and dividends distributed from suchincome are also exempt from Israeli tax.
Teva is a foreign investors company, or FIC, as defined by the Investment Law. FICs are entitled to further reductions in the tax rate normally applicableto Approved Enterprises. Depending on the foreign ownership in each tax year, the tax rate can range between 10% (when foreign ownership exceeds 90%) to25% (when the foreign ownership exceeds 49%). There can be no assurance that the Parent Company and its subsidiaries will continue to qualify as an FIC inthe future or that the benefits described herein will be granted in the future.
The amount of tax-exempt profit earned by the Company from Approved Enterprises through December 31, 2012 is approximately $15,140 million,and the tax that would have been payable had the Company distributed dividends out of that income is approximately $2,129 million. However, deferredtaxes have not been provided for such tax-exempt income, as the Company intends to permanently reinvest these profits and does not currently foresee a need todistribute dividends out of these earnings (see note 1t).
Likewise, the Company intends to reinvest, rather than distribute dividends from the income of its foreign subsidiaries. An assessment of the tax thatwould have been payable had the Company’s foreign subsidiaries distributed their income to the Company is not practicable because of the multiple levels ofcorporate ownership and multiple tax jurisdictions involved in each hypothetical dividend distribution.
Pursuant to a recent amendment to the Investments Law which became effective on November 12, 2012, a company that elects by November 11, 2013to pay a reduced corporate tax rate as set forth in that amendment (rather than the regular corporate tax rate applicable to Approved Enterprise income) withrespect to undistributed exempt income accumulated by the company until December 31, 2011 will be entitled to distribute a dividend from such incomewithout being required to pay additional corporate tax with respect to such dividend. A company that has so elected must make certain qualified investments inIsrael over the five-year period commencing in 2013. A company that has elected to apply the amendment cannot withdraw from its election. Teva is currentlyreviewing the new amendment and its implications to the Company. If Teva elects to take advantage of the amendment, it will be required to pay up toapproximately $700 million as a one-time payment.
Income not eligible for Approved Enterprise benefits is taxed at a regular rate, which was 25% in 2012.
The Parent Company and its Israeli subsidiaries elected to compute their taxable income in accordance with Income Tax Regulations (Rules forAccounting for Foreign Investors Companies and Certain Partnerships and Setting their Taxable Income), 1986. Accordingly, the taxable income or loss iscalculated in U.S. dollars. Applying these regulations reduces the effect of the foreign exchange rate (of NIS against the U.S. dollar) on the Company’s Israelitaxable income.
F-49

Table of Contents
TEVA PHARMACEUTICAL INDUSTRIES LIMITEDNotes To Consolidated Financial Statements
Non-Israeli subsidiaries are taxed according to the tax laws in their respective country of residence. Certain manufacturing subsidiaries operate in several
jurisdictions outside Israel, some of which benefit from tax incentives such as reduced tax rates, investment tax credits and accelerated deductions.
NOTE 15—DERIVATIVE INSTRUMENTS AND HEDGING ACTIVITIES:
a. Foreign exchange risk management:The Group enters into forward exchange contracts in non-functional currencies and purchases and writes non-functional currency options in order to
hedge the currency exposure on identifiable balance sheet items. In addition, the Group takes steps to reduce exposure by using “natural” hedging. TheCompany also acts to offset risks in opposite directions among the companies in the Group. The currency hedged items are usually denominated in thefollowing main currencies: the euro (EUR), Hungarian forint (HUF), British pound (GBP), new Israeli shekel (NIS), Canadian dollar (CAD), Croatian kuna(HRK), Russian ruble (RUB), Czech koruna (CZK) and Swiss franc (CHF). The writing of options is part of a comprehensive currency hedging strategy.
These transactions are for periods of less than one year. The counterparties to the derivatives are comprised mainly of major banks and, in light of thecurrent financial environment, the Company is monitoring the associated inherent credit risks. b. Interest rate and cross-currency swaps:
During the first quarter of 2011, the Company entered into swap agreements with respect to its $250 million principal amount of 1.70% Senior Notesdue 2014. The purpose of these interest rate swap agreements was to change the interest rate from fixed to floating rate. As a result of these agreements, Teva iscurrently paying an effective interest rate of three months LIBOR plus an average 0.39% on the $250 million principal amount, as compared to the stated1.70% fixed rate.
During the fourth quarter of 2011, the Company entered into swap agreements with respect to its $1.1 billion principal amount of three month LIBORplus 0.9% Senior Notes due 2013. The purpose of these interest rate swap agreements was to change the interest rate from floating to fixed rate. As a result ofthese agreements, Teva is currently paying an effective interest rate of 1.61% on the $1.1 billion principal amount, as compared to the stated three monthsLIBOR plus an average 0.9% rate.
During the fourth quarter of 2011, the Company entered into swap agreements with respect to its $875 million principal amount of 3.65% Senior Notesdue 2021. The purpose of these interest rate and cross-currency swap agreements was to convert the notes’ denomination from dollars to Euros. As a result ofthese agreements, Teva pays a fixed rate of 3.85% on the euro principal amount, as compared to the stated 3.65% fixed rate on the dollar principal amount.
During the first quarter of 2012, Teva entered into short term cash flow hedge transactions to reduce its exposure resulting mainly from payroll costsdenominated in new Israeli shekels.
During the first quarter of 2012, Teva entered into short term cash flow hedge transactions to help protect Teva’s European subsidiaries from anticipatedexposure on 2012 sales and partially cover that exposure resulting from the fluctuation of the U.S. dollar against the Euro.
During the third quarter of 2012 and first quarter of 2013, Teva entered into cash flow hedge transactions to help protect Teva’s European subsidiariesfrom anticipated exposure on 2013 sales and partially cover that exposure resulting from the fluctuation of the U.S. dollar against the Euro.
F-50

Table of Contents
TEVA PHARMACEUTICAL INDUSTRIES LIMITEDNotes To Consolidated Financial Statements
During the fourth quarter of 2012, the Company entered into swap agreements with respect to its $1.3 billion principal amount of 2.95% Senior Notes
due 2014. The purpose of these interest rate swap agreements was to change the interest rate from fixed to floating rate. As a result of these agreements, Teva iscurrently paying an effective interest rate of one month LIBOR plus an average 1.306% on the $1.3 billion principal amount, as compared to the stated 2.95%fixed rate.
During the first quarter of 2013, the Company entered into swap agreements with respect to its $1.0 billion principal amount of 6.15% Senior Notes due2036. The purpose of these interest rate swap agreements was to change the interest rate from fixed to floating rate. As a result of these agreements, Teva iscurrently paying an effective interest rate of one month LIBOR plus an average 0.3% on the $1.0 billion principal amount, as compared to the stated 6.15%fixed rate.
The above transactions were accounted for by Teva as hedge accounting. c. Derivative instrument disclosure:
The fair value of derivative instruments consists of: Fair value Reported under December 31, 2012 2011 U.S. $ in millions Asset derivatives, comprising interest rate and cross currency swap agreements, designated as
hedging instruments Other non-current assets $ 4 $ 25 Asset derivatives, comprising primarily foreign exchange contracts, not designated as hedging
instruments Other current assets $ 20 $ 17 Liability derivatives, comprising interest rate and cross currency swap agreements, designated
as hedging instruments Senior notes and loans $(109) $ (53) Liability derivatives, comprising foreign exchange contracts, not designated as hedging
instruments Other current liabilities $ (29) $(57)
Derivatives on foreign exchange contracts hedge Teva’s balance sheet items from currency exposure but are not designated as hedging instruments foraccounting purposes. With respect to such derivatives, losses of $45 million and $5 million were recognized under financial expenses—net for the yearsended December 31, 2012 and 2011, respectively. Such losses offset the revaluation of the balance sheet items also booked under financial expenses—net.
With respect to the interest rate and cross-currency swap agreements, gains of $18 million and $20 million were recognized under financial expenses—net for the years ended December 31, 2012 and 2011, respectively. Such gains mainly reflect the differences between the fixed interest rate and the floatinginterest rate.
d. Securitization:
During 2011 and 2012, Teva securitized approximately $535 million (net) of its trade receivables. The deal was accounted for as a sale transaction.
F-51

Table of Contents
TEVA PHARMACEUTICAL INDUSTRIES LIMITEDNotes To Consolidated Financial Statements
NOTE 16—FINANCIAL EXPENSES- NET:
Year ended December, 31 2012 2011 2010 U.S. $ in millions Interest expenses and other bank charges $355 $ 234 $ 202 Foreign exchange (gain) losses—net 25 16 (22) Income from investments (26) (44) (57) Gain from interest rate swap transaction — (53) Losses from hedging transactions in connection with the ratiopharm acquisition — — 102 Expenses mainly from senior notes prepayment 32 — — Total financial expenses—net $ 386 $153 $225
NOTE 17—IMPAIRMENTS, LOSS CONTINGENCIES, RESTRUCTURING AND OTHERS:Impairments, loss contingencies, restructuring and others consisted of the following:
Year ended December 31, 2012 2011 2010 U.S. $ in millions Impairment of long-lived assets (see also notes 6 and 7) $ 1,071 $ 201 $ 124 Loss contingencies 670 30 — Restructuring and other expenses 221 192 260 Legal settlements 45 441 2 Contingent consideration (40) — — Acquisition costs 7 37 24 Total $1,974 $ 901 $ 410
In determining the estimated fair value of the long-lived assets, we utilized a discounted cash flow model. The key assumptions within the model relatedto forecasting future revenue and operating income, an appropriate weighted average cost of capital, and an appropriate terminal value based on the nature ofthe long-lived asset.
Definite life intangible assets are amortized using mainly the straight-line method over their estimated period of useful life, which is determined byidentifying the period in which substantially all of the cash flows are expected to be generated. Impairment may be triggered whenever events or circumstancespresent an indication of impairment.
Upon completion of the related research and development efforts, management determines the remaining useful life of the intangible assets and amortizesthem accordingly. In case of abandonment, the related research and development efforts are impaired.
Impairment of long-lived assets for the year ended December 31, 2012 amounted to $1.1 billion, comprised of impairments of:
1. Identifiable intangible assets of $858 million (see note 7b):
a. In-process R&D write downs amounted to $625 million, including $268 million relating to obatoclax for the treatment of small cell lung
cancer and $96 million relating to CEP-37247 anti-
F-52

Table of Contents
TEVA PHARMACEUTICAL INDUSTRIES LIMITEDNotes To Consolidated Financial Statements
tumor necrosis factor for the treatment of sciatica. Armodafinil (Nuvigil ) for the treatment of bi-polar disorder was also impaired in theamount of $79 million to reflect a settlement agreement with Mylan. We further impaired CureTech’s in-process R&D by $127 million.
b. Impairment of existing product rights of $233 million, which included mainly Enjuvia , a women’s health marketed product, for a total
of $62 million, Gabatril for $43 million, and Ivax’s verapamil for $20 million.
2. Property, plant and equipment of $190 million, which included various impairments to manufacturing and research and development facilities
(see note 6).
3. Non-current investments of $23 million.
For the year ended December 31, 2011, impairment of long-lived assets amounted to $201 million related mainly to the divestiture of a Cephalon fentanilproduct and the recently sold animal health unit.
Loss contingencies and legal settlements for the year ended December 31, 2012 are composed mainly of a provision for a loss contingency of $670million relating to pending patent litigation concerning Teva’s generic pantoprazole. In 2011, legal expenses were primarily due to the Pfizer settlement, theNovartis settlement and the propofol product liability cases.
Restructuring and other expenses were $221 million and $192 million for the years ended December 31, 2012 and 2011, respectively, comprisedmainly of severance costs of $154 million and $187 million. These expenses for 2012 include costs related to the ongoing restructuring of Cephalon Franceand Théramex.
Contingent consideration benefit was recorded as a result of impairing long lived assets during 2012, which decreased associated milestone paymentliabilities, previously recorded in connection with the Cephalon acquisition.
Acquisition expenses of $7 million and $37 million in 2012 and 2011, respectively, were primarily related to the Cephalon acquisition.
NOTE 18—ENTITY-WIDE DISCLOSURE:
a. Financial reports to Teva’s chief operating decision makers evolve over time as Teva’s business develops, as well as following major acquisitions.Since 2009, Teva has reported under a notion of a “One Teva.” During 2012, following the appointment of Teva’s new Chief Executive Officer,Dr. Jeremy M. Levin, Teva has engaged in a comprehensive review of its strategy, organizational and business structure and is implementingchanges to support the new strategy and to align the organization. Subsequent to the anticipated completion of these procedures in 2013, theCompany intends to re-evaluate its entity wide disclosure and segment reporting. For the purposes of this annual report, Teva has continued toreport under a single segment, as in the past.
F-53
®
®
®

Table of Contents
TEVA PHARMACEUTICAL INDUSTRIES LIMITEDNotes To Consolidated Financial Statements
b. Revenues by geographic area were as follows:
Year ended December 31, 2012 2011 2010 U.S. $ in millions United States:
Generic $ 4,381 $ 3,957 $ 5,789 Branded 5,857 4,804 3,600 Others 200 39 5
Total United States 10,438 8,800 9,394 Europe:
Generic 3,387 3,810 2,637 Branded 1,563 1,101 746 Others 723 749 564
Total Europe 5,673 5,660 3,947 Rest of World:*
Generic 2,617 2,429 1,481 Branded 730 588 509 Others 859 835 790
Total Rest of World 4,206 3,852 2,780 $20,317 $18,312 $16,121
* Of which Israel $ 621 $ 621 $ 5 6 6
c. Net revenues to one major customer of total consolidated revenues for the years ended December 31, 2012, 2011 and 2010 were 16%, 14% and16%, respectively. The balance due from the Company’s largest customer accounted for 24% of the gross trade accounts receivable atDecember 31, 2012. Sales reserves and allowances on these balances are recorded in current liabilities (refer to note 1p). Accordingly, the netbalance of the Company’s largest customer is much lower.
F-54
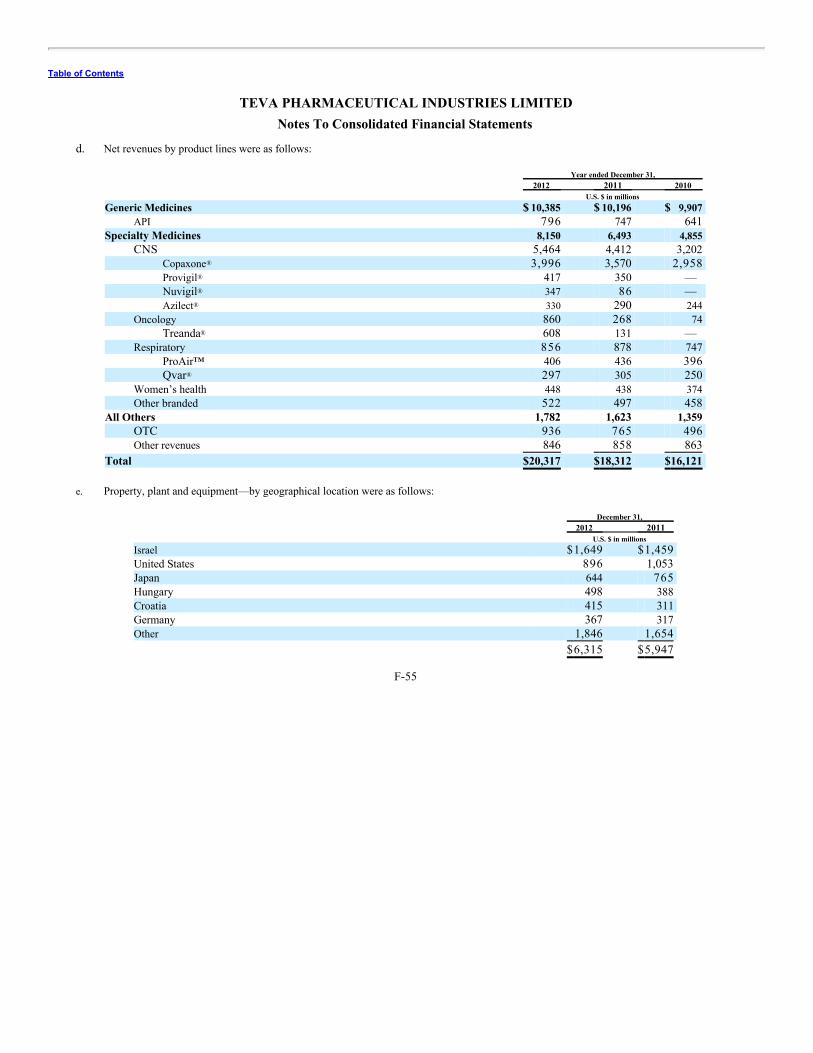
Table of Contents
TEVA PHARMACEUTICAL INDUSTRIES LIMITEDNotes To Consolidated Financial Statements
d. Net revenues by product lines were as follows:
Year ended December 31, 2012 2011 2010 U.S. $ in millions Generic Medicines $ 10,385 $ 10,196 $ 9,907
API 796 747 641 Specialty Medicines 8,150 6,493 4,855
CNS 5,464 4,412 3,202 Copaxone 3,996 3,570 2,958 Provigil 417 350 — Nuvigil 347 86 — Azilect 330 290 244
Oncology 860 268 74 Treanda 608 131 —
Respiratory 856 878 747 ProAir™ 406 436 396 Qvar 297 305 250
Women’s health 448 438 374 Other branded 522 497 458
All Others 1,782 1,623 1,359 OTC 936 765 496 Other revenues 846 858 863
Total $20,317 $18,312 $16,121 e. Property, plant and equipment—by geographical location were as follows:
December 31, 2012 2011 U.S. $ in millions Israel $1,649 $1,459 United States 896 1,053 Japan 644 765 Hungary 498 388 Croatia 415 311 Germany 367 317 Other 1,846 1,654
$6,315 $5,947
F-55
®
®
®
®
®
®

Table of Contents
TEVA PHARMACEUTICAL INDUSTRIES LIMITEDNotes To Consolidated Financial Statements
NOTE 19—EARNINGS PER SHARE:
The net income attributable to Teva and the weighted average number of shares used in computation of basic and diluted earnings per share for the yearsended December 31, 2012, 2011 and 2010 are as follows: 2012 2011 2010 (U.S. $ in millions) Net income attributable to Teva $1,963 $2,759 $ 3,331 Interest expense on convertible senior debentures, and issuance costs, net of tax benefits * * 44 Net income used for the computation of diluted earnings per share $1,963 $2,759 $3,375 Weighted average number of shares used in the computation of basic earnings per share 872 890 896 Add:
Additional shares from the assumed exercise of employee stock options and unvested RSUs 1 2 6 Weighted average number of additional shares issued upon the assumed conversion of convertible senior
debentures * 1 19 Weighted average number of shares used in the computation of diluted earnings per share 873 893 921 * Represents an amount of less than $0.5 million.
F-56

Table of Contents
Report of Independent Registered Public Accounting Firm on Financial Statement Schedule
To the Shareholders ofTeva Pharmaceutical Industries Limited
Our audits of the consolidated financial statements and of the effectiveness of internal control over financial reporting referred to in our report datedFebruary 12, 2013 appearing in the 2012 Annual Report to the Shareholders of Teva Pharmaceutical Industries Limited also included an audit of FinancialStatement Schedule II—Valuation and Qualifying Accounts—listed in Item 18 of this Form 20-F. In our opinion, the schedule presents fairly, in all materialrespects, the information set forth therein when read in conjunction with the related consolidated financial statements. Tel-Aviv, IsraelFebruary 12, 2013
/s/ Kesselman & KesselmanCertified Public Accountants (Isr.)
A member of PricewaterhouseCoopersInternational Limited
S-1

Table of Contents
TEVA PHARMACEUTICAL INDUSTRIES LIMITEDSCHEDULE II—VALUATION AND QUALIFYING ACCOUNTS
Three Years Ended December 31, 2012(U.S. $ in millions)
Column A Column B Column C Column D Column E
Balance atbeginning of
period
Charged tocosts andexpenses
Charged toother accounts Deductions
Balance at endof period
Allowance for doubtful accounts: Year ended December 31, 2012 $ 116 $ 32 $ 5 $ (8) $ 145 Year ended December 31, 2011 $ 126 $ 20 $ (6) $ (24) $ 116 Year ended December 31, 2010 $ 9 9 $ 29 $ 9 $ (11) $ 126
Allowance in respect of carryforward tax losses: Year ended December 31, 2012 $ 452 $ 379 $ 2 $ (112) $ 721 Year ended December 31, 2011 $ 211 $ 124 $ 198 $ (81) $ 452 Year ended December 31, 2010 $ 121 $ 77 $ 24 $ (11) $ 211
S-2

Exhibit 8
TEVA PHARMACEUTICAL INDUSTRIES LIMITEDSubsidiaries
At December 31, 2012
Name of Subsidiary Country Percentage of Ownership
and ControlTeva Canada Limited Canada 100Pliva Hrvatska d.o.o. Croatia 100Teva Czech Industries s.r.o. Czech Republic 100Teva Santé S.A.S. France 100Cephalon France S.A.S. France 100Merckle GmbH Germany 100Teva GmbH Germany 100ratiopharm GmbH Germany 100CT- Arzneimittel GmbH Germany 100Teva Pharmaceutical Works Private Limited Company Hungary 100Norton (Waterford) Limited Ireland 100Teva Pharmaceutical Industries Ltd Israel 100Teva Italia S.r.l. Italy 100Teva Pharma Japan, Inc. Japan 100Teva Pharmaceuticals Polska sp. z o.o Poland 100Teva LLC Russia 100Teva Pharma S.L. Spain 100Teva Pharmaceuticals Europe B.V The Netherlands 100Pharmachemie Holding B.V The Netherlands 100Teva UK Limited United Kingdom 100Ivax UK Limited United Kingdom 100Teva Pharmaceuticals USA, Inc. United States 100Teva API, Inc. United States 100
In addition to the subsidiaries listed above, we have operations in various strategic and important locations, including China, India, Turkey and otheremerging and smaller markets.

Exhibit 10
CONSENT OF INDEPENDENT REGISTERED PUBLIC ACCOUNTING FIRM
We hereby consent to the incorporation by reference in the Registration Statements on Form F-3 (No. 333–178400 and No. 333-131387) and on Form S-8(No. 333-168331) of Teva Pharmaceutical Industries Limited of our report dated February 12, 2013 relating to the consolidated financial statements and theeffectiveness of internal control over financial reporting, which appears in this Form 20-F. We also consent to the incorporation by reference of our report datedFebruary 12, 2013 relating to the Financial Statement Schedule, which appears in this Form 20-F. Tel-Aviv, IsraelFebruary 12, 2013
/s/ Kesselman & KesselmanCertified Public Accountants (Isr.)
A member of PricewaterhouseCoopersInternational Limited

Exhibit 12(i)
CERTIFICATION OF CHIEF EXECUTIVE OFFICER PURSUANT TO SECTION 302
CERTIFICATIONS
I, Dr. Jeremy Levin, certify that:
1. I have reviewed this annual report on Form 20-F of Teva Pharmaceutical Industries Limited;
2. Based on my knowledge, this report does not contain any untrue statement of a material fact or omit to state a material fact necessary to make the statementsmade, in light of the circumstances under which such statements were made, not misleading with respect to the period covered by this report;
3. Based on my knowledge, the financial statements, and other financial information included in this report, fairly present in all material respects the financialcondition, results of operations and cash flows of the company as of, and for, the periods presented in this report;
4. The company’s other certifying officer and I are responsible for establishing and maintaining disclosure controls and procedures (as defined in ExchangeAct Rules 13a-15(e) and 15d-15(e)) and internal control over financial reporting (as defined in Exchange Act Rules 13a-15(f) and 15d-15(f)) for the companyand have:
a. designed such disclosure controls and procedures, or caused such disclosure controls and procedures to be designed under our supervision, to ensurethat material information relating to the company, including its consolidated subsidiaries, is made known to us by others within those entities,particularly during the period in which this report is being prepared;
b. designed such internal control over financial reporting, or caused such internal control over financial reporting to be designed under our supervision,to provide reasonable assurance regarding the reliability of financial reporting and the preparation of financial statements for external purposes inaccordance with generally accepted accounting principles;
c. evaluated the effectiveness of the company’s disclosure controls and procedures and presented in this report our conclusions about the effectiveness ofthe disclosure controls and procedures, as of the end of the period covered by this report based on such evaluation; and
d. disclosed in this report any change in the company’s internal control over financial reporting that occurred during the period covered by the annualreport that has materially affected, or is reasonably likely to materially affect, the company’s internal control over financial reporting; and
5. The company’s other certifying officer and I have disclosed, based on our most recent evaluation of internal control over financial reporting, to thecompany’s auditors and the audit committee of the company’s board of directors (or persons performing the equivalent functions):
a. all significant deficiencies and material weaknesses in the design or operation of internal control over financial reporting which are reasonably likely toadversely affect the company’s ability to record, process, summarize and report financial information; and
b. any fraud, whether or not material, that involves management or other employees who have a significant role in the company’s internal control overfinancial reporting.
Date: February 12, 2013
/s/ Jeremy LevinDr. Jeremy LevinPresident and Chief Executive Officer

Exhibit 12(ii)
CERTIFICATION OF CHIEF FINANCIAL OFFICER PURSUANT TO SECTION 302
CERTIFICATIONS
I, Eyal Desheh, certify that:
1. I have reviewed this annual report on Form 20-F of Teva Pharmaceutical Industries Limited;
2. Based on my knowledge, this report does not contain any untrue statement of a material fact or omit to state a material fact necessary to make thestatements made, in light of the circumstances under which such statements were made, not misleading with respect to the period covered by this report;
3. Based on my knowledge, the financial statements, and other financial information included in this report, fairly present in all material respects thefinancial condition, results of operations and cash flows of the company as of, and for, the periods presented in this report;
4. The company’s other certifying officer and I are responsible for establishing and maintaining disclosure controls and procedures (as defined inExchange Act Rules 13a-15(e) and 15d-15(e)) and internal control over financial reporting (as defined in Exchange Act Rules 13a-15(f) and 15d-15(f))for the company and have:
a. designed such disclosure controls and procedures, or caused such disclosure controls and procedures to be designed under our supervision, to
ensure that material information relating to the company, including its consolidated subsidiaries, is made known to us by others within thoseentities, particularly during the period in which this report is being prepared;
b. designed such internal control over financial reporting, or caused such internal control over financial reporting to be designed under our
supervision, to provide reasonable assurance regarding the reliability of financial reporting and the preparation of financial statements for externalpurposes in accordance with generally accepted accounting principles;
c. evaluated the effectiveness of the company’s disclosure controls and procedures and presented in this report our conclusions about the
effectiveness of the disclosure controls and procedures, as of the end of the period covered by this report based on such evaluation; and
d. disclosed in this report any change in the company’s internal control over financial reporting that occurred during the period covered by the annual
report that has materially affected, or is reasonably likely to materially affect, the company’s internal control over financial reporting; and
5. The company’s other certifying officer and I have disclosed, based on our most recent evaluation of internal control over financial reporting, to thecompany’s auditors and the audit committee of the company’s board of directors (or persons performing the equivalent functions):
a. all significant deficiencies and material weaknesses in the design or operation of internal control over financial reporting which are reasonably
likely to adversely affect the company’s ability to record, process, summarize and report financial information; and
b. any fraud, whether or not material, that involves management or other employees who have a significant role in the company’s internal control
over financial reporting.
Date: February 12, 2013
/S/ EYAL DESHEHEyal DeshehChief Financial Officer

Exhibit 13
CERTIFICATION OF THE CHIEF EXECUTIVE OFFICER AND CHIEFFINANCIAL OFFICER PURSUANT TO SECTION 906
CERTIFICATION PURSUANT TO18 U.S.C. SECTION 1350,
AS ADOPTED PURSUANT TOSECTION 906 OF THE SARBANES-OXLEY ACT OF 2002
In connection with the Annual Report of Teva Pharmaceutical Industries Limited (the “Company”) on Form 20-F for the period ended December 31, 2012 asfiled with the Securities and Exchange Commission on the date hereof (the “Report”), we, Dr. Jeremy Levin, President and Chief Executive Officer of theCompany, and Eyal Desheh, Chief Financial Officer of the Company, certify, pursuant to 18 U.S.C. §1350, as adopted pursuant to §906 of the Sarbanes-Oxley Act of 2002, that:
(1) The Report fully complies with the requirements of section 13(a) or 15(d) of the Securities Exchange Act of 1934; and
(2) The information contained in the Report fairly presents, in all material respects, the financial condition and results of operations of the Company.
Dated: February 12, 2013 /s/ Jeremy LevinDr. Jeremy LevinPresident and Chief Executive Officer
/s/ Eyal DeshehEyal DeshehChief Financial Officer
