tetrabromobisphenol a-bis(2,3-dibromopropyl ether)€¦ · · 2018-03-25studies are subjected to...
TRANSCRIPT

National Toxicology Program Toxicity Report Series Number 85
NTP Technical Report on the Toxicity Studies of
Tetrabromobisphenol A-bis(2,3-dibromopropyl ether)
(CAS No. 21850-44-2)
Administered by Gavage to F344/NTac Rats and B6C3F1/N Mice
August 2017
National Institutes of Health Public Health Service
U.S. Department of Health and Human Services

FOREWORD The National Toxicology Program (NTP) is an interagency program within the Public Health Service (PHS) of the Department of Health and Human Services (HHS) and is headquartered at the National Institute of Environmental Health Sciences of the National Institutes of Health (NIEHS/NIH). Three agencies contribute resources to the program: NIEHS/NIH, the National Institute for Occupational Safety and Health of the Centers for Disease Control and Prevention (NIOSH/CDC), and the National Center for Toxicological Research of the Food and Drug Administration (NCTR/FDA). Established in 1978, the NTP is charged with coordinating toxicological testing activities, strengthening the science base in toxicology, developing and validating improved testing methods, and providing information about potentially toxic substances to health regulatory and research agencies, scientific and medical communities, and the public. The Toxicity Study Report series began in 1991. The studies described in the Toxicity Study Report series are designed and conducted to characterize and evaluate the toxicologic potential of selected substances in laboratory animals (usually two species, rats and mice). Substances selected for NTP toxicity studies are chosen primarily on the basis of human exposure, level of production, and chemical structure. The interpretive conclusions presented in the Toxicity Study Reports are based only on the results of these NTP studies. Extrapolation of these results to other species, including characterization of hazards and risks to humans, requires analyses beyond the intent of these reports. Selection per se is not an indicator of a substance’s toxic potential. The NTP conducts its studies in compliance with its laboratory health and safety guidelines and FDA Good Laboratory Practice Regulations and must meet or exceed all applicable federal, state, and local health and safety regulations. Animal care and use are in accordance with the Public Health Service Policy on Humane Care and Use of Animals. Studies are subjected to retrospective quality assurance audits before being presented for public review. NTP Toxicity Study Reports are indexed in the NIH/NLM PubMed database and are available free of charge electronically on the NTP website (http://ntp.niehs.nih.gov).
National Toxicology Program Toxicity Report Series
Number 85
NTP Technical Report on the Toxicity Studies of
Tetrabromobisphenol A-bis(2,3-dibromopropyl ether)
(CAS No. 21850-44-2)
Administered by Gavage to F344/NTac Rats and B6C3F1/N Mice
June K. Dunnick, Ph.D., Study Scientist
National Toxicology Program Post Office Box 12233
Research Triangle Park, NC 27709
August 2017
National Institutes of Health Public Health Service
U.S. Department of Health and Human Services

2
CONTRIBUTORS
National Toxicology Program Evaluated and interpreted results and reported findings J.K. Dunnick, Ph.D., Study Scientist S.A. Elmore, D.V.M., M.S., Study Pathologist C.R. Blystone, Ph.D. P.M. Foster, Ph.D. R.A. Herbert, D.V.M., Ph.D. M.J. Hooth, Ph.D. A.P. King-Herbert, D.V.M. G.E. Kissling, Ph.D. B.S. McIntyre, Ph.D. D.E. Malarkey, D.V.M., Ph.D. S.L. Smith-Roe, Ph.D. M.D. Stout, Ph.D. G.S. Travlos, D.V.M. M.K. Vallant, B.S., M.T. S. Waidyanatha, Ph.D. N.J. Walker, Ph.D. K.L. Witt, M.S. Battelle Columbus Operations Conducted studies and evaluated pathology findings M.R. Hejtmancik, Ph.D., Principal Investigator D.K. Gerken, D.V.M., Ph.D. T.A. Peace, D.V.M. Experimental Pathology Laboratories, Inc. Provided pathology review M.H. Hamlin, II, D.V.M., Principal Investigator A.E. Brix, D.V.M., Ph.D. T.A. Crabbs, D.V.M. Bridge Global Pharmaceutical Services, Inc. Provided SMVCE analysis B.J.T. Muir, Ph.D., Principal Investigator B. Atkinson, M.Sc. Y. Wang, M.S.
Dynamac Corporation Prepared quality assessment audits S. Brecher, Ph.D., Principal Investigator S. Iyer, B.S. V.S. Tharakan, D.V.M. NTP Pathology Peer Review Evaluated slides and contributed to pathology report (September 6, 2007 and May 7, 2014) G. Hill, D.V.M., Ph.D., Coordinator
ILS, Inc. A.E. Brix, D.V.M., Ph.D.
Experimental Pathology Laboratories, Inc. S.A. Elmore, D.V.M., M.S.
National Toxicology Program K.S. Janardhan, D.V.M., Ph.D.
ILS, Inc. D.E. Malarkey, D.V.M., Ph.D.
National Toxicology Program Social & Scientific Systems, Inc. Provided statistical analyses M.V. Smith, Ph.D., Principal Investigator L.J. Betz, M.S. S.F. Harris, B.S. Biotechnical Services, Inc. Prepared Toxicity Study Report D.C. Serbus, Ph.D., Principal Investigator P.A. Gideon, B.A. L.M. Harper, B.S. T.S. Kumpe, M.A.

3
PEER REVIEW
The draft report on the toxicity studies of tetrabromobisphenol A-bis(2,3-dibromopropyl ether) was evaluated by the reviewers listed below. These reviewers serve as independent scientists, not as representatives of any institution, company, or governmental agency. In this capacity, reviewers determine if the design and conditions of these NTP studies are appropriate and ensure that this Toxicity Study Report presents the experimental results and conclusions fully and clearly.
William J. Brock, Ph.D. Brock Scientific Consulting, LLC Montgomery Village, MD Laura A. Hansen, Ph.D. Department of Biomedical Sciences Creighton University School of Medicine Omaha, NE
Karen S. Regan, D.V.M. Regan Path/Tox Services, Inc. Ashland, OH

4 Tetrabromobisphenol A-bis(2,3-dibromopropyl ether), NTP TOX 85
CONTENTS
ABSTRACT ................................................................................................................................................................. 7
INTRODUCTION ..................................................................................................................................................... 11 Chemical and Physical Properties ........................................................................................................................... 11 Production, Use, and Human Exposure .................................................................................................................. 11 Regulatory Status .................................................................................................................................................... 13 Absorption, Distribution, Metabolism, and Excretion ............................................................................................ 13 Toxicity ................................................................................................................................................................... 14 Reproductive and Developmental Toxicity ............................................................................................................. 15 Carcinogenicity ....................................................................................................................................................... 15 Genetic Toxicity ...................................................................................................................................................... 15 Study Rationale ....................................................................................................................................................... 15 MATERIALS AND METHODS .............................................................................................................................. 17 Procurement and Characterization .......................................................................................................................... 17 Preparation and Analysis of Dose Formulations ..................................................................................................... 17
Animal Source ........................................................................................................................................................ 18 Animal Welfare ....................................................................................................................................................... 18 3-Month Studies ...................................................................................................................................................... 18
Statistical Methods .................................................................................................................................................. 23 Quality Assurance Methods .................................................................................................................................... 24 Genetic Toxicology ................................................................................................................................................. 24
RESULTS ................................................................................................................................................................... 27 3-Month Study in Rats ............................................................................................................................................ 27 3-Month Study in Mice ........................................................................................................................................... 31 Special Respiratory System Microscopic Reviews ................................................................................................. 33 Genetic Toxicology ................................................................................................................................................. 34 DISCUSSION ............................................................................................................................................................. 35
REFERENCES .......................................................................................................................................................... 39
APPENDIXES Appendix A Summary of Nonneoplastic Lesions in Rats and Mice ............................................................ A-1 Appendix B Clinical Pathology Results ....................................................................................................... B-1 Appendix C Organ Weights and Organ-Weight-to-Body-Weight Ratios .................................................... C-1 Appendix D Reproductive Tissue Evaluations and Estrous Cycle Characterization ................................... D-1 Appendix E Genetic Toxicology ................................................................................................................. E-1 Appendix F Microsomal Protein Concentration and Liver Enzyme Activity Data ..................................... F-1 Appendix G Chemical Characterization and Dose Formulation Studies ..................................................... G-1

Tetrabromobisphenol A-bis(2,3-dibromopropyl ether), NTP TOX 85 5
Appendix H Ingredients, Nutrient Composition, and Contaminant Levels in NTP-2000 Rat and Mouse Ration ........................................................................................ H-1 Appendix I Sentinel Animal Program ......................................................................................................... I-1

6 Tetrabromobisphenol A-bis(2,3-dibromopropyl ether), NTP TOX 85
SUMMARY
Background Tetrabromobisphenol A-bis(2,3-dibromopropyl ether) (TBBPA-DBPE) is used as a flame retardant in electronics, building and construction materials, and automotive materials. We conducted short-term (3-month) tests to determine if there were any toxic effects of TBBPA-DBPE in rats or mice. An oral route of exposure was selected because this chemical has been detected in dust samples which could allow for oral human exposure.
Methods We administered solutions of TBBPA-DBPE in corn oil by gavage to rats and mice 5 days per week for 3 months. There were 10 rodents in each dose group. Doses were 62.5, 125, 250, 500, or 1,000 mg TBBPA-DBPE/kg body weight for rats and 125, 250, 500, 1,000, or 2,000 mg/kg for mice. Vehicle control animals received the corn oil vehicle alone. During these studies, samples were collected for hematology and clinical chemistry evaluations (rats only) and estrous cycle characterization. At the end of the studies, samples were collected for hematology, clinical chemistry (rats only), and reproductive tissue evaluations, liver enzyme activities, and genetic toxicology evaluations (mice only), and more than 40 tissues were collected from each vehicle control and high-dose animal for histopathology diagnosis.
Results There were no treatment-related clinical findings or effects on survival. The final mean body weights of the treated groups were within 10% of the final mean body weights in the vehicle control groups. There were no treatment-related lesions in male or female rats or mice. There were no treatment-related findings from the hematology, clinical chemistry, reproductive tissue, or genetic toxicology evaluations.
Conclusions We conclude that after oral exposure to TBBPA-DBPE for 3 months there were no treatment-related lesions in treated rats or mice that demonstrated the potential for a disease process.

7
ABSTRACT
Tetrabromobisphenol A-bis(2,3-dibromopropyl ether) CAS No. 21850-44-2
Chemical Formula: C21H20Br8O2 Molecular Weight: 943.6
Synonyms: 2,2-Bis[3,5-dibromo-4-(2,3-dibromopropoxy)phenyl]propane; 2,2-bis[3,5-dibromo-4-(2,3-dibromopropyloxy)phenyl]propane;
2,2-bis[4-(2,3-dibromopropoxy)-3,5-dibromophenyl]propane; 2,2-bis[4-(2,3-dibromopropyloxy)-3,5-dibromophenyl]propane; bis(2,3-dibromopropoxy)tetrabromobisphenol A; bis(2,3-dibromopropyl)tetrabromobisphenol A; 1,1′-(isopropylidene)bis[3,5-dibromo-4-(2,3-dibromopropoxy)benzene]; 1,1′-(1-methylethylidene)bis[3,5-dibromo-4-(2,3-dibromopropoxy)]benzene; TBBPA-DBPE; 3,3′,5,5′-tetrabromobisphenol A bis(2,3-dibromopropyl) ether; tetrabromobisphenol A dibromopropyl ether
Trade names: 403AF, Bromcal 66.8, Bromkal 66-8, CHEMPACIFIC 34721, D 5532, EcoFlame B-943, FG 3100, Fire Guard 3100, Flame Cut 121K, Flame Cut 121R, FR 720, GX 5532, HP-800 AG, HP-800 AGC, PE-68, Pyroguard SR 720, SAYTEX® HP-800 A, SR 720
Tetrabromobisphenol A-bis(2,3-dibromopropyl ether) is used as a flame retardant in electronics, building and
construction materials, and automotive materials. Tetrabromobisphenol A-bis(2,3-dibromopropyl ether) was
nominated for toxicology and in vivo genotoxicity study by the National Institute of Environmental Health Sciences
because, although human exposure potential may be low, there was concern that this chemical has carcinogenic
potential and has not been adequately studied. The compound was also selected for study because dibromo-1-propanol
(the core structure of the 2,3-dibromopropyl ether side chain) has been studied by the NTP and found to be
carcinogenic. Male and female F344/NTac rats and B6C3F1/N mice were administered tetrabromobisphenol
A-bis(2,3-dibromopropyl ether) (approximately 94% pure) in corn oil by gavage for 3 months. Genetic toxicology
studies were conducted in Salmonella typhimurium and mouse peripheral blood erythrocytes.
Groups of 10 male and 10 female F344/NTac rats were administered 0, 62.5, 125, 250, 500, or 1,000 mg
tetrabromobisphenol A-bis(2,3-dibromopropyl ether)/kg body weight in corn oil by gavage, 5 days per week for
14 weeks, and additional groups of 10 male and 10 female rats were administered the same doses for 23 days. Groups
of 10 male and 10 female mice were administered 0, 125, 250, 500, 1,000, or 2,000 mg/kg for 14 weeks. Two
62.5 mg/kg male rats died during week 6 (one dosing accident), and one vehicle control female rat died during
week 8. All mice survived to the end of the study. Final mean body weights and body weight gains of male and

8 Tetrabromobisphenol A-bis(2,3-dibromopropyl ether), NTP TOX 85
female rats and mice were similar to those of the vehicle controls except the final mean body weight of 250 mg/kg
female mice was 11% more than that of the vehicle controls. There were no treatment-related clinical findings.
Microsomal protein levels were increased in treated rats and mice. There were no chemical-related changes in absolute
or relative organ weights in male or female rats or mice. There were no gross or histologic lesions in rats or mice that
were considered treatment related. There were no chemical-related hematology or clinical chemistry findings in rats
or mice.
Tetrabromobisphenol A-bis(2,3-dibromopropyl ether) was not mutagenic in Salmonella typhimurium strains TA98,
TA100, or TA102, with or without rat liver S9 metabolic activation enzymes. In vivo, no significant increases in the
frequencies of micronucleated erythrocytes were observed in peripheral blood samples from male or female
B6C3F1/N mice in the 3-month study. In addition, no significant changes in the percentage of polychromatic
erythrocytes were seen in these mice, suggesting that tetrabromobisphenol A-bis(2,3-dibromopropyl ether) did not
cause bone marrow toxicity.
Under the conditions of these 3-month gavage studies, there were no clinical findings or treatment-related lesions in
male or female F344/NTac rats or B6C3F1/N mice administered tetrabromobisphenol A-bis(2,3-dibromopropyl ether)
at 0, 62.5, 125, 250, 500, or 1,000 mg/kg in rats or 0, 125, 250, 500, 1,000, or 2,000 mg/kg in mice. Final mean body
weights of treated rats and mice were generally within 10% of vehicle controls, and there were no treatment-related
effects on organ weights.

Tetrabromobisphenol A-bis(2,3-dibromopropyl ether), NTP TOX 85 9
Summary of Findings Considered to be Toxicologically Relevant in Rats and Mice Administered Tetrabromobisphenol A-bis(dibromopropyl ether) by Gavage for 3 Months
Male
F344/NTac Rats
Female
F344/NTac Rats
Male
B6C3F1/N Mice
Female
B6C3F1/N Mice
Doses in corn oil 0, 62.5, 125, 250, 500, or
1,000 mg/kg 0, 62.5, 125, 250, 500, or 1,000 mg/kg
0, 125, 250, 500, 1,000, or 2,000 mg/kg
0, 125, 250, 500, 1,000, or 2,000 mg/kg
Survival rates 10/10, 8/10, 10/10,
10/10, 10/10, 10/10 9/10, 10/10, 10/10, 10/10, 10/10, 10/10
10/10, 10/10, 10/10, 10/10, 10/10, 10/10
10/10, 10/10, 10/10, 10/10, 10/10, 10/10
Body weights Dosed groups similar to
the vehicle control group Dosed groups similar to the vehicle control group
Dosed groups similar to the vehicle control group
250 mg/kg group 11% more than the vehicle control group
Clinical findings Nonea None None None Organ weights None None None None Hematology/clinical chemistry [hematology includes: rats (day 23), rats and mice (week 14); clinical chemistry includes: rats (days 4, 23, week 14)]
None None None None
Sperm parameters and vaginal cytology
None None None None
Nonneoplastic effects None None None None Genetic toxicology Bacterial gene mutations: Negative in S. typhimurium strains TA98, TA100, and TA102 with
or without S9 Micronucleated erythrocytes
Mouse peripheral blood in vivo: Negative in males and females
a None = no treatment-related effects for this endpoint

10 Tetrabromobisphenol A-bis(2,3-dibromopropyl ether), NTP TOX 85

11
INTRODUCTION
Tetrabromobisphenol A-bis(2,3-dibromopropyl ether) CAS No. 21850-44-2
Chemical Formula: C21H20Br8O2 Molecular Weight: 943.6
Synonyms: 2,2-Bis[3,5-dibromo-4-(2,3-dibromopropoxy)phenyl]propane; 2,2-bis[3,5-dibromo-4-(2,3-dibromopropyloxy)phenyl]propane;
2,2-bis[4-(2,3-dibromopropoxy)-3,5-dibromophenyl]propane; 2,2-bis[4-(2,3-dibromopropyloxy)-3,5-dibromophenyl]propane; bis(2,3-dibromopropoxy)tetrabromobisphenol A; bis(2,3-dibromopropyl)tetrabromobisphenol A; 1,1′-(isopropylidene)bis[3,5-dibromo-4-(2,3-dibromopropoxy)benzene]; 1,1′-(1-methylethylidene)bis[3,5-dibromo-4-(2,3-dibromopropoxy)]benzene; TBBPA-DBPE; 3,3′,5,5′-tetrabromobisphenol A bis(2,3-dibromopropyl) ether; tetrabromobisphenol A dibromopropyl ether
Trade names: 403AF, Bromcal 66.8, Bromkal 66-8, CHEMPACIFIC 34721, D 5532, EcoFlame B-943, FG 3100, Fire Guard 3100, Flame Cut 121K, Flame Cut 121R, FR 720, GX 5532, HP-800 AG, HP-800 AGC, PE-68, Pyroguard SR 720, SAYTEX® HP-800 A, SR 720
CHEMICAL AND PHYSICAL PROPERTIES Tetrabromobisphenol A-bis(2,3-dibromopropyl ether) is a white to off-white crystalline solid with a slight odor.
Decomposition takes place at temperatures greater than 270° C. The relative molecular mass is 943.9; the melting
point is 90° to 100° C (95° C); and the specific gravity is 0.7 to 0.9 g/cm3. The bromine content is 68% and the
solubility is 1 g per liter water at 25° C (WHO, 1995).
PRODUCTION, USE, AND HUMAN EXPOSURE Tetrabromobisphenol A-bis(2,3-dibromopropyl ether) is used as a flame retardant in electronics, building and
construction materials, and automotive materials (USEPA, 2014a). It is an additive flame retardant for polyolefins,
polymers, and high- and low-density polyethylene. Tetrabromobisphenol A-bis(2,3-dibromopropyl ether) may be
used as a flame retardant in plastic products such as pipes, water barriers, kitchen hoods, and electronics (Covaci et al.,
2011).

12 Tetrabromobisphenol A-bis(2,3-dibromopropyl ether), NTP TOX 85
The U.S. Environmental Protection Agency (USEPA) (2013a) reports the production volume in the United States is
estimated to be 1 to 10 million pounds. The USEPA notes that 100 to 1,000 workers are likely to be exposed to the
chemical during its manufacturing and processing.
Quantitative measurement of tetrabromobisphenol A-bis(2,3-dibromopropyl ether) exposure in the United States is
limited, and it is not part of the Centers for Disease Control and Prevention NHANES survey of chemical exposure in
the United States population. However, human exposure may occur during its manufacture and use as a flame
retardant. Tetrabromobisphenol A-bis(2,3-dibromopropyl ether) has been detected in dust samples from a primary
school in the United Kingdom at concentrations of 200 µg/kg (Covaci et al., 2011).
Tetrabromobisphenol A-bis(2,3-dibromopropyl ether) is hydrophobic and thus may bind various particles in the
environment (Covaci et al., 2011). Studies reported in the literature indicate that tetrabromobisphenol A-bis(2,3-
dibromopropyl ether) can persist in the environment (de Jourdan et al., 2013; Qu et al., 2013). The USEPA (2014a)
has also predicted that tetrabromobisphenol A-bis(2,3-dibromopropyl ether) would have high persistence in the
environment based on an analysis of unpublished degradation tests submitted for review. Tetrabromobisphenol
A-bis(2,3-dibromopropyl ether) has been found in sewage sludge in China at up to 8,950 µg/kg dry weight (Covaci
et al., 2011).
Tetrabromobisphenol A-bis(2,3-dibromopropyl ether) was identified in environmental samples (i.e., soil, sediments,
rice hulls, and earthworms) taken near a brominated flame retardant manufacturing plant in China (Qu et al., 2013).
The concentration of tetrabromobisphenol A-bis(2,3-dibromopropyl ether) ranged from 0.7 to 293 ng/g dry weight in
these samples. Mollusks collected from the Chinese Bhohai Sea were found to contain tetrabromobisphenol
A-bis(2,3-dibromopropyl ether) in 32% of the samples (Qu et al., 2013).
Tetrabromobisphenol A-bis(2,3-dibromopropyl ether) is listed as an alternative flame retardant for
decabromodiphenyl ether by the USEPA (2014a). It was considered by the EPA for an alternative to the flame
retardant hexabromocyclododecane (CASRNs 25637-99-4 and 3194-55-6) in expanded and extruded polystyrene
foam insulation but was excluded from consideration. Another alternative tetrabromobisphenol A-bis(2,3-
dibromopropyl ether) derivative was considered as a possible alternative flame retardant for hexabromocyclododecane
(USEPA, 2014b).
Exposure to flame retardants, including tetrabromobisphenol A-bis(2,3-dibromopropyl ether), could occur by
inhalation, ingestion, or dermal exposure. Of particular concern is exposure to children in the home by the oral route
(El-Masri and Portier, 1998; Frederiksen et al., 2009).

Tetrabromobisphenol A-bis(2,3-dibromopropyl ether), NTP TOX 85 13
REGULATORY STATUS
Tetrabromobisphenol A-bis(2,3-dibromopropyl ether) is listed on the Toxic Substances Control Act Inventory, but no
test rules have been issued for this chemical (USEPA, 2014a). This chemical is listed by the USEPA as requiring
contaminant testing (EPA-1) (USEPA, 2013b) and export notification (EPA-2) (USEPA, 2013c).
ABSORPTION, DISTRIBUTION, METABOLISM, AND EXCRETION
Experimental Animals There are limited data on the metabolism and disposition of tetrabromobisphenol A-bis(2,3-dibromopropyl ether) in
rodents. In studies conducted by the National Toxicology Program, following gavage administration of 20 mg/kg
[14C]-tetrabromobisphenol A-bis(2,3-dibromopropyl ether) in fasted F344 rats, 89% of the administered dose was
excreted in feces within the first 24 hours; the total dose excreted in feces at 96 hours following dosing was
approximately 95%. (Knudsen et al., 2007; NTP, 2007). Excretion via urine was minimal (≤ 0.1%). When a similar
dose was administered in bile duct-cannulated rats, approximately 1% of the dose was recovered in bile within
24 hours suggesting that the majority of fecal radioactivity was due to unabsorbed dose. The total dose in
non-gastrointestinal (GI) tract tissues at 96 hours was approximately 1%, with liver, adipose, and muscle showing the
highest concentrations. The percent of dose in the liver at 6, 24, 72, and 96 hours following gavage administration
was 4.8, 0.9, 0.6, and 0.2, respectively, whereas the level in adipose did not change with time. Following a 20 mg/kg
intravenous dose in fasted rats, fecal excretion was slower than following gavage administration, with approximately
30% of the administered dose excreted in 24 hours; the total dose recovered in feces at 96 hours was 71%. Urinary
excretion accounted for approximately 0.2% of the dose. Tissues (non-GI tract) contained approximately 14% of the
administered dose with liver, adipose, and muscle having the highest concentrations. Disposition was also investigated
in nonfasted male rats following one, five, or 10 doses, with sacrifice 24 hours after the last dose. The pattern of
disposition was similar to that in fasted rats except that the total dose in tissues at 24 hours, mainly in the liver, was
higher in nonfasted rats (6.7%) than in fasted rats (0.9 %), demonstrating a higher absorption in non-fasted rats. There
was no difference in the pattern of disposition between single or repeated (5 or 10) doses. Blood toxicokinetic
parameters were estimated following a single gavage dose of [14C]-tetrabromobisphenol A-bis(2,3-dibromopropyl
ether) in fasted male F344 rats. The time to reach the maximum blood concentration (Cmax) of 0.6 µg/mL was
7.4 hours following dosing. Tetrabromobisphenol A-bis(2,3-dibromopropyl ether) was eliminated slowly from blood
with an elimination half-life of 13.9 hours. The estimated absolute bioavailability was 2.2%. These data suggest that
tetrabromobisphenol A-bis(2,3-dibromopropyl ether) is poorly absorbed and slowly eliminated following gavage
administration in rodents.
Analysis of bile by radiochromatography showed two peaks that did not co-elute with the parent compound either
before or after deconjugation experiments, suggesting formation of metabolites other than direct conjugates of the
parent. Analysis of fecal extracts also showed some evidence of metabolism of tetrabromobisphenol
A-bis(2,3-dibromopropyl ether). Approximately 5% of the radioactivity in feces was associated with a metabolite

14 Tetrabromobisphenol A-bis(2,3-dibromopropyl ether), NTP TOX 85
peak; however, metabolite identification was not attempted. Approximately 90% of the fecal radioactivity eluted at
the retention time of the parent. In vitro studies using F344 rat hepatocytes or liver microsomes indicated very little
metabolism of tetrabromobisphenol A-bis(2,3-dibromopropyl ether) (Knudsen et al., 2007; NTP, 2007).
Humans
There are no absorption, distribution, metabolism, or excretion studies of tetrabromobisphenol A-bis(2,3-dibromo-
propyl ether) in humans reported in the peer reviewed literature, and no information on tissue levels of tetrabromo-
bisphenol A-bis(2,3-dibromopropyl ether) in humans were found in the literature.
TOXICITY Experimental Animals The acute LD50 for tetrabromobisphenol A-bis(2,3-dibromopropyl ether) in mice was greater than 20 g/kg when given
in feed and observed for 14 days; the acute dermal LD50 for mice was greater than 20 g/kg when applied to skin for
24 hours and observed for 14 days (WHO, 1995). An inhalation LC50 in mice is estimated at 87 mg/L (USEPA,
2014a). There are no 14-day or 90-day toxicity studies of tetrabromobisphenol A-bis(2,3-dibromopropyl ether)
reported in the scientific literature (WHO, 1995; USEPA, 2014a).
The World Health Organization (1995) reviewed unpublished studies of tetrabromobisphenol A dibromopropyl ether
[another name for tetrabromobisphenol A-bis(2,3-dibromopropyl ether)] and reported that, when it was administered
to mice at 200 or 2,000 mg/kg in the diet for 90 days, there were no treatment-related deaths or gross pathologic
changes.
Humans
No in vivo studies on the toxic potential of tetrabromobisphenol A-bis(2,3-dibromopropyl ether) in humans were found
in the peer reviewed literature.
In vitro studies found that tetrabromobisphenol A-bis(2,3-dibromopropyl ether) did not inhibit CYP17 catalytic
activity in human H295R adrenocortical carcinoma cells (Hamers et al., 2006). Tetrabromobisphenol A-bis(2,3-dibro-
mopropyl ether) did not exhibit agonistic or antagonistic activity with aryl hydrocarbon, androgen, progesterone, or
estrogen receptors in a series of chemically activated luciferase gene expression assays (Hamers et al., 2006).
However, tetrabromobisphenol A-bis(2,3-dibromopropyl ether) did displace the thyroid hormone precursor thyroxine
from the plasma transport protein in transthyretin binding assays, and it inhibited estradiol binding in estradiol
sulfotransferase assays (Hamers et al., 2006). These assays were run at concentrations of 0.01 µM to 10 µM.

Tetrabromobisphenol A-bis(2,3-dibromopropyl ether), NTP TOX 85 15
REPRODUCTIVE AND DEVELOPMENTAL TOXICITY No information on the reproductive or developmental toxicity of tetrabromobisphenol A-bis(2,3-dibromopropyl ether)
in experimental animals or humans was found in a review of the literature.
Tetrabromobisphenol A-bis(2,3-dibromopropyl ether) was found to inhibit estradiol-sulfotransferase and thereby may
have an effect on sulfation of estradiol and its subsequent elimination by conjugation (Hamers et al., 2006). A USEPA
(2014a) review of this chemical noted a potential for alkylation and a potential for reproductive effects from
tetrabromobisphenol A-bis(2,3-dibromopropyl ether) exposure.
CARCINOGENICITY Experimental Animals No information of the carcinogenic potential of tetrabromobisphenol A-bis(2,3-dibromopropyl ether) in experimental
animals was found in a review of the literature.
Humans
No epidemiology studies of the carcinogenic potential of tetrabromobisphenol A-bis(2,3-dibromopropyl ether) in
humans were found in the peer-reviewed literature.
GENETIC TOXICITY No genetic toxicology studies of tetrabromobisphenol A-bis(2,3-dibromopropyl ether) were found in the
peer-reviewed literature.
STUDY RATIONALE Tetrabromobisphenol A-bis(2,3-dibromopropyl ether) (TBBPA-DBPE) was nominated by the National Institute of
Environmental Health Sciences for toxicology and in vivo genotoxicity study because this is a widely used flame
retardant with little or no toxicity data reported in the literature, and because there is potential for human exposure.

16 Tetrabromobisphenol A-bis(2,3-dibromopropyl ether), NTP TOX 85
17
MATERIALS AND METHODS
PROCUREMENT AND CHARACTERIZATION Tetrabromobisphenol A-bis(2,3-dibromopropyl ether) Tetrabromobisphenol A-bis(2,3-dibromopropyl ether) was obtained from Great Lakes Chemical Corporation (West
Lafayette, IN) in one lot (534106) that was used during the 3-month studies. Identity and purity analyses were
conducted by the analytical chemistry laboratory at Midwest Research Institute (Kansas City, MO), and the study
laboratory at Battelle Columbus Operations (Columbus, OH) conducted additional identity analyses and confirmed
purity (Appendix G). Reports on analyses performed in support of the tetrabromobisphenol A-bis(2,3-dibromopropyl
ether) studies are on file at the National Institute of Environmental Health Sciences.
The chemical, a white powder, was identified as tetrabromobisphenol A-bis(2,3-dibromopropyl ether) using infrared
and proton nuclear magnetic resonance spectroscopy. Melting point analysis by differential scanning calorimetry
indicated that lot 534106 of the test article contained impurities. The purity of lot 534106 was determined by high-
performance liquid chromatography (HPLC) with ultraviolet (UV) detection; 12 reportable impurities with a total
relative peak area of approximately 5.8% were detected. One impurity (approximately 2% relative to the total peak
area) was tentatively identified as 1,3-dibromo-2-{[(2E)-3-bromoprop-2-en-1-yl]oxy}-5-{1-[3,5-dibromo-4-(2,3-
dibromopropoxy)phenyl]-1-methylethyl}benzene using liquid chromatography coupled with mass spectrometry. The
overall purity of lot 534106 was determined to be approximately 94%.
To ensure stability, the bulk chemical was stored at room temperature (~25° C) in amber glass bottles. Periodic
reanalyzes of the bulk chemical were performed by the study laboratory during the 3-month studies using HPLC/UV,
and no degradation of the test article was detected.
Corn Oil Corn oil was obtained in two lots (UU0854 and UW0493) from Spectrum Chemicals and Laboratory Products
(Gardena, CA) and was used as the vehicle in the 3-month studies. Periodic analyses of the corn oil vehicle performed
by the study laboratory using potentiometric titration demonstrated peroxide concentrations less than the rejection
level of 3 mEq/kg.
PREPARATION AND ANALYSIS OF DOSE FORMULATIONS
The dose formulations were prepared four times by mixing tetrabromobisphenol A-bis(2,3-dibromopropyl ether) with
corn oil to give the required concentrations (Table G1). Homogeneity studies of 1.0 and 600 mg/mL formulations and
stability studies of the 1.0 mg/mL formulation were performed by the analytical chemistry laboratory using HPLC/UV;
18 Tetrabromobisphenol A-bis(2,3-dibromopropyl ether), NTP TOX 85
the study laboratory used the same analytical system to perform additional homogeneity studies of 12.5, 25, 50, 400,
and 800 mg/mL formulations and a gavageability study of a 200 mg/mL dose formulation. Homogeneity was deemed
acceptable for all of the formulations; stability was confirmed for at least 42 days for dose formulations stored in
sealed glass containers at temperatures up to 25° C, and for 3 hours under simulated animal room conditions.
Gavageability of the 200 mg/mL dose formulation was confirmed by the study laboratory.
Analyses of the dose formulations of tetrabromobisphenol A-bis(2,3-dibromopropyl ether) were conducted three times
by the study laboratory using HPLC/UV; animal room samples of these dose formulations were also analyzed
(Table G2). Fourteen of the 15 dose formulations for rats and mice were within 10% of the target concentrations; 14
of 18 animal room samples for rats and 12 of 15 for mice were within 10% of the target concentrations.
ANIMAL SOURCE Male and female F344/NTac rats were obtained from the commercial colony at Taconic Farms, Inc. (Germantown,
NY), and B6C3F1/N mice were obtained from the NTP colony at Taconic Farms, Inc. The rationale for change of rat
strain from F344/N to F344/NTac was a programmatic decision. For many years, the NTP used the inbred F344/N
rat for its toxicity and carcinogenicity studies. Over a period of time, the F344/N rat exhibited sporadic seizures and
idiopathic chylothorax, and consistently high rates of mononuclear cell leukemia and testicular neoplasia. Because of
these issues in the F344/N rat and the NTP’s desire to find a more fecund rat model that could be used in both
reproductive and carcinogenesis studies for comparative purposes, a change in the rat model was explored. Following
a workshop in 2005, the F344 rat from the Taconic commercial colony (F344/NTac) was used for a few NTP studies
to allow the NTP to evaluate different rat models. The F344/NTac rat was used in four subchronic and two chronic
studies between 2005 and 2006 (King-Herbert and Thayer, 2006).
ANIMAL WELFARE Animal care and use are in accordance with the Public Health Service Policy on Humane Care and Use of Animals.
All animal studies were conducted in an animal facility accredited by the Association for the Assessment and
Accreditation of Laboratory Animal Care International. Studies were approved by the Battelle Columbus Operations
Animal Care and Use Committee and conducted in accordance with all relevant NIH and NTP animal care and use
policies and applicable federal, state, and local regulations and guidelines.
3-MONTH STUDIES
On receipt, the rats were 3 to 4 weeks old and the mice were 4 to 5 weeks old. Animals were quarantined for 11 to
14 days; rats were 5 to 6 weeks old and mice were 6 to 7 weeks old on the first day of the studies. Before the studies
began, five male and five female rats and mice were randomly selected for parasite evaluation and gross observation

Tetrabromobisphenol A-bis(2,3-dibromopropyl ether), NTP TOX 85 19
for evidence of disease. The health of the animals was monitored during the studies using the protocols of the NTP
Sentinel Animal Program (Appendix I); all test results were negative.
Recommended doses for the NTP subchronic studies in rats and mice were 0, 125, 250, 500, and 1,000 mg/kg (corn
oil gavage). These doses were based on the relatively low toxicity reported for this chemical in the literature (WHO,
1995) and the NTP finding that the maximum amount of chemical that could be gavaged was 1,000 mg/kg due to
viscosity. Corn oil gavage was selected as the route of administration because oral exposure is a likely route of
exposure in humans, and to allow for comparison of results with those of other flame retardants administered by this
route.
Core study groups of 10 male and 10 female rats were administered tetrabromobisphenol A-bis(2,3-dibromopropyl
ether) in corn oil by gavage at doses of 0, 62.5, 125, 250, 500, or 1,000 mg/kg body weight 5 days per week for
14 weeks, and additional groups of 10 male and 10 female special study rats were administered the same doses for
23 days for hematology, clinical chemistry, and liver enzyme level determinations. Groups of 10 male and 10 female
mice were administered 0, 125, 250, 500, 1,000, or 2,000 mg/kg for 14 weeks. Vehicle control animals received the
corn oil vehicle alone. Dosing volumes were 5 mL/kg for rats and 10 mL/kg for mice. Feed and water were available
ad libitum. Rats and female mice were housed five per cage, and male mice were housed individually. Clinical
findings were recorded postdosing on day 1, weekly, and at the end of the studies; animals were weighed on day 1,
weekly, and at the end of the studies. Details of the study design and animal maintenance are summarized in Table 1.
Hematology, clinical chemistry, and thyroid hormone analyses were performed on special study rats on days 4 (except
hematology) and 23 and on core study rats at study termination. Hematology analyses were performed on mice at
study termination. Blood was collected from the retroorbital plexus of rats and the retroorbital venous sinus of mice
for hematology analyses, and from the retroorbital plexus of special study rats and the heart of core study rats for
clinical chemistry and thyroid hormone analyses. Samples were collected into tubes containing EDTA for hematology
or serum separator tubes for clinical chemistry and thyroid hormone determinations. Hematology parameters were
determined using an Advia 120 analyzer (Bayer Diagnostic Division, Tarrytown, NY). Clinical chemistry parameters
and total thyroxine were determined using a Hitachi 911 analyzer (Roche Diagnostics Corporation, Indianapolis, IN).
Total triiodothyronine and thyroid stimulating hormone were determined by radioimmunoassay using a commercial
kit. The parameters measured are listed in Table 1.
At the end of the 3-month studies, samples were collected for sperm motility or vaginal cytology evaluations on rats
in the 0, 250, 500, and 1,000 mg/kg groups and mice in the 0, 500, 1,000, and 2,000 mg/kg groups. The parameters
evaluated are listed in Table 1. For 12 consecutive days prior to scheduled terminal euthanasia, the vaginal vaults of
the females were moistened with saline, if necessary, and samples of vaginal fluid and cells were stained. Relative
numbers of leukocytes, nucleated epithelial cells, and large squamous epithelial cells were determined and used to
ascertain estrous cycle stage (i.e., diestrus, proestrus, estrus, and metestrus). Male animals were evaluated for sperm

20 Tetrabromobisphenol A-bis(2,3-dibromopropyl ether), NTP TOX 85
count and motility. The left testis and left epididymis were isolated and weighed. The tail of the epididymis (cauda
epididymis) was then removed from the epididymal body (corpus epididymis) and weighed. Test yolk (rats) or
modified Tyrone’s buffer (mice) was applied to slides and a small incision was made at the distal border of the cauda
epididymis. The sperm effluxing from the incision were dispersed in the buffer on the slides, and the numbers of
motile and nonmotile spermatozoa were counted for five fields per slide by two observers. Following completion of
sperm motility estimates, each left cauda epididymis was placed in buffered saline solution. Caudae were finely
minced, and the tissue was incubated in the saline solution and then heat fixed at 65° C. Sperm density was then
determined microscopically with the aid of a hemacytometer. To quantify spermatogenesis, the testicular spermatid
head count was determined by removing the tunica albuginea and homogenizing the left testis in phosphate-buffered
saline containing 10% dimethyl sulfoxide. Homogenization-resistant spermatid nuclei were counted with a
hemacytometer.
Liver samples were collected from special study rats on day 23 and from all core study rats and mice at the end of the
studies for cytochrome P450 and uridine diphosphate-glucuronosyltransferase (UDP-GT) activity determinations.
Microsomal suspensions were prepared as described by Battelle (2006a,b). The concentration of protein in each
suspension was determined using a BCA Protein Assay Kit (Pierce Chemical Co., Rockford, IL). 7-Ethoxyresorufin-
O-deethylase (CYP1A1) and 7-pentoxyresorufin-O-dealkylase (CYP2B1) activities were determined
spectrofluorimetrically (Rutten et al., 1992), acetanilide-4-hydroxylase (CYP1A2) activity was determined by HPLC
with ultraviolet detection (Liu et al., 1991; DeVito et al., 1993, 1996), and UDP-GT activity toward T4 was determined
by quantifying the amount of 125I-T4-glucuronide produced (Hood and Klaassen, 2000).
Necropsies were performed on all core study rats and mice. The heart, right kidney, liver, lung, spleen, right testis,
and thymus were weighed. Tissues for microscopic examination were fixed and preserved in 10% neutral buffered
formalin (eyes were first fixed in Davidson’s solution); testes, vaginal tunics of testes, and epididymides were first
fixed in modified Davidson’s solution), processed and trimmed, embedded in paraffin, sectioned to a thickness of 4
to 6 µm, and stained with hematoxylin and eosin (H&E). Complete histopathologic examinations were performed by
the study laboratory pathologist on 0 and 1,000 mg/kg rats and 0 and 2,000 mg/kg mice. In addition, the liver, lung,
and mesenteric lymph node were examined in the remaining dosed groups of rats because lesions in these tissues were
identified in the high dose groups. When present, gross lesions were examined in all dosed groups. Table 1 lists the
tissues and organs routinely examined.
After a review of the laboratory reports and selected histopathology slides by a quality assessment (QA) pathologist,
the findings and reviewed slides were submitted to a NTP Pathology Peer Review (PPR) coordinator for a second
independent review. Any inconsistencies in the diagnoses made by the study laboratory and QA pathologists were
resolved by the NTP pathology peer review process. Final diagnoses for reviewed lesions represent a consensus of
the PPR or a consensus between the study laboratory pathologist, NTP pathologist, QA pathologist(s) and the PPR

Tetrabromobisphenol A-bis(2,3-dibromopropyl ether), NTP TOX 85 21
coordinator. Details of these review procedures have been described, in part, by Maronpot and Boorman (1982) and
Boorman et al. (1985).
To determine the nature of the pulmonary granulomatous and chronic active inflammatory lesions, special microscopic
reviews (Reviews 1 through 5) were performed on respiratory system tissues of rats and mice in the current 3-month
corn oil gavage study of tetrabromobisphenol A-bis(2,3-dibromopropyl ether), on lung tissue of rats from the 3-month
interim evaluation in the 2-year corn oil gavage study of tetrabromobisphenol A (NTP, 2014), and on lung tissue of
rats from the 3-month feed study of p-toluenesulfonamide (NTP, 2016a). For Review 1, H&E stained sections of the
nasal cavity, larynx, and trachea from all vehicle control and treated F344/NTac rats in the current study were
examined to determine if gavage-related reflux may have caused granulomatous lesions in the lung. For Review 2,
Sudan black stained sections of the lung from three vehicle control and three treated F344/NTac rats in the current
study were examined to determine if corn oil droplets were present and whether their presence correlated with the
occurrence of granulomatous inflammation. For Review 3, H&E and Sudan black stained sections of the lung of five
vehicle control and five high dose Wistar Han rats at the 3-month interim evaluation in the 2-year corn oil gavage
study of tetrabromobisphenol A (NTP, 2014) were evaluated for the presence of granulomatous inflammation and
corn oil droplets. For Review 4, H&E and Sudan black stained sections of the lung of five control and five high dose
F344/NTac rats from the 3-month feed study of p-toluenesulfonamide were evaluated for the presence of
granulomatous inflammation and corn oil droplets. For Review 5, Sudan black stained sections of the lung from three
vehicle control and three high dose B6C3F1/N mice in the current study were examined to determine if corn oil
droplets were present and whether their presence correlated with the occurrence of granulomatous lesions.
TABLE 1 Experimental Design and Materials and Methods in the 3-Month Gavage Studies of Tetrabromobisphenol A-bis(2,3-dibromopropyl ether)
Study Laboratory Battelle Columbus Operations (Columbus, OH) Strain and Species F344/NTac rats B6C3F1/N mice Animal Source Taconic Farms, Inc. (Germantown, NY) Time Held Before Studies Rats: 11 (males) or 12 (females) days Mice: 13 (females) or 14 (males) days Average Age When Studies Began Rats: 5 to 6 weeks Mice: 6 to 7 weeks Date of First Dose Rats: January 9 (males) or 10 (females), 2006 Mice: January 11 (females) or 12 (males), 2006

22 Tetrabromobisphenol A-bis(2,3-dibromopropyl ether), NTP TOX 85
TABLE 1 Experimental Design and Materials and Methods in the 3-Month Gavage Studies of Tetrabromobisphenol A-bis(2,3-dibromopropyl ether)
Duration of Dosing 5 days per week for 14 weeks Date of Last Dose Rats: April 10 (males) or 11 (females), 2006 Mice: April 12 (females) or 13 (males), 2006 Necropsy Dates Rats: April 11 (males) or 12 (females), 2006 Mice: April 13 (females) or 14 (males), 2006 Average Age at Necropsy Rats: 18 to 19 weeks Mice: 19 to 20 weeks Size of Study Groups Core study animals: 10 males and 10 females (rats and mice) Special study animals: 10 males and 10 females (rats only) Method of Distribution Animals were distributed randomly into groups of approximately equal initial mean body weights. Animals per Cage 5 (rats and female mice) or 1 (male mice) Method of Animal Identification Tail tattoo Diet Irradiated NTP-2000 open formula wafer feed (Zeigler Brothers, Inc., Gardners, PA), available ad libitum; changed at least weekly Water Tap water (City of Columbus municipal supply) via automatic watering system (Edstrom Industries, Waterford, WI), available ad libitum
Cages Polycarbonate (Lab Products, Inc., Seaford, DE), changed weekly (male mice) or twice weekly (rats and female mice)
Bedding Irradiated Sani Chips® (P.J. Murphy Forest Products Corp., Montville, NJ), changed weekly (male mice) or twice weekly (rats and female
mice) Rack Filters Spun-bonded polyester (Snow Filtration Co., Cincinnati, OH) changed every 2 weeks Racks Stainless steel (Lab Products, Inc., Seaford, DE), changed every 2 weeks Animal Room Environment Temperature: 72° ± 3° F Relative humidity: 50% ± 15% Room fluorescent light: 12 hours/day Room air changes: at least 10/hour
Doses Rats: 0, 62.5, 125, 250, 500, or 1,000 mg/kg in corn oil (dosing volume, 5 mL/kg) Mice: 0, 125, 250, 500, 1,000, or 2,000 mg/kg in corn oil (dosing volume, 10 mL/kg) Type and Frequency of Observation Observed twice daily; animals were weighed and clinical findings were recorded on day 1, weekly thereafter, and at the end of the studies. Method of Euthanasia Carbon dioxide asphyxiation (special study rats and mice) or exsanguination by severing portal vein (core study rats)

Tetrabromobisphenol A-bis(2,3-dibromopropyl ether), NTP TOX 85 23
TABLE 1 Experimental Design and Materials and Methods in the 3-Month Gavage Studies of Tetrabromobisphenol A-bis(2,3-dibromopropyl ether)
Necropsy Necropsies were performed on all core study rats and mice. Organs weighed were heart, right kidney, liver, lung, spleen, right testis, and
thymus. Clinical Pathology Blood was collected from the retroorbital plexus of special study rats on days 4 and 23 and of core study rats and mice at the end of the studies; blood was also collected from the heart of core study rats at the end of the study. Hematology parameters were measured on day 23 (rats) and at the end of the studies (rats and mice). Clinical chemistry and thyroid hormones were measured in rats on days 4 (except triiodothyronine) and 23 and at the end of the study. Hematology: hematocrit; hemoglobin concentration; erythrocyte, reticulocyte, and platelet counts; mean cell volume; mean cell hemoglobin; mean cell hemoglobin concentration; and leukocyte count and differentials Clinical chemistry: urea nitrogen, creatinine, glucose, total protein, albumin, cholesterol, alanine aminotransferase, alkaline phosphatase, creatine kinase, sorbitol dehydrogenase, and bile acids Thyroid hormones: total triiodothyronine, thyroid stimulating hormone, and total thyroxine
Liver Protein and Enzyme Levels Liver samples were collected from special study rats on day 23 and from core study rats and mice at study termination for determination of microsomal protein concentration and acetanilide-4-hydroxylase, 7-ethoxyresorufin-O-deethylase, 7-pentoxyresorufin-O-dealkylase, and uridine diphosphate-glucuronosyltransferase activities.
Histopathology Complete histopathology was performed on core study rats in the 0 and 1,000 mg/kg groups, mice in the 0 and 2,000 mg/kg groups, and all animals that died early. In addition to gross lesions and tissue masses, the following tissues were examined: adrenal gland, bone with marrow, brain, clitoral gland, esophagus, eye, gallbladder (mice), Harderian gland, heart and aorta, large intestine (cecum, colon, rectum), small intestine (duodenum, jejunum, ileum), kidney, liver, lung (with mainstem bronchus), lymph nodes (mandibular and mesenteric), mammary gland, nose, ovary, pancreas, parathyroid gland, pituitary gland, preputial gland, prostate gland, salivary gland, seminal vesicle, skin, spleen, stomach (forestomach and glandular), testis (with epididymis), thymus, thyroid gland, trachea, urinary bladder, and uterus. The liver, lung, and mesenteric lymph nodes were also examined in the remaining dosed groups of rats. Special microscopic reviews were performed on respiratory system tissues of rats and mice. Sperm Motility and Vaginal Cytology At the end of the studies, sperm samples were collected from male rats in the 0, 250, 500, and 1,000 mg/kg groups and male mice in the 0, 500, 1,000, and 2,000 mg/kg groups. The following parameters were evaluated: spermatid heads per gram testis and per testis, sperm motility, and sperm per gram cauda epididymis and per cauda epididymis. The left cauda, left epididymis, and left testis were weighed. Vaginal samples were collected for up to 12 consecutive days prior to the end of the studies from female rats in the 0, 250, 500, and 1,000 mg/kg groups and female mice in the 0, 500, 1,000, and 2,000 mg/kg groups.
STATISTICAL METHODS Calculation and Analysis of Lesion Incidences The incidences of lesions are presented in Appendix A as the numbers of animals bearing such lesions at a specific
anatomic site and the numbers of animals with that site examined microscopically. The Fisher exact test (Gart et al.,
1979), a procedure based on the overall proportion of affected animals, was used to determine significance.
Analysis of Continuous Variables
Two approaches were employed to assess the significance of pairwise comparisons between dosed and vehicle control
groups in the analysis of continuous variables. Organ and body weight data, which historically have approximately
normal distributions, were analyzed with the parametric multiple comparison procedures of Dunnett (1955) and
Williams (1971, 1972). Hematology, clinical chemistry, thyroid hormone, microsomal protein, cytochrome P450,

24 Tetrabromobisphenol A-bis(2,3-dibromopropyl ether), NTP TOX 85
UDP-GT, spermatid, and epididymal spermatozoal data, which have typically skewed distributions, were analyzed
using the nonparametric multiple comparison methods of Shirley (1977) (as modified by Williams, 1986) and Dunn
(1964). Jonckheere’s test (Jonckheere, 1954) was used to assess the significance of the dose-related trends and to
determine whether a trend-sensitive test (Williams’ or Shirley’s test) was more appropriate for pairwise comparisons
than a test that does not assume a monotonic dose-related trend (Dunnett’s or Dunn’s test). Prior to statistical analysis,
extreme values identified by the outlier test of Dixon and Massey (1957) were examined by NTP personnel, and
implausible values were eliminated from the analysis. Proportions of regular cycling females in each dosed group
were compared to the vehicle control group using the Fisher exact test (Gart et al., 1979). Tests for extended periods
of estrus, diestrus, metestrus, and proestrus, as well as skipped estrus and skipped diestrus, were constructed based on
a Markov chain model proposed by Girard and Sager (1987). For each dose group, a transition probability matrix was
estimated for transitions among the proestrus, estrus, metestrus, and diestrus stages, with provision for extended stays
within each stage as well as for skipping estrus or diestrus within a cycle. Equality of transition matrices among dose
groups and between the vehicle control group and each dosed group was tested using chi-square statistics.
QUALITY ASSURANCE METHODS
The 3-month studies were conducted in compliance with Food and Drug Administration Good Laboratory Practice
Regulations (21 CFR, Part 58). In addition, as records from the 3-month studies were submitted to the NTP Archives,
these studies were audited retrospectively by an independent quality assessment contractor. Separate audits covered
completeness and accuracy of the pathology data, pathology specimens, final pathology tables, and a draft of this NTP
Toxicity Study Report. Audit procedures and findings are presented in the reports and are on file at NIEHS. The
audit findings were reviewed and assessed by NTP staff, and all comments were resolved or otherwise addressed
during the preparation of this Toxicity Study Report.
GENETIC TOXICOLOGY
Salmonella typhimurium Mutagenicity Test Protocol Tetrabromobisphenol A-bis(2,3-dibromopropyl ether) (lot 324811, Great Lakes Chemical Corp.) was tested for
mutagenicity in three strains of Salmonella typhimurium following protocols reported by Zeiger et al. (1992).
Tetrabromobisphenol A-bis(2,3-dibromopropyl ether) was sent to the testing laboratory as a coded sample. It was
incubated with the S. typhimurium tester strains TA98, TA100, and TA102 either in buffer or S9 mix (metabolic
activation enzymes and cofactors from Aroclor 1254-induced male Sprague Dawley rat liver) for 20 minutes at 37º C.
Top agar supplemented with L-histidine and d-biotin was added, and the contents of the tubes were mixed and poured
onto the surfaces of minimal glucose agar plates. Histidine-independent mutant colonies arising on these plates were
counted following incubation for 2 days at 37º C.

Tetrabromobisphenol A-bis(2,3-dibromopropyl ether), NTP TOX 85 25
Each trial consisted of triplicate plates of concurrent positive and negative controls and of five doses of
tetrabromobisphenol A-bis(2,3-dibromopropyl ether). In the absence of toxicity, the highest concentration tested was
10,000 µg/plate.
In this assay, a positive response is defined as a reproducible, dose-related increase in histidine-independent (revertant)
colonies in any one strain/activation combination. An equivocal response is defined as an increase in revertants that
is not dose related, is not reproducible, or is not of sufficient magnitude to support a determination of mutagenicity.
A negative response is obtained when no increase in revertant colonies is observed following chemical treatment.
There is no minimum percentage or fold increase required for a chemical to be judged positive or weakly positive
although positive calls are typically reserved for increases in mutant colonies that are at least twofold over background.
Mouse Peripheral Blood Micronucleus Test Protocol A detailed discussion of this assay is presented by MacGregor et al. (1990). At the termination of the 3-month toxicity
study, peripheral blood samples were obtained from male and female mice. Smears were immediately prepared and
fixed in absolute methanol. The methanol-fixed slides were stained with acridine orange and coded. Slides were
scanned to determine the frequency of micronucleated cells in 2,000 normochromatic erythrocytes (NCEs) in each of
five animals per dose group. In addition, the percentage of polychromatic erythrocytes in a population of 1,000
erythrocytes was determined as a measure of bone marrow toxicity.
The results were tabulated as the mean of the pooled results from all animals within a treatment group, plus or minus
the standard error of the mean. The frequency of micronucleated cells among NCEs was analyzed by a statistical
software package that tested for increasing trend over dose groups using a one-tailed Cochran-Armitage trend test,
followed by pairwise comparisons between each dosed group and the vehicle control group. In the presence of excess
binomial variation, as detected by a binomial dispersion test, the binomial variance of the Cochran-Armitage test was
adjusted upward in proportion to the excess variation. In the micronucleus test, an individual trial is considered
positive if the trend test P value is less than or equal to 0.025 or if the P value for any single dosed group is less than
or equal to 0.025 divided by the number of dosed groups. After the statistical analysis of the test data has been
completed, the scientific staff determines the final call for the assay, considering the results of statistical analyses, the
reproducibility of any effects observed, and the magnitudes of those effects.
Evaluation Protocol These are the basic guidelines for arriving at an overall assay result for assays performed by the National Toxicology
Program. Statistical as well as biological factors are considered. For an individual assay, the statistical procedures
for data analysis have been described in the preceding protocols. There have been instances, however, in which
multiple samples of a chemical were tested in the same assay, and different results were obtained among these samples
and/or among laboratories. Results from more than one aliquot or from more than one laboratory are not simply
combined into an overall result. Rather, all the data are critically evaluated, particularly with regard to pertinent

26 Tetrabromobisphenol A-bis(2,3-dibromopropyl ether), NTP TOX 85
protocol variations, in determining the weight of evidence for an overall conclusion of chemical activity in an assay.
In addition to multiple aliquots, the in vitro assays have another variable that must be considered in arriving at an
overall test result. In vitro assays are conducted with and without exogenous metabolic activation. Results obtained
in the absence of activation are not combined with results obtained in the presence of activation; each testing condition
is evaluated separately. The results presented in the Abstract of this Toxicity Study Report represent a scientific
judgment of the overall evidence for activity of the chemical in an assay.

27
RESULTS
3-MONTH STUDY IN RATS All rats survived to the end of the study with the exception of two 62.5 mg/kg males and one vehicle control female;
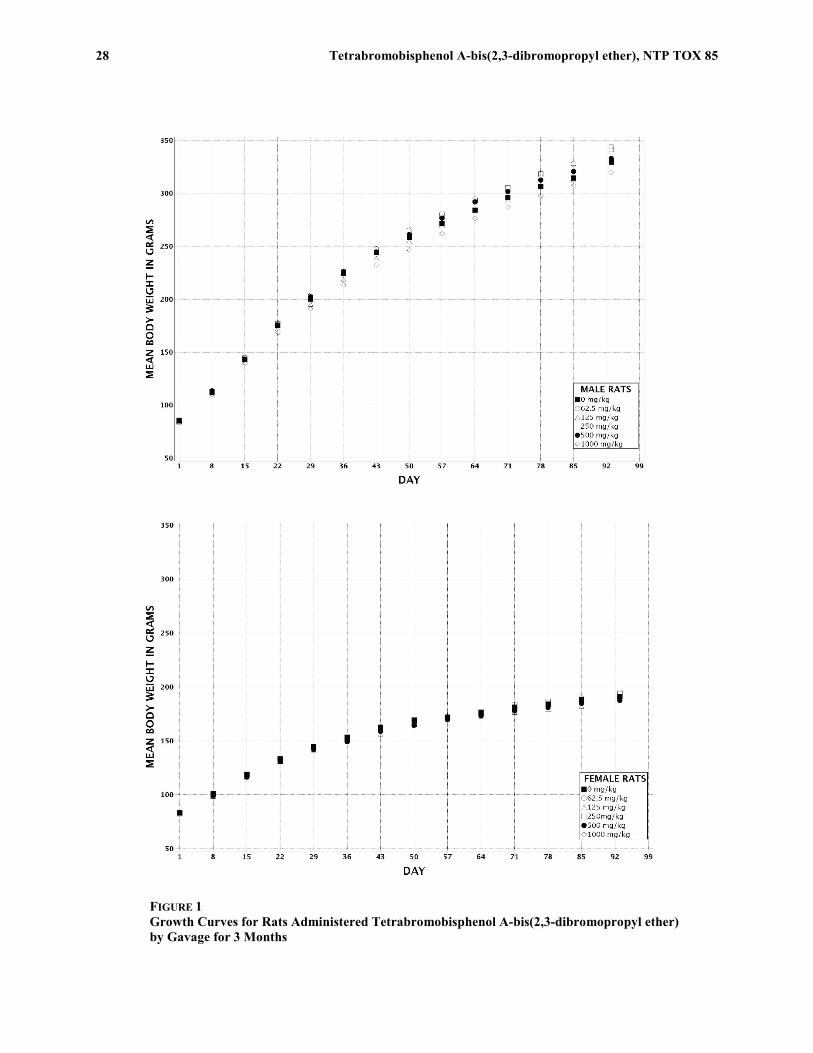
one male death was due to a dosing accident (Table 2). Final mean body weights and body weight gains of male and
female rats were similar to those of the vehicle controls (Table 2; Figure 1). No treatment-related clinical findings or
treatment-related gross lesions were identified in males or females.
TABLE 2 Survival and Body Weights of Rats in the 3-Month Gavage Study of Tetrabromobisphenol A-bis(2,3-dibromopropyl ether)a
Dose (mg/kg)
Survivalb
Initial Body
Weight (g)
Final Body
Weight (g)
Change in Body
Weight (g)
Final Weight Relative
to Controls (%)
Male
0 10/10 85 ± 3 330 ± 9 244 ± 9 62.5 8/10c 85 ± 2 344 ± 8 258 ± 8 104
125 10/10 85 ± 3 329 ± 7 245 ± 7 100 250 10/10 84 ± 2 342 ± 6 257 ± 6 104 500 10/10 86 ± 3 333 ± 5 247 ± 6 101
1,000 10/10 86 ± 3 320 ± 8 234 ± 8 97 Female
0 9/10d 83 ± 2 191 ± 4 108 ± 4 62.5 10/10 83 ± 1 195 ± 4 112 ± 4 102
125 10/10 83 ± 2 188 ± 4 106 ± 4 98 250 10/10 83 ± 1 194 ± 4 111 ± 4 101 500 10/10 84 ± 2 188 ± 3 104 ± 3 98
1,000 10/10 83 ± 2 190 ± 4 106 ± 3 99
a Weights and weight changes are given as mean ± standard error. Subsequent calculations are based on animals surviving to the end of the
study. Differences from the vehicle control group are not significant by Dunnett’s test. b Number of animals surviving at 14 weeks/number initially in group c One 62.5 mg/kg male died early of a natural death on test day 37 and had lesions of minimal cardiomyopathy, minimal chronic liver
inflammation, minimal liver cytoplasmic vacuolization, and acute and minimal pulmonary inflammation. Another 62.5 mg/kg male died of a dosing accident on test day 40 and had lesions of minimal cardiomyopathy, minimal renal nephropathy and mineralization, minimal chronic liver cytoplasmic vacuolization, mesenteric lymph node moderate histiocytic cellular infiltration, and acute mild pulmonary inflammation.
d Week of death: 8
28 Tetrabromobisphenol A-bis(2,3-dibromopropyl ether), NTP TOX 85
FIGURE 1 Growth Curves for Rats Administered Tetrabromobisphenol A-bis(2,3-dibromopropyl ether) by Gavage for 3 Months

Tetrabromobisphenol A-bis(2,3-dibromopropyl ether), NTP TOX 85 29
Small (≤15%) decreases in cholesterol concentrations occurred in the 250 mg/kg or greater male and female rats
(Table B1). This effect was observed in one or more of the higher dose groups at all time points, albeit inconsistently
within a dosed group. Only the 500 mg/kg female rats demonstrated decreases at all time points. The toxicologic
relevance of these small, inconsistent decreases in circulating cholesterol concentrations is unknown, but could suggest
some small alteration in cholesterol metabolism related to treatment.
Liver enzyme levels showed an apparent decrease in treated groups of males and females when normalized on a
microsomal protein level (Table F1). However, this decrease in liver enzyme levels was not considered to be
biologically relevant because the absolute values for the liver enzymes did not increase with treatment.
There were no chemical-related effects on absolute or relative organ weights in males or females (Table C1).
There were no changes in the number of sperm or spermatids, sperm motility, or testis or epididymis weights of dosed
males (Table D1). There were no estrous cycle changes in dosed females (Tables D2 and D3; Figure D1). Under the
conditions of this study, gavage administration of tetrabromobisphenol A-bis(2,3-dibromopropyl ether) did not exhibit
the potential to be a reproductive toxicant in male or female rats.
In the lung, incidences of granulomatous inflammation in 62.5, 125, 250, and 500 mg/kg males and in females
administered 125 mg/kg or greater were significantly greater than those in the vehicle control groups (Tables 3, A1,
and A2). The incidences of chronic active inflammation were significantly increased in 250 mg/kg or greater females;
the incidence of this lesion was significantly decreased in 62.5 mg/kg males.
Granulomatous inflammation in the lung of male and female rats was characterized by foci of vacuolated mononuclear
and occasionally multinucleated macrophages within the alveoli lumens, and less often in the terminal bronchioles,
with minimal to no perivascular involvement. Some macrophages contained linear clear spaces consistent with sterol
clefts and others contained small refractile globules, consistent with oil droplets.
Chronic active inflammation in the lung of male and female rats was characterized by dense perivascular
accumulations of lymphocytes with fewer macrophages, granulocytes, and erythrocytes. This lesion is
morphologically consistent with Pneumocystis carinii infection (Livingston et al., 2011).

30 Tetrabromobisphenol A-bis(2,3-dibromopropyl ether), NTP TOX 85
TABLE 3 Incidences of Nonneoplastic Lesions of the Lung in Rats in the 3-Month Gavage Study of Tetrabromobisphenol A-bis(2,3-dibromopropyl ether)
Vehicle Control
62.5 mg/kg
125 mg/kg
250 mg/kg
500 mg/kg
1,000 mg/kg
Male Number Examined Microscopically 10 10 10 10 10 10
Inflammation, Granulomatousa 0 4* (1.5)b 8** (1.6) 8** (1.4) 6** (1.0) 2 (1.5)
Inflammation, Chronic Active 7 (1.1) 1** (1.0) 9 (2.3) 6 (1.0) 8 (1.1) 7 (1.1)
Female Number Examined Microscopically 10 10 10 10 10 10
Inflammation, Granulomatous 0 3 (1.3) 6** (1.5) 6** (1.5) 6** (1.0) 5* (1.4)
Inflammation, Chronic Active 1 (1.0) 4 (1.0) 3 (1.7) 6* (1.2) 6* (1.2) 8** (1.4)
* Significantly different (P≤0.05) from the vehicle control group by the Fisher exact test ** P≤0.01 a Number of animals with lesion b Average severity grade of lesions in affected animals: 1=minimal, 2=mild, 3=moderate, 4=marked

Tetrabromobisphenol A-bis(2,3-dibromopropyl ether), NTP TOX 85 31
3-MONTH STUDY IN MICE All mice survived to the end of the study (Table 4). The final mean body weights and body weight gains of all dosed
groups of males were similar to those of the vehicle control group; the final mean body weight of 250 mg/kg females
was 11% greater than that of the vehicle controls, and the mean body weight gain of this group was significantly
increased (Table 4; Figure 2). No treatment-related clinical findings or treatment-related gross lesions were identified
in males or females.
No changes attributable to administration of tetrabromobisphenol A-bis(2,3-dibromopropyl ether) occurred in the
hematology data for mice (Table B2).
Liver enzyme levels showed an apparent decrease in treated groups of males and females when normalized on a
microsomal protein level (Table F2). However, this decrease in liver enzyme levels was not considered to be
biologically relevant because the absolute values for the liver enzymes did not increase with treatment.
TABLE 4 Survival and Body Weights of Mice in the 3-Month Gavage Study of Tetrabromobisphenol A-bis(2,3-dibromopropyl ether)a
Dose (mg/kg)
Survivalb
Initial Body
Weight (g)
Final Body
Weight (g)
Change in Body
Weight (g)
Final Weight Relative
to Controls (%)
Male
0 10/10 23.3 ± 0.4 36.8 ± 1.0 13.5 ± 0.9 125 10/10 23.2 ± 0.4 39.0 ± 0.9 15.9 ± 0.6 106 250 10/10 23.0 ± 0.3 38.3 ± 1.0 15.3 ± 0.7 104 500 10/10 23.4 ± 0.4 39.4 ± 1.5 16.0 ± 1.1 107
1,000 10/10 23.0 ± 0.3 38.2 ± 0.9 15.2 ± 0.7 104 2,000 10/10 22.8 ± 0.3 39.1 ± 1.1 16.3 ± 0.9 106
Female
0 10/10 18.4 ± 0.4 29.2 ± 1.0 10.9 ± 0.7 125 10/10 18.7 ± 0.3 31.6 ± 1.3 12.9 ± 1.0 108 250 10/10 18.6 ± 0.3 32.4 ± 0.7 13.8 ± 0.5* 111 500 10/10 18.5 ± 0.3 31.0 ± 0.8 12.5 ± 0.7 106
1,000 10/10 18.8 ± 0.3 31.0 ± 0.8 12.2 ± 0.7 106 2,000 10/10 18.5 ± 0.3 30.2 ± 0.9 11.7 ± 0.7 103
* Significantly different (P≤0.05) from the vehicle control group by Dunnett’s test a Weights and weight changes are given as mean ± standard error. b Number of animals surviving at 14 weeks/number initially in group

32 Tetrabromobisphenol A-bis(2,3-dibromopropyl ether), NTP TOX 85
FIGURE 2 Growth Curves for Mice Administered Tetrabromobisphenol A-bis(2,3-dibromopropyl ether) by Gavage for 3 Months

Tetrabromobisphenol A-bis(2,3-dibromopropyl ether), NTP TOX 85 33
There were no chemical-related effects on absolute or relative organ weights in males or females (Table C2).
There were no changes in the number of sperm or spermatids, sperm motility, or testis or epididymis weights of dosed
males (Table D4). There were no estrous cycle changes in dosed females (Tables D5 and D6; Figure D2). Under the
conditions of this study, gavage administration of tetrabromobisphenol A-bis(2,3-dibromopropyl ether) did not exhibit
the potential to be a reproductive toxicant in male or female mice.
There were no gross or histologic lesions that were considered treatment related (Tables A3 and A4).
SPECIAL RESPIRATORY SYSTEM MICROSCOPIC REVIEWS Special NTP reviews (1 through 5) of respiratory system tissues of rats and mice were conducted to better define and
determine the nature of the pulmonary granulomatous and chronic active inflammatory lesions that occurred in the
lungs of rats in the current study.
In Review 1, histologic evaluation of H&E stained sections of the nasal cavity, larynx, and trachea from all male and
female vehicle control and treated rats in the current study was conducted to determine if gavage-related reflux could
have caused the granulomatous lesions (Damsch et al., 2011). No significant treatment-related histologic lesions were
noted in any of the tissues examined.
In Review 2, Sudan black stained sections of the lung from three vehicle control and three dosed F344/NTac rats in
the current study were evaluated to determine if corn oil could be present in the lung and, if so, was it present within
the granulomatous lesions. Sudan black is a diazo dye used for the staining of some lipoproteins in paraffin sections
(Carson and Hladik, 2009). The presence of granulomatous inflammation correlated with the presence of Sudan black
positive material within the distal alveolar spaces. This positive staining correlated with the small round globules,
consistent with oil droplets, that were noted with H&E stain.
In Review 3, H&E and Sudan black stained sections of lung from five vehicle control Wistar Han rats and five high
dose Wistar Han rats at the 3-month interim evaluation in the 2-year corn oil gavage study of tetrabromobisphenol A
(NTP, 2014) were examined for granulomatous inflammation and corn oil droplets. Animals from that
tetrabromobisphenol A study were used because that study was conducted at the same laboratory at approximately the
same time as the current tetrabromobisphenol A-bis(2,3-dibromopropyl ether) study, tetrabromobisphenol A is a
related chemical, and the route of administration was the same. Granulomatous lesions similar to those that occurred
in F344/NTac rats in the current tetrabromobisphenol A-bis(2,3-dibromopropyl ether) study were not present in any
of the tetrabromobisphenol A Wistar Han rat lungs examined, but occasional similar pale yellow, small refractile,
round globules (consistent with oil droplets) were present without an inflammatory response. In addition, there was

34 Tetrabromobisphenol A-bis(2,3-dibromopropyl ether), NTP TOX 85
a correlation between the Sudan black positive material in the alveolar spaces with the presence of this pale yellow
material on H&E staining in the lung tissues from Wistar Han rats in the tetrabromobisphenol A study.
Review 4 involved an evaluation of select H&E and Sudan black stained sections of lungs from five control and five
high dose F344/NTac rats from the 3-month feed study of p-toluenesulfonamide (NTP, 2016a) for similar
granulomatous lesions. The rationale for comparing animals from a feed study to those from the current gavage study
was to determine if the granulomatous lung lesions in the current study were due to corn oil aspiration. There was an
absence of granulomatous lesions similar to those observed in the lungs of rats treated with tetrabromobisphenol
A-bis(2,3-dibromopropyl ether) in the current study, and no evidence of Sudan black positive material in any of the
animals examined. In addition, there were fewer numbers of alveolar macrophages and intra-alveolar debris in the
rats from the feed study compared to those from the current gavage study.
In Review 5, Sudan black stained sections of lung from six select vehicle control (i.e., corn oil) and six high
dose B6C3F1/N mice in the current gavage study of tetrabromobisphenol A-bis(2,3-dibromopropyl ether) were
examined. The rationale for using tetrabromobisphenol A-bis(2,3-dibromopropyl ether) treated mice was to determine
if corn oil was present in mice treated with tetrabromobisphenol A-bis(2,3-dibromopropyl ether) as was found in
tetrabromobisphenol A-bis(2,3-dibromopropyl ether) treated rats. Only one mouse had questionable Sudan black
positive material, however, granulomatous lesions similar to those present in the rat lungs did not occur.
GENETIC TOXICOLOGY Tetrabromobisphenol A-bis(2,3-dibromopropyl ether) was tested for mutagenicity in three strains of Salmonella
typhimurium (TA98, TA100, and TA102), with and without 10% rat liver S9 mix. The sample of tetrabromobis-
phenol A-bis(2,3-dibromopropyl ether) (lot 324811) that was used in the mutagenicity studies was not the same lot
that was used in the 3-month gavage studies in rats and mice. Tetrabromobisphenol A-bis(2,3-dibromopropyl ether)
(dose range of 100 to 10,000 µg/plate) showed no evidence of mutagenic activity in any of the three tester strains,
with or without S9 (Table E1).
In vivo, no significant increases in the frequencies of micronucleated normochromatic erythrocytes were observed in
peripheral blood samples from male or female mice from the 3-month gavage study (Table E2). Furthermore, no
significant changes in the percentage of polychromatic erythrocytes among total red blood cells were seen in these
mice, suggesting that tetrabromobisphenol A-bis(2,3-dibromopropyl ether) did not induce bone marrow toxicity under
the conditions of this study.
35
DISCUSSION The current tetrabromobisphenol A-bis(2,3-dibromopropyl ether) 3-month F344/NTac rat and B6C3F1/N mouse
studies were performed to evaluate the toxic potential of this flame retardant and to compare the toxicity of the test
chemical to that of the structurally related flame retardant tetrabromobisphenol A (NTP, 2014).
In these 3-month tetrabromobisphenol A-bis(2,3-dibromopropyl ether) studies, there were no treatment-related
mortality or clinical signs in F344/NTac rats or B6C3F1/N mice, and final mean body weights of dosed groups were
within 10% of those of the vehicle controls, except for 250 mg/kg female mice.
Two types of lung lesions were seen in rats treated with tetrabromobisphenol A-bis(2,3-dibromopropyl ether). The
first lung lesion, granulomatous inflammation, was seen in all treated rat groups, but the severity of this lesion did
not increase with increased tetrabromobisphenol A-bis(2,3-dibromopropyl ether) exposure. This lung lesion was
characterized by foci of vacuolated mononuclear and occasionally multinucleated macrophages within the alveolar
lumens and less often in the terminal bronchioles. At times, these macrophages had linear clear spaces consistent with
sterol clefts and/or small, pale yellow, round refractile globules, which may have been corn oil. Special studies were
performed to determine the pathogenesis of this lesion. Evaluation of the nasal cavity, larynx, and trachea revealed
no histologic lesions, ruling out gavage-related reflux as a potential etiology (Damsch et al., 2011). Because H&E
evaluation revealed foreign material consistent with corn oil within the granulomatous foci, Sudan black was used to
better characterize this lesion. Sudan black is a dye that is commonly used to stain lipids. In the animals evaluated,
this foreign material did stain with Sudan black, indicating that it was most likely the corn oil vehicle. Select lung
tissue from Wistar Han rats at the 3-month interim evaluation in the 2-year corn oil gavage study of
tetrabromobisphenol A (NTP, 2014) were also evaluated with Sudan black. Although no similar granulomatous
lesions were present, there was occasional foreign material, morphologically consistent with corn oil, which was
Sudan black positive. This suggests that small amounts of corn oil can be aspirated and not necessarily result in
histologic lesions. Select lung tissue from rats in the 3-month p-toluenesulfonamide feed study (NTP, 2016a) were
evaluated as well, and not surprisingly, there were no granulomatous lesions, no similar foreign material (small pale
yellow refractile globules) and no Sudan black positive foreign material. One additional study looked at lungs from
mice in the current study of tetrabromobisphenol A-bis(2,3-dibromopropyl ether), and there were no granulomatous
lesions, no foreign material, and no conclusive Sudan black positivity. The reason for this lack of similar effects in
mice is unknown and may be multifactorial. Potential factors may include superior gavage techniques in the mouse
study and/or the smaller gavage needle bore/diameters used for the mice.
Based on the presence of a Sudan black positive foreign lipid material associated with the granulomatous lesions in
the affected rats in this study, it is suggested that this material was corn oil vehicle aspirated during the gavage process

36 Tetrabromobisphenol A-bis(2,3-dibromopropyl ether), NTP TOX 85
and was not due to a systemic effect of tetrabromobisphenol A-bis(2,3-dibromopropyl ether). However, because corn
oil was seen in the lungs of some rats from the tetrabromobisphenol A study without an inflammatory component
(NTP, 2014), and this granulomatous lesion did not occur in the vehicle control rats from the current
tetrabromobisphenol A-bis(2,3-dibromopropyl ether) study, it may be that test article was also present in the aspirated
material and this may have caused the granulomatous response in the lung. Accordingly, the occurrence of this
granulomatous lung lesion was most likely caused by the procedure of administering the test article to rats that resulted
in a small amount of gavage material (corn oil and test article) remaining on the gavage needle during removal
resulting in a localized, topical contact with the chemical. High viscosity of the corn oil gavage solution may have
caused the material to adhere to the gavage needles. Because oral intubation of mice is somewhat more difficult
compared to rats, the rate of dose administration for mice is accordingly slower. The slower rate of administration
(and, therefore, no deposition of the gavage material in the lung) could explain the lack of pulmonary lesions in the
mice.
The second lung lesion seen in the rats was chronic inflammation, and it was seen in vehicle control and treated rats.
This lesion was morphologically different from the lesion associated with aspiration of gavage solution and was in a
different location within the lung. The granulomatous lesions were within the alveoli lumens, and less often in the
terminal bronchioles, with minimal to no perivascular involvement. The chronic inflammatory lesions were confined
to the perivascular regions. No Sudan black positive material was identified within these perivascular chronic
inflammatory lesions.
The chronic inflammatory lung lesions were characterized by dense perivascular accumulations of mostly
lymphocytes with fewer macrophages, granulocytes, and erythrocytes. The morphology of this rat lung lesion is
characteristic of Pneumocystis carinii infection (Livingston et al., 2011). In immunocompetent rats, infection with
the fungus P. carinii causes an infectious interstitial pneumonia characterized by dense perivascular cuffs of primarily
lymphocytes and a lymphohistiocytic interstitial pneumonia. This lesion has been reported in research rats since the
1990s and was previously attributed to “rat respiratory virus” with an unknown etiology. In 2011, Livingston et al.
determined that the etiologic agent was P. carinii. In immunocompetent animals, there are usually no clinical signs
associated with this infection and it is considered self-limiting, resolving by about 20 weeks of age. Historically, this
organism had been undetectable with silver stains and thus was undiagnosed in rat colonies until 2011 when Livingston
et al. used polymerase chain reaction (PCR) to detect the presence of this specific fungus. Since that time, both PCR
and serological tests have been used to detect P. carinii. The exact etiology of the lung lesions in the current study
remains uncertain because the NTP rat colonies and sentinel animals were not tested for this organism. At the time
this study was performed the causative agent for “rat respiratory virus” had not been determined, hence there was no
assay for the disease. However, due to the morphology of the lesions and the age of the rats, the most likely etiology
is P. carinii.

Tetrabromobisphenol A-bis(2,3-dibromopropyl ether), NTP TOX 85 37
In the current NTP study, there were no tetrabromobisphenol A-bis(2,3-dibromopropyl ether) treatment-related
changes in thyroxine, triiodothyronine, or thyroid stimulating hormone levels in rats (not measured in mice), while
with tetrabromobisphenol A (NTP, 2014), there were decreases in thyroxine levels in F344/NTac rats after 4, 23, and
93 days of chemical administration.
Tetrabromobisphenol A-bis(2,3-dibromopropyl ether) was negative in bacterial mutagenicity tests (Table E1)
consistent with what has been seen previously with tetrabromobisphenol A and other brominated flame retardants
(NTP, 2014, 2016b). In tests with other brominated chemicals, cancer target organs are not always identified in
3-month studies. For example, tetrabromobisphenol A induced uterine adenocarcinomas in the 2-year rat study, but
uterus was not identified as a target organ in the 3-month rat study, based on the absence of treatment-related lesions
(NTP, 2014). Similarly, in a 2-year 2,3-dibromo-1-propanol study, intestinal tumors were seen in rats, but the intestine
was not designated a target organ in the 3-month study (NTP, 1993). Thus, while the current tetrabromobisphenol
A-bis(2,3-dibromopropyl ether) study did not result in treatment-related target organ toxicity in either rats or mice, it
is uncertain if this result would predict positive or negative carcinogenic activity after longer term administration of
tetrabromobisphenol A-bis(2,3-dibromopropyl ether).
Under the conditions of these 3-month gavage studies, there were no clinical findings or treatment-related lesions in
male or female F344/NTac rats or B6C3F1/N mice administered tetrabromobisphenol A-bis(2,3-dibromopropyl ether)
at 0, 62.5, 125, 250, 500, or 1,000 mg/kg in rats or 0, 125, 250, 500, 1,000, or 2,000 mg/kg in mice. Final mean body
weights of treated rats and mice were generally within 10% of vehicle controls, and there were no treatment-related
effects on organ weights.

38 Tetrabromobisphenol A-bis(2,3-dibromopropyl ether), NTP TOX 85

39
REFERENCES
Battelle Columbus Operations (2006a). Biochemical Toxicology Report: Hepatic CYP1A1, CYP2B1, CYP1A2, and
UDP-GT Activities for the 14-Week Gavage Toxicity Study of Tetrabromobisphenol A (TBP) in B6C3F1 Mice
(G823512-C). Battelle Study No. G823512-C. Battelle Columbus Operations, Columbus, OH.
Battelle Columbus Operations (2006b). Biochemical Toxicology Report: Hepatic CYP1A1, CYP2B1, CYP1A2, and
UDP-GT Activities for the 14-Week Gavage Toxicity Study of Tetrabromobisphenol A (TBP) in Fischer F344/NTac
Rats (G823512-B). Battelle Study No. G823512-B. Battelle Columbus Operations, Columbus, OH.
Boorman, G.A., Montgomery, C.A., Jr., Eustis, S.L., Wolfe, M.J., McConnell, E.E., and Hardisty, J.F. (1985). Quality
assurance in pathology for rodent carcinogenicity studies. In Handbook of Carcinogen Testing (H.A. Milman and
E.K. Weisburger, Eds.), pp. 345-357. Noyes Publications, Park Ridge, NJ.
Carson, F.L., and Hladik, C. (2009). Histotechnology: A Self-Instructional Text, 3rd ed., p. 186. American Society
for Clinical Pathology Press, Hong Kong.
Code of Federal Regulations (CFR) 21, Part 58.
Covaci, A., Harrad, S., Abdallah, M.A.-E., Ali, N., Law, R.J., Herzke, D., and de Wit, C.A. (2011). Novel brominated
flame retardants: A review of their analysis, environmental fate and behaviour. Environ. Int. 37, 532-556.
Damsch, S., Eichenbaum, G., Tonelli, A., Lammens, L., Van den Bulck, K., Feyen, B., Vandenberghe, J.,
Megens, A., Knight, E., and Kelley, M. (2011). Gavage-related reflux in rats: Identification, pathogenesis, and
toxicological implications (review). Toxicol. Pathol. 39, 348-360.
de Jourdan, B.P., Hanson, M.L., Muir, D.C.G., and Solomon, K.R. (2013). Environmental fate of three novel
brominated flame retardants in aquatic mesocosms. Environ. Toxicol. Chem. 32, 1060-1068.
DeVito, M.J., Maier, W.E., Diliberto, J.J., and Birnbaum, L.S. (1993). Comparative ability of various PCBs, PCDFs,
and TCDD to induce cytochrome P450 1A1 and 1A2 activity following 4 weeks of treatment. Fundam. Appl. Toxicol.
20, 125-130.

40 Tetrabromobisphenol A-bis(2,3-dibromopropyl ether), NTP TOX 85
DeVito, M.J., Beebe, L.E., Menache, M., and Birnbaum, L.S. (1996). Relationship between CYP1A enzyme activities
and protein levels in rats treated with 2,3,7,8-tetrachlorodibenzo-p-dioxin. J. Toxicol. Environ. Health 47, 379-394.
Dixon, W.J., and Massey, F.J., Jr. (1957). Introduction to Statistical Analysis, 2nd ed., pp. 276-278, 412.
McGraw-Hill Book Company, Inc., New York.
Dunn, O.J. (1964). Multiple comparisons using rank sums. Technometrics 6, 241-252.
Dunnett, C.W. (1955). A multiple comparison procedure for comparing several treatments with a control. J. Am.
Stat. Assoc. 50, 1096-1121.
El-Masri, H.A., and Portier, C.J. (1998). Physiologically based pharmacokinetics model of primidone and its
metabolites phenobarbital and phenylethylmalonamide in humans, rats, and mice. Drug Metab. Dispos. 26, 585-594.
Frederiksen, M., Vorkamp, K., Thomsen, M., and Knudsen, L.E. (2009). Human internal and external exposure to
PBDEs – A review of levels and sources. Int. J. Hyg. Environ. Health 212, 109-134.
Gart, J.J., Chu, K.C., and Tarone, R.E. (1979). Statistical issues in interpretation of chronic bioassay tests for
carcinogenicity. JNCI 62, 957-974.
Girard, D.M., and Sager, D.B. (1987). The use of Markov chains to detect subtle variation in reproductive cycling.
Biometrics 43, 225-234.
Hamers, T., Kamstra, J.H., Sonneveld, E., Murk, A.J., Kester, M.H.A., Andersson, P.L., Legler, J., and Brouwer, A.
(2006). In vitro profiling of the endocrine-disrupting potency of brominated flame retardants. Toxicol. Sci. 92,
157-173.
Hood, A., and Klaassen, C.D. (2000). Differential effects of microsomal enzyme inducers on in vitro thyroxine (T4)
and triiodothyronine (T3) glucuronidation. Toxicol. Sci. 55, 78-84.
Jonckheere, A.R. (1954). A distribution-free k-sample test against ordered alternatives. Biometrika 41, 133-145.
King-Herbert, A., and Thayer, K. (2006). NTP workshop: Animal models for NTP rodent cancer bioassay: Stocks
and strains–should we switch? Toxicol. Pathol. 34, 802-805.

Tetrabromobisphenol A-bis(2,3-dibromopropyl ether), NTP TOX 85 41
Knudsen, G.A., Jacobs, L.M., Kuester, R.K., and Sipes, I.G. (2007). Absorption, distribution, metabolism and
excretion of intravenously and orally administered tetrabromobisphenol A [2,3-dibromopropyl ether] in male
Fischer-344 rats. Toxicology 237, 158-167.
Liu, G., Gelboin, H.V., and Myers, M.J. (1991). Role of cytochrome P450 1A2 in acetanilide 4-hydroxylation as
determined with cDNA expression and monoclonal antibodies. Arch. Biochem. Biophys. 284, 400-406.
Livingston, R.S., Besch-Williford, C.L., Myles, M.H., Franklin, C.L., Crim, M.J., and Riley, L.K. (2011).
Pneumocystis carinii infection causes lung lesions historically attributed to rat respiratory virus. Comp. Med. 61,
45-59.
MacGregor, J.T., Wehr, C.M., Henika, P.R., and Shelby, M.D. (1990). The in vivo erythrocyte micronucleus test:
Measurement at steady state increases assay efficiency and permits integration with toxicity studies. Fundam. Appl.
Toxicol. 14, 513-522.
Maronpot, R.R., and Boorman, G.A. (1982). Interpretation of rodent hepatocellular proliferative alterations and
hepatocellular tumors in chemical safety assessment. Toxicol. Pathol. 10, 71-80.
National Toxicology Program (NTP) (1993). Toxicology and Carcinogenesis Studies of 2,3-Dibromo-1-propanol
(CAS No. 96-13-9) in F344/N Rats and B6C3F1 Mice (Dermal Studies). Technical Report Series No. 400. NIH
Publication No. 94-2855. U.S. Department of Health and Human Services, Public Health Service, National Institutes
of Health, Research Triangle Park, NC.
National Toxicology Program (NTP) (2007). Chemical Disposition Studies in Mammals; Brominated Flame
Retardants: Tetrabromobisphenol A bis(2,3-dibromopropyl ether). NIEHS Contract No. N01-ES-45529. University
of Arizona.
National Toxicology Program (NTP) (2014). Toxicology Studies of Tetrabromobisphenol A (CAS No. 79-94-7) in
F344/NTac Rats and B6C3F1/N Mice and Toxicology and Carcinogenesis Studies of Tetrabromobisphenol A in
Wistar Han [Crl:WI(Han)] Rats and B6C3F1/N Mice (Gavage Studies). Technical Report Series No. 587. NIH
Publication No. 14-5929. National Institutes of Health, Public Health Service, U.S. Department of Health and Human
Services, Research Triangle Park, NC.
National Toxicology Program (NTP) (2016a). Toxicology Studies of p-Toluenesulfonamide (CAS No. 70-55-3)
Administered in Feed to F344/N Rats, F344/NTac Rats, and B6C3F1/N Mice. Toxicity Report Series No. 88.
National Institutes of Health, Public Health Service, U.S. Department of Health and Human Services, Research
Triangle Park, NC.

42 Tetrabromobisphenol A-bis(2,3-dibromopropyl ether), NTP TOX 85
National Toxicology Program (NTP) (2016b). Toxicology Studies of a Pentabromodiphenyl Ether Mixture [DE-71
(Technical Grade)] (CAS No. 32534-81-9) in F344/N Rats and B6C3F1/N Mice and Toxicology and Carcinogenesis
Studies of a Pentabromodiphenyl Ether Mixture [DE-71 (Technical Grade)] in Wistar Han [Crl:WI(Han)] Rats and
B6C3F1/N Mice (Gavage Studies). Technical Report Series No. 589. National Institutes of Health, Public Health
Service, U.S. Department of Health and Human Services, Research Triangle Park, NC.
Qu, G., Liu, A., Wang, T., Zhang, C., Fu, J., Yu, M., Sun, J., Zhu, N., Li, Z., Wei, G., Du, Y., Shi, J., Liu, S., and
Jiang, G. (2013). Identification of tetrabromobisphenol A allyl ether and tetrabromobisphenol A 2,3-dibromopropyl
ether in the ambient environment near a manufacturing site and in mollusks at a coastal region. Environ. Sci. Technol.
47, 4760-4767.
Rutten, A.A., Falke, H.E., Catsburg, J.F., Wortelboer, H.M., Blaauboer, B.J., Doorn, L., van Leeuwen, F.X.,
Theelen, R., and Rietjens, I.M. (1992). Interlaboratory comparison of microsomal ethoxyresorufin and
pentoxyresorufin O-dealkylation determinations: Standardization of assay conditions. Arch. Toxicol. 66, 237-244.
The Sadtler Standard Spectra (1984a). Standard Infrared Grating Spectra, Vol. 75, Spectrum 66767 K. Sadtler
Research Laboratories, Division of Bio-Rad Laboratories, Inc., Philadelphia, PA.
The Sadtler Standard Spectra (1984b). Standard N.M.R. Spectra, Vol. 70, Spectrum 39539 M. Sadtler Research
Laboratories, Division of Bio-Rad Laboratories, Inc., Philadelphia, PA.
Shirley, E. (1977). A non-parametric equivalent of Williams’ test for contrasting increasing dose levels of a treatment.
Biometrics 33, 386-389.
United States Environmental Protection Agency (USEPA) (2013a). Non-confidential 2006 IUR records by chemical,
including manufacturing, processing and use information for CAS No. 21850-44-2. <http://cfpub.epa.
gov/iursearch/2006_iur_companyinfo.cfm?chemid=432&outchem=both>
United States Environmental Protection Agency (USEPA) (2013b). Polyhalogenated dibenzodioxins/furans.
Appendix A: 12 chemicals in commerce requiring contaminant testing. <http://www.epa.gov/oppt/chemtest/pubs/
polyha2.pdf >
United States Environmental Protection Agency (USEPA) (2013c). Chemicals subject to TSCA 12(b) Export
Notification Requirements (Current as of December 11, 2012). <http://www.epa.gov/oppt/import-export/pubs/
12_b_listFinal-08-21-2012.pdf>

Tetrabromobisphenol A-bis(2,3-dibromopropyl ether), NTP TOX 85 43
United States Environmental Protection Agency (USEPA) (2014a). An alternatives assessment for the flame retardant
decabromodiphenyl ether (DecaBDE). <http://www.epa.gov/sites/production/files/2014-05/documents/decabde_
find.pdf>
United States Environmental Protection Agency (USEPA) (2014b). Flame retardant alternatives for
hexabromocyclododecane (HBCD). EPA Publication 740R14001. <http://www.epa.gov/sites/production/files/
2014-06/documents/hbed_report.pdf >
Williams, D.A. (1971). A test for differences between treatment means when several dose levels are compared with
a zero dose control. Biometrics 27, 103-117.
Williams, D.A. (1972). The comparison of several dose levels with a zero dose control. Biometrics 28, 519-531.
Williams, D.A. (1986). A note on Shirley’s nonparametric test for comparing several dose levels with a zero-dose
control. Biometrics 42, 183-186.
World Health Organization (WHO) (1995). Tetrabromobisphenol A and derivatives. Environmental Health Criteria
172. <http://www.inchem.org/documents/ehc/ehc/ehc172.htm>
Zeiger, E., Anderson, B., Haworth, S., Lawlor, T., and Mortelmans, K. (1992). Salmonella mutagenicity tests:
V. Results from the testing of 311 chemicals. Environ. Mol. Mutagen. 19 (Suppl. 21), 2-141.

44 Tetrabromobisphenol A-bis(2,3-dibromopropyl ether), NTP TOX 85
A-1
APPENDIX A SUMMARY OF NONNEOPLASTIC LESIONS
IN RATS AND MICE
TABLE A1 Summary of the Incidence of Nonneoplastic Lesions in Male Rats in the 3-Month Gavage Study of Tetrabromobisphenol A-bis(2,3-dibromopropyl ether) .............................................................. A-2 TABLE A2 Summary of the Incidence of Nonneoplastic Lesions in Female Rats in the 3-Month Gavage Study of Tetrabromobisphenol A-bis(2,3-dibromopropyl ether) .............................................................. A-5 TABLE A3 Summary of the Incidence of Nonneoplastic Lesions in Male Mice in the 3-Month Gavage Study of Tetrabromobisphenol A-bis(2,3-dibromopropyl ether) .............................................................. A-8 TABLE A4 Summary of the Incidence of Nonneoplastic Lesions in Female Mice in the 3-Month Gavage Study of Tetrabromobisphenol A-bis(2,3-dibromopropyl ether) ............................................................ A-10
A-2 Tetrabromobisphenol A-bis(2,3-dibromopropyl ether), NTP TOX 85
TABLE A1 Summary of the Incidence of Nonneoplastic Lesions in Male Rats in the 3-Month Gavage Study of Tetrabromobisphenol A-bis(2,3-dibromopropyl ether)a
Vehicle Control
62.5 mg/kg
125 mg/kg
250 mg/kg
500 mg/kg
1,000 mg/kg
Disposition Summary Animals initially in study 10 10 10 10 10 10 Early deathsb
Accidental death 1 Natural death 1
Survivors Terminal euthanasia 10 8 10 10 10 10 Animals examined microscopically 10 10 10 10 10 10 Alimentary System Esophagus (10) (2) (0) (0) (0) (10) Intestine large, cecum (10) (1) (0) (0) (0) (10) Intestine large, colon (10) (2) (0) (0) (0) (10) Serosa, parasite metazoan 1 (10%) Intestine large, rectum (10) (2) (0) (0) (0) (10) Parasite metazoan 2 (20%) Intestine small, duodenum (10) (1) (0) (0) (0) (10) Intestine small, ileum (10) (1) (0) (0) (0) (10) Intestine small, jejunum (10) (1) (0) (0) (0) (10) Liver (10) (10) (10) (10) (10) (10)
Inflammation, chronic 10 (100%) 10 (100%) 10 (100%) 10 (100%) 10 (100%) 10 (100%) Vacuolization cytoplasmic 10 (100%) 10 (100%) 10 (100%) 10 (100%) 10 (100%) 10 (100%)
Mesentery (0) (0) (0) (0) (0) (1) Fat, necrosis 1 (100%) Oral mucosa (0) (0) (0) (0) (1) (0) Cyst, focal 1 (100%) Pancreas (10) (2) (0) (0) (0) (10)
Infiltration cellular, mononuclear cell 1 (10%) Acinus, atrophy 2 (20%) 1 (10%) Arteriole, inflammation 1 (10%)
Salivary glands (10) (2) (0) (0) (0) (10) Stomach, forestomach (10) (2) (0) (0) (0) (10) Stomach, glandular (10) (2) (0) (0) (0) (10) Muscularis, mineralization 1 (10%)
Cardiovascular System Blood vessel (10) (2) (0) (0) (0) (10) Heart (10) (2) (0) (0) (0) (10)
Cardiomyopathy 10 (100%) 2 (100%) 10 (100%) Infiltration cellular, mixed cell 1 (10%) Pigmentation 1 (10%)
a Number of animals examined microscopically at the site and the number of animals with lesion b One 62.5 mg/kg rat died a natural death on test day 37 and another 62.5 mg/kg rat died from a dosing accident on day 40; these early death
animals were examined for histopathologic lesions.

Tetrabromobisphenol A-bis(2,3-dibromopropyl ether), NTP TOX 85 A-3
TABLE A1 Summary of the Incidence of Nonneoplastic Lesions in Male Rats in the 3-Month Gavage Study of Tetrabromobisphenol A-bis(2,3-dibromopropyl ether)
Vehicle Control
62.5 mg/kg
125 mg/kg
250 mg/kg
500 mg/kg
1,000 mg/kg
Endocrine System Adrenal cortex (10) (2) (0) (0) (0) (10) Adrenal medulla (10) (2) (0) (0) (0) (10) Islets, pancreatic (10) (2) (0) (0) (0) (10) Parathyroid gland (7) (2) (0) (0) (0) (10) Pituitary gland (10) (2) (0) (0) (0) (10) Thyroid gland (10) (2) (0) (0) (0) (10) General Body System None Genital System Epididymis (10) (2) (0) (0) (0) (10)
Inflammation, chronic active 5 (50%) Preputial gland (10) (2) (0) (0) (0) (10)
Inflammation 3 (30%) 3 (30%) Prostate (10) (2) (0) (0) (0) (10)
Inflammation, chronic active 1 (10%) Seminal vesicle (10) (2) (0) (0) (0) (10) Testes (10) (2) (0) (0) (0) (10) Hematopoietic System Bone marrow (10) (2) (0) (0) (0) (10) Lymph node, mandibular (10) (2) (0) (0) (0) (10) Lymph node, mesenteric (10) (9) (10) (10) (10) (10)
Infiltration cellular, histiocyte 10 (100%) 9 (100%) 10 (100%) 10 (100%) 10 (100%) 10 (100%) Spleen (10) (2) (0) (0) (0) (10) Thymus (10) (2) (0) (0) (0) (10) Integumentary System Mammary gland (10) (2) (0) (0) (0) (10) Skin (10) (2) (0) (0) (0) (10) Musculoskeletal System Bone (10) (2) (0) (0) (0) (10) Nervous System Brain (10) (2) (0) (0) (0) (10)

A-4 Tetrabromobisphenol A-bis(2,3-dibromopropyl ether), NTP TOX 85
TABLE A1 Summary of the Incidence of Nonneoplastic Lesions in Male Rats in the 3-Month Gavage Study of Tetrabromobisphenol A-bis(2,3-dibromopropyl ether)
Vehicle Control
62.5 mg/kg
125 mg/kg
250 mg/kg
500 mg/kg
1,000 mg/kg
Respiratory System Lung (10) (10) (10) (10) (10) (10)
Infiltration cellular, histiocyte 1 (10%) 1 (10%) 1 (10%) 1 (10%) Inflammation, granulomatous 4 (40%) 8 (80%) 8 (80%) 6 (60%) 2 (20%) Inflammation, acute 2 (20%) Inflammation, chronic active 7 (70%) 1 (10%) 9 (100%) 6 (60%) 8 (80%) 7 (70%) Metaplasia, osseous 1 (10%) 2 (20%)
Nose (10) (2) (0) (0) (0) (10) Inflammation, chronic active 1 (10%)
Trachea (10) (2) (0) (0) (0) (10) Infiltration cellular, mononuclear cell 1 (10%) 2 (20%) Special Senses System Eye (10) (3) (0) (0) (0) (10) Harderian gland (10) (2) (0) (0) (0) (10)
Infiltration cellular, mononuclear cell 2 (20%) Inflammation, chronic active 1 (10%) Bilateral, inflammation,
chronic active 1 (10%) Urinary System Kidney (10) (2) (0) (0) (0) (10)
Infiltration cellular, mononuclear cell 1 (10%) 2 (20%) Mineralization 8 (80%) 1 (50%) 6 (60%) Nephropathy 10 (100%) 1 (50%) 10 (100%)
Urinary bladder (10) (2) (0) (0) (0) (10) Inflammation, chronic 1 (10%) Muscularis, mineralization 1 (10%)

Tetrabromobisphenol A-bis(2,3-dibromopropyl ether), NTP TOX 85 A-5
TABLE A2 Summary of the Incidence of Nonneoplastic Lesions in Female Rats in the 3-Month Gavage Study of Tetrabromobisphenol A-bis(2,3-dibromopropyl ether)a
Vehicle Control
62.5 mg/kg
125 mg/kg
250 mg/kg
500 mg/kg
1,000 mg/kg
Disposition Summary Animals initially in study 10 10 10 10 10 10 Early deaths
Natural death 1 Survivors Terminal euthanasia 9 10 10 10 10 10 Animals examined microscopically 10 10 10 10 10 10 Alimentary System Esophagus (10) (0) (0) (0) (0) (10) Intestine large, cecum (10) (0) (0) (0) (0) (10) Intestine large, colon (10) (0) (0) (0) (0) (10) Intestine large, rectum (10) (0) (0) (0) (0) (10) Parasite metazoan 1 (10%) Intestine small, duodenum (10) (0) (0) (0) (0) (10) Intestine small, ileum (10) (0) (0) (0) (0) (10) Intestine small, jejunum (10) (0) (0) (0) (0) (10) Liver (10) (8) (8) (9) (10) (10)
Inflammation, chronic 8 (80%) 8 (100%) 8 (100%) 9 (100%) 10 (100%) 10 (100%) Pancreas (10) (0) (0) (0) (0) (10) Salivary glands (10) (0) (0) (0) (0) (10) Stomach, forestomach (10) (0) (0) (0) (0) (10) Stomach, glandular (10) (0) (0) (0) (0) (10) Cardiovascular System Blood vessel (10) (0) (0) (0) (0) (10) Heart (10) (0) (0) (0) (0) (10)
Cardiomyopathy 9 (90%) 9 (90%) Inflammation, chronic active 1 (10%)
Endocrine System Adrenal cortex (10) (0) (0) (0) (0) (10) Adrenal medulla (10) (0) (0) (0) (0) (10) Islets, pancreatic (10) (0) (0) (0) (0) (10) Parathyroid gland (10) (0) (0) (0) (0) (10) Pituitary gland (10) (0) (0) (0) (0) (10)
Cyst 1 (10%) Thyroid gland (10) (0) (0) (0) (0) (10) General Body System None Genital System Clitoral gland (10) (0) (0) (0) (0) (10)
Inflammation, chronic active 3 (30%) Ovary (10) (0) (1) (0) (0) (10) Left, cyst 1 (100%) Uterus (10) (0) (0) (0) (0) (10)
a Number of animals examined microscopically at the site and the number of animals with lesion

A-6 Tetrabromobisphenol A-bis(2,3-dibromopropyl ether), NTP TOX 85
TABLE A2 Summary of the Incidence of Nonneoplastic Lesions in Female Rats in the 3-Month Gavage Study of Tetrabromobisphenol A-bis(2,3-dibromopropyl ether)
Vehicle Control
62.5 mg/kg
125 mg/kg
250 mg/kg
500 mg/kg
1,000 mg/kg
Hematopoietic System Bone marrow (10) (0) (0) (0) (0) (10) Lymph node, mandibular (10) (0) (0) (0) (0) (10) Lymph node, mesenteric (10) (10) (10) (10) (10) (10)
Infiltration cellular, histiocyte 10 (100%) 10 (100%) 10 (100%) 10 (100%) 10 (100%) 10 (100%) Spleen (10) (0) (0) (0) (0) (10)
Lymphoid follicle, depletion cellular 1 (10%)
Thymus (10) (0) (0) (0) (0) (10) Integumentary System Mammary gland (10) (0) (0) (0) (0) (10) Skin (10) (0) (0) (0) (0) (10) Musculoskeletal System Bone (10) (0) (0) (0) (0) (10) Nervous System Brain (10) (0) (0) (0) (0) (10) Respiratory System Lung (10) (10) (10) (10) (10) (10)
Infiltration cellular, histiocyte 2 (20%) 1 (10%) 2 (20%) 2 (20%) Inflammation, granulomatous 3 (30%) 6 (60%) 6 (60%) 6 (60%) 5 (50%) Inflammation, acute 1 (10%) Inflammation, chronic active 1 (10%) 4 (40%) 3 (30%) 6 (60%) 6 (60%) 8 (80%) Metaplasia, osseous 1 (10%) Bronchiole, metaplasia, squamous 1 (10%)
Nose (10) (0) (0) (0) (0) (10) Squamous epithelium,
hyperplasia 1 (10%) Trachea (10) (0) (0) (0) (0) (10) Infiltration cellular, mononuclear cell 5 (50%) 4 (40%) Special Senses System Eye (10) (0) (0) (0) (0) (10) Harderian gland (10) (0) (0) (0) (0) (10)
Infiltration cellular, mononuclear cell 1 (10%)
Inflammation, chronic active 2 (20%) 3 (30%) Bilateral, infiltration cellular, mononuclear cell 1 (10%) Bilateral, inflammation,
chronic active 1 (10%)
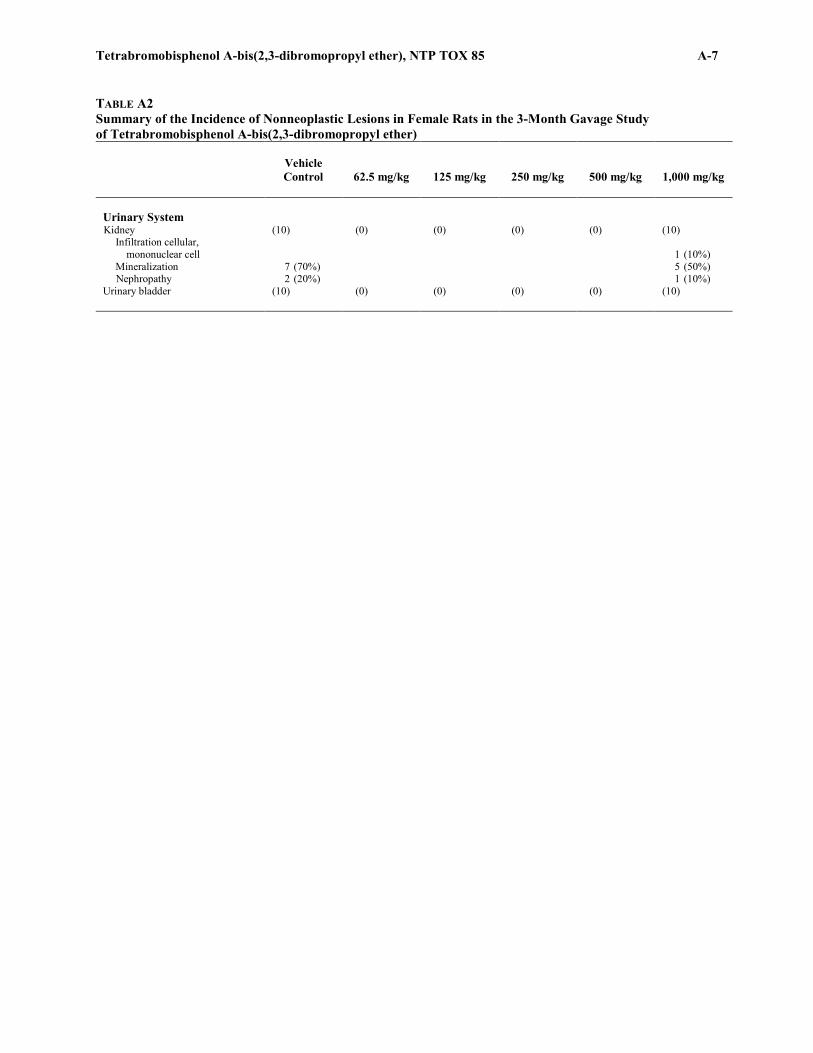
Tetrabromobisphenol A-bis(2,3-dibromopropyl ether), NTP TOX 85 A-7
TABLE A2 Summary of the Incidence of Nonneoplastic Lesions in Female Rats in the 3-Month Gavage Study of Tetrabromobisphenol A-bis(2,3-dibromopropyl ether)
Vehicle Control
62.5 mg/kg
125 mg/kg
250 mg/kg
500 mg/kg
1,000 mg/kg
Urinary System Kidney (10) (0) (0) (0) (0) (10)
Infiltration cellular, mononuclear cell 1 (10%) Mineralization 7 (70%) 5 (50%) Nephropathy 2 (20%) 1 (10%)
Urinary bladder (10) (0) (0) (0) (0) (10)

A-8 Tetrabromobisphenol A-bis(2,3-dibromopropyl ether), NTP TOX 85
TABLE A3 Summary of the Incidence of Nonneoplastic Lesions in Male Mice in the 3-Month Gavage Study of Tetrabromobisphenol A-bis(2,3-dibromopropyl ether)a
Vehicle Control
125 mg/kg
250 mg/kg
500 mg/kg
1,000 mg/kg
2,000 mg/kg
Disposition Summary Animals initially in study 10 10 10 10 10 10 Survivors Terminal euthanasia 10 10 10 10 10 10 Animals examined microscopically 10 0 0 0 0 10 Alimentary System Esophagus (10) (0) (0) (0) (0) (10)
Infiltration cellular, mononuclear cell 1 (10%)
Liver (10) (0) (0) (0) (0) (10) Infiltration cellular, mononuclear cell 3 (30%) 4 (40%)
Pancreas (10) (0) (0) (0) (0) (10) Inflammation, chronic active 1 (10%)
Cardiovascular System None Endocrine System None General Body System None Genital System Prostate (10) (0) (0) (0) (0) (10)
Infiltration cellular, mononuclear cell 4 (40%) 4 (40%) Epithelium, hyperplasia 1 (10%)
Hematopoietic System None Integumentary System None Musculoskeletal System None Nervous System None
a Number of animals examined microscopically at the site and the number of animals with lesion

Tetrabromobisphenol A-bis(2,3-dibromopropyl ether), NTP TOX 85 A-9
TABLE A3 Summary of the Incidence of Nonneoplastic Lesions in Male Mice in the 3-Month Gavage Study of Tetrabromobisphenol A-bis(2,3-dibromopropyl ether)
Vehicle Control
125 mg/kg
250 mg/kg
500 mg/kg
1,000 mg/kg
2,000 mg/kg
Respiratory System Lung (10) (0) (0) (0) (0) (10)
Alveolus, infiltration cellular, mononuclear cell 1 (10%)
Special Senses System None Urinary System Kidney (10) (0) (0) (0) (0) (10)
Infiltration cellular, mononuclear cell 3 (30%) 3 (30%) Nephropathy 1 (10%)

A-10 Tetrabromobisphenol A-bis(2,3-dibromopropyl ether), NTP TOX 85
TABLE A4 Summary of the Incidence of Nonneoplastic Lesions in Female Mice in the 3-Month Gavage Study of Tetrabromobisphenol A-bis(2,3-dibromopropyl ether)a
Vehicle Control
125 mg/kg
250 mg/kg
500 mg/kg
1,000 mg/kg
2,000 mg/kg
Disposition Summary Animals initially in study 10 10 10 10 10 10 Survivors Terminal euthanasia 10 10 10 10 10 10 Animals examined microscopically 10 0 0 0 0 10 Alimentary System Liver (10) (0) (0) (0) (0) (10)
Infiltration cellular, mononuclear cell 9 (90%) 10 (100%)
Cardiovascular System None Endocrine System None General Body System None Genital System None Hematopoietic System None Integumentary System None Musculoskeletal System None Nervous System None Respiratory System Lung (10) (0) (0) (0) (0) (10)
Inflammation, chronic 1 (10%)
a Number of animals examined microscopically at the site and the number of animals with lesion

Tetrabromobisphenol A-bis(2,3-dibromopropyl ether), NTP TOX 85 A-11
TABLE A4 Summary of the Incidence of Nonneoplastic Lesions in Female Mice in the 3-Month Gavage Study of Tetrabromobisphenol A-bis(2,3-dibromopropyl ether)
Vehicle Control
125 mg/kg
250 mg/kg
500 mg/kg
1,000 mg/kg
2,000 mg/kg
Special Senses System None Urinary System Kidney (10) (0) (0) (0) (0) (10)
Casts protein 1 (10%) Infiltration cellular, mononuclear cell 4 (40%) 7 (70%) Mineralization 1 (10%) Nephropathy 1 (10%)

A-12 Tetrabromobisphenol A-bis(2,3-dibromopropyl ether), NTP TOX 85

B-1
APPENDIX B CLINICAL PATHOLOGY RESULTS
TABLE B1 Hematology and Clinical Chemistry Data for Rats in the 3-Month Gavage Study of Tetrabromobisphenol A-bis(2,3-dibromopropyl ether) .............................................................. B-2 TABLE B2 Hematology Data for Mice in the 3-Month Gavage Study of Tetrabromobisphenol A-bis(2,3-dibromopropyl ether) .............................................................. B-7

B-2 Tetrabromobisphenol A-bis(2,3-dibromopropyl ether), NTP TOX 85
TABLE B1 Hematology and Clinical Chemistry Data for Rats in the 3-Month Gavage Study of Tetrabromobisphenol A-bis(2,3-dibromopropyl ether)a
Vehicle Control 62.5 mg/kg 125 mg/kg 250 mg/kg 500 mg/kg 1,000 mg/kg
Male Hematology n
Day 23 10 9 10 10 10 8 Week 14 8 7 8 10 10 9
Hematocrit (%)
Day 23 50.1 ± 0.6 50.5 ± 0.9 50.9 ± 1.0 50.3 ± 0.7 51.1 ± 1.6 50.4 ± 1.6 Week 14 49.0 ± 0.6 47.8 ± 0.4 47.7 ± 0.5 48.1 ± 1.0 47.5 ± 0.5 47.1 ± 0.4
Hemoglobin (g/dL) Day 23 15.4 ± 0.2 15.4 ± 0.3 15.6 ± 0.2 15.4 ± 0.2 15.5 ± 0.4 15.3 ± 0.4 Week 14 15.4 ± 0.2 15.1 ± 0.1 14.9 ± 0.1 15.1 ± 0.3 15.0 ± 0.1 14.8 ± 0.1
Erythrocytes (106/μL) Day 23 8.38 ± 0.08 8.50 ± 0.14 8.62 ± 0.12 8.56 ± 0.12 8.64 ± 0.26 8.58 ± 0.25 Week 14 9.56 ± 0.09 9.37 ± 0.04 9.39 ± 0.09 9.46 ± 0.13 9.41 ± 0.08 9.28 ± 0.09
Reticulocytes (103/μL) Day 23 370 ± 17 379 ± 13 408 ± 16 382 ± 8 408 ± 10 415 ± 14 Week 14 173 ± 19 193 ± 12 186 ± 10 192 ± 8 172 ± 10 197 ± 3
Mean cell volume (fL) Day 23 59.8 ± 0.3 59.4 ± 0.4 59.0 ± 0.4 58.8 ± 0.3 59.1 ± 0.2 58.7 ± 0.4 Week 14 51.3 ± 0.2 51.0 ± 0.4 50.8 ± 0.3 50.8 ± 0.4 50.6 ± 0.3 50.8 ± 0.4
Mean cell hemoglobin (pg) Day 23 18.4 ± 0.1 18.2 ± 0.1 18.1 ± 0.1* 18.0 ± 0.1** 18.0 ± 0.1** 17.8 ± 0.1** Week 14 16.1 ± 0.1 16.2 ± 0.2 15.8 ± 0.1 15.9 ± 0.1 16.0 ± 0.1 16.0 ± 0.1
Mean cell hemoglobin concentration (g/dL) Day 23 30.8 ± 0.2 30.6 ± 0.2 30.6 ± 0.2 30.6 ± 0.1 30.4 ± 0.1 30.3 ± 0.2 Week 14 31.4 ± 0.2 31.7 ± 0.2 31.2 ± 0.1 31.4 ± 0.2 31.6 ± 0.2 31.4 ± 0.1
Platelets (103/μL) Day 23 914 ± 26 937 ± 41 987 ± 32 960 ± 19 893 ± 67 1,004 ± 27 Week 14 754 ± 21 815 ± 15 838 ± 19* 783 ± 20 781 ± 36 834 ± 9*
Leukocytes (103/μL) Day 23 7.82 ± 0.24 8.66 ± 0.38 8.42 ± 0.54 8.14 ± 0.19 8.87 ± 0.31 8.64 ± 0.66 Week 14 7.06 ± 0.51 7.15 ± 0.53 6.92 ± 0.34 7.24 ± 0.36 6.77 ± 0.54 6.95 ± 0.44
Segmented neutrophils (103/μL) Day 23 1.48 ± 0.12 1.98 ± 0.20 1.56 ± 0.11 1.52 ± 0.12 2.13 ± 0.10** 1.95 ± 0.15 Week 14 1.33 ± 0.11 1.49 ± 0.16 1.68 ± 0.14 1.52 ± 0.13 1.50 ± 0.13 1.36 ± 0.12
Lymphocytes (103/μL) Day 23 6.01 ± 0.17 6.31 ± 0.28 6.55 ± 0.44 6.32 ± 0.22 6.25 ± 0.30 6.31 ± 0.50 Week 14 5.45 ± 0.52 5.39 ± 0.43 4.98 ± 0.30 5.43 ± 0.27 4.99 ± 0.44 5.35 ± 0.38
Monocytes (103/μL) Day 23 0.20 ± 0.01 0.23 ± 0.02 0.22 ± 0.02 0.21 ± 0.02 0.24 ± 0.02 0.25 ± 0.03 Week 14 0.15 ± 0.02 0.15 ± 0.02 0.15 ± 0.02 0.15 ± 0.01 0.15 ± 0.02 0.14 ± 0.02
Basophils (103/μL) Day 23 0.080 ± 0.015 0.073 ± 0.011 0.059 ± 0.011 0.044 ± 0.007 0.106 ± 0.020 0.090 ± 0.029 Week 14 0.025 ± 0.004 0.026 ± 0.004 0.030 ± 0.005 0.025 ± 0.003 0.027 ± 0.006 0.024 ± 0.003
Eosinophils (103/μL) Day 23 0.05 ± 0.02 0.07 ± 0.02 0.04 ± 0.01 0.05 ± 0.01 0.14 ± 0.03* 0.05 ± 0.01 Week 14 0.11 ± 0.01 0.10 ± 0.01 0.08 ± 0.01 0.12 ± 0.02 0.11 ± 0.01 0.08 ± 0.01

Tetrabromobisphenol A-bis(2,3-dibromopropyl ether), NTP TOX 85 B-3
TABLE B1 Hematology and Clinical Chemistry Data for Rats in the 3-Month Gavage Study of Tetrabromobisphenol A-bis(2,3-dibromopropyl ether)
Vehicle Control 62.5 mg/kg 125 mg/kg 250 mg/kg 500 mg/kg 1,000 mg/kg
Male (continued) Clinical Chemistry n
Day 4 10 10 10 10 10 10 Day 23 10 10 10 10 9 9 Week 14 10 8 10 10 10 10
Urea nitrogen (mg/dL)
Day 4 10.1 ± 0.6b 10.5 ± 0.7 10.1 ± 0.5b 10.4 ± 0.6b 10.9 ± 0.6b 11.0 ± 0.6 Day 23 10.9 ± 0.3 11.3 ± 0.5 9.6 ± 0.5 11.6 ± 0.5 11.6 ± 0.4 10.9 ± 0.8 Week 14 15.1 ± 0.8 15.6 ± 1.0 12.9 ± 0.5 11.5 ± 0.5** 16.1 ± 0.6 14.4 ± 0.7
Creatinine (mg/dL) Day 4 0.50 ± 0.00b 0.50 ± 0.00 0.47 ± 0.02b 0.49 ± 0.01b 0.49 ± 0.01b 0.45 ± 0.02** Day 23 0.60 ± 0.02 0.55 ± 0.02 0.56 ± 0.02 0.57 ± 0.03 0.56 ± 0.02 0.54 ± 0.02 Week 14 0.80 ± 0.01 0.78 ± 0.02 0.75 ± 0.02 0.74 ± 0.02 0.77 ± 0.02 0.74 ± 0.02
Glucose (mg/dL) Day 4 123 ± 2b 122 ± 2 119 ± 3b 123 ± 4b 121 ± 2b 123 ± 3 Day 23 165 ± 5 157 ± 6 162 ± 7 155 ± 7 153 ± 4 159 ± 4 Week 14 263 ± 8 244 ± 10 255 ± 11 268 ± 13 257 ± 7 249 ± 10
Total protein (g/dL) Day 4 5.9 ± 0.1b 5.9 ± 0.1 5.9 ± 0.1b 5.9 ± 0.1b 5.8 ± 0.1b 5.9 ± 0.1 Day 23 6.3 ± 0.1 6.5 ± 0.1 6.3 ± 0.1 6.5 ± 0.1 6.4 ± 0.1 6.4 ± 0.1 Week 14 7.2 ± 0.1 7.1 ± 0.1 7.0 ± 0.1 6.9 ± 0.1 7.1 ± 0.1 7.0 ± 0.1
Albumin (g/dL) Day 4 4.3 ± 0.0b 4.2 ± 0.1 4.3 ± 0.1b 4.3 ± 0.1b 4.2 ± 0.0b 4.3 ± 0.0 Day 23 4.2 ± 0.0 4.4 ± 0.0* 4.3 ± 0.1 4.4 ± 0.1* 4.4 ± 0.1* 4.4 ± 0.1 Week 14 4.6 ± 0.1 4.6 ± 0.1 4.4 ± 0.0 4.4 ± 0.1 4.5 ± 0.1 4.5 ± 0.1
Cholesterol (mg/dL) Day 4 98 ± 3 89 ± 2 94 ± 3 89 ± 2* 87 ± 3** 85 ± 3** Day 23 88 ± 2 80 ± 2 79 ± 2 81 ± 2 77 ± 2* 81 ± 2 Week 14 76 ± 3 75 ± 3 69 ± 2 64 ± 2** 70 ± 2 67 ± 4
Alanine aminotransferase (IU/L) Day 4 73 ± 2 71 ± 2 69 ± 2 73 ± 3 71 ± 2 71 ± 2 Day 23 56 ± 2 64 ± 1* 60 ± 1 63 ± 2 62 ± 2 63 ± 2 Week 14 116 ± 23 83 ± 8 76 ± 10 84 ± 13 96 ± 6 75 ± 6
Alkaline phosphatase (IU/L) Day 4 665 ± 12 640 ± 14 639 ± 16 620 ± 9 629 ± 13 611 ± 17 Day 23 524 ± 10 528 ± 12 544 ± 14 521 ± 15 517 ± 13 511 ± 16 Week 14 275 ± 8 263 ± 6 257 ± 8 258 ± 10 294 ± 7 265 ± 8
Creatine kinase (IU/L) Day 4 441 ± 35b 646 ± 186 364 ± 34b 545 ± 48b 623 ± 77b 469 ± 40 Day 23 615 ± 89 559 ± 55 458 ± 75 467 ± 64 491 ± 48 725 ± 125 Week 14 360 ± 130 142 ± 17 224 ± 52 248 ± 50 112 ± 4** 140 ± 9
Sorbitol dehydrogenase (IU/L) Day 4 15 ± 1 14 ± 1 15 ± 1 13 ± 1 13 ± 1 14 ± 1 Day 23 18 ± 1 19 ± 2 15 ± 1* 16 ± 1 15 ± 1 16 ± 1 Week 14 44 ± 13 29 ± 3 31 ± 8 46 ± 15 28 ± 1 25 ± 2*
Bile acids (µmol/L) Day 4 16.9 ± 2.6 12.9 ± 1.4 17.0 ± 3.6 13.6 ± 2.5 9.6 ± 1.6 14.7 ± 1.4 Day 23 9.6 ± 1.0 13.8 ± 1.9 14.1 ± 1.1 11.5 ± 1.6 9.3 ± 1.3 10.2 ± 1.4 Week 14 19.7 ± 2.3 17.6 ± 3.1 17.7 ± 2.6 20.4 ± 2.5 16.0 ± 1.8 15.6 ± 1.7
Total thyroxine (µg/dL) Day 4 7.05 ± 0.26 6.61 ± 0.24 6.58 ± 0.29 6.31 ± 0.29 6.50 ± 0.30 6.05 ± 0.22
Day 23 6.45 ± 0.19 6.88 ± 0.18 6.65 ± 0.27 6.83 ± 0.23 7.14 ± 0.34c 6.51 ± 0.14 Week 14 3.16 ± 0.25 3.53 ± 0.29 2.88 ± 0.20 3.24 ± 0.28 3.17 ± 0.20 2.98 ± 0.16

B-4 Tetrabromobisphenol A-bis(2,3-dibromopropyl ether), NTP TOX 85
TABLE B1 Hematology and Clinical Chemistry Data for Rats in the 3-Month Gavage Study of Tetrabromobisphenol A-bis(2,3-dibromopropyl ether)
Vehicle Control 62.5 mg/kg 125 mg/kg 250 mg/kg 500 mg/kg 1,000 mg/kg
Male (continued) Clinical Chemistry (continued) n
Day 4 10 10 10 10 10 10 Day 23 10 10 10 10 9 9 Week 14 10 8 10 10 10 10
Total triiodothyronine (ng/dL) Day 23 158.3 ± 4.3 164.2 ± 8.9 155.1 ± 7.7 175.9 ± 6.8 170.6 ± 8.5c 162.6 ± 9.2 Week 14 109.0 ± 9.2b 106.1 ± 5.8 99.9 ± 6.2b 109.5 ± 5.6 91.2 ± 7.9 97.9 ± 9.2
Thyroid stimulating hormone (ng/mL) Day 4 6.36 ± 0.28d 6.47 ± 0.81 6.44 ± 0.17 6.16 ± 0.41 5.79 ± 0.27 6.56 ± 0.61 Day 23 10.00 ± 0.68 10.05 ± 0.60 11.23 ± 1.51 11.32 ± 0.94b 9.38 ± 0.30 9.62 ± 0.36 Week 14 9.91 ± 0.53 9.96 ± 0.54 10.94 ± 0.80 11.28 ± 1.31 8.84 ± 0.76b 10.85 ± 0.79
Female Hematology n
Day 23 10 7 8 7 9 9 Week 14 9 10 10 10 10 10
Hematocrit (%)
Day 23 49.0 ± 0.7 49.9 ± 2.2 49.3 ± 1.4 49.2 ± 0.9 48.8 ± 0.4 47.5 ± 0.5 Week 14 45.9 ± 0.4 45.9 ± 0.3 45.6 ± 0.4 46.6 ± 0.6 45.3 ± 0.3 44.7 ± 0.4
Hemoglobin (g/dL) Day 23 15.6 ± 0.2 15.8 ± 0.6 15.6 ± 0.4 15.7 ± 0.3 15.5 ± 0.1 15.1 ± 0.1 Week 14 15.0 ± 0.1 15.1 ± 0.1 14.7 ± 0.1 15.0 ± 0.2 14.6 ± 0.1* 14.5 ± 0.1**
Erythrocytes (106/μL) Day 23 8.50 ± 0.14 8.65 ± 0.34 8.53 ± 0.19 8.58 ± 0.15 8.56 ± 0.05 8.36 ± 0.08 Week 14 8.57 ± 0.07 8.47 ± 0.05 8.54 ± 0.08 8.72 ± 0.10 8.55 ± 0.05 8.38 ± 0.09
Reticulocytes (103/μL) Day 23 194 ± 5 214 ± 16 208 ± 10 183 ± 3 209 ± 7 214 ± 10 Week 14 193 ± 7 194 ± 8 206 ± 9 184 ± 9 194 ± 7 209 ± 9
Mean cell volume (fL) Day 23 57.6 ± 0.2 57.6 ± 0.3 57.8 ± 0.4 57.4 ± 0.2 57.0 ± 0.3 56.8 ± 0.3 Week 14 53.6 ± 0.3 54.2 ± 0.2 53.3 ± 0.4 53.5 ± 0.3 53.0 ± 0.2 53.3 ± 0.3
Mean cell hemoglobin (pg) Day 23 18.4 ± 0.1 18.3 ± 0.1 18.3 ± 0.1 18.3 ± 0.1 18.1 ± 0.1 18.1 ± 0.1 Week 14 17.5 ± 0.1 17.8 ± 0.1 17.2 ± 0.1 17.3 ± 0.1 17.1 ± 0.1 17.3 ± 0.1
Mean cell hemoglobin concentration (g/dL) Day 23 31.9 ± 0.1 31.8 ± 0.2 31.6 ± 0.2 31.9 ± 0.2 31.7 ± 0.2 31.9 ± 0.2 Week 14 32.7 ± 0.2 32.9 ± 0.2 32.3 ± 0.1 32.3 ± 0.2 32.3 ± 0.1 32.5 ± 0.1
Platelets (103/μL) Day 23 846 ± 37 873 ± 41 949 ± 30 880 ± 21 795 ± 80 941 ± 65 Week 14 787 ± 28 827 ± 43 916 ± 37* 817 ± 57 883 ± 32 918 ± 47
Leukocytes (103/μL) Day 23 9.57 ± 0.41 9.94 ± 0.45 8.72 ± 0.53 9.52 ± 0.74 9.08 ± 0.48 9.63 ± 0.62 Week 14 8.33 ± 0.80 7.21 ± 0.26 7.57 ± 0.67 8.50 ± 0.56 7.86 ± 0.41 8.19 ± 0.37
Segmented neutrophils (103/μL) Day 23 1.65 ± 0.15 1.99 ± 0.15 1.72 ± 0.17 2.04 ± 0.22 2.09 ± 0.18 2.06 ± 0.18 Week 14 1.55 ± 0.12 1.37 ± 0.11 1.52 ± 0.14 1.59 ± 0.11 1.74 ± 0.11 1.77 ± 0.11

Tetrabromobisphenol A-bis(2,3-dibromopropyl ether), NTP TOX 85 B-5
TABLE B1 Hematology and Clinical Chemistry Data for Rats in the 3-Month Gavage Study of Tetrabromobisphenol A-bis(2,3-dibromopropyl ether)
Vehicle Control 62.5 mg/kg 125 mg/kg 250 mg/kg 500 mg/kg 1,000 mg/kg
Female (continued) Hematology (continued) n
Day 23 10 7 8 7 9 9 Week 14 9 10 10 10 10 10
Lymphocytes (103/μL)
Day 23 7.49 ± 0.32 7.47 ± 0.43 6.54 ± 0.39 6.99 ± 0.45 6.55 ± 0.41 7.15 ± 0.46 Week 14 6.32 ± 0.59 5.52 ± 0.23 5.75 ± 0.53 6.53 ± 0.49 5.78 ± 0.34 6.07 ± 0.30
Monocytes (103/μL) Day 23 0.25 ± 0.02 0.26 ± 0.03 0.23 ± 0.02 0.27 ± 0.04 0.25 ± 0.03 0.27 ± 0.02 Week 14 0.32 ± 0.13 0.18 ± 0.01 0.18 ± 0.02 0.22 ± 0.03 0.21 ± 0.02 0.22 ± 0.01
Basophils (103/μL) Day 23 0.102 ± 0.009 0.094 ± 0.023 0.106 ± 0.029 0.086 ± 0.014 0.084 ± 0.009 0.083 ± 0.010 Week 14 0.049 ± 0.009 0.050 ± 0.006 0.038 ± 0.006 0.066 ± 0.012 0.044 ± 0.004 0.052 ± 0.010
Eosinophils (103/μL) Day 23 0.09 ± 0.02 0.13 ± 0.03 0.12 ± 0.04 0.14 ± 0.05 0.11 ± 0.02 0.07 ± 0.01 Week 14 0.10 ± 0.01 0.09 ± 0.02 0.08 ± 0.01 0.09 ± 0.02 0.09 ± 0.02 0.07 ± 0.01
Clinical Chemistry n
Day 4 10 10 10 10 10 9 Day 23 10 10 10 9 10 10 Week 14 8 9 10 10 10 10
Urea nitrogen (mg/dL) Day 4 10.6 ± 0.6b 11.2 ± 0.9 11.6 ± 0.7b 10.4 ± 0.5 9.7 ± 0.6b 9.4 ± 0.6 Day 23 11.5 ± 0.5 12.0 ± 0.4b 12.1 ± 0.5 11.8 ± 0.9 12.0 ± 0.7 10.6 ± 0.5 Week 14 13.4 ± 0.5 14.9 ± 0.4 14.5 ± 0.5 13.1 ± 0.3 13.3 ± 0.5 14.3 ± 0.5
Creatinine (mg/dL) Day 4 0.47 ± 0.02b 0.46 ± 0.02 0.46 ± 0.02b 0.43 ± 0.02 0.42 ± 0.01b 0.41 ± 0.01* Day 23 0.58 ± 0.01 0.58 ± 0.02b 0.59 ± 0.01 0.59 ± 0.01 0.55 ± 0.02 0.57 ± 0.02 Week 14 0.70 ± 0.02 0.73 ± 0.03 0.70 ± 0.01 0.69 ± 0.02 0.69 ± 0.02 0.71 ± 0.02
Glucose (mg/dL) Day 4 121 ± 3b 122 ± 3 121 ± 4b 113 ± 2 119 ± 3b 111 ± 3* Day 23 137 ± 5 139 ± 5b 151 ± 7 146 ± 9 149 ± 4 131 ± 4 Week 14 215 ± 12 233 ± 14 218 ± 5 218 ± 7 212 ± 7 208 ± 8
Total protein (g/dL) Day 4 5.9 ± 0.1b 5.9 ± 0.1 6.1 ± 0.1b 5.9 ± 0.1 5.8 ± 0.1b 5.8 ± 0.1 Day 23 6.2 ± 0.1 6.3 ± 0.1b 6.4 ± 0.1 6.4 ± 0.1 6.3 ± 0.1 6.3 ± 0.1 Week 14 6.7 ± 0.2 6.7 ± 0.1 6.5 ± 0.1 6.5 ± 0.1 6.4 ± 0.1 6.5 ± 0.1
Albumin (g/dL) Day 4 4.3 ± 0.1b 4.3 ± 0.1 4.4 ± 0.1b 4.3 ± 0.0 4.2 ± 0.1b 4.3 ± 0.1 Day 23 4.5 ± 0.0 4.5 ± 0.1b 4.6 ± 0.1 4.5 ± 0.1 4.5 ± 0.1 4.5 ± 0.0 Week 14 4.6 ± 0.1 4.6 ± 0.1 4.5 ± 0.1 4.5 ± 0.1 4.5 ± 0.1 4.5 ± 0.1
Cholesterol (mg/dL) Day 4 98 ± 3 93 ± 2 93 ± 2 92 ± 3 84 ± 2** 89 ± 2**c Day 23 87 ± 2 82 ± 2 83 ± 3 81 ± 2* 74 ± 1** 77 ± 2** Week 14 74 ± 3 72 ± 2 67 ± 2 68 ± 2 64 ± 1** 69 ± 2
Alanine aminotransferase (IU/L) Day 4 63 ± 2 66 ± 2 67 ± 2 65 ± 3 60 ± 3 67 ± 12 Day 23 43 ± 2 47 ± 2 52 ± 2** 53 ± 2** 49 ± 1** 51 ± 2** Week 14 71 ± 16 87 ± 12* 69 ± 5 72 ± 5 69 ± 8 70 ± 3

B-6 Tetrabromobisphenol A-bis(2,3-dibromopropyl ether), NTP TOX 85
TABLE B1 Hematology and Clinical Chemistry Data for Rats in the 3-Month Gavage Study of Tetrabromobisphenol A-bis(2,3-dibromopropyl ether)
Vehicle Control 62.5 mg/kg 125 mg/kg 250 mg/kg 500 mg/kg 1,000 mg/kg
Female (continued) Clinical Chemistry (continued) n
Day 4 10 10 10 10 10 9 Day 23 10 10 10 9 10 10 Week 14 8 9 10 10 10 10
Alkaline phosphatase (IU/L)
Day 4 565 ± 16 552 ± 8 578 ± 12 550 ± 21 526 ± 15 509 ± 27 Day 23 382 ± 11 383 ± 8 425 ± 8** 413 ± 9 388 ± 8 390 ± 9 Week 14 286 ± 9 279 ± 10 267 ± 12 270 ± 5 271 ± 8 246 ± 5**
Creatine kinase (IU/L) Day 4 559 ± 37d 656 ± 88 545 ± 59b 661 ± 71 651 ± 77b 546 ± 62 Day 23 407 ± 56 583 ± 74b 617 ± 107 517 ± 78 516 ± 63 638 ± 79 Week 14 178 ± 43 318 ± 81 228 ± 76 180 ± 58 196 ± 45 174 ± 56
Sorbitol dehydrogenase (IU/L) Day 4 9 ± 1 9 ± 1 9 ± 1 9 ± 1 9 ± 1 11 ± 2 Day 23 14 ± 1 13 ± 0 16 ± 1 14 ± 1 14 ± 1 13 ± 1 Week 14 40 ± 19 37 ± 11 25 ± 1 28 ± 1 26 ± 3 26 ± 2
Bile acids (µmol/L) Day 4 9.6 ± 1.7 14.9 ± 3.2 11.2 ± 1.1 12.1 ± 2.3 9.2 ± 0.9 10.6 ± 2.4 Day 23 12.1 ± 1.5 8.9 ± 1.2 12.7 ± 3.4 14.7 ± 1.1 12.0 ± 2.8 13.1 ± 1.8 Week 14 25.5 ± 3.4 29.0 ± 4.7 29.5 ± 4.4 21.4 ± 3.5 25.5 ± 3.3 26.6 ± 4.6
Total thyroxine (µg/dL) Day 4 5.52 ± 0.18 5.36 ± 0.26 4.78 ± 0.34 4.87 ± 0.37 5.13 ± 0.31 4.51 ± 0.35c
Day 23 5.03 ± 0.26 5.44 ± 0.21 5.18 ± 0.31 5.21 ± 0.24c 5.68 ± 0.23 5.94 ± 0.26 Week 14 3.42 ± 0.42b 3.28 ± 0.23c 3.84 ± 0.22 4.15 ± 0.22 3.56 ± 0.21 3.48 ± 0.22
Total triiodothyronine (ng/dL) Day 23 147.4 ± 7.3 153.9 ± 8.5 152.2 ± 6.5 158.6 ± 8.6c 136.7 ± 5.1 147.6 ± 5.7 Week 14 128.4 ± 4.9 107.8 ± 7.1 128.8 ± 6.2b 139.6 ± 7.4 115.3 ± 7.7 123.2 ± 9.2
Thyroid stimulating hormone (ng/mL) Day 4 7.09 ± 0.25 6.77 ± 0.17 6.68 ± 0.20 6.64 ± 0.12 6.60 ± 0.34 6.91 ± 0.64c Day 23 7.79 ± 0.41 7.59 ± 0.31 8.13 ± 0.27b 7.76 ± 0.26c 7.93 ± 0.24 7.55 ± 0.20 Week 14 9.46 ± 0.66 7.73 ± 0.43 8.64 ± 0.35 7.41 ± 0.28* 7.95 ± 0.54 7.49 ± 0.21*
* Significantly different (P≤0.05) from the vehicle control group by Dunn’s or Shirley’s test ** P≤0.01 a Data are presented as mean ± standard error. Statistical tests were performed on unrounded data. b n=9 c n=10 d n=8
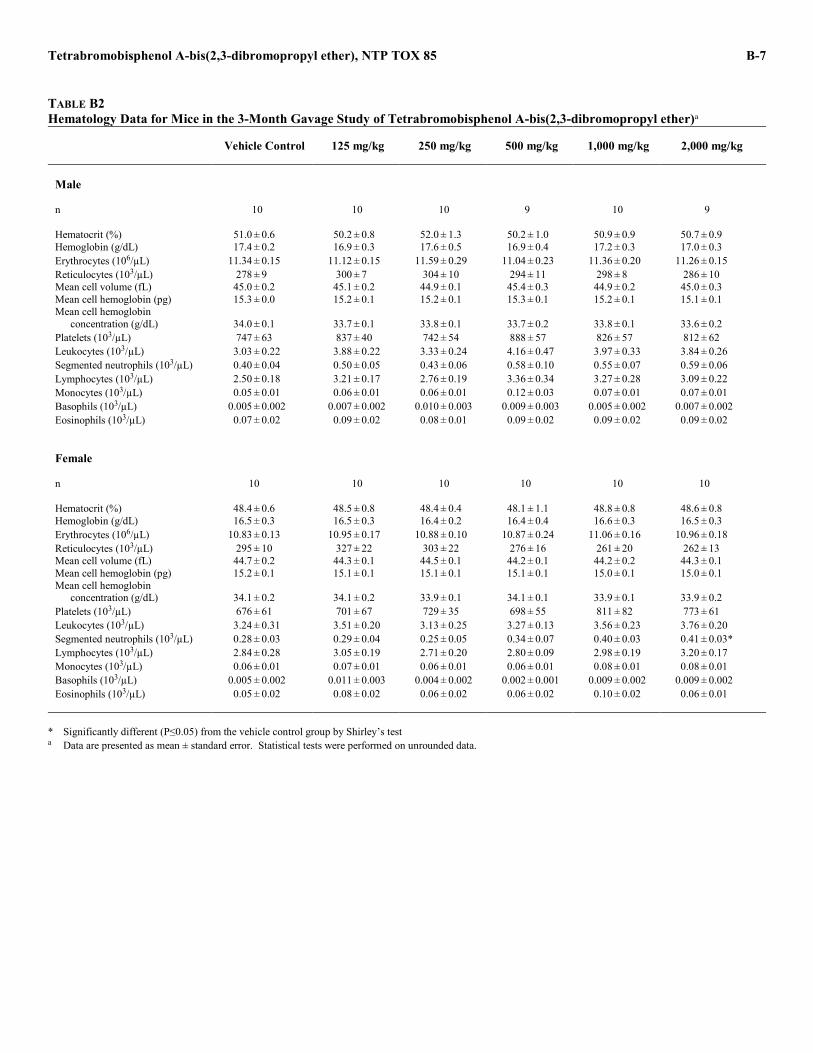
Tetrabromobisphenol A-bis(2,3-dibromopropyl ether), NTP TOX 85 B-7
TABLE B2 Hematology Data for Mice in the 3-Month Gavage Study of Tetrabromobisphenol A-bis(2,3-dibromopropyl ether)a
Vehicle Control 125 mg/kg 250 mg/kg 500 mg/kg 1,000 mg/kg 2,000 mg/kg
Male n 10 10 10 9 10 9 Hematocrit (%) 51.0 ± 0.6 50.2 ± 0.8 52.0 ± 1.3 50.2 ± 1.0 50.9 ± 0.9 50.7 ± 0.9 Hemoglobin (g/dL) 17.4 ± 0.2 16.9 ± 0.3 17.6 ± 0.5 16.9 ± 0.4 17.2 ± 0.3 17.0 ± 0.3 Erythrocytes (106/µL) 11.34 ± 0.15 11.12 ± 0.15 11.59 ± 0.29 11.04 ± 0.23 11.36 ± 0.20 11.26 ± 0.15 Reticulocytes (103/µL) 278 ± 9 300 ± 7 304 ± 10 294 ± 11 298 ± 8 286 ± 10 Mean cell volume (fL) 45.0 ± 0.2 45.1 ± 0.2 44.9 ± 0.1 45.4 ± 0.3 44.9 ± 0.2 45.0 ± 0.3 Mean cell hemoglobin (pg) 15.3 ± 0.0 15.2 ± 0.1 15.2 ± 0.1 15.3 ± 0.1 15.2 ± 0.1 15.1 ± 0.1 Mean cell hemoglobin
concentration (g/dL) 34.0 ± 0.1 33.7 ± 0.1 33.8 ± 0.1 33.7 ± 0.2 33.8 ± 0.1 33.6 ± 0.2 Platelets (103/µL) 747 ± 63 837 ± 40 742 ± 54 888 ± 57 826 ± 57 812 ± 62 Leukocytes (103/µL) 3.03 ± 0.22 3.88 ± 0.22 3.33 ± 0.24 4.16 ± 0.47 3.97 ± 0.33 3.84 ± 0.26 Segmented neutrophils (103/µL) 0.40 ± 0.04 0.50 ± 0.05 0.43 ± 0.06 0.58 ± 0.10 0.55 ± 0.07 0.59 ± 0.06 Lymphocytes (103/µL) 2.50 ± 0.18 3.21 ± 0.17 2.76 ± 0.19 3.36 ± 0.34 3.27 ± 0.28 3.09 ± 0.22 Monocytes (103/µL) 0.05 ± 0.01 0.06 ± 0.01 0.06 ± 0.01 0.12 ± 0.03 0.07 ± 0.01 0.07 ± 0.01 Basophils (103/µL) 0.005 ± 0.002 0.007 ± 0.002 0.010 ± 0.003 0.009 ± 0.003 0.005 ± 0.002 0.007 ± 0.002 Eosinophils (103/µL) 0.07 ± 0.02 0.09 ± 0.02 0.08 ± 0.01 0.09 ± 0.02 0.09 ± 0.02 0.09 ± 0.02 Female n 10 10 10 10 10 10 Hematocrit (%) 48.4 ± 0.6 48.5 ± 0.8 48.4 ± 0.4 48.1 ± 1.1 48.8 ± 0.8 48.6 ± 0.8 Hemoglobin (g/dL) 16.5 ± 0.3 16.5 ± 0.3 16.4 ± 0.2 16.4 ± 0.4 16.6 ± 0.3 16.5 ± 0.3 Erythrocytes (106/µL) 10.83 ± 0.13 10.95 ± 0.17 10.88 ± 0.10 10.87 ± 0.24 11.06 ± 0.16 10.96 ± 0.18 Reticulocytes (103/µL) 295 ± 10 327 ± 22 303 ± 22 276 ± 16 261 ± 20 262 ± 13 Mean cell volume (fL) 44.7 ± 0.2 44.3 ± 0.1 44.5 ± 0.1 44.2 ± 0.1 44.2 ± 0.2 44.3 ± 0.1 Mean cell hemoglobin (pg) 15.2 ± 0.1 15.1 ± 0.1 15.1 ± 0.1 15.1 ± 0.1 15.0 ± 0.1 15.0 ± 0.1 Mean cell hemoglobin
concentration (g/dL) 34.1 ± 0.2 34.1 ± 0.2 33.9 ± 0.1 34.1 ± 0.1 33.9 ± 0.1 33.9 ± 0.2 Platelets (103/µL) 676 ± 61 701 ± 67 729 ± 35 698 ± 55 811 ± 82 773 ± 61 Leukocytes (103/µL) 3.24 ± 0.31 3.51 ± 0.20 3.13 ± 0.25 3.27 ± 0.13 3.56 ± 0.23 3.76 ± 0.20 Segmented neutrophils (103/µL) 0.28 ± 0.03 0.29 ± 0.04 0.25 ± 0.05 0.34 ± 0.07 0.40 ± 0.03 0.41 ± 0.03* Lymphocytes (103/µL) 2.84 ± 0.28 3.05 ± 0.19 2.71 ± 0.20 2.80 ± 0.09 2.98 ± 0.19 3.20 ± 0.17 Monocytes (103/µL) 0.06 ± 0.01 0.07 ± 0.01 0.06 ± 0.01 0.06 ± 0.01 0.08 ± 0.01 0.08 ± 0.01 Basophils (103/µL) 0.005 ± 0.002 0.011 ± 0.003 0.004 ± 0.002 0.002 ± 0.001 0.009 ± 0.002 0.009 ± 0.002 Eosinophils (103/µL) 0.05 ± 0.02 0.08 ± 0.02 0.06 ± 0.02 0.06 ± 0.02 0.10 ± 0.02 0.06 ± 0.01
* Significantly different (P≤0.05) from the vehicle control group by Shirley’s test a Data are presented as mean ± standard error. Statistical tests were performed on unrounded data.

B-8 Tetrabromobisphenol A-bis(2,3-dibromopropyl ether), NTP TOX 85

C-1
APPENDIX C ORGAN WEIGHTS
AND ORGAN-WEIGHT-TO-BODY-WEIGHT RATIOS
TABLE C1 Organ Weights and Organ-Weight-to-Body-Weight Ratios for Rats in the 3-Month Gavage Study of Tetrabromobisphenol A-bis(2,3-dibromopropyl ether) ........... C-2 TABLE C2 Organ Weights and Organ-Weight-to-Body-Weight Ratios for Mice in the 3-Month Gavage Study of Tetrabromobisphenol A-bis(2,3-dibromopropyl ether) ........... C-3

C-2 Tetrabromobisphenol A-bis(2,3-dibromopropyl ether), NTP TOX 85
TABLE C1 Organ Weights and Organ-Weight-to-Body-Weight Ratios for Rats in the 3-Month Gavage Study of Tetrabromobisphenol A-bis(2,3-dibromopropyl ether)a
Vehicle Control 62.5 mg/kg 125 mg/kg 250 mg/kg 500 mg/kg 1,000 mg/kg
Male n 10 8 10 10 10 10 Necropsy body wt 330 ± 9 344 ± 8 329 ± 7 342 ± 6 333 ± 5 320 ± 8 Heart Absolute 0.93 ± 0.03 0.99 ± 0.04 0.95 ± 0.03 1.00 ± 0.03 0.92 ± 0.02 0.90 ± 0.02 Relative 2.81 ± 0.03 2.87 ± 0.07 2.89 ± 0.04 2.92 ± 0.08 2.75 ± 0.05 2.82 ± 0.04 R. Kidney Absolute 0.83 ± 0.02 0.89 ± 0.02 0.85 ± 0.02 0.92 ± 0.02* 0.83 ± 0.02 0.83 ± 0.03 Relative 2.54 ± 0.05 2.59 ± 0.05 2.58 ± 0.05 2.70 ± 0.05 2.49 ± 0.05 2.58 ± 0.04 Liver Absolute 10.36 ± 0.31 11.65 ± 0.25* 10.58 ± 0.27 11.40 ± 0.25 10.72 ± 0.29 10.82 ± 0.37 Relative 31.43 ± 0.53 33.89 ± 0.45** 32.12 ± 0.37 33.37 ± 0.35* 32.18 ± 0.51 33.77 ± 0.44** Lung Absolute 2.13 ± 0.12 1.94 ± 0.11 2.10 ± 0.17 2.38 ± 0.20 2.05 ± 0.08 2.16 ± 0.13 Relative 6.46 ± 0.34 5.63 ± 0.29 6.35 ± 0.46 6.94 ± 0.53 6.19 ± 0.30 6.75 ± 0.37 Spleen Absolute 0.605 ± 0.014 0.617 ± 0.011 0.596 ± 0.017 0.631 ± 0.009 0.571 ± 0.014 0.586 ± 0.014 Relative 1.84 ± 0.03 1.80 ± 0.03 1.81 ± 0.04 1.85 ± 0.04 1.72 ± 0.04 1.84 ± 0.05 R. Testis Absolute 1.357 ± 0.022 1.356 ± 0.027 1.336 ± 0.011 1.393 ± 0.022 1.321 ± 0.024 1.331 ± 0.041 Relative 4.134 ± 0.086 3.945 ± 0.050 4.069 ± 0.079 4.090 ± 0.102 3.972 ± 0.063 4.162 ± 0.086 Thymus Absolute 0.341 ± 0.009 0.354 ± 0.022 0.343 ± 0.010 0.329 ± 0.017 0.296 ± 0.012 0.310 ± 0.013 Relative 1.035 ± 0.020 1.031 ± 0.068 1.044 ± 0.033 0.964 ± 0.051 0.891 ± 0.035 0.972 ± 0.044 Female n 9 10 10 10 10 10 Necropsy body wt 191 ± 4 195 ± 4 188 ± 4 194 ± 4 188 ± 3 190 ± 4 Heart Absolute 0.65 ± 0.01 0.65 ± 0.02 0.63 ± 0.02 0.65 ± 0.02 0.61 ± 0.01 0.64 ± 0.01 Relative 3.39 ± 0.07 3.33 ± 0.08 3.33 ± 0.06 3.34 ± 0.07 3.25 ± 0.06 3.37 ± 0.07 R. Kidney Absolute 0.55 ± 0.01 0.56 ± 0.02 0.55 ± 0.01 0.56 ± 0.01 0.52 ± 0.01 0.55 ± 0.01 Relative 2.87 ± 0.04 2.85 ± 0.06 2.90 ± 0.05 2.89 ± 0.04 2.79 ± 0.05 2.88 ± 0.04 Liver Absolute 5.91 ± 0.14 6.21 ± 0.14 6.09 ± 0.14 6.18 ± 0.12 5.90 ± 0.09 6.25 ± 0.12 Relative 30.93 ± 0.46 31.88 ± 0.52 32.37 ± 0.38 31.92 ± 0.44 31.47 ± 0.53 33.03 ± 0.23** Lung Absolute 1.56 ± 0.18 1.39 ± 0.09 1.40 ± 0.11 1.56 ± 0.10 1.32 ± 0.06 1.43 ± 0.08 Relative 8.14 ± 0.88 7.13 ± 0.44 7.47 ± 0.58 8.05 ± 0.50 7.09 ± 0.37 7.56 ± 0.46 Spleen Absolute 0.433 ± 0.009 0.462 ± 0.018 0.459 ± 0.011 0.467 ± 0.013 0.447 ± 0.009 0.476 ± 0.014 Relative 2.27 ± 0.06 2.37 ± 0.09 2.45 ± 0.06 2.41 ± 0.06 2.39 ± 0.07 2.52 ± 0.08 Thymus Absolute 0.244 ± 0.009 0.250 ± 0.010 0.258 ± 0.008 0.267 ± 0.021 0.237 ± 0.008 0.264 ± 0.012 Relative 1.277 ± 0.041 1.287 ± 0.052 1.371 ± 0.027 1.369 ± 0.096 1.268 ± 0.050 1.397 ± 0.072 * Significantly different (P≤0.05) from the vehicle control group by Dunnett’s test ** P≤0.01 a Organ weights (absolute weights) and body weights are given in grams; organ-weight-to-body-weight ratios (relative weights) are given as
mg organ weight/g body weight (mean ± standard error).

Tetrabromobisphenol A-bis(2,3-dibromopropyl ether), NTP TOX 85 C-3
TABLE C2 Organ Weights and Organ-Weight-to-Body-Weight Ratios for Mice in the 3-Month Gavage Study of Tetrabromobisphenol A-bis(2,3-dibromopropyl ether)a
Vehicle Control 125 mg/kg 250 mg/kg 500 mg/kg 1,000 mg/kg 2,000 mg/kg
n 10 10 10 10 10 10 Male Necropsy body wt 36.8 ± 1.0 39.0 ± 0.9 38.3 ± 1.0 39.4 ± 1.5 38.2 ± 0.9 39.1 ± 1.1 Heart Absolute 0.18 ± 0.01 0.18 ± 0.01 0.20 ± 0.01 0.19 ± 0.01 0.19 ± 0.01 0.19 ± 0.01 Relative 4.90 ± 0.16 4.58 ± 0.13 5.10 ± 0.16 4.94 ± 0.15 5.09 ± 0.19 4.82 ± 0.16 R. Kidney Absolute 0.27 ± 0.01 0.28 ± 0.01 0.28 ± 0.01 0.28 ± 0.01 0.28 ± 0.01 0.27 ± 0.01 Relative 7.33 ± 0.23 7.15 ± 0.12 7.36 ± 0.18 7.14 ± 0.19 7.23 ± 0.15 6.86 ± 0.14 Liver Absolute 1.43 ± 0.07 1.62 ± 0.03 1.58 ± 0.06 1.67 ± 0.13 1.58 ± 0.04 1.62 ± 0.08 Relative 38.91 ± 1.44 41.67 ± 0.93 41.36 ± 1.02 42.05 ± 1.76 41.29 ± 0.56 41.22 ± 1.06 Lung Absolute 0.32 ± 0.01 0.33 ± 0.01 0.34 ± 0.02 0.32 ± 0.01 0.32 ± 0.01 0.32 ± 0.01 Relative 8.85 ± 0.41 8.44 ± 0.23 8.83 ± 0.42 8.08 ± 0.31 8.49 ± 0.23 8.25 ± 0.22 Spleen Absolute 0.063 ± 0.001 0.065 ± 0.002 0.067 ± 0.002 0.067 ± 0.003 0.066 ± 0.001 0.061 ± 0.001 Relative 1.71 ± 0.03 1.67 ± 0.04 1.75 ± 0.06 1.70 ± 0.04 1.73 ± 0.05 1.58 ± 0.03 R. Testis Absolute 0.118 ± 0.002 0.118 ± 0.002 0.116 ± 0.003 0.118 ± 0.002 0.118 ± 0.002 0.116 ± 0.002 Relative 3.244 ± 0.118 3.047 ± 0.072 3.049 ± 0.068 3.014 ± 0.091 3.099 ± 0.082 2.981 ± 0.060 Thymus Absolute 0.053 ± 0.005 0.054 ± 0.004 0.051 ± 0.003 0.054 ± 0.004 0.051 ± 0.002 0.054 ± 0.006 Relative 1.427 ± 0.103 1.388 ± 0.085 1.342 ± 0.061 1.368 ± 0.056 1.326 ± 0.040 1.356 ± 0.120 Female Necropsy body wt 29.2 ± 1.0 31.6 ± 1.3 32.4 ± 0.7 31.0 ± 0.8 31.0 ± 0.8 30.2 ± 0.9 Heart Absolute 0.14 ± 0.00 0.14 ± 0.01 0.14 ± 0.00 0.15 ± 0.01 0.14 ± 0.00 0.14 ± 0.01 Relative 4.72 ± 0.22 4.47 ± 0.22 4.49 ± 0.18 4.78 ± 0.18 4.64 ± 0.13 4.77 ± 0.17 R. Kidney Absolute 0.17 ± 0.00 0.17 ± 0.01 0.17 ± 0.01 0.16 ± 0.00 0.16 ± 0.01 0.16 ± 0.01 Relative 5.66 ± 0.13 5.26 ± 0.10 5.26 ± 0.14 5.31 ± 0.13 5.29 ± 0.07 5.33 ± 0.18 Liver Absolute 1.10 ± 0.02 1.22 ± 0.05* 1.25 ± 0.03** 1.16 ± 0.03 1.21 ± 0.04 1.22 ± 0.03* Relative 37.75 ± 1.14 38.79 ± 1.18 38.75 ± 0.85 37.55 ± 0.64 38.88 ± 0.41 40.57 ± 1.16 Lung Absolute 0.29 ± 0.02 0.30 ± 0.01 0.31 ± 0.01 0.31 ± 0.01 0.30 ± 0.01 0.30 ± 0.01 Relative 9.99 ± 0.42 9.54 ± 0.52 9.64 ± 0.27 10.10 ± 0.17 9.83 ± 0.36 9.76 ± 0.27 Spleen Absolute 0.080 ± 0.002 0.081 ± 0.003 0.084 ± 0.003 0.084 ± 0.003 0.083 ± 0.003 0.081 ± 0.002 Relative 2.76 ± 0.10 2.58 ± 0.09 2.61 ± 0.11 2.72 ± 0.10 2.66 ± 0.06 2.70 ± 0.10 Thymus Absolute 0.050 ± 0.003 0.058 ± 0.002 0.057 ± 0.002 0.052 ± 0.002 0.054 ± 0.002 0.054 ± 0.002 Relative 1.719 ± 0.088 1.855 ± 0.074 1.774 ± 0.060 1.681 ± 0.067 1.739 ± 0.048 1.819 ± 0.094 * Significantly different (P≤0.05) from the vehicle control group by Dunnett’s test ** P≤0.01 a Organ weights (absolute weights) and body weights are given in grams; organ-weight-to-body-weight ratios (relative weights) are given as
mg organ weight/g body weight (mean ± standard error).

C-4 Tetrabromobisphenol A-bis(2,3-dibromopropyl ether), NTP TOX 85

D-1
APPENDIX D REPRODUCTIVE TISSUE EVALUATIONS
AND ESTROUS CYCLE CHARACTERIZATION
TABLE D1 Summary of Reproductive Tissue Evaluations for Male Rats in the 3-Month Gavage Study of Tetrabromobisphenol A-bis(2,3-dibromopropyl ether) ........... D-2 TABLE D2 Estrous Cycle Characterization for Female Rats in the 3-Month Gavage Study of Tetrabromobisphenol A-bis(2,3-dibromopropyl ether) ........... D-2 FIGURE D1 Vaginal Cytology Plots for Female Rats in the 3-Month Gavage Study of Tetrabromobisphenol A-bis(2,3-dibromopropyl ether) ........... D-3 TABLE D3 Results of Vaginal Cytology Study Using the Transition Matrix Approach in Female Rats in the 3-Month Gavage Study of Tetrabromobisphenol A-bis(2,3-dibromopropyl ether) ............................................................. D-4 TABLE D4 Summary of Reproductive Tissue Evaluations for Male Mice in the 3-Month Gavage Study of Tetrabromobisphenol A-bis(2,3-dibromopropyl ether) ........... D-5 TABLE D5 Estrous Cycle Characterization for Female Mice in the 3-Month Gavage Study of Tetrabromobisphenol A-bis(2,3-dibromopropyl ether) ........... D-5 FIGURE D2 Vaginal Cytology Plots for Female Mice in the 3-Month Gavage Study of Tetrabromobisphenol A-bis(2,3-dibromopropyl ether) ........... D-6 TABLE D6 Results of Vaginal Cytology Study Using the Transition Matrix Approach in Female Mice in the 3-Month Gavage Study of Tetrabromobisphenol A-bis(2,3-dibromopropyl ether) ............................................................. D-7
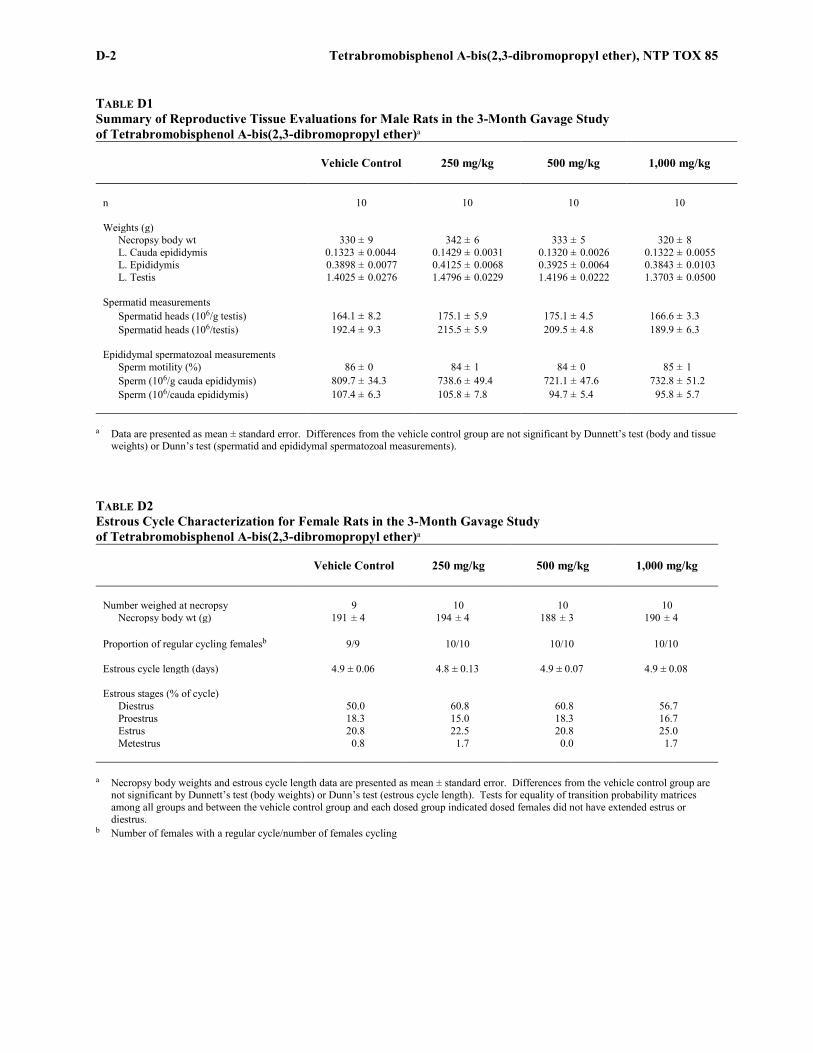
D-2 Tetrabromobisphenol A-bis(2,3-dibromopropyl ether), NTP TOX 85
TABLE D1 Summary of Reproductive Tissue Evaluations for Male Rats in the 3-Month Gavage Study of Tetrabromobisphenol A-bis(2,3-dibromopropyl ether)a
Vehicle Control
250 mg/kg
500 mg/kg
1,000 mg/kg
n 10 10 10 10 Weights (g)
Necropsy body wt 330 ± 9 342 ± 6 333 ± 5 320 ± 8 L. Cauda epididymis 0.1323 ± 0.0044 0.1429 ± 0.0031 0.1320 ± 0.0026 0.1322 ± 0.0055 L. Epididymis 0.3898 ± 0.0077 0.4125 ± 0.0068 0.3925 ± 0.0064 0.3843 ± 0.0103 L. Testis 1.4025 ± 0.0276 1.4796 ± 0.0229 1.4196 ± 0.0222 1.3703 ± 0.0500
Spermatid measurements
Spermatid heads (106/g testis) 164.1 ± 8.2 175.1 ± 5.9 175.1 ± 4.5 166.6 ± 3.3 Spermatid heads (106/testis) 192.4 ± 9.3 215.5 ± 5.9 209.5 ± 4.8 189.9 ± 6.3
Epididymal spermatozoal measurements
Sperm motility (%) 86 ± 0 84 ± 1 84 ± 0 85 ± 1 Sperm (106/g cauda epididymis) 809.7 ± 34.3 738.6 ± 49.4 721.1 ± 47.6 732.8 ± 51.2 Sperm (106/cauda epididymis) 107.4 ± 6.3 105.8 ± 7.8 94.7 ± 5.4 95.8 ± 5.7
a Data are presented as mean ± standard error. Differences from the vehicle control group are not significant by Dunnett’s test (body and tissue weights) or Dunn’s test (spermatid and epididymal spermatozoal measurements).
TABLE D2 Estrous Cycle Characterization for Female Rats in the 3-Month Gavage Study of Tetrabromobisphenol A-bis(2,3-dibromopropyl ether)a
Vehicle Control
250 mg/kg
500 mg/kg
1,000 mg/kg
Number weighed at necropsy 9 10 10 10
Necropsy body wt (g) 191 ± 4 194 ± 4 188 ± 3 190 ± 4
Proportion of regular cycling femalesb 9/9 10/10 10/10 10/10
Estrous cycle length (days) 4.9 ± 0.06 4.8 ± 0.13 4.9 ± 0.07 4.9 ± 0.08 Estrous stages (% of cycle)
Diestrus 50.0 60.8 60.8 56.7 Proestrus 18.3 15.0 18.3 16.7 Estrus 20.8 22.5 20.8 25.0 Metestrus 0.8 1.7 0.0 1.7
a Necropsy body weights and estrous cycle length data are presented as mean ± standard error. Differences from the vehicle control group are not significant by Dunnett’s test (body weights) or Dunn’s test (estrous cycle length). Tests for equality of transition probability matrices among all groups and between the vehicle control group and each dosed group indicated dosed females did not have extended estrus or diestrus.
b Number of females with a regular cycle/number of females cycling

Tetrabromobisphenol A-bis(2,3-dibromopropyl ether), NTP TOX 85 D-3
DOSE (MG/KG)
0 D P E D D D P E D D D P 0 D P E D D D P E D D D P 0 E D D D P E D D D P E D
0 P E D D D E E D D D P E
0 P E D D D E D D D E E D
0 D P E D D D P E D D D P 0 E D D D P E D D D P E D
0 P E D D D P E D D D P E 0 D P E M D D P E D D D P
250 E D D D P E D D D P E D
250 E D D D P E D D D P E D
250 P E D D D E E D D D D P
250 D D P E D D D P E D D D 250 E D D D P E D D D P E D
250 D D D E D D D E M D D E 250 E D D D P E D D D P E D
250 D D P E D D D P E D D D 250 D D D P E D D D E M D D 250 P E D D D P E D D D P E
500 D D P E D D D P E D D D 500 D P E D D D P E D D D E 500 D D D P E D D D P E D D 500 D P E D D D E E D D D E 500 P E D D D P E D D D P E 500 D P E D D D P E D D D P 500 D P E D D D P E D D D P 500 D D D P E D D D P E D D 500 D D D P E D D D P E D D 500 E D D D P E D D D P E D
1,000 D P E D D D P E D D D P 1,000 P E D D D P E D D D P E 1,000 D D P E D D D P E D D D 1,000 E E D D D E E D D D P E
1,000 E D D D P E D D D P E D
1,000 E D D D E D D D P E D D 1,000 D D D P E D D D P E D D 1,000 E E M D D P E D D D P E 1,000 D P E M D D P E D D D E 1,000 D P E D D D P E D D D E
FIGURE D1 Vaginal Cytology Plots for Female Rats in the 3-Month Gavage Study of Tetrabromobisphenol A-bis(2,3-dibromopropyl ether) Daily vaginal lavage samples were collected from each animal, and estrous stage was determined based on vaginal cytology. Individual females are aligned by their second estrus and color coded based on estrous stage to aid in visual comparisons amongst the groups. D = diestrus, P = proestrus, E = estrus, M = metestrus

D-4 Tetrabromobisphenol A-bis(2,3-dibromopropyl ether), NTP TOX 85
TABLE D3 Results of Vaginal Cytology Study Using the Transition Matrix Approach in Female Rats in the 3-Month Gavage Study of Tetrabromobisphenol A-bis(2,3-dibromopropyl ether)
Stage
Comparison
P Value
Trenda
Overall Tests Overall 1 Overall Tests 250 mg/kg vs. Vehicle Controls 0.971 N Overall Tests 500 mg/kg vs. Vehicle Controls 0.996 N Overall Tests 1,000 mg/kg vs. Vehicle Controls 0.996 N Extended Estrus Overall 0.945 Extended Estrus 250 mg/kg vs. Vehicle Controls 0.702 N Extended Estrus 500 mg/kg vs. Vehicle Controls 0.702 N Extended Estrus 1,000 mg/kg vs. Vehicle Controls 0.864 Extended Diestrus Overall 0.999 Extended Diestrus 250 mg/kg vs. Vehicle Controls 0.933 Extended Diestrus 500 mg/kg vs. Vehicle Controls 0.958 Extended Diestrus 1,000 mg/kg vs. Vehicle Controls 0.948 N Extended Metestrus Overall 1 Extended Metestrus 250 mg/kg vs. Vehicle Controls 1 Extended Metestrus 500 mg/kg vs. Vehicle Controls 1 Extended Metestrus 1,000 mg/kg vs. Vehicle Controls 1 Extended Proestrus Overall 1 Extended Proestrus 250 mg/kg vs. Vehicle Controls 1 Extended Proestrus 500 mg/kg vs. Vehicle Controls 1 Extended Proestrus 1,000 mg/kg vs. Vehicle Controls 1 Skipped Estrus Overall 1 Skipped Estrus 250 mg/kg vs. Vehicle Controls 1 Skipped Estrus 500 mg/kg vs. Vehicle Controls 1 Skipped Estrus 1,000 mg/kg vs. Vehicle Controls 1 Skipped Diestrus Overall 1 Skipped Diestrus 250 mg/kg vs. Vehicle Controls 1 Skipped Diestrus 500 mg/kg vs. Vehicle Controls 1 Skipped Diestrus 1,000 mg/kg vs. Vehicle Controls 1 a N means that the dosed group had a lower probability of transitioning to the relevant abnormal state (extended estrus, extended diestrus,
extended metestrus, extended proestrus, skipped estrus, or skipped diestrus) than did the vehicle control group.

Tetrabromobisphenol A-bis(2,3-dibromopropyl ether), NTP TOX 85 D-5
TABLE D4 Summary of Reproductive Tissue Evaluations for Male Mice in the 3-Month Gavage Study of Tetrabromobisphenol A-bis(2,3-dibromopropyl ether)a
Vehicle Control
500 mg/kg
1,000 mg/kg
2,000 mg/kg
n 10 10 10 10 Weights (g)
Necropsy body wt 36.8 ± 1.0 39.4 ± 1.5 38.2 ± 0.9 39.1 ± 1.1 L. Cauda epididymis 0.0152 ± 0.0006 0.0167 ± 0.0016 0.0146 ± 0.0005 0.0149 ± 0.0008 L. Epididymis 0.0428 ± 0.0009 0.0449 ± 0.0014 0.0433 ± 0.0011 0.0405 ± 0.0009 L. Testis 0.1102 ± 0.0016 0.1139 ± 0.0023 0.1135 ± 0.0027 0.1096 ± 0.0015
Spermatid measurements
Spermatid heads (106/g testis) 210.0 ± 6.3 230.9 ± 11.8 221.7 ± 13.9 230.2 ± 7.1 Spermatid heads (106/testis) 21.4 ± 0.8 23.7 ± 1.1 22.9 ± 1.6 22.3 ± 0.8
Epididymal spermatozoal measurements
Sperm motility (%) 86 ± 1 85 ± 1 85 ± 1 85 ± 1 Sperm (106/g cauda epididymis) 1,477.4 ± 147.4 1,448.0 ± 139.8 1,391.0 ± 132.9 1,672.3 ± 153.7 Sperm (106/cauda epididymis) 22.3 ± 2.2 22.9 ± 1.6 20.5 ± 2.2 24.8 ± 2.3
a Data are presented as mean ± standard error. Differences from the vehicle control group are not significant by Dunnett’s test (body and tissue weights) or Dunn’s test (spermatid and epididymal spermatozoal measurements).
TABLE D5 Estrous Cycle Characterization for Female Mice in the 3-Month Gavage Study of Tetrabromobisphenol A-bis(2,3-dibromopropyl ether)a
Vehicle Control
500 mg/kg
1,000 mg/kg
2,000 mg/kg
Number weighed at necropsy 10 10 10 10
Necropsy body wt (g) 29.2 ± 1.0 31.0 ± 0.8 31.0 ± 0.8 30.2 ± 0.9
Proportion of regular cycling femalesb 8/9 9/10 7/9 8/9
Estrous cycle length (days) 4.6 ± 0.18c 5.2 ± 0.44 4.5 ± 0.17c 4.5 ± 0.17c Estrous stages (% of cycle)
Diestrus 35.8 39.2 46.7 38.3 Proestrus 0.0 0. 0 0.0 0.0 Estrus 44.2 39.2 35.8 39.2 Metestrus 19.2 21.7 17.5 22.5 Uncertain diagnosis 0.8 0.0 0.0 0.0
a Necropsy body weights and estrous cycle length data are presented as mean ± standard error. Differences from the vehicle control group are not significant by Dunnett’s test (body weight) or Dunn’s test (estrous cycle length). Tests for equality of transition probability matrices among all groups and between the vehicle control group and each dosed group indicated that 1,000 mg/kg females spent significantly more time in extended diestrus (P=0.004) than did the vehicle control group.
b Number of females with a regular cycle/number of females cycling c Estrous cycle unclear in 1 of 10 animals

D-6 Tetrabromobisphenol A-bis(2,3-dibromopropyl ether), NTP TOX 85
DOSE (MG/KG)
0 E M D D E E M D D E E M
0 D D E E M D D E E M D D
0 D E E M D D E E M D E E
0 E E M D D E E M D D E E
0 E E M D E E M D E E M D
0 D E E M D D D D D D IC D
0 D D E E M D E E M D E E
0 E E M D E E E M D E E E
0 E M D E E M D E E M D E
0 M D D E E M D D E E M D
500 E E M D E E M D D D E M
500 M D D E E M D D E E M D
500 E M D D E E M D D E E M
500 E M D D E E M D D E E M
500 E M D D D D D D E E D D
500 E M D E E M D D E E M D
500 E E M D D E E M D D E E
500 E M D D E E M D D E E M
500 E M D D E E M D D E E M
500 D D D E E M D E E M D D
1,000 M D D E E M D D E E M D
1,000 M D D E E M D D E E D D
1,000 M D D E E M D D E E M D
1,000 E E M D D E E M D D E E
1,000 D E E M D E E M D D D E
1,000 D D D D D D D D D E D D
1,000 D D D D D D E D D E E M
1,000 E E M D E E M D D D D D
1,000 D E E M D E E M D E E M
1,000 M D E E M D E E M D E E
2,000 E M D E E M D D D E E M
2,000 D E E M D E E M D E E M
2,000 M D D E E M D D E E M D
2,000 M D D E E M D E E E M D
2,000 M D D E E M D D E E M D
2,000 E E M D E E M D D E E M
2,000 D E E M D E E M D E E M
2,000 D D D E M D E M D D E E
2,000 E E M D E E M D E E M D
2,000 D D D D D D D D D E M D
FIGURE D2 Vaginal Cytology Plots for Female Mice in the 3-Month Gavage Study of Tetrabromobisphenol A-bis(2,3-dibromopropyl ether) Daily vaginal lavage samples were collected from each animal, and estrous stage was determined based on vaginal cytology. Individual females are aligned by their second estrus and color coded based on estrous stage to aid in visual comparisons amongst the groups. D = diestrus, P = proestrus, E = estrus, M = metestrus, IC = insufficient number of cells to determine stage

Tetrabromobisphenol A-bis(2,3-dibromopropyl ether), NTP TOX 85 D-7
TABLE D6 Results of Vaginal Cytology Study Using the Transition Matrix Approach in Female Mice in the 3-Month Gavage Study of Tetrabromobisphenol A-bis(2,3-dibromopropyl ether)
Stage
Comparison
P Value
Trenda
Overall Tests Overall 0.636 Overall Tests 500 mg/kg vs. Vehicle Controls 0.368 Overall Tests 1,000 mg/kg vs. Vehicle Controls 0.719 Overall Tests 2,000 mg/kg vs. Vehicle Controls 0.44 Extended Estrus Overall 0.579 Extended Estrus 500 mg/kg vs. Vehicle Controls 0.351 N Extended Estrus 1,000 mg/kg vs. Vehicle Controls 0.351 N Extended Estrus 2,000 mg/kg vs. Vehicle Controls 0.764 N Extended Diestrus Overall 0.001 Extended Diestrus 500 mg/kg vs. Vehicle Controls 0.06 Extended Diestrus 1,000 mg/kg vs. Vehicle Controls 0.004 Extended Diestrus 2,000 mg/kg vs. Vehicle Controls 0.069 Extended Metestrus Overall 1 Extended Metestrus 500 mg/kg vs. Vehicle Controls 1 Extended Metestrus 1,000 mg/kg vs. Vehicle Controls 1 Extended Metestrus 2,000 mg/kg vs. Vehicle Controls 1 Extended Proestrus Overall 1 Extended Proestrus 500 mg/kg vs. Vehicle Controls 1 Extended Proestrus 1,000 mg/kg vs. Vehicle Controls 1 Extended Proestrus 2,000 mg/kg vs. Vehicle Controls 1 Skipped Estrus Overall 1 Skipped Estrus 500 mg/kg vs. Vehicle Controls 1 Skipped Estrus 1,000 mg/kg vs. Vehicle Controls 1 Skipped Estrus 2,000 mg/kg vs. Vehicle Controls 1 Skipped Diestrus Overall 1 Skipped Diestrus 500 mg/kg vs. Vehicle Controls 1 Skipped Diestrus 1,000 mg/kg vs. Vehicle Controls 1 Skipped Diestrus 2,000 mg/kg vs. Vehicle Controls 1 Summary of Significant Groups Extended Diestrus 1,000 mg/kg vs. Vehicle Controls 0.004 a N means that the dosed group had a lower probability of transitioning to the relevant abnormal state (extended estrus, extended diestrus,
extended metestrus, extended proestrus, skipped estrus, or skipped diestrus) than did the vehicle control group.

D-8 Tetrabromobisphenol A-bis(2,3-dibromopropyl ether), NTP TOX 85

E-1
APPENDIX E GENETIC TOXICOLOGY
TABLE E1 Mutagenicity of Tetrabromobisphenol A-bis(2,3-dibromopropyl ether) in Salmonella typhimurium ................................................................................................................ E-2 TABLE E2 Frequency of Micronuclei in Peripheral Blood Erythrocytes of Mice Following Administration of Tetrabromobisphenol A-bis(2,3-dibromopropyl ether) by Gavage for 3 Months..................................................................................................................... E-3
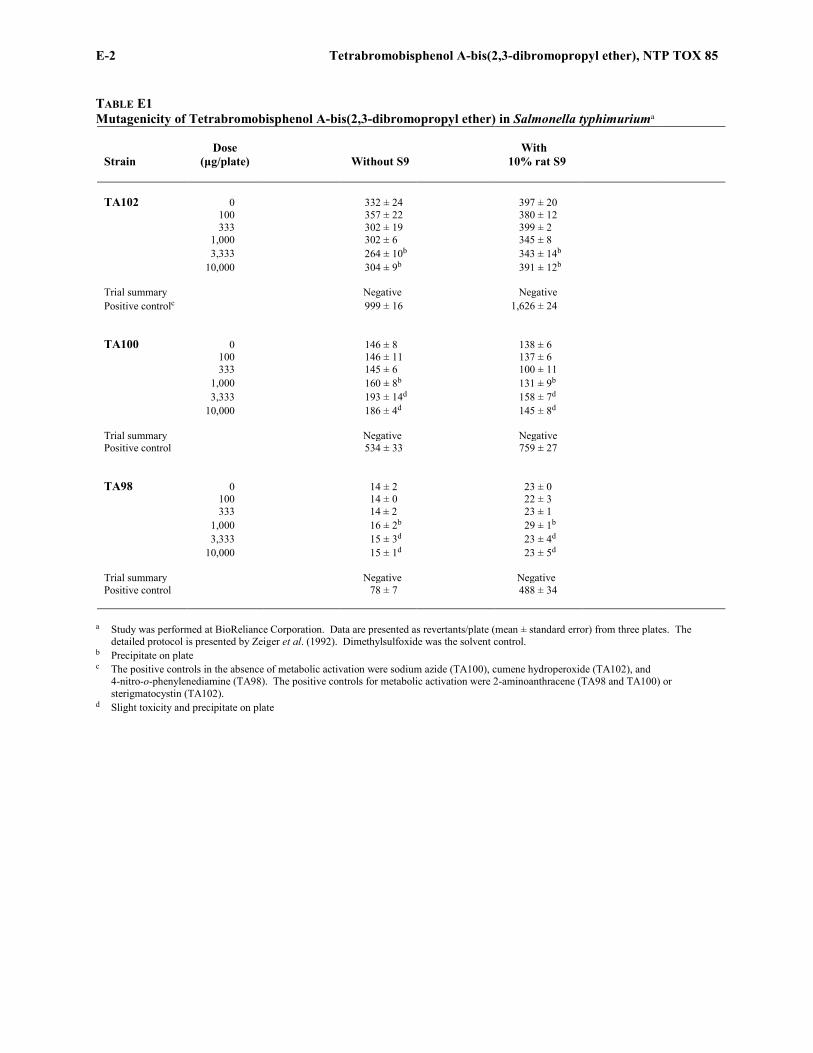
E-2 Tetrabromobisphenol A-bis(2,3-dibromopropyl ether), NTP TOX 85
TABLE E1 Mutagenicity of Tetrabromobisphenol A-bis(2,3-dibromopropyl ether) in Salmonella typhimuriuma
Strain
Dose
(μg/plate)
Without S9
With
10% rat S9
TA102 0 332 ± 24 397 ± 20 100 357 ± 22 380 ± 12 333 302 ± 19 399 ± 2 1,000 302 ± 6 345 ± 8 3,333 264 ± 10b 343 ± 14b 10,000 304 ± 9b 391 ± 12b Trial summary Negative Negative Positive controlc 999 ± 16 1,626 ± 24 TA100 0 146 ± 8 138 ± 6 100 146 ± 11 137 ± 6 333 145 ± 6 100 ± 11 1,000 160 ± 8b 131 ± 9b 3,333 193 ± 14d 158 ± 7d 10,000 186 ± 4d 145 ± 8d Trial summary Negative Negative Positive control 534 ± 33 759 ± 27 TA98 0 14 ± 2 23 ± 0 100 14 ± 0 22 ± 3 333 14 ± 2 23 ± 1 1,000 16 ± 2b 29 ± 1b 3,333 15 ± 3d 23 ± 4d 10,000 15 ± 1d 23 ± 5d Trial summary Negative Negative Positive control 78 ± 7 488 ± 34
a Study was performed at BioReliance Corporation. Data are presented as revertants/plate (mean ± standard error) from three plates. The detailed protocol is presented by Zeiger et al. (1992). Dimethylsulfoxide was the solvent control.
b Precipitate on plate c The positive controls in the absence of metabolic activation were sodium azide (TA100), cumene hydroperoxide (TA102), and
4-nitro-o-phenylenediamine (TA98). The positive controls for metabolic activation were 2-aminoanthracene (TA98 and TA100) or sterigmatocystin (TA102).
d Slight toxicity and precipitate on plate

Tetrabromobisphenol A-bis(2,3-dibromopropyl ether), NTP TOX 85 E-3
TABLE E2 Frequency of Micronuclei in Peripheral Blood Erythrocytes of Mice Following Administration of Tetrabromobisphenol A-bis(2,3-dibromopropyl ether) by Gavage for 3 Monthsa
Dose (mg/kg)
Number of Mice
with Erythrocytes Scored
Micronucleated NCEs/ 1,000 NCEsb
P Valuec
PCEsb (%)
Male Corn oild 0 5 2.20 ± 0.41 2.90 ± 0.21 Tetrabromobisphenol A-bis(2,3-dibromopropyl ether) 125 5 2.00 ± 0.42 0.6213 3.10 ± 0.22 250 5 2.20 ± 0.41 0.5000 3.24 ± 0.13 500 5 2.20 ± 0.20 0.5000 3.52 ± 0.38 1,000 5 2.40 ± 0.37 0.3839 3.04 ± 0.18 2,000 5 2.20 ± 0.12 0.5000 2.72 ± 0.18 P=0.412e Female Corn oil 0 5 1.40 ± 0.24 3.40 ± 0.20 Tetrabromobisphenol A-bis(2,3-dibromopropyl ether) 125 5 1.50 ± 0.16 0.4263 3.40 ± 0.06 250 5 1.30 ± 0.30 0.5764 3.74 ± 0.16 500 5 1.40 ± 0.37 0.5000 2.94 ± 0.41 1,000 5 2.40 ± 0.37 0.0522 3.32 ± 0.23 2,000 5 1.90 ± 0.33 0.1918 3.28 ± 0.18 P=0.068
a Study was performed at ILS, Inc. The detailed protocol is presented by MacGregor et al. (1990). NCE=normochromatic erythrocyte; PCE=polychromatic erythrocyte
b Mean ± standard error c Pairwise comparison with the vehicle control group; dosed group values are significant at P≤0.005 d Vehicle control e Significance of micronucleated NCEs/1,000 NCEs tested by the one-tailed Cochran-Armitage trend test; significant at P≤0.025

E-4 Tetrabromobisphenol A-bis(2,3-dibromopropyl ether), NTP TOX 85

F-1
APPENDIX F MICROSOMAL PROTEIN CONCENTRATION
AND LIVER ENZYME ACTIVITY DATA
TABLE F1 Microsomal Protein Concentration and Liver Enzyme Activities for Rats in the 3-Month Gavage Study of Tetrabromobisphenol A-bis(2,3-dibromopropyl ether) .............................................................. F-2 TABLE F2 Microsomal Protein Concentration and Liver Enzyme Activities for Mice in the 3-Month Gavage Study of Tetrabromobisphenol A-bis(2,3-dibromopropyl ether) .............................................................. F-3

F-2 Tetrabromobisphenol A-bis(2,3-dibromopropyl ether), NTP TOX 85
TABLE F1 Microsomal Protein Concentration and Liver Enzyme Activities for Rats in the 3-Month Gavage Study of Tetrabromobisphenol A-bis(2,3-dibromopropyl ether)a
Vehicle Control
62.5 mg/kg
125 mg/kg
250 mg/kg
500 mg/kg
1,000 mg/kg
Male n Day 23 10 10 10 10 10 9 Week 14 10 8 10 10 10 10
Microsomal protein (mg/mL)
Day 23 10.54 ± 0.31 11.70 ± 0.64 17.17 ± 0.77** 18.26 ± 0.54** 17.35 ± 0.22** 18.28 ± 0.52** Week 14 12.89 ± 0.65 13.47 ± 1.05 15.61 ± 1.13* 17.91 ± 1.26** 17.31 ± 0.71** 17.73 ± 0.94**
Acetanilide-4-hydroxylase (A4H) (nmol/minute per mg microsomal protein) Day 23 0.914 ± 0.038 0.852 ± 0.040 0.579 ± 0.049** 0.534 ± 0.020** 0.504 ± 0.024** 0.479 ± 0.029** Week 14 0.762 ± 0.062 0.735 ± 0.030 0.629 ± 0.038 0.513 ± 0.014** 0.567 ± 0.027** 0.526 ± 0.018**
7-Ethoxyresorufin-O-deethylase (EROD) (pmol/minute per mg microsomal protein) Day 23 60.1 ± 2.2 55.6 ± 2.9 37.4 ± 2.9** 39.5 ± 1.5** 38.2 ± 2.3** 35.1 ± 1.9** Week 14 48.2 ± 1.9 47.7 ± 2.0 39.1 ± 2.6* 35.4 ± 1.6** 39.2 ± 1.4** 34.7 ± 0.9**
7-Pentoxyresorufin-O-dealkylase (PROD) (pmol/minute per mg microsomal protein) Day 23 8.4 ± 0.2 7.7 ± 0.3 5.7 ± 0.3** 5.5 ± 0.2** 5.7 ± 0.4** 4.9 ± 0.3** Week 14 8.8 ± 0.3 8.9 ± 0.6 7.0 ± 0.3** 6.6 ± 0.3** 7.2 ± 0.4** 6.3 ± 0.1**
UDP-Glucuronosyltransferase (UDP-GT) (pmol/minute per mg microsomal protein) Day 23 3.24 ± 0.14 3.11 ± 0.12 2.55 ± 0.15** 2.51 ± 0.13** 2.48 ± 0.12** 2.47 ± 0.11** Week 14 4.29 ± 0.23 3.81 ± 0.17 3.68 ± 0.19 3.46 ± 0.19* 3.71 ± 0.21* 3.47 ± 0.15**
Female n Day 23 10 10 10 10 10 10 Week 14 9 10 10 10 10 10
Microsomal protein (mg/mL)
Day 23 10.32 ± 0.28 10.58 ± 0.21 16.84 ± 0.84** 17.74 ± 0.43** 18.01 ± 0.20** 18.60 ± 0.41** Week 14 14.88 ± 1.03 15.37 ± 0.67 17.79 ± 0.85* 18.96 ± 0.75** 18.69 ± 0.59** 19.46 ± 0.63**
Acetanilide-4-hydroxylase (A4H) (nmol/minute per mg microsomal protein) Day 23 0.787 ± 0.041 0.739 ± 0.033 0.399 ± 0.049** 0.371 ± 0.024** 0.361 ± 0.015** 0.336 ± 0.010** Week 14 0.763 ± 0.055 0.716 ± 0.035 0.613 ± 0.025* 0.581 ± 0.032** 0.595 ± 0.022** 0.586 ± 0.039**
7-Ethoxyresorufin-O-deethylase (EROD) (pmol/minute per mg microsomal protein) Day 23 59.0 ± 2.0 57.8 ± 1.4 34.1 ± 2.3** 34.9 ± 2.3** 32.4 ± 2.0** 30.7 ± 2.8** Week 14 63.2 ± 2.1 58.9 ± 2.3 52.3 ± 2.6** 48.6 ± 1.8** 51.3 ± 0.9** 47.8 ± 2.1**
7-Pentoxyresorufin-O-dealkylase (PROD) (pmol/minute per mg microsomal protein) Day 23 6.1 ± 0.3 5.6 ± 0.3 3.2 ± 0.3** 3.7 ± 0.2** 3.3 ± 0.2** 3.0 ± 0.2** Week 14 6.4 ± 0.2 6.3 ± 0.3 4.8 ± 0.3** 5.1 ± 0.2** 5.5 ± 0.3** 5.2 ± 0.2**
UDP-Glucuronosyltransferase (UDP-GT) (pmol/minute per mg microsomal protein) Day 23 3.25 ± 0.16 3.25 ± 0.13 2.50 ± 0.21** 2.72 ± 0.14* 2.66 ± 0.20* 2.73 ± 0.19* Week 14 4.48 ± 0.16 4.72 ± 0.13 4.44 ± 0.21 4.11 ± 0.11 4.23 ± 0.18 4.18 ± 0.13
* Significantly different (P≤0.05) from the vehicle control group by Shirley’s test ** P≤0.01 a Data are given as mean ± standard error. Statistical tests are performed on unrounded data.

Tetrabromobisphenol A-bis(2,3-dibromopropyl ether), NTP TOX 85 F-3
TABLE F2 Microsomal Protein Concentration and Liver Enzyme Activities for Mice in the 3-Month Gavage Study of Tetrabromobisphenol A-bis(2,3-dibromopropyl ether)a
Vehicle Control
125 mg/kg
250 mg/kg
500 mg/kg
1,000 mg/kg
2,000 mg/kg
Male n 10 10 10 10 10 10 Microsomal protein (mg/mL)
Week 14 11.65 ± 0.98 13.93 ± 0.92 18.10 ± 0.93** 21.98 ± 1.46** 20.21 ± 1.05** 21.35 ± 1.00** Acetanilide-4-hydroxylase (A4H) (nmol/minute per mg microsomal protein)
Week 14 0.961 ± 0.062 0.838 ± 0.076 0.601 ± 0.044** 0.558 ± 0.033** 0.514 ± 0.033** 0.532 ± 0.030** 7-Ethoxyresorufin-O-deethylase (EROD) (pmol/minute per mg microsomal protein)
Week 14 183.1 ± 6.2 167.7 ± 9.8 132.0 ± 8.6** 116.3 ± 4.5** 103.8 ± 5.4** 108.5 ± 3.8** 7-Pentoxyresorufin-O-dealkylase (PROD) (pmol/minute per mg microsomal protein)
Week 14 8.7 ± 0.3 7.1 ± 0.4** 5.4 ± 0.2** 5.2 ± 0.2** 4.5 ± 0.2** 4.1 ± 0.2** UDP-Glucuronosyltransferase (UDP-GT) (pmol/minute per mg microsomal protein)
Week 14 2.14 ± 0.09 2.08 ± 0.16 1.96 ± 0.13 1.88 ± 0.13 1.77 ± 0.11 1.85 ± 0.12
Female n 10 10 10 10 9 10
Microsomal protein (mg/mL) Week 14 12.42 ± 0.50 14.91 ± 1.93 18.37 ± 1.16** 21.02 ± 0.67** 23.74 ± 1.63** 22.52 ± 1.12**
Acetanilide-4-hydroxylase (A4H) (nmol/minute per mg microsomal protein) Week 14 0.657 ± 0.047 0.544 ± 0.041 0.378 ± 0.027** 0.393 ± 0.015** 0.389 ± 0.028** 0.331 ± 0.015**
7-Ethoxyresorufin-O-deethylase (EROD) (pmol/minute per mg microsomal protein) Week 14 149.8 ± 9.7 129.0 ± 10.8 93.8 ± 5.4** 110.4 ± 4.7** 98.5 ± 6.2** 89.4 ± 3.3**
7-Pentoxyresorufin-O-dealkylase (PROD) (pmol/minute per mg microsomal protein) Week 14 14.5 ± 0.9 12.0 ± 1.1 8.8 ± 0.6** 9.2 ± 0.4** 8.8 ± 0.5** 7.8 ± 0.3**
UDP-Glucuronosyltransferase (UDP-GT) (pmol/minute per mg microsomal protein) Week 14 3.54 ± 0.23 3.20 ± 0.19 2.42 ± 0.18** 2.49 ± 0.17** 2.44 ± 0.17** 2.38 ± 0.13**
** Significantly different (P≤0.01) from the vehicle control group by Shirley’s test a Data are given as mean ± standard error. Statistical tests are performed on unrounded data.

F-4 Tetrabromobisphenol A-bis(2,3-dibromopropyl ether), NTP TOX 85

G-1
APPENDIX G CHEMICAL CHARACTERIZATION
AND DOSE FORMULATION STUDIES
PROCUREMENT AND CHARACTERIZATION ............................................................................................................. G-2 PREPARATION AND ANALYSIS OF DOSE FORMULATIONS ...................................................................................... G-3 FIGURE G1 Infrared Absorption Spectrum of Tetrabromobisphenol A-bis(2,3-dibromopropyl ether) ....... G-4 FIGURE G2 Proton Nuclear Magnetic Resonance Spectrum of Tetrabromobisphenol A-bis(2,3-dibromopropyl ether) ............................................................ G-5 TABLE G1 Preparation and Storage of Dose Formulations in the 3-Month Gavage Studies of Tetrabromobisphenol A-bis(2,3-dibromopropyl ether) ............................................................. G-6 TABLE G2 Results of Analyses of Dose Formulations Administered to Rats and Mice in the 3-Month Gavage Studies of Tetrabromobisphenol A-bis(2,3-dibromopropyl ether) ............................................................. G-7

G-2 Tetrabromobisphenol A-bis(2,3-dibromopropyl ether), NTP TOX 85
CHEMICAL CHARACTERIZATION AND DOSE FORMULATION STUDIES
PROCUREMENT AND CHARACTERIZATION Tetrabromobisphenol A-bis(2,3-dibromopropyl ether) Tetrabromobisphenol A-bis(2,3-dibromopropyl ether) was obtained from Great Lakes Chemical Corporation (West Lafayette, IN) in one lot (534106) that was used during the 3-month studies. Identity and purity analyses were conducted by the analytical chemistry laboratory at Midwest Research Institute (Kansas City, MO). The study laboratory at Battelle Columbus Operations (Columbus, OH) conducted additional identity analyses and confirmed purity. Reports on analyses performed in support of the tetrabromobisphenol A-bis(2,3-dibromopropyl ether) studies are on file at the National Institute of Environmental Health Sciences. Lot 534106 of the test chemical, a white powder, was identified as tetrabromobisphenol A-bis(2,3-dibromopropyl ether) by the analytical chemistry laboratory using infrared (IR) and proton nuclear magnetic resonance (NMR) spectroscopy. The study laboratory confirmed the identity of the test article using IR spectroscopy. All spectra were consistent with the literature spectra of tetrabromobisphenol A-bis(2,3-dibromopropyl ether) (Sadtler, 1984a,b). Representative IR and NMR spectra are presented in Figures G1 and G2, respectively. For lot 534106, the analytical chemistry laboratory determined the melting point using differential scanning calorimetry (DSC) and the purity profile using high-performance liquid chromatography (HPLC) with ultraviolet (UV) detection; in addition, the analytical chemistry laboratory determined the tentative identity of a single impurity using liquid chromatography (LC) coupled with mass spectrometry (MS). DSC was conducted with a Perkin Elmer Diamond Differential Scanning Calorimeter (Perkin Elmer, Waltham, MA), an indium reference, and a heating ramp from 25° to 300° C at 10° C per minute after an initial 1 minute hold. HPLC/UV was conducted using system A, and LC/MS was conducted using system A coupled with an MS detector (Micromass Quattro LC Dual Quadrupole, Waters Corporation, Milford, MA) operated in full scan mode with negative atmospheric pressure chemical ionization.
A) The HPLC system included a liquid chromatograph (Waters Corporation), an Inertsil® ODS-2, 250 mm × 4.6 mm, 5 μm particle size column (Alltech Associates, Inc., Deerfield, IL), an isocratic mobile phase of 90:10 acetonitrile with 0.5% acetic acid:18 mM aqueous ammonium acetate with 0.5% acetic acid, UV detection at 280 nm, and a flow rate of 1 mL/minute.
Melting point analysis by DSC indicated that lot 534106 of the test article contained impurities. Purity profile analysis by HPLC/UV detected 12 reportable impurities with a total relative peak area of approximately 5.8%. One impurity (approximately 2% relative to the total peak area) was tentatively identified as 1,3-dibromo-2-{[(2E)-3-bromoprop-2-en-1-yl]oxy}-5-{1-[3,5-dibromo-4-(2,3-dibromopropoxy)phenyl]-1-methylethyl}benzene by LC/MS. The overall purity of lot 534106 was determined to be approximately 94%. To ensure stability, the bulk chemical was stored at room temperature (~25° C) in amber glass bottles. Periodic reanalyses of the bulk chemical were performed by the study laboratory during the 3-month studies using HPLC/UV by system A, and no degradation of the test article was detected. Corn Oil Corn oil was obtained in two lots (UU0854 and UW0493) from Spectrum Chemicals and Laboratory Products (Gardena, CA) and was used as the vehicle in the 3-month studies. Periodic analyses of the corn oil vehicle performed by the study laboratory using potentiometric titration demonstrated peroxide concentrations less than the rejection level of 3 mEq/kg.

Tetrabromobisphenol A-bis(2,3-dibromopropyl ether), NTP TOX 85 G-3
PREPARATION AND ANALYSIS OF DOSE FORMULATIONS The dose formulations were prepared four times by mixing tetrabromobisphenol A-bis(2,3-dibromopropyl ether) with corn oil to give the required concentrations (Table G1). The dose formulations were stored in sealed clear glass bottles enclosed in amber plastic bags at room temperature and used within 41 days. Homogeneity studies of 1.0 and 600 mg/mL formulations, and stability studies of the 1.0 mg/mL formulation were performed by the analytical chemistry laboratory using HPLC/UV by system B; the study laboratory used the same analytical system to perform additional homogeneity studies of 12.5, 25, 50, 400, and 800 mg/mL formulations and a gavageability study of a 200 mg/mL dose formulation.
B) The HPLC system included a liquid chromatograph (Waters Corporation or Agilent Inc., Palo Alto, CA), an Inertsil C18, 250 mm × 4.6 mm, 5 μm particle size column (Alltech Associates, Inc.), an isocratic mobile phase of 95:5 acetonitrile:water, with UV detection at 280 nm, and a flow rate of 1.0 mL/minute.
Homogeneity was deemed acceptable for all of the formulations; stability was confirmed for at least 42 days for dose formulations stored in sealed glass containers at temperatures up to 25° C, and for 3 hours under simulated animal room conditions. Gavageability of the 200 mg/mL dose formulation was confirmed by the study laboratory. Periodic analyses of the dose formulations of tetrabromobisphenol A-bis(2,3-dibromopropyl ether) were conducted by the study laboratory using HPLC/UV by system B. During the 3-month studies, the dose formulations were analyzed three times; 14 of the 15 dose formulations for rats and mice were within 10% of the target concentrations (Table G2). Animal room samples of these dose formulations were also analyzed; 14 of 18 animal room samples for rats and 12 of 15 for mice were within 10% of the target concentrations.

G-4 Tetrabromobisphenol A-bis(2,3-dibromopropyl ether), NTP TOX 85
FIGURE G1 Infrared Absorption Spectrum of Tetrabromobisphenol A-bis(2,3-dibromopropyl ether)
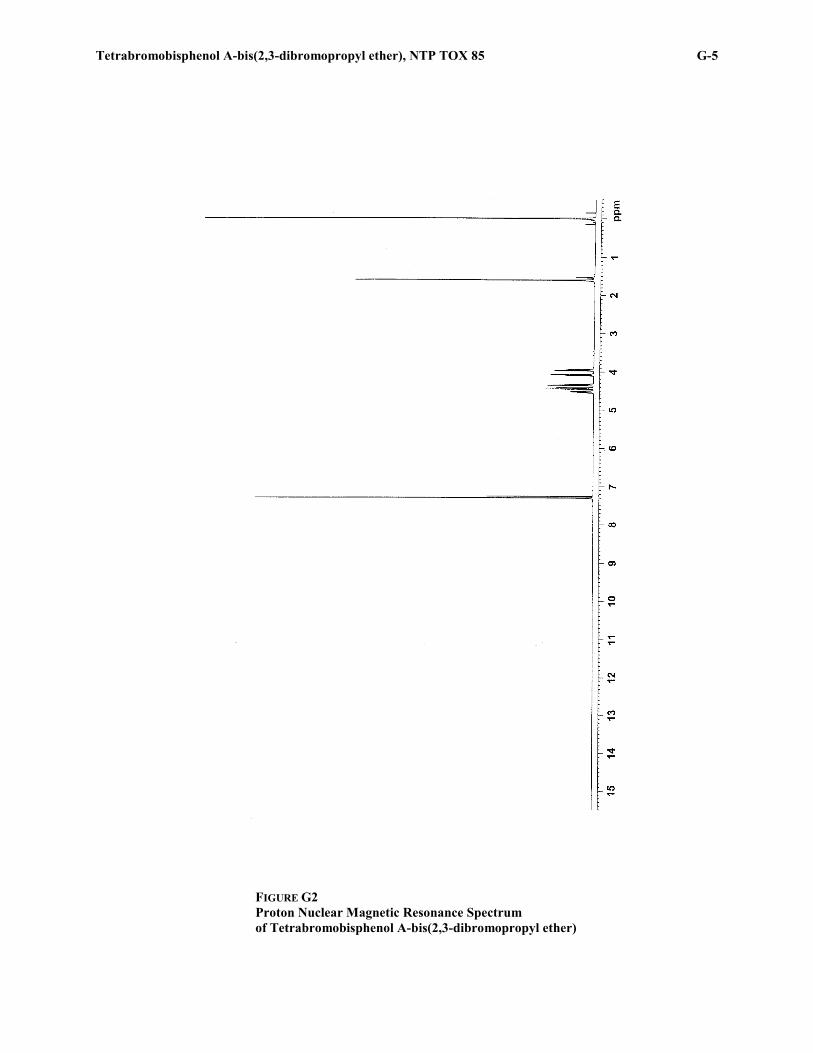
Tetrabromobisphenol A-bis(2,3-dibromopropyl ether), NTP TOX 85 G-5
FIGURE G2 Proton Nuclear Magnetic Resonance Spectrum of Tetrabromobisphenol A-bis(2,3-dibromopropyl ether)

G-6 Tetrabromobisphenol A-bis(2,3-dibromopropyl ether), NTP TOX 85
TABLE G1 Preparation and Storage of Dose Formulations in the 3-Month Gavage Studies of Tetrabromobisphenol A-bis(2,3-dibromopropyl ether)
Preparation Dose formulations were prepared by adding the appropriate weight of tetrabromobisphenol A-bis(2,3-dibromopropyl ether) directly into an appropriate sized glass beaker, adding enough corn oil to wet the test article, and stirring with a spatula to form a smooth slurry. The spatula and sides of the beaker were rinsed with corn oil, and the beaker contents were diluted to final volume with corn oil and stirred using an overhead stirrer with a vigorous vortex for approximately 15 minutes; during this mixing, the bottom of the beaker was periodically scraped with a spatula to ensure that the test article did not stick to it. Dose formulations were prepared four times. Chemical Lot Number 534106 Maximum Storage Time 42 days Storage Conditions Stored in sealed clear glass bottles in amber plastic bags at 25° C. Study Laboratory Battelle Columbus Operations (Columbus, OH)

Tetrabromobisphenol A-bis(2,3-dibromopropyl ether), NTP TOX 85 G-7
TABLE G2 Results of Analyses of Dose Formulations Administered to Rats and Mice in the 3-Month Gavage Studies of Tetrabromobisphenol A-bis(2,3-dibromopropyl ether)
Date Prepared
Date Analyzed
Target
Concentration (mg/mL)
Determined
Concentrationa (mg/mL)
Difference
from Target (%)
Rats and Mice December 28, 2005b January 4-5, 2006 12.5 12.23 –2 50 48.29 –3 100 100.3 0 200 191.4 –4 January 6, 2006 January 6, 2006 25 25.15 +1 February 20, 2006 February 22-23, 2006 12.5 10.89c –13 25 23.48 –6 50 49.61 –1 100 89.98 –10 200 184.8 –8 March 16, 2006 March 17-18, 2006 12.5 12.45 0 25 24.85 –1 50 46.15 –8 100 94.33 –6 200 197.7 –1 Animal Room Samples Rats December 28, 2005b February 3-4, 2006 12.5 11.84 –5 50 45.96 –8 100 91.16 –9 200 194.9 –3 January 6, 2006 January 6, 2006 25 24.63 –1 February 20, 2006 March 29-30, 2006 12.5 11.92 –5 25 24.16 –3 50 47.96 –4 100 91.77 –8 200 182.8 –9 March 16, 2006 April 18-19, 2006 12.5 14.14 +13 25 25.97 +4 50 78.64d +57 50 44.56e –11 100 92.49 –8 200 186.7 –7 May 12, 2006 12.5 11.82f –5 50 43.85f –12

G-8 Tetrabromobisphenol A-bis(2,3-dibromopropyl ether), NTP TOX 85
TABLE G2 Results of Analyses of Dose Formulations Administered to Rats and Mice in the 3-Month Gavage Studies of Tetrabromobisphenol A-bis(2,3-dibromopropyl ether)
Date Prepared
Date Analyzed
Target
Concentration (mg/mL)
Determined
Concentration (mg/mL)
Difference
from Target (%)
Animal Room Samples (continued) Mice December 28, 2005b February 3-4, 2006 12.5 13.01 +4 50 50.53 +1 100 91.09 –9 200 193.6 –3 January 6, 2006 January 6, 2006 25 25.09 0 February 20, 2006 March 29-30, 2006 12.5 12.09 –3 25 23.95 –4 50 48.26 –3 100 94.36 –6 200 183.7 –8 March 16, 2006 April 18-19, 2006 12.5 14.87 +19 25 30.33 +21 50 56.26 +13 100 92.34 –8 200 183.6 –8
a Results of duplicate analyses. For rats, dosing volume=5 mL/kg; 12.5 mg/mL=62.5 mg/kg, 25 mg/mL=125 mg/kg, 50 mg/mL=250 mg/kg, 100 mg/mL=500 mg/kg, 200 mg/mL=1,000 mg/kg. For mice, dosing volume=10 mL/kg; 12.5 mg/mL=125 mg/kg, 25 mg/mL=250 mg/kg, 50 mg/mL=500 mg/kg, 100 mg/mL=1,000 mg/kg, 200 mg/mL=2,000 mg/kg.
b The 25 mg/mL formulation prepared on December 28, 2005, was replaced by one prepared on January 6, 2006, due to a preparation error. c Formulation was outside the acceptable range of ±10% of target concentration, but used at NTP’s direction. d Results indicated that this formulation was not adequately resuspended prior to sampling. e Two additional replicates were prepared from the same 50 mg/mL formulation, analyzed, and had peak responses that were closer to meeting
the acceptance criterion. f Because sufficient volume of this dose formulation remained, NTP directed that it be resampled and reanalyzed.
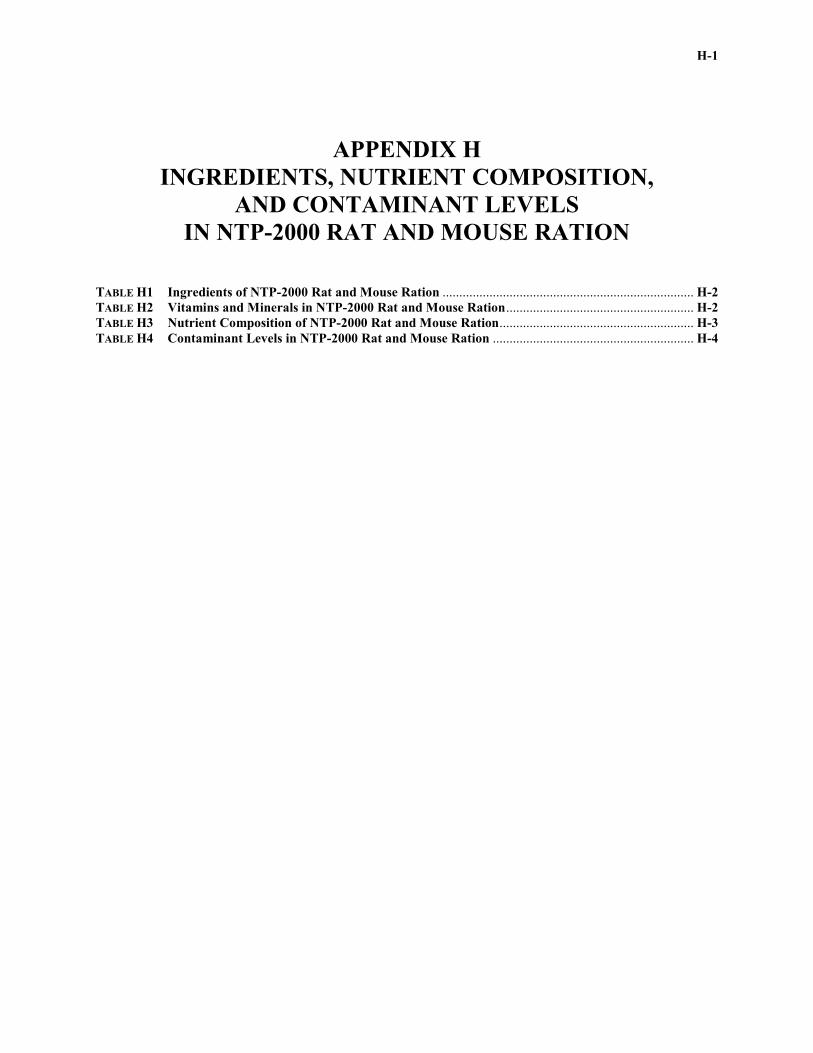
H-1
APPENDIX H INGREDIENTS, NUTRIENT COMPOSITION,
AND CONTAMINANT LEVELS IN NTP-2000 RAT AND MOUSE RATION
TABLE H1 Ingredients of NTP-2000 Rat and Mouse Ration ........................................................................... H-2 TABLE H2 Vitamins and Minerals in NTP-2000 Rat and Mouse Ration ........................................................ H-2 TABLE H3 Nutrient Composition of NTP-2000 Rat and Mouse Ration .......................................................... H-3 TABLE H4 Contaminant Levels in NTP-2000 Rat and Mouse Ration ............................................................ H-4
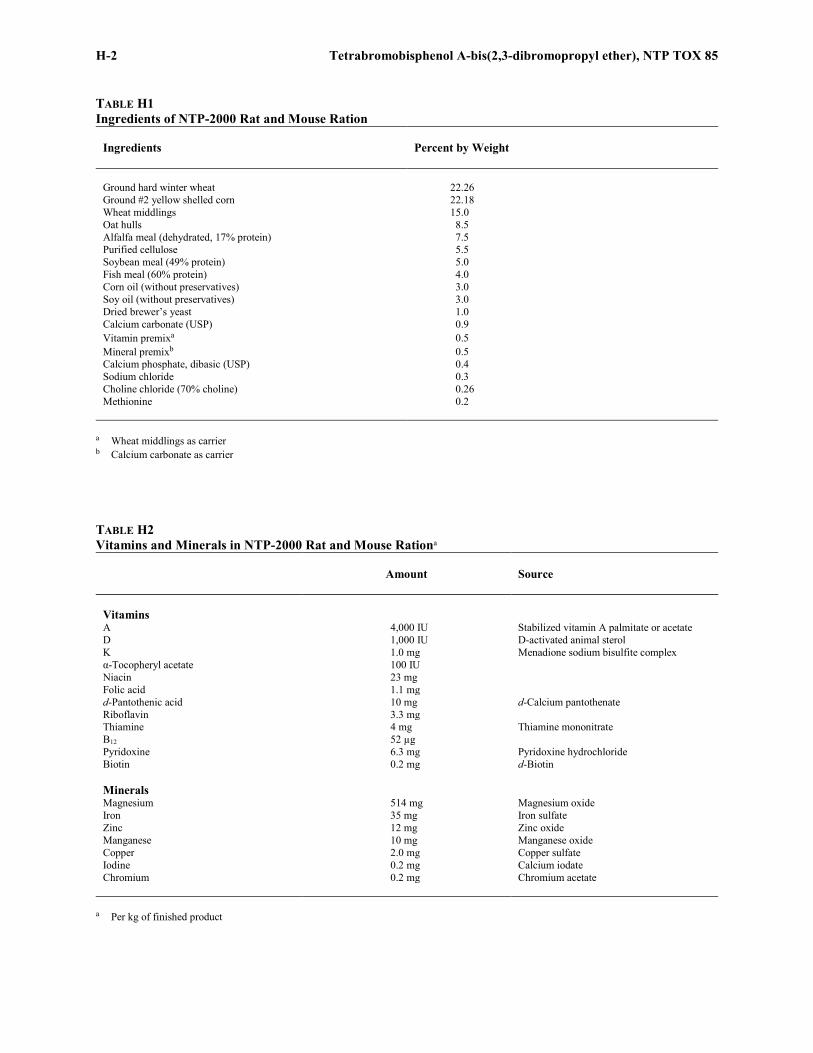
H-2 Tetrabromobisphenol A-bis(2,3-dibromopropyl ether), NTP TOX 85
TABLE H1 Ingredients of NTP-2000 Rat and Mouse Ration
Ingredients
Percent by Weight
Ground hard winter wheat 22.26 Ground #2 yellow shelled corn 22.18 Wheat middlings 15.0 Oat hulls 8.5 Alfalfa meal (dehydrated, 17% protein) 7.5 Purified cellulose 5.5 Soybean meal (49% protein) 5.0 Fish meal (60% protein) 4.0 Corn oil (without preservatives) 3.0 Soy oil (without preservatives) 3.0 Dried brewer’s yeast 1.0 Calcium carbonate (USP) 0.9 Vitamin premixa 0.5 Mineral premixb 0.5 Calcium phosphate, dibasic (USP) 0.4 Sodium chloride 0.3 Choline chloride (70% choline) 0.26 Methionine 0.2
a Wheat middlings as carrier b Calcium carbonate as carrier
TABLE H2 Vitamins and Minerals in NTP-2000 Rat and Mouse Rationa
Amount
Source
Vitamins A 4,000 IU Stabilized vitamin A palmitate or acetate D 1,000 IU D-activated animal sterol K 1.0 mg Menadione sodium bisulfite complex α-Tocopheryl acetate 100 IU Niacin 23 mg Folic acid 1.1 mg d-Pantothenic acid 10 mg d-Calcium pantothenate Riboflavin 3.3 mg Thiamine 4 mg Thiamine mononitrate B12 52 µg Pyridoxine 6.3 mg Pyridoxine hydrochloride Biotin 0.2 mg d-Biotin Minerals Magnesium 514 mg Magnesium oxide Iron 35 mg Iron sulfate Zinc 12 mg Zinc oxide Manganese 10 mg Manganese oxide Copper 2.0 mg Copper sulfate Iodine 0.2 mg Calcium iodate Chromium 0.2 mg Chromium acetate
a Per kg of finished product

Tetrabromobisphenol A-bis(2,3-dibromopropyl ether), NTP TOX 85 H-3
TABLE H3 Nutrient Composition of NTP-2000 Rat and Mouse Ration
Nutrient
Mean ± Standard Deviation
Range
Number of Samples
Protein (% by weight) 14.4 ± 0.71 13.5 – 15.2 4 Crude fat (% by weight) 8.1 ± 0.14 8.0 – 8.3 4 Crude fiber (% by weight) 9.3 ± 0.57 8.7 – 10.0 4 Ash (% by weight) 5.2 ± 0.22 4.9 – 5.4 4 Amino Acids (% of total diet) Arginine 0.783 ± 0.070 0.670 – 0.970 22 Cystine 0.220 ± 0.024 0.150 – 0.250 22 Glycine 0.701 ± 0.041 0.620 – 0.800 22 Histidine 0.352 ± 0.077 0.270 – 0.680 22 Isoleucine 0.546 ± 0.044 0.430 – 0.660 22 Leucine 1.095 ± 0.067 0.960 – 1.240 22 Lysine 0.711 ± 0.114 0.310 – 0.860 22 Methionine 0.409 ± 0.046 0.260 – 0.490 22 Phenylalanine 0.628 ± 0.040 0.540 – 0.720 22 Threonine 0.505 ± 0.043 0.430 – 0.610 22 Tryptophan 0.150 ± 0.028 0.110 – 0.200 22 Tyrosine 0.401 ± 0.061 0.280 – 0.540 22 Valine 0.665 ± 0.043 0.550 – 0.730 22 Essential Fatty Acids (% of total diet) Linoleic 3.95 ± 0.259 3.49 – 4.55 22 Linolenic 0.30 ± 0.032 0.21 – 0.35 22 Vitamins Vitamin A (IU/kg) 3,490 ± 43 3,150 – 4,090 4 Vitamin D (IU/kg) 1,000a α-Tocopherol (ppm) 80.6 ± 22.03 27.0 – 124.0 22 Thiamine (ppm)b 6.5 ± 0.22 6.3 – 6.8 4 Riboflavin (ppm) 7.6 ± 2.89 4.20 – 17.50 22 Niacin (ppm) 78.9 ± 9.08 66.4 – 98.2 22 Pantothenic acid (ppm) 26.9 ± 12.63 17.4 – 81.0 22 Pyridoxine (ppm)b 9.54 ± 1.99 6.44 – 13.7 22 Folic acid (ppm) 1.62 ± 0.48 1.15 – 3.27 22 Biotin (ppm) 0.32 ± 0.10 0.20 – 0.704 22 Vitamin B12 (ppb) 53.6 ± 39.6 18.3 – 174.0 22 Choline (ppm)b 2,846 ± 485 1,820 – 3,790 22 Minerals Calcium (%) 0.991 ± 0.062 0.938 – 1.080 4 Phosphorus (%) 0.585 ± 0.020 0.566 – 0.607 4 Potassium (%) 0.666 ± 0.030 0.626 – 0.733 22 Chloride (%) 0.386 ± 0.039 0.300 – 0.474 22 Sodium (%) 0.189 ± 0.016 0.160 – 0.222 22 Magnesium (%) 0.216 ± 0.062 0.185 – 0.490 22 Sulfur (%) 0.170 ± 0.029 0.116 – 0.209 14 Iron (ppm) 186 ± 39.2 135 – 311 22 Manganese (ppm) 51.4 ± 10.28 21.0 – 73.1 22 Zinc (ppm) 53.4 ± 8.46 43.3 – 78.5 22 Copper (ppm) 7.01 ± 2.562 3.21 – 16.3 22 Iodine (ppm) 0.503 ± 0.206 0.158 – 0.972 22 Chromium (ppm) 0.694 ± 0.276 0.330 – 1.380 22 Cobalt (ppm) 0.256 ± 0.164 0.098 – 0.864 20
a From formulation b As hydrochloride (thiamine and pyridoxine) or chloride (choline)
.

H-4 Tetrabromobisphenol A-bis(2,3-dibromopropyl ether), NTP TOX 85
TABLE H4 Contaminant Levels in NTP-2000 Rat and Mouse Rationa
Mean ± Standard Deviationb
Range
Number of Samples
Contaminants Arsenic (ppm) 0.28 ± 0.073 0.20 – 0.38 4 Cadmium (ppm) 0.05 ± 0.009 0.04 – 0.07 4 Lead (ppm) 0.09 ± 0.005 0.09 – 0.09 4 Mercury (ppm) <0.02 4 Selenium (ppm) 0.41 ± 0.044 0.38 – 0.48 4 Aflatoxins (ppb) <5.00 4 Nitrate nitrogen (ppm)c 21.3 ± 3.08 16.8 – 23.7 4 Nitrite nitrogen (ppm)c 2.50 ± 1.56 0.30 – 3.86 4 BHA (ppm)d <1.0 4 BHT (ppm)d <1.0 4 Aerobic plate count (CFU/g) 10 ± 0.0 10 4 Coliform (MPN/g) 3.0 ± 0.0 3.0 4 Escherichia coli (MPN/g) <10 4 Salmonella (MPN/g) Negative 4 Total nitrosoamines (ppb)e 6.9 ± 2.07 5.3 – 9.9 4 N-Nitrosodimethylamine (ppb)e 4.1 ± 1.54 2.9 – 6.3 4 N-Nitrosopyrrolidine (ppb)e 2.8 ± 0.85 1.8 – 3.6 4 Pesticides (ppm) α-BHC <0.01 22 β-BHC <0.02 22 γ-BHC <0.01 22 δ-BHC <0.01 22 Heptachlor <0.01 22 Aldrin <0.01 22 Heptachlor epoxide <0.01 22 DDE <0.01 22 DDD <0.01 22 DDT <0.01 22 HCB <0.01 22 Mirex <0.01 22 Methoxychlor <0.05 22 Dieldrin <0.01 22 Endrin <0.01 22 Telodrin <0.01 22 Chlordane <0.05 22 Toxaphene <0.10 22 Estimated PCBs <0.20 22 Ronnel <0.01 22 Ethion <0.02 22 Trithion <0.05 22 Diazinon <0.10 22 Methyl chlorpyrifos 0.096 ± 0.070 0.035 – 0.186 4 Methyl parathion <0.02 22 Ethyl parathion <0.02 22 Malathion 0.285 ± 0.248 0.020 – 0.619 4 Endosulfan I <0.01 22 Endosulfan II <0.01 22 Endosulfan sulfate <0.03 22
a All samples were irradiated. CFU=colony-forming units; MPN=most probable number; BHC=hexachlorocyclohexane or benzene hexachloride b For values less than the limit of detection, the detection limit is given as the mean. c Sources of contamination: alfalfa, grains, and fish meal d Sources of contamination: soy oil and fish meal e All values were corrected for percent recovery.

I-1
APPENDIX I SENTINEL ANIMAL PROGRAM
METHODS ................................................................................................................................................................... I-2 RESULTS ..................................................................................................................................................................... I-2

I-2 Tetrabromobisphenol A-bis(2,3-dibromopropyl ether), NTP TOX 85
SENTINEL ANIMAL PROGRAM
METHODS Rodents used in the National Toxicology Program are produced in optimally clean facilities to eliminate potential pathogens that may affect study results. The Sentinel Animal Program is part of the periodic monitoring of animal health that occurs during the toxicological evaluation of compounds. Under this program, the disease state of the rodents is monitored via sera or feces from extra (sentinel) animals in the study rooms. The sentinel animals and the study animals are subject to identical environmental conditions. The sentinel animals come from the same production source and weanling groups as the animals used for the studies of test compounds. Blood samples were collected, allowed to clot, and the serum was separated. All samples were processed appropriately and tested at BioReliance Corporation (Rockville, MD) for determination of the presence of pathogens. The laboratory methods and agents for which testing was performed are tabulated below; the times at which samples were collected during the studies are also listed. Blood samples were collected from five male and five female rats and mice at each time point.
Method and Test Time of Collection RATS ELISA
PVM (pneumonia virus of mice) End of quarantine, 4 weeks, study termination RCV/SDA (rat coronavirus/sialodacryoadenitis virus) End of quarantine, 4 weeks, study termination Sendai End of quarantine, 4 weeks, study termination
Immunofluorescence Assay
Parvovirus End of quarantine, 4 weeks, study termination RCV/SDA End of quarantine, study termination
MICE ELISA
Ectromelia virus End of quarantine, 4 weeks, study termination EDIM (epizootic diarrhea of infant mice) End of quarantine, 4 weeks, study termination GDVII (mouse encephalomyelitis virus) End of quarantine, 4 weeks, study termination LCM (lymphocytic choriomeningitis virus) End of quarantine, 4 weeks, study termination Mouse adenoma virus-1 End of quarantine, 4 weeks, study termination MHV (mouse hepatitis virus) End of quarantine, 4 weeks, study termination MMV VP2 (mouse minute virus viral protein 2) End of quarantine, 4 weeks, study termination MPV VP2 (mouse parvovirus viral protein 2) End of quarantine, 4 weeks, study termination PVM End of quarantine, 4 weeks, study termination Reovirus 3 End of quarantine, 4 weeks, study termination Sendai End of quarantine, 4 weeks, study termination
RESULTS All test results were negative.