testing for conditional multiple marginal · pdf file1 testing for conditional multiple...
TRANSCRIPT

1
Testing for Conditional Multiple Marginal Independence
Christopher R. BilderDepartment of Statistics
Oklahoma State [email protected]
Thomas M. LoughinDepartment of Statistics Kansas State University
March 26, 2001

Christopher R. Bilder 2
What is CMMI?
Oral Condom L. Cond. Spermicide Diaphragm TotalNo 18 9 8 7 0 24Yes 8 9 2 3 2 14
38
Oral Condom L. Cond. Spermicide Diaphragm TotalNo 55 41 37 27 0 85Yes 75 68 33 22 5 116
201
UTI
UTI
Contraceptive
ContraceptiveAge<24
Age>=24
Conditional multiple marginal independence (CMMI)Survey of 239 college women
Contraceptive use and first time urinary tract infection (UTI)
LogXact 4 manual (p. 198-9) and Foxman et al. (1997)
Christopher R. Bilder 3
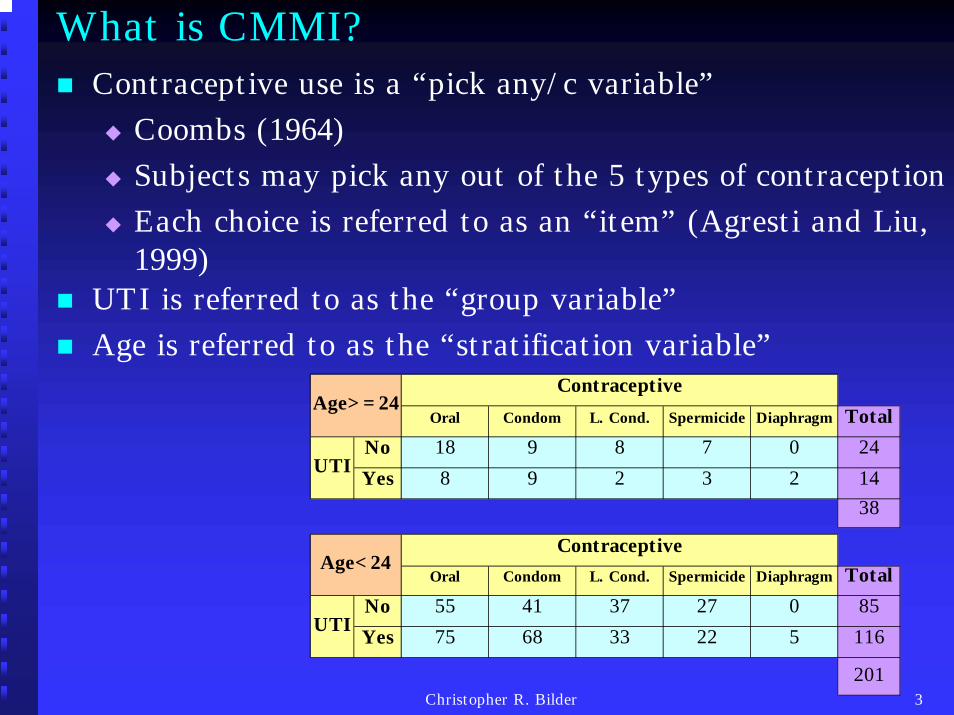
What is CMMI?Contraceptive use is a “pick any/c variable”
Coombs (1964)Subjects may pick any out of the 5 types of contraceptionEach choice is referred to as an “item” (Agresti and Liu, 1999)
Oral Condom L. Cond. Spermicide Diaphragm TotalNo 18 9 8 7 0 24Yes 8 9 2 3 2 14
38
Oral Condom L. Cond. Spermicide Diaphragm TotalNo 55 41 37 27 0 85Yes 75 68 33 22 5 116
201
UTI
UTI
Contraceptive
ContraceptiveAge<24
Age>=24
UTI is referred to as the “group variable”Age is referred to as the “stratification variable”

Christopher R. Bilder 4
What is CMMI?
Oral Condom L. Cond. Spermicide Diaphragm Total
No 18 (0.75) 9 (0.38) 8 (0.33) 7 (0.29) 0 (0.00) 24
Yes 8 (0.57) 9 (0.64) 2 (0.14) 3 (0.21) 2 (0.14) 14
38
Oral Condom L. Cond. Spermicide Diaphragm Total
No 55 (0.65) 41 (0.48) 37 (0.44) 27 (0.32) 0 (0.00) 85
Yes 75 (0.65) 68 (0.59) 33 (0.28) 22 (0.19) 5 (0.04) 116
201
UTI
Age>=24Contraceptive
UTI
Age<24Contraceptive
Hypothesis test for CMMI Are the contraception practices of college women marginally independent of their UTI history, controlling for age?
Observed proportion of women selecting an item is in parentheses

Christopher R. Bilder 5
What is CMMI?Hypothesis test for CMMI
Let πj|ik=P(subject picks item j|subject is in group i and stratum k)
i=1,…,r denotes the group (row)j=1,…,c denotes the item (column)k=1,…,q denotes the stratum
Hypotheses (in general)Ho:πj|1k=πj|2k=…=πj|rk for j=1, …,c and k=1,…,qHa:At least one of the equalities does not hold
Cochran (1954) and Mantel and Haenszel (1959) tests should not be used
Need the pick any/c variable to be pick 1/c
Christopher R. Bilder 6
PurposeDerive test for CMMI
Extend Cochran’s statistic to include r×2×q tablesTest for conditional independence for each item
Sum c “extended Cochran” statistics to form a new statistic to test for CMMI
Approximations to its sampling distribution

Christopher R. Bilder 7
Multiple Marginal Independence (MMI)Special case of CMMI when the number of strata is 1Previous research
Umesh (1995)Loughin and Scherer (1998)Agresti and Liu (1998, 1999)Decady and Thomas (2000)Bilder, Loughin, and Nettleton (2000)
Conclude the best MMI testing methods are:• Bootstrapping the naïve chi-squared statistic • Bootstrapping p-value combination methods
Most consistently hold the correct size while providing power against various alternatives

Christopher R. Bilder 8
NotationFor subject s in row i, Ys(ik)j=1 if a positive response is given for item j and Ys(ik)j=0 for a negative response
s=1,…,nAll responses by subject s can be viewed as an item response vector, Ys(ik) = (Ys(ik)1, Ys(ik)2, …, Ys(ik)c)′.
h=1,…,2c different item response vectors
Let mijk = number of positive responses to item j in group i and stratum k
Then
Let nihk = number of observed subjects for the hth item response vector
Let nik=Independent multinomial sampling within each row of each stratum
j
ijk ihks s(ik)j{h:Y 1}
m Y n=
= =∑ ∑
c ci1k 1|iki2 k 2 |ik(n ,..., n ) Multinomial( ,..., )′ τ τ∼

Christopher R. Bilder 9
NotationExample 2×2×q table
j= 1 2 1 2 1 2
1 π1|11 π2|11 π1|12 π2|12 π1|1q π2|1q
2 π1|21 π2|21 π1|22 π2|22 π1|2q π2|2q
k=q
i=
k=2 …k=1
j= 1 2 1 2 1 2
1 m111 m121 m112 m122 m11q m12q
2 m211 m221 m212 m222 m21q m22q
m+11m+21 m+12 m+22 m+1qm+2q
k=q
i=
k=2 …k=1

Christopher R. Bilder 10
Extended Cochran Statistic - 2jC
Consider the jth item and examine the responses over the strata
Develop a test for conditional independence
Letq
j 1jk r 1,jkk 1
(m ,...,m )+ −=
′= ∑m
q 1 k jk r 1, k jkj
k 1 k k
n m n m,...,
n n+ + − + +
+= ++ ++
′⎛ ⎞⎟⎜= ⎟∑ ⎜ ⎟⎜ ⎟⎜⎝ ⎠m

Christopher R. Bilder 11
Let denote the estimated covariance matrix ofunder conditional independence with elements of
Extended Cochran Statistic -
q jki k jk i kijk i jk
k 1 k k
n mn mCov m ,m
n n
∧ ++ + ′+′
= ++ ++
⎛ ⎞⎟⎜ − − ⎟∑ ⎜ ⎟⎜ ⎟⎜⎝ ⎠
jV̂j j+ +−m m
2jC
q jk k jk i k kii i k3
k 1 k
m (n m )n ( n n )
n+ ++ + + ++′ ′+
= ++
− δ −= ∑
ii
1 if i iwhere
0 if i i′
⎧ ′=⎪⎪⎪δ = ⎨⎪ ′≠⎪⎪⎩

Christopher R. Bilder 12
Extended Cochran Statistic -C2j
The “Extended Cochran Statistic” is 2 1j j j j j j
ˆC ( ) ( )−+ + + +′= − −m m V m m
Under conditional independence as n→∞:
d2 2j r 1C −⎯⎯→χ
dj j jn ( ) N( , )−+ +− ⎯⎯→m m 0 V½
p1j j
ˆn− ⎯⎯→V V
ThenNotes:
simplifies to Cochran’s original statistic for 2×2×qSimilar to the Generalized Mantel-Haenszel test statistic
Landis, Heyman, and Koch (1978)Difference: Assumes a multiple hypergeometric distribution in each stratum.
2jC
Christopher R. Bilder 13
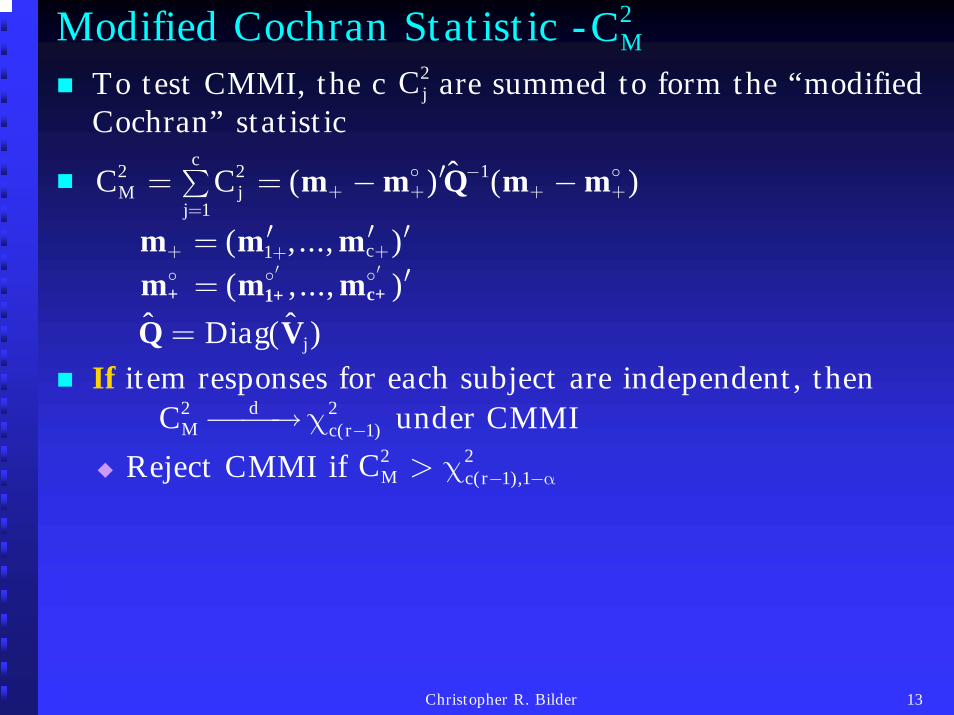
Modified Cochran Statistic -To test CMMI, the c are summed to form the “modified Cochran” statistic
2jC
c2 2 1
jMj 1
ˆC C ( ) ( )−+ + + +
=′= = − −∑ m m Q m m
c1( ,..., )+ ++′ ′ ′=m m m( ,..., )′ ′ ′=+ c+1+m m m
jˆ ˆDiag( )=Q V
If item responses for each subject are independent, thend2 2
M c(r 1)C under CMMI−⎯⎯→χReject CMMI if 2 2
M c(r 1),1C − −α> χ
2MC
Christopher R. Bilder 14
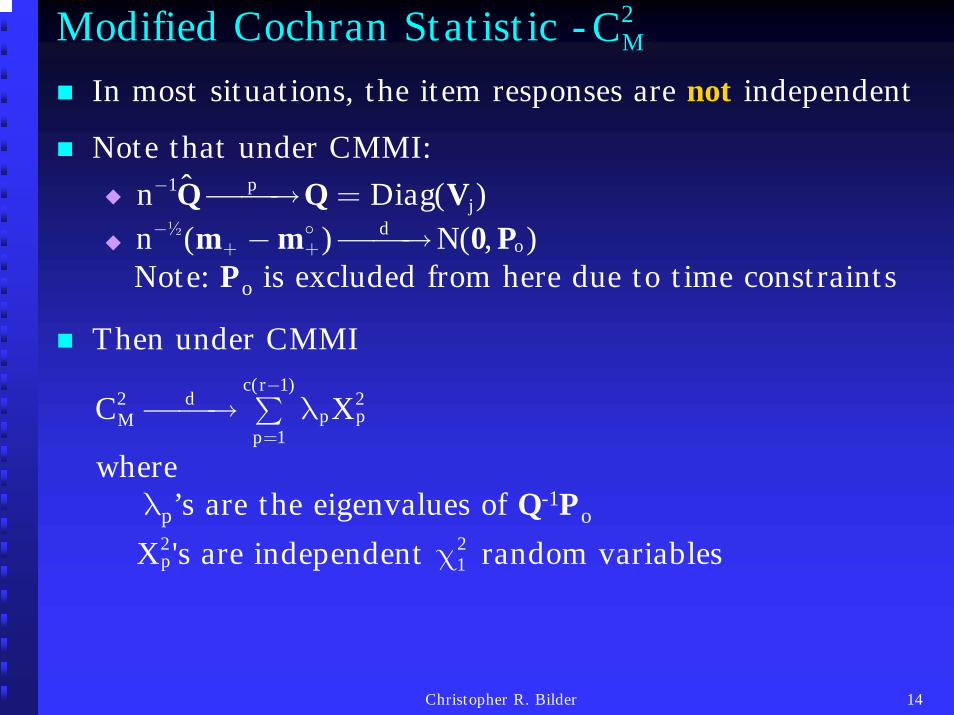
Modified Cochran Statistic - 2MC
In most situations, the item responses are not independent
Note that under CMMI:
Note: Po is excluded from here due to time constraints
don ( ) N( , )−
+ +− ⎯⎯→m m 0 P½
p1j
ˆn Diag( )− ⎯⎯→ =Q Q V
c(r 1)d2 2
p pMp 1
C X−
=⎯⎯→ λ∑
where λp’s are the eigenvalues of Q-1Po
2 2p 1X 's are independent random variablesχ
Then under CMMI

Christopher R. Bilder 15
Modified Cochran Statistic - 2MC
Nonparametric bootstrap Approximate sampling distribution of
2M(bootstrap C )
2MC
For each resample, calculate the test statistic, , for b=1,…,B
AlgorithmTake B resamples of size n by randomly selecting Ys(i)k= (Ys(ik)1, Ys(ik)2, …, Ys(ik)c)′ and group (row)designation independently with replacement from the original data within strata
( )c(r 1)
2 2M,b M
b 1
1 I C CB
∗−
=>∑
2M,bC∗
Calculate the p-value as
where I(A)=1 if event A occurs, 0 otherwise
Christopher R. Bilder 16
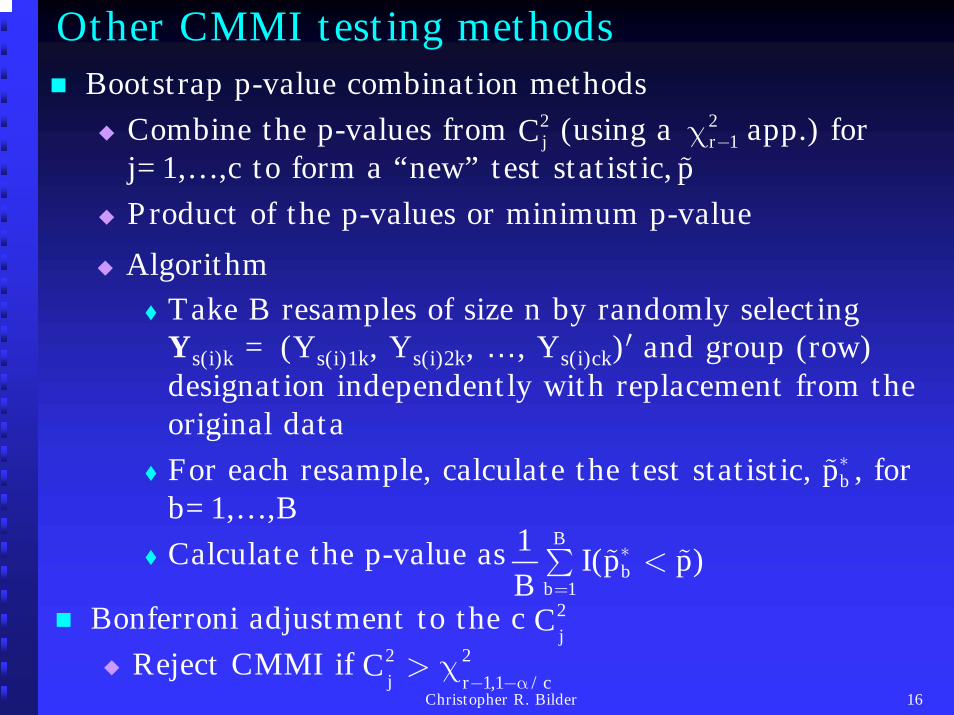
Other CMMI testing methods
AlgorithmTake B resamples of size n by randomly selecting Ys(i)k = (Ys(i)1k, Ys(i)2k, …, Ys(i)ck)′ and group (row)designation independently with replacement from the original dataFor each resample, calculate the test statistic, , for b=1,…,BCalculate the p-value as
Bootstrap p-value combination methodsCombine the p-values from (using a app.) for j=1,…,c to form a “new” test statistic,Product of the p-values or minimum p-value
B
bb 1
1 I(p p)B
∗
=<∑
p
bp∗
2jC 2
r 1−χ
Bonferroni adjustment to the cReject CMMI if 2 2
j r 1,1 /cC
− −α> χ
2jC

Christopher R. Bilder 17
UTI Data
Rejection may be due to Diaphragm and L.Cond.
CMMI Testing Method P-value
0.0005
Bootstrap 0.0058
Bootstrap prod. p-values 0.0330
Bootstrap min. p-values 0.0060
Bonferroni 0.0408
2 2M c(r-1)C using app.χ
2MC
Oral Condom L. Cond. Spermicide Diaphragm
0.20 3.87 6.42 4.51 7.00
Contraceptive
2jC =
21(0.99) 6.63χ =
Evidence against CMMI5,000 resamples

Christopher R. Bilder 18
CMMI Type I Error Simulations Estimated type I error rate
Proportion of data sets in which CMMI is incorrectly rejected
Data generated using an algorithm by Gange (1995)Specify πj|ik’s
Under CMMISpecify odds ratios (ORs)
)0Y|1Y(Odds)1Y|1Y(Odds
ORAB
ABAB ==
===
For each data set generated, the CMMI testing methods are applied

Christopher R. Bilder 19
CMMI Type I Error SimulationsSettings held constant for each simulation
Nominal type I error rate=0.05 500 data sets generated1,000 resamples for bootstrap methodsExpected range of estimated type I error rates for methods holding the nominal level:
(0.05)(1 0.05)0.05 2 0.05 0.0195500−± = ±
Trellis plots on next slide shows estimated type I error rates
Includes only the π1|ik=0.1, π2|ik=0.2, π3|ik=0.3, π4|ik=0.4, and π5|ik=0.5 cases for i=1,…,r and k=1,…,qResults generalize to other cases

Christopher R. Bilder 20
2MC
2MC
2MC
2MC
0.00
0.05
0.10
0.15
0.20
OR = All 2
OR = All 25
OR = 2(R1-3), 25(R4-5)
0.00
0.05
0.10
0.15
0.20
BonferroniBoot prod pBoot min pBoot
BonferroniBoot prod pBoot min pBoot
BonferroniBoot prod pBoot min pBoot
OR = All 2
OR = All 25
OR = 2(R1-3), 25(R4-5)
0.00
0.05
0.10
0.15
0.20
BonferroniBoot prod pBoot min p
Boot
BonferroniBoot prod pBoot min p
Boot
BonferroniBoot prod pBoot min p
Boot
OR = All 2
OR = All 25
OR = 2(R1) 25(R2)
5x5x2 5x5x525 50 100 20025 100 25 125 250 500
Estimated Type I Error Rate
2x5x5
2MC
2MC
2MC
2MC
2MC 2
MC2MC
2MC
2MC
2MC
2MC 2
MC2MC
•Bootstrap simulations are only run at n=25 and n=100 for 5×5×2 and n=25 and 250 for 5×5×5
•OR=2(R1) 25(R2) means all ORs are 2 for row 1 and 25 for row 25
Christopher R. Bilder 21
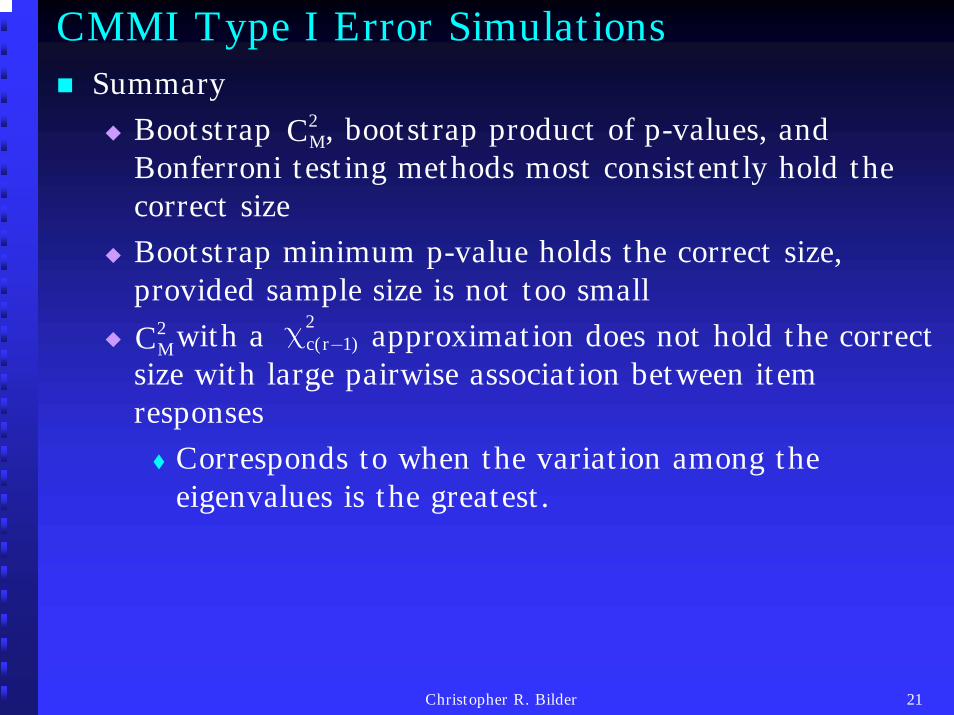
CMMI Type I Error SimulationsSummary
Bootstrap , bootstrap product of p-values, and Bonferroni testing methods most consistently hold the correct sizeBootstrap minimum p-value holds the correct size, provided sample size is not too small
with a approximation does not hold the correct size with large pairwise association between item responses
Corresponds to when the variation among the eigenvalues is the greatest.
2MC
2MC
2c(r 1) −χ
Christopher R. Bilder 22
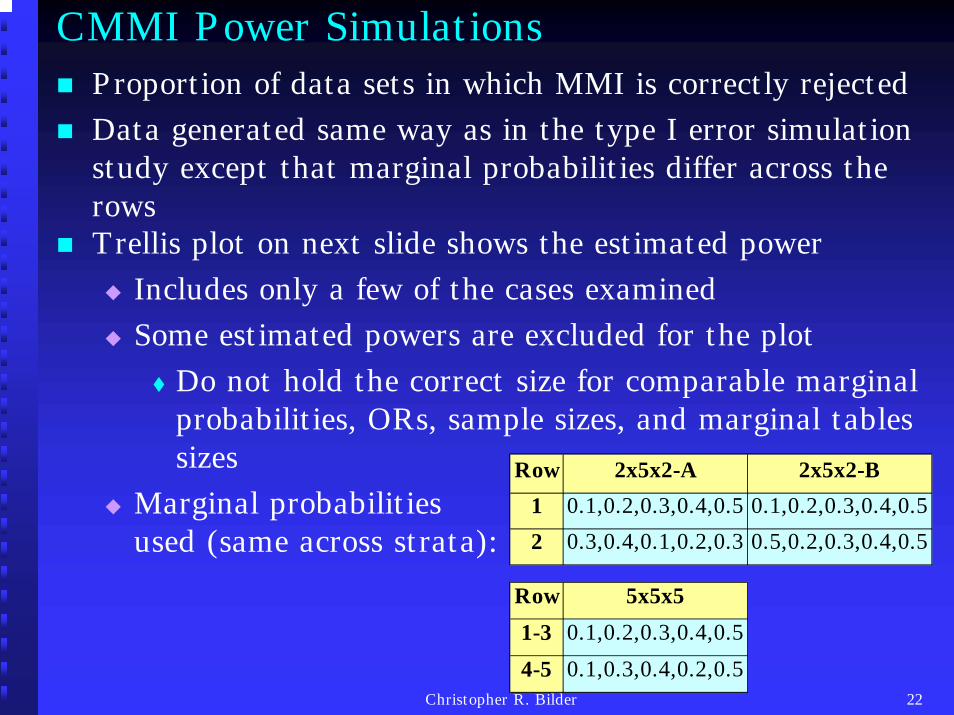
CMMI Power SimulationsProportion of data sets in which MMI is correctly rejectedData generated same way as in the type I error simulation study except that marginal probabilities differ across the rowsTrellis plot on next slide shows the estimated power
Includes only a few of the cases examinedSome estimated powers are excluded for the plot
Do not hold the correct size for comparable marginal probabilities, ORs, sample sizes, and marginal tables sizes
Marginal probabilities used (same across strata):
Row 2x5x2-A 2x5x2-B1 0.1,0.2,0.3,0.4,0.5 0.1,0.2,0.3,0.4,0.5
2 0.3,0.4,0.1,0.2,0.3 0.5,0.2,0.3,0.4,0.5
Row 5x5x51-3 0.1,0.2,0.3,0.4,0.5
4-5 0.1,0.3,0.4,0.2,0.5

Christopher R. Bilder 23
2MC 2
MC
Some estimated powers are excluded from the plot for methods that do not hold the correct size for comparable marginal probabilities, ORs, …
0.0
0.2
0.4
0.6
0.8
BonferroniBoot prod pBoot min pBoot
BonferroniBoot prod pBoot min pBoot
BonferroniBoot prod pBoot min pBoot
OR = All 2
OR = All 25
OR = 2(R1-3), 25(R4-5)
0.0
0.2
0.4
0.6
0.8
BonferroniBoot prod pBoot min p
Boot
BonferroniBoot prod pBoot min p
Boot
BonferroniBoot prod pBoot min p
Boot
OR = All 2
OR = All 25
OR = 2(R1) 25(R2)0.
0
0.2
0.4
0.6
0.8
OR = All 2
OR = All 25
OR = 2(R1) 25(R2)
2x5x2-A 2x5x2-B 5x5x51212 125 250
Estimated Power
50 50
2MC 2
MC
2MC 2
MC
2MC 2
MC
2MC 2
MC
2MC
2MC
2MC
2MC
Christopher R. Bilder 24
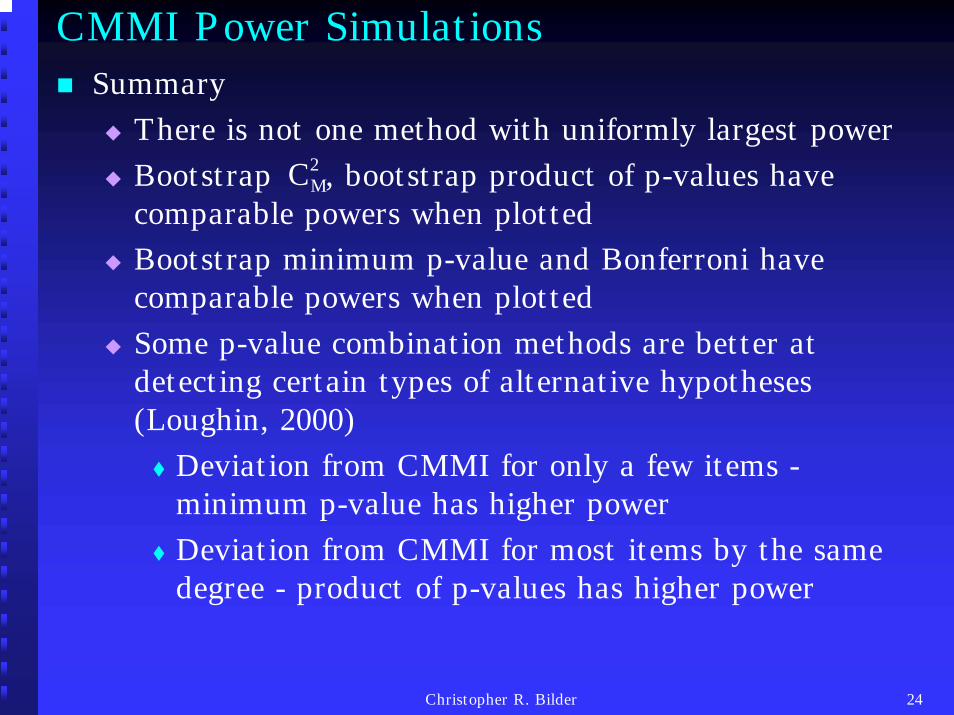
CMMI Power SimulationsSummary
There is not one method with uniformly largest powerBootstrap , bootstrap product of p-values have comparable powers when plotted
2MC
Bootstrap minimum p-value and Bonferroni have comparable powers when plottedSome p-value combination methods are better at detecting certain types of alternative hypotheses (Loughin, 2000)
Deviation from CMMI for only a few items -minimum p-value has higher powerDeviation from CMMI for most items by the same degree - product of p-values has higher power

Christopher R. Bilder 25
CMMI Testing RecommendationsBootstrap , Bootstrap product of p-values, and Bonferroni
Most consistently hold the correct sizeProvide power against detecting various alternatives
2MC

26
Testing for Conditional Multiple Marginal Independence
Christopher R. BilderDepartment of Statistics
Oklahoma State [email protected]
Thomas M. LoughinDepartment of Statistics Kansas State University
March 26, 2001

Christopher R. Bilder 27
ReferencesAgresti, A. and Liu, I.-M. (1998). Modelling Responses to a Categorical Variable Allowing Arbitrarily Many Category Choices. Univ. of Florida Dept. of Statistics Technical Report no.575. Agresti, A. and Liu, I.-M. (1999). Modeling a Categorical Variable Allowing Arbitrarily Many Category Choices. Biometrics 55, 936-943. Bilder, C. R., Loughin, T. M., Nettleton, D. (2000). Multiple Marginal Independence Testing for Pick Any/c Variables. To appear in Communications in Statistics: Simulation and Computation29(4). Cochran, W. G. (1954). Some Methods for Strengthening the Common χ2 Test. Biometrics 10, 417-451. Coombs, C. H. (1964). A Theory of Data. New York: John Wiley & Sons, Inc. Decady, Y. J. and Thomas, D. R. (2000). A simple test of association for contingency tables with multiple column responses. Biometrics 56, 893-896.. Foxman, B., Marsh, J. Gellespie, B., Rubin, N. Kopman, J., and Spear, S. (1997). Condom Use and First-Time Urinary Tract Infection. Epidemiology 8, 637-641. Gange, S. J. (1995). Generating Multivariate Categorical Variables Using the Iterative Proportional Fitting Algorithm. The American Statistician 49, 134-138. Landis, J. R., Heyman, E. R., Koch, G. G. (1978). Average Partial Association in Three-way Table Contingency Tables: a Review and Discussion of Alternative Tests. International Statistical Review46, 237-254.Loughin, T. M. and Scherer, P. N. (1998). Testing for Association in Contingency Tables with Multiple Categorical Responses. Biometrics 54, 630-637.Loughin, T. M. (2000). A systematic comparison of methods for combining independent tests. Technical Report, Kansas State University, Department of Statistics, Manhattan, KS. Mantel, A. M. and Haenszel, W. (1959). Statistical Aspects of the Analysis of Data from Retrospective Studies on Disease. Journal of the National Cancer Institute 22, 719-748.