testing ethylene control technologies in domestic fridges - wrap
TRANSCRIPT

Final report - Strategies to Reduce Waste of Fresh Produce
Testing ethylene control
technologies in domestic fridges
A report describing trials to assess the potential benefits of ethylene control technologies within domestic fridges, as a means of extending the shelf-life of fresh produce, and thereby reducing household food waste.
Project code: RBC820-002
Research date: March 2009 – June 2010 Date: May 2011

WRAP‟s vision is a world without waste, where resources are used sustainably. We work with businesses and individuals to help them reap the benefits of reducing waste, develop sustainable products and use resources in an efficient way. Find out more at www.wrap.org.uk
Written by: Dr. Debbie Rees (NRI, University of Greenwich), Dr. Neil Hipps (East Malling Research), Dr. Richard
Colgan (NRI, University of Greenwich), Karen Thurston (East Malling Research)
Legacy research commissioned by the previous government
Front cover photography: Fridge fruit (ID: 16639)
WRAP and the project team believe the content of this report to be correct as at the date of writing. However, factors such as prices, levels of recycled content and
regulatory requirements are subject to change and users of the report should check with their suppliers to confirm the current situation. In addition, care should be taken
in using any of the cost information provided as it is based upon numerous project-specific assumptions (such as scale, location, tender context, etc.).
The report does not claim to be exhaustive, nor does it claim to cover all relevant products and specifications available on the market. While steps have been taken to
ensure accuracy, WRAP cannot accept responsibility or be held liable to any person for any loss or damage arising out of or in connection with this information being
inaccurate, incomplete or misleading. It is the responsibility of the potential user of a material or product to consult with the supplier or manufacturer and ascertain
whether a particular product will satisfy their specific requirements. The listing or featuring of a particular product or company does not constitute an endorsement by
WRAP and WRAP cannot guarantee the performance of individual products or materials. This material is copyrighted. It may be reproduced free of charge subject to the
material being accurate and not used in a misleading context. The source of the material must be identified and the copyright status acknowledged. This material must
not be used to endorse or used to suggest WRAP‟s endorsement of a commercial product or service. For more detail, please refer to WRAP‟s Terms & Conditions on its
web site: www.wrap.org.uk

Testing ethylene control technologies in domestic fridges 3
Executive summary
WRAP is working with industry to identify ways of reducing wastage of fresh fruit and vegetables through the
whole supply chain. From the packhouse, through distribution depots and retail outlets, to domestic households,
every step of the chain offers opportunities to realise the benefits of avoiding waste.
Research1 has found that the majority of food and drink waste occurs at the end of the chain – in the household.
This project focuses on the potential for ethylene control technologies to extend the shelf-life of fresh produce in
domestic fridges, thereby helping to reduce household food waste. Through practical experiment, it measured the
effects of three technologies on fresh produce stored in fridges, against „control‟ produce stored normally in
identical fridges. The tested technologies were:
Absorption of ethylene in the fridge by use of Extrafresh discs containing potassium permanganate.
Addition of ozone to the fridge to act as an ethylene control agent. Ozone also destroys and/or retards the
growth of bacteria and fungal spores.
Treatment of fresh produce with an ethylene inhibitor, 1-methylcycopropene, the active ingredient of
SmartfreshTM.
Ethylene is important because it can increase the rate of deterioration of fresh produce. The concentrations at
which ethylene can affect produce is very low, and therefore methods of reducing its presence, or equally its
effects, may be beneficial.
Previous research2 has suggested that consumers should be encouraged to store more fruit and vegetables in the
fridge at home to extend their shelf-life. One possible consequence of this may be an increase in ethylene
concentrations in domestic fridges. The widespread presence of more ethylene-generating produce may have
adverse consequences for the quality of ethylene-sensitive produce. This may then support a rationale for using
one of the three ethylene control technologies examined here.
Researchers developed a methodology to compare these technologies against an untreated control scenario. The
trial design allowed direct comparison between the technologies. Fresh produce was selected to ensure that the
following categories were included in each of the tests:
Produce shown to be „most wasted‟ in the household.
Produce which generates ethylene.
Produce which is sensitive to ethylene.
The amount of fresh produce was chosen to reflect a scenario of greater fridge storage of fruit and vegetables in
the home. A range of produce was chosen that offered a “worse case” scenario in terms of likely ethylene
concentrations in the fridges. The same combination of items was placed in each fridge. Ethylene levels were
then measured in the fridges at set intervals over a three-week period, and the on-going quality of the
refrigerated produce was monitored for deterioration using a visual scoring system.
The results showed that the action of opening and closing the fridge had a significant effect on reducing ethylene
concentrations. The absorption technology (a) was found to reduce ethylene concentrations, but its effect on
fresh produce quality, as against the control, was limited. The ozone technology (b) had little effect on either
ethylene or the fresh produce at the output, discharge interval and frequency settings selected. The ethylene
inhibitor technology (c) reduced ethylene concentrations, and lowered the rate of deterioration for a limited
selection of produce, but had no, or negligible effects on others.
During this study the fridges were set at 4°C as recommended by fridge manufacturers. Notably, under these
conditions all the fresh produce used in the tests had a shelf-life of seven or more days, and eight of the 21
product had a shelf-life greater than 21 days. This would suggest that if fridge temperatures are at the
recommended level, there may be no need for additional technologies to extend shelf-life. The report, therefore,
concludes that the use of ethylene control technologies at this stage of the supply chain is unlikely to have great
benefits, and should not be given high priority.
1 Waste arisings in the supply of food and drink to households in the UK, WRAP, 2009
2 Helping consumers reduce fruit and vegetable waste, WRAP, April 2008

Testing ethylene control technologies in domestic fridges 4
Contents
1.0 Introduction and background to the project ............................................................................. 6 1.1 Overview of supply chain food waste .................................................................................... 6 1.2 Objectives .......................................................................................................................... 7 1.3 Technical background .......................................................................................................... 7
1.3.1 The role of ethylene in the deterioration of fruit and vegetables .................................. 7 1.3.2 The rationale for controlling ethylene within fridges ................................................... 9 1.3.3 Potential strategies for controlling ethylene and its effects within fridges. .................. 10
1.4 Project team ..................................................................................................................... 11 2.0 Methodology ............................................................................................................................. 12
2.1 Basis of the trials .............................................................................................................. 12 2.2 Choice of produce for fridge storage ................................................................................... 12 2.3 Effect of produce selection on ethylene levels and production rates within fridges ................... 14 2.4 Protocol for trials to test fridge technologies ........................................................................ 15
2.4.1 Fridge allocation ................................................................................................... 15 2.4.2 Packaging and positioning of produce within the fridges ........................................... 16 2.4.3 Door opening ....................................................................................................... 18
2.5 Application of ethylene control technologies......................................................................... 18 2.5.1 Ethylene removal using ExtraFresh discs ................................................................. 18 2.5.2 Ozone as an ethylene control agent ........................................................................ 18 2.5.3 Inhibition of ethylene action using Smartfresh™ 1-MCP ............................................ 19
2.6 Ethylene measurements ..................................................................................................... 19 2.7 Duration of trials ............................................................................................................... 19 2.8 Quality assessment of produce during trials ......................................................................... 19 2.9 Creation of a visual score system ........................................................................................ 19 2.10 Standardisation of fridge temperatures................................................................................ 20
3.0 Results ...................................................................................................................................... 22 3.1 Ethylene production rates and sensitivities of products ......................................................... 22 3.2 Assessing the effect of Extrafresh discs ............................................................................... 22
3.2.1 The effect of Extrafresh discs on measured ethylene concentrations .......................... 22 3.2.2 The effect of Extrafresh discs on product quality ...................................................... 23
3.3 Assessing the effect of ozone treatment .............................................................................. 27 3.3.1 The effect of ozone treatment on measured ethylene levels ...................................... 27 3.3.2 The effect of the ozone generator on product quality ............................................... 27
3.4 Assessing the effect of SmartfreshTM treatment .................................................................... 31 3.4.1 The effect of SmartfreshTM treatment on measured ethylene concentrations ............... 31 3.4.2 The effect of SmartfreshTM treatment on product quality .......................................... 32
4.0 Summary and discussion of findings ........................................................................................ 37 4.1 Fridge temperatures and normal shelf-life of produce ........................................................... 37 4.2 Ethylene levels in fridges ................................................................................................... 37 4.3 The effect of tested technologies on ethylene levels ............................................................. 38 4.4 The effect of tested technologies on product quality for specific products ............................... 38
4.4.1 Broccoli ................................................................................................................ 39 4.4.2 Cucumber ............................................................................................................ 40 4.4.3 Green pepper ....................................................................................................... 40 4.4.4 Nectarine ............................................................................................................. 41
5.0 Conclusions ............................................................................................................................... 42 5.1 Shelf-life of fresh produce under refrigeration without ethylene control technologies ............... 42 5.2 Extrafresh discs ................................................................................................................. 42 5.3 Ozone generation .............................................................................................................. 42 5.4 SmartfreshTM .................................................................................................................... 42 5.5 The potential benefits of complete ethylene removal ............................................................ 42 5.6 Recommendations ............................................................................................................. 42
Appendix 1 Visual scoring system ........................................................................................................ 43

Testing ethylene control technologies in domestic fridges 5
Glossary and acronyms 1-methylcyclopropene (1-MCP): a chemical that inhibits ethylene action in plant tissues, widely used in the UK to treat apples after harvest to extend storage life. It has no known toxic effects. Avoidable food waste: food and drink thrown away that was edible at some point before disposal (e.g. slice of bread, apples, meat). Climacteric fruit: fruit which have a pattern of ripening that is stimulated by ethylene, involves synthesis of more ethylene and cannot be stopped once started. Large changes occur in colour, texture and taste during ripening and there is a burst in respiration rate to provide the energy for this. Examples include apples and bananas. Ethylene gas (C2H4): produced by most plant tissues and acts a plant hormone, stimulating a range of plant responses including fruit ripening and tissue senescence.
Ethylene scrubbing: ethylene removal. Extrafresh disc: a product that absorbs ethylene, using potassium permanganate impregnated on clay granules. Flame Ionisation Detector (FID): detects chemicals on the basis of their ionisation in a flame. Fungistatic: fungal growth inhibitor. Lloyd penetrometer: a machine that measures hardness of fresh produce. Microbial contamination: contamination with fungi and/or bacteria. Mycotoxin: a chemical produced by fungi that is toxic to humans. Non-climacteric plant tissues: those that are sensitive to ethylene but do not respond by synthesising more ethylene. Typical responses include loss of green colour in non-climacteric fruit, such as oranges, and senescence, such as in broccoli. Ozone generator: a producer of ozone. Ozone is primarily used in the fresh produce industry to control microbial contamination. Ozone also reacts with and destroys ethylene. Packhouse: a facility where fresh produce is graded for quality and packed. Parts per million (ppm): a measure of concentration equivalent to 0.0001%. Parts per billion (ppb): a measure of concentration equivalent to 0.0000001%.
Senescence: death of plant tissues in a controlled process. Examples include shrivelling and drop of flower petals, browning and drop of leaves in autumn. SmartfreshTM: the commercial form of 1-methylcyclopropene.

Testing ethylene control technologies in domestic fridges 6
1.0 Introduction and background to the project
1.1 Overview of supply chain food waste
One of WRAP‟s key priorities is the reduction of food waste across the supply chain3. The overall level of food
waste from the grocery sector is estimated to be at least 11 million tonnes (Table 1), and much of this goes to
landfill4. The majority of food and drink waste occurs at the household level (8.3 million tonnes). WRAP is
carrying out a number of activities to reduce household food waste as part of the “Love Food Hate Waste‟
programme5 and Courtauld Commitment6, a voluntary agreement aimed at improving resource efficiency and
reducing the carbon and wider environmental impact of the grocery retail sector.
Table 1 Estimated total food and drink waste arisings from the supply of food and drink to households in the UK
Supply chain stage
Total waste arisings
Million tonnes
Manufacture 3.2
Distribution and retail 0.37
Household 8.3
Total 11.87
Source: “Waste arisings in the supply of food and drink to households in the UK” WRAP, 2009
As well as decreasing the amount of material being sent to landfill, the reduction of food waste is key to reducing
greenhouse gas emissions. Food 20307 reports that “the greenhouse gas footprint of the UK food chain was 160
million tonnes CO2 equivalent in 2006, an estimated 22% of emissions associated with all UK economic activity”.
A WWF report8, states that a further 101 million tonnes CO2 equivalent from land use change in other countries is
attributable to UK food. This results in the food chain contribution to UK CO2 equivalent emissions rising to 30%.
Figure 1 indicates that of all household food and drink waste (8.3 million tonnes) 36% is fresh vegetables, salads
and fruit (equating to 3 million tonnes)9.
Figure 1 Proportion of weight of all food and drink waste, split by food group
3 http://www.wrap.org.uk/wrap_corporate/about_wrap/food_waste_one_of.html
4 Waste arisings in the supply of food and drink to households in the UK, WRAP, 2009
5 www.lovefoodhatewaste.com
6 http://www.wrap.org.uk/retail/courtauld_commitment/index.html
7 http://www.defra.gov.uk/foodfarm/food/pdf/food2030strategy.pdf
8 How low can we go? WWF, January 2010: http://assets.wwf.org.uk/downloads/how_low_can_we_go.pdf
9 Household food and drink waste in the UK, WRAP, 2009

Testing ethylene control technologies in domestic fridges 7
Food and drink waste has been categorised by how avoidable the waste is:
Avoidable – food and drink thrown away that was, at some point prior to disposal, edible (e.g. slice of bread,
apples, meat). Possibly avoidable – food and drink that some people eat and others do not (e.g. bread crusts), or that can be
eaten when a food is prepared in one way but not in another (e.g. potato skins).
Unavoidable – waste arising from food or drink preparation that is not, and has not been, edible under normal circumstances (e.g. meat bones, egg shells, pineapple skin, tea bags).
Of the 3 million tonnes of fresh vegetables salads and fruits, 1.36 million tonnes is considered to be avoidable. It
is this avoidable waste that is being targeted within this project.
Reducing this waste not only has a direct effect by reducing landfill and greenhouse gas emissions, but will also
reduce the level of resources that were used unnecessarily to create and dispose of the food and drink that is
produced, but not consumed. These resources include land and water for agriculture, inorganic fertilisers,
transport fuel, packaging materials, and electricity for storage at low temperature.
1.2 Objectives
WRAP has been working to identify approaches to reducing wastage of fresh fruit and vegetables through the
whole supply chain, from packhouse, through distribution depots and retail outlets to domestic households,
concentrating on the impact of ethylene and microbial contamination. This project concentrates on methods of
reducing wastage within the household, with the following objective:
To assess the impact of ethylene removal and an ethylene action inhibitor on waste reduction of
fruits and vegetables in domestic fridges.
A previous WRAP project10 recommended that retailers should improve storage information given to consumers,
and encourage the storage of more fruit and vegetables in the fridge at home, thereby extending shelf-life and
reducing domestic waste. One expected consequence of storing more fruit in this way might be an increase in
ethylene concentrations within fridges. It is therefore important to assess the potential impact on shelf-life of any
enhanced ethylene levels and strategies to mitigate this.
1.3 Technical background
1.3.1 The role of ethylene in the deterioration of fruit and vegetables
Ethylene (C2H4) is produced naturally by most plant tissues, especially ripening fruit. It is a plant hormone that
controls many biological processes. Among plant hormones, ethylene is unusual because it is a gas. The
implication of this is that if one plant or plant organ starts to produce ethylene, nearby plant tissues are also
affected. For plants, many processes involving tissue death, such as leaf drop in deciduous trees, petal drop in
flowers, over-ripening of fruit, are actively controlled as part of the natural life cycle. Many of these are
controlled / stimulated by ethylene. For this reason ethylene can speed up deterioration in fruits and many
vegetables, particularly leafy greens.
As it controls so many processes associated with the quality of fruit and vegetables, ethylene is an extremely
important chemical for the fresh produce handling industry. On the one hand it is used to trigger ripening in
fruits. Thus bananas are transported green to the UK and are then stimulated to ripen by being fumigated with
ethylene within warm ripening rooms. On the other hand, as ethylene will stimulate deterioration and senescence
(an active process of cell death that leads to tissue deterioration), it is important to control concentrations in
order to maintain quality. Thus, there is a growing recognition of the importance of controlling ethylene in fresh
produce store rooms, and therefore an increase in the use of ethylene scrubbers.
The concentrations at which ethylene can affect produce are very low. There is evidence that many products are
sensitive to concentrations well below 100 parts per billion (ppb). Ethylene is known to build up in packhouses to
concentrations near 1,000 ppb (= 1 part per million (ppm)), which is above the threshold of sensitivity of most
10 Helping consumers reduce fruit and vegetable waste, WRAP, April 2008

Testing ethylene control technologies in domestic fridges 8
produce. A study conducted on a range of produce showed a 60% extension of post-harvest life when stored in
<5 ppb compared with 100 ppb ethylene11.
The biochemistry of how ethylene controls plant processes is very complex and beyond the scope of this report.
However, in order to relate the observation of ethylene levels to their likely effects on fresh produce, it is useful
to understand some of the background principles.
Processes controlled by ethylene can be classified into two types:
System 1. Ethylene „stimulates‟ the process. If ethylene concentrations are increased the process goes faster,
and if ethylene concentrations are reduced or ethylene is removed completely then the process slows/stops. This system applies to ethylene stimulation of the deterioration/senescence of vegetables, over-ripening/senescence of
fruit, discolouration of cucumber and browning of broccoli.
System 2. Ethylene acts as a switch that cannot be stopped. Thus ethylene triggers the biological process. If
ethylene levels are reduced or ethylene is removed completely then the process continues, albeit at a slower
pace. This is the case for the initiation of ripening of certain fruits, which are called climacteric fruit. These include bananas, apples, tomatoes, kiwifruit, pears and avocadoes, but not grapes, oranges and lemons.
On the whole, during handling of the produce in the grocery supply chain, ripening would already have been
initiated in all climacteric fruits that were used in this project. Therefore, we are concerned with System 1
processes and the exposure to continuous ethylene. Short-term exposure would not have dramatic effects.
Figures 2–4 demonstrate some of the effects of exposure to ethylene.
Figure 2 Ethylene treatment triggers the ripening of bananas which are climacteric fruit and therefore need only
temporary exposure (System 2)
11 Wills, R.B.H., Ku, V.W., Shohet, D. and Kim, G.H. (1999) Importance of low ethylene levels to delay senescence of non-climacteric fruit and vegetables. Australian Journal Of Experimental Agriculture, 39 (2), 221-224

Testing ethylene control technologies in domestic fridges 9
Figure 3 Exposure to ethylene can induce colour loss of cucumbers. This is a natural “ripening” process, but
detrimental to quality
Figure 4 Exposure to ethylene can induce brown streaks in leafy vegetables, as shown in this example of
Chinese leaves
1.3.2 The rationale for controlling ethylene within fridges
Following the previous WRAP project12, exploratory trials suggested that the presence of fruit in fridges may have
slight negative effects on the visual quality of certain vegetables. These effects may result from heightened levels
of ethylene generated by the fruit (unpublished data).
The trials undertaken for the previous project found that, generally, vegetable quality related to ethylene
concentrations within the fridges, once they had accumulated to levels above thresholds reported to cause
adverse effects on quality. However, despite high ethylene concentrations accumulating within the trial fridges
over three to four days, vegetable quality was generally good for seven days, regardless of whether they were
stored with or without fruit.
The trials therefore suggested that the presence of ethylene-generating produce in refrigerators might have
adverse consequences on the quality of ethylene-sensitive produce. Over a 14-day period, the highest recorded
ethylene concentrations in fridges containing only vegetables were 31 and 66 ppb. This compares with maximum
concentrations of 1677 and 9915 ppb where apples and pears were included.
12 Helping consumers reduce fruit and vegetable waste, WRAP, April 2008

Testing ethylene control technologies in domestic fridges 10
It was noted that opening the fridge doors to inspect produce flushed out much of the ethylene from the fridges.
The fridge with the highest ethylene concentration lost 96% and 90% of its ethylene, when the door was opened
on days four and eight respectively. Residual ethylene levels measured after closing the fridge doors were similar
irrespective of the concentration at the time of opening. However, residual concentrations were above the 100
ppb concentration often cited as the threshold level that enhances senescence in vegetables.
The vegetables affected by heightened levels of ethylene were lettuces, broccoli, cauliflowers and Brussels
sprouts. Cabbage appeared not to be affected. Those that were affected by ethylene showed symptoms regarded
as typical of accelerated senescence, such as yellowing and leaf detachment (cauliflowers). With the exception of
Brussels sprouts, and to a lesser extent broccoli, the adverse effects of ethylene were nevertheless slight.
Other studies have shown that ethylene levels in fridges were about 10-fold higher where apples were included,
and were likely to result in a 30% reduction in post-harvest life of a range of products13. As expected, the quality
of most types of vegetables is better under lower ethylene conditions, but even a level of 70 ppb (recorded in the
study above) is higher than the threshold level for the physiological effects of ethylene indicated in some
studies14. It is, therefore, important to establish the benefits of the removal of ethylene from fridges, or the
inhibition of its effects, especially for ethylene sensitive products that are known to contribute significantly to
levels of domestic waste.
1.3.3 Potential strategies for controlling ethylene and its effects within fridges.
For this project, three strategies were tested within domestic fridges: ethylene removal by absorption; the use of
ozone which destroys ethylene; and, inhibition of ethylene action. Each of these strategies is described below,
while the specific technologies employed are described in section 2.
Ethylene removal
A number of technologies already exist for the removal of ethylene from the storage atmosphere; these include
the use of potassium permanganate that absorbs ethylene, and the use of catalytic scrubbers that catalyse the
breakdown of the chemical. Absorbing the gas with potassium permanganate is the cheapest of these, and
therefore the one most likely to be appropriate for use in domestic fridges. Extrafresh discs15 used in the project
are an example of this technology.
Ozone as an antimicrobial and ethylene control agent
Ozone reacts with and destroys ethylene, and therefore has potential as an ethylene removal agent16. It also has
several other characteristics that make it attractive for maintaining quality of fresh produce: it destroys and/or
retards the growth of bacteria and fungal spores (depending on concentration); controls odours; improves
firmness in some fruits; has been reported to induce resistance to postharvest decay development and increase
the levels of antioxidants in the fruit; and can degrade pesticides and mycotoxins.
In the mid 1990s, ozone was approved for food processing in Australia, France and Japan, and it has been
granted the status of Generally Recognized as Safe (GRAS) by the FDA (Food and Drug Administration) in the
USA. The use of ozone in organic products is also approved in the USA. Its use is free of residues, because the
only product of ozone when it decomposes is oxygen and its half-life is only about 12 hours at room temperature.
UAP ozone generators (provided by Onnic Ltd17) were used in this study to generate ozone.
Inhibition of ethylene action
An alternative to removing ethylene from the fridge environment is to de-sensitise fresh produce to the
deleterious effects of ethylene. The ethylene inhibitor 1-methylcyclopropene (1-MCP), the active ingredient of
„SmartFresh‟TM18 (Rohm and Haas Company, USA), is widely used to treat apples prior to storage in order to
13 Wills, R.B.H., Ku, V.W., Shohet, D. and Kim, G.H. (1999) Importance of low ethylene levels to delay senescence of non-climacteric fruit and vegetables. Australian Journal Of Experimental Agriculture, 39 (2), 221-224
14 Wills, R.B.H., Warton, M.A. and Ku, V.V.V. (2000). Ethylene levels associated with fruit and vegetables during marketing. Australian Journal of Experimental Agriculture, 40, 465-70
15 http://extrafresh.com.au/welcome.php 16 Skog, L. J. and Chu, C. L. 2001. Effect of ozone on qualities of fruits and vegetables in cold storage. Can. J. Plant Sci. 81: 773-778.
17 http://www.onnic.co.uk/home.htm
18 http://www.smartfresh.com/smartfresh.html

Testing ethylene control technologies in domestic fridges 11
maintain quality, particularly during post-storage shelf-life19. Treatment with 1-MCP also slows the ripening of
many other climacteric fruits such as plums and tomatoes. Although „SmartFreshTM‟ technology is not currently
available at the domestic level, there is an opportunity for product development if the application of 1-MCP
proved effective in enhancing the quality and extending the life of fresh produce stored in fridges. There is a
need to evaluate the potential benefits of this technology for the most wasted types of fruits and vegetables.
1.4 Project team
East Malling Research Neil Hipps Project Manager
Karen Thurston Postharvest technologist
David Johnson Postharvest technologist
Natural Resources Institute Debbie Rees Postharvest technologist
Richard Colgan Postharvest technologist
Mack Multiples Cristian Metzger Innovation technologist
Bruce McGlashan Fresh produce technologist
Sainsburys Theresa Huxley Fresh produce technologist
Onnic International Peter Holmes Ozone technology
MAPCAP Technology Nigel Parker Ozone technology
ICA David Bishop Extrafresh discs technology
Stephen Lawrence Extrafresh discs technology
Landseer Ltd Mark Tully Smartfresh Technology
19 Johnson, D.S. (2008). Factors affecting the efficacy of 1-MCP applied to retard apple ripening. Acta Horticulturae, 796, 59-67

Testing ethylene control technologies in domestic fridges 12
2.0 Methodology
2.1 Basis of the trials
Three technologies were tested:
1 Extrafresh discs containing potassium permanganate to absorb ethylene (provided through ICA Ltd).
2 UAP ozone generators (provided by Onnic Ltd) to break down ethylene.
3 Smartfresh 1-MCP (provided by Landseer Ltd) to inhibit ethylene action.
Details of the number and location of devices is given below.
The trials were designed with the premise that the most relevant information could be obtained if fresh produce
was assessed under the conditions that it would actually experience in the home. Trials were therefore carried
out using the fridge compartments of a set of „Beko‟ 300L domestic fridge-freezers. This particular make of fridge
is frequently used in the UK, and is similar to many other commonly purchased models. Eight fridges were used
simultaneously. In order to conduct trials with sufficient replication, each strategy was tested against untreated
controls in separate trials.
The produce included within each fridge was chosen to be typical of what may be found within a family fridge. A
range of packaging was included, with consideration of what was most likely to be found in a domestic fridge. For
the same reason some products (e.g. melons, cucumbers) were cut into two pieces, as this would have a
significant effect on ethylene production rates.
The effect of the technologies on produce quality was followed for three weeks, as it was considered unlikely that
consumers would knowingly keep produce for longer than this. Quality of produce was assessed using a visual
scoring system, which was developed specifically for this project.
2.2 Choice of produce for fridge storage
When choosing the range and quantity of produce to be stored in the fridges during the trials, there were two
main considerations:
(a) which ethylene-generating produce to place in the fridge environment; and
(b) which ethylene-responsive produce to place in the fridge environment.
For (a), tests were conducted to determine the effects of produce on ethylene levels, and these are discussed in
section 2.3.
It was decided that (b) should comprise produce that contributes most significantly to levels of waste in domestic
households. The selection of produce was, therefore, made using data available at the start of the project on
those that are “most wasted” in the household (WRAP diary research 2007; unpublished). Produce for which
refrigeration is not recommended were not included.
Subsequently, more up-to-date information was obtained by WRAP. The more recent data on the “most wasted”
fresh produce within the household is presented in Figures 5 and 620. The levels of waste have been separated
into avoidable, possibly avoidable and unavoidable. For the purposes of these trials, the avoidable waste is the
most important.
20 Household food and drink waste in the UK, WRAP, 2009

Testing ethylene control technologies in domestic fridges 13
Figure 5 The weight of fruit waste within UK households, split by avoidability
tonnes per year
0 50,000 100,000 150,000 200,000 250,000 300,000 350,000
Banana
Apple
Orange
Melon
Stone fruit
Other citrus
Soft / berry fruit
All other fresh fruit
Avoidable Possibly avoidable Unavoidable
Source: Household Food and Drink Waste in the UK WRAP 2009
Figure 6 The amount of vegetable waste within UK households, split by avoidability
tonnes per year
0 200,000 400,000 600,000 800,000
Potato
Mixed vegetables
Onion
Carrot
Cabbage
Lettuce
Tomato
Other root vegetables
Cucumber
Sweetcorn / corn on the cob
Broccoli
Cauliflower
Leafy salad
Bean (all varieties)
Pepper
Leek
Mushroom
Spring onion
All other fresh vegetables and salads
Avoidable Possibly avoidable Unavoidable
Source: Household Food and Drink Waste in the UK WRAP 2009
Table 2 shows the selection of produce used in these trials, compared with the produce more recently identified
with high levels of avoidable waste. These columns correspond well, with only a few variations. The produce that
might have been included, had this data been available at the time of trial planning, are sweetcorn, green beans
and leeks. In the case of stone fruit, nectarines were included as an example, but other examples such as plums
or mangoes might also have been included.

Testing ethylene control technologies in domestic fridges 14
Table 2 Commodities included in the main trials to assess ethylene control technologies, compared to
commodities most recently identified with high avoidable waste
Commodities included in trials
(* indicates items previously identified as most
wasted21)
Commodities with high levels of avoidable
waste22 for which refrigeration is
recommended
*Apple (Braeburn and Granny Smith) Apple
Asparagus
Avocado
*Broccoli Broccoli
*Pear
*Cabbage
*Cauliflower Cauliflower
*Carrot Carrot
Celery
*Cucumber Cucumber
*Grape
*Green pepper Pepper
*Honeydew Melon Melon
*Kiwifruit
*Lemon Other citrus
*Lettuce Lettuce
*Mushroom Mushroom
Nectarine Stone fruit
*Satsuma Orange
Strawberry Soft berry fruit
*Tomato Tomato
Other leafy salad
Sweetcorn
Beans
Leek
Shaded products have significant “avoidable” waste, but were not included in the main trials.
2.3 Effect of produce selection on ethylene levels and production rates within fridges
At present there is no information on the actual concentrations of ethylene in domestic fridges in the UK, and it
was considered beyond the scope of this project to undertake the size of study that would be necessary to obtain
reliable data. Ethylene concentration is likely to be affected by the range of fresh produce stored in the fridge and
the frequency of door opening.
Two selections of produce (Table 3) were tested for their effects on ethylene levels within the fridges. Figure 7
indicates the ethylene levels measured within fridges with these two selections. For selection A, ethylene
concentrations were below 500 ppb, whereas for selection B the ethylene concentrations ranged between 1,500
and 3,500 ppb. Higher levels for selection B were expected due to the greater number of apples and pears and
the inclusion of a cut melon. The main trials of this project were conducted using selection B, in order to
determine produce shelf-life and the effects of ethylene control technologies in the presence of high ethylene
producers.
21 WRAP diary research 2007, unpublished
22 As identified in “Household Food and Drink Waste in the UK” WRAP, 2009

Testing ethylene control technologies in domestic fridges 15
Table 3 The selection of produce to include within each fridge was very important. Two sets of produce were
assessed for their effects on the ethylene levels within the fridges
Produce selection A Produce selection B
4 Apples 4 Braeburn and 4 Granny Smith apples
Asparagus Asparagus
Avocado 2 Avocadoes
Broccoli Broccoli
- Cabbage
Carrots Carrots
Cauliflower Cauliflower
Celery Celery
Cherries -
Cucumber ½ Cucumber
Grapes Grapes
Green pepper 2 Green peppers
- 6 Kiwifruit
- Lemon
Lettuce Lettuce
- Melon cut into two
- Mushroom
Nectarines 4 Nectarines
- 4 Pears
Raspberries -
- Satsuma
Figure 7 Ethylene concentrations measured within fridges in which produce selection A or B had been stored.
Each data point relates to the mean of values measured over three weeks for an individual fridge
0
500
1000
1500
2000
2500
3000
3500
4000
0 1 2 3 4 5 6
Me
an
eth
yle
ne
le
ve
l in
fri
dg
e (
pp
b)
Produce selection A Produce selection B
2.4 Protocol for trials to test fridge technologies
2.4.1 Fridge allocation
The technologies were tested separately, so that within each trial there were two treatments: untreated control
vs. ethylene control technology. Four fridge-freezers were assigned to each treatment. The allocation of the
fridges was made randomly for each trial.
Trials were carried out using the fridge compartments of a set of eight „Beko‟ 300L domestic fridge-freezers kept
in one room (in two rows on either side of the room) (Figure 8).

Testing ethylene control technologies in domestic fridges 16
Figure 8 Four domestic fridge-freezers arranged on one side of the trial room
The fridge-freezers had an upper fridge and lower freezer. The fridge contained two crispers at the bottom. In
order to simulate the loading of domestic fridge freezers, the freezer compartments were filled with packages of
sliced bread, and in addition to the products being tested, the fridge compartment of each of the eight fridge-
freezers contained the following items, in addition to fresh fruit and vegetables:
UHT milk x1 carton
Tomato puree x1 tube
Sweet pickle x1 jar Jam x1 jar
Marmalade x1 jar
Olives x1 jar Lemon juice x1 bottle
Salad cream x1 bottle
Tomato ketchup x1 bottle Lard x1 pack
Butter x1 pack
Apple juice x2 bottle.
2.4.2 Packaging and positioning of produce within the fridges
The amount of each product, type of packaging and position of storage of the produce is summarised in Table 4
and illustrated in Figure 9. Where produce was „cut‟ this is also indicated. All produce was purchased from a local
Sainsbury‟s supermarket, and was placed in the fridges within two hours of purchase.
The importance of storing most „free-flow‟ products in plastic bags was demonstrated clearly in a previous WRAP
project23. It was, therefore, appropriate for most commodities to test the ethylene control technologies on
bagged products. However, we recognise that most consumers open bags as they use produce. For that reason
where bags were used the ends were kept open.
The „Beko‟ fridge-freezers used in this project have two separate crispers. Ethylene-sensitive produce (mainly
green vegetables) was stored in the crisper compartments and the ethylene-producing products (mainly
climacteric fruits) were stored on the shelves. In this way high ethylene producers and ethylene-sensitive
products were not stored together in close proximity.
23 Helping consumers reduce fruit and vegetable waste, WRAP, April 2008

Testing ethylene control technologies in domestic fridges 17
Table 4 Commodities included in the trial, with packaging and location within the fridge
Product Amount Packaging Location in fridge
Apple 2 x 6 Open bags Shelf
Asparagus 1 pack Open bag Crisper
Avocado 2 Unbagged Shelf
Broccoli 1 head Open bag Crisper
Cabbage green 1 Open bag
Carrot 1x 500g pack Open bag Crisper
Cauliflower 1 head Open bag Crisper
Celery 1 Open bag Crisper
Cucumber 1 Sleeved, cut into two Crisper
Grapes 1 bag Open bag Shelf
Green pepper 2 Unbagged Crisper
Kiwifruit 4 Open bag Shelf
Lemons 2 Open bag Shelf
Lettuce 1 Open bag Crisper
Melon (Honeydew) 1 Cut into two halves Shelf
Mushroom 1 Paper bag Shelf
Nectarines 4 Open bag Shelf
Pears 6 Open bag Shelf
Satsumas 4 Open bag Shelf
Strawberries 1 punnet Plastic punnet Shelf
Tomato 6 Open bag Shelf
Figure 9 The arrangement of produce within each fridge during the main trials

Testing ethylene control technologies in domestic fridges 18
2.4.3 Door opening
The fridge doors were opened for 30 seconds twice a day (early morning and late afternoon) to simulate
mealtime activity in the home. In surveys carried out by FRPERC24, 30 seconds was the maximum time that fridge
doors were left open.
The doors were kept sealed over the weekend period to determine ethylene build-up during a period of inactivity,
as would be the case where the householder(s) left the premises for a short vacation. It is presumed that in
preparation for longer vacations, perishable products would be removed from the fridge compartments.
2.5 Application of ethylene control technologies
2.5.1 Ethylene removal using ExtraFresh discs
Following discussions with the manufacturing company, six Extrafresh discs were placed in each fridge, one on
each of the four shelves and one in each crisper compartment.
Figure 10 Extrafresh disc
2.5.2 Ozone as an ethylene control agent
A single UAP ozone generator was used in each fridge. The generator was programmed to produce ozone for two
minutes during each 15-minute period. As ozone is heavier than air, the generators were placed on the top shelf
in order to optimise the distribution of ozone through the fridge.
Figure 11 Ozone generator
24 The Food Refrigeration and Process Engineering Research Centre (FRPERC) at the University of Bristol

Testing ethylene control technologies in domestic fridges 19
2.5.3 Inhibition of ethylene action using Smartfresh™ 1-MCP
When water is mixed with Smartfresh™, 1-MCP is released as a volatile. At the start of each trial, products were
placed in sealable chambers (two fridges of produce per chamber) maintained at 20ºC, and exposed to volatile 1-
MCP at an initial estimated concentration of 625 ppb. All packaging was open to allow free circulation of the gas.
The chamber was kept closed for 24 hours after which produce was placed in fridges and the storage trial
initiated. Produce for the non-treated controls were kept in identical chambers under identical conditions for 24
hours.
2.6 Ethylene measurements
The fridge atmosphere was sampled before door opening on days of quality assessment. A pump was connected
to two tubes that penetrated the fridge door seal (top and bottom) and samples of the circulated atmosphere
were extracted by syringe from a septum port inserted into one of the gas lines. Ethylene concentration was
measured by gas chromatography, using a Flame Ionisation Detector (FID). This method of measurement is
accurate to 10 ppb and there is no interference from other volatile chemicals.
2.7 Duration of trials
Each trial ran for three weeks with produce quality being assessed twice a week and coincident with the early
morning door opening. Products remained in the fridge for the duration of the experiment.
2.8 Quality assessment of produce during trials
Quality assessment was carried out over time based on visual quality, using a visual score system created before
the trials were initiated (see section 2.9). For selected produce, internal assessments to check for physiological
disorders and/or texture measurements using a Lloyd penetrometer were made at the end of the storage period.
Produce was weighed at each assessment to check for weight loss.
2.9 Creation of a visual score system
Loss of visual quality is a major reason for consumers wasting fruits and vegetables. However, it is also likely that
consumers have differing views about what is and is not visually acceptable. In order to make the results of the
experiments as objective as possible, it was necessary to develop a scoring system for quality, so that any
benefits of ethylene control technologies could be quantified.
Small quantities of each of the products to be used in trials were purchased from a local Sainsbury‟s supermarket
and kept in air storage at 20oC to hasten deterioration. All products were weighed on a daily basis and a full
visual description of quality made. Symptoms associated with senescence of the products included yellowing,
softening, decay, abscission and browning. A photographic record was kept so that visual quality could be
matched with the descriptions and a scoring system developed. This process was continued for each product
until it deteriorated to an unacceptable level. A subjective assessment was made by the investigators of the point
at which each product became unacceptable for use. The resulting scoring system is given in Appendix 1.
As fresh produce deteriorated the score increased from 1 (good) to 5 (poor quality). Most produce had a five
point scale, although for some (e.g. strawberry, mushroom) it was possible to increase this to 6. For each type of
produce used in the main trials, the score that in the assessor‟s view reached the limit of acceptable quality was
recorded (Table 5). This was subsequently used to calculate any change in shelf-life period found as a result of
the technologies tested.
Table 5 The score considered to indicate the limit of acceptable quality for each product, using scores in
Appendix 1
Product Limit of good quality
Apple >2
Asparagus 3
Avocadoes 3
Broccoli 3
Cabbage 3

Testing ethylene control technologies in domestic fridges 20
Carrot 2
Cauliflower 3
Celery 2
Cucumber 2
Grapes 2
Green pepper 3
Kiwifruit 3
Lemon 2
Lettuce 2
Melon 2
Mushroom 3
Nectarine 2
Pear 3
Satsuma >2
Strawberries 2
Tomatoes 2
NB. Apple and satsuma did not deteriorate beyond the limit of good quality during the whole assessment period.
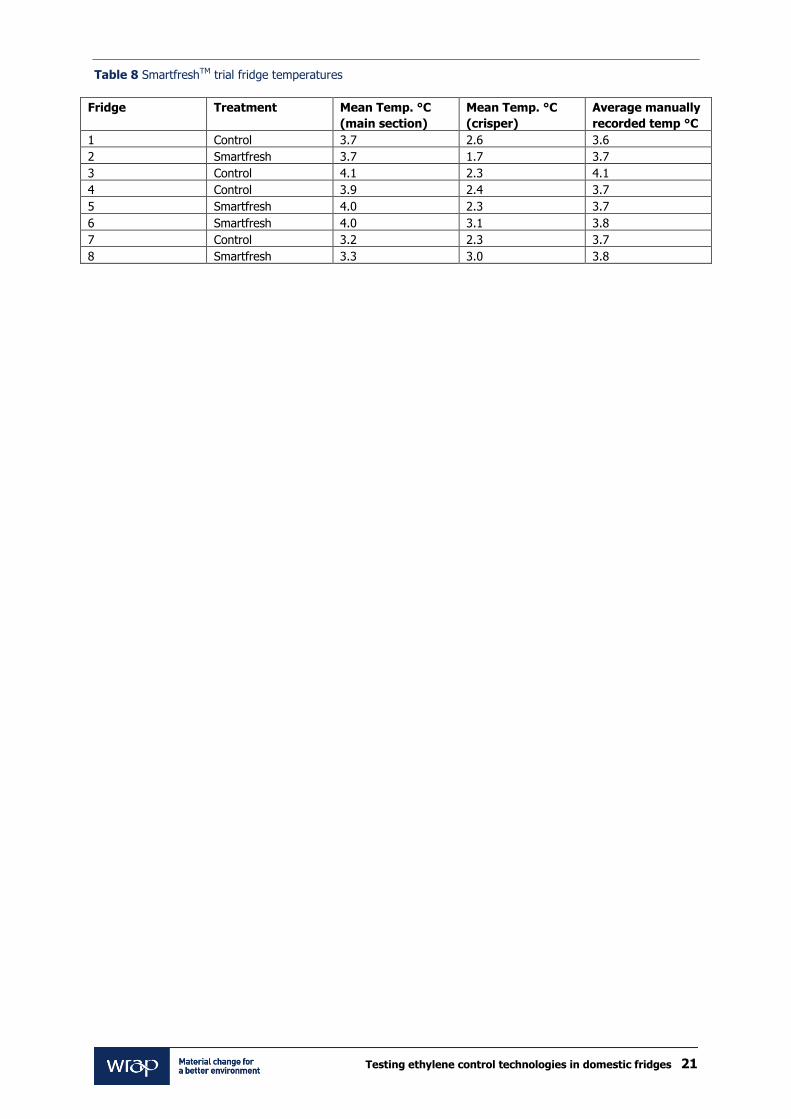
2.10 Standardisation of fridge temperatures
Even though the fridges maintained constant temperatures when tested before the trial, in a preliminary trial it
was found that once loaded with produce, fridge temperature was unacceptably variable (varying within a two
degree range). To reduce variability during trials, the temperature of each fridge was checked twice weekly using
a glass thermometer inserted into a bottle of glycerol, and the fridge setting adjusted as necessary. Tables 6, 7
and 8 summarise the temperature data for the three trials reported.
Table 6 Extrafresh trial fridge temperatures
Fridge Treatment Mean Temp. °C
(main section)
Mean Temp. °C
(crisper)
Average manually
recorded temp °C
1 Extrafresh 3.8 2.5 3.7
2 Extrafresh 3.6 2.0 3.6
3 Control 4.0 2.2 3.9
4 Control 4.1 2.5 4.0
5 Extrafresh 3.9 2.1 3.7
6 Control 4.0 3.0 3.8
7 Extrafresh 3.4 2.4 3.9
8 Control 3.5 2.9 3.7
Table 7 Ozone generator trial fridge temperatures
Fridge Treatment Mean Temp. °C
(main section)
Mean Temp. °C
(crisper)
Average manually
recorded temp °C
1 Control 3.9 2.5 4.0
2 Ozone generator 3.7 2.0 3.7
3 Control 4.0 2.1 3.9
4 Ozone generator 3.8 2.4 3.8
5 Ozone generator 3.9 2.1 3.6
6 Control 4.0 3.0 3.8
7 Ozone generator 3.4 2.5 3.8
8 Control 3.3 2.9 3.9
Testing ethylene control technologies in domestic fridges 21
Table 8 SmartfreshTM trial fridge temperatures
Fridge Treatment Mean Temp. °C
(main section)
Mean Temp. °C
(crisper)
Average manually
recorded temp °C
1 Control 3.7 2.6 3.6
2 Smartfresh 3.7 1.7 3.7
3 Control 4.1 2.3 4.1
4 Control 3.9 2.4 3.7
5 Smartfresh 4.0 2.3 3.7
6 Smartfresh 4.0 3.1 3.8
7 Control 3.2 2.3 3.7
8 Smartfresh 3.3 3.0 3.8

Testing ethylene control technologies in domestic fridges 22
3.0 Results
3.1 Ethylene production rates and sensitivities of products
In order to understand the results it is very useful to have information on the ethylene production rates and
sensitivity of the individual products included in the trials. Table 9 summarises the available information.
Table 9 Ethylene production and ethylene sensitivity of fruits and vegetables used in these trials. Figures based
on data from University of California (VH-very high, H-high, M-moderate, L-low, VL-very low)
Product Rate of production of ethylene Sensitivity to ethylene
Apple VH H
Asparagus VH H
Avocadoes
Broccoli
Cabbage VL H
Carrot VL H
Cauliflower VL H
Celery VL H
Cucumber VL M
Grapes L H
Green pepper VL L
Kiwifruit L H
Lemon
Lettuce VL H
Melon
Mushroom VL M
Nectarine
Pear H H
Pepper L L
Satsuma VL M
Strawberries L L
Tomatoes H L
3.2 Assessing the effect of Extrafresh discs
3.2.1 The effect of Extrafresh discs on measured ethylene concentrations
Figure 12 indicates that Extrafresh discs reduced the levels of ethylene within the fridges from a range of 1,000 –
4,000 ppb down to approximately 500 ppb. Each set of data refers to measurements from an individual fridge.
Measurements were made on Monday and Thursday mornings. Fridge doors were opened for 30 seconds on
Monday – Friday in the morning (after ethylene assessment) and in the late afternoon. Doors were not opened
during the weekend. The higher levels observed at day 7, 14 and 21 were measured on Monday morning after
the fridges had been closed since Friday afternoon, whereas the lower levels measured on days 3, 10 and 17
were measured on a Thursday morning at which point the fridges had been closed for one night only. The
difference in these levels indicates the significant effect that opening the fridge doors can have on ethylene
concentration.

Testing ethylene control technologies in domestic fridges 23
Figure 12 Ethylene concentrations measured within fridges with or without Extrafresh discs
0
500
1000
1500
2000
2500
3000
3500
4000
4500
5000
0 5 10 15 20 25
Storage time (Days)
Eth
yle
ne c
on
cen
trati
on
(p
pb
)
Control 1
Control 2
Control 3
Control 4
E/Fresh 1
E/Fresh 2
E/Fresh 3
E/Fresh 4
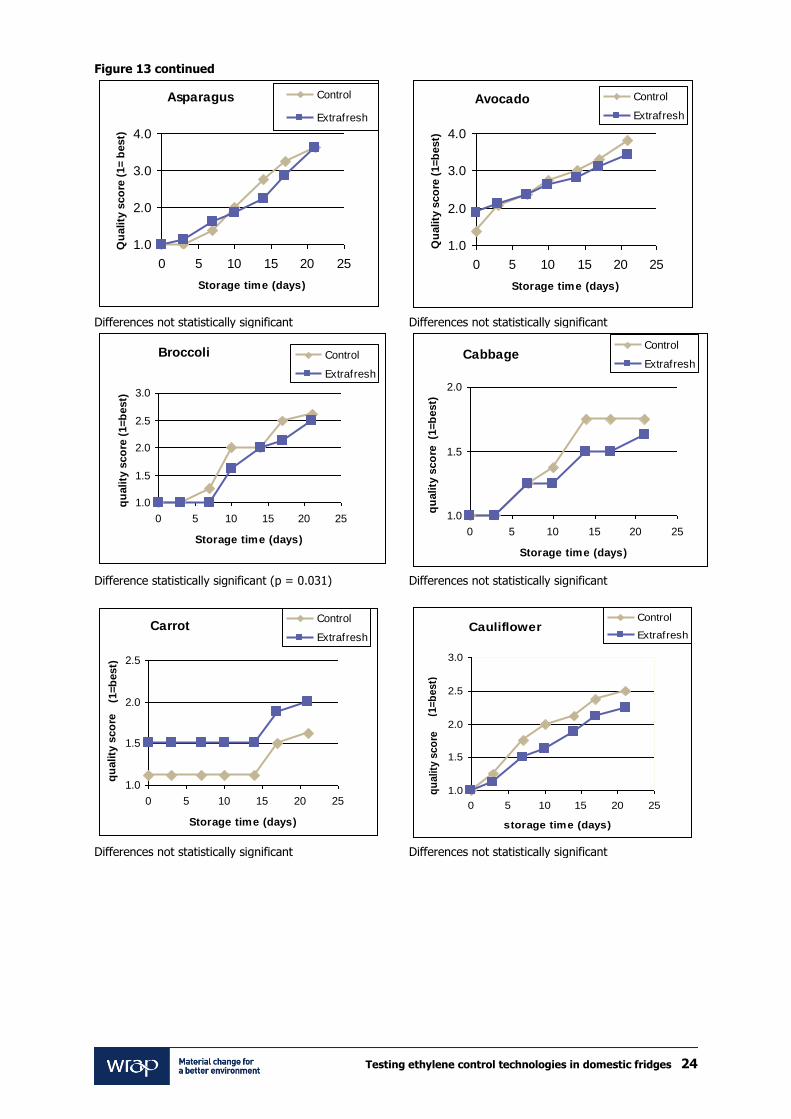
3.2.2 The effect of Extrafresh discs on product quality The quality of each product during the three week storage period is summarised in Figure 13. The main
observations are as follows:
In terms of visual quality score, Extrafresh significantly slowed the rate of deterioration for broccoli, and
cucumber (just statistically significant to 10%).
For apples, no visible deterioration was observed throughout the storage period.
There were some other commodities for which there appeared to be a trend for slower deterioration with
Extrafresh, (cauliflower, cabbage, tomato) and some for which the quality seemed worse with Extrafresh
(lemon, mushroom). However, as the results were not statistically significant, this could have been random
effects due to natural product variability.
Internal quality was assessed at the end of three weeks for avocado and nectarines, but no differences were
observed between treatments.
No differences in rates of weight loss were observed for any product (data not shown).
Figure 13 Quality scores for fresh produce stored in domestic fridges over three weeks, with (blue) and without
(grey) Extrafresh discs. Each data point is the mean of values assessed for produce in four replicate fridges
Apple- Braeburn
0.5
1.0
1.5
2.0
0 5 10 15 20 25
Storage time (days)
Qu
ality
sco
re (
1= b
est)
Control
Extrafresh
Apple- G Smith
0.5
1.0
1.5
2.0
0 5 10 15 20 25
Storage time (days)
Qu
ality
sco
re (
1= b
est)
Control
Extrafresh
No treatment effects No treatment effects
Testing ethylene control technologies in domestic fridges 24
Figure 13 continued
Asparagus
1.0
2.0
3.0
4.0
0 5 10 15 20 25
Storage time (days)
Qu
ality
sco
re (
1= b
est)
Control
Extrafresh
Avocado
1.0
2.0
3.0
4.0
0 5 10 15 20 25
Storage time (days)
Qu
ality
sco
re (
1=b
est)
Control
Extrafresh
Differences not statistically significant Differences not statistically significant
Broccoli
1.0
1.5
2.0
2.5
3.0
0 5 10 15 20 25
Storage time (days)
qu
ality
sco
re (
1=b
est)
Control
Extrafresh
Cabbage
1.0
1.5
2.0
0 5 10 15 20 25
Storage time (days)
qu
ality
sco
re
Control
Extrafresh
(1=b
est)
Difference statistically significant (p = 0.031) Differences not statistically significant
Carrot
1.0
1.5
2.0
2.5
0 5 10 15 20 25
Storage time (days)
qu
ality
sco
re
Control
Extrafresh
(1=b
est)
Cauliflower
1.0
1.5
2.0
2.5
3.0
0 5 10 15 20 25
storage time (days)
qu
ality
sco
re
Control
Extrafresh
(1=b
est)
Differences not statistically significant Differences not statistically significant

Testing ethylene control technologies in domestic fridges 25
Figure 13 continued
Celery
1.0
1.5
2.0
2.5
3.0
3.5
0 5 10 15 20 25
Storage time (days)
Qu
ality
sco
re (
1=b
est)
Control
Extrafresh
Cucumber
1.0
1.5
2.0
2.5
3.0
3.5
0 5 10 15 20 25
Storage time (days)
Qu
ality
sco
re (
1=b
est)
Control
Extrafresh
Differences not statistically significant Differences statistically significant to 10% (p = 0.079)
Grape
1.0
1.5
2.0
2.5
0 5 10 15 20 25
Storage time (days)
Qu
ality
sco
re (
1=b
est)
Control
Extrafresh
Kiwifruit
1.0
1.2
1.4
1.6
0 5 10 15 20 25
Storage time (days)
Qu
ality
sco
re (
1=b
est)
Control
Extrafresh
Differences not statistically significant Differences not statistically significant
Lemon
1.0
1.2
1.4
1.6
0 5 10 15 20 25
Storage time (days)
Qu
ality
sco
re (
1=b
est)
Control
Extrafresh
Lettuce
1.0
2.0
3.0
4.0
5.0
0 5 10 15 20 25
Storage time (days)
Qu
ality
sco
re (
1=b
est)
Control
Extrafresh
Differences not statistically significant Differences not statistically significant

Testing ethylene control technologies in domestic fridges 26
Figure 13 continued
Melon
1.0
2.0
3.0
4.0
5.0
6.0
0 5 10 15 20 25
Storage time (days)
Qu
ality
sco
re (
1=b
est)
Control
Extrafresh
Mushroom
1.0
2.0
3.0
4.0
5.0
0 5 10 15 20 25
Storage time (days)
Qu
ality
sco
re (
1=b
est)
Control
Extrafresh
Differences not statistically significant Differences not statistically significant
Nectarine
1.0
2.0
3.0
4.0
0 5 10 15 20 25
Storage time (days)
Qu
ality
sco
re (
1=b
est)
Control
Extrafresh
Pear
0.8
1.0
1.2
1.4
0 5 10 15 20 25
Storage time (days)
Qu
ality
sco
re (
1=b
est)
Control
Extrafresh
Differences not statistically significant Differences not statistically significant
Pepper
1.0
1.5
2.0
2.5
3.0
3.5
0 5 10 15 20 25
Storage time (days)
Qu
ality
sco
re (
1=b
est)
Control
Extrafresh
Satsuma
0.8
1.0
1.2
1.4
1.6
0 5 10 15 20 25
Storage time (days)
Qu
ality
sco
re (
1=b
est)
Control
Extrafresh
Differences not statistically significant Differences not statistically significant

Testing ethylene control technologies in domestic fridges 27
Figure 13 continued
Strawberry
1.0
2.0
3.0
4.0
5.0
6.0
0 5 10 15 20 25
Storage time (days)
Qu
ality
sco
re (
1=b
est)
Control
Extrafresh
Tomato
0.8
1.0
1.2
1.4
1.6
1.8
0 5 10 15 20 25
Storage time (days)
Qu
ality
sco
re (
1=b
est)
Control
Extrafresh
Differences not statistically significant Differences not statistically significant
3.3 Assessing the effect of ozone treatment
3.3.1 The effect of ozone treatment on measured ethylene levels
Figure 14 shows the measured ethylene levels within the fridges with and without the ozone generator. No effect
of the ozone generator could be observed at the output, discharge interval and frequency settings selected. The
concentration of ethylene, generally 2,000 – 5,000 ppb, was greater than the controls in the previous trial. This
presumably indicates a difference in the behaviour of the fresh produce.
Each set of data refers to measurements from an individual fridge. Measurements were made on Monday and
Thursday mornings. Fridge doors were opened for 30 seconds on Monday – Friday in the morning (after ethylene
assessment) and in the late afternoon. Doors were not opened during the weekend.
Figure 14 Ethylene levels measured within fridges with or without an ozone generator
0
1000
2000
3000
4000
5000
6000
7000
0 5 10 15 20 25
Storage time (Days)
Eth
yle
ne c
on
cen
trati
on
(p
pb
)
Control 1
Control 2
Control 3
Control 4
Ozone 1
Ozone 2
Ozone 3
Ozone 4
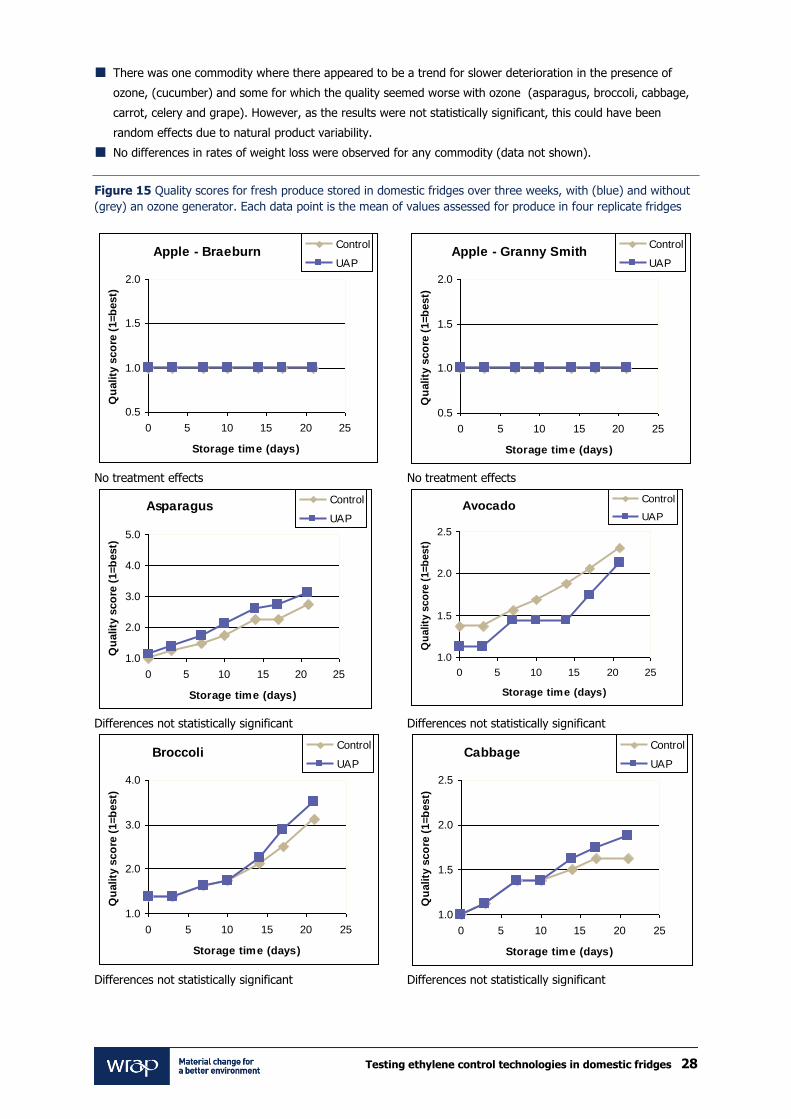
3.3.2 The effect of the ozone generator on product quality
The quality of each product during the three week storage period is summarised in Figure 15. The main
observations are as follows:
No clear effects on quality of produce were observed.
For apples no visible deterioration was observed throughout the storage period.
Testing ethylene control technologies in domestic fridges 28
There was one commodity where there appeared to be a trend for slower deterioration in the presence of
ozone, (cucumber) and some for which the quality seemed worse with ozone (asparagus, broccoli, cabbage,
carrot, celery and grape). However, as the results were not statistically significant, this could have been
random effects due to natural product variability.
No differences in rates of weight loss were observed for any commodity (data not shown).
Figure 15 Quality scores for fresh produce stored in domestic fridges over three weeks, with (blue) and without
(grey) an ozone generator. Each data point is the mean of values assessed for produce in four replicate fridges
Apple - Braeburn
0.5
1.0
1.5
2.0
0 5 10 15 20 25
Storage time (days)
Qu
ality
sco
re (
1=b
est)
Control
UAP
Apple - Granny Smith
0.5
1.0
1.5
2.0
0 5 10 15 20 25
Storage time (days)
Qu
ality
sco
re (
1=b
est)
Control
UAP
No treatment effects No treatment effects
Asparagus
1.0
2.0
3.0
4.0
5.0
0 5 10 15 20 25
Storage time (days)
Qu
ality
sco
re (
1=b
est)
Control
UAP
Avocado
1.0
1.5
2.0
2.5
0 5 10 15 20 25
Storage time (days)
Qu
ality
sco
re (
1=b
est)
Control
UAP
Differences not statistically significant Differences not statistically significant
Broccoli
1.0
2.0
3.0
4.0
0 5 10 15 20 25
Storage time (days)
Qu
ality
sco
re (
1=b
est)
Control
UAP
Cabbage
1.0
1.5
2.0
2.5
0 5 10 15 20 25
Storage time (days)
Qu
ality
sco
re (
1=b
est)
Control
UAP
Differences not statistically significant Differences not statistically significant

Testing ethylene control technologies in domestic fridges 29
Figure 15 continued
Carrot
0.8
1.0
1.2
1.4
0 5 10 15 20 25
Storage time (days)
Qu
ality
sco
re (
1=b
est)
Control
UAP
Cauliflower
1.0
1.5
2.0
2.5
3.0
0 5 10 15 20 25
Storage time (days)
Qu
ality
sco
re (
1=b
est)
Control
UAP
Differences not statistically significant Differences not statistically significant
Celery
1.0
1.2
1.4
1.6
1.8
2.0
0 5 10 15 20 25
Storage time (days)
Qu
ality
sco
re (
1=b
est)
Control
UAP
Cucumber
1.0
1.5
2.0
2.5
3.0
3.5
0 5 10 15 20 25
Storage time (days)
Qu
ality
sco
re (
1=b
est)
Control
UAP
Differences note statistically significant Differences not statistically significant
Grape
1.0
1.2
1.4
1.6
0 5 10 15 20 25
Storage time (days)
Qu
ality
sco
re (
1=b
est)
Control
UAP
Kiwifruit
1.0
1.2
1.4
1.6
0 5 10 15 20 25
Storage time (days)
Qu
ality
sco
re (
1=b
est)
Control
UAP
Differences not statistically significant Differences not statistically significant

Testing ethylene control technologies in domestic fridges 30
Figure 15 continued
Lemon
0.8
1.0
1.2
1.4
1.6
0 5 10 15 20 25
Storage time (days)
Qu
ality
sco
re (
1=b
est)
Control
UAP
Lettuce
1.0
2.0
3.0
4.0
0 5 10 15 20 25
Storage time (days)
Qu
ality
sco
re (
1=b
est)
Control
UAP
Differences not statistically significant Differences not statistically significant
Melon
1.0
2.0
3.0
4.0
0 5 10 15 20 25
Storage time (days)
Qu
ality
sco
re (
1=b
est)
Control
UAP
Mushroom
1.0
2.0
3.0
4.0
5.0
6.0
0 5 10 15 20 25
Storage time (days)
Qu
ality
sco
re (
1=b
est)
Control
UAP
Differences not statistically significant Differences not statistically significant
Nectarine
1.0
1.5
2.0
2.5
0 5 10 15 20 25
Storage time (days)
Qu
ality
sco
re (
1=b
est)
Control
UAP
Pear
0.5
1.0
1.5
2.0
0 5 10 15 20 25
Storage time (days)
Qu
ality
sco
re (
1=b
est)
Control
UAP
Differences not statistically significant Differences not statistically significant

Testing ethylene control technologies in domestic fridges 31
Figure 15 continued
Pepper
1.0
1.2
1.4
1.6
0 5 10 15 20 25
Storage time (days)
Qu
ality
sco
re (
1=b
est)
Control
UAP
Satsuma
1.0
1.2
1.4
1.6
1.8
0 5 10 15 20 25
Storage time (days)
Qu
ality
sco
re (
1=b
est)
Control
UAP
Differences not statistically significant Differences not statistically significant
Strawberry
1.0
2.0
3.0
4.0
5.0
6.0
0 5 10 15 20 25
Storage time (days)
Qu
ality
sco
re (
1=b
est)
Control
UAP
Tomato
1.0
1.5
2.0
2.5
3.0
0 5 10 15 20 25
Storage time (days)
Qu
ality
sco
re (
1=b
est)
Control
UAP
Differences not statistically significant Differences not statistically significant
3.4 Assessing the effect of SmartfreshTM treatment
3.4.1 The effect of SmartfreshTM treatment on measured ethylene concentrations
Figure 16 shows the measured ethylene levels within the fridges, with and without prior SmartfreshTM (1-MCP)
treatment. There was a trend for lower ethylene levels in the fridges containing SmartfreshTM treated products.
Each set of data refers to measurements from an individual fridge. Measurements were made on Monday and
Thursday mornings. Fridge doors were opened for 30 seconds on Monday – Friday in the morning (after ethylene
assessment) and in the late afternoon. Doors were not opened during the weekend.

Testing ethylene control technologies in domestic fridges 32
Figure 16 Ethylene concentrations measured within fridges with or without prior SmartfreshTM treatment
0
1000
2000
3000
4000
5000
6000
0 5 10 15 20 25
Storage time (Days)
Eth
yle
ne
Co
nc
en
tra
tio
n (
pp
b)
Control 1
Control 2
Control 3
Control 4
Smartfresh 1
Smartfresh 2
Smartfresh 3
Smartfresh 4
3.4.2 The effect of SmartfreshTM treatment on product quality
The quality scores for produce kept in a fridge for three weeks with and without treatment with SmartfreshTM are
illustrated in the graphs below (Figure 18). The main observations are as follows.
In terms of visual quality score, SmartfreshTM treatment significantly slowed the rate of deterioration for
broccoli, peppers and nectarines, with an estimated shelf-life extension of five days and three days for
broccoli and peppers respectively.
For several products there was a trend for slower deterioration after SmartfreshTM treatment, but this was not
statistically significant (avocado, carrot, cauliflower and celery).
For other products no significant effects of SmartfreshTM treatment on visual quality was observed.
For kiwifruit, firmness measured by penetrometer after three weeks storage was significantly greater in
SmartfreshTM treated fruit than controls (Figure 17). Although this demonstrates the potential of SmartfreshTM
to slow down ripening, in this case this cannot be considered as a beneficial effect, as the kiwifruits remained
firmer than would normally be acceptable to consumers.
Internal quality was assessed at the end of three weeks for avocado and nectarines, but no differences were
observed between treatments.
No differences in rates of weight loss were observed for any commodity (data not shown).
Figure 17 Mean firmness of kiwifruits after three weeks storage in a fridge with and without prior treatment with
SmartfreshTM (1-MCP). Each data point is the mean of four fruits
0
2
4
6
8
10
12
14
16
18
Fir
mn
es
s (N
)
Controls Smartfresh treated

Testing ethylene control technologies in domestic fridges 33
Figure 18 Quality scores for fresh produce stored in domestic fridges over three weeks, with (blue) and without
(grey) prior treatment with SmartfreshTM. Each data point is the mean of values assessed for produce in four
replicate fridges
Apple - Braeburn
0.5
1.0
1.5
2.0
0 5 10 15 20 25
Storage time (days)
Qu
ality
sco
re (
1=b
est)
Control
SmartFresh
Apple - Granny Smith
0.5
1.0
1.5
2.0
0 5 10 15 20 25
Storage time (days)
Qu
ality
sco
re (
1=b
est)
Control
SmartFresh
No treatment effects No treatment effects
Asparagus
1.0
2.0
3.0
4.0
5.0
0 5 10 15 20 25
Storage time (days)
Qu
ality
sco
re (
1=b
est)
Control
SmartFresh
Avocado
1.0
1.2
1.4
1.6
1.8
2.0
0 5 10 15 20 25
Storage time (days)
Qu
ality
sco
re (
1=b
est)
Control
SmartFresh
Differences not statistically significant Differences not statistically significant
Broccoli
1.0
1.5
2.0
2.5
3.0
0 5 10 15 20 25
Storage time (days)
Qu
ality
sco
re (
1=b
est)
Control
SmartFresh
Cabbage
1.0
1.2
1.4
1.6
1.8
2.0
0 5 10 15 20 25
Storage time (days)
Qu
ality
sco
re (
1=b
est)
Control
SmartFresh
Treatment effect significant (p<0.005) Differences not statistically significant

Testing ethylene control technologies in domestic fridges 34
Figure 18 continued
Carrot
1.0
1.5
2.0
2.5
0 5 10 15 20 25
Storage time (days)
Qu
ality
sco
re (
1=b
est)
Control
SmartFresh
Cauliflower
1.0
1.5
2.0
2.5
3.0
0 5 10 15 20 25
Storage time (days)
Qu
ality
sco
re (
1=b
est)
Control
SmartFresh
Differences not statistically significant Differences not statistically significant
Celery
1.0
1.2
1.4
1.6
1.8
2.0
0 5 10 15 20 25
Storage time (days)
Qu
ality
sco
re (
1=b
est)
Control
SmartFresh
Cucumber
1.0
1.5
2.0
2.5
3.0
3.5
4.0
0 5 10 15 20 25
Storage time (days)
Qu
ality
sco
re (
1=b
est)
Control
SmartFresh
Differences not statistically significant Differences not statistically significant
Grape
1.0
1.5
2.0
2.5
3.0
0 5 10 15 20 25
Storage time (days)
Qu
ality
sco
re (
1=b
est)
Control
SmartFresh
Kiwifruit
0.5
1.0
1.5
2.0
0 5 10 15 20 25
Storage time (days)
Qu
ality
sco
re (
1=b
est)
Control
SmartFresh
Differences not statistically significant Differences not statistically significant

Testing ethylene control technologies in domestic fridges 35
Figure 18 continued
Lemon
0.5
1.0
1.5
2.0
0 5 10 15 20 25
Storage time (days)
Qu
ality
sco
re (
1=b
est)
Control
SmartFresh
Lettuce
1.0
1.5
2.0
2.5
3.0
3.5
4.0
0 5 10 15 20 25
Storage time (days)
Qu
ality
sco
re (
1=b
est)
Control
SmartFresh
Differences not statistically significant Differences not statistically significant
Melon
1.0
2.0
3.0
4.0
5.0
6.0
0 5 10 15 20 25
Storage time (days)
Qu
ality
sco
re (
1=b
est)
Control
SmartFresh
Mushroom
1.0
2.0
3.0
4.0
5.0
6.0
0 5 10 15 20 25
Storage time (days)
Qu
ality
sco
re (
1=b
est)
Control
SmartFresh
Differences not statistically significant Differences not statistically significant
Nectarine
0.8
1.0
1.2
1.4
1.6
1.8
2.0
0 5 10 15 20 25
Storage time (days)
Qu
ality
sco
re (
1=b
est)
Control
SmartFresh
Pear
0.5
1.0
1.5
2.0
0 5 10 15 20 25
Storage time (days)
Qu
ality
sco
re (
1=b
est)
Control
SmartFresh
Treatment effects statistically significant to 10% (p =
0.086)
Differences not statistically significant

Testing ethylene control technologies in domestic fridges 36
Figure 18 continued
Pepper
1.0
1.5
2.0
2.5
0 5 10 15 20 25
Storage time (days)
Qu
ality
sco
re (
1=b
est)
Control
SmartFresh
Satsuma
0.5
1.0
1.5
2.0
0 5 10 15 20 25
Storage time (days)
Qu
ality
sco
re (
1=b
est)
Control
SmartFresh
Treatment effects statistically significant (p= 0.025) No treatment effects
Strawberry
1.0
2.0
3.0
4.0
5.0
6.0
0 5 10 15 20 25
Storage time (days)
Qu
ality
sco
re (
1=b
est)
Control
SmartFresh
Tomato
1.0
1.5
2.0
2.5
0 5 10 15 20 25
Storage time (days)
Qu
ality
sco
re (
1=b
est)
Control
SmartFresh
Differences not statistically significant Differences not statistically significant

Testing ethylene control technologies in domestic fridges 37
4.0 Summary and discussion of findings
4.1 Fridge temperatures and normal shelf-life of produce
During the three trials described in this report to test ethylene management technologies within domestic fridges,
it was decided to set the fridges at 4°C as recommended by fridge manufacturers. Actual temperatures measured
ranged from 3.6 to 4.2°C. Table 10 shows the shelf-life of products in the absence of ethylene control
technologies for the three main trials conducted during this project. All products had a shelf-life of seven or more
days. Eight of the 21 commodities had a shelf-life greater than 21 days for all three trials, and only five
(cucumber, lettuce, cut melon, mushroom and strawberries) had a shelf-life less than the 21 days of the test for
all three trials. As it is unlikely that commodities would be kept for longer than three weeks in the home, this
could indicate that, if fridge temperatures are well controlled, the need for technologies to extend shelf-life
beyond this time may be of limited value.
However, a recent study by WRAP25 suggested that domestic fridges are generally kept at temperatures higher
than the recommendation of 4°C. A study of 48 domestic fridges found that a significant proportion of the fridges
tested (14 fridges, 29% of the sample) were operating at mean fridge temperatures of 9°C or above. Only 14 of
the 48 fridges (29% of the sample) were found to be at mean temperatures of 5°C or less, with only 34 fridges
(70%) operating below 8°C. Under these conditions faster rates of deterioration could be expected.
Table 10 Shelf-life of produce in fridges in the absence of ethylene control technologies
Product Packaging Quality score
equivalent to
limit of good
quality
Estimated shelf-life (days)
Trial 1
(Oct/ Nov)
Trial 2
(Jan/ Feb)
Trial 3
(Mar)
Apple Open bag >2 > 21 > 21 > 21
Asparagus Open bag 3 > 21 >21 18
Avocadoes Unbagged 3 14 > 21 >21
Broccoli Open bag 3 > 21 20 > 21
Cabbage Open bag 3 > 21 > 21 > 21
Carrot Open bag 2 > 21 > 21 14
Cauliflower Open bag 3 > 21 > 21 > 21
Celery Open bag 2 8 > 21 > 21
Cucumber Sleeved, cut into 2 halves 2 9 16 17
Grapes Open bag 2 13 > 21 18
Green Pepper Unbagged 3 > 21 > 21 > 21
Kiwifruit Open bag 3 > 21 > 21 > 21
Lemon Open bag 2 > 21 > 21 > 21
Lettuce Open bag 2 7 10 10
Melon Cut into 2 halves 2 7 7 7
Mushroom Paper bag 3 17 12 14
Nectarine Open bag 2 12 >21 >21
Pear Open bag 3 >21 >21 >21
Satsuma Open bag >2 >21 >21 >21
Strawberries Plastic punnet 2 13 9 9
Tomatoes Open bag 2 >21 12 >21
A score of 1 indicates optimum quality. Scores increase as quality decreases. Differences in shelf-life between the
trials are due to produce quality changes in accordance with season.
4.2 Ethylene levels in fridges
As discussed in section 2.3, at the start of this study two selections of produce were tested for their effects on
levels of ethylene within fridges (see Table 10). For selection A, considered to represent a typical domestic fridge,
ethylene concentrations were below 500 ppb, whereas for selection B, with more „high ethylene producers‟ as
expected with increased refrigeration of fresh produce, the ethylene concentrations ranged between 1,500 and
25 Reducing waste through the chill chain, WRAP, August 2010

Testing ethylene control technologies in domestic fridges 38
3,500 ppb. The main trials of this project were conducted using selection B, in order to determine produce shelf-
life and the effects of ethylene control technologies in the presence of high ethylene producers. During the main
trials using selection B, ethylene concentrations measured ranged from 2,500 ppb to 4,500 ppb. It should be
noted that all these levels are high relative to average ethylene concentrations measured through the supply
chain, as indicated by Figure 19 (reproduced from research undertaken in a related part of this project26).
Figure 19 Average ethylene level measured by location within the supply chain
0
200
400
600
800
1000
1 3 5 7 9 11 13 15 17 19 21 23 25 27 29 31 33 35 37 39 41 43
Eth
yle
ne c
on
cen
trati
on
(p
pb
)
Store roomsPackhousesDepotsBack of shopRetail area
Source “Ethylene levels and microbial load in the fresh produce retail supply chain” (WRAP 2010)
4.3 The effect of tested technologies on ethylene levels
Under the high ethylene levels tested, Extrafresh discs (six per fridge) reduced ethylene levels significantly from a
range of 1,000 – 4,000 ppb down to near 500 ppb. The ozone generator had no significant effect at the output,
discharge interval and frequency settings selected. SmartfreshTM treatment reduced the concentration from a
range of 2,000 – 5,000 ppb down to 1,000 - 4,000 ppb.
A review of the scientific literature27 has indicated that many commodities may be sensitive to ethylene down to
levels < 100 ppb. As this was not achieved within these trials, there may be potential to improve quality further
through ethylene control in a way that could not be demonstrated in these trials. The use of SmartfreshTM, which
works by blocking ethylene action, may provide a useful indication of the potential for more effective ethylene
control.
4.4 The effect of tested technologies on product quality for specific products
The main observations on product quality are summarised in Table 11. Only the products for which an effect was
observed have been included. A more detailed description of each of these products is included below.
26 Ethylene and microbial hotspots in the fresh produce supply chain, WRAP, February 2011
27 Reported in Ethylene and microbial hotspots in the fresh produce supply chain, WRAP, February 2011

Testing ethylene control technologies in domestic fridges 39
Table 11 Effects of technologies on product quality
Product Packaging Effect of technology
Extrafresh Ozone generator SmartfreshTM
Broccoli Open bag Improved quality Improved quality
Cucumber Sleeved, cut into
two
Improved quality
Green pepper Unbagged Improved quality
Kiwifruit Increased firmness
Nectarine Open bag Improved quality
4.4.1 Broccoli
In the case of broccoli, improvements in quality were observed for Extrafresh discs and SmartfreshTM. Broccoli
kept well in the fridges and only passed the limit of acceptable quality in the ozone generator trial. A very rough
estimate of the effect on shelf-life of a technology can be made by extrapolating the quality score change on the
assumption that it changes in a linear fashion. For example, for SmartfreshTM treatment (Figure 20) extrapolation
indicates an extension in shelf-life of approximately 11 days (from 22 to 33 days from placement in the fridge),
given that the limit of acceptability is reached at a score of 3.
The scientific literature indicates that broccoli is sensitive to very low levels of ethylene <100 ppb. This suggests
that if a technology were used that could remove ethylene more effectively than Extrafresh, the benefits may be
more substantial. The SmartfreshTM results confirm this.
Figure 20 Quality scores for broccoli in control and SmartfreshTM treated fridges with extrapolation of data
1.0
1.5
2.0
2.5
3.0
3.5
0 10 20 30 40
Days in fridge
Qu
ali
ty s
co
re Control
SmartFresh
Control extrapolated
SmartFresh extrapolated

Testing ethylene control technologies in domestic fridges 40
4.4.2 Cucumber
Trials indicated the cucumber quality maintenance could be improved by Extrafresh discs. Figure 21 indicates a
six-day shelf-life extension, assuming that the limit of acceptability is a score of 2. As for broccoli, there are
indications that cucumber is sensitive to ethylene concentrations below 100 ppb, so that more efficient ethylene
removal would have greater effects than we have found.
Figure 21 Quality scores for cucumber in control and Extrafresh treated fridges
Cucumber
1.0
1.5
2.0
2.5
3.0
3.5
0 5 10 15 20 25
Days in Fridge
Qu
ality
sco
re
Control
Extrafresh
4.4.3 Green pepper
The quality of green peppers could potentially be improved by treatment with SmartfreshTM. During the time scale
of the trials the peppers did not reach their limit of acceptable quality. However, extrapolation of the data
suggests that the extension of shelf-life could be 6-7 days (26 – 32/33 days after placement in the fridge),
assuming that the limit of acceptability is reached at a score of 3 (Figure 22).
Figure 22 Quality scores for green pepper in control and SmartfreshTM treated fridges with extrapolation of data
0.0
0.5
1.0
1.5
2.0
2.5
3.0
3.5
0 10 20 30 40
Days in fridge
Qu
ali
ty s
co
re Control
SmartFresh
Control extrapolated
SmartFresh extrapolated

Testing ethylene control technologies in domestic fridges 41
4.4.4 Nectarine
Nectarine quality was improved by SmartfreshTM, but from existing data it is not possible to relate this directly to
a shelf-life extension (Figure 23).
Figure 23 Quality scores for nectarine in control and SmartfreshTM treated fridges
Nectarine
0.8
1.0
1.2
1.4
1.6
1.8
2.0
0 5 10 15 20 25
Days in fridge
Qu
ali
ty s
co
re
Control
SmartFresh

Testing ethylene control technologies in domestic fridges 42
5.0 Conclusions
The objective of this study was to test produce shelf-life and the impact of three ethylene control technologies in
domestic fridges under the scenario of increased fridge storage of fruit and vegetables. A range of produce was
chosen that offered a “worse case” scenario in terms of likely ethylene concentrations in the fridges. This
produced conditions similar to those for which the original observations on the detrimental effect of high ethylene
producers had been made28. Under these conditions we made the following observations.
5.1 Shelf-life of fresh produce under refrigeration without ethylene control technologies
Even though the concentrations of ethylene in the fridge trials were high compared to other parts of the supply
chain, all products tested had a shelf-life of 7 or more days, with many greater than the 21 days of the trials.
5.2 Extrafresh discs
Using six Extrafresh discs, the ethylene levels were reduced from 1,000-4,000 ppb down to 500 ppb. Reduced
rates of deterioration that were statistically significant were observed for broccoli and cucumber, with some
indications for improved quality for other produce. Given knowledge of the sensitivity to ethylene of these
products, this effect could be expected to be greater if ethylene levels could be reduced further. WRAP‟s work on
the whole supply chain indicates that the produce is exposed to the highest levels of ethylene in the domestic
fridge, and although this is the last stage of the chain and therefore the effects would be less significant, removal
of ethylene may be advantageous. The technology presently on offer is, however, not efficient enough. Further
technical development is necessary, and could be valuable for waste reduction.
5.3 Ozone generation
The ozone generator had no significant effect on the levels of ethylene in the fridges at the output, discharge
interval and frequency settings selected and under these conditions. It could be that by using a “worse case
scenario” the trials moved beyond the control range of ethylene concentration for this technology. However,
ozone has other beneficial effects, including being fungistatic. The potential use of ozone throughout the fresh
produce supply chain is presently a subject of great interest and deserves more study.
5.4 SmartfreshTM
SmartfreshTM treatment slowed down deterioration in broccoli, peppers and nectarines. It had a very significant
effect on the softening of kiwifruit, although this cannot be considered beneficial at this stage of the supply chain
as the fruit was not soft enough to be acceptable even at the end of three weeks. However, these results
indicate the potential value of SmartfreshTM for maintaining fresh produce quality. Therefore, SmartfreshTM could
be more valuable earlier in the supply chain but the technology is not at a stage for it to be recommended for use
in domestic fridges.
5.5 The potential benefits of complete ethylene removal
The results indicate that for some produce, notably broccoli, cucumber, green pepper and nectarine, ethylene
control has potential to increase shelf-life. Tests with complete removal of ethylene during storage would confirm
whether under some circumstances this is a strategy that could improve handling and reduce waste
5.6 Recommendations
Work on the whole fresh produce supply chain indicates that produce is exposed to the highest levels of ethylene
in the domestic fridge. Despite this, with good fridge temperature control, but infrequent door opening, even
when using a range of fresh produce with high ethylene production, the shelf-life of all fresh produce tested was
seven days or more. This shelf-life is sufficient for most domestic households, suggesting that where fridge
temperatures are well controlled, and the increased frequency of door opening associated with normal fridge use,
the use of ethylene control technologies at this stage of the supply chain is unlikely to have great benefits and
should not be given high priority.
28 Exploratory trials conducted following previous WRAP research, Helping consumers reduce fruit and vegetable waste, WRAP, April 2008

Testing ethylene control technologies in domestic fridges 43
Appendix 1 Visual scoring system
Apple
1. Bright, turgid, not greasy. 2. Less shine, slightly greasy, firm.
Note: scores above 2 are not shown as apples did not deteriorate beyond this level during the whole timescale of
trials.

Testing ethylene control technologies in domestic fridges 44
Asparagus
1. Cut ends dry. Spears straight, turgid and glossy.
Tips closed and compact.
2. Cut ends disease free. Stalks turgid. Tips starting
to open.
3. Tips showing curvature and continued
feathering. Overall spears less glossy and green.
4. Extensive mould growth. Extreme tip extension.
Loss of turgidity and colour.

Testing ethylene control technologies in domestic fridges 45
Avocado
1. Firm and shiny 2. Firm and shiny. Less green coloration visible.
3. Completely purple – no green colouration
remaining.
4. Purple colour darkening. Stalk scar grey.
5. Colour almost black. Mould on stalk scar.

Testing ethylene control technologies in domestic fridges 46
Broccoli
1. Tight heads, blue tinge. Green leaves, firm stalk.
5. Yellowing increasing. More brown heads.
2. Heads less tight. Occasional yellowing of florets.
Outer leaves wilted.
6. Almost completely yellow
3. Increase in yellowing.
7. All florets yellow or brown. Some mould.
4. Over third of surface yellow. Some browning.

Testing ethylene control technologies in domestic fridges 47
Cabbage
1. Leaves turgid and green. Cut end dry, white and
clean.
3. Increase in yellowing and root growth.
2. Slight yellowing of outer leaf edges. Some root
growth on cut end.
4. Yellowing progressing down leaf margins of outer
leaves. Heart still firm and compact.

Testing ethylene control technologies in domestic fridges 48
Carrot
1. Blemish free and turgid. Clean stalk base.
2. Still turgid. Slight browning of root initials.
3. Progressive blackening of root initials. Continued shoot growth.
4. Extensive silvering. Progression of stalk re-growth and browning. Root initials
continue to blacken.

Testing ethylene control technologies in domestic fridges 49
Cauliflower
1. Cut stalks white. Leaves green. Curd tight, clean and
white.
4. Remaining leaves dehydrating. Curd centre
opening out with isolated areas of browning.
2. Leaves generally turgid with laminae yellowing. Cut
ends browning. Curd still compact, white and clean.
5. Complete leaf abscission. Curd still compact away
from middle. Creamy coloured with slight peppering
and browning.
3. Some leaf loss. Remaining leaves yellowing. Curd less
compact but still clean and white.

Testing ethylene control technologies in domestic fridges 50
Celery
1. Green central leaves. Stems compact and turgid with dry clean ends.
2. Stems splaying but still turgid. Base and stem ends slight browning.
3. Leaves growing. Stems more yellow with some areas of slight decay. Stem
splaying increasing.
4. Increase in browning of base. Pronounced splaying of stems. Leaves
yellowing. Progressed decay.

Testing ethylene control technologies in domestic fridges 51
Cucumber
1. Turgid and firm. Dark green, disease free, no lesions.
2. Shrivel on stalk end. Still firm. Lighter green/yellow lines and areas visible. Some transport damage.
3. Stalk end extremely shrivelled. Approx. half surface area yellow. Overall scuffed and dried out.

Testing ethylene control technologies in domestic fridges 52
Grape
1. Stems and berries generally green and firm.
2. Berries firm but showing browning around stalk
attachment and small areas of damage. Some stem
browning.
3. More damage and disease visible. Majority of fruit still
firm.
4. Level of disease increasing.
5. Extensive rot development. Few healthy fruit
remaining.

Testing ethylene control technologies in domestic fridges 53
Kiwifruit
1. Firm and blemish free
2. Still firm. Some darker patches
visible on skin.
3. Darker patches more prevalent.

Testing ethylene control technologies in domestic fridges 54
Lemon
1. Firm to touch. Peel bright, shinny and unblemished.
2. Still firm. Slightly less shinny, small isolated brown
marks evident.
3. Some skin surface deterioration and browning at stalk
end.

Testing ethylene control technologies in domestic fridges 55
Lettuce
1. Cut end brown but dry. Stem tissue white. Leaves
green and turgid.
3. Progression in effects of damage. Outer leaves
yellow and wilted. Head still firm and green.
2. Some damage evident on stems and leaves. Slight
yellowing and loss of turgidity in outer leaves.
4. Significant damage and decay on outer regions.
Heart still green and turgid.

Testing ethylene control technologies in domestic fridges 56
Melon
1. Firm texture. Cut surface shinny
with green outer ring and creamy
centre. No disease.
2. Cut surface showing effects of
drying.
Texture less firm.
3. Flesh level lower than outer skin.
4. Flesh increasingly sunken. Slight
mould development.
Overall texture still firm.
5. Flesh sunken. Increase in mould
development.
6. Extensive mould coverage.

Testing ethylene control technologies in domestic fridges 57
Mushroom
1. Buttons tight. Cut ends white and dry. Overall colour white.
2. Some gill exposure. Overall colour off-white.
3. All gills exposed. Cut ends browning. Caps developing feathered
effect around edges. Overall colour more brown.
4. Gills fully exposed. Cut ends brown. Caps scaly and browning.
5. Dehydration evident. Disease on cut ends. Overall brown
shrivelled appearance.
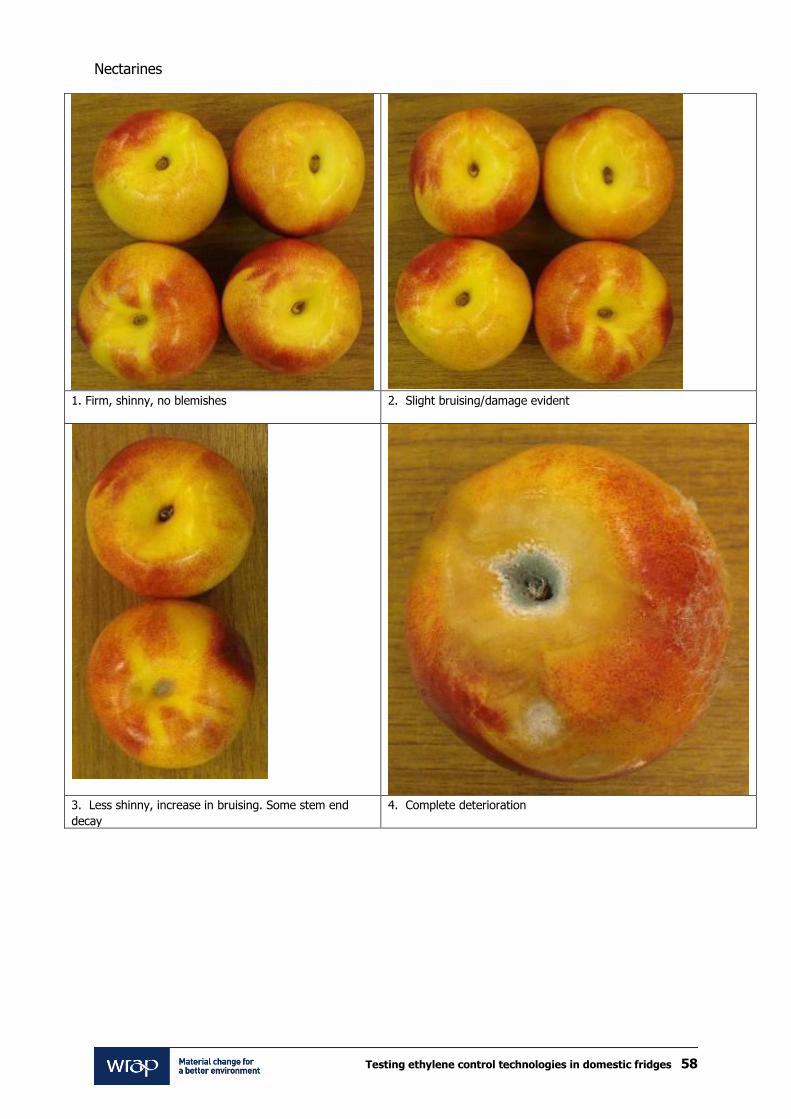
Testing ethylene control technologies in domestic fridges 58
Nectarines
1. Firm, shinny, no blemishes
2. Slight bruising/damage evident
3. Less shinny, increase in bruising. Some stem end
decay
4. Complete deterioration

Testing ethylene control technologies in domestic fridges 59
Pear
1. No shrivel. Firm and turgid. Green colour (1.0)
3. Generally softer, riper. More yellow (2.5)
2. No shrivel, firm. Slight skin damage.
Less green
(1.5)
4. Softer. Progression in evidence of damage. Further yellowing
(3.0)

Testing ethylene control technologies in domestic fridges 60
Pepper
1. Shiny, turgid, no wrinkles. Stem healthy. Dark green.
2. Less shiny. Slight browning on stalk end; minor shrivel at top.
Still firm.
3. Slightly less green. Stalk browning progressing. Still firm.
4. Some mould around stalk. Firm with wrinkles around top. Colour
changing from green to orange.

Testing ethylene control technologies in domestic fridges 61
Orange
1. Firm to touch. Peel bright and shiny
2. Less bright and shiny
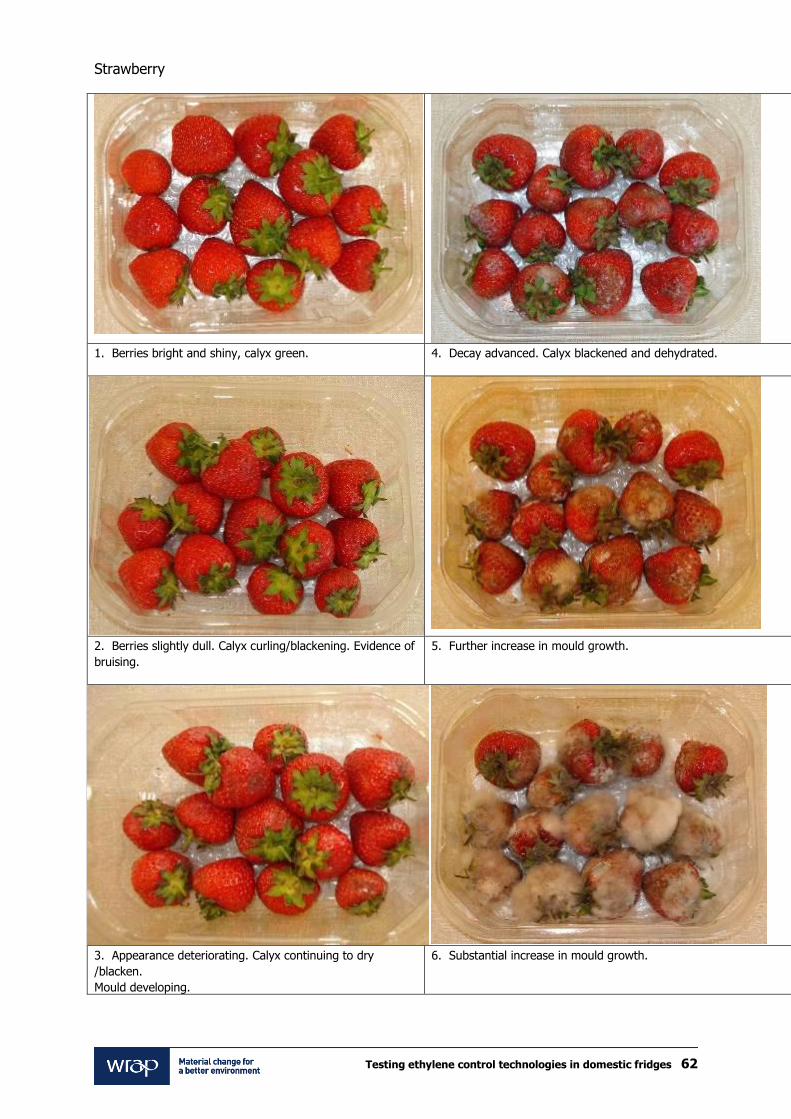
Testing ethylene control technologies in domestic fridges 62
Strawberry
1. Berries bright and shiny, calyx green.
4. Decay advanced. Calyx blackened and dehydrated.
2. Berries slightly dull. Calyx curling/blackening. Evidence of
bruising.
5. Further increase in mould growth.
3. Appearance deteriorating. Calyx continuing to dry
/blacken.
Mould developing.
6. Substantial increase in mould growth.

Testing ethylene control technologies in domestic fridges 63
Tomato
1. Calyx green, mould free. Firm and shinny.
3. Generally more red and soft. Progression of calyx
mould.
2. Calyx slightly mouldy. Firm and shiny, more red.
4. Further progression of calyx mould. Little other
visible change. Soft.

www.wrap.org.uk/retail