testing a two-state model of nanoconfined liquids: conformational equilibrium of ethylene glycol...
TRANSCRIPT

Testing a Two-State Model of Nanoconfined Liquids:Conformational Equilibrium of Ethylene Glycol in Amorphous Silica
Pores
Tolga S. Gulmen and Ward H. Thompson*
Department of Chemistry, UniVersity of Kansas, Lawrence, Kansas 66045
ReceiVed August 2, 2006. In Final Form: October 13, 2006
Molecular dynamics simulations of the conformational equilibrium of ethylene glycol in roughly cylindrical nanoscaleamorphous silica pores are presented and analyzed in the context of a two-state model of confined liquids. This modelassumes that an observable property of a confined liquid can be decomposed into a weighted average arising fromtwo subensembles with distinct physical attributes: molecules at the surface and molecules in the interior of the pore.It is further assumed that the molecules in the interior exhibit behavior that is indistinguishable from that of the bulkliquid. However, the present simulation results are not consistent with this two-state model. Neither the assumptionof two distinct subensembles nor the assumption that the interior molecules possess bulk-like behavior is supported.
1. Introduction
Materials with nanoscale porosity have attracted increasinginterest in recent years. This is due in part to the tremendousvariety of materials that can be used to confine molecules andliquids (e.g., sol-gels, zeolites, supramolecular assemblies,micelles, vesicles, and proteins). The search for suitable materialsis further motivated by potential applications of these materialsin a wide array of areas including catalysis, molecular separations,fuel cell electrodes and membranes, chemical sensors, andphotonic devices. However, despite advances in synthetictechniques for generating microporous and mesoporous materials,our understanding of chemistry in solvents confined on nanometerlength scales is still relatively limited.
A widely applied framework for explaining the differencesbetween the bulk and confined behavior of liquids is a two-statemodel. This model is based on two fundamental assumptions:first, that the liquid can be divided into two distinct subensembles,one consisting of molecules at the “surface” and the othercomposed of molecules in the “interior” of the pores, and second,that the interior liquid possesses nearly identical properties tothat of the bulk liquid. Together, these assumptions determinethe physical picture of the two-state model: the deviation of anobserved property from its bulk value must be due to only theliquid molecules affected by interactions with the surface, whichare distinct from the remaining bulk-like molecules.
A number of experimental approaches have been used to probea variety of physical equilibrium and dynamical phenomena ofnanoconfined liquids: conformational equilibria,1,2 vibrationalspectra,3-6reorientational dynamics,7-10solvation dynamics,11-17
and vibrational dephasing and relaxation.18-24 In many cases,the predictions of the two-state model are in accord with the
experimental results. However, there are also examples wherethe two-state model fails to explain the observed behavior.10,24
Moreover, there are cases where different properties of a singlesystem are probed, and it is found that some of the properties
* Corresponding author. E-mail: [email protected].(1) Luo, R.-S.; Jonas, J.J. Raman Spectrosc.2001, 32, 975-978.(2) Crupi, V.; Maisano, G.; Majolino, D.; Migliardo, P.; Venuti, V.J. Chem.
Phys.1998, 109, 7394-7404. Crupi, V.; Majolino, D.; Migliardo, P.; Venuti, V.J. Phys. Chem. A2000, 104, 11000-11012.
(3) Jain, T. K.; Varshney, M.; Maitra, A.J. Phys. Chem.1989, 93, 7409-7416.
(4) Riter, R. E.; Undiks, E. P.; Kimmel, J. R.; Levinger, N. E.J. Phys. Chem.B 1998, 102, 7931-7938. Riter, R. E.; Undiks, E. P.; Levinger, N. E.J. Am.Chem. Soc.1998, 120, 6062-6067.
(5) Venables, D. S.; Huang, K.; Schmuttenmaer, C. A.J. Phys. Chem. B2001,105, 9132-9138.
(6) Zhong, Q.; Steinhurst, D. A.; Carpenter, E. E.; Owrutsky, J. C.Langmuir2002, 18, 7401-7408.
(7) Zhang, J.; Jonas, J.J. Phys. Chem.1993, 97, 8812-8815. Korb, J.-P.; Xu,S.; Jonas, J.J. Chem. Phys.1993, 98, 2411-2422. Korb, J.-P.; Malier, L.; Cros,F.; Xu, S.; Jonas, J.Phys. ReV. Lett.1996, 77, 2312-2315. Korb, J.-P.; Xu, S.;Cros, F.; Malier, L.; Jonas, J.J. Chem. Phys.1997, 107, 4044-4050. Ballard,L.; Jonas, J.Langmuir1996, 12, 2798-2801.
(8) Loughnane, B. J.; Fourkas, J. T.J. Phys. Chem. B1998, 102, 10288-10294. Loughnane, B. J.; Scodinu, A.; Fourkas, J. T.J. Phys. Chem. B1999, 103,6061-6068. Loughnane, B. J.; Farrer, R. A.; Scodinu, A.; Reilly, T.; Fourkas,J. T.J. Phys. Chem. B2000, 104, 5421-5429. Farrer, R. A.; Fourkas, J. T.Acc.Chem. Res.2003, 36, 605-612. Zhu, X.; Farrer, R. A.; Fourkas, J. T.J. Phys.Chem. B2005, 109, 12724-12730.
(9) Loughnane, B. J.; Farrer, R. A.; Fourkas, J. T.J. Phys. Chem. B1998, 102,5409-5412. Loughnane, B. J.; Farrer, R. A.; Scodinu, A.; Fourkas, J. T.J. Chem.Phys.1999, 111, 5116-5123.
(10) Farrer, R. A.; Fourkas, J. T.Acc. Chem. Res.2003, 36, 605-612.(11) Zhang, J.; Bright, F. V.J. Phys. Chem.1991, 95, 7900-7907.(12) Cho, C. H.; Chung, M.; Lee, J.; Nguyen, T.; Singh, S.; Vedamuthu, M.;
Yao, S.; Zhu, J.-B.; Robinson, G. W.J. Phys. Chem.1995, 99, 7806-7812.(13) Streck, C.; Mel’nichenko, Y. B.; Richert, R.Phys. ReV. B1996,53, 5341-
5347. Richert, R.Phys. ReV. B 1996, 54, 15762-15766.(14) Riter, R. E.; Kimmel, J. R.; Undiks, E. P.; Levinger, N. E.J. Phys. Chem.
B 1997, 101, 8292-8297. Riter, R. E.; Willard, D. M.; Levinger, N. E.J. Phys.Chem. B1998, 102, 2705-2714. Pant, D.; Riter, R. E.; Levinger, N. E.J. Chem.Phys.1998, 109, 9995-10003. Willard, D. M.; Riter, R. E.; Levinger, N. E.J.Am. Chem. Soc.1998, 120, 4151-4160. Willard, D. M.; Levinger, N. E.J. Phys.Chem. B2000, 104, 11075-11080. Pant, D.; Levinger, N. E.Langmuir2000,16, 10123-10130.
(15) Pal, S. K.; Sukul, D.; Mandal, D.; Sen, S.; Bhattacharyya, K.J. Phys.Chem. B2000, 104, 2613-2616. Sarkar, N.; Das, K.; Datta, A.; Das, S.;Bhattacharyya, K.J. Phys. Chem.1996, 100, 10523-10527. Sarkar, N.; Datta,A.; Das, S.; Bhattacharyya, K.J. Phys. Chem.1996, 100, 15483-15486. Datta,A.; Mandal, D.; Pal, S. K.; Bhattacharyya, K.J. Phys. Chem. B1997,101, 10221-10225. Datta, A.; Pal, S. K.; Mandal, D.; Bhattacharyya, K.J. Phys. Chem. B1998, 102, 6114-6117.
(16) Baumann, R.; Ferrante, C.; Deeg, F. W.; Brau¨chle, C.J. Chem. Phys.2001, 114, 5781-5791. Baumann, R.; Ferrante, C.; Kneuper, E.; Deeg, F. W.;Brauchle, C.J. Phys. Chem. A2003, 107, 2422-2430.
(17) Nandi, N.; Bagchi, B.J. Phys. Chem.1996, 100, 13914-13919.Bhattacharyya, K.; Bagchi, B.J. Phys. Chem. A2000, 104, 106.
(18) Nikiel, L.; Hopkins, B.; Zerda, T. W.J. Phys. Chem.1990, 94, 7458-7464.
(19) Hoang, G. C.J. Korean Phys. Soc.2002, 40, 224-231.(20) Czeslik, C.; Kim, Y. J.; Jonas, J.J. Chem. Phys.1999, 111, 9739-9742.
Kim, Y. J.; Chang, H.-C.; Sullivan, V. S.; Jonas, J.J. Chem. Phys.1999, 111,9658-9666. Lee, Y. T.; Wallen, S. L.; Jonas, J.J. Phys. Chem.1992, 96, 7161-7164. Czeslik, C.; Kim, Y. J.; Jonas, J.J. Raman Spectrosc.2000, 31, 571-575.Yi, J.; Jonas, J.J. Phys. Chem.1996, 100, 16789-16793. Czeslik, C.; Kim, Y.J.; Jonas, J.J. Phys. IV2000, 10, 103-106.
(21) Tominaga, K.; Okuno, H.; Maekawa, H.; Tomonaga, T.; Loughnane, B.J.; Scodinu, A.; Fourkas, J. T. InLiquid Dynamics: Experiment, Simulation, andTheory; Fourkas, J. T., Ed.; American Chemical Society: Washington, DC, 2002;Vol. 820, pp 160-168.
10919Langmuir2006,22, 10919-10923
10.1021/la062285k CCC: $33.50 © 2006 American Chemical SocietyPublished on Web 11/24/2006
are well described by the two-state model whereas others arenot.24 Experimental measurements that are not consistent withthe two-state model have prompted extensions, includingexchange between the surface and interior populations9,10 orincorporating a third state.3,10 It is reasonable that the accuracyof the two-state model will depend on the confined liquid systemand the measured property. However, the underlying physicalassumptions of the two-state model are difficult to probeexperimentally. Specifically, what is missing is a clear under-standing of whether distinct surface and interior subensemblesexist and, if so, whether the interior truly does have bulk-likeproperties.
In this letter, we investigate the appropriateness of a two-statemodel for describing the trans-gauche conformational equi-librium of ethylene glycol (EG) about the O-C-C-O dihedralangle confined in nanoscale silica pores. This work was motivatedby the Raman scattering study of Luo and Jonas,1 who measuredthe populations of the trans and gauche conformers in hydrophilicand hydrophobic sol-gel pores of varying sizes,∼30 - 70 Åin radius. They observed that the relative stability of the EG transconformer increases with decreasing pore radius in hydroxyl-terminated pores.30 They interpreted these interesting results interms of a two-state model with two additional assumptions: (1)there is uniform liquid density in the pore and (2) the pores arecylindrical. The two-state model then predicts that the observedtrans fraction,Ft, will depend on the pore radius,R, as
Here,Fti andFt
s are the trans fractions for the interior and surfacesubensembles, respectively. The surface layer thickness is denotedby ∆, which is typically assumed to be about one moleculardiameter. Thus,∆/R, 1, and the∆2/R2 term is often neglected,as it was by Luo and Jonas.1 They found that their measuredFt(R) was indeed well described by the resulting 1/Rdependence,and from the fit to the data, Luo and Jonas concluded thatFt
s )97%. This is roughly a factor of 3 larger than the assumedFt
i )Ft
bulk ) 36% ( 10%.25 Furthermore, they attributed thepredominance of the trans conformer near the surface to hydrogenbonding with the silanol groups, disfavoring the gaucheconformer.
In the remainder of this letter, we present the results ofmolecular dynamics (MD) simulations of EG in roughlycylindrical, hydroxyl-terminated silica pores of diameter∼24Å. These simulations allow us to test the physical picture implicit
in the two-state model becauseFti andFt
s are directly accessible.We find that, in direct opposition to the tenets of the two-statemodel,Ft
s ≈ Fti * Ft
bulk. Rather than test the predicted behaviorover a range of pore sizes (which may or may not distinguishbetween alternative models), our concern is with establishingthe validity of the assumption of two distinct subensemblesbecause this condition is necessary for a two-state model to apply.
2. Method
We have prepared 11 distinct roughly cylindrical amorphous silicapores of nominal radius 12 Å by a method nearly identical to ourprevious method, which is described in ref 26. The deviations fromthat procedure are detailed in the Supporting Information. Thisprocedure leads to a surface density of∼3 OH groups/nm2, whichis in accord with experimental estimates of 2 to 3 OH groups/nm2.1
The number of OH groups,NOH, for each pore is listed in Table 1.The interaction potential for the system was taken from the
literature with some modifications by us. The EG potential is thatof the OPLS parameter set27 with one variation: the O-Ointramolecular Lennard-Jones interaction was used. Without the O-Ointeraction, the bulk trans fraction is only 5%. The inclusion of theO-O interaction increasesFt
bulk to 18%; see Table 1. Although stillnot perfect, this potential places the calculatedFt
bulk in much betteragreement with the experimental value. More importantly, this meansthat a much smaller change in the dihedral free energy can lead toa resolvable difference inFt. Similar to Widmalm and Pastor,28 wechose to include a weak, short-ranged interaction potential for theH to prevent numerical instabilities. The potential parameters aregiven in the Supporting Information.
The simulations were performed with the DL_POLY simulationpackage29 and utilized theNVT ensemble with a Nose-Hooverthermostat withT ) 300 K. The time step was 1 fs, and eachsimulation was equilibrated for 1 ns. The long equilibration was
(22) Zhong, Q.; Baronavski, A. P.; Owrutsky, J. C.J. Chem. Phys.2003, 118,7074-7080. Zhong, Q.; Baronavski, A. P.; Owrutsky, J. C.J. Chem. Phys.2003,119, 9171-9177. Sando, G. M.; Dahl, K.; Owrutsky, J. C.J. Phys. Chem. A2004,108, 11209-11217. Sando, G. M.; Dahl, K.; Owrutsky, J. C.J. Phys. Chem. B2005, 109, 4084-4095. Sando, G. M.; Dahl, K.; Zhong, Q.; Owrutsky, J. C.J.Phys. Chem. A2005, 109, 5788-5792.
(23) Tan, H.-S.; Piletic, I. R.; Riter, R. E.; Levinger, N. E.; Fayer, M. D.Phys.ReV. Lett.2005, 94, 057405. Piletic, I. R.; Tan, H.-S.; Fayer, M. D.J. Phys. Chem.B 2005, 109, 21273-21284.
(24) Piletic, I. R.; Moilanen, D. E.; Spry, D. B.; Levinger, N. E.; Fayer, M.D. J. Phys. Chem. A2006, 110, 4985-4999.
(25) Schwartz, M.Spectrochim. Acta1977, 33A, 1025-1032.(26) Gulmen, T. S.; Thompson, W. H. InDynamics in Small Confining Systems
VIII ; Fourkas, J. T., Levitz, P., Overney, R., Urbakh, M., Eds.; Materials ResearchSociety Symposium Proceedings 899E; Materials Research Society: Warrendale,PA, 2005; 0899-N06-05.
(27) Jorgensen, W. L.J. Am. Chem. Soc.1981, 103, 335-340.(28) Widmalm, G.; Pastor, R. W.Faraday Trans.1992, 88, 1747-1754.(29) DL_POLY is a molecular dynamics simulation package written by Smith,
W.; Forester, T. R.; Todorov, I. T. and has been obtained from CCLRCs DaresburyLaboratory via the website http://www.ccp5.ac.uk/DL_POLY.
(30) Interestingly, they found that the fraction of trans conformers is essentiallyunchanged from the bulk value in hydrophobic (-O-Si-(CH3)3-terminated)pores of varying sizes.
Ft(R) ) Fti + (Ft
s - Fti)[2∆
R- ∆2
R2] (1)
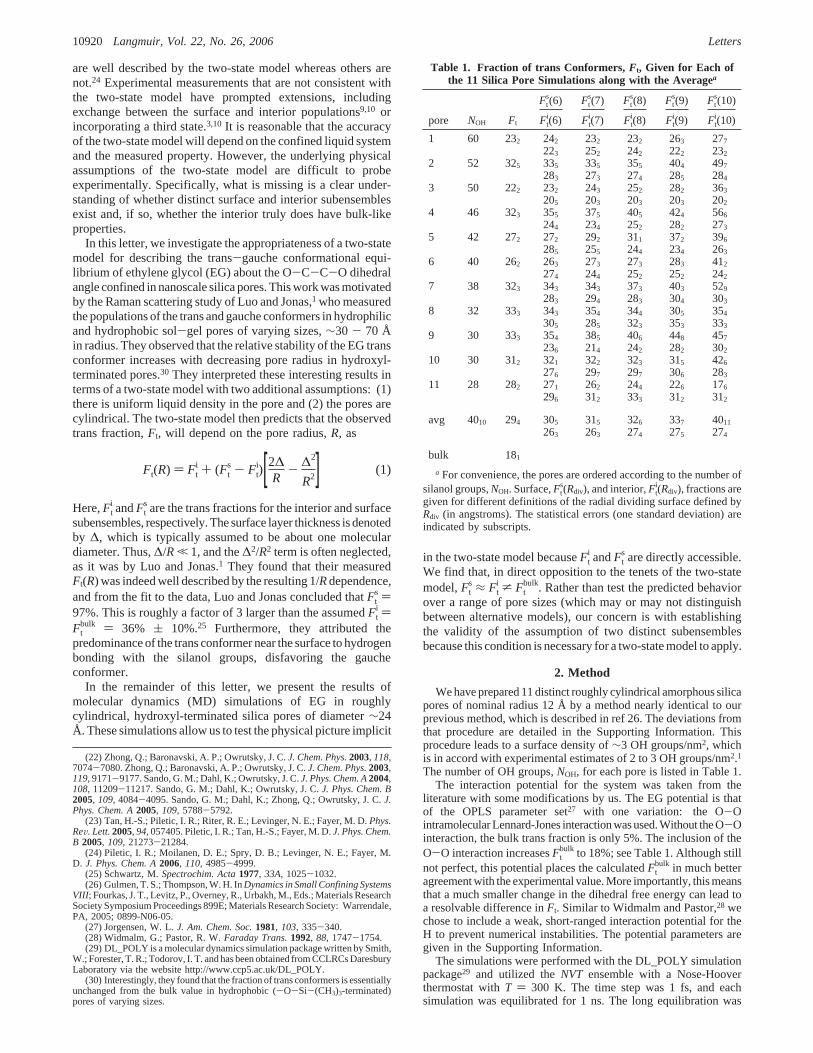
Table 1. Fraction of trans Conformers, F t, Given for Each ofthe 11 Silica Pore Simulations along with the Averagea
Fts(6) Ft
s(7) Fts(8) Ft
s(9) Fts(10)
pore NOH Ft Fti(6) Ft
i(7) Fti(8) Ft
i(9) Fti(10)
1 60 232 242 232 232 263 277
223 252 242 222 232
2 52 325 335 335 355 404 497
283 273 274 285 284
3 50 222 232 243 252 282 363
205 203 203 203 202
4 46 323 355 375 405 424 566
244 234 252 282 273
5 42 272 272 292 311 372 396
285 255 244 234 263
6 40 262 263 273 273 283 412
274 244 252 252 242
7 38 323 343 343 373 403 529
283 294 283 304 303
8 32 333 343 354 344 305 354
305 285 323 353 333
9 30 333 354 385 406 448 457
236 214 242 282 302
10 30 312 321 322 323 315 426
276 297 297 306 283
11 28 282 271 262 244 226 176
296 312 333 312 312
avg 4010 294 305 315 326 337 4011
263 263 274 275 274
bulk 181
a For convenience, the pores are ordered according to the number ofsilanol groups,NOH. Surface,Ft
s(Rdiv), and interior,Fti(Rdiv), fractions are
given for different definitions of the radial dividing surface defined byRdiv (in angstroms). The statistical errors (one standard deviation) areindicated by subscripts.
10920 Langmuir, Vol. 22, No. 26, 2006 Letters

necessary to stabilize the trans-gauche ratio. Each production runfor data collection consisted of a 5 nstrajectory, and the dihedralangle was sampled every 20 fs. Within each pore, there were 65 EGmolecules. Intramolecular stretching and bending motions wereconstrained by the SHAKE algorithm.
3. Results and Discussion
We performed MD simulations of EG in 11 differentamorphous silica pores with nominal radii of 12 Å. The intrinsicheterogeneity of amorphous silica pores demands that simulationsbe carried out in multiple pores to establish which properties arespecific to a particular pore and which are general (see below).The distribution of O-C-C-O dihedral angles in the EGmolecules has been calculated for each of these simulations andconverted toFt by integrating the distribution from2π/3 to π.Furthermore, we have computed the surface,Ft
s, and interior,Fti,
fractions using a cylindrical dividing surface defined by a radiusRdiv. Because the appropriate location of the dividing surface isnot clear, we have generated data for five different values ofRdiv.The results are presented in Table 1, with the pores orderedaccording toNOH.
There are a number of noteworthy features of the data in Table1. We first focus on the overall fraction of trans conformers. Thetotal Ft for every pore is statistically greater than that for bulkEG, in qualitative agreement with the trend found by Luo andJonas.31 Averaged over all pores,Ft increases to 29% uponconfinement from 18% in the bulk. It should be noted that Luoand Jonas investigated pores of larger radius (R ) 31.4 to 68.5Å) than those considered here and found thatFt = 56% in theirsmallest pore. The quantitative discrepancies likely ariseprincipally from the EG potential model, which, as noted above,does not reproduce the bulk trans fraction. However, in thisletter we focus on the change inFt upon confinement and noton the absolute values, and thus this does not affect ourconclusions. It is interesting that the change inFt that we observecorresponds to a reduction of the trans free energy relative to thatof the gauche conformer of∼0.4 kcal/mol.32 The free-energydifference corresponding to the change inFt observed by Luoand Jonas is∼0.6 kcal/mol (extrapolated to the 24 Å pore diameterconsidered here).
Another interesting feature of Table 1 is the relation betweenthe trans fraction and the number of surface hydroxyl groups.To illustrate this point better,Ft is plotted againstNOH in Figure1 and compared withFt
bulk and the average over all 11 pores.From Table 1 and Figure 1, it is clear that there is not a correlationbetween the number of surface hydroxyl groups and theFt
associated with each pore. This is an important and interestingresult because Luo and Jonas attributed the large trans fractionin the surface layer (obtained from their two-state model) inhydrophilic pores to hydrogen bonding with the surface. In thisinterpretation, one would expect thatFt should increase withincreasingNOH, yet this is not observed.
As noted in section 1, a test of the two-state model for thissystem lies in the comparison of the interior,Ft
i, and surface,Fts,
fractions of trans conformers. It is clear from Table 1 that,independent of the location of the dividing surface,Rdiv, theassumptions of the two-state model are not supported by thesesimulations. First, althoughFt
s is greater thanFti, averaged over
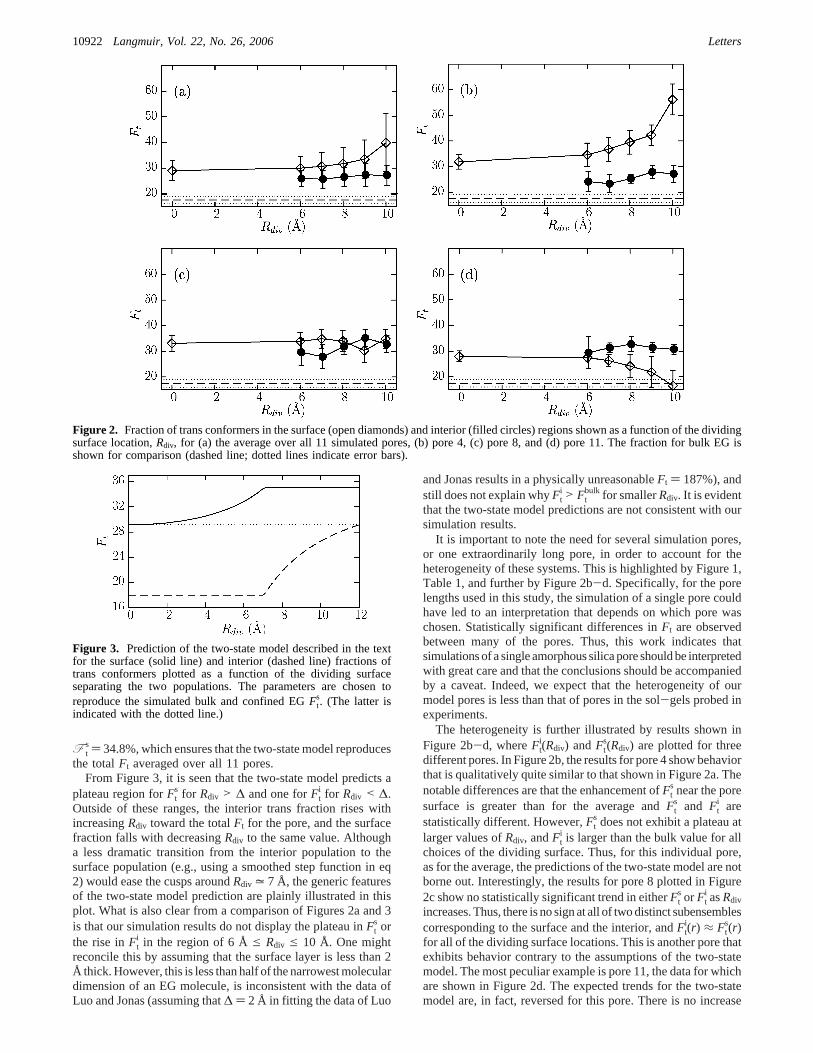
all 11 pores, the difference is quite small, and the two are thesame within error for every choice ofRdiv. This can be seen moreclearly in Figure 2a, where the data are plotted. Second, it is alsoclear from Figure 2a that the interior trans population is statisticallydistinct from, and greater than, the bulk value, regardless of thechoice of dividing surface. The trans fraction at the surface isalso far from theFt
s = 97% value predicted by Luo and Jonasfrom their two-state model, but this must be considered in thecontext of the discrepancy betweenFt
bulk values for our forcefield (18%) and experimental measurements (36( 10%). Itappears thatFt
sdoes increase asRdiv increases, indicating that thetrans conformer may be stabilized somewhat near the surface.However, the magnitude of this increase is small, especiallyconsidering that the statistical errors increase withRdiv as a resultof the smaller number of molecules making up what is definedas the surface layer. Thus, we find thatFt, Ft
s, andFti are not
statistically distinguishable nor, for that matter, are the valuesof Ft
s for different Rdiv values.To expand on the test of a two-state model provided by the
present simulations, it is useful to consider the model predictionsfor Ft
i(Rdiv) andFts(Rdiv). Specifically, if our simulated pores are
approximated as cylindrical and a two-state model is assumed,then the position-dependent trans conformer fraction is
whereF ts is the intrinsic trans population in the surface layer
of thickness∆ andθ(x) is the Heaviside step function. If oneconstructs a cylindrical dividing surface at radiusRdiv todifferentiate the surface and interior populations, then expressionsfor Ft
i(Rdiv) andFts(Rdiv) can be derived by integratingFt(r) from
0 to Rdiv and fromRdiv to R, respectively. Note that ifRdiv ) ∆this givesFt
i ) Ftbulk andFt
s) F ts, but otherwise one is attributing
part of the surface layer to the interior or vice versa. This approachthus allows one to compare not only the particular values ofFt
i
andFts but also their dependence onRdiv to the predictions of the
two-state model. The resulting predictions of the two-state modelare shown in Figure 3 for an ideal cylindrical pore of radiusR) 12 Å and a surface layer thickness of∆ ) 4.95 Å obtainedfrom fitting the data of Luo and Jonas to eq 1. To provide theclosest comparison, we have used the simulatedFt
bulk and chosen
(31) In some of the earliest work on nanoconfined EG, Crupi et al.2 usedRaman spectroscopy to investigate EG in∼25-Å-diameter sol-gel pores. Theiranalysis of the Raman spectra found that intramolecular hydrogen bonding andthus the gauche conformer population are enhanced upon confinement inhydrophilic pores relative to the bulk. In hydrophobic pores, the conformationalequilibrium is quite similar to the bulk. Their conclusions are thus at odds withthe results of Luo and Jonas1 and the present simulations. (The contradictoryexperimental data are perhaps due to differences in sample preparation.) We planto use MD simulations to address the issue of infrared and Raman spectra ofnanoconfined EG in the future.
(32) There can be some ambiguity in the meaning of the relative free energies.Here, we have calculated the free energies on the basis of the simple two-conformermodel,Ft ) e-â∆G/(2 + e-â∆G). Here, the 2 in the denominator comes from thetwo equivalent gauche forms. Note that this is not the same as the free-energydifference between the gauche and trans minima because the curvature of the freeenergy as a function of the torsional angle is different for the two conformers.
Figure 1. Fraction (%) of trans EG conformer,Ft, plotted as afunction of the number of surface silanol groups,NOH, for each ofthe 11 pores simulated (diamonds with error bars). The bulk value,Ft
bulk, is also shown (dashed line), as is the average from all pores(solid line). Error bars are indicated by dotted lines.
Ft(r) ) Ftbulk + (F t
s - Ftbulk)θ(r - ∆) (2)
Letters Langmuir, Vol. 22, No. 26, 200610921
F ts) 34.8%, which ensures that the two-state model reproduces
the totalFt averaged over all 11 pores.From Figure 3, it is seen that the two-state model predicts a
plateau region forFts for Rdiv > ∆ and one forFt
i for Rdiv < ∆.Outside of these ranges, the interior trans fraction rises withincreasingRdiv toward the totalFt for the pore, and the surfacefraction falls with decreasingRdiv to the same value. Althougha less dramatic transition from the interior population to thesurface population (e.g., using a smoothed step function in eq2) would ease the cusps aroundRdiv = 7 Å, the generic featuresof the two-state model prediction are plainly illustrated in thisplot. What is also clear from a comparison of Figures 2a and 3is that our simulation results do not display the plateau inFt
s orthe rise inFt
i in the region of 6 Åe Rdiv e 10 Å. One mightreconcile this by assuming that the surface layer is less than 2Å thick. However, this is less than half of the narrowest moleculardimension of an EG molecule, is inconsistent with the data ofLuo and Jonas (assuming that∆ ) 2 Å in fitting the data of Luo
and Jonas results in a physically unreasonableFt ) 187%), andstill does not explain whyFt
i > Ftbulk for smallerRdiv. It is evident
that the two-state model predictions are not consistent with oursimulation results.
It is important to note the need for several simulation pores,or one extraordinarily long pore, in order to account for theheterogeneity of these systems. This is highlighted by Figure 1,Table 1, and further by Figure 2b-d. Specifically, for the porelengths used in this study, the simulation of a single pore couldhave led to an interpretation that depends on which pore waschosen. Statistically significant differences inFt are observedbetween many of the pores. Thus, this work indicates thatsimulations of a single amorphous silica pore should be interpretedwith great care and that the conclusions should be accompaniedby a caveat. Indeed, we expect that the heterogeneity of ourmodel pores is less than that of pores in the sol-gels probed inexperiments.
The heterogeneity is further illustrated by results shown inFigure 2b-d, whereFt
i(Rdiv) andFts(Rdiv) are plotted for three
different pores. In Figure 2b, the results for pore 4 show behaviorthat is qualitatively quite similar to that shown in Figure 2a. Thenotable differences are that the enhancement ofFt
s near the poresurface is greater than for the average andFt
s and Fti are
statistically different. However,Fts does not exhibit a plateau at
larger values ofRdiv, andFti is larger than the bulk value for all
choices of the dividing surface. Thus, for this individual pore,as for the average, the predictions of the two-state model are notborne out. Interestingly, the results for pore 8 plotted in Figure2c show no statistically significant trend in eitherFt
s or Fti asRdiv
increases. Thus, there is no sign at all of two distinct subensemblescorresponding to the surface and the interior, andFt
i(r) ≈ Fts(r)
for all of the dividing surface locations. This is another pore thatexhibits behavior contrary to the assumptions of the two-statemodel. The most peculiar example is pore 11, the data for whichare shown in Figure 2d. The expected trends for the two-statemodel are, in fact, reversed for this pore. There is no increase
Figure 2. Fraction of trans conformers in the surface (open diamonds) and interior (filled circles) regions shown as a function of the dividingsurface location,Rdiv, for (a) the average over all 11 simulated pores, (b) pore 4, (c) pore 8, and (d) pore 11. The fraction for bulk EG isshown for comparison (dashed line; dotted lines indicate error bars).
Figure 3. Prediction of the two-state model described in the textfor the surface (solid line) and interior (dashed line) fractions oftrans conformers plotted as a function of the dividing surfaceseparating the two populations. The parameters are chosen toreproduce the simulated bulk and confined EGFt
s. (The latter isindicated with the dotted line.)
10922 Langmuir, Vol. 22, No. 26, 2006 Letters

of Fts as the dividing surface is moved further out. In fact, atRdiv
) 10 Å, the value ofFts is essentially the same asFt
bulk. Takentogether, these examples emphasize the considerable heterogene-ity in these pore systems and caution that failure to sample thisheterogeneity sufficiently (e.g., by simulating only a single pore)may lead to dramatically erroneous conclusions. For brevity,results for the other pores are not plotted. Although the behaviorof pore 11 is anomalous insofar asFt
s decreases asRdiv increases,the remaining pores show behavior intermediate between that ofpores 4 and 8.
4. Conclusions
Molecular dynamics simulations of ethylene glycol confinedin roughly cylindrical, hydrophilic silica pores of∼2.4 nmdiameter have been presented. The results speak to the ap-propriateness of a two-state model for describing the propertiesof this nanoconfined liquid. The simulation data indicate that thetwo-state model is too restrictive to be fully correct for this system.In particular, a distinct difference in the fraction of transconformers between the surface and interior regions is notobserved, and the trans conformer population is not dramaticallyincreased in the surface layer and is not equal to the bulk fractionin the interior. However, we expect that for sufficiently largepores the properties in the interior should be indistinguishablefrom those of the bulk. The appropriate length scale for this
transition is an important, open question. A two-state model mayrepresent a more accurate description of other measurableproperties or different nanoconfined liquid systems. Additionallight will also be shed on the issue by simulations of ethyleneglycol confined in silica pores with varying pore size and surfacefunctionality; these are currently underway in our laboratory.
Moreover, the present simulations demonstrate the strongheterogeneity of the amorphous silica pores. Although our modelpores are likely less diverse than in a real sol-gel, we found thatthe consideration of only a single pore can lead to dramaticallydifferent conclusions. Thus, conclusions drawn from simulationsmust be judiciously regarded in the context of the significantaveraging over the heterogeneity of the pore properties that isrequired.
Acknowledgment. This work was supported by the ChemicalSciences, Geosciences and Biosciences Division, Office of BasicEnergy Sciences, Office of Science, U.S. Department of Energy.Acknowledgment is made to the donors of the Petroleum ResearchFund, administered by the American Chemical Society, for partialsupport of this research.
Supporting Information Available: Procedure for generatingmodel silica pores. Potential parameters. This material is available freeof charge via the Internet at http://pubs.acs.org.
LA062285K
Letters Langmuir, Vol. 22, No. 26, 200610923