testimony of susan f. tierney, ph.d. analysis group ... · before the u.s. house of representatives...
TRANSCRIPT
Testimony of Susan F. Tierney, Ph.D. Analysis Group, Boston
Before the U.S. House of Representatives
Committee on Oversight & Government Reform, Subcommittee on Interior
Hearing to Examine the Impacts of EPA Air and Water Regulations on the States and the American People
February 26, 2015
Good morning, Chairman Lummis, Ranking Member Lawrence, and Members of the Subcommittee. My testimony focuses on the impacts of the Environmental Protection Agency’s recent proposals to address air and water pollution affecting the health and welfare of the American people. The EPA has responsibility under the U.S. Clean Air Act and Clean Water Act to protect the public from harmful discharges of pollutants into our air and waterways.
In the decades since these major federal environmental laws were passed, they have brought about improvements in the public’s health and protected the nation’s natural resources on which our economy depends. As scientific information and technological advances have occurred, so has the administration of these laws over time.
As a former state cabinet officer (Secretary of Environmental Affairs) and regulator (public utilities and energy facilities) in Massachusetts (where, incidentally, I was appointed by governors of both parties), I have direct familiarity with state administration of federal and state environmental laws. As a consultant for a wide variety of clients (including state governments, private companies, grid operators, utilities, large consumers, project developers, foundations, tribal governments), I also have studied the implications of federal and state energy and environmental laws on energy markets, electric reliability, local economies, and consumers.
I am familiar with the three sets of EPA regulations under discussion today: a new ambient air equality standard for ozone (smog); the new regulations under the Clean Air Act to reduce emissions of carbon pollution from existing power plants; and clarifications regarding the definition of U.S. waters under the Clean Water Act.
These are important regulations from a public health point of view, but they are also important for local economies and economic development. Clarifying the scope of federal jurisdiction and consistency of treatment of waterways across the nation helps to provide appropriate signals to private actors about what they can expect when states review their development projects. Ensuring that ozone standards remain consistent with the evolving scientific evidence of harm is critical for the health of local populations and economies. Reducing emissions of carbon pollution from the power sector will bring benefits in the long run to Americans.
My testimony focuses in particular on the EPA’s proposed Clean Power Plan. As with the other regulations, the EPA is required to establish emissions controls on the power sector. In doing so, the EPA has adopted a regulatory approach that offers significant flexibility to the states to fashion their

Testimony of Susan F. Tierney before the House Investigations and Government Oversight 2 Subcommittee on Interior (Hearing on EPA Regulations, February 25, 2015)
own plans to control emissions from power plants in ways that work well with their own circumstances.
Having a reliable and efficient electric industry is, of course, critically important for Americans and for the U.S. economy. Americans demand world-class electric reliability at reasonable prices. The U.S., as the world’s largest economy and the world’s historically largest emitter of carbon pollution, is poised to take seriously its role in controlling such emissions.
In that context, EPA’s proposed power-plant regulations are critically important. The Supreme Court has held that “greenhouse gases fit well within the [Clean Air] Act’s capacious definition of ‘air pollutant’.” The American power sector represents the nation’s largest source of greenhouse gas emissions. Americans are already feeling the damaging effects of climate change. The U.S.’s cumulative CO2 emissions exceed those of any other country, and our power sector produces one out of every 15 tons of energy-related CO2 emissions produced anywhere in the globe. Taking action to reduce emissions from the U.S. power sector will have a material impact on reducing global emissions and mitigating the costly impacts of climate change.
Just as important are the laws, policies, and expectations surrounding assurance of electric system reliability and provision of electricity at just and reasonable rates. Fortunately, the regulation allows flexibility that states can use to implement the Clean Power Plan in ways that can minimize impacts on consumers.
In the recent past, I have authored or co-authored three reports on the EPA proposal’s impacts on consumers and electric system reliability. I attach them to this statement.
Having read a significant portion of the comments submitted by stakeholders about the Clean Power Plan, my co-authors and I found in our most recent report (published last week) that many comments presume inflexible implementation, are based on worst-case scenarios, and assume that policy makers, regulators, and market participants will stand on the sidelines without doing their jobs to ensure lowest-cost and reliable outcomes. There is no historical basis for these assumptions.
These issues will be solved by the dynamic interplay of actions by regulators, entities responsible for reliability, and market participants – with many solutions proceeding in parallel. Indeed, this dynamic interplay is one reason why a recent survey of over 400 utility executives nationwide found that more than 60 percent felt optimistic about the Clean Power Plan and either supported EPA’s proposed current emissions reduction targets or would make them more stringent.
Finally, the electric industry is undergoing major transitions. These changes arise from such things as: dramatic increases in domestic energy production (stemming from the shale gas revolution), shifts in fossil fuel prices (so that gas is less expensive than coal in many power plants), retirements of aged infrastructure, and strong growth in energy efficiency and distributed energy resources. In light of the significant shifts already underway in the electric system, the industry would need to adjust its operational and planning practices to accommodate changes even if EPA had not proposed its carbon-control regulation.
Thank you for the opportunity to present this testimony to the Subcommittee.

SUSAN F. TIERNEY, Ph.D. Analysis Group
111 Huntington Avenue, 10th Floor Phone: 617-425-8114 Boston, MA 02199 Fax: 617-425-8001
[email protected] Dr. Tierney, a Senior Advisor at Analysis Group, is an expert on energy economics, regulation and policy, particularly in the electric and gas industries. She has consulted to businesses, government, tribes, environmental groups, and other organizations on energy markets, economic and environmental regulation and strategy, and energy projects. Her expert witness and consulting services have involved market analyses, wholesale and retail market design, contract disputes, resource planning and procurements, regional transmission organizations, the siting of electric and gas infrastructure projects, electric system reliability, ratemaking for electric and gas utilities (including cost allocation, rate design, incentive ratemaking mechanisms), clean energy resources, climate change policy, and other environmental policy and regulation. She has participated as an expert in civil litigation cases, regulatory proceedings before state and federal agencies, and business consulting engagements.
Previously, she served as the Assistant Secretary for Policy at the U.S. Department of Energy in the Clinton Administration. She was the Secretary for Environmental Affairs in Massachusetts, Commissioner at the Massachusetts Department of Public Utilities, Chairman of the Board of the Massachusetts Water Resources Authority, and executive director of the Massachusetts Energy Facilities Siting Council. She co-chaired the Obama-Biden Transition Team at the U.S. Department of Energy.
Dr. Tierney has authored numerous articles and speaks frequently at industry conferences. She serves on a number of boards of directors and advisory committees, including chairing the External Advisory Council of the National Renewable Energy Laboratory (NREL) and the board of ClimateWorks Foundation. She is a director of the World Resources Institute, the Alliance to Save Energy, and the Energy Foundation. She is a member of the Bipartisan Policy Center’s Energy Project, the China Sustainable Energy Program’s Policy Advisory Council, and the Environmental Advisory Council of the New York Independent System Operator (NYISO). She co-chairs the NAESB Gas-Electric Harmonization Committee, the Bipartisan Policy Center’s cyber security and the electric grid, is a member of the National Academy of Sciences panel on shale gas risk, and is co-lead author of the energy chapter of the National Climate Assessment. She chaired the Policy Subgroup of the National Petroleum Council’s study of the natural gas and oil resource base in North America, co-chaired the NAESB Gas/Electric Harmonization Committee, served on the U.S. Secretary of Energy Advisory Board (and its Shale Gas Subcommittee), and was a member of the National Petroleum Council. Previously, she chaired several non-profit organizations (the National Commission on Energy Policy; the Electricity Innovations Institute; and the Massachusetts Ocean Commission); was formerly a director of several companies (EnerNOC, Inc.; Evergreen Solar, Inc.; Ze-gen, Inc.; Catalytica Energy Systems Inc.), and several non-profit organizations (Clean Air Task Force; Clean Air – Cool Planet; the Electric Power Research Institute); and was a member of the Advisory Council of the New England Independent System Operator (ISO-NE) and the Massachusetts Renewable Energy Trust Advisory Council. She taught at the Department of Urban Studies and Planning at MIT and at the University of California at Irvine, and has lectured at Harvard University, Yale University, New York University, Tufts University, Northwestern University, and University of Michigan.
She earned her Ph.D. and M.A. degrees in regional planning at Cornell University and her B.A. at Scripps College.

None
Myself
None
2-25-2015

Electric System Reliability and EPA’s Clean Power Plan: Tools and Practices
Analysis Group Susan Tierney Paul Hibbard Craig Aubuchon February 2015

Electric System Reliability and EPA’s Clean Power Plan
Analysis Group
Acknowledgments
This report provides a primer on various reliability issues facing the electric industry as it looks ahead to implementation of the Clean Power Plan, as proposed by the U.S. Environmental Protection Agency on June 2, 2014.
Taking into consideration the many comments of various parties filed on EPA’s proposal, the report addresses issues that the nation and the electric industry need to address in order to simultaneously meet electric system reliability and carbon-emissions reduction obligations.
This is an independent report by the authors at the Analysis Group, supported by funding from the Energy Foundation.
The report, however, reflects the analysis and judgment of the authors only.
About Analysis Group
Analysis Group provides economic, financial, and business strategy consulting to leading law firms, corporations, and government agencies. The firm has more than 600 professionals, with offices in Boston, Chicago, Dallas, Denver, Los Angeles, Menlo Park, New York, San Francisco, Washington, D.C., Montreal, and Beijing.
Analysis Group’s energy and environment practice area is distinguished by expertise in economics, finance, market modeling and analysis, regulatory issues, and public policy, as well as significant experience in environmental economics and energy infrastructure development. The practice has worked for a wide variety of clients including: energy producers, suppliers and consumers; utilities; regulatory commissions and other public agencies; tribal governments; power system operators; foundations; financial institutions; and start-up companies, among others.

Electric System Reliability and EPA’s Clean Power Plan
Analysis Group
Table of Contents
Executive Summary ES-1
Recommendation Tables Recommendations - 1
I. Context 8
II. What Do We Mean by “Electric System Reliability”? 14
What is reliability, and why does it matter? 14
How could electric system reliability be affected by the Clean Power Plan? 16
III. What Concerns are Commenters Raising About Reliability Issues Associated with EPA’s the Clean Power Plan? 25
Summary of comments 25
Reliability safety value concept 28
NERC’s initial reliability assessment of the Clean Power Plan 29
IV. Options for Assuring Electric System Reliability in Conjunction with Implementing the Clean Power Plan 31
The reliability check list 31
The Reliability Toolkit: Which ones to use here? 32
V. Conclusion: 34
APPENDIX
Public Comments on EPA’s Proposed Clean Power Plan: Summary of Concerns relating to Electric System Reliability Issues Appendix - 1
Acronyms Appendix - 7

Electric System Reliability and the EPA’s Clean Power Plan
Analysis Group ES-1
http://imgkid.com/checklist-icon.shtml
Executive Summary
Since the U.S. Environmental Protection Agency (EPA) proposed its Clean Power Plan last June, many observers have raised concerns that its implementation might jeopardize electric system reliability.
Such warnings are common whenever there is major change in the industry, and play an important role in focusing the attention of the industry on taking the steps necessary to ensure reliable electric service to Americans. There are, however, many reasons why carbon pollution at existing power plants can be controlled without adversely affecting electric system reliability.
Given the significant shifts already underway in the electric system, the industry would need to adjust its operational and planning practices to accommodate changes even if EPA had not proposed the Clean Power Plan.
In the past several years, dramatic increases in domestic energy production (stemming from the shale gas revolution), shifts in fossil fuel prices, retirements of aged infrastructure, implementation of numerous pollution-control measures, and strong growth in energy efficiency and distributed energy resources, have driven important changes in the power sector. As always, grid operators and utilities are already looking at what adjustments to long-standing planning and operational practices may be needed to stay abreast of, understand, and adapt to such changes in the industry.
The standard reliability practices that the industry and its regulators have used for decades are a strong foundation from which any reliability concerns about the Clean Power Plan will be addressed.
The electric industry’s many players are keenly organized and strongly oriented toward safe and reliable operations. There are well-established procedures, regulations and enforceable standards in place to ensure reliable operations of the system, day in and day out.
Among other things, these “business-as-usual” procedures include:

Electric System Reliability and the EPA’s Clean Power Plan
Analysis Group ES-2
• Assigning specific roles and responsibilities to different organizations, including regional reliability organizations, grid operators, power plant and transmission owners, regulators, and many others;
• Planning processes to look ahead at what actions and assets are needed to make sure that the overall system has the capabilities to run smoothly;
• Maintaining secure communication systems, operating protocols, and real-time monitoring processes to alert participants to any problems as they arise, and initiating corrective actions when needed; and
• Relying upon systems of reserves, asset redundancies, back-up action plans, and mutual assistance plans that kick in automatically when some part of the system has a problem.
As proposed by EPA, the Clean Power Plan provides states and power plant owners a wide range of compliance options and operational discretion (including various market-based approaches, other means to allow emissions trading among power plants, and flexibility on deadlines to meet interim targets) that can prevent reliability issues while also reducing carbon pollution and cost.
EPA’s June 2014 proposal made it clear that the agency will entertain market-based approaches and other means to allow emissions trading within and across state lines. Examples include emissions trading among plants (e.g., within a utility’s fleet inside or across state lines), or within a Regional Transmission Organization (RTO) market. In this respect, the Clean Power Plan is fundamentally different from the Mercury and Air Toxics Standard (MATS) and is well-suited to utilize such flexible and market-based approaches. Experience has shown that such approaches allow for seamless, reliable implementation of emissions-reduction targets. In its final rule, EPA should clarify acceptable or standard market-based mechanisms that could be used to accomplish both cost and reliability goals.
http://www.bls.gov/ooh/installation-maintenance-and-repair/line-installers-and-repairers.htm

Electric System Reliability and the EPA’s Clean Power Plan
Analysis Group ES-3
Moreover, EPA has stated repeatedly that it will write a final rule that reflects the importance of a reliable grid and provides the appropriate flexibility.1 We support such adjustments in EPA’s final rule as needed to ensure both emissions reductions and electricity reliability.
Some of the reliability concerns raised by stakeholders about the Clean Power Plan presume inflexible implementation, are based on worst-case scenarios, and assume that policy makers, regulators, and market participants will stand on the sidelines until it is too late to act. There is no historical basis for these assumptions. Reliability issues will be solved by the dynamic interplay of actions by regulators, entities responsible for reliability, and market participants with many solutions proceeding in parallel.
Some of the cautionary comments are just that: calls for timely action. Many market participants have offered remedies (including readiness to bring new power plant projects, gas infrastructure, demand-side measures, and other solutions into the electric system where needed).2 Indeed, this dynamic interplay is one reason why a recent survey of over 400 utility executives nationwide found that more than 60 percent felt optimistic about the Clean Power Plan and either supported EPA’s proposed current emissions reduction targets or would make them more stringent.3
We note many concerns about electric system reliability can be resolved by the addition of new load-following resources, like peaking power plants and demand-side measures, which have relatively short lead times.4 Other concerns are already being addressed by ongoing work to improve market rules, and by infrastructure planning and investment. A recent Department of Energy (DOE) report found that while a low-carbon electric
1 See, for example, the January 6, 2015 blog post of Janet McCabe, EPA’s Acting Administrator for Air and Radiation, “Time and Flexibility: Keys to Ensuring Reliable, Affordable Electricity,” http://blog.epa.gov/epaconnect/2015/01/time-and-flexibility/. Also, see EPA’s October 2014 Notice of Data Availability (NODA) that sought comments on, among other things, the potential to change the phase-in of emissions reductions to accommodate, for example, any constraints in natural gas distribution infrastructure, or how states could earn compliance credits for actions taken between 2012 and 2020. 2 Although we think it is ultimately a good thing that the industry is paying close attention to reliability issues – so that any potential problems can be avoided through planning and infrastructure – we do note that serious questions have been raised about the assumptions used in recent reliability assessments performed by the North American Reliability Corporation (NERC). For example, Brattle Group’s February 2015 report found that NERC failed to account for how industry is likely to respond to market and operational changes resulting from the Clean Power Plan. See Jurgen Weiss, Bruce Tsuchida, Michael Hagerty, and Will Gorman, “EPA’s Clean Power Plan and Reliability: Assessing NERC’s Initial Reliability Review,” The Brattle Group, February 2015. 3 The same survey found that utility executives believe that distributed energy resources offer the biggest growth opportunity over the next five years, and more than 70 percent expect to see a shift away from coal towards natural gas, wind, utility-scale solar and distributed energy. Utility Dive and Siemens, “2015 State of the Electric Utility Survey Results,” January 27, 2015. The survey included 433 U.S. electric utility executives from investor-owned and municipal utilities, and electric cooperatives. 4 Our report provides typical timelines for various types of resource additions in Section II.

Electric System Reliability and the EPA’s Clean Power Plan
Analysis Group ES-4
system may significantly increase natural gas demand from the power sector, the projected incremental increase in natural gas pipeline capacity additions is modest (lower than historic pipeline expansion rates), and that the increasingly diverse sources of natural gas supply reduces the need for new pipeline infrastructure.5
Some other comments raise the reliability card as part of what is – in effect – an attempt to delay or ultimately defeat implementation of the Clean Power Plan. We encourage parties to distinguish between those who identify issues and offer solutions, and those who (incorrectly) suggest that reducing carbon pollution through the Clean Power Plan is inconsistent with electric system reliability.
In the end, because there are such fundamental shifts already underway in the electric industry, inaction is the real threat to good reliability planning. Again, there are continuously evolving ways to address electric reliability that build off of strong standard operating procedures in the industry.
There are many capable entities focused on ensuring electric system reliability, and many things that states and others can do to maintain a reliable electric grid.
First and foremost, states can lean on the comprehensive planning and operational procedures that the industry has for decades successfully relied on to maintain reliability, even in the face of sudden changes in industry structure, markets and policy.
Second, states should take advantage of the vast array of tools available to them and the flexibility afforded by the Clean Power Plan to ensure compliance is obtained in the most reliable and efficient manner possible. Given the interstate nature of the electric system, we encourage states
5 U.S DOE, “Natural Gas Infrastructure Implications of Increased Demand from the Electric Power Sector,” February 2015.

Electric System Reliability and the EPA’s Clean Power Plan
Analysis Group ES-5
to rely upon mechanisms that facilitate emission trading between affected power plants in different states. Doing so will increase flexibility of the system, mitigate many electric system reliability concerns, and lower the overall cost of compliance for all.6
In this report we identify a number of actions that the Federal Energy Regulatory Commission (FERC), grid operators, states, and others should take to support electric system reliability as the electric industry transitions to a lower-carbon future. We summarize our recommendations for these various parties in tables at the end of our report.
In the end, the industry, its regulators and the States are responsible for ensuring electric system reliability while reducing carbon emissions from power plants as required by law. These responsibilities are compatible, and need not be in tension as long as all parties act in a timely way and use the many reliability tools at their disposal.
We observe that, too often, commenters make assertions about reliability challenges that really end up being about cost impacts. Although costs matter in this context, we think it is important to separate reliability considerations from cost issues in order to avoid distracting attention from the actions necessary (and feasible) to keep the lights on. There may be “lower cost” options that reduce emissions some part of the way toward the target reductions, but that fail to meet acceptable reliability standards. We do not view such ‘solutions’ as the lowest cost solution precisely because they fail to account for the cost of unacceptable system outages to electricity consumers.
Any plan that starts with consumer costs and works backward to reliability and then to emission reduction is one that fails to consider the wide availability of current tools that have served grid operators for more than a decade to meet reliability needs. There is no reason to think that cost and reliability objectives cannot be harmonized within a plan to reduce carbon pollution.
6 As we will discuss in a series of regional reports, others have already identified that regional strategies will minimize overall compliance costs. For example, the Midcontinent Independent System Coordinator (MISO) estimated that a regional carbon constraint approach could save up to $3 billion annually relative to a sub-regional or individual state approach. MISO, “Analysis of EPA’s Proposal to Reduce CO2 Emissions from Existing Electric Generating Units,” November 2014. See also, “Statement of Michael J. Kormos, Executive Vice President – Operations, PJM Interconnection, FERC Docket No. AD15-4-000, Technical Conference on Environmental Regulations and Electric Reliability, Wholesale Electricity Markets, and Energy Infrastructure,” February 19, 2015.

Electric System Reliability and the EPA’s Clean Power Plan
Analysis Group ES-6
This paper is designed to:
• Describe the changes underway in the industry which set the stage for the continued evolution of reliability tools and practices;
• Provide a “reliability 101” primer to describe what “electric reliability” means to system planners and operators, and why specific standard practices are so important to assuring electric reliability;7
• Summarize reliability concerns expressed by various stakeholders; • Explain the ways that standard operating procedures can address these concerns; and, • Recommend actions that can be taken by various actors in the electric industry to assure
that the Clean Power Plan’s goals do not undermine reliable power supply.
Our recommendations can be found in tables following the Executive Summary.
7 This report also includes a glossary of acronyms used in our report.

Electric System Reliability and the EPA’s Clean Power Plan
Analysis Group Recommendation Tables - 1
Recommendation Tables
Table 1 Key Players in the Clean Power Plan and Available Tools
Entities Roles and Responsibilities
Entities with direct responsibility for electric system reliability
- FERC (under the Federal Power Act (FPA)) - NERC (as the FERC-approved Electric Reliability Organization under the FPA) - Regional Reliability Organizations (RROs) - System operators and balancing authorities (including Regional Transmission
Organizations (RTOs) and electric utilities) - States (for resource adequacy)
Other public agencies with direct and indirect roles in the Clean Power Plan
- U.S. Environmental Protection Agency (EPA) - State executive branch agencies:
- Air offices and other Environmental Agencies - Public Utility Commissions (PUCs) - Energy Offices - Public authorities (e.g., state power authorities)
- State governors and legislatures - U.S. Department of Energy (DOE) - Energy Information Administration (EIA)
Owners of existing power plants covered by 111(d) of the Clean Air Act
- Electric utilities - investor-owned utilities - municipal utilities - electric cooperatives - joint action agencies
- Non-utility power plant owners
Markets and Resource Planning/ Procurement Organizations
- Organized markets administered by RTOs (CAISO, ERCOT, ISO-NE, MISO, NYISO, PJM, SPP).
- Electric utilities with supply obligations & subject to least-cost planning processes: - Many utilities (including joint action agencies) operate under requirements to use
a combination of planning and competitive procurements (with or without self-build opportunities
- Transmission owners also have transmission planning requirements - Private investors (including non-utility companies) responding to market signals and
seeking to develop/permit/construct/install/operate new resources (including new power plant projects, demand-response companies, merchant transmission companies, rooftop solar PV installation companies, etc.)
Others
- North American Energy Standards Board (NAESB) for setting electric & gas standards - Administrators/Operators of CO2 allowance-trading systems - Administrators/Operators of energy efficiency programs - Fuel supply and delivery companies (gas pipeline and/or storage companies; gas
producers; coal producers; coal transporters) - Energy marketing companies - Emerging technology providers – including, e.g., storage system providers, companies
providing advanced communications and “smart” equipment, etc.

Electric System Reliability and the EPA’s Clean Power Plan
Analysis Group Recommendation Tables - 2
Table 2 FERC, NERC, and RROs’ Potential Actions to Address Reliability Issues
Electric Reliability Entities (with some of the their
Standard Tools)
Potential Additional Actions to Address Reliability Issues Relating
Directly or Indirectly to Clean Power Plan (CPP) FERC: - Adoption of federally-enforceable
reliability requirements and standards - Oversight of NERC and all bulk power
system operators - Oversight of interstate natural gas
pipeline owners/operators, with authority to approve interstate pipeline expansions
- Authority over transmission planning, tariffs, open-access
- In organized markets, authority over market rules (including capacity markets, provision of ancillary services providing various attributes to system operators)
- Interagency coordination with EPA, DOE
Consider: - Requiring NERC, RROs, and system operators/balancing authorities to
periodically assess potential reliability impacts of CPP with geographic scope appropriate to the reliability entity. The assessments could identify specific concerns, and develop backstop solutions − Preliminary assessments starting at end of 2015/early 2016, to
inform state action taking into account known policy, practices, resources in the relevant area
− Reliability assessments at the time of proposed state plans − Reliability assessments annually up through early 2020s
- Continuing to evaluate the adequacy of current FERC gas/electric coordination policies in light of incremental changes resulting from CPP relative to trends already underway in the industry
- Eliciting filings from RTOs and other transmission companies about any new planning tools, notice provisions for potential retirements, information reporting, new products, minimum levels of capability with various attributes
- Inquiring into new natural gas policies to support wider interdependence with electric system reliability (e.g., incentives for development of gas delivery/storage infrastructure)
- Working with states to consider mechanisms to afford bulk-power system grid operators’ greater visibility into generating and demand-side resources on the distribution system
- Providing guidance outlining compliance strategies that would require approvals of the FERC under the FPA (versus approaches that might not require such)
NERC − Reliability Standards, compliance
assessment, and enforcement − Annual & seasonal reliability
assessments − Special reliability assessments
Consider: − Continuing to conduct special assessments of impact of CPP on
reliability (as it periodically does for other developments in the industry) − Preliminary assessments in parallel with final rule
development,(in 2015) and development of State Plans (2015/2016)
− Final assessments upon finalization of State Plans (2016+) − Assess whether any new standards relating to Essential Reliability
Services need to be modified in light of electric system changes occurring as part of the industry’s response(s) to CPP
Regional Reliability Organizations − Annual & seasonal reliability
assessments − Special reliability assessments − Coordination with neighboring RROs
Consider: − Conducting special assessments of impact of CPP on reliability − Preliminary assessments in parallel with final rule
development,(in 2015) and development of State Plans (2015/2016)
− Final assessments upon finalization of State Plans (2016+)

Electric System Reliability and the EPA’s Clean Power Plan
Analysis Group Recommendation Tables - 3
Table 3
Grid Operators’ Potential Actions to Address Reliability Issues
Electric Reliability Entities (with some of the their
Standard Tools)
Potential Additional Actions to Address Reliability Issues Relating
Directly or Indirectly to Clean Power Plan (CPP) System Operators and Balancing Authorities − On-going annual & seasonal reliability
assessments, including transmission planning
− Special reliability assessments − Coordination with neighboring systems
Note: Some of these entities also fulfill market, resource planning and procurement functions
(described further below)
Consider − Conducting special assessments of impact of CPP on system
reliability − Preliminary assessments in parallel with final rule
development (in 2015) and development of State Plans (2015/2016)
− Final assessments upon finalization of State Plans (2016+) − Identifying specific areas of concern (e.g., notice period for
potential unit retirements; need for more routine anticipatory analyses in transmission planning to explore “what if” changes occur on the system; identification of zones with violations of reliability requirements and any specific units needed for reliability pending resolution of the violation)
− Working with stakeholders (including environmental agencies in relevant states) to develop proposals for reliability safety value to ensure mechanism to fully offset CO2 emission impacts when use of a safety valve is triggered
− Working with counterparts in natural gas industry to harmonize business practices, develop improved inter-industry forecasting tools, coordinate operating days/market timing, share information, identify specific natural gas infrastructure needs
− Refreshing policies and practices to assure technology-neutral and competitively neutral means for providing reliability services (both resource adequacy and system operations)
- Technology neutrality should recognize the different attributes needed for essential reliability services, but be supportive of generation, transmission and demand-side solutions for providing such attributes
− Working with state officials and distribution utilities within their relevant geographies to explore ways to expand the visibility (e.g., through communications and information systems) of the system operator into distribution system resource operations (i.e., distributed variable resources such as solar PV); incorporate into planning activities
− Continuing to improve meteorological forecasting capabilities

Electric System Reliability and the EPA’s Clean Power Plan
Analysis Group Recommendation Tables - 4
Table 4 Other Federal Agencies’ Potential Actions to Address Reliability Issues
Other Public Entities (with some of the their
Standard Tools)
Potential Additional Actions to Address Reliability Issues Relating
Directly or Indirectly to Clean Power Plan (CPP)
EPA - Issuing the final Clean Power Plan
regulation - Responsibility for finalizing standards
for new power plants (Section 111(b)) - Responsibility for administering federal
air, water, and waste pollution standards
Consider: - Clarifying acceptable standard market mechanisms that could be
used to accomplish emission-reduction and reliability goals in economically efficient ways
- Providing guidance on allowing one or more forms of a reliability safety valve, with the condition that overall emissions over the interim period (e.g., 2020-2029) are equal to or better than the plan without a triggering of the reliability safety valve. Examples might include: - Allowing the reliability safety valve as proposed by the
RTO/ISO Council (with the noted CO2 emissions offset condition)
- Requiring/allowing temporary exemptions/modifications of timing/quantity requirements in State Plans
- Providing guidance about how states may propose to alter compliance deadlines/requirements where needed for reliability, should such issues arise over time
- Requiring States to include reliability assessments in final State Plans (not for EPA to review/approve, but rather to ensure that such studies are conducted)
Other federal agencies - DOE - EIA
Consider: - Investigating additional reporting requirements by members of the
industry - Conducting studies and analyses that examine physical
capabilities of more integrated gas and electric system - Identifying CPP compliance issues as qualifying for DOE Critical
Congestion Areas and Congestion Areas of Concern, and/or “national interest electric transmission corridors” under the Energy Policy Act of 2005

Electric System Reliability and the EPA’s Clean Power Plan
Analysis Group Recommendation Tables - 5
Table 5 States’ Potential Actions to Address Reliability Issues
Other Public Entities (with some of the their
Standard Tools)
Potential Additional Actions to Address Reliability Issues Relating
Directly or Indirectly to Clean Power Plan (CPP) States − Air agency: − obligation to submit State Plans to
EPA − reviewing/approving any
modification to air permits of affected generating units
− Executive and legislative responsibility for energy, environmental laws and regulations
− Oversight over regulated electric and natural gas utilities (public utility commissions) – including ratemaking, programs (e.g., energy efficiency), planning and resource procurement
− Coordination with neighboring states − Engagement in regional planning,
operational, and market rules and procedures
− Siting/permitting of electric energy infrastructure and local gas distribution facilities
Consider: − Proactively (i.e., now) engaging with state utilities and state/regional
system operators in evaluation of potential CPP reliability impacts, and identification of reliability solutions (including supporting preliminary assessments in parallel with development of State Plans (2015/2016), and final assessments upon finalization of State Plans (2016+))
− Establishing as part of the State Plan an annual state reliability evaluation, and identification of/commitment to take steps and measures in the future in response to any identified reliability concerns. This could include a framework for allowing compliance waivers and extensions in the early years in the event that reliability issues arise circa 2020, combined with requirements on state and/or compliance entities for provisional CO2 reductions over transition period to make up for waivers/extensions in early years (e.g., to arrive at same cumulative emissions over the period)
- Incorporating conditions in air permits to reflect operating limits (e.g., total emissions within an annual period)
- Creating flexible implementation plans (e.g., mass-based models) and multi-state programs (e.g., regional cap/trade) to mitigate potential reliability impacts and operational flexibility across regions that reflect the normal operations of interconnected electric system
- State or regional cap and trade programs - “Bubbling” of requirements across units owned by common
owner (e.g., within one state or across states through bilateral state agreements/MOUs)
− Developing statewide policies and measures for compliance that support reliability (energy-efficiency/renewable energy programs, including measures beyond Investor Owned Utility funded programs), for example: − Clean energy standards − Investment in emerging or early-stage technologies (e.g., storage),
public-private partnerships, tax and investment credits − Protocols for counting Energy Performance Savings Contracts in
State Plans − Reviewing need to modify permitting/siting regulations to
accommodate dual-fuel capability of gas-fired power plants − Reviewing need to modify administrative or procedural measures to
expedite siting, zoning, permitting of needed energy infrastructure (renewables, other power plants, transmission, LNG storage)
− Instituting new entities (e.g., natural-gas buying authorities) to serve as contracting entity to support long-term commitments that may be necessary for gas system expansion
− Requiring longer advance notice of power plant retirements

Electric System Reliability and the EPA’s Clean Power Plan
Analysis Group Recommendation Tables - 6
Table 6 Organized Markets’ & Electric Utilities Potential Actions to Address Reliability Issues
Entities Involved with Markets, Resource Planning, and Procurements
Potential Additional Actions to Address Reliability Issues Relating
Directly or Indirectly to Clean Power Plan (CPP) Wholesale Market Administrators (Generally, Bulk Power System (BPS) Operators in Competitive Market Regions) − Markets designed and administered to
minimize costs subject to the constraint that all reliability requirements of the system are met
Consider: − Adding technology-neutral and competitively neutral market
rules/products to add incentives for new reliability attributes. − Local (zonal/load pocket) capacity and energy market
pricing; changes to scarcity pricing − Reliability attributes for system security (greater quantities
of spinning or non-spinning reserves; AGC; ramping/load-following; reactive power; on-site fuel; frequency response; black start capability)
− Establishing or clarifying, where necessary, expectations around unit performance during shortage or scarcity conditions
− Clarifying how normal dispatch processes incorporate current restrictions on unit operations (including emissions limits, ramping periods, etc.), and how similar operational restrictions (if any) resulting from Clean Power Plan compliance would be incorporated in system operations
− Establishing or clarifying, where needed, provisions for the creation of reliability must run (RMR) contracts for generators needed for reliability that would otherwise retire – conditioned upon permit restrictions that account for CO2 emissions offsets
− Establishing or clarifying, where needed, procedures to minimize duration of RMR contracts through development of utility or market responses (generation, transmission)
− Identifying any changes in forward capacity markets for the period starting in 2020
Vertically-Integrated Utilities, Cooperatives, Municipal Light Companies − Long-term resource planning − Obligation and opportunity to develop
and obtain cost recovery for necessary demand, supply, and transmission investments and expenses
− Obligation to maintain power system reliability
− In some states, integrated resource planning and/or resource need/procurement processes
− Coordinated operation of systems with neighboring utilities
Consider: − Conducting forward-looking assessments of potential impacts on
system reliability of CPP implementation − Preliminary assessments prior to and during final rule
development and SIP implementation − Final assessments upon finalization of SIP
− Developing or expanding long-term integrated resource planning processes for timely and practical incorporation of CPP compliance requirements
− Incorporating all potential short- and long-term measures (supply and demand; generation and transmission) to address significant changes during CPP transition period
− Engaging in coordination with neighboring utilities around local reliability concerns tied to CPP implementation
Electric System Reliability and the EPA’s Clean Power Plan
Analysis Group Recommendation Tables - 7
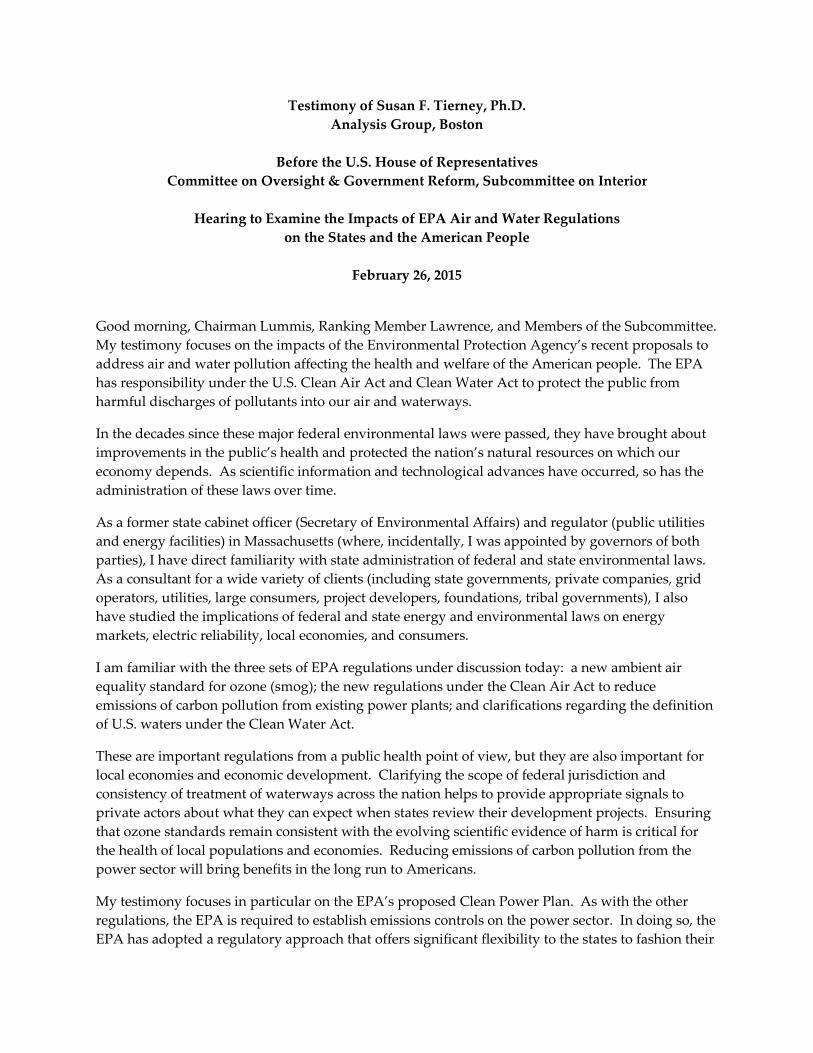
Table 7 Other Organizations’ Potential Actions to Address Reliability Issues
Other Organizations that have a Role To Play in Assisting in Reliable and
Effective Industry Compliance
Potential Additional Actions to Address Reliability Issues Relating
Directly or Indirectly to Clean Power Plan (CPP)
Non-Utility Generating Companies Consider: - Responding to signals in organized wholesale markets and in
response to competitive solicitations by electric utilities Interstate Natural Gas Pipeline Owners/Operators − Coordination among NGP
owners/operators − Coordination with BPS operators − Development of new pipeline capacity
Consider: − Improving coordination with system operators – e.g., harmonize
standards and practices, coordinate operating days/market timing, share information, etc.
NAESB - Working with industry stakeholders to
develop standards for operations in electric and gas industry
Consider: − Periodically convening industry sector discussions about
continuing need to harmonize standards in the electric and gas industries
Administrators of Allowance Trading Programs (e.g, RGGI, California, new ones)
Consider: - Establishing new “plug and play” programs that allow states to
join with relatively administrative ease Administrators of Energy Efficiency Programs
Consider: - Establishing products to offer to generating companies to
‘purchase’ program credits to offset emissions, subject to strict measurement and verification
Energy Service Companies (ESCos) Consider: - Working with State agencies to develop mechanisms to
incorporate energy-savings-performance contracts into State Plans

Electric System Reliability and the EPA’s Clean Power Plan
Analysis Group 8
I. Context
In June 2014, the U.S. Environmental Protection Agency (EPA) issued its proposed Clean Power Plan, designed to reduce carbon dioxide (CO2) emissions from existing fossil-fuel power plants in the United States. The final rule, which is now anticipated to come out in mid-2015, will require each of the 49 states with covered power plants to prepare and submit plans for how they propose to reduce emissions from the plants in their state. Although the features of the final regulation will undoubtedly change in light of the many comments filed, EPA’s current proposal requires states and affected electric generating units (EGUs) to demonstrate progress to reduce emissions starting in 2020, with subsequent reductions thereafter. This new policy will eventually affect over half of the nation’s generating capacity and all but the smallest fossil fuel generating units.8
In light of the broad scope of the regulation, many stakeholders have raised concerns about whether EPA’s proposal will jeopardize the reliability of the electric system. In Washington, in state capitols, in media alerts, in comments filed at the EPA, and elsewhere, many public officials, electric utilities, industry reliability organizations, and others have been demanding
8 An affected electric generating unit (EGU) is defined broadly, as any boiler, integrated gasification combined cycle (IGCC), or combustion turbine (in either simple cycle or combined cycle configuration) that (1) is capable of combusting at least 250 million Btu per hour; (2) combusts fossil fuel for more than 10 percent of its total annual heat input and (3) sells the greater of 219,000 MWh per year and one-third of its potential electrical output to a utility distribution system (Proposed Rule, Federal Register, Vol. 79, No. 117, June 18, 2014, page 34854). Generating units estimated to be subject to EPA’s Clean Power Plan:
SNL Financial
(as of 2-2015)
Generating Units Likely to be Directly Covered by Section 111(d)*
Total Grid-Connected Generating Capacity in
the U.S. (GW)
111(d) Capacity as Share of Total Capacity (%)
(# Units) Summer Capacity (GW) Summer Capacity (GW) Summer Capacity (GW)
Coal 922 300 303 99%
Gas 2,137 334 464 72%
Oil 62 17 39 44%
Total Fossil 3,121 651 806 81%
All Capacity 1,151 57%
* Includes all existing or under development steam turbines and combined cycle units greater than 25 MW, and any natural gas combustion turbines with generation greater than 219,000 MWh. Source: SNL Financial, Power Plant Unit Database.

Electric System Reliability and the EPA’s Clean Power Plan
Analysis Group 9
that the changes introduced by the Clean Power Plan not come at the expense of electric reliability.9
For many decades, such cautions have appeared whenever major events – such as major new environmental regulations affecting power plants or structural changes to introduce competition in the electric industry – occur that could affect electric system reliability.10
Indeed, well before the EPA issued its proposal, various reliability organizations had already begun to anticipate how changes underway in the electric industry would necessitate modifications in traditional ways to plan for and operate the electric system. For example, the North American Electric Reliability Corporation (NERC) – the nation’s electric reliability standards organization – issued a “concept paper” in October 2014, in which NERC describes the many ways that today’s reliability procedures will need to evolve to keep ahead of the changing character of the electric “resources” that connect with the grid.11
NERC’s paper, which was in development well before the EPA issued its Clean Power Plan (and is different from NERC’s November 2014 assessment relating to the EPA proposal), begins by recognizing that the
North American BPS [bulk power system] is experiencing a transformation that could result in significant changes to the way the power grid is planned and operated. These changes include retirements of baseload generating units; increases in natural gas generation; rapid expansion of wind, solar, and commercial solar photovoltaic (PV) integration; and more prominent uses of Demand Response (DR) and distributed generation…. As the overall resource mix changes, all the aspects of the ERSs [Electric Reliability Services] still need to
9 See discussion in Section III and the Appendix to this paper. Note that even the leadership of the EPA and the President of the United States have insisted upon design and implementation of the Clean Power Plan in ways consistent with electric system reliability. See, for example: President Obama’s Presidential Memorandum (“Power Sector Carbon Pollution Standards,” June 25, 2013), in which the President directed the EPA to issue regulations to control CO2 emissions from the power sector, and included the following instructions: “In developing standards, regulations, or guidelines … [EPA] shall ensure, to the greatest extent possible, that you: …(v) ensure that the standards are developed and implemented in a manner consistent with the continued provision of reliable and affordable electric power for consumers and businesses…” Available at: http://www.whitehouse.gov/the-press-office/2013/06/25/presidential-memorandum-power-sector-carbon-pollution-standards
Also, see: Statement of Gina McCarthy, Nominee for the Position of Administrator of the EPA, Before the Environment and Public Works Committee, U.S. Senate, April 11, 2013; and the January 6, 2015 blog post of Janet McCabe, EPA’s Acting Assistant Administrator for Air and Radiation, “Time and Flexibility: Keys to Ensuring Reliable, Affordable Electricity,” http://blog.epa.gov/epaconnect/2015/01/time-and-flexibility/.
10 Notably, this has occurred in conjunction with: the EPA “NOx SIP call” which affected 23 states in the 1990s; state and federal policies related to electric industry restructuring in the 1990s: the Cross-State Air Pollution Rule (CSAPR) and MATS rule; and with on-going increases in the amount of distributed energy resources and intermittent/non-dispatchable resources on the grid.
11 NERC, “Essential Reliability Services Task Force: A Concept Paper on Essential Reliability Services that Characterizes Bulk Power System Reliability,” October 2014. Hereinafter referred to as “NERC Essential Reliability Services Report”.

Electric System Reliability and the EPA’s Clean Power Plan
Analysis Group 10
be provided to support reliable operation. ERSs are technology neutral and must be available regardless of the resource mix composition.12
Those transformations have been in the works for years – in part as a result of the shale gas revolution, changes in the relative prices of fossil fuels, state policies and federal laws encouraging greater use of renewable energy and energy efficiency, declines in wind and solar technology costs, retirements of old and highly polluting coal plants, retirements of a handful of nuclear plants (in some cases for safety reasons, and others for economic reasons), and strong interest by many customers in exploring ways to better manage their own energy use.13 We depict these changes occurring in parallel in Figure 1, below.
Figure 1 Timeline of Changes Underway in the Electric Industry
As always, grid operators and utilities have implemented and adjusted long-standing planning and operational practices to stay abreast of, understand, and adapt practices to address reliability issues related to such changes in the industry. Given the multiple pressures on the electric power sector, such actions would be needed today even if EPA had not proposed to control carbon pollution in the Clean Power Plan.
12 NERC Essential Reliability Services Report, page iii. The scope of work for this report was adopted by NERC in March of 2014, before the EPA Clean Power Plan was issued in proposed form in June, 2014.
13 See, for example: Susan Tierney, “Greenhouse Gas Emission Reductions From Existing Power Plants Under Section 111(d) of the Clean Air Act: Options to Ensure Electric System Reliability,” May 8, 2014, pages 23-46.
2010 2011 2012 2013 2014 2015 2016 2017 2018 2019 2020 2021 2022 2023 2024 2025 2026 2027
… Shale Gas Revolution
… Accelerated distributed energy resources
… MATS Regulations
… 70 GW Plant Retirements to date
… 103 GW Resource Additions to date … Plus 50 GW of Planned Development1
1 Includes retirements/additions announced for 2015 and units that are mothballed or out of service. Planned units include those under construction or in advanced development. Source for MW of retirements and planned additions: SN Financial, Accessed February 2015
… Industry-wide focused attention and ongoing reliability assessments to address emerging changes in the power system…
… FERC policies: reliability, competitive markets, gas/electric integration, renewables integration, transmission planning incorporating state policies
… States’ policies: renewable portfolio standards; diversity of supply; energy efficiency; other distributed energy resources

Electric System Reliability and the EPA’s Clean Power Plan
Analysis Group 11
Indeed, many organizations besides NERC have also been flagging the need to address reliability issues as the industry undergoes significant change. For example:
• The Federal Energy Regulatory Commission’s (FERC) attention to gas-electric coordination as the two industries become increasingly dependent on each other,14 and transmission companies and Regional Transmission Organizations (RTOs) plan for integration of variable generating resources and transmission requirements driven by public policies of state and local governments;15
• Studies by the Midcontinent ISO (MISO) of gas infrastructure,16 and MISO’s support for policies addressing transmission implications of the region’s growing quantities of wind and other renewable resources;17
• ISO-New England’s (ISO-NE) continuing analysis of that region’s deepening reliance on gas-fired generating facilities, near-term generator retirements, and need to integrate deepening amounts of renewable resources;18
14 FERC Commissioner Philip Moeller first requested comments on gas-electric coordination in February 2012. Since that time, the FERC has held nine regional conferences to address the issue. See FERC “Natural Gas – Electric Coordination.” Available: http://www.ferc.gov/industries/electric/indus-act/electric-coord.asp for additional detail. In 2013, FERC Chairman Cheryl LaFleur and Commissioner Moeller testified before Congress on “The Role of Regulators and Grid Operators in Meeting Natural Gas and Electric Coordination Challenges”. The Commissioners noted that gas-electric coordination was and is a growing and important trend due to falling natural gas prices and substantial domestic supplies. FERC receives quarterly updates from its staff on the status of developments in the industry regarding gas/electric coordination issues. http://www.ferc.gov/industries/electric/indus-act/electric-coord.asp. Note too that in response to a directive from FERC, the North American Energy Standards Board (NAESB) undertook a process to develop some new standards for both electric and natural gas industries, which were described in a report submitted to FERC on September 29, 2014.
15 On July 21, 2011, FERC issued Order 1000 (Docket No. RM10-23-000), in which the agency required, among other things, that each public utility transmission provider: (1) participate in a regional transmission planning process that produces a regional transmission plan; and (2) consider transmission needs driven by public policy requirements established by state or federal laws or regulations. Each public utility transmission provider must establish procedures to identify transmission needs driven by public policy requirements and evaluate proposed solutions to those transmission needs. FERC Fact Sheet, Order 1000, http://www.ferc.gov/media/news-releases/2011/2011-3/07-21-11-E-6-factsheet.pdf. On June 22, 2012, FERC issued the final rule in its docket (RM10-11-000) on Integration of Variable Energy Resources, in which it ordered a number of changes in interconnection agreements, transmission tariffs and cost recovery for regulation reserves to better accommodate renewables reliably and efficiently. 139 FERC ¶ 61,246, FERC Order No. 764.
16 MISO released its first gas-electric interdependence study in February 2012; it reviewed existing gas pipeline capacity to serve existing electric generation and additional capacity that could be added in the future, and signaled to the MISO and stakeholders that an increase in gas-fired generation will require an “improved collaborative process between pipelines, power generators, and regulators to coordinate natural gas infrastructure projects.” Gregory L. Peters, “Gas and Electric Infrastructure Interdependency Analysis,” Prepared for the Midwest Independent Transmission System Operator, February 22, 2012, page. 12.
17 MISO’s “Multi-Value Project Portfolio Analysis” of transmission projects will support delivery of up to 41 million MWh of wind energy. Available: https://www.misoenergy.org/PLANNING/TRANSMISSIONEXPANSIONPLANNING/Pages/MVPAnalysis.aspx
18 ISO-NE first identified these issues in 2010. In 2013, ISO-NE’s Chief Executive Officer, Gordon van Welie, stated: “It is clear that resolving these challenges will not be simple, and it will take several years to realize the benefits of the solutions… It is important to remember that, often, the best ideas are born out of necessity. Today the power system faces significant and formidable obstacles. But tomorrow, it will be smarter, stronger, and more environmentally sound because of our collective efforts.” ISO-NE, “2013 Regional Electricity Outlook,” January 31, 2013, page 8.
Electric System Reliability and the EPA’s Clean Power Plan
Analysis Group 12
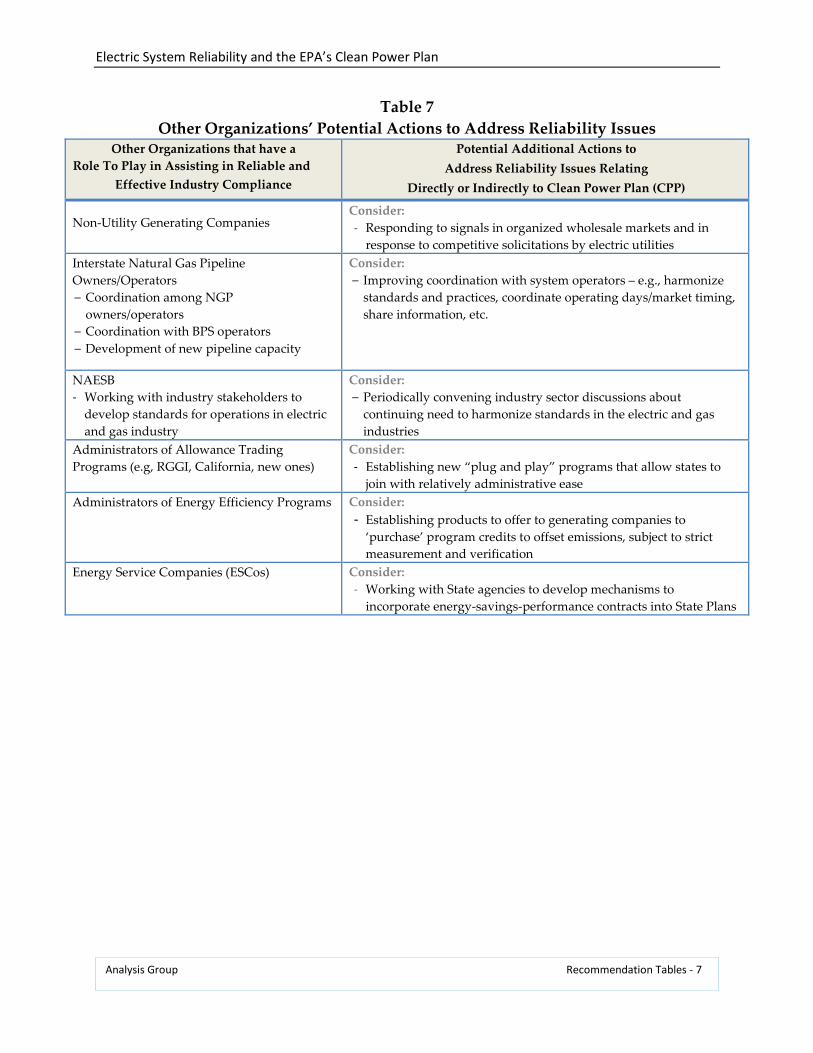
• Starting in 2010, calls by the American Public Power Association (APPA) to pay greater attention to the impacts of distributed generation and increased natural gas demand for power generation;19
• The Electric Reliability Council of Texas’ (ERCOT) ongoing analysis of wind integration as part of its bi-annual Long Term System Assessment;20
• The review by the five major electric utilities in California of the implications of a potential significant increase in the state’s renewable portfolio standard,21 and the California ISO’s (CAISO) solicitation of more flexible resources to support integration of renewables;22
• PJM Interconnection’s (PJM) recent capacity performance proposal, in response to concerns raised by unavailable conventional generation capacity during the 2013-2014 polar vortex;23 and
• New York ISO’s (NYISO) ongoing evaluation of reliability needs, including scenarios that account for environmental regulations, increasing penetration of renewable resources, and natural gas fuel availability.24
These studies and activities – and others like them – illustrate that our electric system operators, planners, regulators, and others are stepping up to the plate (as they typically do) to grapple with ways to make sure that the future electric system is as reliable as the one we count on today. And their analyses reflect the reality that these trends are occurring as a result of economic, policy and regulatory forces that are independent of EPA’s Clean Power Plan.
The value of such “reliability alerts” is that they identify ways in which changes in policy, economics, technology, and law affecting the electric industry intersect with the physics and engineering of interconnected electric systems. All parts of the system must pay attention to certain imperatives of the others.
19 See, for example, Aspen Environmental Group, “Implications of Greater Reliance on Natural Gas for Electricity Generation,” prepared for American Public Power Association, July 2010.; and American Public Power Association, “Distributed Generation: An Overview of Recent Policy and Market Developments”, November 2013.
20 See, for example, ERCOT, “Long-Term System Assessment for the ERCOT Region,” December 2012, which examined the implications of introducing significant wind generation and new gas-fired power plants on to the ERCOT Texas system.
21 Energy+Environmental Economics, “Investigating a Higher Renewables Portfolio Standard in California,” January 2014.
22 California Independent System Operator Corporation Reply Comments on Workshop issues, before the Public Utilities Commission of the State of California, In the Matter of “Order Instituting Rulemaking to Oversee the Resource Adequacy Program, Consider Program Refinements, and Establish Annual Local Procurement Obligations.” Rulemaking 11-10-023, April 5, 2013.
23 PJM Staff Proposal, “PJM Capacity Performance Proposal”, August 20, 2014.
24 NYISO conducts a detailed “Reliability Needs Assessment” every two years. See, for example, NYISO, “2014 Reliability Needs Assessment,” Final Report, September 16, 2014.

Electric System Reliability and the EPA’s Clean Power Plan
Analysis Group 13
Certainly, the shale gas ‘revolution’ has introduced significant quantities of domestically supplied natural gas at prices which compete with coal, the historically dominant domestic fossil fuel for power generation. This new reality presents economic opportunities to the power system, with cost and environmental benefits for households and businesses. At the same time, however, lower-cost natural gas introduces new issues that must be addressed in the standards, business practices and regulation of both the electric and gas industries: for example, there are new issues surrounding ensuring adequate fuel-transportation and storage arrangements. States’ policies to rely more heavily on domestic wind and solar generation also introduce new challenges: grid operators must plan to operate their systems reliably with greater reliance on less dispatchable resources (or in some cases resources that cannot be ‘seen’ on the system by grid operators, when the resources are behind the meters of customers).
Reliability organizations and grid operators (including NERC, Regional Transmission Organizations (RTOs), electric utilities, and others) are already facing the implications of these trends. They are doing what we count on them to do: looking ahead to see what’s on the horizon and identifying reliability-related issues that require adjustments to planning, markets, or operations. They are identifying issues that arise from economic, technological, legal or policy changes. They are developing new analytic tools to better understand how factors like the weather (or wind or sun/cloud-cover conditions) affect power system operations. They are identifying possible, if not likely, changes in power supplies, and indicating where and when new resources might be needed in the years ahead. They are working with transmission owners, power plant companies, government regulators, reliability coordination organizations, consumer representatives, and others to identify changes that may be required in operating standards, market products, and practices.
This is standard operating procedure in an industry with a history with strong legal, cultural, and organizational incentives to do what it takes to make sure that a world-class reliable electric system remains a bedrock of the American economy and society. Recent calls for action to ensure that the Clean Power Plan does not jeopardize electric system reliability should be viewed in that context: people are doing their jobs, not necessarily trying to impede the Clean Power Plan.

Electric System Reliability and the EPA’s Clean Power Plan
Analysis Group 14
II. What Do We Mean by “Electric System Reliability”?
What is reliability, and why does it matter?
Most electricity users think of reliability in terms of how often their power shuts off and how long it takes to get it back on. These familiar reliability annoyances typically result from events affecting the local distribution system, such as a snowstorm or hurricane knocking out power lines or a car hitting a power pole.
While critically important to electricity users,25 such events are not the main concern of observers considering the implications of EPA’s Clean Power Plan. What they worry about is whether the overall electric system can do its job, day in and day out, even if one neighborhood or another loses its power.
This other kind of reliability is known as “bulk power system”26 reliability (and what we call “system reliability” and what insiders sometimes call “BPS” reliability). Outages due to system failures differ from local outages in fundamental ways: in how they can arise; in the geographic scope of power interruptions; in the process and timing of power restoration; in the magnitude of adverse consequences; and, in terms of the parties responsible to fix the problems. The sheer scale of potential human health, safety, and economic impacts is what separates system reliability from local reliability, and dictates a high degree of vigilance on the part of regulators and the industry to avoid system-reliability failures.27
25 Electricity consumers are acutely aware of how inconvenient and costly outages can become, and of course may not care whether an outage is local or system-wide, in terms of the disruptive impacts on their lives. At the state level, maintaining reliable service is a fundamental obligation of every local utility, and state public utility commissions (PUCs) measure the performance of local utilities in maintaining local reliability over time through measurements that track the frequency and duration of outages. In many states, utilities can be fined heavily for poor reliability performance tied to local distribution-system outages. In contrast, system power failures – which are far less common – generally involve events affecting power plants and transmission lines and a wider geographic area of the grid, with reliability enforcement subject to the jurisdiction of FERC under then Federal Power Act (FPA).
26 A Bulk Power System (BPS) generally covers a wide geographic region, and includes the generating resources, transmission lines, and associated equipment and systems used to operate the integrated electric system within the region. BPSs generally do not include the lower-voltage distribution systems of local utilities, which deliver power from the BPS to end-use customers.
27 This is not to say that local distribution system circumstances can never create system reliability challenges. Given that the electric system has to maintain customer demand (load) and supply in balance at all times, a major storm that causes local lines to
http://www.dailymail.co.uk/news/article-2226399/Sandy-Vast-majority- ConEd-wont-power-10-days--Manhattan-hopes-lit-Saturday.html

Electric System Reliability and the EPA’s Clean Power Plan
Analysis Group 15
Table 8 Entities Responsible for Electric System
Reliability
For this reason, multiple entities (including those in Table 8) constantly monitor conditions on the overall power system to assure that the overall system operates with a high degree of reliability. System planners, reliability organizations, power companies and regulators look many years ahead, to analyze changing conditions and flag issues on the horizon that need attention. From one season to the next, they review whether there will be enough resources
to meet peak demand. Closer to real time, system operators monitor whether power plants are out for maintenance, whether temperature conditions will produce higher than expected demand, and myriad other conditions so that they can get ready for the next day’s operations. And in real time, on a second-by-second basis, grid operators have to monitor, and manage the “balance” of the system so that supply equals demand within tolerable operating limits (i.e., “frequency”). Thus, across very different time frames, many actors in the industry work to assure that the system performs with impeccable reliability levels.
Those responsible range from: the federal regulators at the FERC, which has statutory authority relating to system reliability; to NERC, the nation’s “Electric Reliability Organization” (ERO), authorized by FERC to set reliability standards for grid operators, utilities and other power companies; to Regional Reliability Organizations (RRO) which ensure that the system is reliable, adequate and secure within the geographic footprint for which they’re responsible; to grid operators (also known as “balancing authorities” or “system operators”) with the operational responsibility in smaller areas.28 Each go down can cause a rapid loss of demand with the immediate need to address that big imbalance on the overall system in order to avoid a bigger problem affecting many other areas of the grid. Similarly, high penetrations of distributed resources (e.g., rooftop solar panels on customers’ premises) connected to the local distribution system are emerging as a reason to increase the BPS grid operator’s “visibility” into what is happening at the distribution system level because of the interrelationships between the two systems. In fact, several areas with significant current or expected installation of distributed resources (e.g., Hawaii, California) have begun to evaluate potential system-wide challenges associated with such developments.
28 NERC’s Glossary of Terms formally defines the various entities, along with various terminologies that described their responsibilities. NERC, “Glossary of Terms Used in NERC Reliability Standards,” January 29, 2015, available: http://www.nerc.com/pa/stand/glossary%20of%20terms/glossary_of_terms.pdf

Electric System Reliability and the EPA’s Clean Power Plan
Analysis Group 16
one has different responsibilities, as shown in Table 8.
These entities monitor system reliability using time-tested, well-developed industry analytic tools. For longer-term assessments, the standard methods take into consideration a vast array of potential future infrastructure scenarios and system operational contingencies (e.g., sudden loss of generation, transmission or load). Annually and seasonally, system operators and reliability planners conduct reliability assessments to evaluate system changes, flag areas of concern that need to be addressed within different time frames, and identify plans to address any reliability concerns that may arise over the planning period. In addition, special assessments are periodically carried out in response to any industry or policy changes that have the potential to affect system reliability.
Thus it should not be surprising that EPA’s proposed Clean Power Plan is being (and will continue to be) evaluated for potential reliability impacts in future years. We have seen such reliability evaluations exercised regularly over decades in the face of other major industry changes, as noted previously.29 In every case, the prospect of change has led to reliability assessments and the waving of cautionary flags to call attention to the new challenges ahead.
How could electric system reliability be affected by the Clean Power Plan?
The Clean Power Plan will not lead to more cars hitting distribution poles, nor will it affect the frequency, location, or severity of storms that lead to local outages. The more relevant questions are how controls on power plant CO2 emissions will affect power system components and operations. As highlighted in Section III (which summarizes stakeholder concerns around the Clean Power Plan’s potential impacts on system reliability), concerns primarily relate to impacts these pollution controls will have on availability of existing power plants. Will plants
29 There are many examples where changes in conditions have led to questions about whether the electric industry (and its supply chains) could respond in a sufficiently timely and effective way to avoid reliability problems. This occurred, for example, with: (1) prior EPA and state regulations governing human health and environmental impacts, including the CAA Title IV sulfur dioxide cap-and-trade program contained in the 1990s; the changes in National Ambient Air Quality Standards (NAAQS) and Clean Water Act (CWA) requirements; the more recent CSAPR and MATS regulations; and the proposals under 316(b) of the CWA. (2) Changes to the structure of the electric industry over the past several decades, involving major changes in the regulation of and the incentives for investment and operation; transfers of ownership and management of existing generation and transmission system elements; and the formation of RTOs and associated wholesale markets for energy, capacity and ancillary services. (3) Fundamental shifts in the economics of generating power from coal or from natural gas, driven initially by changes in technology costs (e.g., large-scale steam generators versus combined-cycle technologies) and more recently by the emergence of low-priced domestic shale gas resources; the growing strain in some regions on the capacity of interstate natural gas delivery and storage systems to meet combined demand from heating and electricity generation uses during peak winter conditions; and different business practices, and operational protocols and standards in two industries (the natural gas industry and the electric industry) that might need to be better aligned as the two industries become more interdependent. (4) The ongoing displacement of traditional generation resources by grid-connected and customer-sited variable renewable resources, in some cases dramatically changing the shape of net load that must be followed by system operators. (5) Questions about the ability of some wholesale electricity markets to provide sufficient financial incentives for suppliers to continue to operate and/or to enter the market.

Electric System Reliability and the EPA’s Clean Power Plan
Analysis Group 17
retire and, if so, which ones and when? Which new ones will be added, over what time period? Will gas pipelines and other fuel-delivery infrastructure be in place in time to fuel a power system that depends more upon natural gas? Will the electric transmission system be capable of moving power generated in new locations relative to customer demand?
Insights and answers to these various questions fall into two basic categories, differentiated by time scales. One focuses on long-term planning considerations, and is called “resource adequacy”: Will there be enough (adequate) resources in place when system operators need to manage the system to meet demand in the future? The other focuses on short-term operations, and is called “system security”: Will the operators be able to run the system in real time in a secure way to keep the system in balance, with all that that entails technically?30
Resource Adequacy
First, the interconnected electric grid must have resource adequacy – that is, there must be sufficient electric supply to meet electric demand at the time of annual peak consumption, taking into account the expectation that some parts of the system will not be able to operate for one reason or another. The system must have some additional quantity of capacity above the annual peak load value (the reserve margin) to cover the possibility that in highest-demand hours some resources may be out of service due to planned or unplanned outages.31 In some regions and sub-regions (or “zones”), constraints on the ability of the transmission system to move power from one location to another mean that some portion of the demand within the zone must be met by generating resources within that same zone.
Ensuring resource adequacy is generally accomplished through two steps. First, the expected system peak demand and energy requirements over a long-term period (e.g., ten years) are established through a comprehensive forecasting effort. Forecasting processes for this purpose use well-established economic and industry modeling tools and data, are conducted frequently, and typically involve input by utilities, grid operators, public officials, consumer advocates, and
30 The U.S. Energy Information Administration (EIA) defines electric system reliability as the “degree to which the performance of the elements of the electrical system results in power being delivered to consumers within accepted standards and in the amount desired. Reliability encompasses two concepts, adequacy and security. Adequacy implies that there are sufficient generation and transmission resources installed and available to meet projected electrical demand plus reserves for contingencies. Security implies that the system will remain intact operationally (i.e., will have sufficient available operating capacity) even after outages or other equipment failure. The degree of reliability may be measured by the frequency, duration, and magnitude of adverse effects on consumer service.” U.S. EIA, “Glossary,” available at http://www.eia.gov/tools/glossary/index.cfm?id=E.
31 Reserve margins are generally in the range of 10 to 20 percent of system peak load. The actual reserve margin varies from region to region as a function of many factors (e.g., the mix and expected performance of assets on the system, operational and emergency procedures, the availability of demand response/load curtailment, and contributions that may come from neighboring regions).

Electric System Reliability and the EPA’s Clean Power Plan
Analysis Group 18
many other market participants and stakeholders. This step occurs in both wholesale energy markets and through integrated resource planning conducted by electric utilities.
Second, to the extent that identified long-term needs exceed resources expected to be on the system (due, for example, to growth in demand over time, and/or the retirement of existing resources), the deficit is met through the addition of new infrastructure (power plants or transmission lines) and/or demand resources (such as energy efficiency or demand-response measures). The ways in which new resources are added varies around the country, depending on the structure of the electric industry and the regulatory approach in place in a given state, along with other aspects of the market (including FERC-regulated RTOs in many regions). In wholesale market regions like PJM and NYISO, identified needs are met through market structures designed to provide financial incentives for investment in new capacity. In other regions (like most of the West), vertically integrated utilities, cooperatives and municipal electric companies add needed capacity by proposing and building their own project and/or through soliciting offers from other competitive suppliers. In any event, the overall resource need is forecasted (and, if relevant, a local/zonal requirement is further identified), and some combination of regulated and/or market process brings forth proposals to satisfy the need.
These processes are designed to accommodate the lead times necessary to bring a new project or resource into operation. They typically involve sufficient advance notification of need to allow for: (1) initial development stages and associated studies around project feasibility, interconnection, etc.; (2) administration of the markets or competitive procurement processes (and regulatory approvals of them); (3) zoning, permitting, and siting approvals for specific facility projects; (4) construction of the power plant and associated infrastructure (e.g., transmission interconnection/upgrades and – if needed – fuel delivery such as natural gas pipeline connections). Lead times for implementing peaking generating units and demand-side actions (e.g., programs leading to installation of energy efficiency measures; equipping buildings with automated capability to control demand when signaled to do so by the system operator; adding solar PV panels) are much shorter than those for large power plants and transmission upgrades. Figure 2 provides a conceptual depiction of lead times for planning, developing and installing
Figure 2 Typical Lead Times for Different Electric Resources
Source: Analysis Group

Electric System Reliability and the EPA’s Clean Power Plan
Analysis Group 19
different types of infrastructure to support electric resource options.
The processes outlined above rarely occur in a sequential fashion.32 Ten-year assessments take into account time periods that extend well beyond the number of years it typically takes to develop, permit, finance, and construct a new power plant.33 As one developer is starting to scope out where to site a new power plant in anticipation of hoping to get approvals and enter the market four years in the future, another already has its approvals and has commenced construction. Installation of demand-response measures take much shorter time periods altogether. Many steps occur concurrently across many different types of resources that are being planned and put in place to meet resource adequacy requirements.
In practice, there are exceptionally few instances where industry has failed to provide for resource adequacy, where – due to a lack of installed capacity – the grid operator had to implement emergency protocols (such as lowering voltage (sometimes known as rolling brownouts) or curtailing service to customers (sometimes known as rolling blackouts)).34 Although there have been rare occasions where a relatively near-term resource adequacy problem has been identified, regulators, market participants, grid operators, customers and reliability organizations have taken the steps needed to assure that the lights stayed on. There are well-known examples from around the country where the industry (including its regulators) did what was necessary to keep power flowing to consumers.35 In large part, this track record 32 For example, often initial market development of a new generating resource – e.g., site identification and control, technology selection, fuel and transmission infrastructure studies, fatal flaw analyses, even some initial siting and permitting efforts – happen in advance of or concurrent with resource need specification or market/utility procurement. Similarly, engineering, construction, and fuel contracts may be established (on a contingent basis) prior to final resource selection or final regulatory approval. Successful resource development teams effectively manage the flow of steps needed to take a new power plant from concept to operation so as to balance the stages of investment risk against the process of procurement and approval.
33 Typically, lead times for a new natural gas power plant involve 2 years for development and permitting and another 2 years for construction. A peaking unit typically takes less time: from 2 to 3 years. Demand-response and other distributed energy resources can be brought to market in 1 to 2 years. Some generating additions may further require transmission or distribution system upgrades. These can range in time from as little as 2 to 3 years for local distribution upgrades to 5 to 6 years or longer for more extensive transmission system upgrades, but such permitting and construction activities are carried out coincident with power plant permitting and construction. Lead and development times are in part, flexible, depending on the system need and critically, it is possible to move faster when needed. For example, following the California Energy Crisis in the early 2000’s, the state added thousands of MWs of new generation using a set of emergency 21-day, 4-month, and 6-month citing procedures. These emergency responses helped establish a set of best practice siting procedures that can be used by other states in similar situations. Susan F. Tierney and Paul J. Hibbard, “Siting Power Plants: Recent Experience in California and Best Practices in Other States,” Hewlett Foundation Energy Series, February 2002.
34 A notable exception is the well-known California electricity crisis of 2000-2001, which resulted from a combination of actions (including market manipulation through actions in the electric and natural gas markets, as well as caps on retail electricity prices). To our knowledge, there has never been a resource adequacy event (e.g., a brownout or blackout) due to implementation of an environmental regulation.
35 Examples include:
- ERCOT’s slim reserve margins in recent summers, including for example, in 2012, when nearly 2,000 MW of mothballed capacity was returned to service. Commissioner Anderson Jr., Public Utilities Commission of Texas, “Resource Adequacy in

Electric System Reliability and the EPA’s Clean Power Plan
Analysis Group 20
reflects the existence of the many resource-adequacy processes outlined above, the presence of multiple early warning systems, the ability of policy makers to take action to address challenges when urgent action is needed,36 and a strong mission orientation of the industry and its regulators.37
System Security
Even assuming that these resource adequacy processes end up ensuring there are enough megawatts of capacity in place when needed to meet aggregate load requirements, actual
ERCOT,” Update #4, January 30, 2013. Available: https://www.puc.texas.gov/agency/about/commissioners/anderson/pp/analysis_ercot_capacity_reserve_margin_013013.pdf.
- Reliability must run (RMR) contracts to keep plants operating, for example:
o The retention of operations of the Potomac Generating Station until completion of the Pepco transmission lines; see, Paul J. Hibbard, Pavel G. Darling, and Susan F. Tierney, “Potomac River Generating Station: Update on Reliability and Environmental Considerations,” July 19, 2011);
o A delay in Exelon’s proposed retirement of the Eddystone and Cromby generating stations in Pennsylvania after PJM determined that in the absence of transmission upgrades, retirements of those units would lead to violations of security standards, with a reliability must run agreement between PJM and Exelon and state air regulators so that the plant could remain on line pending those transmission upgrades, but with limits on the units’ dispatch to only those times when the units were needed for operational reliability purposes. Prepared Testimony of Kathleen L. Barrón, Vice President of Federal Regulatory Affairs and Policy, Exelon Corporation, before the FERC, Reliability Technical Conference Docket No. AD12-1-000 (etc.), November 11, 2011.
- Construction of peaking units on a fast-track basis by the New York Power Authority: “We increased our generating capacity by about 450 megawatts during summer 2001 when we began operating small, clean natural gas-powered generating plants at six sites in New York City and one on Long Island. We had launched a crash program in late August 2000 to install these PowerNow! plants in response to warnings from officials in the public and private sectors that the New York City metropolitan area could face power shortages in the summer of 2001. Similar warnings were repeated throughout the 10 months it took to obtain, site, design and install the units—a process that normally would require more than two years.” New York Power Authority, “Small Clean Power Plants,” Available: http://www.nypa.gov/facilities/powernow.htm.
- Requests by ISO-NE for demand-response resources in Connecticut on a fast-track basis: “On December 1, 2003, ISO New England Inc. (ISO-NE) issued a Request for Proposals (RFP) soliciting up to 300 MW of temporary supply and demand resources for Southwest Connecticut (SWCT) for the period 2004 to 2008. The purpose for acquiring these resources was to improve the electric system reliability in SWCT through the summer of 2007, when the 345 kV transmission loop is planned for completion.” J.E. Platts, ISO-NE, “Final Report on Evaluation and Selection of Resources in SWCT RFP for Emergency Capability, 2004-2008,” October 4, 2004, page iii.
- New York State’s contingency planning efforts (including consideration of new transmission projects) to prepare for a possible shutdown of the Indian Point nuclear plant, shutdown as early as 2018, depending on the outcome of its re-licensing with NRC. See the New York Department of Public Service Commission Case No. 12-E-0503, “Proceeding on Motion to Review Generation Retirement Contingency Plans.” Available: http://documents.dps.ny.gov/public/MatterManagement/ CaseMaster.aspx?MatterCaseNo=12-e-0503&submit=Search+by+Case+Number
36 Susan F. Tierney, and Paul J. Hibbard, “Siting Power Plants: Recent Experience in California and Best Practices in Other States,” Hewlett Foundation Energy Series, February 2002.
37 For example, FERC/EPA processes under the MATS regulation introduced a Reliability Safety Valve and related procedures to ensure that identified reliability challenges could be addressed, while allowing some flexibility with the eventual MATS timeline. As discussed below, the ISO/RTO council has proposed a similar reliability safety valve for the Clean Power Plan and the EPA has also acknowledged potential reliability concerns in its most recent Notice of Data Availability memorandum.

Electric System Reliability and the EPA’s Clean Power Plan
Analysis Group 21
‘delivered’ reliability also depends on making sure that the system operates in real time with high technical integrity.
System reliability is affected in real time by several things:
• The mix of attributes of the resources on the system – their location, their fuel source, and the operating characteristics of the supply and demand resources;
• The variations in system conditions (e.g., building lights turned on, or a power plant tripping off line unexpectedly, or sudden storm-related outages, or shifts in windiness) that change on a second-to-second, minute-to-minute, hour-to-hour, and day-to-day basis; and
• The system operator’s practices and procedures for managing the changing conditions on the system at all times and in all places under that operator’s responsibility, to assure that the system stays in balance.
System security describes the ability of the system to meet ever changing system conditions, and to do so with enough redundancy in operational capabilities to manage and recover from a variety of potential system events – or “contingencies” – such as sudden and unexpected loss of generation, transmission, or load.38 System planners and operator must ensure that the mix of resources on the system is capable of responding in real time to normal load changes and contingency events. This is needed to avoid the catastrophic wide-area failure of the bulk power system – such as a cascading outage covering one or more regions – that can come from unacceptable variations in system voltage and frequency. Blackouts can damage electrical equipment on the grid and on customers’ premises, and create wide-ranging safety and health impacts.
To assure system security, the system as a whole must have certain attributes allowing it to provide “essential reliability services,” as summarized in Table 9. These include two functional categories:
• Voltage support, meaning the ability of system resources to maintain real power across the transmission grid, through the use of reactive power sources such as generators connected to the system, capacitors, reactors, etc. Voltage on the system must be
38 NERC describes certain features of the bulk power system needed to meet system security requirements – e.g., voltage control, frequency control – as Essential Reliability Services, or ERS. NERC Essential Reliability Services Report.

Electric System Reliability and the EPA’s Clean Power Plan
Analysis Group 22
maintained within an acceptable voltage bandwidth in normal operations and following a contingency on the system.39
• Frequency Management, meaning the ability of the system to maintain a system frequency within a technical tolerance at all times.40 Frequency is a function of the match between generation output and load on the system, and requires constant balancing, or following of load by resources that can increase and decrease output instantaneously.
Importantly, system security, or operational reliability, is not a “yes” or “no” condition. To maintain it, system operators use a combination of strategies, tools, procedures, practices, and resources to keep the entire system in balance even as conditions change on a moment to moment basis.41 The difficulty of this task largely results from several things. First, the
39 Voltage support is local in nature, can change rapidly, and depends in part on the type and location of generators connected to the transmission system. Typically, voltage control is maintained by system planners and operators. Acceptable power factors for voltage support are maintained, in part, through the use of reactive power devices (or power factor control) that inject or absorb reactive power from the bulk power system. Reactive power can be provided by synchronous thermal generators and through capacitors and other devices, as well as by ‘adequately designed’ variable energy resources (including wind and solar) and storage technology. Voltage disturbance performance is the ability to maintain voltage support and voltage control after a disturbance event. NERC Essential Reliability Services Report, pages 1, 10-11.
40 Frequency must typically be maintained within tens of mHz of a 60 Hz target. Higher frequencies indicate greater supply, while lower frequencies typically indicate greater demand. Frequency management includes: (1) Operating reserves, which are used to balance minute to minute differences in load and demand, load following capabilities to respond to intra- and inter-hour changes in load fluctuations, and reserves, which are used to restore system synchronization following generator or transmission outages; (2) Active Power Control, including ramping capability to quickly bring generators online in response to operator needs, often in ten minutes or less; (3) Inertia, or stored rotating energy that is used to arrest declines in frequency following unexpected losses. Historically, inertia has been supplied by large coal-fired generators, although NERC notes that new ‘synthetic’ inertia is available through the operation of variable energy resources supported by energy storage devices; and (4) Frequency Distribution Performance, which similar to voltage distribution performance, is the ability to maintain operations during and after an unplanned disturbance. NERC Essential Reliability Services Report, pages 3-5, 8-9.
41 System operators manage voltage and frequency as load changes over time, and in response to contingency events, through the posturing and management of the resources on the system across several time scales:
- On a second-by-second basis through automatic generation control (AGC) systems on resources that will automatically adjust generation up or down in response to system frequency signals.
- On the time scale of minutes through tens of minutes through accessing “spinning reserves,” including operating resources with the ability to ramp output up or down quickly, and resources that can connect to the system within several minutes.
- On the timescale of tens of minutes through accessing longer-term reserve resources that can turn on and connect to the system in less than an hour (typically on the order of 15 to 30 minutes).
- On the time scale of hours or days by committing sufficient operating and reserve resources to manage expected swings in net system load (that is, system load net of variable resource output). Note that load varies in relatively ‘normal’ ways over the course of the days, weeks, and months, and is predictable with a relatively high degree of accuracy by system operators. This allows for the commitment and availability of enough system resources to meet reliability objectives. However, the proliferation of distribution-level, behind-the-meter (BTM) generation with variable output (e.g., distributed wind and solar PV) complicates the forecasting of “net load” visible to system operators – that is, the normal variation in load net of variable BTM output that comes and goes with the sun and wind.
- On an as-needed basis for voltage control by adjusting reactive power injected into or absorbed from the system by on-line generators, capacitors, reactors, and system var compensators.
Source: NERC Essential Reliability Services Report, generally.

Electric System Reliability and the EPA’s Clean Power Plan
Analysis Group 23
operator has, in effect, a particular set of assets on the system at any time, which reflects the operational attributes of the various resources on the system at that time. These include things like: power plants with different operating profiles (e.g., start-up time, limits on output under different temperature conditions, availability to fuel supply); transmission systems that allow or limit power flows in various directions; ‘smart’ controls and communications devices that allow (or not) visibility into and/or management of power flows; demand response; storage systems; and so forth.
Table 9 System Security Needs and “Essential Reliability Services”
Second, the operator must maintain frequency and voltage on the system at all times. This means, for example, starting up plants as backup resources (“reserves”) to quickly replace another plant that trips off line or dips in its output (e.g., due to changes in wind conditions or power plant failure), or adjusting power output up and down with little notice to meet swings in load.
Third, the operator maintains and draws on a diverse set of operational procedures to manage system performance – such as committing or “posturing” resources that may be needed, allowing minor variations in system voltage, calling on resources from neighboring regions,

Electric System Reliability and the EPA’s Clean Power Plan
Analysis Group 24
disconnecting variable generation, signaling to ‘demand-response’ providers to curtail their loads within short periods of time, and other procedures (including, as a last resort, isolated involuntary disconnection of load – or “rolling blackouts”).
Reliability is by nature a technology-neutral concept. That said, not all of a system’s resources are equal when it comes to the attributes they provide to system operators to manage system security. Historically, power systems’ needs for voltage support, inertia, frequency control, and contingency-response capability have been met through operator actions in conjunction with their commitment of the types of technologies on the system: traditional thermal steam units (e.g., coal, nuclear, oil plants, natural gas and combined heat and power units) providing baseload service around the clock; cycling and load-following technologies (e.g., combined cycle plants operating on natural gas); quick-start fossil-fired peaking plants; and dispatchable hydro power supplies.
As the technologies on the system change – which is happening to different extents in different regions as a result of various forces, with or without the Clean Power Plan (as described above in Section I) – steps are being taken to ensure that the suite of essential reliability services is available to supply the frequency/voltage control and contingency-reserve needs of the system. NERC has characterized the challenge as one of filling gaps in services as they arise or widen over time.
Notably, system planners across the country are dealing constantly – and so far successfully – with the new and emerging reliability challenges from changing technology mixes. For example, the CAISO and California electric utilities have identified the need to add greater ramping capability to handle an increased variability in intra-day loads introduced from increasing amounts of ‘variable energy resources’ (VERs) necessary to meet increasingly higher renewable portfolio standards.42 In general, load following is typically accomplished through the dispatch of fast-ramping combustion turbines and natural gas combined cycle (NGCC), although load following can also be met through well-designed and cost-effective storage, optimized energy efficiency programs, demand response, and devices (such as smart inverters) being added to wind farms.
42 California is on track to meet its renewables portfolio standard target, such that by 2020, 33 percent of its total energy comes from renewable resources. The state is considering whether to adopt a 50-percent goal by 2030. Behind-the-meter solar and wind supplies are projected to significantly decrease net load during the middle of the day, while leaving significant shoulder peaks in the morning and evening, resulting in what is commonly called the “duck curve.” A recent analysis found that this will require a significant increase in fast ramping, flexible dispatchable generation resources (along with other technologies, including storage). See Energy+Environmental Economics (E3), “Investigating a Higher Renewables Portfolio Standard in California,” January 2014.

Electric System Reliability and the EPA’s Clean Power Plan
Analysis Group 25
III. What Concerns are Commenters Raising About Reliability Issues Associated with EPA’s Clean Power Plan?
Summary of comments
To date, the EPA has received more than 3 million comments on the proposed Clean Power Plan. Many comments have raised concerns about electric system reliability. These comments have come from a wide range of stakeholders, including: owners of affected power plants (including vertically integrated utilities, merchant generators, municipal electric utilities, cooperatives); state officials, including public utility commissions, air pollution regulators, energy offices, as well as governors, attorneys general, and consumer advocate offices, and associations representing these various groups of public officials; system operators, regional reliability organizations; trade associations with business, public health, environmental, fossil-fuel supply and delivery organizations; members of the public; and others.43
The many comments received on reliability issues reflect the importance of thinking clearly about the potential impacts of the Clean Power Plan on system reliability. We summarize the types of reliability-related comments in Table 10, below, and provide more information about these public comments in the Appendix. Notably, EPA has made it clear that system reliability needs to be maintained as the Clean Power Plan is finalized and implemented.44
43 Among the latter include various electric industry organizations (e.g., the Edison Electric Institute; the APPA; the National Rule Electric Cooperative Association; the Electric Power Supply Organization; the Clean Energy Group); business associations (e.g., the Chamber of Commerce); gas industry organizations (e.g., the Interstate Natural Gas Association (INGAA)); coal-industry groups (e.g., the Coal Utilization Research Council); non-energy trade groups (e.g., Water Associations such as the American Water Works Association, National Association of Water Companies and the National Association of Clean Water Agencies), and environmental organizations (e.g. Natural Resources Defense Council and Environmental Defense Fund); NERC; various individual RTOs (MISO, PJM, NYISO); FERC Commissioner Philip Moeller; Senator Dan Coats and 22 other senators. This is not intended to be a comprehensive or exhaustive list of comments or commenters, but rather represent the broad cross-section of types of organizations with an interest in Clean Power Plan reliability issues. Regulations.gov Docket Folder Summary, Docket No. EPA-HQ-OAR-2013-0602, “Standards of Performance for Greenhouse Gas Emissions from Existing Sources: Electric Utility Generating Units,” available at http://www.regulations.gov/#!docketDetail;rpp=100;so=DESC;sb=docId;po=0;D=EPA-HQ-OAR-2013-0602.
44 For example, see both the Proposed Rule, Carbon Pollution Emission Guidelines for Existing Stationary Sources: Electric Utility Generating Units, Federal Register, Vol. 79, No. 117, June 18, 2014. Available at: http://www.gpo.gov/fdsys/pkg/FR-2014-06-18/pdf/2014-13726.pdf, and the Technical Support Document: Resource Adequacy and Reliability Analysis. Available at: http://www2.epa.gov/carbon-pollution-standards/clean-power-plan-proposed-rule-resource-adequacy-and-reliability-analysis

Electric System Reliability and the EPA’s Clean Power Plan
Analysis Group 26
Table 10 Summary of Reliability Concerns Raised in Public Comments and Which Need to be
Addressed as the EPA’s Proposed Clean Power Plan is Implemented
Many observers’ concerns that the Clean Power Plan could jeopardize resource adequacy are tied primarily to questions around timing: Does the sequence of steps implied by EPA’s proposal – starting with the June 2014 proposal, then taking into account the timing of EPA’s final rule, the development of State Plans, the approval of plans by the EPA, and then through compliance

Electric System Reliability and the EPA’s Clean Power Plan
Analysis Group 27
decisions and actions by owners of affected power plants – allow sufficient time for everything that needs to be done by states, reliability planners, grid operators, planning and procurement processes, market responses, and so forth to ensure resource adequacy? Or, where that is not assured, do the final EPA and state compliance provisions and administrative procedures allow sufficient flexibility to ensure proper administration of Clean Power Plan without jeopardizing resource adequacy?
Concerns voiced about whether Clean Power Plan implementation could jeopardize system security are tied primarily to anxiety over how and when state compliance activity will alter the diversity of resources on the system, and thus the mix of resource capabilities needed to meet system security requirements. In particular, will the economic signals and compliance obligations provided through state implementation of the Clean Power Plan cause the retirement of resources that are needed for system security, and/or will replacement capacity provide the needed operational capabilities? If a significant portion of existing coal-fired capacity retires and is replaced (in part) by gas-fired capacity, will regional interstate pipeline systems be robust enough to ensure reliable delivery of fuel in all hours of the year? If state compliance activities significantly increase the proliferation of grid- and distribution-level variable resources, how much more difficult will it be for system operators to manage the variability in net load on a real-time basis? Or, where this is not assured, do the final EPA and state compliance provisions and administrative procedures allow sufficient flexibility to ensure proper administration of Clean Power Plan without jeopardizing system security concerns?
Other commenters portray the readiness of the industry to step up with solutions to these reliability issues. For example, INGAA described the capability of the natural gas pipeline industry to add new infrastructure.45 Calpine stated its readiness (along with other market participants) to add new gas-fired generation (and to offer under-utilized capacity already existing on the system).46 The Clean Energy Group provided suggestions about how the design of policies supporting flexibility and market-based approaches can substantially mitigate reliability concerns.47 State energy offices (through their national association (NASEO)) noted the ability of a wide variety of well-tested energy efficiency measures (beyond utility-provided programs) to avoid CO2 emissions from power plant operations.48 The National Association of Regulatory Commissioners (NARUC) pointed to the ability to reap cost-effective savings in the
45 Comments of INGAA, filed December 1, 2014.
46 Comments of Calpine Corporation, filed November 26, 2014.
47 Comments of the Clean Energy Group (CEG), filed December 1, 2014.
48 Comments of the National Association of State Energy Officials (NASEO), filed December 1, 2014.

Electric System Reliability and the EPA’s Clean Power Plan
Analysis Group 28
electricity used for water treatment and delivery by introducing measures on the water utility system – thus affording water savings and avoiding CO2 emissions on the power system.49
We also point out many ways to address the reliability issues raised in comments in Section IV of our report, with our suggestions organized around the different entities with some direct or indirect role to play in system reliability.
Reliability safety value concept
The ISO/RTO Council (IRC) has proposed that EPA include a “Reliability Safety Valve” provision as part of the final rule, to help with resolve multi-state issues that may arise due to the Proposed Rule and impact grid reliability.50 In the view of the IRC, a Reliability Safety Value would provide a regulated and reviewed backstop solution with a defined process for modifying State Plans to ensure reliability against unforeseen issues. As part of this process, the IRC has recommended that the EPA include a specific requirement in the final rule that State Plans must include a detailed reliability assessment. By requiring reliability assessments ahead of final plans, according to the IRC, the Reliability Safety Valve would only be used in situations that could not be addressed ahead of time and that arise solely from dynamic, unplanned changes in the grid. As proposed by the IRC, a Reliability Safety Value would allow relief from compliance schedules if specific units are deemed necessary for reliability considerations.51 The Reliability Safety Value has been supported by numerous organizations and RTOs, who point out that the concept has been successfully implemented as part of the MATS compliance policy.
We note – as an important element in considering the particular Reliability Safety Valve proposed by the IRC – that there are key differences between the regulatory frameworks of Clean Power Plan and the MATS rule. In particular, the latter assigns emissions-reductions targets on each affected fossil-fuel generating unit, and does not allow any emission averaging across generating stations or across time. As we noted previously in this report, there is much more flexibility in the design of the Clean Power Plan.52 In particular, the opportunity for states
49 Comments of the National Association of Regulatory Utility Commissioners (NARUC), filed November 19, 2014.
50 For example, see comments filed by the ISO/RTO Council (IRC), December 1, 2014.
51 This process is analogous to RMR contracts that are often available in organized ISO/RTO markets. These contracts provide for time-limited, out-of-market payments to generators that have provided notification of retirement but are necessary for reliability reasons (e.g., local voltage support). Once alternative resources (transmission or generation) solving the reliability need are in place, the RMR contracts cease and the units may retire. By way of example, the IRC suggests that the Reliability Safety Value and a mandatory reliability assessment could help identify reliability issues arising from an individual State Plan, such as a state requirement for reduced utilization at a fossil unit needed for transmission security and voltage support on a transmission network that crosses a state line. ISO/RTC Comments, filed December 1, 2014.
52 EPA is relying on a portion of the Clean Air Act– Section 111(d) – in its Clean Power Plan. “Section 111(d)’s regulatory framework creates an entirely different and potentially much wider set of compliance and implementation options compared to
Electric System Reliability and the EPA’s Clean Power Plan
Analysis Group 29
to rely upon market-based mechanisms that allow emission trading across power plants within states and across wide regions is a compelling basis for thinking differently about the need for a reliability safety value in this instance. The wider the region in which emission trading might occur, the less likely that reliability issues will be introduced by the Clean Power Plan.
NERC’s initial reliability assessment of the Clean Power Plan
NERC published its own “Initial Reliability Review” of the Proposed Rule in November 2014.53 NERC flagged a number of “significant reliability challenge[s], given the constrained time period for implementation” and that “Essential Reliability Services may be strained by the proposed [Clean Power Plan].”54 NERC notes that the primary purpose of the paper was to “provide the foundation for the range of reliability analyses” that will be required for stakeholders to work together. Notably, NERC recommended that coordinated regional and multi-regional planning and analysis should start immediately to identify specific areas of concern and that the EPA should consider a more timely approach to resolving any known reliability concerns.
NERC noted that the accelerated retirement of fossil units will stress already declining reserve margins, and that time will be a major constraint, particularly for facility planning, permitting, and construction. NERC identifies transmission upgrades as potentially being needed to successfully integrate variable energy resources anticipated as part of various states’ plans, as well as to support reliability concerns regarding voltage and frequency support associated with extensive re-dispatch of NGCC. NERC also suggested that pipeline capacity constraints will
other recent federal regulatory initiatives applicable to the electric industry.… In the recent MATS rule, for example, EPA set uniform national standards to reduce emissions from different categories of existing coal- and oil-fired power plants. No trading or averaging is allowed across different generating stations. There is no possibility of purchasing credits resulting from over-compliance at other sources, or to credit emissions reductions resulting from end-use efficiency or zero-carbon energy sources. By contrast with MATS, Section 111(d) inherently allows greater opportunities for different pathways to compliance… And in its [State Plan], each state will have flexibility to propose its own preferred actions to accomplish the targeted reductions, as long as the plan provides reductions across the facilities in the state that are at least as effective as EPA’s approach. This language “supports the use of market-based mechanisms” and other alternatives in ways that are not possible under the statutory language governing MATs, which required each affected generating station to have emissions at or below the allowed emissions rates. If a state has concerns about the reliability implications of compliance with EPA guidance, the state can take that fact into account as it designs its SIP and its schedule/timetable for individual units’ compliance so long as the overall emission reduction required by the guideline has a firm deadline and is achieved. For example, a state could propose plan elements that enable early action/compliance at some Section 111(d) generating units in exchange for allowing more time for others, or that allow for deeper reductions at one unit in exchange for lighter reductions at another.” Source: Susan F. Tierney, “Greenhouse Gas Emission Reductions From Existing Power Plants Under Section 111(d) of the Clean Air Act: Options to Ensure Electric System Reliability,” May 2014, pages 3-4.
53 NERC has stated that its November report, “Potential Reliability Impacts of EPA’s Proposed Clean Power Plan: Initial Reliability Review,” November 2014 (Hereinafter referred to as “NERC CPP IRR”) is the first in a series of reliability assessments that NERC plans to conduct. NERC says it plans to release two additional studies in 2015 that will include a detailed evaluation of generation and transmission adequacy and a preliminary assessment of state SIPs.
54 NERC CPP IRR, page 2.

Electric System Reliability and the EPA’s Clean Power Plan
Analysis Group 30
exacerbate the strain on essential reliability services from relying more heavily on gas. While a full review of the NERC study is beyond the scope of this paper, we note again that these issues have been emerging in markets for a number of years, well before the introduction of the Clean Power Plan. Indeed, NERC covered these “emerging trends” in California, Hawaii, ERCOT, and other regions in its October primer on “Essential Reliability Services.”
Many comments in turn, have cited and expanded on the NERC Review. While reliability has been a common theme of these comments, for the most part the NERC report and the public’s comments on the Clean Power Plan do not point to specific, modeled reliability problems that have been identified at known points on the bulk power system. Rather, both the report and the comments focus on generalized concerns about potential reliability issues that may arise due to the operational challenge of meeting both the interim and final-goal targets, generally assuming little in the way of the compliance flexibility built into the proposed rule and available to states. While these are valid concerns, it is critical to recognize the numerous strategies, policies, markets and organizations in place that have successfully dealt with these similar operational challenges in the past, and will going forward, as we discuss further below.
Moreover, the Clean Power Plan proposed rule, like all proposed EPA rules, is a “first draft” that is designed to elicit data and comments. EPA has already signaled that it is evaluating stakeholder concerns about the timing and glide path for meeting interim and final targets, and will evaluate this information as it writes the final rule.
Although we think it is ultimately a good thing that the industry is paying close attention to reliability issues – so that any potential problems can be avoided and addressed in time through planning and infrastructure – we do note recent critiques (e.g., Brattle Group’s February 2015 report) of the assumptions used in NERC’s recent reliability assessments, which do not take into consideration industry responses to market and reliability signals. This is a significant reason to view the NERC as only having set the table with respect to potential reliability concerns, and to recognize that NERC and many other parties will step up with their important contributions to implementation of the CPP within the electric system reliability context.

Electric System Reliability and the EPA’s Clean Power Plan
Analysis Group 31
http://imgkid.com/checklist-icon.shtml
IV. Options for Assuring Electric System Reliability in Conjunction with Implementing the Clean Power Plan
The reliability check list
The many comments on the proposed Clean Power Plan submitted to EPA serve as a reminder of the broadly-understood condition that pursuing CO2 emission reductions in the power sector has to occur in an environment that respects the reliability rules of the game. Like the check list at the start of any endeavor, the comments point out a number of potential items to consider adding to the “to do” list that the electric industry routinely uses to ready itself for reliable system operations.
Fortunately, that check list is already robust. There are well-established procedures, regulations and enforceable standards in place to ensure reliable operations, placing the country in a good starting position as of the start of 2015. Many of the reliability issues identified in public comments are not new – the industry has responded successfully and effectively to similar challenges in the past. And for several years, some of the trends that commenters note must now be addressed in response to the Clean Power Plan are actually developments that have been underway for many years – and that are currently being addressed. Examples include the FERC’s policies addressing: transmission planning taking into account infrastructure needs arising from state-policy (such as renewable portfolio standards); integration of variable electric resources; market designs to assure efficient entry of capacity with attributes needed for reliable system operations; and directives to modify standards and policies so as to better harmonize operations of the electric and gas markets. Other examples include the many studies conducted by RTOs, electric utilities, national laboratories (like the National Renewable Energy Laboratory and Lawrence Berkeley National Laboratory), research institutions (such as the Electric Power Research Institute, university research centers, and think tanks) , and the Department of Energy.
These many studies are already pointing out that some of the tools and checklists needed for reliability may need to be enhanced as a result of the many changes underway in the industry. In many respects, the shift towards natural gas-fired generation (driven in large part by fundamental economic forces), the proliferation of variable resources due to economic and policy factors, and the growth in distributed resources in some regions will drive changes in industry planning and operations over a schedule largely coincident with implementation of the Clean Power Plan.

Electric System Reliability and the EPA’s Clean Power Plan
Analysis Group 32
In the end, we think that even if sometimes exaggerated, the reliability “alerts” are actually a good thing: It is appropriate that people are paying attention to reliability issues, so that potential problems can be avoided – and they can be addressed in time through proper planning and appropriate responses. Even if some of the existing tools need to be sharpened or even new ones added, past experience, the capabilities of the industry, the attention of regulators, and the inherent flexibility of Clean Power Plan implementation strongly suggest that the task is manageable. As always, careful planning and advance work is necessary to make sure that there are not inefficient trade-offs between the two core objectives.
The Reliability Toolkit: Which ones to use here?
The U.S. electric system performs so reliably because it includes both clearly defined and clearly assigned roles and responsibilities to particular actors, and also relies upon markets and regulated planning processes to provide an array of workable solutions. This is a very sturdy toolkit to build upon. Our suggestions aim to make it even better by pointing out some extra steps that responsible parties might take to make the toolkit as strong as possible for supporting the changes underway in the industry, including Clean Power Plan implementation.
For this reason, we organize our discussion of tools by identifying those in the hands of “reliability organizations” (like grid operators, FERC, NERC, the states, and others) and those in others’ hands (including power plant owners, the markets, and many additional players, including the EPA itself). While the latter may not be “reliability organizations” in the same ways that the institutions in the first group are, they still have significant opportunities (if not genuine responsibility) to take actions to help ensure reliable pathways to compliance with CO2
emission reductions required from the power sector.
In Table 1 at the beginning of our report, we categorize parties into the following groupings:
- Entities with direct responsibility for critical reliability functions; - Other public agencies with direct or indirect roles in the Clean Power Plan; - Owners of existing power plants covered by Section 111(d) of the CAA; - “Markets” and resource planning/procurement organizations; and - Other entities with inevitable roles to play in ensuring a reliable system in conjunction
with enabling effective and timely compliance with the Clean Power Plan.
Note that in some cases, some parties (e.g., a vertically integrated utility which is a balancing authority and also conducts resource/planning and procurements) may fall into one or more categories.

Electric System Reliability and the EPA’s Clean Power Plan
Analysis Group 33
Then we use those groupings not only to identify the normal, business-as-usual responsibilities of those parties, but also to make a number of suggestions for things that those different players might do in anticipation of heading off potential reliability problems before they arise, or in mitigating impacts if they do. Table 2 makes suggestions for what FERC, NERC, the Regional Reliability Organizations, with Table 3 providing suggestions for System Operators/Balancing Authorities might do, in terms of institutionalizing new studies, reporting requirements, and so forth. Table 4 then focuses on things that other federal agencies can do, with Table 5 suggesting actions by state government entities. Table 6 identifies potential actions that might be considered/adopted as part of organized markets to send appropriate and timely signals for investment, and in parallel, what electric utilities might do within their own resource planning/procurement processes to accomplish reliable outcomes in their geographic footprint. Finally, Table 7 provides a number of suggestions about things that other players might do in their own zones of influence.
In the end, the industry, its reliability regulators and the States have a wide variety of existing and modified tools at their disposal to help as they develop, formalize, and implement their respective State Plans. These two responsibilities – assuring electric system reliability while taking the actions required under law to reduce CO2 emissions from existing power plants – are compatible, and need not be in tension with each other as long as parties act in timely ways.
This is not to suggest that electricity costs to consumers do not also matter in this context; of course they do. But we observe that too often, commenters make assertions about reliability challenges that really end up being about cost impacts. We think that separating reliability considerations from cost consideration is important so as to avoid distracting attention from the actions necessary (and possible) in order to keep the lights on. There may be “lower cost” options that reduce emissions some part of the way toward the target reductions, but that fail to meet acceptable reliability standards. We do not view such ‘solutions’ as the lowest cost solution, precisely because they fail to account for the cost of unacceptable system outages to electricity consumers. Any plan that starts with consumer costs and works backward to reliability and then to emission reduction is one that fails to consider the wide availability of current tools that have served grid operators for more than a decade to meet reliability needs.
This array of tools is of course subject to important and beneficial social constraints and must be exercised to serve the interests of ratepayers. There is no reason to think that these dual objectives cannot be harmonized within a plan to reduce carbon pollution.

Electric System Reliability and the EPA’s Clean Power Plan
Analysis Group 34
V. Conclusion In this report we identify the many rules, regulations, institutions, and organizations – in effect, the industry’s standard operating procedures – for ensuring that EPA’s design and administration of the Clean Power Plan in no way jeopardizes or compromises the high level of power system reliability we are used to. Such reliability is essential for the strength of our economy and the public health and safety of our citizens.
In the end, of course, it is a good thing that the industry is paying close attention to reliability issues, so that any potential problems can be avoided – and can be addressed in time through planning and appropriate responses. This is do-able, based on past experience and the capabilities of the industry. As always, careful planning and advance work is necessary to make sure that there are not trade-offs between the two.
Having reviewed the broad range of comments received by EPA with a focus on power system reliability, and the potential reliability challenges posed by Clean Power Plan administration, we find that many of these comments tend to assume inflexible implementation and present worst case scenarios, with an exaggerated cause-and-effect relationship. Moreover, many comments (including those from NERC itself) tend to assume that policy makers, regulators, and market participants will stand on the sidelines until it is too late to act. The history of the electric system and its ability to respond to previous challenges including industry deregulation and previous Clean Air Act regulations such as the NOx SIP call, SO2 rule, CSAPR, and MATS prove that this is highly unlikely. These challenges will be solved by the dynamic interplay of regulators and market forces with many solutions proceeding in parallel.
Indeed, this dynamic interplay is one reason why a recent survey of more than 400 utility executives nationwide found that more than 60 percent felt optimistic about the Clean Power Plan and felt that EPA should either hold to its current emissions reduction targets or make them more aggressive.55 Similarly, other market participants announced a willingness and ability to help meet system demand for new natural gas supplies56 and gas-fired generation, in
55 The same survey found that those utility executives believed that distributed energy resources offered the biggest growth opportunity over the next five years, and more than 70 percent expect to see a shift away from coal towards natural gas, wind, utility-scale solar and distributed energy. Utility Dive and Siemens, 2015 State of the Electric Utility Survey Results, January 27, 2015. The survey included 433 U.S. electric utility executives from investor-owned, municipal, and electric cooperatives.
56 See, for example, comments filed by INGAA, December 1, 2014. (“INGAA is confident that … the natural gas pipeline industry can respond to demand for the natural gas pipeline capacity that may be necessary to enable compliance with the Clean Power Plan.”). INGAA noted that the existing natural gas pipeline system is already supporting national gas-fired combined-cycle utilization rates of 60 percent during peak periods, which are the same periods when distribution constraints are most likely.

Electric System Reliability and the EPA’s Clean Power Plan
Analysis Group 35
support of the Clean Power Plan.57 This is in addition to the expanded and innovative solutions and strategies for incremental energy efficiency and distributed energy resources identified by State Regulators and Energy Officials.
There are a number of things states and others can (and, in our view, should) do as part of developing their State Plans to further ensure reliability. First and foremost, states can lean on the comprehensive planning and operational procedures that the industry has relied on to maintain reliability for decades – in the face of both normal operations and sudden changes in markets and policy. These procedures flow from a comprehensive set of laws, rules, protocols, organizations, and industry structures that focus continuously on what is needed to maintain electric reliability.
Second, states should give due consideration to the vast array of tools available to them and the flexibility afforded by the Clean Power Plan in order to ensure compliance is obtained in the most reliable and efficient manner possible. In particular, given the interstate nature of the electric system, we encourage states to enter into agreements with other states or add provisions to state plans that facilitate emission trading between affected power plants in different states; doing so will increase flexibility of the system, mitigate electric system reliability concerns, and lower the overall cost of compliance for all.
57 See, for example, the comments of Calpine Corporation, filed November 26, 2014. (“With our modern, flexible, and efficient generating fleet, Calpine is prepared to facilitate the successful implementation of the Proposed Clean Power Plan. We are confident that by working constructively with the states and EPA as we have always done, the Clean Power Plan can be a success.”)

Electric System Reliability and EPA’s Clean Power Plan
Analysis Group Appendix - 1
APPENDIX: Public Comments on EPA’s Proposed Clean Power Plan:
Summary of Concerns Relating to Electric System Reliability Issues
As of February 8, 2015, 3.83 million comments have been filed on the EPA’s proposed Clean Power Plan.58 Many organizations have compiled lists and summaries of comments filed by various parties.59 Most of the comments focus on stringency of the proposed emissions reductions targets, the reasonableness of (and legal bases for) the “building block” methodology used by EPA is setting state targets, the timing of emissions reductions in two periods (interim: 2020-2029); and final (2030 and beyond); the ability of states to develop their State Plans with enough time; and other comments.60,61
58 Regulations.gov Docket Folder Summary, Docket No. EPA-HQ-OAR-2013-0602, “Standards of Performance for Greenhouse Gas Emissions from Existing Sources: Electric Utility Generating Units,” available at http://www.regulations.gov/#!docketDetail;rpp=100;so=DESC;sb=docId;po=0;D=EPA-HQ-OAR-2013-0602.
59 See, for example: Bipartisan Policy Center (http://bipartisanpolicy.org/wp-content/uploads/2015/02/Comments_Map_Static.pdf); National Association of State Energy Offices ( http://111d.naseo.org/); Advanced Energy Economy (http://blog.aee.net/epa-ghg-regs-we-read-the-comments-so-you-dont-have-to-part-1-state-federal-regulator-association); Institute for 21st Century Energy (U.S. Chamber of Commerce); (http://www.energyxxi.org/eparule-stateanalysis; http://www.energyxxi.org/eparule-stateanalysis).
60 See, for example, comments filed by APPA, December 1, 2014; Business Roundtable, December 1, 2014; Class of ‘85 Regulatory Response Group, December 1, 2014; CEG, December 1, 2014; CURC, December 1, 2014; Coalition for Innovative Climate Solutions, December 1, 2014; Edison Electric Institute (EEI), December 1, 2014; Electric Power Supply Institute, December 1, 2014; ERCOT, November 17, 2014; Environmental Defense Fund, December 1, 2014; Georgetown Climate Center (with state officials from California, Connecticut, Delaware, Illinois, Maine, Maryland, Massachusetts, Minnesota, New Hampshire, New York, Oregon, Rhode Island, Vermont, and Washington), December 1, 2014; INGAA, December 1, 2014; NARUC, November 19, 2014; NASEO, December 1, 2014; NRDC, December 1, 2014; National Rural Electric Cooperative Association, July 29, 2014; Nuclear Energy Institute (NEI), December 1, 2014; NYISO, November 17, 2014; PJM Interconnection, December 1, 2014; RTO/ISO Council, December 1, 2014; Sierra Club, December 1, 2014; Southern States Energy Council, September 29, 2014; and Western Electricity Coordinating Council (WECC), November 25, 2014.
61 Even before the final December 1st, 2014 deadline for filing comments, the EPA and other regulators had acknowledged these many public statements and the comments that had been submitted in advance of the deadline. Specifically, in October of 2014, EPA issued a Notice of Data Availability (NODA) that sought comments on three core issues, which we summarize below:
- Compliance trajectory of emissions reductions from 2020 to 2029, and in particular, if or how reductions related to building block 2 could be phased in over time (for example, to accommodate constraints in natural gas distribution infrastructure, or how the book life of existing assets could be used to define an alternative glide path) or how states could earn compliance credits for actions taken between 2012 and 2020;
- Technical assumptions in the building block methodologies for 2 and 3, including how to consider new gas-fired combined cycle (NGCC) units in state goals, the role of natural gas co-firing at coal plants as a compliance strategy, and if states with little to no existing NGCC capacity should achieve a minimum target of new NGCC generation; and with respect to renewable energy, how or if the EPA could consider alternative goal setting strategies that account for state or regional economic potential of renewables as opposed to relying on existing RPS; and the role of nuclear units in building block 3; and
- Methodologies for setting State-specific goals, including the feasibility of using a multi-year baseline (2010-2012) for goal setting, to what extent renewable and energy efficiency goals should be assumed to displace existing fossil generation – as opposed to displacing or avoiding future fossil generation.
The formal NODA is available through Regulations.Gov in Docket No. EPA-HQ-OAR-2013-0602 and informally, through the EPA, here: http://www2.epa.gov/carbon-pollution-standards/clean-power-plan-proposed-rule-notice-data-availability.

Electric System Reliability and EPA’s Clean Power Plan
Analysis Group Appendix - 2
Our own review of submissions from the public and various organizations has focused on issues related to system reliability. These commentaries include concerns raised about one or another aspect of the proposal’s impact on the power system’s performance. Many comments make suggestions for changes in EPA’s proposal, and steps that other entities might take to address reliability issues in the context of compliance with the Clean Power Plan.
A common reliability-related comment is that the EPA did not consider – or seek out the expertise – for how the assumptions it used in setting states’ emission reduction targets (i.e., the four “building blocks”) may change the operations of the electric grid and how those changes in turn can affect the ability to meet state targets.62 A similar theme is that the individual state targets do not account for the regional nature of electric grid reliability. Finally, a common concern is that the proposed timeframes for compliance, combined with the interim targets for emissions reductions commencing in 2020, do not provide adequate time for states to develop regional compliance plans or for RTOs to incorporate State Plan provisions into the regional long-term planning frameworks or existing market rules for economic dispatch.
That said, a wide range of regulators and other organizations have committed to working with the EPA and the states to manage these challenges, and in turn, leverage their detailed knowledge of the electric system. As discussed later in this report, many regional coordinators and state regulators already have planning policies and procedures in place that can proceed in parallel with the development of SIPs to ensure the timely development of generation, transmission, and distribution infrastructure needs.63
Although the comments do not point to specific known, localized reliability problems identified by a specific commenter, many observers caution that if a state elects not to (or cannot, for one reason or another) accomplish the depth of emission reductions assumed by EPA in state
62 For example, the EEI noted that “a significant portion of [it’s] comments is devoted to explaining how the system operates and how electric utilities, states and system operators engage in complex planning to maintain the reliability of the interconnected power system.” Comments filed December 1, 2014, at 12. Similarly, on December 22, 2014, Senator Murkowski (ranking member, Committee on Energy & Natural Resources), Representative Upton (Chairman, Committee on Energy & Commerce), and Representative Whitfield (Chairman, Subcommittee on Energy & Power) requested comment from the FERC Commissioners on their level of involvement and interaction with EPA staff when developing the Clean Power Plan and understanding reliability implications. Letter to FERC from Senator Murkowski, Representative Upton, and Representative Whitfield, December 22, 2014.
63 Note for example, recent activities among the PJM states: the recent comments submitted to the FERC (Docket No. AD15-4-000: Technical Conference on Environmental Regulations and Electric Reliability, Wholesale Electricity Markets, and Energy Infrastructure, February 19, 2015) by Michael Kormos, Executive Vice President for Operations, PJM: “PJM has begun this coordination process by engaging state commissions, state environmental regulators responsible for implementing the Clean Power Plan, and EPA starting last year. Recently, PJM has undertaken detailed analyses of scenarios and alternatives that were provided to us by OPSI. Those results have been reviewed with our members and with the states and are posted on our website at http://www.pjm.com/~/media/committeesgroups/committees/mc/20150120-webinar/20150120-item-05-carbon-rule-analysis.ashx.

Electric System Reliability and EPA’s Clean Power Plan
Analysis Group Appendix - 3
targets, then the state will inevitably need to make additional cuts from other blocks which will increase the stress on remaining assets and strategies.
Comments on reliability issues thus tend to focus on challenges in system operation that may lead to reliability failures. The commentaries do, however, provide suggestions for how to mitigate the challenges for system reliability failures by building into State Plans alternative strategies for meeting those same targets beyond those incorporated into EPA’s target-setting assumptions. For example, comments by both NARUC and NASEO discuss the extensive potential for additional CO2 savings from energy efficiency projects at the interface of the energy-water nexus and other energy-efficiency initiatives outside of conventional programs administered by electric utilities. Additional guidance or clarification from the EPA on how to account for these programs in State Plans could unleash and incentivize a broad swath of carbon reduction strategies beyond the narrow four building blocks.
Many comments focused on the implications of greater utilization of natural gas-fired power plants on changes in system dispatch and the interdependence of interim and final state goals.64 Achieving a system-wide 70-percent capacity factor for existing natural-gas combined cycle (NGCC) units, for example, would transition a set of power plants now used largely as intermediate and load-following resources to become base-load capacity resources. Baseload coal-fired generators in place at the end of the 2010s would feel the effects, through either greater cycling of these units, or retention of the units to operate only occasionally if needed to remain on the system for resource adequacy purposes, or retirements. Observers note that cycling such coal-fired units more frequently will decrease their efficiency (i.e., increase their heat rates), as plants use additional energy to overcome the inertia inherent in these units. Commenters’ cautions that such impacts will increase the overall fleet average emission profile. The observation is that such interactions will mean that states will need to find additional carbon reductions elsewhere. To the extent that the shift includes greater reliance on renewable energy penetration, then the system operators will need to adjust how they operate the resources on their system to maintain reliability. These variable energy resources do not offer system operators the same level of control (e.g., some may be behind the meter and therefore not even “visible” to operator) for frequency or voltage support nor can they be relied upon to meet load in all hours of the day. In the absence of significant new storage capability on the system, this will increase the need for load-following, fast-ramping resources to respond to
64 The U.S. Chamber of Commerce Institute for 21st Century Energy reviewed and summarized State comments and found that 35 states raised issue with Building Block 2. This was more than any other category identified by the report. Institute for 21st Century Energy, U.S. Chamber of Commerce. “In Their Own Words: A Guide to States’ Concerns Regarding the Environmental Protection Agency’s Proposed Greenhouse Gas Regulations for Existing Power Plants”, January 22, 2015, page 14.

Electric System Reliability and EPA’s Clean Power Plan
Analysis Group Appendix - 4
sudden drops in renewable generation. Traditionally, gas-fired combined cycles or natural gas combustion turbines have met this need. But gas-fired plants that begin to operate more in baseload mode may not be able to perform that load-following function. As described in Section II, Figure 2 above, lead times for implementing peaking generating units and demand-side actions (e.g., programs leading to installation of energy efficiency measures; equipping buildings with automated capability to control demand when signaled to do so by the system operator; adding solar PV panels) are much shorter than those for large power plants and transmission upgrades.
These changes are already underway in part due to the shale gas revolution, state and federal policies supporting renewable energy, other environmental policies. According to some observers, the Clean Power Plan will accelerate such trends. Either way, grid operators will need to address the potential diminishing reservoir of voltage support and inertia that has historically been supplied by coal-fired thermal units with their rotating mass of equipment.
Also, the successful operation of natural gas combustion turbines to balance and integrate intermittent and variable renewable supplies will depend, in turn, on the availability and access to fuel when needed for dispatch. Commenters have suggested, and rightly so, that a significant increase in gas-fired generation will require new gas delivery infrastructure. (We note the recent report published by the U.S. DOE that found, among other things, that the amount of incremental gas infrastructure needed is less than what has been put in place by the industry in the recent past.65
Diverse sources of natural gas supply and demand will reduce the need for additional interstate natural gas pipeline infrastructure. The combination of a geographic shift in regional natural gas production—largely due to the expanded production of natural gas from shale formations—and growth in natural gas demand is projected to require expanded natural gas pipeline capacity. However, the rate of pipeline capacity expansion in the scenarios considered by this analysis is lower than the historical rate of natural gas pipeline capacity expansion. … (2) Higher utilization of existing interstate natural gas pipeline infrastructure will reduce the need for new pipelines. The U.S. pipeline system is not fully utilized because flow patterns have evolved with changes in supply and demand. … (3) Incremental interstate natural gas pipeline infrastructure needs in a future with an illustrative national carbon policy are projected to be modest relative to the Reference Case. While a future carbon policy may significantly increase natural gas demand from
65 U.S. DOE, “Natural Gas Infrastructure Implications of Increased Demand from the Electric Power Sector, February 2015, http://energy.gov/sites/prod/files/2015/02/f19/DOE%20Report%20Natural%20Gas%20Infrastructure%20V_02-02.pdf. After modeling interactions between the gas and electric industries, the report’s key findings (at iv-v).
Electric System Reliability and EPA’s Clean Power Plan
Analysis Group Appendix - 5
the electric power sector, the projected incremental increase in natural gas pipeline capacity additions is modest relative to the Reference Case. (4) While there are constraints to siting new interstate natural gas pipeline infrastructure, the projected pipeline capacity additions in this study are lower than past additions that have accommodated such constraints.”
It will take time – in some cases several years – to build this infrastructure, and unlike transmission planning that is coordinated by a central planning authority, expansion of the gas delivery and storage system is driven by market economics. But significant amount of pipeline expansion is already in advanced planning and permitting. Thus, while typically, gas pipeline companies require long-term commitments from ‘anchor’ gas shippers before receiving permitting approval and proceeding to break ground, there is no reason to believe that the system will be short of capacity as a result of the Clean Power Plan. Indeed, such commitments have and can be made in many regions (notably, in Colorado, as part of the state’s approval of Xcel’s decision to replace parts of its coal fleet with gas-fired plants, or in the Midwest, where DTE Energy has committed to support pipeline expansion to access gas supplies in the Marcellus). In some organized wholesale electric markets, however, there may need to be changes in some market rules and/or new institutional commitments to induce new investment in firm pipeline expansion to make gas available to non-utility generators.
Another issue raised in many comments relates to the current uncertainty that exists with regard to how states may/should/will count new gas-fired combined cycle power plants in their overall planning. Because such new plants fall under a different part of the Clean Air Act (i.e., Section 111(b)) than existing power plants (i.e., Section 111(d)), EPA has suggested that states will have the option to determine whether to fold in new plants into their overall framework for controlling emissions of then-existing power plants, or to keep those new plants regulated under a separate regime. What states will do remains a critical unknown, and could affect the operations of the overall power system, as well as emissions from the plants now covered under the Clean Power Plan.66
Beyond regional concerns and detailed technical criticisms, the most frequent reliability-related comments focus on the implications of the interim targets and the timelines for compliance.67
66 For example, states with an emission rate goal less than 1,000 lbs/MWh may meet such a target through extensive renewable resources. The use and reliance on new NGCC units (with an emission rate equal to 1,000 lbs/MWh) to provide significant quantities of energy when renewables are off-line may actually increase net total emissions.
67 The current rule includes two compliance options: a 2030 final goal with an interim compliance goal for average emissions between 2020 and 2029, and a second option, with lower total goals and no interim goals, to be achieved by 2025. Under option 1, States are required to file their SIP by June 30, 2016, with one year extensions available for single states and two years for multi-state plans. EPA has committed to reviewing and approving all SIPs within one year of receipt. Therefore, final SIPs will take effect

Electric System Reliability and EPA’s Clean Power Plan
Analysis Group Appendix - 6
Commenters point out that the compliance timeline presents at least two challenges. The first is the added pressure on resource adequacy in light of pending retirements, particularly of economically marginal coal units facing difficult retrofit decisions for compliance with ongoing air regulations such as the MATS.68 The second is the asserted lack of time for states to develop regional plans for compliance, which could easily require multi-year time frames to coordinate necessary staff in legislative departments, PUCs, and state energy and air offices.
Others have raised the issue that the timelines will result in significant stranded costs for ratepayers.69 While not a reliability issue per-se, these stranded costs carry a true economic cost in that those monies may have been better spent on other programs in support of the Clean Power Plan project. However, as we discussed we observe that too often, commenters make assertions about reliability challenges that really end up being about cost impacts. We think that separating reliability considerations from cost consideration is important so as to avoid distracting attention from the actions necessary (and possible) in order to keep the lights on. There may be “lower cost” options that reduce emissions some part of the way toward the target reductions, but that fail to meet acceptable reliability standards. We do not view such ‘solutions’ as the lowest cost solution precisely because they fail to account for the cost of unacceptable system outages to electricity consumers. Any plan that starts with consumer costs and works backward to reliability and then to emission reduction is one that fails to consider the wide availability of current tools that have served grid operators for more than a decade to meet reliability needs.
between June 30, 2017 and June 30, 2019. Interim compliance goals for each state are set for the 2020 to 2029 period, in what is commonly referred to as the “glide path” of emission reductions to the 2030 target. The interim compliance goals assume that states can achieve the full quantity of reductions equal to estimates from Building Block 1 and Building Block 2. The “glide” in the interim targets, then, is due to the steady increase in carbon reductions from avoided fossil fuel generation in the 2020-2029 period from increasing levels of renewable energy and energy efficiency deployment.
68 For example, MISO estimated that between 10 -12 gigawatts of coal-fired capacity will retire by 2016 to meet the MATS rule. An additional 14 gigawatts of coal-fired generation (25 percent of the remaining supply) is further at risk of retirement by 2020. MISO conservatively estimates that it will take a minimum of six years for the necessary generation and transmission infrastructure to replace these retirements. Assuming that all state plans are finalized and approved by 2018, necessary infrastructure would not be in place until 2024 – leaving a four year gap of increased reliability risk. MISO, “Analysis of EPA’s Proposal to Reduce CO2
Emissions from Existing Electric Generating Units,” November 2014.
69 For example, Ameren estimated that the 2020-2029 interim timelines could cost Missouri ratepayers an additional $4 billion compared to its existing Integrated Resource Plan (IRP). Ameren noted that its existing IRP assumes the full retirement of coal units at the end of their useful lives by 2034. The early retirements would move forward the in-service date for proposed NGCC and require additional capacity than would otherwise be needed by 2034. See Comments of Ameren, filed December 1, 2014, at 3.
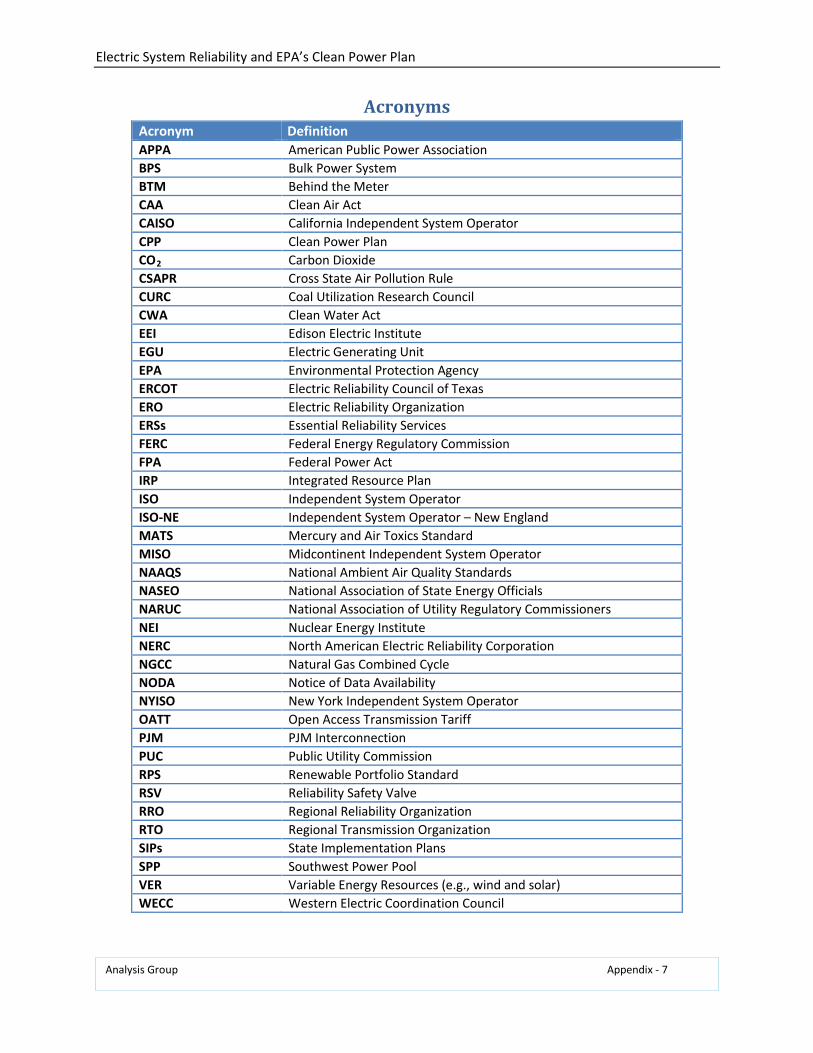
Electric System Reliability and EPA’s Clean Power Plan
Analysis Group Appendix - 7
Acronyms Acronym Definition APPA American Public Power Association BPS Bulk Power System BTM Behind the Meter CAA Clean Air Act CAISO California Independent System Operator CPP Clean Power Plan CO2 Carbon Dioxide CSAPR Cross State Air Pollution Rule CURC Coal Utilization Research Council CWA Clean Water Act EEI Edison Electric Institute EGU Electric Generating Unit EPA Environmental Protection Agency ERCOT Electric Reliability Council of Texas ERO Electric Reliability Organization ERSs Essential Reliability Services FERC Federal Energy Regulatory Commission FPA Federal Power Act IRP Integrated Resource Plan ISO Independent System Operator ISO-NE Independent System Operator – New England MATS Mercury and Air Toxics Standard MISO Midcontinent Independent System Operator NAAQS National Ambient Air Quality Standards NASEO National Association of State Energy Officials NARUC National Association of Utility Regulatory Commissioners NEI Nuclear Energy Institute NERC North American Electric Reliability Corporation NGCC Natural Gas Combined Cycle NODA Notice of Data Availability NYISO New York Independent System Operator OATT Open Access Transmission Tariff PJM PJM Interconnection PUC Public Utility Commission RPS Renewable Portfolio Standard RSV Reliability Safety Valve RRO Regional Reliability Organization RTO Regional Transmission Organization SIPs State Implementation Plans SPP Southwest Power Pool VER Variable Energy Resources (e.g., wind and solar) WECC Western Electric Coordination Council

EPA’s Clean Power Plan: States’ Tools for Reducing Costs and Increasing Benefits to Consumers
Analysis Group Paul Hibbard Andrea Okie Susan Tierney July 2014

Acknowledgments This report evaluates the Clean Power Plan – proposed by the U.S. Environmental Protection Agency on June 2, 2014 – from the perspective of how it might impact consumers. The report examines how states’ plans to control carbon emissions may affect owners of affected power plants, other market participants in the electric industry, and, in turn, consumers of electricity. The paper examines one particular carbon-control program – the Northeast states’ Regional Greenhouse Gas Initiative – that has been in operation for several years, to illustrate how such carbon-control compliance costs and benefits have evolved over the initial years of that program. The paper also reviews the normal ratemaking practices and other regulatory policies in states across the country that are designed to mitigate rate impacts of investments and program costs affecting production and delivery of power to consumers. The goal of the Report is to reflect on recent experience to outline the tools states have to control costs and increase consumer benefits as they develop their plans.
This is an independent report by Analysis Group, supported by funding from the Energy Foundation and the Merck Family Fund. The authors wish to thank the foundations for their interest in electricity consumer issues and for their support of the analysis presented in this report. In addition, the authors thank Laurie Burt, of Laurie Burt LLC for effective and efficient project coordination, and Caroline Corbett, Lucy Wagner, and Anne Williams of Analysis Group for research assistance throughout the project.
The report, however, reflects the analysis and judgment of the authors only, and does not necessarily reflect the views of the Energy Foundation, the Merck Family Fund, or Laurie Burt LLC.
About Analysis Group Analysis Group provides economic, financial, and business strategy consulting to leading law firms, corporations, and government agencies. The firm has more than 600 professionals, with offices in Boston, Chicago, Dallas, Denver, Los Angeles, Menlo Park, New York, San Francisco, Washington, D.C., Montreal, and Beijing.
Analysis Group’s energy and environment practice area is distinguished by expertise in economics, finance, market modeling and analysis, regulatory issues, and public policy, as well as significant experience in environmental economics and energy infrastructure development. The practice has worked for a wide variety of clients including: energy producers, suppliers and consumers; utilities; regulatory commissions and other public agencies; tribal governments; power system operators; foundations; financial institutions; and start-up companies, among others.

EPA’s Clean Power Plan: State Plans and Consumer Impacts
Table of Contents 1. Executive Summary 1
2. EPA’s Proposed Clean Power Plan 8
3. Connecting the Dots: EPA’s Proposal and Potential Economic Impacts on Electricity Consumers 10
4. Program Design Considerations: Review of the Regional Greenhouse Gas Initiative 17
Overview 17
RGGI Background and Overview 17
Analysis of RGGI’s Economic Impacts 19
RGGI helped the Northeast states lower total fossil-fired power production and lower use of natural gas and oil for heating, thereby reducing the total dollars sent out of state for energy resources. 22
RGGI Program Developments Since the 2011 AG RGGI Report 22
Implications for Clean Power Plan Compliance 25
5. Fairness And Protection of Consumers 28
Overview 28
Electric Ratemaking to Allocate Costs and Benefits “Fairly and Equitably” (with a focus on energy efficiency programs) 29
Protecting Lower-Income Consumers 34
State Tools to Manage Potential Program Cost Impacts 35
6. Conclusion 36
EPA’s Clean Power Plan: State Plans and Consumer Impacts
Analysis Group Page 1
1. EXECUTIVE SUMMARY On June 2, 2014, the United States Environmental Protection Agency (EPA) released proposed rules to reduce emissions of carbon dioxide (CO2) from existing fossil power plants. EPA’s “Clean Power Plan” would require significant reductions in CO2 emissions from the power sector, while also providing each state the flexibility to determine its preferred way to comply with the new requirements.
EPA’s analysis indicates that although there will be costs to comply with the Clean Power Plan, such costs will be much lower than the benefits to public health and to the overall economy from lower CO2 and other air emissions.1
Some observers2 have contended that consumers will experience net costs because, in those observers’ view, overall compliance costs will outweigh economic and other benefits. EPA’s analysis indicates that customers will see slightly higher electricity rates in the near term but lower electricity bills over the long run with the Clean Power Plan in place.
Based on our own analysis and experience, we believe that the impacts on electricity rates from well-designed CO2-pollution control programs will be modest in the near term, and can be accompanied by long-term benefits in the form of lower electricity bills and positive economic value to state and regional economies.
There are sound reasons to be confident that customers can and will benefit from states’ plans to lower the carbon intensity of their electric systems. First, and foremost, states have a long track record of using various regulatory and other policy tools to encourage utility programs and investments that minimize the cost of electric service, consistent with the myriad of public policies (tax, environmental, reliability, labor, and other areas of policy) that affect the provision of electricity. State officials (including utility regulators) are keenly focused on protecting electricity customers and will keep that objective front and center as they determine how to reduce CO2 emissions.
Second, under the proposed Clean Power Plan, states will have the flexibility, experience and tools to prepare and implement State Plans that fit their circumstances, minimize costs of compliance, and provide benefits to customers. States can each put together the elements of plans well-suited to their state, and they’ll have the ability to phase in changes over the 2020-2029 period in ways that accommodate smooth transitions. Although states differ in many ways – including their electric systems, their regulatory culture, and their electric industry structure – all states have programs,
1 EPA has estimated that by 2020, compliance costs for the Clean Power Plan will fall in a range of $4.3 billion to $7.5 billion (2011$). For context, total expenditures on electricity in 2012 were $363.7 billion (2012$). (Source: Energy Information Administration (EIA) 861 database on electric revenues.) EPA’s cost analysis tracks “the net change in the annualized cost of capital investment in new generating sources and heat rate improvements at coal steam facilities, the change in the ongoing costs of operating pollution controls, shifts between or amongst various fuels, demand-side energy efficiency measures, and other actions associated with compliance.” EPA’s analysis of benefits examines the effect of lower demand leading to lower costs to consumers, along with the expected economic, health, safety and environmental benefits of the rule. See EPA, Regulatory Impact Analysis for the Proposed Carbon Pollution Guidelines for Existing Power Plants and Emission Standards for Modified and Reconstructed Power Plants (hereafter referred to as EPA RIA), June 2014, page ES-8, Table ES-10, and the Executive Summary more generally. 2 See, e.g., Institute for 21st Century Energy (U.S. Chamber of Commerce), “Assessing the Impact of Potential New Carbon Regulations in the United States,” May 2014.

EPA’s Clean Power Plan: State Plans and Consumer Impacts
Analysis Group Page 2
policies and practices that will allow them to develop plans that align well with their different circumstances while still complying with the new CO2 emission requirements. For example:
States with vertically integrated utilities have mechanisms – including but not limited to integrated resource planning processes – for identifying least-cost compliance strategies. States have considerable experience and strong practical background in evaluating portfolios of supply and demand resources with costs and reliability in focus, and in encouraging long-term investments that minimize costs and maximize electricity consumer benefits.
States with restructured electric industries can choose from a variety of market-based mechanisms that dovetail well with competitive retail and wholesale electric industry structures.
Not surprisingly, in both areas, there will be continued opportunities in the future to use cost-effective energy-efficiency programs as part of states’ CO2 compliance strategies to help deliver significant benefits to customers and to local economies. Many states and utilities have deep experience in using energy efficiency as part of a least-cost utility resource plan or in competitive market contexts. Practices for design, implementation, administration, and evaluation of energy efficiency programs are readily transferable to states and utilities with less background in such programs. As the value of customer-side programs rises in the context of CO2 compliance, states should expect to see more opportunities for cost-effective energy efficiency – and can use ratemaking tools to create incentives for utilities and others to pursue them.
Additionally, many states are already introducing changes into their local utility systems to accommodate opportunities for customers to take actions – such as adopting energy efficient technologies in their buildings and operations – that will give customers the opportunity to be part of the solution in lowering carbon pollution from electricity production and use.
Third, market-based mechanisms offer unique opportunities to minimize costs while also reducing CO2 emissions from existing power plants.
States can implement such market-based programs within state boundaries. Moreover, states can work together – and with the stakeholders within each state – to develop and implement workable multi-state programs to control CO2 emissions from existing power plants, in ways that fully preserve the rights of states in program design and administration. The EPA has not required states to develop their plans together, but the Clean Power Plan anticipates that many states may find it worthwhile to do so, in light of the way that electric systems and electrical resources are commonly shared across state boundaries.
Such multi-state, market-based mechanisms to control CO2 emissions can respect the practicalities of reliable electric system operations, and can be seamlessly integrated into both traditionally regulated and competitive electric industry settings.
Pricing carbon – and this is likely true whether through a market-based mechanism or alternative compliance mechanisms – will help send efficient signals for new investment in resources (like zero-carbon technologies such as renewables and nuclear power plants, and in deeper energy efficiency measures) and for shifting power system operations toward power plants with lower carbon emissions.
Market-based mechanisms – like the Regional Greenhouse Gas Initiative (RGGI) or California’s cap-and-trade program – can provide opportunities for states to capture the economic value of

EPA’s Clean Power Plan: State Plans and Consumer Impacts
Analysis Group Page 3
CO2 emission allowances, and direct those revenues for consumer and public benefit. For example, in states with restructured electricity markets, states may choose to rely on methods to move CO2 emission allowances into the market that avoid windfalls to owners of power plants. For the RGGI states, this has been accomplished through auctioning of CO2 allowances. In other states (whether they have a traditional utility structure or a restructured market), another competitively neutral way to provide public/consumer benefits would be to allocate allowances for free to electric distribution utilities, who then can sell them to power generators and capture the revenues for consumers.
Based specifically on our detailed analysis of states’ experience with RGGI and the design of a wide array of programs that insulate lower-income consumers, we believe that the impacts on electricity rates and bills from well-designed CO2-pollution control programs will be modest in the near term, especially for low-income customers. (See figure as example of the difference between rates and bills.3)
Fourth, states are well equipped through long-standing utility ratemaking principles, practices and programs to help protect low-income customers when electricity costs increase. Such tools include discounted rates and arrearage management plans, dedicated funding for low-income energy-efficiency and weatherization programs, utility-driven charitable contribution programs, one-time emergency assistance programs, LIHEAP funding for heating and utility bill assistance, and disconnect/shut-off protection policies. Among the many states we found to be offering targeted energy efficiency programs for low-income customers are Colorado, Florida, Georgia, Illinois, Maine, Maryland, Michigan, Missouri, Montana, North Carolina, Ohio, and Texas.
In the end, the states are in control. State environmental, energy and utility-regulatory agencies will tailor compliance approaches to their individual circumstances, and in doing so will play a significant role in driving down and managing the costs of Clean Power Plan compliance through their plans.
3 The difference between electricity rates and electricity bills is an important one in the context of many potential compliance approaches. In our prior analysis of the RGGI program, we found that while RGGI program costs initially had an increasing effect on electricity rates, the impact of energy efficiency investments (using RGGI allowance revenues) significantly reduced commercial and residential electricity use, placing downward pressure on rates over time, and combined with lower consumption, tended to generate on average much lower electricity bills. See: Paul Hibbard, Susan Tierney, Andrea Okie, Pavel Darling, “The Economic Impacts of the Regional Greenhouse Gas Initiative on Ten Northeast and Mid-Atlantic States,” November 15, 2011 (hereafter referred to as the AG RGGI Report).

EPA’s Clean Power Plan: State Plans and Consumer Impacts
Analysis Group Page 4
Those State Implementation Plans (or simply State Plans) will define the set of actions that will work together to reduce emissions from fossil power plants. The components of the State Plans will affect compliance costs and collateral benefits. And states’ regulatory and ratemaking policies can influence how compliance actions undertaken by owners of power plants and other actors translate into increases or decreases in electricity rates and bills to different types of consumers. We note that EPA’s Clean Power Plan is quite different from the more typical federal air regulations affecting emissions from fossil power plants. Normally, owners of such plants are responsible for determining how to comply with regulations through investments, changes in operations, or – in some cases – a decision to retire a plant. Here, the states themselves may end up taking the actions to reduce emissions (e.g., through energy efficiency programs or appliance-efficiency standards or continued pursuit of renewable resources, none of which are necessarily operated or paid for by owners of fossil power plants). If included in a State Plan, such elements would affect the operations and costs of some fossil power plants, but would do so indirectly rather than through an action specifically undertaken by an owner of a plant subject to the EPA’s rules. And in turn, such policies adopted by a state could affect overall compliance costs passed through to electricity consumers – as well as the character of the benefits they receive through state actions under the Clean Power Plan.
Our report explains the practical mechanics of how compliance costs tend to be passed through to electricity consumers in competitive and traditional electricity systems. We also draw on recent experience among existing carbon-control programs already in operation in some states to illustrate how program design and state ratemaking policies can influence the distribution of cost and benefit outcomes to consumers. The bottom line, in our view, is that states have the means to help ensure that compliance costs are as low as possible – and to provide benefits to local economies.
How should we think about compliance costs in this context? To start with, controlling and reducing CO2 will tend to increase the cost of doing business for many owners of affected plants, whether compliance is achieved through investments to increase a plant’s efficiency, or through controls on a plant’s operations that reduce its output (and associated revenues), and/or through the purchase of CO2 allowances in a cap-and-trade program. Changes in plant operations (e.g., lower output, lower revenues from power sales) could also result from other components of a State Plan, for example, if a state were to include energy efficiency programs or renewable energy requirements or measures to retain existing nuclear plants as part of the power supply. These latter actions could lower the amount of power produced overall at fossil-fuel power plants, and help to offset potential costs associated with lowering the emissions from fossil-fuel power plants. States may choose to pursue these latter options because they could substantially help to lower the overall costs of compliance with the Clean Power Plan.
How could such compliance costs translate into impacts on consumers’ electricity bills? This is a bit more complicated. In many parts of the U.S., there is not a straight line connecting the costs incurred by the owners of the power plants directly affected by EPA’s Clean Power Plan, and the costs, benefits and state/regional economic impacts experienced by electricity consumers and other players in the electric industry. In fact, the relationship between power plant owners’ compliance costs and consumers’ prices will vary significantly, depending upon many factors (such as whether the local electric utility owns any power plants, or what things a state includes in its State Plan). For example:
Approximately two-thirds of the nation’s electricity customers live in regions where an independent grid operator runs a competitive power market. In these parts of the country –

EPA’s Clean Power Plan: State Plans and Consumer Impacts
Analysis Group Page 5
including California, Texas, much of the Midcontinent region, the MidAtlantic area, and the Northeast – electricity customers pay prices based on the costs of the power plant operating on the margin in any hour, and thus do not necessarily reflect every dollar of compliance costs incurred by owners of all power plants. This results from the way that electricity prices arise in these markets (which we explain later in our report).
Ten of the nation’s states (California and the nine member states that participate in the Northeast/MidAtlantic region’s RGGI program) already participate in a carbon cap-and-trade program, with compliance costs incurred by some – but not all – power producers already reflected in electricity prices.
Across the country as a whole, approximately two-thirds of power is produced by electric utility companies (investor-owned utility companies, municipally owned utilities and electric cooperatives).4 In these contexts, state utility regulators and boards of public-power companies and cooperatives typically allow pass-through of costs and investments associated with environmental compliance activities. However, collection of these costs from customers usually requires least-cost planning processes and/or other cost-minimization steps as a condition of recovery, in order to maintain the incentives for efficient, operations and investment, and to keep overall compliance costs low.
There clearly are a number of strategies that states can include in their State Plans to at least partially offset the impact of program costs on consumers. Experience demonstrates that some approaches can even generate net benefits to electricity customers and the larger state economy. An example of the latter is the RGGI states’ auction of CO2 allowances and use of the auction proceeds to support energy efficiency and customer bill credits; we have previously concluded in our detailed study of RGGI’s first three years that it provided net benefits to customers and the economy of each participating state, and we update that prior analysis here to encompass over five years of experience with a CO2 market-based trading program.5
There are other emission-credit trading approaches focused on consumer protection, cost mitigation or other objectives that could be adopted and implemented by states, such as the one proposed by the Clean Air Task Force (CATF). CATF’s proposed mechanism would allow states “to mitigate retail electric rate impacts and protect all classes of electric ratepayers (industrial, commercial and residential) in all power markets by allowing for compensation to ratepayers…[and] to use a portion of the allowance allocations to compensate merchant coal generators for losses in asset value that may occur due to the program.”6 In both of these approaches – one an actual program (RGGI), the other an alternative design – states’ voluntary agreements to use a multi-state approach helps to keep
4 In more than half of the states, the local utility owns more than 70 percent of the power plant capacity. (Source: EIA 860 database for 2012.) Typically, state utility regulators in states with utilities that own power plants determine whether large capital investments at those plants are prudent, used and useful, and appropriate to be included in “just and reasonable” rates charged to customers. In many such states, the regulators review utilities’ plans for capital investments at power plants are part of least-cost planning processes. 5 AG RGGI Report. 6 Conrad Schneider, “Power Switch: An Effective, Affordable Approach to Reducing Carbon Pollution from Existing Fossil-Fueled Power Plants,” Clean Air Task Force, February, 2014, with accompanying technical analysis by Bruce Phillips, “ Alternative Approaches for Regulating Greenhouse Gas Emissions from Existing Power Plants under the Clean Air Act: Practical Pathways to Meaningful Reductions,” The NorthBridge Group, February 2014 (together, hereafter referred to as CATF Proposal).

EPA’s Clean Power Plan: State Plans and Consumer Impacts
Analysis Group Page 6
compliance costs low and mitigate impacts on affected entities. EPA’s own benefit/cost analysis also supports this conclusion.7
Finally, creative approaches by states to address potential compliance costs, mitigate impacts on all consumers, and achieve various policy objectives will all be layered on top of a deep level of commitment and practice states have in managing electric industry costs. States have many decades of experience with electricity rate design, program benefit and cost allocation, and compliance program planning and implementation that will help guide an equitable distribution of program costs and benefits, while protecting lower-income customers.
We hope that our report provides states with ideas for how they might apply their experience and expertise in preparing State Plans to lower overall compliance costs and provide economic benefits to consumers and to the local economy. We assume that as states begin to consider what to include in their plans (as many states have already begun), they will do so by convening stakeholder processes to identify and weigh options and by assuring that personnel from different relevant state agencies are involved in those discussions. (The experience of Illinois and several other Midwest states are a few great examples.)
Although EPA’s Clean Power Plan anticipates that a state’s air regulatory agency will be the entity to present a state’s plan to the EPA, our experience in state government8 informs us of the value of ensuring that all relevant state agencies (utility regulators, state energy offices, climate policy advisors, consumer protection branches, in addition to state environmental regulators) participate fully in the development of State Plans. Given the differences that exist among states in terms of the scope and depth of agency authorities, skills, and expertise, and given the fact that EPA’s Clean Power Plan will lead to policies that directly and indirectly affect operations of the electric system and consumer prices, bringing more and different points of view to the task will likely improve the quality, costs and benefits of State Plans. State utility regulators, for example, will have a critical role in assuring that implementation of the EPA requirements occurs in a least-cost fashion and in assuring a fair allocation of costs and benefits of such actions. State energy offices often also have responsibility for many aspects of electricity use in appliances and buildings, and in managing renewable programs.
7 “The proposed emission guidelines provide states with options for establishing standards of performance in a manner that accommodates a diverse range of state approaches. The proposed guidelines would also allow states to collaborate and to demonstrate emission performance on a multi-state basis, in recognition of the fact that electricity is transmitted across state lines, and local measures often impact regional EGU CO2 emissions.” EPA RIA, page ES-2, Table ES-4, and the Executive Summary more generally. 8 Paul Hibbard was recently Chairman of the Massachusetts Department of Public Utilities (DPU), and previously had worked in the state’s air regulatory division. Sue Tierney previously served as Secretary of Environmental Affairs, Commissioner of the DPU, and senior economist at the energy office in Massachusetts, and was subsequently Assistant Secretary for Policy at the U.S. Department of Energy.

EPA’s Clean Power Plan: State Plans and Consumer Impacts
Analysis Group Page 7
Our report describes our assessment of states’ actual experience with RGGI, and of the larger body of ratemaking practices in states around the country through which regulators ensure fair and equitable rates to customers. In the latter, we examined a wide and diverse cross-section of states (covering half of the states in the U.S., as shown in the figure at the right), in order to point to the many tools available to states to manage the distribution of compliance costs and economic benefits among customers.
Clearly, State Plans approved by the EPA will create the framework for the industry’s compliance with EPA’s Clean Power Plan. How compliance plans are designed by the states will strongly affect the magnitude and distribution of costs and benefits among consumers, power plant owners, and the general economy. The regulatory practices for passing on costs to electricity consumers is also important, as it can influence the degree and allocation of program costs and benefits.
In the following sections, we discuss the analyses that allowed us to reach the conclusions noted above. Section 2 briefly summarizes EPA’s proposed Clean Power Plan, and the role it anticipates for states in developing State Plans to control CO2 emissions from existing power plants. We describe the wide range of compliance options available to states. In Section 3, we explain how different State Plan options may affect compliance costs, and how those costs may impact consumers’ electricity rates and bills. Those impacts will vary across the country, due to several factors including: the different emission-reduction targets assigned to each state; the structure of the electric industry in the state (e.g., traditional utility-owned generation versus independent power production; vertically integrated utility operations versus wholesale competitive markets). We further highlight the importance of state program design on the economic benefits and costs of program implementation.
Section 4 reviews the experience of RGGI in the Northeast states, with RGGI being the long-running market-based CO2 control program in the U.S. This discussion illustrates how a multi-state approach can operate seamlessly as part of the electric system, lead to efficient price signals affecting power plant dispatch, reduce emissions, and provide opportunities to control compliance costs and enhance benefits to consumers. Our review of RGGI’s experience focuses on a recent economic analysis of the program, supplemented with a review of up-to-date data on continuing RGGI auctions and spending of allowance revenues.
Finally, in Section 5, we review state ratemaking practices and public policies that allow for fair cost recovery across all consumers, and for protecting low-income customers in particular. Appendix 1 provides more detail on EPA’s proposed Clean Power Plan. Appendix 2 summarizes how RGGI states have used the proceeds from selling CO2 allowances (e.g., to invest in energy efficiency programs, to provide a credit on customers’ electricity bills and for other purposes including payments to the state’s general fund). Appendix 3 compares state electricity revenues and spending on energy efficiency program by customer class, to illustrate how states can design those programs to support efficiency improvements for different types of customers. Appendix 4 provides case studies of electricity consumer-protection policies, to illustrate the tools currently in place in half of the states in the U.S.

EPA’s Clean Power Plan: State Plans and Consumer Impacts
Analysis Group Page 8
EPA’s Proposed Clean Power Plan:
State-specific targets to reduce CO2/MWh produced at existing fossil-fuel power plants.
Two compliance periods: 2020-2029 (averaging compliance over the decades, to meet an interim target) and another by 2030.
State Plans to be submitted to EPA to show how the state and the power plants within it will comply with the targets.
States have the flexibility to propose a wide variety of options in their plans, including actions that directly affect emissions from fossil power plants (EGUs) and actions that indirectly affect those EGUs’ emissions (such as through energy efficiency, policies that encourage more investment in zero-carbon power generation technologies, or changes to electric transmission infrastructure).
States may propose market-based mechanisms.
States may join together for regional plans.
States may use a “rate-based” approach (i.e., CO2/MWh) or a “mass-based” approach (i.e., a total amount of CO2 allowed to be emitted in the state, sometimes also called a CO2 budget or cap).
2. EPA’S PROPOSED CLEAN POWER PLAN On June 2, 2014, the U.S. EPA proposed rules to reduce CO2 emissions from existing electric generating units (EGUs) through Section 111(d) of the Clean Air Act (CAA). The proposed rules, called the “Clean Power Plan,” are anticipated to lower CO2 emissions from the power sector by 30 percent relative to levels in 2005. Under the CAA, EPA establishes the target level of emission reductions for each state, and the states develop (and submit to EPA for approval) State Plans to meet EPA’s requirements.
EPA’s proposal sets state-specific standards, in terms of pounds of CO2 allowed to be emitted per megawatt-hour (MWh) of electricity produced at affected facilities. In setting the standards applicable to each state’s power plants, EPA used a standardized methodology based on assumptions about the amount of emissions reduction that could occur through investments and operational changes at affected power plants, through zero-carbon generating sources, and through energy efficiency. (EPA refers to these as the “building blocks.”9) No state, however, is required to use all of those approaches.
States may choose from a wide variety of potential compliance mechanisms, actions and investments. Among the many options are: modifications at existing EGUs to increase their power-production efficiency; operating limits at EGUs; real or shadow prices on carbon emissions; carbon taxes; emission-averaging across power plants; participation in single state or multi-state market-based emission-trading programs; reliance on non-fossil alternatives, including ones that reduce demand through energy efficiency (and therefore reduce output at fossil plants), and others that retain/increase low/zero-CO2 emitting resources (e.g., new renewable energy and existing or new nuclear capacity).
Each state’s choice of what elements to include in its State Plan will affect compliance benefits and costs in that state. On the one hand, a State Plan could require investments to improve the efficiency of each power plant affected by the Clean Power Plan, along with other measures to cause some of the most-polluting plants to operate on a restricted basis. Based on what is known at present,
9 The four building blocks EPA used to set state-specific emission-reduction targets reflect the potential to reduce emissions through: Improving operating efficiency or otherwise reducing CO2/MWh at EGUs. Shifting output at power plants with high CO2 emissions (e.g., at coal-fired units or inefficient gas/oil plants) through increased output
at plants with lower CO2 emissions per MWh generated (i.e., at natural-gas combined cycle (NGCC) units). Substituting output at fossil EGUs with retention or addition of output at zero-carbon generation (renewables and nuclear); and Reducing emissions from affected EGUs by lowering overall demand for electricity through additional energy efficiency.

EPA’s Clean Power Plan: State Plans and Consumer Impacts
Analysis Group Page 9
however, this would not necessarily minimize overall compliance costs.10 On the other hand, using approaches that send appropriate CO2-related price signals could help to minimize costs.
States may be able to layer on various approaches as part of their State Plans. For example, rather than requiring a certain average level of emissions at each plant, a state with vertically integrated utilities could decide to allow all of the plants owned by a particular company to average the emissions across its fleet. This might lead to retirements of some older and less efficient power plants, in exchange for allowing continued operation of coal-fired power plants that have recent investments in equipment to control mercury and other toxic emissions. States can determine how to adopt cost-sharing approaches so that those customers that benefit from such flexibility may share some of those benefits with customers of other electric companies needing to do more.
A state also could select market-based approaches that allow pursuit of the cheapest compliance options first (and thus produce a lower overall compliance cost) within that single state. And states may decide to enter into agreements with other states that establish an overall blended-average emissions cap, and allow owners of plants in multiple states to trade their emissions reductions so that on average, all plants in the relevant states achieve the average emission-reduction target.
Because states may choose from such a wide variety of potential compliance options, EPA’s cost/benefit analysis estimated outcomes under a number of assumptions about how states would craft their plans. Based on these analyses, EPA concluded that potential costs will be more than offset by reduced demand (which would lower overall production costs to consumers) and by the expected economic, health, safety and environmental benefits of the rule.
Although projections of pollution program costs always rely on inherently uncertain information before a program actually goes into effect, prospective estimates of the costs of pollution-control regulations have historically exceeded actual program costs.11 This tends to occur for several reasons, most notably the fact that it is difficult to anticipate in advance how technology innovation will occur, even if it is well understood that such innovation will likely occur in response to regulation.12
In this particular case, the EPA does not know now what specific actions individual states – or groups of states – will incorporate into their State Plans. The actual economic costs of the Clean Power Plan will depend strongly on the decisions that states make in developing and implementing their State Plans, industry’s responses to these decisions, and the nature and pace of technological change driven by compliance activities. Additionally, state practices regarding review of utilities’ compliance plans and recovery of costs related to them will affect the magnitude and distribution of consumers’ costs. In all states – whether they have a vertically integrated or restructured electric industry – ratemaking practices can affect the impacts on different customer segments (including low-income customers).
10 See, for example: Joshua Linn, Erin Mastrangelo, and Dallas Burtraw, “Regulating Greenhouse Gases from Coal Power Plants under the Clean Air Act,” Resources for the Future (RFF), February 2013; Dallas Burtraw, Joshua Linn, Karen L. Palmer, Anthony Paul, “The Costs and Consequences of Clean Air Act Regulation of CO2 from Power Plants,” RFF, January 2014. 11 Winston Harrington, Richard Morgenstern, and Peter Nelson, “On the Accuracy of Regulatory Cost Estimates,” RFF, 1999; Hart Hodges, “Falling Prices: Complying with Environmental Regulations Almost Always Less Than Advertised,” Briefing Paper, Economic Policy Institute, 1997; Ruth Ruttenberg, “Not Too Costly After All,” prepared for Public Citizen Foundation, February 2004. 12 National Academy of Sciences, “America’s Energy Futures Report, 2008, pages 97-102; International Energy Agency, “Experience Curves for Energy Technology Policy” (2000).

EPA’s Clean Power Plan: State Plans and Consumer Impacts
Analysis Group Page 10
3. CONNECTING THE DOTS: EPA’S PROPOSAL AND POTENTIAL ECONOMIC IMPACTS ON ELECTRICITY CONSUMERS
EPA’s proposed Clean Power Plan will have various positive and negative effects on consumers and the economy. In its benefit/cost analysis, EPA identified a number of potential economic impacts (positive and negative), including: (1) direct compliance costs incurred by owners of affected power plants (and passed along, in part, to electricity consumers); (2) expenditures on power production facilities with low or no carbon emissions; (3) expenditures on energy efficiency measures; (4) changes in the markets for fuels (e.g., coal, natural gas) used to produce electricity; (5) the expected direct and indirect social, economic, health and environmental benefits from mitigation of climate change; and (6) public health benefits from reduction in combustion of fossil fuels.13
Although the fundamental purpose of EPA’s proposed control of CO2 emissions is to obtain the benefits that come with avoiding climate change impacts (that is, capturing the impacts quantified in item (5) above), much attention will undoubtedly be focused on the proposal’s implications for direct and indirect costs relating to items (1) through (4) above. (Unfortunately, many parties will overlook that expected impacts that produce public health benefits (6).) The close attention paid to direct and indirect economic impacts is inevitable given the importance the public places on near-term energy costs and economic productivity. Consequently, we summarize how compliance costs translate to economic impacts on electricity consumers.
There are a myriad of ways in which implementation of EPA’s Clean Power Plan will shift the flow of dollars associated with the production and consumption of electricity over time, generating additional direct and indirect economic costs and economic benefits. The impacts will ripple through the electric sector in many ways, for example by:
changing the costs to generate electricity at different power plants;
changing the demand for different fossil fuels;
prompting the retirement of some generating assets, the retention of some generating assets that would otherwise retire, and the addition of different electricity generation and storage resources than would otherwise occur;
13 EPA, RIA, Executive Summary. “The annual incremental cost is the projected additional cost of complying with the proposed rule in the year analyzed and includes the net change in the annualized cost of capital investment in new generating sources and heat rate improvements at coal steam facilities, the change in the ongoing costs of operating pollution controls, shifts between or amongst various fuels, demand-side energy efficiency measures, and other actions associated with compliance….[The costs] represent the estimated incremental electric utility generating cost changes from the base case, plus end-use energy efficiency program costs (paid by electric utilities) and end-use energy efficiency participant costs (paid by electric utility consumers).” EIA, RIA, Page ES-8. “Implementing the proposed guidelines is expected to reduce emissions of CO2 and have ancillary emission reductions (i.e., co-benefits) of SO2, NO2, and directly emitted PM2.5, which would lead to lower ambient concentrations of PM2.5 and ozone. The climate benefits estimates have been calculated using the estimated values of marginal climate impacts presented in the Technical Support Document: Technical Update of the Social Cost of Carbon for Regulatory Impact Analysis under Executive Order 12866,...Also, the range of combined benefits reflects different concentration-response functions for the air pollution health co-benefits, but it does not capture the full range of uncertainty inherent in the health co-benefits estimates. Furthermore, we were unable to quantify or monetize all of the climate benefits and health and environmental co-benefits associated with the proposed emission guidelines, including reducing exposure to SO2, NOx, and hazardous air pollutants (e.g., mercury and hydrogen chloride), as well as ecosystem effects and visibility impairment. These unquantified benefits could be substantial, but it is difficult to approximate the potential magnitude of these unquantified benefits and previous quantification attempts have been incomplete.” EIA, RIA, pages ES-9 and ES-10.

EPA’s Clean Power Plan: State Plans and Consumer Impacts
Analysis Group Page 11
changing the price of power passed along to electricity customers;
altering the amount of electricity consumed by customers as a result of energy efficiency compliance investments;
spurring or accelerating growth in emerging technologies and industries that address carbon emissions at power plants or that meet electricity demand through less carbon-intensive ways;
accelerating consumer- and business-based investments in on-site conservation, load reduction, and behind-the-meter renewable generation technologies; and
other impacts not understood or imagined today.
These impacts will introduce costs and benefits for different parts of the local and regional economies in ways that are challenging to predict with precision at the outset of the program. It is possible, though, to explore how such costs and benefits arise in different parts of the economy.
In the first instance, controlling and reducing CO2 will tend to increase costs for owners of power plants affected by the rule. This is the part of the cost equation that usually gets the most attention in public discussions of environmental regulations: Compliance will increase the cost of doing business for affected plant owners in ways determined by a state’s plan – e.g., through on-site investments to increase power plant efficiency or otherwise reduce plant emissions of CO2, through company-wide costs incurred in an emissions averaging program, through the purchase of CO2 allowances in a cap-and-trade program, or through payments associated with a carbon charge, fee or tax mechanism.
All else equal, power producers will attempt to pass along such costs in the prices they charge for generating electricity. In states where electric utilities own affected power plants, such costs will tend to be passed along to those utility’s consumers through regulated rates as a pass-through of a variable expense, or as recovery of and a return on compliance capital investments. (That result will undoubtedly occur in the parts of the country where municipally owned utilities and electric cooperatives end up taking actions at the power plants that they own.14) In states where non-utility generators’ costs are not part of a utility’s rate base or expenses, but are recovered through competitive wholesale energy markets, generators will include such costs in their market offers but these compliance costs will only flow through to consumer prices if and to the extent an affected unit is actually setting the price of electricity.15
Changes in the cost of operating different types of power plants will affect their dispatch. In principle under the normal “economic dispatch” arrangement similar to those in power systems everywhere
14 This result is tied to the fact that municipal utilities do not have shareholders and must cover their costs through rates charged to consumers. For electric cooperatives, the members are both customers and shareholders, so the same result is true. 15 In competitive markets, there is not a one-to-one correspondence between costs incurred by owners of power plants and wholesale prices that are passed along to retail electricity customers. For example: in circumstances when the CO2 compliance cost per MWh for an inefficient coal unit is higher than for an efficient, natural gas combined cycle unit, the degree to which the CO2 control program increases the price of electricity in a given hour is a direct function of the extent to which a unit is setting the price of electricity (the “marginal” unit). In an hour when a non-emitting unit is marginal and setting the price of electricity, the impact on electricity price of the program in that hour is zero. But conversely, in hours when the least-efficient coal unit is setting the price of electricity, the CO2 program would affect the marginal electricity price. Over the course of the year, the extent to which the CO2 compliance expense (on producers) leads to increases in electricity prices in organized wholesale competitive markets is a function of the extent to which (and how often) CO2-emitting resources are on the margin and setting the price of electricity. The impact on electricity costs over the course of the year is in turn a function of this impact on electricity prices and the extent to which – through consumer choice or program investments (in energy efficiency or renewable energy) – the CO2 program leads to a reduction in electricity consumption.

EPA’s Clean Power Plan: State Plans and Consumer Impacts
Analysis Group Page 12
around the country, the grid operator (e.g., the utility for a vertically integrated power system, or the independent system operator in an ‘organized’ wholesale market) schedules plants to operate so as to minimize the overall cost of production on the system. If it becomes more expensive to generate power at a particular coal plant due to a State Plan’s elements, then the grid operator will turn to a cheaper source of power (e.g., a gas-fired combined cycle). (This could happen in a number of ways, consistent with economic-dispatch principles: for example, the cost to operate the coal plant could rise because it faces a new price on carbon (e.g., through a state tax on carbon, or through the need to purchase CO2 emission allowances, or through use of a ‘shadow’ price on carbon applied in the dispatch equation) or because it has a new constraint on its ability to operate (e.g., through a change in that plant’s operating permit to limit its output over the course of a year.)16 The extent to which this occurs will depend on a region’s resource mix and its demand over all hours of the year. Under the standards proposed by EPA, it is likely that some of the more efficient coal-fired power plants will be able to continue to produce power relatively inexpensively for some time, and they will continue to be dispatched.
Nevertheless, as these changes occur in the relative costs to produce power from different plants, there will be shifts in the electric system. (These have been anticipated by EPA in its application of the “building block” methodology used to set state-specific CO2 targets.) Some plants may retire; others will operate less; others will operate more. Other zero-carbon-emitting plants that tend to be dispatched whenever their fuel supply is available (e.g., nuclear power plants; wind turbines; solar panels) may not see significant changes in output.
There is not a direct line, however, connecting the changes in costs incurred by owners of power plants and the actual costs, benefits and state/regional economic impacts experienced by consumers or other economic actors (e.g., fuel suppliers, owners of non-fossil power plants).
For example, among electric industry participants, some plant owners will face higher costs and/or lose revenues, while others will gain revenues and market opportunities. Older CO2-emitting assets that have operated profitably for many decades may no longer be able to do so. But newer, more efficient and lower-emitting fossil-fired units will tend to operate more. In some parts of the country (e.g., the Rockies, or in the Southeast), some of those changes will occur within a single utility’s own power plant portfolio. In addition, depending upon how states design their State Plans, those changes could also arise across the power plants owned in different states by that single utility (such as might occur in the Southeast states).
In states where the power plants operate as part of single state or regional ‘organized’ power market (shown in the colored areas of the map below), those shifts in output could occur among facilities owned by different power plant owners. How they shift will be influenced by the design of those states’ State Plans, and the resulting approaches to compliance selected by owners of affected EGUs.
16 We are aware of real-world examples of several of these approaches: For example, in the RGGI states, power generators’ offer prices into the energy markets administered by regional transmission organizations (i.e., in the ISO New England market, in the New York ISO market, and in Maryland and Delaware, which are part of the PJM wholesale market), reflect a price on carbon through the generators’ inclusion of the opportunity cost of carbon as part of its energy offer price. In Massachusetts, some gas-fired power plants with dual-fuel capability have limits in their air permits that allow them to be dispatched (on oil) no more than the equivalent of 30 days at full output. In each case, the grid operator incorporates these factors into its economic dispatch that includes these generating units.

EPA’s Clean Power Plan: State Plans and Consumer Impacts
Analysis Group Page 13
Compliance Cost Impacts on Owners of Assets in “Organized” Competitive Wholesale Markets:
Assume an hour when an efficient, natural gas combined cycle power plant is the last one dispatched to meet load, and thus sets the price paid to all generating units operating in that hour. Assume too that the plant operates in a state with a State Plan that includes some form of price on its carbon emissions (as now occurs in the 9-state RGGI region) The price offered by the natural gas plant contains a variable cost, in dollars per MWh of generation, based on its opportunity cost related to its emissions of CO2 in that hour (e.g., by purchasing allowances, paying a tax or fee). This will affect various power plant owners in the following ways:
The clearing natural gas-fired unit: The unit that sets the clearing price will exactly recover its compliance cost, and the price increase for energy in the wholesale market will increase (relative to a no-carbon control program) by the cost of compliance for a natural-gas combined-cycle unit. All gas-fired units with similar heat rates will face similar circumstances. In effect, there may be little impact on profits for such asset owners.
Low/zero-emitting units: Many renewable resources (such and wind and solar) have very low operating costs, and typically would be operating (or inframarginal) in the same hours as the gas plant above, and would receive energy market revenues roughly equal to the market price times MWh output. Since the price of energy is higher with the CO2 price in effect, the profits for these low-emitting units are higher. Nuclear and hydro units would experience a similar effect on profits in this hour.
Inefficient coal-fired unit: An inefficient coal unit faces a higher compliance cost than the gas unit in $/MWh since it emits more tons of CO2 per MWh. Yet the impact of the program increases electricity prices only by the $/MWh compliance cost of the unit of the margin (e.g., the gas plant). Thus, the coal unit’s costs increase more than its revenues, so the effect of the program is to decrease profits for this unit. A directionally similar impact would be felt by less efficient natural gas and oil units, to the extent they are operating.
Zero-emitting marginal unit: In hours when the price of energy is set on the margin by a zero-emitting unit (e.g., renewables, nuclear, hydro) – not the typical occurrence – any operating fossil-fueled unit is receiving less profits (than the case without a carbon control requirement), and there is no price increase paid by consumers with respect to the carbon control program.
Given the market-based structure of the wholesale electric systems in these regions, there are strong rationales for State Plans to include market-based mechanisms for controlling carbon emissions. Such approaches could be a single-state or multi-state cap-and-trade program (e.g., like California’s or in the Northeast/MidAtlantic states) or a carbon tax (being considered in some regions in the Pacific Northwest), or a dispatch shadow-price approach (also under discussion in some states in the Midwest).
In wholesale markets where state plans lead to some form of a price on carbon, owners of plants with lower CO2/MWh emission rates will likely increase their output to the extent they can. The changing market price relationships will affect the economic opportunities and profits for existing or emerging electricity market participants – some positively, and some negatively. (See the text box below.)
In addition to the fact that not all compliance costs are passed on to consumers, the way a program is designed and implemented can actually deliver additional program cost reductions. For example, to the extent that State Plans directly or indirectly increase utilities and/or consumers’ investments in
EPA’s Clean Power Plan: State Plans and Consumer Impacts
Analysis Group Page 14
energy efficiency or technology-driven load control or behind-the-meter renewable technologies, the associated reduction in demand for power generation has the effect of lowering CO2 compliance costs, or even producing net benefits for electricity customers. This is because reducing consumptions lowers a business or homeowner’s electricity bill, and lowering total system demand in any hour will tend to reduce the clearing price for power for all users of electricity, whether they themselves invested in an energy efficiency measure or not. This creates opportunities for State Plans to incorporate elements that offset the cost impacts from other compliance actions.
The net effect of such considerations can strongly influence the impact of EPA’s program on electricity costs over time.17 Depending upon the design of State Plans to include energy efficiency, any initial price increases experienced by electricity consumers may be more than offset over time by lower electricity bills. (EPA’s benefit/cost analysis indicates that “average monthly electricity bills are anticipated to increase by roughly 3 percent in 2020, but decline by roughly 9 percent by 2030 because increased energy efficiency will lead to reduced usage.”18 The CATF has proposed an approach to CO2 compliance that would limit price impacts to no more than 2 percent.19 And in its recent analysis of the potential compliance strategies for ERCOT, the Brattle Group found that Texas could meet both resource adequacy and carbon-emissions reduction goals through a combination of increased reliance on gas-fired generation, demand-response, combined heat and power, and energy efficiency at inflation-adjusted prices that resembled those experienced in the 2010-2012 period.20)
From the point of view of state or regional economies, the direct impact of compliance on producer profits and electricity consumer costs is still just one piece of the larger economic puzzle. All of the direct changes in costs, investments, and producer and consumer actions discussed above ripple through the economy in various ways. As the profits of the owners of affected units fall, for example, their spending in the economy drops (e.g., by perhaps deferring spending on operations and maintenance, or by reducing the disposal income of company shareholders), negatively affecting economic activity. The opposite impacts occur when other plants increase their output (e.g., greater demand for and production of natural gas in different regions of the country, with jobs and tax
17 For example, in the RGGI Report we found that: fossil generators’ inclusion of CO2 allowance prices in their offer price tended to change the order of dispatch of various power plants, and tended to increase electricity prices (by less than 1 percent) in the near term; encouragement of energy efficiency; also, the use of the proceeds from auctioning off CO2 allowances to fun energy efficiency investments also altered the load profile, lowered overall demand, and in turn lowered electricity prices (because of avoiding the need to dispatch higher-priced supply on the margin). In these regions, the generation sector as a whole earned less revenues than they would have absent the RGGI program being in place. However, owners of low- and zero-carbon emitting plant gained substantial revenues, while fossil-fired units lost revenues. Since many of the zero-emitting facilities were new renewable generation assets within the affected states, the net effect of the program was to retain a greater share of generation sector revenues within the region, producing local economic benefits (on top of those provided by the local investments in energy efficiency measures). 18 EPA RIA, page ES-24. 19 The CATF Proposal would accomplish this through a combination of several things: providing states with the opportunity to use “mass-based, fossil boiler emission budgets” as an alternative to complying with an emission rate standard; allowing interstate emissions trading; offering states the ability to mitigate retail ratepayer and merchant coal impacts through free allowance allocations (“Giving states an emissions tonnage budget provides states with “free” allowance allocations, the value of which can be used to mitigate ratepayer impacts and compensate merchant coal generators for lost asset value.” CATF Proposal, pages 4, 14. 20 “In inflation-adjusted terms, prices in the Reference scenarios remain within the band observed between 2010 and 2012, from a low of about $42/MWh to a high of about $67/MWh under the strong carbon rule. Importantly, the inclusion of EE, DR, and CHP [energy efficiency, demand response and combined heat and power] in the Phase III scenario reduces the higher-priced carbon rule scenarios, as what would otherwise have been.” See: Ira Shavel, Peter Fox-Penner, Jurgen Weiss, Ryan Hledik, Pablo Ruiz, Yingxia Yang, Rebecca Carroll, and Jake Zahniser-Word (The Brattle Group, “Exploring Natural Gas and Renewables in ERCOT, Part III: The Role of Demand Response, Energy Efficiency, and Combined Heat & Power,” May 29, 2014, pages 6 and 77.

EPA’s Clean Power Plan: State Plans and Consumer Impacts
Analysis Group Page 15
revenues associated with them; potentially greater need for new investment in pipelines, with construction jobs and equipment purchases associated with such infrastructure investment).
Also, where revenues rise for owners of power facilities with zero carbon emissions that previously were undervalued or not sufficiently compensated in electricity markets, an owner may be able to keep the plant open (e.g., a nuclear unit that may have been previously financially challenged) or add new capacity in the future (e.g., a new wind turbine or solar PV system, or an uprate at an existing hydro facility or nuclear plant). Those will have investment and job impacts in their regions.
Where energy efficiency is part of a State Plan, it will tend to increase economic activity in the local economy, through sales of efficient electric devices or insulation, and/or through jobs associated with audits, installations, and other parts of the energy-efficiency supply chain. In some communities, there will be gains in manufacturing of energy-efficient equipment.
On the consumer side, to the extent that program implementation increases electricity costs, consumers will tend to have less disposable income. There are tools that states can use to partially or entirely mitigate the impact of program costs on consumers, and in some cases actually generate consumer and broader net economic benefits. As we explain further below, State Plan designs that flow revenues back to electricity customers (e.g., through a credit on customers’ electricity bills) can mitigate the impact of power supply price increases. Those that lead to increased investment in energy efficiency and lower consumption of electricity are particularly effective in lowering total customer payments for electricity and increasing disposable income (even if there are initial rate increases). Such income effects can increase economic benefits in local economies.
Although most discussions of the EPA’s proposed Clean Power Plan will inevitably focus on costs of compliance, states should consider possible ways to design their State Plans to minimize those costs and increase the economic benefits of reducing CO2 emissions from the power sector. Discussions and analyses that only address the former without paying attention to the latter will lead to incomplete assessments of the proposed Clean Power Plan’s impact on consumers and the economy. A complete story on the impact of program implementation on electricity consumers must include a more review of the overall impact of the program on electricity market infrastructure and pricing dynamics, the investment of program revenues, the changing character of the electric industry (with much-greater investment by utilities, third parties and customers on the customer side of the meter) and the actions and response of electricity consumers. A complete story on the impact on economic productivity and jobs must follow how changes in investment and spending from the program – including producer costs/revenues, consumer income, and program investments – flow through the broader economic setting.

EPA’s Clean Power Plan: State Plans and Consumer Impacts
Analysis Group Page 16
0%
10%
20%
30%
40%
50%
60%
70%
80%
90%
100%
Major Components of U.S. Average ElectricityPrice
Distribution Transmission Generation
Notes & Sources:[1] Average across all customer classes.[2] Does not include any state- or utility-specific charges.[3] U.S. Energy Information Administration, Annual Energy Outlook 2014, Reference Case, Table A8: Electrical Supply, Disposition, Prices and Emissions.
5.9 cents/kWh58%
1.1 cents/kWh11%
3.1 cents/kWh31%
Major Components of U.S. Average Electricity Finally, it is important to keep in mind that the impact of the Clean Power Plan on electricity prices – through increased costs at some power plants – is incomplete in the sense that it examines and over-emphasizes only one part of the electricity cost structure. A typical electricity bill includes other elements besides costs relating to electricity supply – namely, the costs to transmit and distribute electricity to the end user, and costs to manage power system operations and markets. Of the all-in price of electricity (on the basis of the national average cent/kWh), approximately 40 percent of the costs relate to the delivery (distribution and transmission) of electricity, and 60 percent relate to power production. Thus, for a 1-percent change in the price of electricity generation, there will be a smaller change (less than 1 percent) in the bottom-line price of electricity.
Also, where states include in their State Plans a variety of elements that encourage cost-effective energy efficiency, demand-response and renewable projects on customers’ premises, these will tend to lower overall demand for power and in turn lower average cost of electricity supply.

EPA’s Clean Power Plan: State Plans and Consumer Impacts
Analysis Group Page 17
4. PROGRAM DESIGN CONSIDERATIONS: REVIEW OF THE REGIONAL GREENHOUSE GAS INITIATIVE
Overview
How EPA’s proposed Clean Power Plan ultimately impacts consumers and the economy will depend on many things: what a state includes in its plan, how that plan alters demand for electricity, how it affects infrastructure investment and power system operations, and so forth. Given the flexibility that EPA has afforded to the states in its proposed Clean Power Plan, the choices that states make in shaping their State Plans could (and no doubt will) have far-reaching implications not only for CO2 emission reductions, but also for the cost of compliance. What those State Plans include also will affect the cost of electricity for the state’s residents and businesses, and the overall impact of the program on the state’s economic growth, employment, taxes and wages.
To illustrate the potential implications of program design and implementation, we have reviewed the experience of Northeast states in implementing RGGI, the nation’s first CO2 emission control program using a cap-and-trade approach. RGGI is now in its sixth year of operations. While it is a coordinated, multi-state market-based program for the control of CO2 emissions from the power sector, the states’ design for RGGI reserved a significant degree of implementation flexibility for each of the states participating in the program. From the outset, RGGI allowed each state to determine whether and how to allocate or auction emissions allowances to owners of power plants. Because the states implemented the program in various ways, the RGGI experience provides insights about the relationship between program design and outcomes for consumers and the economy.
In this section we summarize key elements of the RGGI program, discuss the findings and implications of a recent economic analysis of RGGI previously conducted by Analysis Group, review program design and spending changes implemented since the time of that prior report, and discuss implications for design considerations in the context of states’ implementation of the proposed Clean Power Plan.
In focusing here on the RGGI story to illustrate how a multi-state, market-based approach has worked, we do not presume that other states would use this particular approach. We recognize that there are various other approaches that different states might use to align CO2-emission reduction goals with electric system operations and distribution of benefits to consumers. RGGI’s experience provides a workable example, from which other states can derive insights about how they might design approaches that work within their own electric-industry contexts.
RGGI Background and Overview
In 2009, ten Northeastern and Mid-Atlantic States began the Regional Greenhouse Gas Initiative as the country’s first market-based program to reduce emissions of CO2 from fossil-fueled power plants equal to or greater than 25 megawatts (MW) in size.21 The concept underlying the design of RGGI was that the participating states could reduce power plant emissions most efficiently (that is, at lowest
21 The ten states are Connecticut, Delaware, Massachusetts, Maryland, Maine, New Hampshire, New Jersey, New York, Rhode Island, and Vermont. On May 26, 2011 New Jersey decided to withdraw from the RGGI program, and has not participated since the end of 2011.

EPA’s Clean Power Plan: State Plans and Consumer Impacts
Analysis Group Page 18
cost) by introducing a price signal on carbon, and in so doing, cause the region’s economic dispatch of power plants to reflect the cost of a tradable carbon-emission allowances along with the other more traditional variable costs of operating power plants (e.g., fuel, operations and maintenance).
Once the RGGI program was designed through a process involving state officials and industry participants over several years, each state that elected to join RGGI obtained authority to do so through its legislature and/or regulatory mechanisms. For example, RGGI developed a ‘model rule’ that outlined the core design elements of the program, and then each state adopted its own enabling authority to allow it to participate. This meant that the participating states did not need to adopt a formal interstate compact under federal law, while still allowing the participating states to establish a coordinated and common mechanism for incorporating a carbon price into their power-system dispatch and operations.
The program initially limited regional emissions to 188 million short tons of CO2 annually across the then ten-state RGGI region. This regional cap was agreed-upon by the participating states and then apportioned to states based largely on CO2 emissions from the affected sources, in accordance with state-specific allowance budgets that were agreed upon by the states.22
The region-wide cap on total CO2 emissions is the only ceiling on emissions.23 In other words, an annual pool of emission allowances was created in an amount equivalent to the regional cap, and each state received a share of allowances that the state could then allocate to market participants. Once the allowances moved from the states’ hands into the market, actual emissions in a state could be higher or lower than that state’s original allowance allocation, as long as the total emissions were consistent with the cap.
In order to comply, every affected power plant must to surrender an allowance for every ton of CO2 emissions it emits over the three-year period. (This process occurs at the end of each three-year compliance period, with the first being for the 2009-2011 period.)
As originally designed, the cap would decline by 2.5 percent per year beginning in 2015, to reach an overall reduction of 10 percent of CO2 emissions by 2018. The states were free to decide how each state’s allowances would be distributed or sold into the hands of power plant owners. In theory, each state could issue them to power plant owners for free, or could sell them into the market, or some combination of both approaches.
Ultimately, however, each RGGI state voluntarily decided to distribute the vast majority of CO2 emission allowances through a common, centralized auction administered by the organization set up by states to run the program (RGGI Inc.). As a result, the owners of affected power plants have obtained CO2 allowances by purchasing them through the initial auctions (held quarterly), or by
22 Thus, this would be different from a multi-state agreement where, under the proposed Clean Power Plan, the EPA established a CO2-emissions-reduction target for each state, and then each cooperating state individually decided to: (a) coordinate its emissions reductions with other states, (b) convert its CO2/MWh emission-rate target into an equivalent mass-based CO2 target (e.g., a CO2 emission budget or cap for each state), and then (c) establish mechanisms through which it would formerly adopt elements in its State Plan to effectuate the common, coordinated and multi-state CO2-emission reduction program. We recognize that such an approach could work in the context of traditional investor-owned utilities that serve portions of several states and that operate as an integrated system, and/or in the context of multi-state competitive markets. See: Susan Tierney, “Greenhouse Gas Emission Reductions From Existing Power Plants Under Section 111(d) of the Clean Air Act: Options to Ensure Electric System Reliability,” May 8, 2014. 23 Under some circumstances, the regional cap could increase (i.e., if CO2 allowance prices hit a particular dollar level, at which point the program would issue new allowances held in reserve for that purpose).

EPA’s Clean Power Plan: State Plans and Consumer Impacts
Analysis Group Page 19
purchasing/transferring them in a secondary market once those allowances move into the system via the auction process.
Approximately 99 percent of allowances have been initially distributed via RGGI auctions. Participation in the auctions is open to any company or person meeting qualification requirements (e.g., financial security requirements), with a ceiling of 25 percent placed on purchases by a single buyer or group of affiliated buyers in each auction.
Proceeds from the quarterly auctions – which are determined by quantities sold and auction clearing price (subject to a reserve (floor) price) – are distributed to states, and states determine how to use the funds. Since the initial allowance auction took place at the end of 2008, and up through the most recent auction. As of June 4, 2014, total revenues from the sale of CO2 allowances has amounted to $1.4 billion. (See Appendix 2.)
The proceeds from the quarterly auctions have flowed through to the individual states in proportion to each state’s share of the cap.
The use of auction proceeds has varied across the states and over time, consistent with the enabling state legislation, regulation, and policy. Examples of how the states used their share of the RGGI funds include:
investment in energy efficiency programs, a credit on each customer’s electricity bills, funding of state government operations through allocation to state general funds, investment in community-based installation of renewable or advanced power generation
systems, education and job training programs, and other greenhouse gas reduction initiatives.
Additionally, a small portion of the proceeds have supported administrative costs for the RGGI program. As explained further below, the vast majority of RGGI funds have been reinvested in energy efficiency in part to mitigate the impact of the program on wholesale electricity prices and consumer electricity costs.
Analysis of RGGI’s Economic Impacts
In late 2011, we published a report examining, among other things, the consumer cost and economic impacts of RGGI’s implementation over its first three years (the first compliance period from 2009-2011).24 The purpose of that report was to review program implementation, quantify the impact of the program on wholesale electricity markets (power prices, emissions trends, operations), review the various ways in which states reinvested allowance auction proceeds, examine impacts on customers’ electricity prices, and estimate the economic impacts of program implementation on each of the RGGI states. The AG RGGI Report was designed to evaluate program performance in order to provide insights and observations that could be useful in evaluating past policy decisions and in the development of future policy design changes.
24 AG RGGI Report.

EPA’s Clean Power Plan: State Plans and Consumer Impacts
Analysis Group Page 20
In that report, we tracked the path of RGGI-related dollars through the supply chain: we observed the payments that owners of affected units made to purchase CO2 allowances and how those allowances affected the prices at which those power plant owners were willing to sell power. We examined the implications of those allowance prices on changes in the production costs of different types of power plants, and then on their dispatch. We observed the changes in allowance prices in the quarterly auctions, along with the amounts of auction proceeds that went to each state after each auction. We tracked how each state chose to spend those proceeds over time. Where states spent auction proceeds to implement energy efficiency, we examined the types of programs they supported and the impacts of those programs on the demand for electricity over time. Our analysis relied on actual data on allowance pricing, actual fossil fuel prices, revenues, state disbursement and expenditures.
Using a comprehensive power sector production-cost model (GE MAPS), we compared the electric system’s demand, power plant dispatch, emissions, and overall cost first using the “real world” conditions which represented the “with RGGI” scenario. We compared it to a “without RGGI” scenario in which we backed out the price of emissions allowances and the effect of investments of RGGI dollars in energy efficiency and renewable energy, and identified how this changed power plant dispatch, production costs, and emissions. Taking the results of the “with RGGI” and “without RGGI” analyses, we then modeled the impacts on the states’ economies by using the IMPLAN input/output model. That latter analysis also examined the implications for different states’ economies of their choices to use the RGGI auction proceeds for energy efficiency versus general-fund support versus credits on customers’ electricity bills and other uses.
Our analysis reached the following conclusions about the states’ implementation of RGGI during its initial three years of operation:25
RGGI produced in total $1.6 billion in net present economic value (NPV) for the ten-state region, representing on average approximately $33 per capita in net economic benefits (i.e., taking costs into consideration). The use of auction proceeds for public purposes (e.g., giving customers a credit on their electricity bill, paying for energy efficiency measures to help reduce consumers’ electricity use and electricity bills) offset the modest increase in electricity prices associated with the RGGI program and led to myriad positive economic spillover effects. Examples included the increased purchasing power associated with lower electricity bills, the economic impacts of spending money to hire people to perform energy audits or install solar panels, and the benefits to businesses of increased sales of energy efficiency equipment). Our analysis reflected both direct spending benefits and indirect multiplier effects locally and regionally.
The economic benefits resulted from the fact that when the states auctioned off the allowances (rather than giving them to power plant owners for free), the revenues from the program could be used for public benefit. This allowed states to retain associated revenues for public use, with outcomes that provided substantial fiscal, consumer, and environmental benefits. (Note that in the ten RGGI states, the electric industry was restructured over a decade ago, so that most power plants are not owned by electric utility companies. Had the states given away the allowances for free to the owners of power plants, the value of those allowances would have gone to the shareholders of those companies, rather than to consumers of electricity in competitive wholesale markets. This influenced the decisions of states to use an auction to move the allowances into the
25 AG RGGI Report, pages 2-8.
EPA’s Clean Power Plan: State Plans and Consumer Impacts
Analysis Group Page 21
hands of power plant owners, leaving the states with the opportunity to use the monetary value of those allowances for the public benefit.)
Over the first three years, RGGI led to over 16,000 additional jobs (job-years) with each of the ten states showing net job additions. Jobs related to RGGI activities are located around the economy, with examples including engineers who perform efficiency audits, workers who install energy efficiency measures in commercial buildings, staff performing teacher training on energy issues, and other things.
CO2 allowances tended to increase electricity prices by less than 1 percent in the near term, but over time – as the RGGI states invested a substantial amount of the allowance proceeds on energy efficiency programs that led to lower electricity use – the program results in lower electricity prices and lower consumer payments for electricity. This resulted because the system avoided having to run some of the more expensive power plants, and thus lowered wholesale prices, plus consumers had lower electricity bills as demand went down. The analysis found reduced electricity expenditures equaling approximately $1.1 billion over a ten-year period, reflecting an average savings of $25 for residential consumers, $181 for commercial consumers, and $2,493 for industrial consumers. Consumers of natural gas and heating oil saved another $174 million, because some of the energy efficiency programs had the collateral effect of lowering use of those other heating services
Although owners of fossil-fuel power plant owners raised their prices to reflect the cost of having had to purchase CO2 emission allowances (and thus most of these owners ended up recovering at least some of their RGGI compliance costs), over time the market for their product (i.e., sales of electricity) ended up being lower than it would have been without RGGI, because of the states’ use of auction proceeds to fund energy efficiency and lower demand. Also, among power plants, those with zero or low carbon emissions (such as renewable facilities or nuclear plants) received financial benefit for this attribute through revenues in electric energy markets.
The scope of RGGI’s positive economic benefits varied by state and region, with those states investing the heaviest in energy efficiency realizing significantly higher economic benefits.
The form of CO2 controls – namely, a market-based program – worked seamlessly within the Northeast’s wholesale electricity market structures and produced relatively efficient compliance costs in those markets.
The states’ use of allowance proceeds not only provided economic benefits, but also helped them meet a wide variety of social, fiscal, and environmental policy goals, such as assisting low-income customers, achieving advanced energy policy goals, addressing state and municipal budget challenges, and restoring wetlands. Even so, how allowance proceeds were used strongly affected their economic impacts, with energy efficiency investment standing out as the use with the highest local economic benefits. For example, use of RGGI dollars to invest in energy efficiency ended up lowering regional electrical demand, lowering electricity prices, and lowering all consumers’ payments for electricity (not just those who installed energy efficiency measures). These savings on electricity bills flowed through the economy as increased consumer disposable income (from fewer dollars spent on energy bills), lower payments to out-of-state energy suppliers, and increased local spending or savings.

EPA’s Clean Power Plan: State Plans and Consumer Impacts
Analysis Group Page 22
RGGI helped the Northeast states lower total fossil-fired power production and lower use of natural gas and oil for heating, thereby reducing the total dollars sent out of state for energy resources.
RGGI Program Developments Since the 2011 AG RGGI Report
Since the time we concluded our analysis of the first three years of the RGGI program, it has continued to evolve in several ways.
For example, the states undertook a comprehensive program review in 2012, examining program success and impacts, the effects of imports and emissions leakage, the integrity of the offset program, and whether additional reductions beyond 2018 should be implemented. That program review was completed in February 2013, and involved a comprehensive assessment of program design issues, a modeling of potential future RGGI program levels, CO2 allowance prices, impacts on electricity prices and customer bills, and the region’s economy.26
Based on its review, the RGGI states made a number of technical changes and improvements designed to build on past experience and to strengthen the program moving forward, the most significant of which was the decision to reduce the 2014 regional CO2 emission cap by 45 percent, from 165 million to 91 million tons, with an additional annual decline beyond that of 2.5 percent per year from 2015 to 2020.27 The decision to reduce the cap reflected all states’ positive association with program implementation and the environmental and economic benefits flowing from the program’s first three years.
Overall, revenue generation through RGGI Auctions has remained strong, and states have continued to invest in ways that likely generate cost savings and economic benefits for residents and businesses. For example, in the initial period analyzed in the AG RGGI Report (2009 - 2011), RGGI collected and the states spent approximately $620 million through allowance sales, across all current RGGI states.28 In just the subsequent two years, states have already collected and spent approximately $440 million, reflecting in particular an increase in allowance prices. See Figure 1.
26 Program impacts were modeled under a fully vetted reference case as well as a number of key sensitivities related to natural gas prices, electricity demand, and changes to existing generation infrastructure. 27 Other changes included: Adjusting the CO2 emissions cap to address the private bank of allowances held by participating entities, and the retirement of existing
unsold 2012 and 2013 allowances; Instituting of a cost-containment reserve (CCR) of CO2 allowances to help moderate price impacts, whereby CCR allowances would
be made available for sale should the CO2 allowance prices exceed certain pre-established price levels; Updating the RGGI offsets program, including a new forestry protocol; Requiring regulated entities to acquire and hold a portion of required allowances throughout each compliance period; and Committing to assessing tools to monitor for emissions associated with electricity imports and developing a mechanism to address
such import emissions. RGGI Inc., “RGGI States Propose Lowering Regional CO2 Emissions Cap 45%, Implementing a More Flexible Cost-Control Mechanism,” Press Release, February 7, 2013. 28 For the purpose of consistency in our comparisons of the first and (to-date) second compliance periods, we exclude New Jersey from these values.

EPA’s Clean Power Plan: State Plans and Consumer Impacts
Analysis Group Page 23
Figure 1
From 2009-2011 (Compliance Period 1), roughly half (52 percent) of allowance revenues across the region were invested in energy efficiency programs and measures. The other uses were: 17 percent for credits on electricity customers’ electricity bills (and primarily low-income consumers); 15 percent used to offset state budget challenges; 11 percent for either clean and renewable energy investments or CO2 mitigation measures; and 5 percent to cover program administrative costs. See Figure 2.
More recently (in 2012-2013), the RGGI states have spent more of their auction proceeds on energy efficiency. Based on the insights we gained from the prior AG Study, we think that this will increase the overall economic benefits of the RGGI program. Based on those two most recent years (2012 and 2013), there has been a 25-percent increase in states’ spending on energy efficiency (most recently at 68 percent of the total auction revenues of approximately $440 million), with additional increases in spending on clean and renewable energy (12 percent) and greenhouse gas abatement (8 percent), and no use of auction revenues for contribution to states’ general funds.29 See Figure 2.
29 Charts and values for all states’ spending in Compliance Period 1 and Compliance Period 2 (to-date) are contained in Appendix 1.

EPA’s Clean Power Plan: State Plans and Consumer Impacts
Analysis Group Page 24
Figure 2
Across the RGGI region, about half of funds went to energy efficiency during first three years of the RGGI program (i.e., in Compliance Period 1). But in some states (especially in New England), virtually all allowance proceeds were spent in that category. For example, Massachusetts spent approximately 93 percent of auction revenues on energy efficiency in the first Compliance Period, and has essentially maintained that level of energy-efficiency spending over the past two years (92 percent). See Figure 3. For New England as a whole, Compliance Period 1 spending on energy efficiency amounted to approximately 89 percent of total auction revenues, with a similar level since that time (88 percent).
These factors had important implications for the level of state economic benefits derived from RGGI program implementation. We found that level of economic benefits (net economic value added, and jobs) per dollar of auction revenue spent was highest in those states in regions with the greatest level of reinvestment of auction proceeds on energy efficiency.
Therefore, all else equal, the recent trend in the second Compliance Period (2012-2013) towards use of auction proceeds for energy efficiency investment will lead to increased economic benefits across the RGGI states.

EPA’s Clean Power Plan: State Plans and Consumer Impacts
Analysis Group Page 25
Figure 3
Implications for Clean Power Plan Compliance
The RGGI experience may provide important insights as states develop their State Plans and consider alternative compliance approaches. EPA’s Clean Power Plan invites states to explore market-based mechanisms and to attempt to participate in multi-state CO2 reduction programs. One option for the states that now participate in RGGI would be to include this program as part of their State Plans.30 In addition, other states could elect to join RGGI (with corresponding changes in the cap and the state budget allocations). Other states may elect to set up a single-state cap-and-trade program or establish a new one in concert with other states. Some states served by electric-utility affiliates of a single holding company could establish a cap on the emissions of that company’s power plants in the several states, and then allow it to operate its power plants (as now) as an integrated system, allowing the company to dispatch its plants economically with also taking system security as well as carbon emissions into account.
Insights from the RGGI experience are relevant for other states as they consider market-based approaches. But there are wider lessons for other approaches, as well. There are a number of
30 We expect that the RGGI states would need to make technical changes in the RGGI program design, once the final Clean Power Plan is adopted by EPA, if some aspects of RGGI would not otherwise meet EPA’s requirements (e.g., as to the level of the cap, or the existence of a cost-containment mechanism that allows electric companies to purchase more allowances if prices hit a particular ceiling price).
EPA’s Clean Power Plan: State Plans and Consumer Impacts
Analysis Group Page 26
potential additional compliance approaches and mechanisms suggested by EPA (or that states might develop on their own) that could involve the investment of compliance fees or charges on affected units that could operate in ways akin to market-based mechanisms. States can look at the RGGI experience to inform their own choices regarding these various ways to introduce some sort of real or shadow prices on carbon emissions from power plants.
We note, for example, the a number of observations, based on our review of the economic impacts of the RGGI program and our research on ratemaking policies of states:
Market-based mechanisms offer important opportunities to minimize costs while also reducing CO2 emissions from existing power plants.
States can implement such market-based programs within state boundaries.
Moreover, states can work together – and with the stakeholders within each state – to develop and implement workable multi-state programs to control CO2 emissions from existing power plants, in ways that fully preserve the rights of each state.
Such multi-state, market-based mechanisms to control CO2 emissions can respect the practicalities of electric system operations, and can be seamless integrated into both traditionally regulated and competitive electric industry settings.
States with vertically integrated utilities have other tools, including integrated resource planning processes, for identifying least-cost compliance strategies.
Pricing carbon will help send efficient signals for new investment in resources (like zero-carbon technologies such as renewables, hydro facilities, and nuclear power plants, and in deeper energy efficiency measures) and for shifting power system operations toward power plants with lower carbon emissions. This result is likely true whether pricing carbon is accomplished through a market-based mechanism like RGGI or alternative compliance mechanisms.
Market-based mechanisms – like RGGI or California’s cap-and-trade program – can also provide opportunities for states to capture the economic value of CO2 emission allowances and direct those revenues for public and social benefit. In states with restructured electricity markets, states may choose to rely on methods to move CO2 emission allowances into the market that avoid windfalls to owners of power plants. For the RGGI states, this has been accomplished through auctioning of CO2 allowances. In other states (whether they have a traditional utility industry or a restructured market), another competitively neutral way to provide public/consumer benefits would be to allocate allowances for free to electric distribution utilities, who then can sell them to power generators and capture the revenues for consumers.31
Including cost-effective energy-efficiency programs as part of states’ CO2 compliance strategies can help deliver significant benefits to customers and to local economies. The RGGI states have used the proceeds from selling CO2 allowances to produce such benefits while offsetting compliance costs. Many other states have experience in using energy efficiency as part of a least-cost utility resource plan. As electricity prices tend to rise with CO2 compliance, states should
31 See, for example, Conrad Schneider, “Power Switch: An Effective, Affordable Approach to Reducing Carbon Pollution from Existing Fossil-Fueled Power Plants,” Clean Air Task Force, February, 2014, with accompanying technical analysis by Bruce Phillips, “ Alternative Approaches for Regulating Greenhouse Gas Emissions from Existing Power Plants under the Clean Air Act: Practical Pathways to Meaningful Reductions,” The NorthBridge Group, February 2014.

EPA’s Clean Power Plan: State Plans and Consumer Impacts
Analysis Group Page 27
expect to see more opportunities for cost-effective energy efficiency – and can use ratemaking tools to create financial incentives for utilities to pursue them.
No matter what set of approaches a state considers including in its State Plan, state utility regulators will be in a position to weigh the cost implications of various programs and do what they can to encourage efficient and least-cost compliance options so as to minimize impacts on electricity consumers. This is discussed in Section 5, below.

EPA’s Clean Power Plan: State Plans and Consumer Impacts
Analysis Group Page 28
5. FAIRNESS AND PROTECTION OF CONSUMERS
Overview
We know that potential electricity price impacts from the EPA’s proposed Clean Power Plan will be the subject of intense attention: electricity costs can affect the competitiveness of businesses, particularly those engaged in energy-intensive activities, with implications for economic output and jobs. Increases and decreases in electricity rates and costs affect the disposable income of all residents, with ramifications tied to quality of life, ability to meet other financial obligations, and the degree of spending in the general economy. Lower-income individuals spend a disproportionate share of annual income on energy costs, and any increases in electricity costs to those customers can create genuine hardship, drawing away income that is otherwise needed for other basic necessities, and cost increases often lead to an increase in uncollected revenues for utilities.
Although there is not a direct relationship between program compliance costs and impacts on consumers’ payments for electricity, it is still important to consider ways to minimize costs and protect consumers as much as possible from potential price increases. Careful attention to this issue can positively influence the design and implementation of State Plans. The lessons learned from the states’ experience with RGGI program, for example, illustrate how the design and operations of that CO2 reduction program led to net benefits for electricity customers and for those states’ economies.
But state planning for implementation of CO2 emission-control plans should not (and likely will not) stop with State Plan design. States can also use their long-standing experience in utility ratemaking principles and practices to ensure that the costs and benefits of CO2 program compliance are distributed fairly among different types of customers. State can take steps to ensure that, to the maximum extent feasible, that compliance costs are minimized and that lower-income customers, in particular, are protected fairly.
In this context, states already have the tools to address and fairly manage the distribution of compliance program costs and benefits among customers. These tools are a standard part of ratemaking by state regulators around the country. We review these tools here, to remind states that in the end, these ratemaking issues will be part of how they roll out implementation of CO2-control programs affecting their power industry and electricity consumers in their states.
In this section, we provide a brief overview of the legal and/or regulatory foundation for setting electricity rates, and consider how and to what extent public utility commissions (PUC) appear to manage investments in (and benefits of) energy efficiency programs and measures in that context. Second, we review how the federal government, states, and PUCs consider the specific challenges faced by lower-income consumers.
Our review of these issues is based on our prior experience and research into utility ratemaking, an understanding of relevant precedent and policies in most U.S. states, and the preparation of case studies for about half of the states in the U.S. The specific states

EPA’s Clean Power Plan: State Plans and Consumer Impacts
Analysis Group Page 29
on which we focused (shown in shading on the map to the right) represent a diverse cross-section of states by geography (covering virtually every region of the U.S.), by electric industry structures (competitive, investor-owned utilities, municipal electric utilities, and electric cooperatives), by type of local economy (e.g., industrial, rural), and by power plant mix (e.g., dominated by coal, or gas, or hydro/nuclear, or more of a mix). We summarize our research and findings here, and include the individual state case studies in Appendix 4.
Electric Ratemaking to Allocate Costs and Benefits “Fairly and Equitably” (with a focus on energy efficiency programs)
Electric customers will pay for some of the costs of CO2 compliance in a number of ways that are overseen by state utility regulators and/or boards of public power utilities. For example:
In states where the utility owns fossil-fuel power plants directly affected by the proposed EPA Clean Power Plan and where consumers pay a ‘bundled’ price for power, consumers’ rates will reflect the utility’s compliance costs (as approved by state regulators/utility boards and consistent with least-cost ratemaking principles). States in this category include much of the Western states, the Plains states and Upper Midwest, the Southeast.
In states with a restructured electric industry (e.g., Texas, Illinois, Ohio, the MidAtlantic and Northeast states), electricity customers that obtain power supply through default service offered by the distribution utility will pay electricity prices that reflect CO2 compliance costs included in competitive power supplier purchases in wholesale electricity markets, which are regulated by the Federal Energy Regulatory Commission and to some degree are influenced by local state policies (e.g., for renewable energy).
In states that choose to include energy efficiency as part of a State Plan, state PUCs (and in some instances, state efficiency providers) will play an important role in those programs.
In most states, utility regulators endeavor to set utility rates in a manner that allocates costs to those customers whose usage patterns cause the costs to be incurred in the first place. For example, customers whose usage tends to increase during peak periods when relatively expensive power-production costs occur tend to end up having rates that reflect those peaking power costs. Relatively arcane but important ratemaking methodologies to align rates with costs are the bread-and-butter of regulators’ ratemaking work.
Through general rate cases and other ratemaking proceedings, PUCs routinely evaluate utility investments and expenses, determine what portion of these should be borne by shareholders and what portion by customers, allocate such costs in a manner that approximates cost incurrence, and design the resulting rates so as to recover approved costs in a way that encourage efficiency in utility operations and management of costs.
The obligation of PUCs to fairly and equitably allocate investments and expenses of regulated utilities is typically encoded in law, regulations, policies, and/or judicial precedent. Guidance is sometimes prescriptive, and other times general, but for many decades public utility regulation has followed the obligation to allocate costs and benefits in a manner that follows this concept, often phrased as “fair and equitable,” “not unduly preferential,” “just and reasonable,” “non-discriminatory,” etc. Table 1 provides a sampling of legal or regulatory language included in the statutes and/or decisions of state PUCs. Appendix 4 contains more detailed summaries for the states included in our case studies.
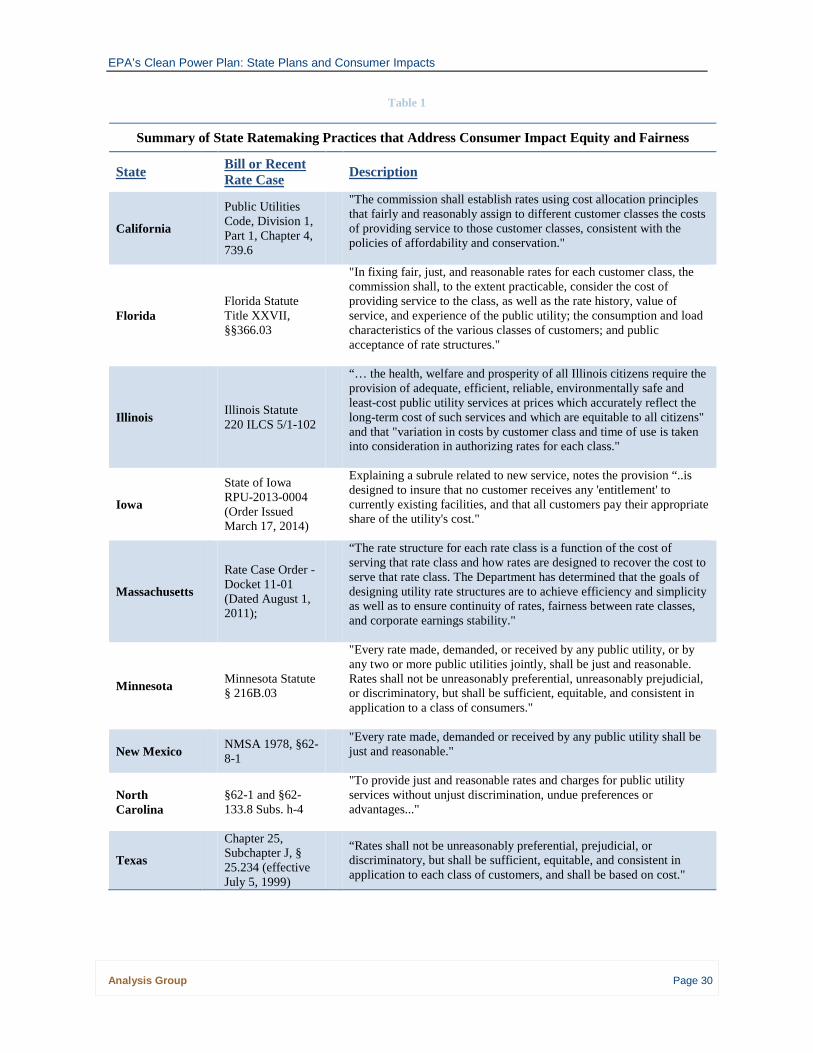
EPA’s Clean Power Plan: State Plans and Consumer Impacts
Analysis Group Page 30
Table 1
Summary of State Ratemaking Practices that Address Consumer Impact Equity and Fairness
State Bill or Recent
Rate Case
Description
California
Public Utilities Code, Division 1, Part 1, Chapter 4, 739.6
"The commission shall establish rates using cost allocation principles that fairly and reasonably assign to different customer classes the costs of providing service to those customer classes, consistent with the policies of affordability and conservation."
Florida
Florida Statute Title XXVII, §§366.03
"In fixing fair, just, and reasonable rates for each customer class, the commission shall, to the extent practicable, consider the cost of providing service to the class, as well as the rate history, value of service, and experience of the public utility; the consumption and load characteristics of the various classes of customers; and public acceptance of rate structures."
Illinois
Illinois Statute 220 ILCS 5/1-102
“… the health, welfare and prosperity of all Illinois citizens require the provision of adequate, efficient, reliable, environmentally safe and least-cost public utility services at prices which accurately reflect the long-term cost of such services and which are equitable to all citizens" and that "variation in costs by customer class and time of use is taken into consideration in authorizing rates for each class."
Iowa
State of Iowa RPU-2013-0004 (Order Issued March 17, 2014)
Explaining a subrule related to new service, notes the provision “..is designed to insure that no customer receives any 'entitlement' to currently existing facilities, and that all customers pay their appropriate share of the utility's cost."
Massachusetts
Rate Case Order - Docket 11-01 (Dated August 1, 2011);
“The rate structure for each rate class is a function of the cost of serving that rate class and how rates are designed to recover the cost to serve that rate class. The Department has determined that the goals of designing utility rate structures are to achieve efficiency and simplicity as well as to ensure continuity of rates, fairness between rate classes, and corporate earnings stability."
Minnesota
Minnesota Statute § 216B.03
"Every rate made, demanded, or received by any public utility, or by any two or more public utilities jointly, shall be just and reasonable. Rates shall not be unreasonably preferential, unreasonably prejudicial, or discriminatory, but shall be sufficient, equitable, and consistent in application to a class of consumers."
New Mexico NMSA 1978, §62-
8-1
"Every rate made, demanded or received by any public utility shall be just and reasonable."
North Carolina
§62-1 and §62-133.8 Subs. h-4
"To provide just and reasonable rates and charges for public utility services without unjust discrimination, undue preferences or advantages..."
Texas
Chapter 25, Subchapter J, § 25.234 (effective July 5, 1999)
“Rates shall not be unreasonably preferential, prejudicial, or discriminatory, but shall be sufficient, equitable, and consistent in application to each class of customers, and shall be based on cost."
EPA’s Clean Power Plan: State Plans and Consumer Impacts
Analysis Group Page 31
Specifically with respect to energy efficiency programs, PUCs typically consider fairness and equity considerations when approving utility spending on and collection of costs for energy efficiency programs and measures. However, although most states have some type of energy efficiency program operated by a utility (or a third-party energy efficiency entity, whose costs are paid for by electricity customers), ratemaking practices for “fairness and equity” in the design and implementation of energy-efficiency programs varies widely across the states. Typically, ratemaking and program design operate in parallel to assure a “fair and equitable” mix of energy efficiency programs and costs for different types of customers.
Table 2 presents for each state a breakdown of energy efficiency spending by rate class, compared to the overall level of revenues collected from rate classes to cover all utility costs. Appendix 3 contains a summary and state-specific charts showing energy efficiency spending and overall electric utility revenues by rate class.
We observe the following with respect to ratemaking practices and energy efficiency program design across the states:
Most states have at least some experience with reviewing and approving expenditures for implementation of energy-efficiency programs and measures, across all rate classes, and many states have developed energy-efficiency programs and precedent over many years, even decades.
In states with significant energy-efficiency expenditures, programs are implemented across all major customer classes.
Across the country, the percentage of spending on energy efficiency is roughly equivalent to the breakdown of revenues collected from each customer class. As shown in Table 2, the average dollars spent on residential, commercial, and industrial rate classes for energy efficiency programs is roughly 46 percent, 40 percent, and 14 percent, respectively – which is close to the total revenues collected for overall utility service from each rate class (45 percent, 37 percent, and 18 percent, respectively).
The types of energy-efficiency programs operated in a state vary across states. This may reflect, in part, that states have very different mixes and types of residential, commercial and industrial customers. It may also be due to the fact that in many states the energy savings benefits do not necessarily match the level of expenditures. For example, programs reaching large commercial and industrial customers may realize higher benefit/cost ratios than programs reaching smaller commercial and residential customers. In this case, the relative portion of total energy-efficiency spending may be smaller for large customers at the same time that total savings resulting from such spending are much higher.
Even in states with a long history of having supported energy efficiency programs paid for in electricity customers’ rates, PUCs are still finding that there are cost-effective opportunities to get further electric system savings. As electricity prices change over time, additional cost-effective energy-efficiency opportunities also increase.
.

EPA’s Clean Power Plan: State Plans and Consumer Impacts
Analysis Group Page 32
Table 2
State Energy Efficiency Spending by Customer Class Compared to Revenues 2012
State
Residential Commercial Industrial Total
Alabama
$9,172 $4,625 $24,131 $37,928
Alaska
$363 $148 $0 $511
Arizona
$65,678 $70,216 $409 $136,303
Arkansas
$18,670 $9,834 $40,696 $69,200
California
$488,578 $559,873 $144,861 $1,193,312
Colorado
$44,040 $67,717 $13,452 $125,209
Connecticut
$58,083 $47,665 $14,742 $120,490
Delaware
$1,860 $0 $0 $1,860
District of Columbia
$8,423 $8,760 $0 $17,183
Florida
$281,810 $100,270 $43,436 $425,516
Georgia
$30,794 $13,128 $11,344 $55,266
Hawaii
$2,328 $4,555 $185 $7,068
Idaho
$15,859 $15,734 $32,540 $64,133
Illinois
$78,368 $75,671 $2,658 $156,697
Indiana
$59,112 $20,475 $13,880 $93,467
Iowa
$45,851 $25,852 $51,943 $123,646
Kansas
$10,767 $3,427 $5,869 $20,063
Kentucky
$29,318 $8,358 $2,307 $39,983
Louisiana
$1,065 $3 $0 $1,068
Maine
$7,630 $9,356 $4,579 $21,565
Maryland
$161,184 $66,413 $280 $227,877
Massachusetts
$114,872 $74,881 $42,373 $232,126
Michigan
$71,543 $63,338 $11,008 $145,889
Minnesota
$78,367 $94,601 $52,695 $225,663
Mississippi
$3,725 $1,567 $5,052 $10,344
Missouri
$17,576 $16,020 $254 $33,850
Montana
$6,270 $9,112 $15 $15,397
Nebraska
$6,413 $7,197 $7,741 $21,351
Nevada
$20,013 $15,461 $0 $35,474
New Hampshire
$9,447 $10,888 $339 $20,674
New Jersey
$48,397 $12,867 $3,067 $64,331
New Mexico
$14,890 $10,501 $2,250 $27,641
New York
$116,235 $338,506 $31,836 $486,577
North Carolina
$84,693 $55,883 $12,510 $153,086
North Dakota
$8,263 $9,618 $1,998 $19,879
Ohio
$71,711 $56,782 $36,361 $164,854
Oklahoma
$26,155 $12,118 $1,866 $40,139
Oregon
$40,587 $49,355 $29,584 $119,526
Pennsylvania
$140,410 $89,219 $60,161 $289,790

EPA’s Clean Power Plan: State Plans and Consumer Impacts
Analysis Group Page 33
State
Residential Commercial Industrial Total Rhode Island
$20,227 $18,740 $11,486 $50,453
South Carolina
$41,125 $19,832 $12,562 $73,519 South Dakota
$4,206 $1,701 $1,082 $6,989
Tennessee
$22,789 $15,544 $19,097 $57,430 Texas
$121,730 $78,628 $7,381 $207,739
Utah
$24,578 $14,708 $8,567 $47,853 Vermont
$14,474 $19,346 $0 $33,820
Virginia
$21,184 $6,614 $716 $28,514 Washington
$99,204 $85,276 $21,447 $205,927
West Virginia
$2,970 $2,749 $205 $5,924 Wisconsin
$40,351 $30,600 $46,831 $117,782
Wyoming
$1,784 $1,762 $1,288 $4,834
Average Spending (%)
46% 40% 14%
Average Rate Class Revenues (%)
45% 37% 18%
Notes & Sources:
[1] Electric power sales, revenues, and energy efficiency Form EIA-861 detailed data files, U.S. Energy Information Administration, Electricity, available at http://www.eia.gov/electricity/data/eia861/, accessed May 10, 2014. [2] Energy efficiency spending includes costs associated with both Energy Efficiency and Load Management Programs as reported in EIA data. [3] "Average Spending (%)" shows the arithmetic mean of state percentages for EE revenues/costs by customer class. [4] "Average Rate Class Revenues (%)" takes the sum of customer class revenues/costs from all states and divides by the total EE revenue/costs from all states.

EPA’s Clean Power Plan: State Plans and Consumer Impacts
Analysis Group Page 34
Protecting Lower-Income Consumers
At least in the initial periods of CO2-compliance programs, electricity prices are expected to increase slightly – with longer-term impacts reversing over time. (EPA’s benefit/cost analysis estimates that “Average monthly electricity bills are anticipated to increase by roughly 3 percent in 2020, but decline by roughly 9 percent by 2030 because increased energy efficiency will lead to reduced usage.”32) Even modest increases in electricity costs can have a disproportionate impact in the budgets of lower-income customers.
States have many tools to address cost impacts on lower-income customers, and have been using various approaches for many years. In Appendix 4, state summaries contain detailed descriptions of various programs to assist low-income customers, including the Low Income Home Energy Assistance Program (LIHEAP), the use of special discounted electricity rates for low-income customers, arrearage forgiveness and arrearage management plans, utility-sponsored charitable assistance programs, and dedicated funds for the targeted implementation of comprehensive electric and gas energy-efficiency programs in low-income residences.
Two important findings emerge from our review of the various commitments states have made to protect low-income customers: First, there is widespread application of low-income assistance across the country. There is broad reliance on the federal LIHEAP program across states, and virtually all states have various programs to help low-income customers with electricity costs. These will tend to dampen the impacts of CO2 compliance costs on these consumers’ electricity bills; in fact, in some states the existence of capped rates for low-income customers could limit or even eliminate the effect of any potential compliance cost increases on low-income customers.
Second, among the states, there are various ‘best-practice’ low-income assistance approaches. States can draw lessons from each other’s practices to design and administer programs to protect lower-income consumers. Examples drawn from the states included in Appendix 4 include the following:
LIHEAP Funding for heating and utility bill assistance, and low-income home weatherization, administered by states with federal funding, at times supplemented with separate state funding;
Low-Income Rates, providing fixed discounts or caps on the rates that may be charged eligible low-income customers;
Dedicated Funding for Low-Income Energy Efficiency Programs, requiring utility spends or minimum contributions to the installation of energy-efficiency programs and measures in the building units or residences of low-income customers;
Arrearage Management, providing for discounting, contributions towards, or elimination of utility bill amounts in arrears for customers meeting minimum program requirements (such as making installment payments or staying current on bills going forward);
Utility-Driven Charitable Contribution Programs, encouraging contributions through utility bill stuffers to funds that help low-income customers pay energy bills;
Disconnect/shut-off Protection, whereby PUCs require extensive processes be followed by utilities before low-income customers may be disconnected for lack of bill payment; and
32 EPA RIA, page ES-24.

EPA’s Clean Power Plan: State Plans and Consumer Impacts
Analysis Group Page 35
Miscellaneous One-Time or Emergency Assistance Programs instituted by states to help low-income customers maintain energy services, pay bills, or otherwise acquire service.
State Tools to Manage Potential Program Cost Impacts
States have various traditional ratemaking tools that will help them allocate costs related to CO2 compliance in fair and equitable ways among customer classes. Additionally, states have considerable experience in designing energy efficiency programs to align program support with program benefits. Finally, states have deep experience in designing and using various mechanisms to protect lower-income customers.
States are well equipped through long-standing application of ratemaking principles and practices governing cost allocation fairness and equity, the pursuit of widely-distributed benefits from energy efficiency program implementation, and a comprehensive and diverse set of programs and policies recognizing and addressing the disproportionate impact of energy costs on low-income customers.

EPA’s Clean Power Plan: State Plans and Consumer Impacts
Analysis Group Page 36
6. CONCLUSION On June 2, 2014, the EPA released proposed rules to reduce emissions of CO2 from existing fossil power plants. EPA’s Clean Power Plan would require significant reductions in CO2 emissions from the power sector, while also providing each state the flexibility to determine its preferred way to comply with the new requirements.
The costs associated with EPA’s Clean Power Plan will likely be the focus of intense discussion in the coming months. EPA’s analysis indicates that although there will be costs to comply with the Clean Power Plan, such costs will be much lower than the benefits to public health and to the overall economy from lower CO2 and other air emissions. Yet others are suggesting that costs will outweigh benefits.
Clearly, State Plans approved by the EPA will create the framework for the industry’s compliance with EPA’s Clean Power Plan. How compliance plans are designed by the states will strongly affect the magnitude and distribution of costs and benefits among consumers, power plant owners, and the general economy. Regulatory practices for passing on costs to electricity consumers are also important, as they can influence the degree and allocation of program costs and benefits.
Based on our analysis and experience, we believe that the impacts on electricity rates from well-designed CO2-pollution control programs will be modest in the near term, and can be accompanied by long-term benefits in the form of lower electricity bills and positive economic value to states’ and regional economies.
We base our findings on the analysis conducted for this Report, in which we review the experience and expertise states have to prepare State Plans with a focus on lowering overall compliance costs and maximizing program economic benefits to consumers and to the states’ economies.
There are sound reasons to be confident that customers will benefit from states’ plans to lower the carbon intensity of their electric systems. First, and foremost, states have a long track record of using various regulatory and other policy tools to encourage utility programs and investments that minimize the cost of electric service, consistent with the myriad of public policies (tax, environmental, reliability, labor, and other areas of policy that affect the provision of electricity).
Second, under the proposed Clean Power Plan, states will have the flexibility, experience and tools to prepare and implement State Plans that fit their circumstances, minimize costs of compliance, and provide benefits to customers. Although states differ in many ways – including in terms of the electric systems, their regulatory culture, and their electric industry structure –all states have programs, policies and practices that will allow them to develop plans that align well with their different circumstances
Third, market-based mechanisms offer unique opportunities to minimize costs while also reducing CO2 emissions from existing power plants. They can be done within a state or across a number of states. Pricing carbon in this way sends efficient, market-based signals for investment and operation of the electric system. Experience shows that such programs can be designed to achieve a number of state policy objectives, can lower electricity bills, and can deliver positive net economic benefits.
Fourth, states are well equipped through long-standing utility ratemaking principles and practices and implementation of energy programs to help protect low-income customers when electricity costs increase. Such tools include low-income rates and arrearage management plans, dedicated funding for low-income energy-efficiency and weatherization programs, utility-driven charitable contribution

EPA’s Clean Power Plan: State Plans and Consumer Impacts
Analysis Group Page 37
programs, one-time emergency assistance programs, LIHEAP funding for heating and utility bill assistance, and disconnect/shut-off protection policies.
In the end, the states are in control. State energy, environmental and utility regulatory agencies will tailor compliance approaches to their individual circumstances, and in doing so will play a significant role in driving down and managing the costs of Clean Power Plan compliance through their plans. Those State Plans will define the set of actions that will work together to reduce emissions from fossil power plants. The components of the State Plans will affect compliance costs and collateral benefits. And states’ regulatory and ratemaking policies can influence how compliance actions undertaken by owners of power plants and other actors translate into increases or decreases in electricity rates and bills to different types of consumers.
We are confident that, based on a long history of state policymaking focused on similar issues, and on the experience states have with a number of tools directly relevant to the task, states will successfully and fairly navigate implementation of EPA’s Clean Power Plan.

i
Greenhouse Gas Emission Reductions From Existing Power Plants Under Section 111(d) of the Clean Air Act: Options to Ensure Electric System Reliability
Susan F. Tierney, Ph.D. Analysis Group, Inc. May 8, 2014

Analysis Group, Inc. Page | 2
Table of Contents Introduction and Executive Summary........................................................................................................... 1
Regulating GHG Emissions from Existing Power Plants under Section 111(d) of the Clean Air Act ............. 7
How does Section 111(d) of the CAA work? .............................................................................................. 9
The likely character of EPA’s guidance under CAA Section 111(d) .......................................................... 13
Section 111(d) Differs from Other Recent EPA Regulations Affecting Power Plants .............................. 16
The MATS Rule .................................................................................................................................... 16
How Section 111(d)’s Framework Differs from the MATS Rule .......................................................... 18
Power plants that are subject to CAA Section 111(d) ............................................................................. 20
Context for Industry Compliance with CAA Section 111(d) Requirements ................................................ 23
Natural gas, coal and existing power plants ........................................................................................... 23
Outlook for electricity demand ............................................................................................................... 28
Availability of zero-carbon supply from nuclear generators ................................................................... 34
Responses to EPA MATS regulations ....................................................................................................... 38
New Generating Capacity Proposals ....................................................................................................... 43
Implications of the Changing Electricity Resource Mix ........................................................................... 44
Planning for Compliance with EPA Guidance Under Section 111(d) of the CAA ........................................ 46
Breadth of Options Available to the States in Developing Section111(d) SIPs ....................................... 46
Inside the Fence Options .................................................................................................................... 47
Outside the Fence Options ................................................................................................................. 49
Outside-the-Fence Models Approaches: Examples to ensure reliable and economic compliance in states with different electric industry structures ............................................................................... 56
Outside-the-Fence Models Approaches: Collateral policies ............................................................... 65
Conclusions ................................................................................................................................................. 66

Electric System Reliability and GHG Emission Reductions Under CAA Section 111(d) – May 2014
Analysis Group, Inc. Page | 1
Electric system reliability: “The degree to which the performance of the elements of the electrical system results in power being delivered to consumers within accepted standards and in the amount desired. Reliability encompasses two concepts, adequacy and security. Adequacy implies that there are sufficient generation and transmission resources installed and available to meet projected electrical demand plus reserves for contingencies. Security implies that the system will remain intact operationally (i.e., will have sufficient available operating capacity) even after outages or other equipment failure. The degree of reliability may be measured by the frequency, duration, and magnitude of adverse effects on consumer service.”
Energy Information Administration.
Introduction and Executive Summary
In June 2014, the U.S. Environmental Protection Agency (“EPA”) is expected to propose guidance to the states for reducing greenhouse gas (“GHG”) emissions from existing fossil-fuel power plants. Final guidance is expected a year later, with requirements that each state develop and submit a state implementation plan (“SIP”) for how the state would prefer to achieve such emissions reductions at the power plants in its state. While the Clean Air Act’s Section 111 identifies many criteria for setting the emissions standard and for states’ development of SIPs to achieve it, an important additional objective not mentioned in the Act but still important for the nation is assuring that such plans will not jeopardize electric system reliability.
This paper addresses whether EPA’s actions to regulate GHG emissions from existing power plants will give rise to electric system reliability problems,1 and explains why it will not.
Industry participants have often raised concerns about potential electric system reliability impacts from major new EPA regulations affecting power plants. This was a major issue in 2010 to 2012, for example, in many parties’ comments on EPA’s proposals to control mercury and air toxic emissions (the “MATS” rule). Reliability concerns have already been raised in relation to EPA’s upcoming regulation of GHG emissions from existing power plants.2
1 The North American Electric Reliability Corporation (“NERC”) further explains the adequacy component of reliability: “The ability of the electric system to supply the aggregate electrical demand and energy requirements of the end-use customers at all times, taking into account scheduled and reasonably expected unscheduled outages of system elements.” In this paper, I focus on reliability in the bulk-power system, which NERC defines as: “(A) facilities and control systems necessary for operating an interconnected electric energy transmission network (or any portion thereof); and (B) electric energy from generation facilities needed to maintain transmission system reliability. The term does not include facilities used in the local distribution of electric energy….The bulk power electric system is routinely planned and operated so as to perform reliably under normal and abnormal conditions.” http://www.nerc.com/files/glossary_of_terms.pdf. 2 See, for example, hearings held on November 14, 2013, before the House Energy and Commerce Subcommittee on Energy and Power, and comments made by panelists at the February 12, 2014 meeting of the National Association of Regulatory Utility Commissioners (“NARUC”).

Electric System Reliability and GHG Emission Reductions Under CAA Section 111(d) – May 2014
Analysis Group, Inc. Page | 2
Historically, the reliability red flag3 has tended to be raised with regard to concerns that compliance with a new environmental rule would require a large portion of generating capacity to be simultaneously out of service to add control equipment, to retire permanently, or otherwise to become unavailable to produce power.4 To date, implementation of new environmental rules has not produced reliability problems, in large part because the industry has proven itself capable of responding effectively. A very mission-oriented industry, composed of electric utilities, other grid operators, non-utility energy companies, federal and state regulators, and others, has taken a wide variety of steps to ensure reliability.5
Regarding the upcoming EPA regulations of GHG emissions from existing power plants, reliability concerns are misplaced. It is broadly understood – including by President Obama6 3 In recent years, many Congressional hearings have addressed the implications of EPA regulations for electric system reliability. For example: hearings before the House Energy and Commerce Subcommittee on Energy and Power (December 5, 2013; May 9, 2012; and September 14, 2011); the November 1, 2011 hearing before the House Oversight and Government Reform Committee; and the June 30, 211 hearing before the Senate Environment and Public Works Subcommittee on Clean Air and Nuclear Safety. In 2010/2011, NERC published major assessments of electric system reliability and EPA regulations. . 4 This, for example, was how the issue came up in discussions of EPA’s acid rain regulations in the early 1990s and in proposals for how Northeast states would reduce sulfur dioxide (“SO2”), and nitrogen oxides (“NOx”) emissions from existing power plants. In such cases, key questions were whether the electric industry (and its supply chains) could respond in a timely way to regulatory requirements while also ensuring that the lights stay on at all times in every part of the affected regions of the U.S. This was the framing of reliability concerns in recent years when EPA agency proposed the combination of regulations affecting cross-state transport of NOx (e.g., the “Cross-State Air Pollution Rule” (“CSAPR”) and toxic air pollution (e.g., the MATS rule)). 5 For example, the Federal Energy Regulatory Commission (“FERC”) has authority under the Energy Policy Act of 2005 to ensure reliability in the bulk power systems, and has delegated to the NERC (as the National Reliability Organization) the responsibility for setting reliability standards. For decades, states have supervised – and continue to do so – utilities and others’ planning for long-term resource adequacy. I previously described these processes, norms, requirements, and other elements of the mission-oriented culture of the industry: “The U.S. electric industry has a proven track record of doing what it takes to provide the reliable power supplies. Regulated electric utilities, competitive electric companies, grid operators, and regulators have a strong mission orientation, along with regulatory requirements, which together ensure that reliable electricity supply is a priority. For many decides, the U.S. electric industry has developed institutions, operating and planning requirements, system plans, operating approaches, emergency response protocols, and billions of dollars of investment to assure reliable electricity supply. The industry is keenly aware that the American economy and standard of living depend upon reliable power supplies…. With some notable exceptions, utilities and other electric companies and their workers, investors, and suppliers, have provided what Americans take for granted and what public officials insist upon: that electricity be reliably available around the clock, with increasing levels of environmental performance to assure worker and community safety and public health. ….The electric industry has responded well in prior periods (such as the mid-1990s) when Clean Air Act requirements led to investments in new pollution-control equipment and new additions to generating capacity. There were no reliability problems arising from those actions, in spite of concerns raised that there would be equipment shortages and difficulties adding control equipment on so many power plants in a constrained period of time.” Testimony of Susan Tierney, Before the U.S. Senate Environment and Public Works Committee. Subcommittee on Clean Air and Nuclear Safety, June 30, 2011 (Oversight Hearing: Review of EPA Regulations Replacing the Clean Air Interstate Rule (CAIR) and the Clean Air Mercury Rule (CAMR)). 6 The June 35, 2013 “Presidential Memorandum -- Power Sector Carbon Pollution Standards” states that “In developing standards, regulations, or guidelines … {EPA] shall ensure, to the greatest extent possible, that you: …(v) ensure that the standards are developed and implemented in a manner consistent with the continued provision of reliable and affordable electric power for consumers and businesses…”

Electric System Reliability and GHG Emission Reductions Under CAA Section 111(d) – May 2014
Analysis Group, Inc. Page | 3
and the EPA’s Administrator7 – that regulatory actions to reduce threats to public health and the environment from power generation cannot occur at the expense of reliable power supply.
Moreover, EPA will be relying on a portion of the Clean Air Act (“CAA”) – Section 111(d) – to regulate GHG emissions from existing power plants. Section 111(d)’s regulatory framework creates an entirely different and potentially much wider set of compliance and implementation options compared to other recent federal regulatory initiatives applicable to the electric industry. Section 111(d)’s ‘cooperative federalism’ model provides for much more compliance flexibility and creativity than was possible for the many unit-specific regulations issued by EPA in the past two decades. This is core to understanding why EPA’s regulation of GHG emissions from existing power plants will not jeopardize electric system reliability.
In the recent MATS rule, for example, EPA set uniform national standards to reduce emissions from different categories of existing coal- and oil-fired power plants. No trading or averaging is allowed across different generating stations. There is no possibility of purchasing credits resulting from over-compliance at other sources, or to credit emissions reductions resulting from end-use efficiency or zero-carbon energy sources.
By contrast with MATS, Section 111(d) inherently allows greater opportunities for different pathways to compliance. Section 111(d) relies on the SIP process. This means that EPA will provide states with guidance allowing considerable and wide-ranging latitude in how they plan to meet EPA’s requirements. EPA’s guidance will not likely impose a standard that must be met solely by actions taken at each affected unit. Rather, EPA is likely to establish standards specific to each state, based on the “degree of emission limitation achievable through the application of the best system of emission reduction,” which may vary across states in light of their own particular circumstances. And in its SIP, each state will have flexibility to propose its own preferred actions to accomplish the targeted reductions, as long as the plan provides reductions across the facilities in the state that are at least as effective as EPA’s approach.8 This language “supports the use of market-based mechanisms” and other alternatives in ways that
7 See, for example: Statement of Gina McCarthy, Nominee for the Position of Administrator of the EPA, Before the Environment and Public Works Committee, U.S. Senate, April 11, 2013; Testimony of Gina McCarthy before the FERC, Reliability Technical Conference, Docket Number AD12-1-000, November 30, 2011. 8 Section 111(d) directs EPA to “prescribe regulations which shall establish a procedure similar to that provided by section 110 under which each State shall submit to the Administrator a plan….” As explained in Section 110 (a)(2)(A) of the Act, a SIP shall (among other things), “(A) include enforceable emission limitations and other control measures, means, or techniques (including economic incentives such as fees, marketable permits, and auctions of emissions rights), as well as schedules and timetables for compliance, as may be necessary or appropriate to meet the applicable requirements of this chapter.”

Electric System Reliability and GHG Emission Reductions Under CAA Section 111(d) – May 2014
Analysis Group, Inc. Page | 4
are not possible under the statutory language governing MATs, which required each affected generating station to have emissions at or below the allowed emissions rates.
If a state has concerns about the reliability implications of compliance with EPA guidance, the state can take that fact into account as it designs its SIP and its schedule/timetable for individual units’ compliance so long as the overall emission reduction required by the guideline has a firm deadline and is achieved. For example, a state could propose plan elements that enable early action/compliance at some Section 111(d) generating units in exchange for allowing more time for others, or that allow for deeper reductions at one unit in exchange for lighter reductions at another. Thus, the inherent authority within Section 111(d) removes the reliability red flag in this case, as long as the EPA, the states, and the industry take appropriate and timely steps.
States may consider diverse options as they plan for cost-effective emissions reductions while also ensuring electric system reliability. Some of the options may take place “inside the fence” of generating units covered by Section 111(d), while others might focus more on interactions of those plants’ emissions in light of changes in power demand, transmission and generation:
Inside the fence: Examples include: heat-rate improvements; fuel switching; averaging of emissions within a single station; and changes to the operating permit of existing power plants to limit emissions over some averaging period.
Outside the fence: Examples include: emission reductions achieved through changes in the overall dispatch of existing generating resources and/or level of demand on the system: emission-averaging among multiple power plants; state carbon budgets with an emissions cap-and-trade program; multi-state electric-system dispatch practices of grid operators; demand-side reductions; adoption of clean energy standards; and/or transmission upgrades to open up access to underutilized, low-carbon facilities.
Other factors also allow for cost-effective emissions reductions at Section 111(d) units in ways that do not adversely affect system reliability. A significant amount of existing generating capacity is underutilized. For example, output at natural-gas fired combined-cycle power plants averaged approximately 50 percent in 2012. There is the potential to reduce overall demand through energy efficiency, thus reducing the need to dispatch plants with relatively high emission rates. There is potential to add additional low or zero-carbon electricity supply (e.g., wind and solar; combined heat and power; nuclear uprates). Actions also can be taken to extend the life of, or increase the output from, well-performing generating units that produce no emissions at the facility (e.g., hydroelectric resources, nuclear plants). These various resources

Electric System Reliability and GHG Emission Reductions Under CAA Section 111(d) – May 2014
Analysis Group, Inc. Page | 5
offer significant flexibility and optionality to states as they prepare a SIP suited to their own circumstances and conditions (including reliability concerns).
As they develop SIPs in response to the EPA’s Section 111(d) guidance, the states start from a position of great diversity in their electric power industries. These differences show up in the character of the power plants located in each state, the electric industry structure, the CO2 emissions from existing power plants, renewable energy potential, reliance on in-state versus out-of-state power resources, the outlook for demand growth, mix of public policies affecting power plants, and many other differences. This will likely lead to varied approaches in SIP designs. (See the Appendix 2 for the generating units in each state that are directly affected by Section 111(d) requirements, along with information about other generating resources and their capacity factors in 2012.)
To envision how differently situated states might shape their compliance strategies to assure both electric system reliability and compliance with upcoming EPA guidance, this paper concludes with a handful of examples representing ways that states could consider shaping their SIPs to suit their own conditions. The examples address options for states with traditionally regulated electric industries, and for states whose electric companies participate in an organized interstate wholesale electric market managed by a regional transmission organization (“RTO”). The GHG control options include: inter-facility emissions trading for plants owned by a common owner in a single state or in multiple states with traditional electric industry structure; inter-state trading among plants owned by multiple owners in traditionally regulated states; reliance on a state-wide emissions budget combined with other mechanisms to allow emissions averaging across plants located within a single-state or multi-state RTO; and use of collateral programs to support cost-effective emissions reductions (such as clean energy standards, renewable portfolio standards, energy efficiency programs, transmission enhancements, and others). All of these provide extensive opportunities for innovative SIP elements that can accommodate cost-effective environmental compliance, alignment with economic principles underpinning electric industry structure and market design, while maintenance of electric system reliability.
The bottom line: there is no reasonable basis to anticipate that EPA’s guidance, the states’ SIPs and the electric industry’s compliance with them will create reliability problems for the power system, as long as EPA and the states plan appropriately and take timely actions to assure electric-system reliability in their plans. Section 111(d) affords states considerable latitude to mitigate and otherwise resolve reliability concerns.

Electric System Reliability and GHG Emission Reductions Under CAA Section 111(d) – May 2014
Analysis Group, Inc. Page | 6
To explain how I reached this conclusion, this paper covers the following topics:
the federal/state regulatory framework under Section 111(d) of the CAA; how Section 111(d)’s reliance on the preparation of SIPs makes this regulatory
framework inherently different from other recent environmental regulations affecting existing power plants, and provides more compliance options and greater flexibility;
the types of power plants directly affected by the GHG reduction policies, with differences among fleets in various regions of the country;
conditions in the electric industry (such as the outlook for demand, fuel prices, plant additions and retirements) that set the stage for the industry’s future compliance with GHG regulations for existing plants;
the breadth of tools that may be available to the states as they consider what to include in their SIPs;
the factors that states may take into account to assure electric system reliability as part of their compliance strategies;
examples of ways to design compliance strategies in different industry contexts; and
the overall implications of Section 111(d) compliance for maintaining electric system reliability.
Electric System Reliability and GHG Emission Reductions Under CAA Section 111(d) – May 2014
Analysis Group, Inc. Page | 7
Regulating GHG Emissions from Existing Power Plants under Section 111(d) of the Clean Air Act
Under the CAA, the control of GHG emissions from existing power plants fits within a larger framework in which EPA regulates air pollution from mobile and stationary sources. Section 111(d) sets forth the process through which EPA will regulate GHG emissions from existing power plants, which account for 40 percent of total CO2 emissions in the U.S.,9 and one out of every 15 tons of CO2 emitted anywhere in the world.10
Much has been written about the overall framework under which GHG emissions may be regulated under the CAA.11 These analyses depict the process now underway:
9 Based on 2011 data, the most recent available in the EPA’s “Inventory of U.S. Greenhouse Gas Emissions and Sinks: 1990-2011,” April 12 2013, Table 2-3 (Recent Trends in U.S. Greenhouse Gas Emissions and Sinks) and Table 2-4 (Emissions from Energy). 10 The U.S. emitted 5,433,056 kt of CO2, out of the total 33,615,389 kt of CO2 emitted globally in 2010. The U.S.’s CO2 emissions were 16 percent of the global amount. http://data.worldbank.org/topic/climate-change. Assuming electric power accounts for 40 percent of U.S. CO2 emissions (from the EPA GHG Inventory data), then electric power production in the U.S. accounted for 6.5 percent of global CO2 emissions in 2010. 11 For example, see: Dan Lashof, et. al., “Cleaner and Cheaper: Using the Clean Air Act to Sharply Reduce Carbon Pollution from Existing Power Plants, Delivering Health, Environmental, and Economic Benefits,” NRDC, March 2014; Clean Air Task Force, “Power Switch: An Effective, Affordable Approach to Reducing Carbon Pollution from Existing Fossil-Fueled Power Plants,” February 2014, with accompanying analysis (Bruce Phillips, The Northbridge Group,“ Alternative Approaches for Regulating Greenhouse Gas Emissions from Existing Power Plants under the Clean Air Act: Practical Pathways to Meaningful Reductions,” February 27, 2014); Comments of the Attorneys General of New York, California, Massachusetts, Connecticut, Delaware, Maine, Maryland, New Mexico, Oregon, Rhode Island, Vermont, Washington, and the District of Columbia on the Design of a Program to Reduce Carbon Pollution from Existing Power Plants, December 16, 2013; White Paper to EPA from 18 State Attorneys General, “Perspective of 18 States on Greenhouse Gas Emission Performance Standards for Existing Sources under § 111(d) of the Clean Air Act,” November 2013; Megan Ceronsky and Tomas Carbonell, “Section 111(d) of the Clean Air Act: The Legal Foundation for Strong, Flexible & Cost-Effective Carbon Pollution Standards for Existing Power Plants,” Environmental Defense Fund, October 2013; Christopher Van Atten, “Structuring Power Plant Emissions Standards Under Section 111(d) of the Clean Air Act – Standards for Existing Plants,” MJ Bradley & Associates, October 2013; James McCarthy, “EPA Standards for Greenhouse Gas Emissions from Power Plants: Many Questions, Some Answers,” Congressional Research Service, September 30, 2013; National Climate Coalition, “Using EPA Clear Air Act Authority to Build a Federal Framework for State Greenhouse Gas Reduction Programs,” September 2013; Scott Schang, ed., Old Laws, New Tricks: Using the Clean Air Act to Curb Climate Change (Environmental Law Institute, August 19, 2013); Kyle Danish, Stephen Fotis, Doug Smith, Ilan Gutherz, “EPA Regulation of Greenhouse Gas Emissions from Existing Power Plants: Issues and Options,” Van Ness Feldman, June 27, 2013; Daniel A. Lashof, et. al., “Closing the Power Plant Carbon Pollution Loophole: Smart Ways the Clean Air Act Can Clean Up America’s Biggest Climate Polluters,” March 2013; Nicholas Bianco and Franz Litz, “Reducing Greenhouse Gas Emissions in the United States: Using Existing Federal Authorities and State Action,” World Resources Institute, February 2013; Jeremy Tarr, Jonas Monast and Tim Profeta, “Regulating Carbon Dioxide under Section 111(d) of the Clean Air Act: Options, Limits, and Impacts,” Nicholas Institute, Duke University, January 2013; Georgetown Climate Center, “Issue Brief for the States: EPA’s Forthcoming Performance Standards for Regulating Greenhouse Gas Pollution from Power Plants (Clean Air Action Section 111),” September 2011; Gregory E. Wannier, Jason A. Schwartz, Nathan Richardson, Michael A. Livermore, Michael B. Gerrard, and Dallas Burtraw, “Prevailing Academic View on Compliance Flexibility under § 111 of the Clean Air Act,” Resources for the Future, July 2011; Pew Center on Global Climate Change, “GHG New Source Performance Standards for the Power Sector: Options for EPA and the States,” March 17, 2011.

Electric System Reliability and GHG Emission Reductions Under CAA Section 111(d) – May 2014
Analysis Group, Inc. Page | 8
The U.S. Supreme Court’s 2007 holding that “greenhouse gases fit well within the [Clean Air] Act’s capacious definition of ‘air pollutant’.”12
The EPA Administrator’s finding in 2009 that current and projected concentrations of GHGs “in the atmosphere threaten the public health and welfare of current and future generations.”13
The President’s 2009 pledge at the United Nations Climate Change Conference that by 2020, America would reduce its GHG “emissions in the range of 17 per cent by 2020” compared with 2005 levels.14
The President’s 2013 Climate Action Plan and Presidential Memorandum directing the EPA to take steps under Section 111(d) authority to reduce carbon pollution from existing power plants,15 and to do so through engaging directly with the states (“as they will play a central role in establishing and implementing standards for existing power plants”) and other stakeholders.16
12 549 U.S. 497 (2007). 13 74 Fed. Reg. 66496 (December 15, 2009) (Environmental Protection Agency, Endangerment and Cause or Contribute Findings for Greenhouse Gases Under Section 202(a) of the Clean Air Act). 14 White House Press Release, Remarks by the President in the Morning Plenary Session of the United Nations Climate Change Conference, Copenhagen, December 18, 2009. 15 The President’s Climate Action Plan, June 2013; White House, Presidential Memorandum -- Power Sector Carbon Pollution Standards, June 25, 2013. 16 “Carbon Pollution Regulation for Modified, Reconstructed, and Existing Power Plants. To ensure continued progress in reducing harmful carbon pollution, I direct you to use your authority under sections 111(b) and 111(d) of the Clean Air Act to issue standards, regulations, or guidelines, as appropriate, that address carbon pollution from modified, reconstructed, and existing power plants and build on State efforts to move toward a cleaner power sector.” White House, Presidential Memorandum -- Power Sector Carbon Pollution Standards, June 25, 2013. The Memorandum also directs that EPA “(ii) consistent with achieving regulatory objectives and taking into account other relevant environmental regulations and policies that affect the power sector, tailor regulations and guidelines to reduce costs; (iii) develop approaches that allow the use of market-based instruments, performance standards, and other regulatory flexibilities; (iv) ensure that the standards enable continued reliance on a range of energy sources and technologies; (v) ensure that the standards are developed and implemented in a manner consistent with the continued provision of reliable and affordable electric power for consumers and businesses; and (vi) work with the Department of Energy and other Federal and State agencies to promote the reliable and affordable provision of electric power through the continued development and deployment of cleaner technologies and by increasing energy efficiency, including through stronger appliance efficiency standards and other measures.”

Electric System Reliability and GHG Emission Reductions Under CAA Section 111(d) – May 2014
Analysis Group, Inc. Page | 9
Clean Air Act:
Section 111(d) Standards of performance for existing sources; remaining useful life of source [excerpts]
(1) The Administrator shall prescribe regulations which shall establish a procedure similar to that provided by section 110 under which each State shall submit to the Administrator a plan which (A) establishes standards of performance for any existing source for any air pollutant (i) for which air quality criteria have not been issued …, and (B) provides for the implementation and enforcement of such standards of performance. Regulations of the Administrator under this paragraph shall permit the State in applying a standard of performance to any particular source under a plan submitted under this paragraph to take into consideration, among other factors, the remaining useful life of the existing source to which such standard applies.
Section 111(a) Definitions [excerpts] For the purposes of this section:
(1) The term “standard of performance” means a standard for emissions of air pollutants which reflects the degree of emission limitation achievable through the application of the best system of emission reduction which (taking into account the cost of achieving such reduction and any non air quality health and environmental impact and energy requirements) the Administrator determines has been adequately demonstrated…..
(See Appendix 1 for additional statutory language from Section 111 of the CAA)
How does Section 111(d) of the CAA work?
Regulation of one third of the nation’s GHG emissions (i.e., from existing fossil power plants) will take place through a portion of the CAA that is used infrequently. Section 111(d) only applies to pollutants (like GHGs) not regulated elsewhere in the law. Most air pollutants emitted from power production – including emissions of sulfur dioxide (“SO2”), nitrogen oxides (“NOx”), and air toxics like mercury – are specifically covered by other parts of the CAA. The electric industry, the states and many other stakeholders have become familiar with regulatory approaches related to those other pollutants over several decades.
Section 111(d) has only been used to control emissions for five categories of existing sources of emissions17 and never for a pollutant that is so pervasive (as CO2) in the U.S. and globally. Thus it is thus relatively ‘new’ to the EPA, as well as to the regulated industry and the states.
That said, the upcoming regulatory process is not entirely unfamiliar to the states. Section 111(d) calls for EPA to use “a procedure similar to that provided by section 110.” Section 110 is a well-established “cooperative federalism” framework that has been relied upon for decades to ensure that EPA’s National
17 Section 111(d) has been used previously for regulating: landfill gases from municipal solid waste landfills; acid mist from sulfuric acid plants; flourides from phosphate fertilizer plants; flourides from primary aluminum plants; and total reduced sulfur from kraft pulp plants. Source: “Overview presentation of Clean Air Act Section 111,” http://www2.epa.gov/carbon-pollution-standards/what-epa-doing.

Electric System Reliability and GHG Emission Reductions Under CAA Section 111(d) – May 2014
Analysis Group, Inc. Page | 10
Ambient Air Quality Standards (“NAAQS”) are met and maintained for six common air pollutants (known as ‘criteria pollutants’). Under Section 110, “EPA uses its expertise to determine what the NAAQS should be, and the states are delegated the authority to determine how the NAAQS will be achieved.”18 In essence, the ‘cooperative federalism’ framework of Section 111(d) can be thought of one in which EPA identifies the destination (e.g., ambient air quality), and states determine what route they want to take to get there.19 In the past, the states (typically through their state air regulatory agency) have developed SIPs to demonstrate how they will address ground-level ozone (smog), particulate emissions, SO2, NOx, and other criteria pollutants to meet the national air standards.20 Thus, state air regulators have considerable experience with such SIP processes.21
In various presentations, statements and other documents, EPA has provided strong indications of how it intends to move forward under the Section 111(d) framework. The process is expected to involve the following steps and elements:22
- EPA Guidance: EPA issues guidance to the states with respect to the “best system of emissions reductions” (“BSER”) from existing power plants. This guidance will likely establish the target CO2 tonnage reductions, or reductions in CO2 emission rates per megawatt-hour (“MWh”), that each individual state must achieve at affected generating units through its SIP.
18 Jonas Monast, Tim Profesta, Brooks Rainey Pearson, and John Doyle, “Regulating Greenhouse Gas Emissions from Existing Sources: Section 111(d) and State Equivalency,” 42 ELR 10206, March 2012 (hereinafter “Monast et. al. (2012)”). 19 Susan Tierney, “Section 111(d) of the Clean Air Act: Drivers of Power Sector CO2 Reductions,” presentation to the Bipartisan Policy Center Workshop on GHG Regulation of Existing Power Plants under the Clean Air Act: Policy Design and Impacts, December 6, 2013. 20 The States “develop a general plan to attain and maintain the NAAQS in all areas of the country and a specific plan to attain the standards for each area designated nonattainment for a NAAQS. These plans, known as State Implementation Plans or SIPs, are developed by state and local air quality management agencies and submitted to EPA for approval.” http://www.epa.gov/oar/urbanair/sipstatus/index.html 21 See, for example, EPA’s website that tracks the status of each state’s SIP for each criteria pollutant. As is apparent there, SIPs include elements that are added or changed over time. http://www.epa.gov/oar/urbanair/sipstatus/reports/map_s.html. 22 This description is drawn from various documents, including from the EPA’s website and its “Overview presentation of Clean Air Act Section 111”( http://www2.epa.gov/carbon-pollution-standards/what-epa-doing); EPA Office of Air and Radiation, “Considerations in the Design of a Program to Reduce Carbon Pollution from Existing Power Plants,” September 23, 2013 version (hereinafter “EPA Design Considerations 2013”); EPA, “Background on Establishing New Source Performance Standards (NSPS) Under the Clean Air Act,” October 2013, http://www.epa.gov/region9/air/listening/BackgroundEstablishingNewSourcePerformance Stds.pdf; EPA, Office of Air Quality Planning and Standards (“OAQPS”), “Rulemaking for Greenhouse Gas Emissions from Electric Utility Steam Generating Units,” Tribal Consultation, May 2011 (hereinafter “OAQPS GHG Presentation”).

Electric System Reliability and GHG Emission Reductions Under CAA Section 111(d) – May 2014
Analysis Group, Inc. Page | 11
Guidance will be developed through EPA’s normal rulemaking process with a notice-and-comment period (including a Regulatory Impact Assessment), and with “binding requirements that states are required to address when they develop plans to regulate existing sources in their jurisdictions.”
The guidance will come first in proposed form (by June 1, 2014), and then in final form (by June 1, 2015).
The Presidential Memorandum requests that EPA guidelines require that States submit to EPA their SIPs by no later than June 30, 2016.
EPA’s guidance will likely set the target reductions for states to use in developing their implementation plans with performance standards that apply to the power plants subject to Section 111(d) (the “affected sources” of GHG emissions). Consistent with prior Section 111(d) rules, “EPA believes that its guidelines should identify for sources and states the required level(s) of performance prior to plan submittal.”23 Based on prior EPA guidance under Section 111(d), the GHG guidance is likely to contain:24
o A description of BSER that has been adequately demonstrated for a particular category of sources (taking into account feasibility, cost, emissions reductions, and technology development issues); 25 the degree of emission limitation achievable, costs and benefits, and environmental impacts of application; and a goal for reductions based on the BSER analysis.
o No specific prescribed technologies that must be used to comply.
23 EPA Design Considerations 2013. 24 Sources for these points: EPA, “Background on Establishing New Source Performance Standards (NSPS) Under the Clean Air Act,” October 2013, http://www.epa.gov/region9/air/listening/BackgroundEstablishingNewSourcePerformanceStds.pdf; “Overview presentation of Clean Air Act Section 111”(http://www2.epa.gov/carbon-pollution-standards/what-epa-doing); OAQPS GHG Presentation; Monast et. al. (2012). 25 Senior EPA officials have stated that the particular BSER the agency adopts for existing sources of GHG emissions will not be the same as the one it adopted for new power plants, although the BSER criteria EPA takes into account are similar. (See the statement of Acting Administrator for Air and Radiation Janet McCabe before the House Energy and Commerce Subcommittee on Energy and Power (November 14, 2013)). The application of the criteria to new versus existing power plants is what would lead to different BSER targets. In EPA’s proposed Standards of Performance for Greenhouse Gas Emissions from New Stationary Sources: Electric Utility Generating Units” (dated September 2013), EPA explains the factors that are to be considered in identifying the BSER: “For this rulemaking [under Section 111(b)], the following factors are key: feasibility, costs, size of emission reductions and technology. Feasibility …whether the system of emission reduction is technically feasible. Costs…whether the costs of the system are reasonable. Size of emission reductions…the amount of emissions reductions that the system would generate. Technology…whether the system promotes the implementation and further development of technology.” Page 25 of the signed prepublication version of 40 CFR Part 60 [EPA-HQ-OAR-2013-0495; FRL-9839-4] RIN 2060-AQ91, EPA, Standards of Performance for Greenhouse Gas Emissions from New Stationary Sources: Electric Utility Generating Units, September 20, 2013 (hereinafter “EPA 2013 Proposed GHG Standards for New EGUs”).

Electric System Reliability and GHG Emission Reductions Under CAA Section 111(d) – May 2014
Analysis Group, Inc. Page | 12
o A stated performance standard using a rate of allowed emissions that is met on a facility-by-facility basis (although EPA has discretion to set performance standards for classes of power plants based on an allowed rate of emissions (e.g., pounds of CO2 per MWh) or a total mass of emissions (e.g., a CO2 tonnage budget for a state)).26
o Timelines for implementing its guidelines. o “Different guidelines or compliance times (or both)…for different sizes, types,
and classes of designated facilities when costs, physical limitations, geographical location, or other factors make sub-categorization appropriate.”
o Proposed model rules or a “model approach” to facilitate development of SIPs, but the states need not adopt any particular approach.
- State SIPs: States prepare their plans and implement the elements of approved SIPs:
In parallel with EPA’s development and issuance of proposed and final guidelines, a state may begin to plan its SIP, informed by increasingly more concrete information provided through the process and adopted in the final EPA guidance.
A state’s SIP, due to be filed at EPA one year after EPA finalizes its guidance, will describe how the state proposes to satisfy the EPA guidance, either through adopting the EPA approach (if one is provided) or through a program that would provide equivalent emissions reductions achieved via elements preferred by the state.
A SIP may need to contain, for example: o “Emission standards and compliance schedules ‘no less stringent than emission
guidelines’,”27 with the regulations (under Section 110) allowing for equivalency where the resulting emission limit is quantifiable, accountable, and enforceable, and (based upon replicable procedures) is equivalent to the SIP limit.28
o Methods and procedures for determining compliance.29 o Enforceable increments of progress for compliance schedules longer than 12
months.30
26 Megan Ceronsky and Tomas Carbonell, “Section 111(d) of the Clean Air Act: The Legal Foundation for Strong, Flexible & Cost-Effective Carbon Pollution Standards for Existing Power Plants,” Environmental Defense Fund, October 2013. 27 OAQPS GHG Presentation. 28 57 Fed. Reg. 13567-68. 29 OAQPS GHG Presentation. 30 OAQPS GHG Presentation.

Electric System Reliability and GHG Emission Reductions Under CAA Section 111(d) – May 2014
Analysis Group, Inc. Page | 13
A SIP may propose to “adopt less stringent emission standards or longer compliance schedules than those set out in the guidelines where the State demonstrates””:31
o “Unreasonable cost of control due to age, location or basic process design” o “Physical impossibility of installing necessary control equipment” o “Other factors specific to the facility or class of facility that make application of a
less stringent standard or final compliance time significantly more reasonable.” A SIP may adopt more stringent standards or shorter compliance schedules than those
contained in the guidelines. States will need to adopt laws, rules and/or other administrative mechanisms as part of
their demonstration that their SIPs will be effective and enforceable. If a state does not file a satisfactory SIP or fails to enforce an approved SIP, then EPA has
the authority to issue and enforce a Federal Implementation Plan (“FIP”).
The likely character of EPA’s guidance under CAA Section 111(d)
Until the EPA publishes its proposed Section 111(d) guidance in June 2014 and finalizes it by the following year, observers cannot be sure what that final guidance will contain. There are clues, however, in statements from EPA, as well as analyses prepared by many observers. These clues provide a reasonable basis for states and the affected industry to begin their planning (as many states have already done).
In its September 2013 document posing “questions to the states,” for example, EPA identified two “different options available for addressing carbon pollution from existing power plants… A source-based approach evaluates emission reduction measures that could be taken directly at the affected sources—in this case, the power plants. A system-based approach evaluates a broader portfolio of measures including those that could be taken beyond the affected sources but still reduce emissions at the source.”32
EPA has typically adopted a source-based approach in other Section 111 regulations.33 In developing its proposed GHG emission standards for new fossil power plants under Section 111(b), for example, EPA relied upon a source-based approach, expressed as a limit on pounds
31 OAQPS GHG Presentation. 32 EPA Design Considerations 2013. 33 EPA, “Background on Establishing New Source Performance Standards (NSPS) Under the Clean Air Act,” October 2013, http://www.epa.gov/region9/air/listening/BackgroundEstablishingNewSourcePerformanceStds.pdf;

Electric System Reliability and GHG Emission Reductions Under CAA Section 111(d) – May 2014
Analysis Group, Inc. Page | 14
of CO2 emitted for each MWh of generation. The proposal has one CO2/MWh rate for new Electric Utility Steam Generating Units (“EGUs”) that propose to use a solid fossil fuel (e.g., coal-fired boilers) and integrated gasification combined cycle (“IGCC”) units,34 and another rate for natural-gas-fired combustion units.35,36
Many parties outside of EPA have made recommendations and proposals for the form of regulations they prefer to see EPA adopt in its guidance. In terms of the design and stringency of the requirement, these proposals differ in two dimensions (as described recently by Bruce Phillips/Clean Air Task Force37): “(1) Whether the rule establishes separate emission standards for covered coal and natural gas-fired generation or a blended emission standard for all covered fossil generation (both coal and natural gas). (2) Whether the emission standards are expressed as an emission rate (in pounds of carbon emissions per unit of generating output) or a mass-based standard (in tons of carbon emissions). As shown in the following table, these two basic design elements characterize the policy proposals and concepts offered to date.”
34 EPA has proposed standards of performance for utility boilers and IGCC units based on partial implementation of carbon capture and storage (“CCS”) as the BSER. “There are two limits for fossil fuel-fired utility boilers and IGCC units, depending on the compliance period that best suits the unit. These limits require capture of only a portion of the CO2 from the new unit. These proposed limits are: (a) 1,100 lb CO2/MWh gross over a 12-operating month period, or (b) 1,000-1,050 lb CO2/MWh gross over an 84-operating month (7-year) period. All standards are in pounds of CO2 per megawatt-hour (lb CO2/MWh gross).” EPA Fact Sheet, “Reducing Carbon Pollution From Power Plants Moving Forward On the Climate Action Plan,” September 20, 2013; EPA 2013 Proposed GHG Standards for New EGUs, pages 15-16. 35 “EPA is proposing two standards for natural gas-fired stationary combustion units, depending on size. The proposed limits are based on the performance of modern natural gas combined cycle (NGCC) units. These proposed limits are: (a) 1,000 lb CO2/MWh gross for larger units (> 850 mmBtu/hr); and (b) 1,100 lb CO2/MWh gross for smaller units (≤ 850 mmBtu/hr).” All standards are in pounds of CO2 per megawatt-hour (lb CO2/MWh gross.” EPA Fact Sheet, “Reducing Carbon Pollution From Power Plants Moving Forward On the Climate Action Plan,” September 20, 2013; EPA 2013 Proposed GHG Standards for New EGUs, page 16. 36 I do not mean to suggest that the particular form or level of the CO2/MWh standards proposed in the Section 111(b) rulemaking for new power plants will be the same form or level of standards applicable to existing power plants. Indeed, EPA has stated that the particular CO2/MWh standards proposed in the rulemaking for new power plants will not be the same standards applicable to existing power plants: “In September [2013], the EPA announced its new proposal. The proposed standards would establish the first uniform national limits on carbon pollution from future power plants. They will not apply to existing power plants.” Opening Statement of Janet McCabe, Acting Assistant Administrator, Office of Air and Radiation, EPA, Hearing on EPA’s Proposed GHG Standards for New Power Plants and H.R. __, Whitfield-Manchin Legislation, Subcommittee on Energy and Power, Committee on Energy and Commerce, U.S. House of Representatives, November 14, 2013. 37 Bruce Phillips, The Northbridge Group, “Alternative Approaches for Regulating Greenhouse Gas Emissions from Existing Power Plants under the Clean Air Act: Practical Pathways to Meaningful Reductions,” prepared at the Request of the Clean Air Task Force, February 27, 2014 (hereafter, “Phillips/CATF 2014”).

Electric System Reliability and GHG Emission Reductions Under CAA Section 111(d) – May 2014
Analysis Group, Inc. Page | 15
Table 1
TAXONOMY OF ALTERNATIVE POLICY DESIGNS38
Blended Fossil Standard Separate Coal and Gas Standards
Rate-Based
Blended Fossil Emission Rate [one rate for all fossil sources]
• NRDC [Natural Resources Defense Council] (trading with uncovered sources)39
Coal Emission Rate & Gas Emission Rate
• CATF [Clean Air Task Force] 1.0
• NCC [National Climate Coalition] (trading with uncovered sources)40
Mass-Based
Fossil Budget (ceiling on total amount of emissions from covered fossil fuel units)
• RGGI [Regional Greenhouse Gas Initiative]
• California AB 32 [Cap-and-Trade Program]
• CATF 2.0 Fossil Alternative
Coal Budget & Gas Emission Rate
• CATF 2.0 Coal Budget/Gas Rate Alternative (with an emission rate standard for natural gas)
EPA reports41 that commenters have suggested that Section 111(d) guidelines be drafted to accommodate multiple emission-reduction options for state SIPs,42 including:
Averaging of emissions from covered units, through tradable credits. “Units would be given emission rate targets. If they emit below the targets, they would generate credits
38 I have reproduced the overall structure of the original table in Phillips/CATF 2014 (page 8), but have annotated it [in bracketed italics text] to provide full names for the acronyms in the original table, and with other information as provided in the explanatory text of Phillips/CATF 2014 regarding the table. Note the perspective of Phillips/CATF 2014 (page 8) that “Although the coal budget/gas rate approach is less familiar than the fossil budget approach, there are several advantages. It provides similar compliance flexibility and cost effectiveness to the fossil approach, and during the initial years of a 111(d) power plant policy results in lower emission credit prices, wholesale market prices and potentially lower retail rate impacts. Also, it is fundamentally quite similar to the sulfur dioxide (SO2) trading program established by the CAA Amendments of 1990 and successfully operated since then. Coal plants produce virtually all of the electric sector’s SO2 emissions, while natural gas emits only trace amounts. Consequently, the SO2 trading program is effectively a type of mass-based coal regulation. Given these characteristics and advantages, the mass-based coal approach deserves close consideration.” 39 Footnote in the original: Dan Lashof et al., NRDC, “Closing The Power Plant Loophole: Smart Ways The Clean Air Act Can Clean Up America’s Climate Polluters, December 2012. 40 Footnotes in the original: “The NCC policy concept calls for renewable and demand side efficiency crediting to play a critical role in the rule.” National Climate Coalition, “Using EPA Clean Air Act Authority to Build a Federal Framework for State Greenhouse Gas Reduction Programs.” September 2013. Phillips/CATF 2014, page 7-8. 41 EPA Design Considerations 2013. 42 EPA has also indicated that although it has historically issued a model rule, the agency is “exploring whether and how to develop a ‘toolbox’ of decision-making and implementation resources for states that might include information about state programs and measures that reduce electricity sector CO2 emissions. Examples of information in the decision-making toolbox might include criteria for demonstrating how system-wide actions can meet the level of performance in the emission guidelines; a compendium of existing state energy and GHG policies, programs, and measures that includes information about key design attributes and how the states are estimating energy savings and emission reductions; and links to tools that help quantify energy savings and emissions reductions from state programs and measures.” EPA Design Considerations 2013.

Electric System Reliability and GHG Emission Reductions Under CAA Section 111(d) – May 2014
Analysis Group, Inc. Page | 16
for each MWh generated. If they emit above the targets, they would still be able to comply if they obtained credits to offset emissions above the target.”
“Generation performance standards,” which EPA depicts as similar to emissions averaging “but would include all generating sources (e.g., renewables, nuclear, etc.).”
“Intrastate emission trading programs with GHG limitations.” “Other programs that impact a State’s generation mix and could lead to reductions in
emissions from covered sources such as renewable portfolio standards, clean energy standards,” or “increases in end-use efficiency and demand-side management.”
These clues provide a reasonable basis to expect that the final rule will give states many options to meet CO2 reductions cost-effectively and reliably and in ways tailored to the generation mix and policy preferences of the particular state.
Section 111(d) Differs from Other Recent EPA Regulations Affecting Power Plants
The character of Section 111(d)’s regulatory framework creates an entirely different and potentially much-wider set of compliance and implementation options compared to other federal regulations that have affected the electric industry in recent memory. The ‘cooperative federalism’ model embedded in Section 111(d) provides for much more compliance flexibility and creativity than was possible for the many unit-specific regulations issued recently by EPA. This is core to the conclusion that EPA’s regulation of GHG emissions from existing power plants will not raise electric system reliability concerns.
The MATS Rule
For example, one of the most recent EPA regulations affecting existing fossil-fuel power plants – the MATS rule – differs in fundamental ways from Section 111(d). In the MATS rule, EPA set uniform, national standards to reduce emissions of mercury and other toxic air pollutants from approximately 1,100 coal-fired EGUs and 300 oil-fired EGUs located in the U.S.43, 44 The regulations set limits on allowable emissions that could occur at each affected unit by the compliance dates.
43 The 12-16-2011 MATS rule also adopted standards for new power plants, which were updated in March 2013. 44 EPA, “Reducing Toxic Pollution from Power Plants: Final Mercury and Air Toxics Standards (MATS),” December 2011 presentation, page 11.

Electric System Reliability and GHG Emission Reductions Under CAA Section 111(d) – May 2014
Analysis Group, Inc. Page | 17
EGUs generally have up to four years (and in a limited number of instances, a fifth year) to comply with MATS,45 through a range of compliance strategies to be undertaken at the specific generating units covered by the regulation. “Many existing sources will comply with the MATS by controlling their emissions, while others (typically older, smaller, less efficient units) may choose to cease operations rather than install control technologies.”46 No trading or averaging is allowed across different generating stations. There is no possibility of purchasing compliance credits from over-compliance at other generating stations.
A vibrant public debate took place during the 2010-2012 period about the ability of the electric industry to maintain electric system reliability while also complying with MATS, because those EGUs not yet in compliance would either have to invest in pollution-control technology to comply with MATS, or shut down.47,48 Reliability concerns focused on the fact that such a large portion of the nation’s generating fleet would be affected, and on whether the systems in which they were located could respond appropriately (and reliably) given those regions’ heavy reliance on coal-fired generation. Other concerns focused on whether pollution-control equipment manufacturers and installers could absorb the simultaneous demand for work orders from the owners of so many affected units, and whether the rule would force coal units to retire and create shortages of generation capacity in some regions.
To address such concerns, the EPA took the unusual step in December 2011 (when it finalized its MATS regulation) of issuing a specific statement of enforcement policy to explain that, “where there is a conflict between timely compliance with a particular requirement and electric reliability, the EPA intends to carefully exercise its authorities to ensure compliance with
45 MATS includes a 3-year compliance period, with an extension of the compliance deadline for a 4th year for units able to demonstrate to state permitting authorities that additional year is needed for installing technology. In some cases a 5th year may be allowed, in light of EPA intention to allow use of administrative orders “with respect to sources that must operate in noncompliance with the MATS for up to a year to address a specific and documented [electric] reliability concern.” EPA December 2011 MATS Enforcement Policy Letter. This would extend MATS compliance deadlines from April 2015 to April 2016 for certain units. 46 EPA December 2011 MATS Enforcement Policy Letter. 47 Note that many generating units covered by the MATS rule were already compliant with the emissions limits as of the issuance of the MATS rule. See M. Bradley, S. Tierney, C. Van Atten, and A. Saha, “Ensuring a Clean, Modern Electric Generating Fleet while Maintaining Electric System Reliability,” Fall 2011 Update, November 2011. 48 During the two-year period of 2010 and 2011, countless industry reports and analyses, conference presentations, financial analyst calls, media articles, congressional hearings, and other public reviews focused on the question of whether the EPA’s adoption of the mercury and air toxics rules, either alone or in conjunction with other potential EPA regulations affecting existing power plants (including CSAPR, the coal-ash rule, and the cooling water intake structure rule (Section 316(b) of the Clean Water Act)) that were being considered at the time, would introduce local or regional electric system reliability issues. Note one of my own analyses on this topic from early 2011: S. Tierney, “Electric Reliability under New EPA Power Plant Regulations: A Field Guide,” January 18, 2011. http://www.wri.org/stories/2011/01/electric-reliability-under-new-epa-power-plant-regulations-field-guide.

Electric System Reliability and GHG Emission Reductions Under CAA Section 111(d) – May 2014
Analysis Group, Inc. Page | 18
environmental standards while addressing genuine risks to reliability in a manner that protect public health and welfare.”49
At present, the industry is proceeding with its planning in light of the final MATS regulation. (See further discussion, below, on how MATS compliance affects the conditions under which the states and the industry will develop their responses to EPA guidance under Section 111(d).)
How Section 111(d)’s Framework Differs from the MATS Rule
There several reasons why the types of reliability concerns raised during the discussions of the MATS rule in 2010-2011 are not relevant to the Section 111(d) regulations. First, Section 111(d)’s reliance on the SIP process means that EPA will be able to provide states with guidance allowing considerable and wide-ranging latitude in how they plan to meet EPA’s requirements. EPA’s guidance will not likely impose a common emission standard that must be met solely by actions taken at each affected unit. Rather, EPA is likely to establish standards specific to each state, based on the “degree of emission limitation achievable through the application of the best system of emission reduction,” which may vary across states given their own particular circumstances. Each state will have flexibility to propose its preferred actions that accomplish the targeted reductions, as long as the SIP provides reductions across the facilities in the state that are at least as effective as EPA’s approach. As EPA Acting Administrator for Air and Radiation told state regulators recently, “We get it that states are in very different positions and that they’re thinking about these issues in their own context.”50
Second, if a state has concerns about the reliability implications of potential temporary or permanent outages of units needed to respond to EPA guidance, the state can take that fact
49 EPA December 2011 MATS Enforcement Policy Letter, pages 1, 4: “The EPA generally does not speak publicly to the intended scope of its enforcement efforts, particularly years in advance of the date when a violation may occur. The Agency is doing so now with respect to the MATS to provide confidence with respect to electric reliability. EGUs may be needed to operate to maintain the reliability of the electric grid when they would prefer, or could be required, to halt operations temporarily (until controls can be installed) or indefinitely (through deactivation of a unit). …Some sources may take all steps necessary to comply with the MATS, but may nevertheless be needed to operate in noncompliance with the MATS to address concerns with electric reliability. In the event that such sources are interested in receiving a schedule to come into compliance while operating, the EPA intends, where necessary to avoid a serious risk to electric reliability, and provided the criteria set forth herein are met, to issue an expeditious case-specific AO [Administrative Order] to bring a source into compliance within one year….Any such AOs would be issued on or after (not before) the MATS Compliance Date and would be limit to units that are required to run for reliability purposes that (A) would otherwise be deactivated, or (B) due to factors beyond the control of the owner/operator, have a delay in installation of controls or need to operate because another units has had such a delay.” 50 Remarks of Janet McCabe, Acting Administrator for Air and Radiation, presented to the National Association of Regulatory Utility Commissioners, February 11, 2014.

Electric System Reliability and GHG Emission Reductions Under CAA Section 111(d) – May 2014
Analysis Group, Inc. Page | 19
explicitly into account as it designs its SIP. For example, a state may propose plan elements that enable early action/compliance at some Section 111(d) generating units in exchange for allowing more time for others, or that allow emission averaging or emission-credit trading that achieve deeper reductions at one unit in exchange for lighter reductions at another. (The many options available to states in developing their SIPs are discussed below, in the section on “Planning for compliance with EPA guidance.”)
Third, the Presidential Memorandum directing EPA to use its Section 111(d) authority explicitly calls for the agency to “develop approaches that allow the use of market-based instruments, performance standards, and other regulatory flexibilities” that are not possible under the statutory language governing MATS. The Presidential Memorandum further directs EPA to develop its standards, regulations or guidelines to:
identify and use the best, most innovative, and least burdensome tools for achieving regulatory ends…[and to] propose or adopt a regulation only upon a reasoned determination that its benefits justify its costs (recognizing that some benefits and costs are difficult to quantify); (2) tailor its regulations to impose the least burden on society, consistent with obtaining regulatory objectives, taking into account, among other things, and to the extent practicable, the costs of cumulative regulations; (3) select, in choosing among alternative regulatory approaches, those approaches that maximize net benefits (including potential economic, environmental, public health and safety, and other advantages; distributive impacts; and equity); (4) to the extent feasible, specify performance objectives, rather than specifying the behavior or manner of compliance that regulated entities must adopt; and (5) identify and assess available alternatives to direct regulation, including providing economic incentives to encourage the desired behavior, such as user fees or marketable permits, or providing information upon which choices can be made by the public.51
Thus, the inherent authority within 111(d), combined with these Presidential directives, invites (if not requires) EPA to implement a flexible framework that will allow states to propose SIPs that take into account the need to assure electric system reliability. As such, the reliability red flag is mainly useful as a spur toward advanced planning, and to motivate states to prepare SIPs with elements addressing (and mitigating) such concerns. (See further discussion below.)
51 This language is from Executive Order 13563, reflecting the Presidential Memorandum direction that EPA develop its guidance in a manner “consistent with Executive Orders 12866 of September 30, 1993, as amended, and 13563 of January 18, 2011.” The latter Executive Order is “13563: Improving Regulation and Regulatory Review.”

Electric System Reliability and GHG Emission Reductions Under CAA Section 111(d) – May 2014
Analysis Group, Inc. Page | 20
Power plants that are subject to CAA Section 111(d)
EPA has previously indicated that its Section 111(d) regulations will apply specifically to existing EGUs:52 all grid-connected steam generators that use fossil fuel and are over 25 megawatts (“MW”) in size. It is sensible to presume, too, that Section 111(d) will also apply to natural-gas-fired combined-cycle (“NGCCs”) generating units, in light of the fact that the Section 111(b) proposal (affecting new power plants) applies to such units as well.53
Together, these categories represent a large subset of all of the nation’s power plants, and cover most but not all existing fossil-fuel generating units. It does not include either non-grid connected or very-small steam generating units, or simple-cycle peaking units. EGUs and NGCCs represent classes of technologies which may be owned by investor-owned utilities, publicly owned utilities, rural electric cooperatives, non-utility generating companies, and others.
Based on current information about power plants from SNL Financial for 2013, I calculate that there are 3,084 EGUs and NGCC units likely to be directly affected by EPA’s upcoming regulations.54 (See Table 2.) These generating units represent approximately 532.4 GW of generating capacity,55 with 292.4 GW of coal-fired power plants (mainly EGU capacity), 216.6
52 “The regulations would apply to each EGU capable of combusting more than 250 million British thermal units per hour (MMBtu/hr) heat input of fossil fuel: Electric utility steam generating unit means any steam electric generating unit that is constructed for the purpose of supplying more than one-third of its potential electric output capacity and more than 25 megawatts electric (MWe) output to any utility power distribution system for sale. Fossil fuel means natural gas, petroleum, coal, and any form of solid, liquid, or gaseous fuel derived from such material for the purpose of creating useful heat.“ OAQPS GHG Presentation. 53 This is based on two assumptions: First, CAA Section 111(d) will apply to EGUs as defined by the EPA (see, for example, the OAQPS GHG Presentation from 2011). Second, Section 111(d) will apply to any categories of existing emission sources that, if they were new sources, would be regulated under Section 111(b). Under EPA’s 2013 Proposed GHG Standards for New EGUs, Section 111(b) includes not only fossil-fuel steam generating units but also natural-gas combined-cycle units: “Utility announcements about the status of coal projects, IRPs [integrated resources plans], and EIA projections suggest that, by far, the largest sources of new fossil fuel-fired electricity generation are likely to be NGCC units. The EPA believes, therefore, that it is also appropriate to set a standard for stationary combustion turbines used as EGUs. These units are currently covered under subpart KKKK (stationary combustion turbines). The EPA also proposes to maintain the definition of EGUs under the NSPS that differentiates between EGUs (sources used primarily for generating electricity for sale to the grid) and non-EGUs (turbines primarily used to generate steam and/or electricity for on-site use). That definition defines EGUs as units that sell more than one-third of their potential electric output to the grid. Under this definition, most simple cycle “peaking” stationary combustion turbines, which typically sell significantly less than one-third of their potential electric output to the grid, would not be affected by today’s proposal.” Page 24 of EPA 2013 Proposed GHG Standards for New EGUs. 54 The actual number of EGUs as of early 2014 is 1,929 units in light of data for grid-connected steam generating units over 25 MW in size and using coal, natural gas or oil for fuel. In early 2014, there were 1,176 generating units associated with combined cycle technologies, most of which burn natural gas. Source of data: SNL Financial. 55 Net summer capacity.

Electric System Reliability and GHG Emission Reductions Under CAA Section 111(d) – May 2014
Analysis Group, Inc. Page | 21
GW of natural-gas-fired plants (mainly combined cycle units), and 23.7 GW of plants that burn oil (mainly EGUs).56 This represents approximately half of total generating capacity in the U.S. as of the first quarter of 2014 (with the rest being primarily nuclear, hydro and wind), and 70 percent of U.S. fossil generating capacity. (See Appendix 2.)
Table 2 Existing Power Generation Capacity in the U.S. as of 3-2014:
All Power Plants and Power Plants Likely to be Subject to Clean Air Act 111(d)
Generating Units Likely to Be
Directly Covered by Section 111(d)* (# Units) (GW of Capacity)
Total Grid-Connected Generating Capacity
in the U.S. (GW)
111(d) Capacity as a Share of Total
Capacity (%)
Coal 1204 292.4 303.7 96%
Natural Gas 1,636 216.6 414.3 52%
Oil 244 23.7 38.2 61%
Nuclear 0 0 98.0 0
Hydro 0 0 99.0 0
Wind and Solar 0 0 68.9 0
Other** 0 0 21.7 0
Total 3,804 532.4 1042.4 51% Source of data: SNL Financial, March 2014. “GW” reflects net summer capacity of the generating units. * This reflects existing grid-connected EGUs over 25 MW and NGCCs. ** This includes biomass, geothermal, and generation from other fuels not listed above.
Figure 1 shows the location of all U.S. fossil power plants by fuel type. Given the different fuel/technology mixes of power plants across the states, Section 111(d) will impact the states in different ways:
States with half of their in-state generating capacity likely to be subject to Section 111(d) are (ranked by percentage of total capacity in the state): West Virginia (highest at 88 percent), Utah, Wyoming, Kentucky, Indiana, Louisiana, Delaware, Ohio, New Mexico, Oklahoma, Texas, Missouri, North Dakota, Missouri, Arkansas, Rhode Island, Massachusetts, Maryland, Wisconsin, Florida, Nebraska, Michigan, Alabama, Pennsylvania, and Hawaii (with 50 percent).
56 These estimates are based on the primary fuel of plants, some of which may burn a second fuel.

Electric System Reliability and GHG Emission Reductions Under CAA Section 111(d) – May 2014
Analysis Group, Inc. Page | 22
States with a relatively high share of the nation’s total generating capacity affected by Section 111(d) are as follows (ranked by highest percentage of total capacity in the U.S.): Texas (12 percent), Florida, California, Pennsylvania, Ohio, Indiana, Georgia, Illinois, Louisiana, Alabama, New York, Michigan, Kentucky, Oklahoma, West Virginia, North Carolina, and Missouri (3 percent).
Appendix 2 provides state-specific information about power plant capacity and units likely to be directly subject to 111(d), along with other capacity in the each state’s electric generating fleet. Forty-nine of the 50 states will need to prepare a SIP to show how the state plans to bring its generating facilities into compliance with EPA guidance.
Figure 1
Roughly one quarter of that Section 111(d) capacity (and 28 percent of the units) entered service prior to 1970, and is thus at least 43 years old. Approximately 352 EGUs (with a total capacity of 43.2 GW) are older than 53 years. Owners of 119 of the old (pre-1970) EGUs (with a capacity totaling 16.7 GW) have announced that they intend to retire the unit in a year prior to the end of

Electric System Reliability and GHG Emission Reductions Under CAA Section 111(d) – May 2014
Analysis Group, Inc. Page | 23
2016.57 These tend to be much smaller units, two-thirds of which are coal-fired EGUs and one-fourth oil-fired EGUs.
Approximately three percent of the directly affected EGU and combined-cycle capacity (18.8 GW) operating at the start of 2014 has a planned retirement occurring between 2013 and 2016 – well before the compliance period for SIP implementation58 (and roughly consistent with the date by which existing coal-fired and oil-fired EGUs will have had to comply with the EPA’s MATS rule59 or retire). Using this information as a proxy for upcoming retirements, approximately 523 GW of capacity nationwide would be subject to Section 111(d) after 2016. (See further discussion below regarding power plant retirements.)
Context for Industry Compliance with CAA Section 111(d) Requirements
Several trends affecting the electric industry set the stage for the roll-out of new regulations. Foremost among these trends are: the ‘shale gas’ revolution and its implications for coal plant economics (including the availability of higher levels of output from existing natural-gas power plants); relatively flat demand for electricity; growth in development of renewable energy; the availability of supply from zero-carbon nuclear generation; the announcements of retirements of coal-fired generating capacity that result from these factors and the EPA’s MATS rule; and proposals to build new power plants. These trends set the context for EPA and the states preparing to address GHG emission reductions. And they affect the factors that states will need to consider as they plan for electric-system reliability as part of that process.
Natural gas, coal and existing power plants
Until the past few years, energy market fundamentals favored use of coal for power generation in many parts of the U.S. The recent shale gas revolution has fundamentally changed that
57 Analysis based on SNL Financial data. 58 The Presidential Memorandum requests that EPA’s 111(d) guidelines require states to submit their SIPs by no later than June 2016. Assuming this optimistic time frame and taking into account time for EPA review and state implementation, compliance would actually likely begin no earlier than late 2017. (See, for example, the schedule showing an estimated compliance period for Section 111(d) spanning roughly late 2017 through 2020, as presented by Jennifer Macedonia, Bipartisan Policy Center, “Clean Air Act Regulation of Power Plants: Greenhouse Gas Performance Standards,” September 2013, page 4.) 59 See December 16, 2011, letter of Cynthia Giles, Assistant Administrator of the Office of Enforcement and Compliance Assurance, EPA, re: the EPA’s “Enforcement Response Policy for Use of Clean Air Act Section 113(a) Administrative Orders in Relation to Electric Reliability and the Mercury and Air Toxics Standard” (hereafter, “EPA December 2011 MATS Enforcement Policy Letter”).

Electric System Reliability and GHG Emission Reductions Under CAA Section 111(d) – May 2014
Analysis Group, Inc. Page | 24
situation. Low natural gas prices over the past few years60 have put economic pressure on coal facilities. Natural-gas-fired power plants increased their output (from 22 percent of U.S. power production in 2007, to 28 percent in 2013), while coal-fired generation decreased (from 49 percent in 2007 to 39 percent 2013).61 Fuel-switching and re-dispatch of existing power plants was possible in light of the significant amount of gas-fired generating capacity that had been added in the U.S. since 2000 (Figure 2) and that had been underutilized for many years.
Figure 2 Generating Capacity Additions by Year and by Fuel (GW): 1985-2013
Source: EIA, Annual Energy Outlook 2013, Figure 78.
Low gas prices resulted from a combination of lower demand for energy (from the U.S. economic downturn and other factors62), and generally lower production costs associated with unconventional gas production. (See Figure 3 for wellhead prices of natural gas and in Figure 4 for prices of natural gas futures.) Market pressure resulting from low natural gas prices led to
60 Note that natural gas commodity prices spiked in many parts of the U.S. where extremely cold weather occurred in December 2013 and mid-January 2014. See SNL Financial. 61 Source: EIA, Electric Power Monthly, Table 1.1. Net Generation by Energy Source: Total (All Sectors), 2003-November 2013. Information for 2013 is for the 11 months (January through November). 62 Including states’ promotion of increased funding for energy efficiency programs and stronger appliance efficiency standards.
-
10.00
20.00
30.00
40.00
50.00
60.00
1985
1986
1987
1988
1989
1990
1991
1992
1993
1994
1995
1996
1997
1998
1999
2000
2001
2002
2003
2004
2005
2006
2007
2008
2009
2010
2011
2012
2013
Other RenewablesSolarWindOil and GasNuclearHydro/otherCoal

Electric System Reliability and GHG Emission Reductions Under CAA Section 111(d) – May 2014
Analysis Group, Inc. Page | 25
announcements of retirements of some of the oldest, smallest and least-efficient coal plants, as discussed previously.63 Figure 5 shows the cumulative amount of coal-fired generating capacity (a total of 25.4 GW) that retired without reliability problems in the 2008-2013 period, in various regions of the U.S. It also shows the amount of capacity (an additional 20 GW) that has been announced to retire between 2014 through 2018. Most of the retiring capacity is located in the RFC and SERC regions – areas with substantial coal-fired generation and underutilized natural gas capacity.
Figure 3 Figure 4
Source: EIA Source: SNL Financial
Given the significant amount of natural-gas-fired generating capacity added since 2000, these plants have not operated at full capacity, even as natural gas prices dropped in recent years and made it more economical to operate gas-fired plants.64 This underutilized gas-fired capacity represents existing capacity that could operate more and could supply consumers’ power requirements in the event of retirements of other power plants, operating restrictions on other high-emitting plants, and/or increased costs to run coal-fired power plants.
63 A longer explanation of such market changes is in my February 2012 paper called “Why Coal Plants Retire: Power Market Fundamentals as of 2012.” 64 This is particularly true compared to prior years (e.g., during the period from roughly 2001 through 2008), when gas prices were relatively volatile and high (compared to most of the period since then, as shown in Figure 3).

Electric System Reliability and GHG Emission Reductions Under CAA Section 111(d) – May 2014
Analysis Group, Inc. Page | 26
Figure 5 Generating Capacity Associated Actual Coal-Plant Retirements (2009-2013) and
Planned Coal Capacity Retirements (2014-2018) by NERC Region (With Retirements as a Percentage of Each Region’s Total 2012 Generating Capacity)
Source of data: SNL Financial, March 25, 2014. “NERC Region” refers to NERC’s reliability regions (shown on the map). Note that there are no actual or planned retirements during the 2008-2018 period for TRE and FRCC.
The states and regions vary with respect to their reliance on natural gas capacity (e.g., NGCC capacity as a percentage of total capacity in the region) and their dispatch of NGCCs (i.e., their capacity factors, or the percentage actual output relative to their potential to produce power). Figure 6 shows the various regions, with shading indicating the extent to which there is significant under-utilized NGCC capacity that could be dispatched to meet power requirements in the event of restricted output at or retirement of coal plants. A lighter-shaded color indicates that the region’s electric mix has relatively low reliance on NGCC capacity, but operates them relatively frequently. A darker-shaded color indicates that that region has relatively high reliance on NGCC capacity but with low capacity factors at those plants.

Electric System Reliability and GHG Emission Reductions Under CAA Section 111(d) – May 2014
Analysis Group, Inc. Page | 27
Figure 6 Regional Reliance on Natural Gas-Fired Combined Cycle in 2012 as a Percentage of
Total Generating Capacity and in terms of Asset Utilization (Capacity Factor):
Source of data: SNL data (on NGCC power plants and capacity factors) by NERC subregion as of 2012. NERC regions and subregions are shown in Appendix 3. Note: There were no regions with less than 3 percent or more than 41 percent reliance on NGCC capacity (as a percentage of total summer capacity in 2012). No regions had an average NGCC capacity factor lower than 25 percent and higher than 65 percent in 2012. In all but one region (NWPP), the average 3-year capacity factor (2011-2013) was lower than the capacity factor in 2012, due to various factors including relative price of natural gas and coal, availability of hydro and/or wind, nuclear outages and/or retirements, coal-plant retirements). The 3-year average was less than 5 percent lower for some regions (i.e., ERCOT, FRCC, ISO-NE, NYISO, RMPA, VACAR), between 5-10 percent lower for others (AZNM, DELTA, and SOUTHEAST), between 10-15 percent lower (CAISO, CENTRAL, PJM, and SPP), and 15-30 percent lower (in GATEWAY and MISO).
This under-utilized NGCC capacity provides an opportunity in most states to incorporate policies and actions in their SIPs that encourage redispatch of existing power plants. For example, the recent Phillips/CATF 2014 analysis indicates that a combination of
approaches would reduce emissions through a mix of compliance actions: by reducing the heat rates (and consequently the emission rates) of coal units; displacing high emission rate coal generation with lower emission rate gas generation through an emission credit trading program; retiring

Electric System Reliability and GHG Emission Reductions Under CAA Section 111(d) – May 2014
Analysis Group, Inc. Page | 28
coal generating capacity; and reducing electric demand through customer response to higher electric prices. Of these, the emission reductions from fossil dispatch represent the largest single source of reductions, in both cases approximately 70 percent of total compliance. This is due to the large size and intermediate capacity factors of the existing NGCC fleet (even under current and expected market conditions) and the relatively narrow spread between delivered coal and natural gas prices, especially in the eastern and central regions of the country.”65
This existing, under-utilized existing capacity provides grid operators with generating resources to dispatch to meet operating requirements reliably. As noted in Figure 6, every region has some existing under-utilized NGCC capacity, and there were no regions with average NGCC capacity factors lower than 25 percent and higher than 65 percent in 2012. As shown in the Appendix 2, a handful of states (Hawaii, Kansas, Kentucky, North Dakota, Vermont, West Virginia, and Wyoming) did not have any NGCC capacity operating in 2012; of these, most of them either have NGCC capacity under construction in their state as of March 2014 (as is the case for Kansas, Kentucky, North Dakota, and Wyoming) and/or are part of a region with significant under-utilized NGCC capacity (as is the case for all of these states besides Hawaii).
Outlook for electricity demand
GHG emissions from fossil fuel power plants are also strongly tied to overall electricity use. Electricity demand has been relatively flat in recent years, with a gradual return to 2007 levels anticipated by next year.66 Beyond then, EIA estimates that demand will grow approximately 1.5 percent per year through the end of this decade.67 The current forecast for 2020 is approximately the level of demand anticipated for 2013 before the economic downturn. This provides a degree of breathing room for managing changes in the generation mix.
65 Phillips/CATF 2014, page 21. See also the Appendix in that report. 66 EIA, Annual Energy Outlook 2014 (Early Release) (hereafter “EIA AEO 2014ER”), and AEO 2008, with actual data from Electric Power Monthly. 67 The EIA’s estimates of demand does not take into account the demand met by on-site renewable generation (e.g., roof-top photovoltaic systems).

Electric System Reliability and GHG Emission Reductions Under CAA Section 111(d) – May 2014
Analysis Group, Inc. Page | 29
Figure 7 Electricity Demand through 2025:
Projected (as of 2008 and 2014) and Actual (2005-2012)
Source of data: EIA, AEO (2008, 2014), and Electric Power Monthly
EIA projects different growth rates by region of the country.68 Regions anticipated to grow faster than the U.S. average are the Mountain states, the Plains states, Texas, and the Southeast.69 By contrast, EIA projects slower growth for the Pacific states, East North Central states, the Mid-Atlantic, and New England regions.70 (Figure 8.)
68 EIA AEO 2014ER, Tables 1-30. http://www.eia.gov/forecasts/aeo/er/tables_ref.cfm, Tables. 69 West North Central (1.0%/year); South Atlantic (1.1%/year); West South Central (1.2%/year); Mountain (1.7%/year); East South Central (1.7%/year). EIA, AEO 2014ER. 70 Middle Atlantic states (0.3%/year); New England (0.6%/year); East North Central (0.8%/year); Pacific states (0.8%/year). EIA AEO 2014ER.

Electric System Reliability and GHG Emission Reductions Under CAA Section 111(d) – May 2014
Analysis Group, Inc. Page | 30
Figure 8 Projected Growth in Demand for Electricity by Region:
Average Annual Growth Rate (2012-2020)
Source of data: EIA, AEO 2014ER
States’ growth trends reflect not only different economic activity but also the effect of policy. Many states have adopted energy efficiency policies that enable greater energy productivity through policies such as utility-sponsored energy efficiency programs, building codes, ratemaking incentives for meeting efficiency targets, and an Energy Efficiency Resource Standard (“EERS”). According to the American Council for an Energy Efficiency Economy (“ACEEE”), 26 states “have adopted and adequately funded an EERS, which sets long-term energy savings targets and drives investments in utility-sector energy efficiency programs,”71 and which “aim explicitly for quantifiable energy savings.”72 Figure 9 shows states with an EERS and other programs promoting efficiency savings in electricity use.
71 ACEEE, “The 2013 State Energy Efficiency Scorecard,” ACEEE Report E13K (hereafter “ACEEE 2013 Efficiency Scorecard”), page vi. The states with a “statewide EERS” as of 2013 are: Arizona, Arkansas, California, Connecticut, Illinois, Indiana, Maine, Maryland, Massachusetts, Michigan, Minnesota, New Mexico, New York, Ohio, Pennsylvania, Rhode Island, and Texas. The states with a version of an EERS that ACEEE calls a “tailored target” are Colorado, Iowa, Oregon, Vermont, Washington, and Wisconsin. And the states that combine a renewables and energy efficiency standard are Hawaii, Nevada and North Carolina. ACEEE 2013 Efficiency Scorecard, page 19. 72 “Twenty-six states now have fully funded EERS that establish specific energy savings targets through customer energy efficiency programs. These policies set multi-year targets for electricity…, such as 1% or 2% incremental savings per year or 20% cumulative savings by 2025.[fn in the original.] EERS policies aim explicitly for quantifiable energy savings, reinforcing the idea that energy efficiency is a utility system resource on par with supply-side resources. These standards also help utility system planners more clearly anticipate and project the impact of energy efficiency programs on utility system loads and resource needs. Energy savings

Electric System Reliability and GHG Emission Reductions Under CAA Section 111(d) – May 2014
Analysis Group, Inc. Page | 31
Figure 9 States with a Energy Efficiency Resource Standard or With Relatively
High Scores for Electricity Energy Efficiency Policies (as of 2013)
Source: Data from the ACEEE 2013 Efficiency Scorecard, Table 8. This table includes all states considered having an EERS (by ACEEE) and otherwise receiving at least 5 of 16 points for electricity energy efficiency (“EE”) or EE ratemaking incentives for utilities.
Even states with a strong history of pursuing cost-effective energy efficiency have further opportunities to improve energy productivity in the future.73 Tapping such opportunities can help states reduce some of the GHG emissions associated with electricity production.74
State policies relating to renewable energy
Another factor affecting the outlook for GHG emissions at existing fossil units is the widespread adoption of policies by states to promote use of renewable generation. As shown in Figure 10,
targets are generally set at levels that push efficiency programs to achieve higher savings than they otherwise would have, typically based on analysis for the energy efficiency savings potential in the state that ensures the targets are realistic and achievable. EERS policies maintain strict requirements for cost-effectiveness so that efficiency programs are guaranteed to provide overall benefits to consumers.” ACEEE 2013 Efficiency Scorecard, Page 18. 73 See, for example, the February 7, 2013 report of the Alliance Commission on National Energy Efficiency Policy, “Doubling U.S. Energy Productivity by 2030.” 74 Paul Hibbard and Andrea Okie, “Crediting Greenhouse Gas Emission Reductions from Energy Efficiency Investments: Recommended Framework for Proposed Guidance on Quantifying Energy Savings and Emission Reductions in Section 111(d) State Plans Implementing the Carbon Pollution Standards for Existing Power Plants,” March 2014. http://www.edf.org/sites/default/files/eemv-111d-recommended-framework.pdf.

Electric System Reliability and GHG Emission Reductions Under CAA Section 111(d) – May 2014
Analysis Group, Inc. Page | 32
most states have either a Renewable Portfolio Standard (“RPS”) that requires that a certain percentage of electricity sold at retail be sourced from renewable energy generation, or a goal for development and use of renewable supplies. Some of these states’ RPS policies have been in place for many years, leading to growth in renewable generation in recent years. Figure 11 shows the percentage of states’ 2012 generation that came from renewable energy (including wind, solar, geothermal, hydro, wood, wood waste, municipal waste, landfill gas, and other biomass). This output tends to displace output that would otherwise come from fossil generation with GHG emissions.75
Figure 10 States with a Renewable Portfolio Standard or Renewables Goals (as of 2013)
Source: Database of State Incentives for Renewables and Efficiency (“DSIRE”)
75 In the U.S. overall in 2012, renewable generation accounted for 14 percent of total electricity supply. Of this renewable generation, the sources of power production were as follows:
Renewable Generation in the U.S. – Percentage Shares by Fuel/Resource in 2012 Conventional Hydro 55% Wind 28% Wood and Other Biomass 7% Municipal Wastes 4% Geothermal 3% Solar (not including off-grid PV systems) 2% Total Renewables 100%
EIA, AEO 2014ER, ref2014.d102413a, Table 120.

Electric System Reliability and GHG Emission Reductions Under CAA Section 111(d) – May 2014
Analysis Group, Inc. Page | 33
Figure 11 Percentage of States’ Total Power Generation from Renewable Energy in 2012
Source of data: EIA, AEO 2014ER, ref2014.d102413a, Table 96. States’ output shown on the map above is based on their location within EIA’s Electricity Market Module Regions. For states in more than one region, a state has been assigned to the particular region in which the majority of the state is located (by land, not necessarily load). “Renewables” includes wind, solar, geothermal, conventional hydro, wood, wood waste, municipal waste, landfill gas, and other biomass.
EIA projects that in several parts of the country where renewable generation was a relatively small share of total power supply in 2012, there will be substantial growth in renewable output. Figure 12 shows information related to such growth, with the color indicating each state’s renewable generation in 2020, as a percentage increase from that state’s base of renewables in 2012. The additional renewable supply will come from both utility-scale and distributed renewable energy projects (i.e., facilities located ‘behind the meter’ on customers’ premises). These projections, based on current policy assumptions, provide a reasonable basis for assuming that in the future, renewables will allow for displacement of some of the output from fossil generation in many regions of the country (e.g., the Southeast and Florida, Arizona and New Mexico, Virginia and the Carolinas, Michigan and other parts of the Midwest) in the years ahead. States may be able to plan for such as part of their SIPs, and will likely need to address

Electric System Reliability and GHG Emission Reductions Under CAA Section 111(d) – May 2014
Analysis Group, Inc. Page | 34
operational/integration issues that may become more urgent with higher penetration of renewables (although the availability of flexible NGCC will help with this integration).76
Figure 12 Projected Growth in States’ Renewable Generation
by 2020, Relative to 2012 Percentage
Source of data: EIA, AEO, 2014ER, ref2014.d102413a, Table 96. The information in this chart is based on a comparison of the MWh of generation in 2012 with the projected generation in 2020, with the difference reflecting the percentage change in renewables generation over that period. States with a darker color represent a higher percentage growth in that state. States’ output shown on the map above is based on their location within EIA’s Electricity Market Module Regions. For states in more than one region, a state has been assigned to the particular region in which the majority of the state is located (by land, not necessarily load). “Renewables” includes wind, solar, geothermal, conventional hydro, wood, wood waste, municipal waste, landfill gas, and other biomass.
Availability of zero-carbon supply from nuclear generators
For nearly two decades, one fifth of the nation’s electricity supply has been generated at nuclear power plants.77 The currently operating 100 nuclear reactors are located in 31 states, as shown in Figure 13.
76 See, for example, the recent study performed to examine the operational, cost, emission, and other implications of a 40-percent and 50-percent RPS requirement in California: E3, “investigating a Higher Renewables Portfolio Standard in California, January 2014; and Dan Arvizu, Severin Borenstein, Susan Tierney, and Stephen Wright, “Report of the Independent Advisory Panel Regarding the Five California Utilities’ Study of Integration of Renewable Energy into California’s Electric System: ‘Investigating a Higher Renewables Portfolio Standard in California’,” January 2014.

Electric System Reliability and GHG Emission Reductions Under CAA Section 111(d) – May 2014
Analysis Group, Inc. Page | 35
Figure 13 Location of Existing Nuclear Power Plants and Regional Transmission Organizations (RTOs)
Source: World Nuclear Association, http://www.world-nuclear.org/info/Country-Profiles/Countries-T-Z/USA--Nuclear-Power/. Overlay of RTOs (Analysis Group). Note that this map shows the San Onofre (California), Crystal River (Florida), and Kewaunee (Wisconsin) units – all of which were retired as of 2014.
In the past two years, owners of several existing nuclear units have either retired or announced an impending retirement of the plants. The actual retirements include units located in California, Wisconsin, and Florida. A unit retirement will occur in Vermont at the end of 2014. These particular retirements are due to a variety of reasons, including costly repairs and low wholesale power prices.78
77 EIA, Annual Review of Energy, 2013, Table 7.2b Electricity Net Generation: Electric Power Sector. 78 San Onofre Units 2 and 3 in California (and totaling 2150 MW) retired in 2013 after being shut down for an extended outage related to a damaged steam generator at the unit, with its owner reporting it would be uneconomic to repair and restart the units, in light of market conditions; Kawanee, a 566-MW unit in Wisconsin shut down in 2013 due to lower power prices in wholesale markets; Crystal River, a 860-MW unit in Florida that was shut down permanently in 2013 down after a decision not to repair the previously damaged station; and Vermont Yankee, a 604-MW unit announced to be retired at the end of 2014 due to unfavorable economics, in spite of a 90+ percent capacity factor. Sources: EIA Generator Y2012 data (860 database on power plants); EIA, “Lower power prices and high repair costs drive nuclear,” July 2, 2013; Matthew Bandyck, “UPDATE: Entergy says Vermont Yankee nuke closure shows 'design flaws' in wholesale markets,” August 27, 2013.
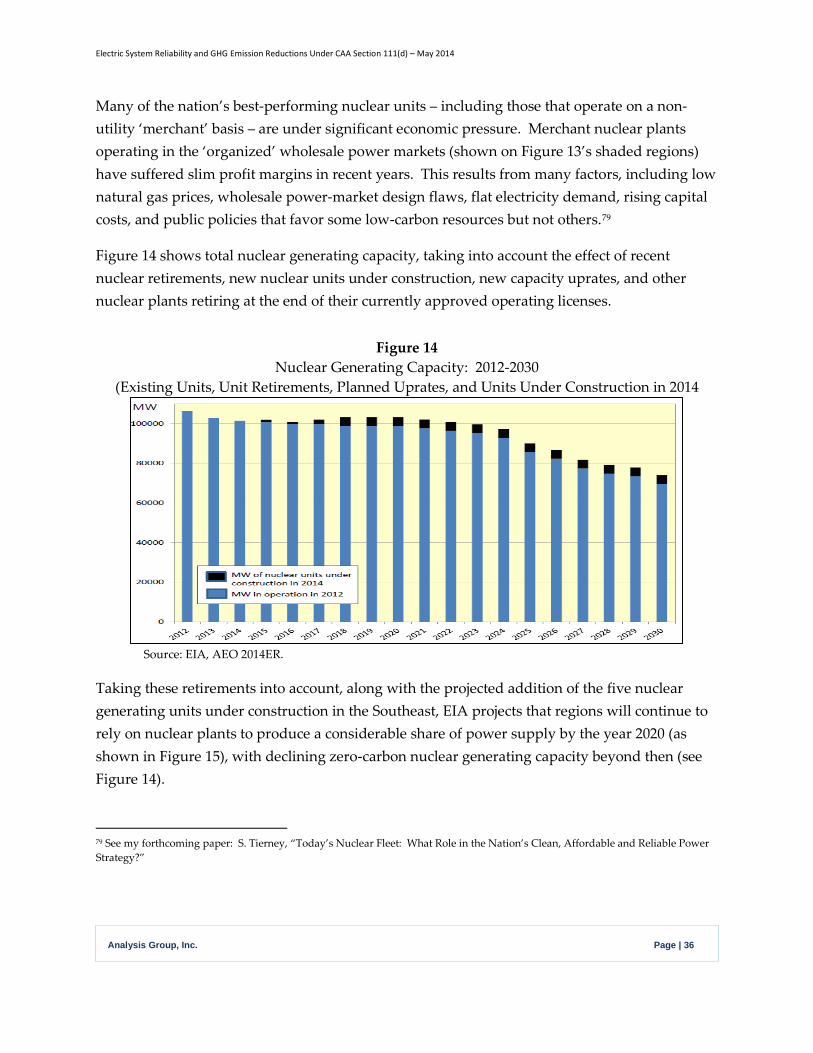
Electric System Reliability and GHG Emission Reductions Under CAA Section 111(d) – May 2014
Analysis Group, Inc. Page | 36
Many of the nation’s best-performing nuclear units – including those that operate on a non-utility ‘merchant’ basis – are under significant economic pressure. Merchant nuclear plants operating in the ‘organized’ wholesale power markets (shown on Figure 13’s shaded regions) have suffered slim profit margins in recent years. This results from many factors, including low natural gas prices, wholesale power-market design flaws, flat electricity demand, rising capital costs, and public policies that favor some low-carbon resources but not others.79
Figure 14 shows total nuclear generating capacity, taking into account the effect of recent nuclear retirements, new nuclear units under construction, new capacity uprates, and other nuclear plants retiring at the end of their currently approved operating licenses.
Figure 14 Nuclear Generating Capacity: 2012-2030
(Existing Units, Unit Retirements, Planned Uprates, and Units Under Construction in 2014
Source: EIA, AEO 2014ER.
Taking these retirements into account, along with the projected addition of the five nuclear generating units under construction in the Southeast, EIA projects that regions will continue to rely on nuclear plants to produce a considerable share of power supply by the year 2020 (as shown in Figure 15), with declining zero-carbon nuclear generating capacity beyond then (see Figure 14).
79 See my forthcoming paper: S. Tierney, “Today’s Nuclear Fleet: What Role in the Nation’s Clean, Affordable and Reliable Power Strategy?”

Electric System Reliability and GHG Emission Reductions Under CAA Section 111(d) – May 2014
Analysis Group, Inc. Page | 37
Figure 15 Projected Regional Reliance on Nuclear Energy 2020
(NERC Subregions80)
Source of data: EIA, AEO 2014ER, ref2014.d102413a, Table 96. Note that because these projections are based on NERC subregions rather than state-specific generation estimates for 2020, there may be no nuclear units in some states with that show shading (rather than being a white color). Compare Figure 13 to this one, for the location of nuclear units by state. Note that NERC regions and subregions are shown in Appendix 3.
When a nuclear plant retires, its output tends to be replaced (at least in the near term) with generation from plants that burn natural gas, oil or coal. Loss of nuclear units leads, therefore, to higher CO2 emissions. Reportedly, California’s CO2 emissions increased by 10 percent after the recent loss of the output from the two San Onofre units that shut down in early 2012.81
The need to replace zero-carbon generation at any additional nuclear plants that shut down could increase the pressure on states to include Section 111(d) SIP elements addressing this 80 States’ output shown on the map above is based on their location within EIA’s Electricity Market Module Regions. For states in more than one region, a state has been assigned to the particular region in which the majority of the state is located (by land, not necessarily load). There may be no nuclear units in some states with a shading (i.e., not white color), in light of the market sub-regions used in EIA modeling. 81 The California Air Resources Board has reported that CO2 emissions in the state increased from 2011 to 2012, “primarily due to emission increases from California electricity generation using natural gas as a fuel”, which in turn were tied to low hydro conditions, higher demand as a result of warmer weather and a recovery economy, and the shutdown of the San Onofre nuclear station in early 2012. World Nuclear News, “Greenhouse gas emissions from power plants in California increased by 35% in 2012, partly due to the early closure of the San Onofre nuclear power plant,” November 5, 2013.

Electric System Reliability and GHG Emission Reductions Under CAA Section 111(d) – May 2014
Analysis Group, Inc. Page | 38
situation. For example, EPA should consider requiring states with existing nuclear plants to demonstrate in their SIPs mechanisms to assure retention of such zero-carbon electricity supply and/or address the potential loss of resources with no GHG emissions. Additionally, the states located in regions with (a) deep reliance on nuclear generation (Figure 15), (b) merchant nuclear plants located in ERCOT, PJM, MISO, NYISO, ISO-NE (Figure 13), and (c) significant coal retirements (Figure 5, and discussion in the following section) should consider including elements in their SIPs to create incentives to retain safely operating zero-carbon generating capacity and/or to recognize the potential to generate electricity with no carbon emissions as a result of any planned nuclear capacity uprates.
Responses to EPA MATS regulations
Owners of many existing coal-fired power plants are planning for their future in light of the EPA’s MATS regulations issued at the end of 2011. EGUs affected by the MATS rule will need to be in compliance by 2016, with some exceptions as noted by EPA.82
In anticipation of these regulations and in light of market fundamentals, many of the older and less-efficient coal plants may retire before the MATS compliance deadlines. (See Figure 5.) (Various observers have estimated the expected amounts of retirements, but comparisons among them are hard because they reflect different time periods for their baseline generating capacity and forward period for retirements.83) Some of the coal plant capacity has already retired (e.g., 25.4 GW from 2008 through 2013, as shown in Table 5), leaving 303.7 GW of coal-fired capacity as of the beginning of 2014. Because owners of plants affected by the MATS rule have until roughly 2016 to comply with the rule’s requirements, the retirements occurring before then can be viewed as heavily affected by current power market pressures. In addition to the 25.4 GW already retired, another 18.4 GW has been announced to retired through 2016, with most of that retiring by the end of 2015 and located in the RFC (Midwest) and SERC (Southeast) regions (see Figure 5).
82 See EPA December 2011 MATS Enforcement Policy Letter. 83 “Over 52 GW (about 16% of the existing coal fleet) of coal-fired electric generating capacity has been announced for retirement by 2025. Of this, about 45 GW will retire by 2016.” Amlan Saha, “Review of Coal Retirements,” MJ Bradley Associates, April 2013. SNL has recently reported that owners of 47 GW (roughly 14.6 percent of the 323 GW of coal-fired generating capacity operating as of 2012) have announced the retirement of such units before 2016. Jesse Gilbert and Andrew Gelbaugh, “Coal under fire: Assessing risk factors and market impacts for upcoming coal retirement decisions,” SNL Financial, December 2013 (hereafter “SNL 2013 Coal Retirement Study”), page 14.

Electric System Reliability and GHG Emission Reductions Under CAA Section 111(d) – May 2014
Analysis Group, Inc. Page | 39
A December 2013 SNL study analyzed the combined economic pressures from MATS compliance and other factors (including low natural gas prices, wholesale power prices and demand forecasts). SNL estimates that an additional 16.9 GW is ‘at risk” of retirement, with that amount decreasing to 15 GW if average natural gas prices are 50 cents/MMBtu higher than the base case and increasing to 22.3 GW if average natural gas prices are 50 cents/MMBtu lower than in the base case [by 2016]. 84 Most of the coal-fired capacity identified as ‘at risk’ of retirement by SNL is located in parts of the Midwest and the Southeast, as shown in Figure 16, reproduced from the SNL study. These ‘at risk’ units are older, smaller and worse performing compared to the average coal fleet overall. This capacity has an average unit size of 102 MW, an average age at retirement of 51 years old, and an average capacity factor of 51 percent.85
84 SNL’s report identified 323 GW, but included the 9 GW that had been retired in 2012. As of the start of 2013, SNL identified 314 GW of coal plants in operation as of the beginning of 2013. Of this capacity, 13 GW are not “EGUs,” and therefore are not subject to MATS regulations. SNL identified 113 GW of existing coal-fired capacity “which appear to need some retrofits for MATS compliance but have neither announced specific plans for major retrofits nor firm retirement plans.” SNL 2013 Coal Retirement Study, page 12-16.
SNL’s analysis of announced retirements plus capacity at-risk of retirement is generally consistent with February 2014 study published by the Brattle Group, which identifies additional announced retirements totaling 25 GW in 2014 through 2016, as a result of the combined effects of low wholesale electricity prices and the cost of compliance with pollution-control equipment. This report summarized coal-plant retirements by year: Actual retirements in 2012 (9.0 GW) and 2013 (6.0 GW), totaling 15 GW. Announced additional retirements in 2014 (3.5 GW), in 2015 (16.9 GW), and 2016 (4.6 GW, for a total of 25 GW between now and the end of 2016. Martin Celebi, Brattle Group, “Coal Plant Retirements and Market Impacts,” February 5, 2014. 85 SNL 2013 Coal Retirement Study, Figure 22.
Table 4 Operating Statistics for ‘At-Risk” Coal Retirements for Select Regions
2011 Capacity Factor
Average Heat Rate
Average Age at Retirement
Average size (MW)
MISO (Midcontinent) 52.29 11,598 51 75 PJM (MidAtlantic and Midwest) 40.51 11,414 53 67 Southeast 38.11 10,527 50 169 AZ/NM (Arizona and New Mexico) 65.15 10,953 39 192 SPP (Southwest) 61.44 11,065 48 97 Central 64.79 10,679 60 144 All regions 51.19 11,138 51 102 Source: SNL 2013 Coal Retirement Study, Figure 22.

Electric System Reliability and GHG Emission Reductions Under CAA Section 111(d) – May 2014
Analysis Group, Inc. Page | 40
Figure 16
Source: SNL 2013 Coal Retirement Study. The note on the bottom of the chart reads: States are shaded by total at risk and announced retirements (2012-2021) as a percentage of the state’s total 2012 installed capacity (adjusted for availability), as of Nov. 15, 2013.
By now, electric companies and grid operators affected by these retirements have been planning to assure compliance as well as system reliability for many years.86 According to EIA, as of the end of 2012, “70% of the U.S. coal generating capacity already had the appropriate environmental control equipment to comply with the MATS and allow their operation past 2016. Another 6% plan to add control equipment, while 8% have announced plans to retire. Owners of the remaining 16% are faced with the decision of upgrading or retiring their plants.”87
86 See, for example, M. Bradley, S. Tierney, C. Van Atten, and A. Saha, “Ensuring a Clean, Modern Electric Generating Fleet while Maintaining Electric System Reliability,” Fall 2011 Update, November 2011; NERC, “2010 Special Reliability Scenario Assessment: Resource Adequacy Impacts of Potential U.S. Environmental Regulations,” October 2010. 87 EIA, “Coal-fired power plant operators consider emissions compliance strategies,” March 28, 2014.

Electric System Reliability and GHG Emission Reductions Under CAA Section 111(d) – May 2014
Analysis Group, Inc. Page | 41
The most recent long-term reliability assessment published by NERC indicates that reserve margins will be adequate in upcoming years in all parts of the country, with two notable exceptions: ERCOT (the TRE reliability region in Texas) and the MISO region.88
In ERCOT, for example, relatively near-term resource adequacy issues have been headline news for several years, with different parties expressing views about the need for changes in the wholesale power market design (which is an “energy-only” market) to assure new investment in generating capacity.89 This debate is separate from the state’s response to the MATS rule. In its recent analysis of at-risk generating assets, SNL found “no units in ERCOT were identified as at risk under the SNL base case…”90 ERCOT’s regulators, grid operator and stakeholders are working on solutions to address these low-reserve-margin issues, including instituting additional market-design changes, demand-response and other actions.
At the end of 2013, MISO issued a report summarizing power plant owners’ plans for unit retirements, and indicated that “25 coal-fired units, representing 8.2 GW of capacity, or about one-eighth of the MISO coal fleet capacity, have yet to determine whether they need an additional year to comply with MATS.”91 MISO’s summary indicated a potential shortfall of capacity by 2016 but only if all of that capacity retired and no significant steps end up being taken to increase additional demand-response, energy efficiency, incremental generating capacity, and/or transmission additions. The SNL analysis of ‘at risk’ capacity identifies 6 GW in MISO, with that capacity at small, old, and inefficient units.92 Some have offered suggestions
88 NERC, “2013 Long-Term Reliability Assessment,” December 2013, page 2 and Figure 2 (page 6). 89 For example, “ERCOT projects that reserve margins will fall to 9.8% by 2014, substantially below its current reliability target of 13.75%. Reserve margins will decline even further thereafter unless new resources are added. Generation investors state that a lack of long-term contracting with buyers, low market heat rates, and low gas prices in ERCOT’s energy-only market make for a uniquely challenging investment environment. In response to these concerns, the Public Utility Commission of Texas (PUCT) has implemented a number of actions to ensure stronger price signals to add generation when market conditions become tight…. The key question is whether market prices will be high enough to support entry at an acceptably high reserve margin and associated reliability level.” Samuel Newell, Kathleen Spees, Johannes Pfeifenberger, Robert Mudge, Michael DeLucia, Robert Carlton, “ERCOT Investment Incentives and Resource Adequacy,” June 1, 2012. 90 SNL 2013 Coal Retirement Study, page 17. 91 MISO's "3rd Quarter 2013 EPA Survey Update," November 13, 2013, as reported by Jonathan Crawford, “More than 8 GW of MISO coal capacity still undecided on compliance path for EPA mercury rule,” SNL Exclusive, November 18, 2013. “An additional 24 coal-fired units in MISO, accounting for 4.1 GW, that were listed as needing a one-year extension to meet the MATS emissions limits were identified as not having submitted an extension request to regulators for approval. The survey had a participation rate of 98.5%, with 1 GW of MISO's total 66 GW of coal capacity not included in the results….. On the positive side, the survey showed that 35 coal-fired units in MISO, accounting for 11.7 GW, were approved for a one-year extension to comply with MATS. That is out of 84 coal units, representing 24 GW, which could possibly need a one-year extension….This is consistent with calls by the EPA that state regulators be liberal in granting approval of the compliance deadline extension requests.” 92 See prior table. SNL 2013 Coal Retirement Study, Figure 19.

Electric System Reliability and GHG Emission Reductions Under CAA Section 111(d) – May 2014
Analysis Group, Inc. Page | 42
about steps that could be undertaken by parties in the MISO region and states in the near term to ensure adequate reserve margins in 2016.93 These include: improving joint planning and coordination with neighboring regions with very-high reserve margins (e.g., SPP); increasing the notice that generators must give of their intention to close temporarily or permanently (beyond the current 6-months’ notice requirement); and encouraging states to coordinate their plans (e.g., for energy efficiency, demand response) with MISO’s.
MISO is taking steps to assuring resource adequacy in light of MATS regulations. MISO is also actively planning for the cost and reliability implications of upcoming Section 111(d) regulations (e.g., for additional retirements beyond those likely to occur before Section 111(d)’s implementation). For example, MISO has recently refreshed its analysis of the impacts of region-wide versus more zonal approaches that MISO states might choose to take with respect to managing their future compliance with Section 111(d), and concluded that a more flexible, region-wide approach may lower the overall cost of compliance.94 This latter analysis does not specifically assess reliability implications of compliance strategies, but it nonetheless invites cooperative approaches to design compliance schedules and pathways in light of the realities of interstate electricity market operations and reliability considerations.
In both MISO and ERCOT (as elsewhere in the nation), there are at least five years before the full effect of implementation of Section 111(d) will occur. States will have many tools and flexible approaches to use in planning for compliance with GHG emission limits, and addressing reliability and other concerns. For example, MISO and ERCOT have significant amounts of underutilized natural gas combined-cycle capacity whose more-frequent dispatch could absorb some of the generation needed in those regions to comply with Section 111(d). (See Figure 6.) Many states in the MISO region rely on integrated resource plans to assure resource adequacy, and these states can take steps in near-term planning cycles to assure both adequate capacity and generation that emits lower CO2 emissions. As a single state RTO, ERCOT and Texas regulators have demonstrated an ability to take aggressive action to implement policies deemed to be important for the state.95
93 For example: John Moore, NRDC, “We Can Have Both a Reliable Grid and a Cleaner Environment,” December 9, 2013. http://switchboard.nrdc.org/blogs/jmoore/we_can_have_both_a_reliable_gr.html. 94 MISO, “Refresh of MTEP-10 Carbon Analysis,” presentation to PAC Meeting, February 19, 2014. 95 Note that Texas/ERCOT undertook steps in the past decade to create incentives for investment in renewable energy and high-voltage transmission facilities. Today, Texas has the highest amount of wind power capacity (12,355 MW as of the 4th quarter of 2013). It has more wind capacity than the combined amount in the two states with next-highest amount of wind generating capacity

Electric System Reliability and GHG Emission Reductions Under CAA Section 111(d) – May 2014
Analysis Group, Inc. Page | 43
New Generating Capacity Proposals
Given the relatively low price of natural gas, the “fuel of choice” for new power generation capacity planned and under construction by electric utilities and independent power producers has shifted to natural gas and renewable power plants, and away from coal. Figure 17 shows the location of capacity under construction (by state). Half of the power plant capacity under construction is at gas-fired power plants, with another fifth at renewable facilities. There are five new nuclear reactors under construction in the Southeast. Of the other projects in advanced development (e.g., well along in permitting but not yet under construction), approximately one-third of the capacity is at gas-fired power plants, and another 42 percent is at renewable projects. Figure 18 shows the expected net changes in generating capacity from 2013 through 2017, by fuel type and by NERC region. These data reflect the effect of new plants under construction or planned (especially natural gas-fired capacity and renewable projects), as well plant retirements (especially coal, oil, and nuclear retirements).
Figure 17 Generating Capacity Under Construction by State as of March 2014
Source of data: SNL Financial
(California, with 5,830 MW, and Iowa, with 5,178 MW). American Wind Energy Association, “U.W. Wind Industry Fourth Quarter Market Report, 2013,” page 6. Since 1999, when Texas restructured its electric industry, there has been $14.3 billion investment in transmission, with 9,141 new circuit miles of transmission improvements, with another 2,558 circuit miles and $3.7 billion of planned transmission. ERCOT Quick Facts, 2014. Currently, Texas has 5,833 MW of power plants under construction, and another 1,671 MW in advanced development, most of which is scheduled to come on line in 2014 and 2015. Of this, 3,940 MW is gas-fired capacity. Charlotte Cox, “Nearly 6 GW of capacity under construction in ERCOT, with 42 GW planned,” SNL Data Dispatch, February 26, 2014.

Electric System Reliability and GHG Emission Reductions Under CAA Section 111(d) – May 2014
Analysis Group, Inc. Page | 44
Figure 18 Changes in Capacity by Fuel and by NERC Region from 2013 to 2017
(Showing Capacity Additions and Retirements)
Source of data: SNL Financial (as of March 2014)
Implications of the Changing Electricity Resource Mix
The significant changes underway in the electric industry (and described above) set the stage for states’ planning for compliance with Section 111(d). To a large degree, many of these changes create breathing room for compliance with upcoming GHG regulations while also maintaining electric system reliability.
Around the country, the changing conditions reflect the combined effects of low natural gas prices, significant under-utilized capacity at existing gas-fired power plants around the country, relatively slow demand growth, continuing opportunities for cost-effective energy efficiency, retirements of older and less efficient coal-fired generating capacity, new natural-gas-fired and

Electric System Reliability and GHG Emission Reductions Under CAA Section 111(d) – May 2014
Analysis Group, Inc. Page | 45
renewable energy capacity under construction, and substantial progress toward compliance with MATS by 2016.
The conditions create opportunities for states to maintain system reliability as they plan for compliance with Section 111(d). For example, the presence of under-utilized capacity at existing gas-fired power plants and the outlook for relatively low natural gas prices allow for a relatively affordable pathway to lower GHG emissions, but doing so must be accompanied with advanced planning to assure that natural gas supplies can be delivered and/or stored reliably as electric systems increase their reliance on natural gas. (New England has already had to accelerate its planning to respond to this type of situation while assuring reliable system operations.96) Federal regulators and policy makers, grid operators, and many others are focusing on this question of gas-deliverability and harmonization of electric and gas markets.97 Continued attention to this issue will be important for reliability, regardless of the implementation of Section 111(d).
Similarly, new gas-fired power plants, new renewable projects, and new nuclear capacity additions will further support reliable compliance with Section 111(d). That said, states (and the federal government) should not assume that zero-carbon generating capacity at existing nuclear stations will automatically be available in the future, especially at merchant nuclear plants located in organized markets which are facing significant financial pressure to remain in operation.98 Planning for reliable and affordable compliance with Section 111(d) should proactively address market reforms and other policies (including design of SIPs) to retain zero-carbon electricity supplies.99
In the parts of the country – like MISO and ERCOT – with pre-existing reliability challenges, Section 111(d) will only exacerbate that situation if nothing is done to address them. Clearly,
96 ISO-NE has for the past two years focused attention on ways to ensure winter reliability in an electric system with high reliance on natural gas, pipeline capacity constraints, and lack of incentives in the market design to ensure gas-fired generators have fuel to allow them to operate. 97 See, for example, NERC, “2013 Long-Term Reliability Assessment,” December 2013, page 2 and Figure 2 (page 6); Questions of the leadership of the House Energy and Commerce Committee to MISO, PJM, NYISO, and ISO-NE, March 27, 2014; FERC notice of proposed rulemaking on Coordination of the Scheduling Processes of Interstate Natural Gas Pipelines and Public Utilities, 146FERC¶61,201, 18 CFR Part 284, Docket No. RM14-2-000, March 20, 2014; Testimony of Acting Chair Cheryl LaFleur and Commissioners Philip Moeller, John Norris and Tony Clark before the House Energy & Commerce, Subcommittee on Energy and Power, valuating the Role of FERC in a Changing Energy Landscape, December 5, 2013. 98 See my forthcoming paper: S. Tierney, “Today’s Nuclear Fleet: What Role in the Nation’s Clean, Affordable and Reliable Power Strategy?” 99 See further discussion below on “outside the fence” actions to reduce GHG emissions.

Electric System Reliability and GHG Emission Reductions Under CAA Section 111(d) – May 2014
Analysis Group, Inc. Page | 46
the industry, state and federal regulators, grid operators, and many other stakeholders are working to address these pre-existing reliability challenges, through a wide range of solutions. These options include potential market reforms, new power plants, new power lines, new gas transmission, more efficient use of existing transmission and distribution systems for electricity and gas, increased investment in demand-side measures, and other things.
Section 111(d)’s compliance period is far enough in the future that there will be time for states and regions to transition toward lower GHG emissions while retaining electric reliability. And, as described previously, Section 111(d) affords broad flexibility to the states to respond to upcoming GHG emissions requirements in a way that preserves electric system reliability.
Planning for Compliance with EPA Guidance Under Section 111(d) of the CAA
Breadth of Options Available to the States in Developing Section111(d) SIPs
Even in advance of EPA’s proposed guidelines (June, 2014), it is already clear that states will have discretion to consider and propose a wide range of options as part of their plans. EPA officials have signaled their intention to allow each state to submit a SIP that enables them to comply with EPA’s guidance and tailor their approach to meet multiple state-specific goals, including affordable and reliable electricity supplies.100
It is likely that as long as a state is able to demonstrate that its SIP is at least equivalent to EPA’s guidance (in terms of reducing GHG emissions from affected power plants), then that state will have significant flexibility in developing its preferred package of policies. For example, SIPs may create incentives for EGUs and NGCCs to reduce emissions “within the fence” line of the covered units themselves. SIPs may include elements that affect actions occurring “outside the fence,” where there is a strong connection between those actions and emission reductions at plants covered by Section 111(d). (See Figure 19.) This combination of options creates significant opportunities to plan for reliability while also planning for cost-effective GHG emissions reductions.
100 For example, remarks of Administrator Gina McCarthy, Acting Administrator for Air and Radiation Janet McCabe and Senior Air Advisor Joseph Goffman at the meeting of the National Association of Regulatory Utility Commissioners, February 7th and 11th, 2014.

Electric System Reliability and GHG Emission Reductions Under CAA Section 111(d) – May 2014
Analysis Group, Inc. Page | 47
Figure 19
Inside the Fence Options
“Inside the fence” actions differ in terms of engineering, cost and feasibility of potential GHG reductions. For example, Dr. James Staudt has identified two categories of actions that can accomplish GHG emissions reductions at existing coal plants: (a) heat rate improvements at the units, which improve the efficiency of the boiler and/or steam plant (in terms of the amount of fuel it needs to burn to generate a unit of electricity), or reduce auxiliary loads at the station; and (b) conversion to a less carbon-intensive fuel, by fuel-switching, co-firing and/or reburn approaches.101 These engineering-based approaches all focus on reducing a plant’s rate of GHG emissions relative to its production of electricity.
101 Dr. James Staudt, “Reducing CO2 Emissions from Fossil Fuel Power Plants,” presented to the Bipartisan Policy Center workshop on Section 111(d), December 6, 2013. Dr. Staudt has identified the various engineering options for reducing CO2 emissions from existing coal plants: (1) “Potential Approaches for HR [heat rate] Improvement: Coal Drying (esp., lignite coals); Variable Speed

Electric System Reliability and GHG Emission Reductions Under CAA Section 111(d) – May 2014
Analysis Group, Inc. Page | 48
States seeking these types of engineering approaches could require each affected EGU or NGCC to reduce its emissions by a certain percentage, or meet a maximum emission rate for CO2/MWh. A state could impose a common standard to all plants in a category of EGUs, or it could tailor the requirements to particular conditions at different plants (reflecting, for example, their remaining useful life, or their role in providing local reliability).
The Department of Energy’s National Energy Technology Laboratory (“NETL”) has studied the opportunities for “inside the fence” power-production efficiency improvements, and has estimated that they could improve power plant performance (and thereby reduce coal combustion and GHG emissions) in the range of 1 percent to as high as 12 percent, depending upon the particular set of engineering actions taken at different coal-fired facilities.102
Other SIP approaches that could lead to “inside the fence” GHG reductions at EGUs and NGCCs would include modifications to the operating permit of particular plants so as to limit the dispatch and generation output of one or more units. It is not uncommon for power plants to have certain operational limits. Sometimes these limit the unit’s overall annual output to an amount equivalent to 30 days of output at full power.103 Or the unit may be dispatched only when local system reliability requirements demand operation of the generating unit (such as shortage events in the summer or winter period).104 Such inside-the-fence operating constraints Drives; Centrifugal to Axial fan conversion; Steam turbine modifications; Intelligent soot-blowing system; New APH seals; Repair boiler casing and duct in-leakage; Condenser cleaning. [2] Using less Carbon-Intensive Fuels: Conversion (convert to 100% gas), with a capital cost of ~$80/kW (with gas on site); Cofiring/Reburning (10-15% gas) Modest cost (somewhat higher for reburn), assuming gas is on site, with co-benefits from reducing NOx emissions as well.” 102 A recent study by the NETL evaluated four efficiency improvement projects, the three of which are ‘off-the-shelf’ technologies: 1. Coal Pulverizer Improvement; 2. Condenser Improvement; 3. Steam Turbine Upgrade; and 4. Solar Assisted Feedwater Heaters. NETL’s analysis found opportunities to reduce GHG emissions in the range of 1.7 to 6.9 percent, with the highest reduction potential at less-efficient power plants. NETL, “Options for Improving the Efficiency of Existing Coal-Fired Power Plants,” DOE/NETL-2013/1611, Final Report, April 1, 2014, pages 1-4. Prior NETL studies examined the effect of efficiency improvements: NETL, “Reducing CO2 Emissions by Improving the Efficiency of the Existing Coal-fired Power Plant Fleet,” DOE/NETL-2008/1329, July 23, 2008. By examining the efficiency of the top performing coal-fired power plants relative to the efficiency level of the fleet on average, NETL calculates that if changes could be made across the fleet to bring all of the plants up to the top 10 percent performance level, then the CO2 emissions associated with a constant level of MWh generated could be reduced by approximately 12 percent. This conclusion was further examined in NETL, “Improving the Efficiency of Coal-Fired Power Plants for Near Term Greenhouse Gas Emissions Reductions” (DOE/NETL-2010/1411), April 16, 2010. NETL concluded that the use of a combination of aggressive refurbishment and improved operation and maintenance at existing coal plants could improve the average fleet’s overall efficiency. 103 This approach was used in the air permit approvals issued in 1999/2000 by the Massachusetts Department of Environmental Protection for capacity expansion at Mystic Station, in which a new 1500-MW NGCC was permitted to operate in conjunction with imposition of 30-day operating limits on several other older generating units that also existed at the same station. 104 For example: Several years ago, Exelon Corporation decided to retire units at two generating stations in Pennsylvania (the Eddystone and Cromby units) due primarily to economic factors. In its analysis to determine whether such retirements would lead to system reliability problems, the grid operator (PJM) determined that in the absence of transmission upgrades, retirements of

Electric System Reliability and GHG Emission Reductions Under CAA Section 111(d) – May 2014
Analysis Group, Inc. Page | 49
would affect the terms and conditions of plant dispatch, causing the grid operator (e.g., the local vertically integrated utility, or the RTO) to dispatch other power plants to make up for power it might otherwise have wanted to generate at the restricted unit. A state (or an owner of multiple power plants within the state) might find it economically preferable to impose operating limits on Unit A (with relatively high GHG emissions per MWh) and to dispatch Unit B (with higher operating costs but lower GHG emissions per MWh), than to require both Unit A and Unit B to invest in engineering actions leading to heat rate improvements at both. The permit limitation on Unit A would be the action inside the fence of that plant, and the electricity requirements for the system could be satisfied by electricity generation at Unit A and B.
In theory, a state could identify plants that provide some form of important functionality to the system but produce GHG emissions that are relatively expensive to control through one of the types of actions above. The state could introduce a limitation on that unit’s output over an annual period of time such that its MWh and GHG emissions would be capped, while retaining its availability during high load periods, and with its MWh replaced at cleaner unit(s) during periods of low or medium electric demand. The latter approach would be one type of tool that states could use to assure that the compliance pathways demonstrated in their SIPs take into account both GHG emissions reductions and reliability concerns.
Outside the Fence Options
A much wider set of cost-effective emissions reductions could result from SIP elements involving actions in the electric system occurring outside the fence of a specific unit subject to Section 111(d).105
those units would lead to violations of security standards. Exelon entered into agreements with PJM and with the state air regulatory office so that the plant could remain on line pending those transmission upgrades, but allowing the units to be dispatched by PJM only when needed for reliability purposes. Prepared Testimony of Kathleen L. Barrón, Vice President, Federal Regulatory Affairs and Policy Exelon Corporation, before the FERC, Reliability Technical Conference Docket No. AD12-1-000 (etc.), November 11, 2011. This agreement was referenced by CATF in its 2011 proposal for “reliability-only dispatch”: “to minimize health risks, we propose limiting the operation of any such units to the brief periods when required to preserve reliability, i.e., when no other resource is available to meet the electricity need. Such a targeted “Reliability---Only Dispatch” approach can serve the goals of both the Federal Power Act’s reliability framework and the Clean Air Act’s express concern for near term reductions of air toxics and maximum protections for public health and the environment…. Through such customized solutions to identified reliability issues and tailored to specific, local circumstances, the Cromby---Eddystone example demonstrates that when a plant must continue to operate for some period due to reliability needs, it can be limited to running only to meet those reliability needs.” John Hanger, “Reliability Only Dispatch: Protecting Lives & Human Health While Ensuring System Reliability,” Clean Air Task Force, pages 5, 23. 105 In the example above, Unit B’s redispatch to replace power that would otherwise have come from Unit A is an example of an outside-the-fence counterpart action to the inside-the-fence action at Unit A.

Electric System Reliability and GHG Emission Reductions Under CAA Section 111(d) – May 2014
Analysis Group, Inc. Page | 50
Emission Averaging and Carbon Budgets
Many observers have examined the economic and emissions trade-offs associated with engineering-approaches versus more market-based compliance approaches. For example, Dallas Burtraw and Matt Woerman compared the cost to achieve a ton of CO2 emission reduction through inside-the-fence actions versus outside-the-fence options enabled through a ‘tradable performance standard.’ Starting with estimates of the cost to accomplish the types of inside-the-fence options, they determined that with the money it would take to accomplish 4 percent reductions in GHG emissions inside the fence, it would be possible to achieve four times the amount of total emissions reductions if power plants were allowed the flexibility to trade emissions reduction opportunities.106
They and others107 have analyzed variations on this approach of allowing a state to comply with EPA guidance by creating a rate-based or mass-based tradable currency, either of which could allow units with a higher level of GHG emissions per MWh to trade with those having a lower-than-average level of GHG emissions per MWh.
The Philips/CATF 2014 study explains how the use of a mass-based standard (converted from an original rate-based standard) has numerous benefits because it overcomes certain market distortions that might arise with use of a rate-based standard alone. “First, the positive price on carbon emissions and lack of production incentives means they would diminish or avoid the previously described emission rebound, seams and longer term regulatory transition concerns associated with most rate-based approaches. Also, they would give states another proven, practical compliance pathway and greater flexibility than if every state were restricted to complying through a mandatory emission rate standard. …Further, the accounting rules required to reflect the impact of new
106 A “specific emissions rate improvement averaged over a larger set of generators reduces the actual emissions change. A marginal abatement cost criterion to compare policy designs suggests cost-effectiveness across sources. This criterion can quadruple the emissions reductions that are achieved, with net social benefits exceeding $25 billion in 2020, with a 1.3 percent electricity price increase.” Dallas Burtraw and Matt Woerman, “Technology Flexibility and Stringency for Greenhouse Gas Regulations,” Resources for the Future, July 2013, executive summary. 107 For example, Phillips/CATF 2014; Christopher Van Atten, “Structuring Power Plant Emissions Standards Under Section 111(d) of the Clean Air Act – Standards for Existing Plants,” MJ Bradley & Associates, October 2013; National Climate Coalition, “Using EPA Clear Air Act Authority to Build a Federal Framework for State Greenhouse Gas Reduction Programs,” September 2013.

Electric System Reliability and GHG Emission Reductions Under CAA Section 111(d) – May 2014
Analysis Group, Inc. Page | 51
renewable facilities, energy efficiency programs and nuclear uprates, would be much more straightforward under a mass-based system than a rate-based system.”108
More generally, mass-based standards can be translated into a total amount of GHG emissions “budgeted” or allowed to occur in a state. A budget could apply to all units collectively within a state, or to groups of units within a state, or to the units in multiple states that have compacted with each other. Chris Van Atten has described how a state budget approach might work: “In proposing a state budget approach, EPA could still develop a rate-based performance standard and then translate that performance standard into state budgets, giving each individual state the choice in terms of whether to impose a rate-based performance standard or state-wide emissions budget. In guidance to states, EPA could: define the appropriate baseline period (i.e., the MWh data used in converting the lbs./MWh standards to tons); determine whether and how future economic growth should be factored into the calculation of the budgets; and define trading rules for states that elect to allow trading as a compliance mechanism.”109
Demand-side and non-carbon emitting options
States could take action to create incentives specifically aimed at adding and/or retaining zero-carbon electricity supply through adoption of a tradable emission standard (“TES”) or clean 108 Also, “Rate-based approaches…are typically established so that some covered generating sources have emission rates above the standard and others have rates below the standard. Generating sources with emission rates above the standard must undertake actions to come into compliance. Generating sources with emission rates below the standard have a financial incentive to increase their production, assuming an emission credit trading program, because every additional unit of generating output “earns” that generator additional emission credits which have a financial value under the trading program. In the case of a single blended fossil rate standard covering both coal and gas generation, NGCC units would typically be awarded emission credits whenever they generate output. This would allow gas units to sell power for less than their direct variable fuel and O&M costs. The value of the credits earned by generating additional output partially offsets the unit’s variable cost of production, reducing the marginal cost of dispatch and making the unit more competitive with other sources of generation in that power market without comparable production incentives. Such production incentives can lead to unintended adverse consequences….. create what often are referred to as “seams” conflicts at the borders of mass-based trading programs such as RGGI and other mass-based programs, emissions “rebound”, and greater difficulty in transitioning to longer term national carbon policies.” Phillips/CATF 2014 (pages 8-9, 18). 109 Also: “States would … have the flexibility to determine their preferred method for meeting their assigned budget, including the option of relying on a system of transferable emissions permits. If states elected to implement a trading program, power plant operators would track their CO2 emissions and surrender an emissions permit for each ton of CO2 released to the atmosphere….. For example, a state could propose to give each company operating in the state a set number of emission permits. Under such a scenario, a regulated utility might advocate for a company-wide emission budget that it could reflect in its integrated resource plan.” Christopher Van Atten, “Structuring Power Plant Emissions Standards Under Section 111(d) of the Clean Air Act – Standards for Existing Plants,” M. J. Bradley & Associates, October 2013, pages 17-18.
Electric System Reliability and GHG Emission Reductions Under CAA Section 111(d) – May 2014
Analysis Group, Inc. Page | 52
energy standard (“CES”). When applied to owners of generating units in an area, the TES could be a mechanism through which generation of zero- and low-carbon electricity by suppliers (old and new) would create carbon-free electricity credits, for sale to others. For example, a state (or a group of states) could set assign a common target CO2/MWh to all generating units in the state, and then allow generators with different CO2/MWh emissions rates to buy/sell their CO2-emission permits. A provider of energy efficiency or demand-side measures could similarly generate CO2-emission permits. It would be important that such a standard be at or below the emissions rate achievable by NGCCs so as to avoid potential wholesale price distortions that would result from natural gas units generating rate credits by offering a price below their variable cost of generation (as could arise as described above by Phillips/CATF 2014).
By contrast, a state could apply the CES to sellers of retail power supply (e.g., load serving entities (“LSEs”)) to demonstrate that their overall supply portfolio satisfies a standard emissions amount (in much the same way that an RPS requires LSEs to include renewables as a percentage of their supply portfolios). A CES could cover all existing and new generation, thus allowing sellers of zero-carbon supply to find revenue streams to remain in and/or enter the market.
Allowing zero-carbon resources to capture the economic value of that attribute through efficient market-based transactions with other generators provides the state with the ability to arrive at a least-cost, reliable pathway toward overall electric system compliance.
RTO Dispatch Constraint Another recent variation on the outside-the-fence approach has been suggested for one multi-state RTO (or Independent System Operator (“ISO”)) region. In this approach, the RTO would expand the criteria it uses to determine the dispatch of power plants so that in addition to security-constrained economic dispatch, it would also use a total system-wide constraint on CO2 emissions. As described by its authors, this concept includes the following elements:
Translate EPA requirements into ISO-level targets on CO2 emissions, ideally with a single long-term target (e.g. X% reduction over 2000 level, by 2030). Short/ intermediate term targets may be necessary to guide the “emissions path,” but could limit flexibility of meeting the targets and possibly be less cost effective. ISO sets an initial path of “carbon values,” that are used in dispatching (based on

Electric System Reliability and GHG Emission Reductions Under CAA Section 111(d) – May 2014
Analysis Group, Inc. Page | 53
emissions profiles and bid offers) to reach the expected regional target. Plant dispatch minimizes total cost while meeting reliability and CO2 constraints. The resulting power market prices, paid by load, reflect the emission constraints. Generators are charged the per-unit carbon value for their CO2 emissions. Revenues collected are returned to load on a non-variable basis (maintaining proper price signals for demand-side resources). ISO adjusts carbon value path carefully when updated projections of emissions deviate significantly from original assumptions.110
These various mass-based approaches allow for cost-effective and administratively efficient means to reduce GHG emissions across the power plants dispatched in a system. And they allow for system conditions, such as reliability considerations, to factor into the manner in which the grid operator dispatches its plants to meet system requirements in regions with organized wholesale electricity markets.
Figure 20 shows (with color shading) the parts of the U.S. where an RTO (or ISO) is the grid operator and administrator of an organized wholesale market.111 In these areas, the RTO has responsibility for centrally dispatching power plants that are owned or controlled by market participants (e.g., utilities (including investor-owned, coops, publicly owned utilities) and IPPs) in that region.112 In states (or parts of states) which are not part of an RTO, the utility typically is responsible for centrally dispatching the power plants it owns or controls. In some states with a traditional vertically integrated electric industry structure, most if not all of the generating capacity is owned by utilities. The states with more than two-thirds of their generation produced at utility-owned power plants are shown with a pattern (dotted) on Figure
110 Judy Chang, Jurgen Weiss, Yingxia Yang, Jon Brekke, and Will Kaul, “A Market-based Regional Approach to Implementing EPA’s GHG Emissions Regulation,” Brattle Group and Great River Energy, January 2014. 111 “Presently, RTOs/ISOs geographic footprint covers approximately 2/3rds of the nation, encompassing regions that cover all or parts of 38 of the 50 states plus the District of Columbia. ISOs/RTOs serve approximately 75% of national demand.” ISO/RTO Council, “EPA CO2 Rule – ISO/RTO Council Reliability Safety Valve and Regional Compliance Measurement and Proposals,” January 31, 2014. 112 “ISOs/RTOs centrally dispatch power plants within their footprint based on the marginal cost of operation of each individual unit as reflected in bids submitted to the ISO/RTO on a day ahead basis.[fn] By dispatching generation resources across the I ISO/RTO footprint based on the marginal cost to produce the next MW of electricity, the economic efficiencies of the generation fleet is maximized for each hour of the operating day across the entire RTO footprint.[fn] Supply bids submitted by generators effectively internalize environmental compliance costs while still ensuring least cost compliance with environmental requirements.[fn] The regional centralized dispatch undertaken by ISOs/RTOs is known as Security Constrained Economic Dispatch (SCED).” ISO/RTO Council, “EPA CO2 Rule – ISO/RTO Council Reliability Safety Valve and Regional Compliance Measurement and Proposals,” January 31, 2014.
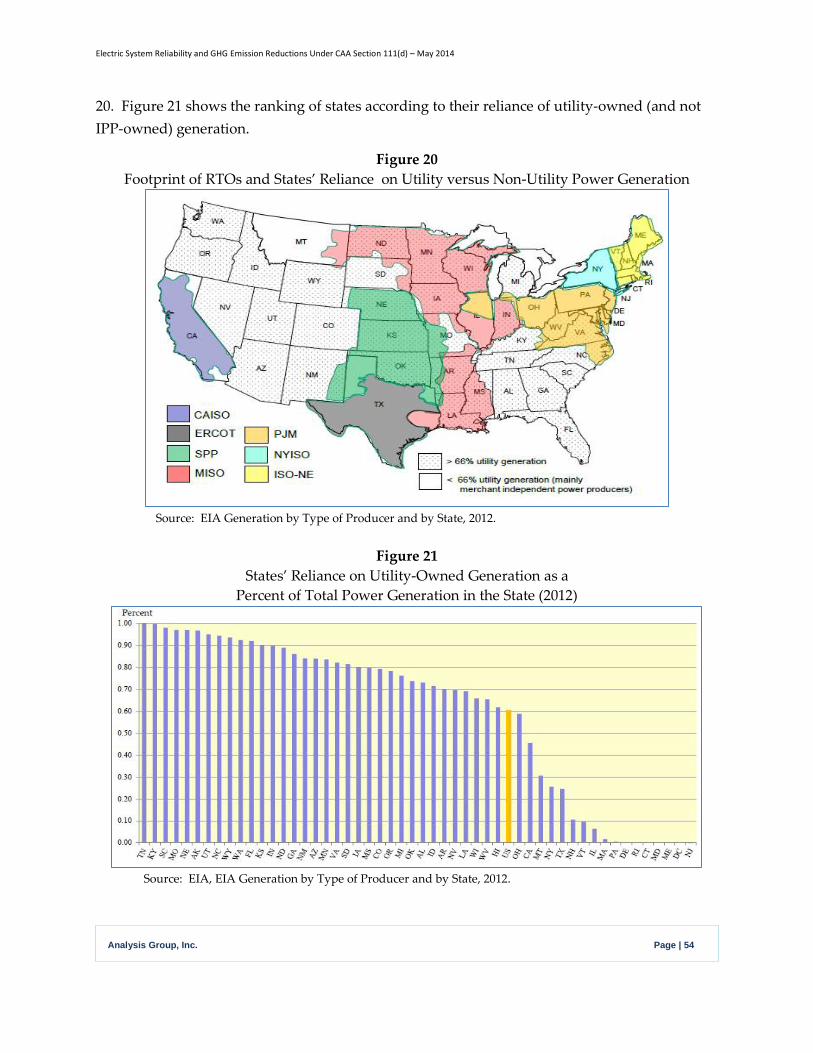
Electric System Reliability and GHG Emission Reductions Under CAA Section 111(d) – May 2014
Analysis Group, Inc. Page | 54
20. Figure 21 shows the ranking of states according to their reliance of utility-owned (and not IPP-owned) generation.
Figure 20 Footprint of RTOs and States’ Reliance on Utility versus Non-Utility Power Generation
Source: EIA Generation by Type of Producer and by State, 2012.
Figure 21
States’ Reliance on Utility-Owned Generation as a Percent of Total Power Generation in the State (2012)
Source: EIA, EIA Generation by Type of Producer and by State, 2012.

Electric System Reliability and GHG Emission Reductions Under CAA Section 111(d) – May 2014
Analysis Group, Inc. Page | 55
Recent modeling by Bruce Phillips for the CATF examines how two alternative policy designs for an emissions standard would work in a regional dispatch. As shown previously in Table 1, the “CATF 2.0” options that they modeled were: (a) a single mass-based standard applicable to all fossil power plants, and (b) an alternative that has a mass-based budget for emissions from coal-fired power plants and a rate-based standard for emissions from gas-fired power plants (which they have called the “Mass-Based Coal” budget as a short hand name).113 Phillips’ analysis found that both “approaches would reduce emissions through a mix of compliance actions: by reducing the heat rates (and consequently the emission rates) of coal units; displacing high emission rate coal generation with lower emission rate gas generation through an emission credit trading program; retiring coal generating capacity, and reducing electric demand through customer response to higher electric prices. Of these, the emission reductions from fossil dispatch represent the largest single source of reductions, in both cases approximately 70 percent of total compliance…..Heat rate improvements, coal retirements and electric price response comprise the remainder, with approximately 10 percent, 15 percent and 5 percent respectively.”114 The analysis also concluded that these policies would lead to relatively similar changes in generation and capacity mix: “Under the mass-based coal case, 42 GWs of coal capacity retire due to the policy (that is, relative to what would otherwise be expected in 2020), average national coal capacity factors decline from 67 to 58 percent and average national NGCC capacity factors increase from 48 to about 65 percent. Under the mass-based fossil case, 37 GWs of coal capacity retire, average national coal capacity factors decline to 58 percent and average national NGCC capacity factors increase to 63 percent.”115
113 Phillips/CATF 2014, page 17. 114 Phillips/CATF 2014, page 21. 115 Phillips/CATF 2014, page 21.

Electric System Reliability and GHG Emission Reductions Under CAA Section 111(d) – May 2014
Analysis Group, Inc. Page | 56
Figure 22 Modeled Changes in Generation Output, Capacity Retirements and Capacity Factors of Coal-
Fired and Gas-Fired Power Plants under Two Alternative CATF Policy Designs
Phillips/CATF 2014, page 22. This analysis suggests that there will be capacity retirements that are manageable, especially in light of the existence of underutilized NGCC capacity in all regions of the country, along with inherent flexibility in the Section 111(d) framework that will allow states to tailor their SIPs to local conditions and reliability requirements. ,
Outside-the-Fence Models Approaches: Examples to ensure reliable and economic compliance in states with different electric industry structures
Because states have different electric industry structures that affect how groups of power plants are dispatched to supply electricity at different times during the year, states will likely seek to take this factor into account as they consider different options for and inside-the-fence and outside-the-fence compliance approaches.
For example, there are two key features of industry structure: (1) presence or absence of an RTO; and (2) the extent to which utilities versus merchant generators (IPPs) dominate the power generation – seem relevant for how a state might consider structuring its SIP to include relatively cost-effective outside-the-fence policy elements. These two features essentially are proxies for the extent to which power plants owned by different entities participate in a common system for generation dispatch within a state (or across a region).
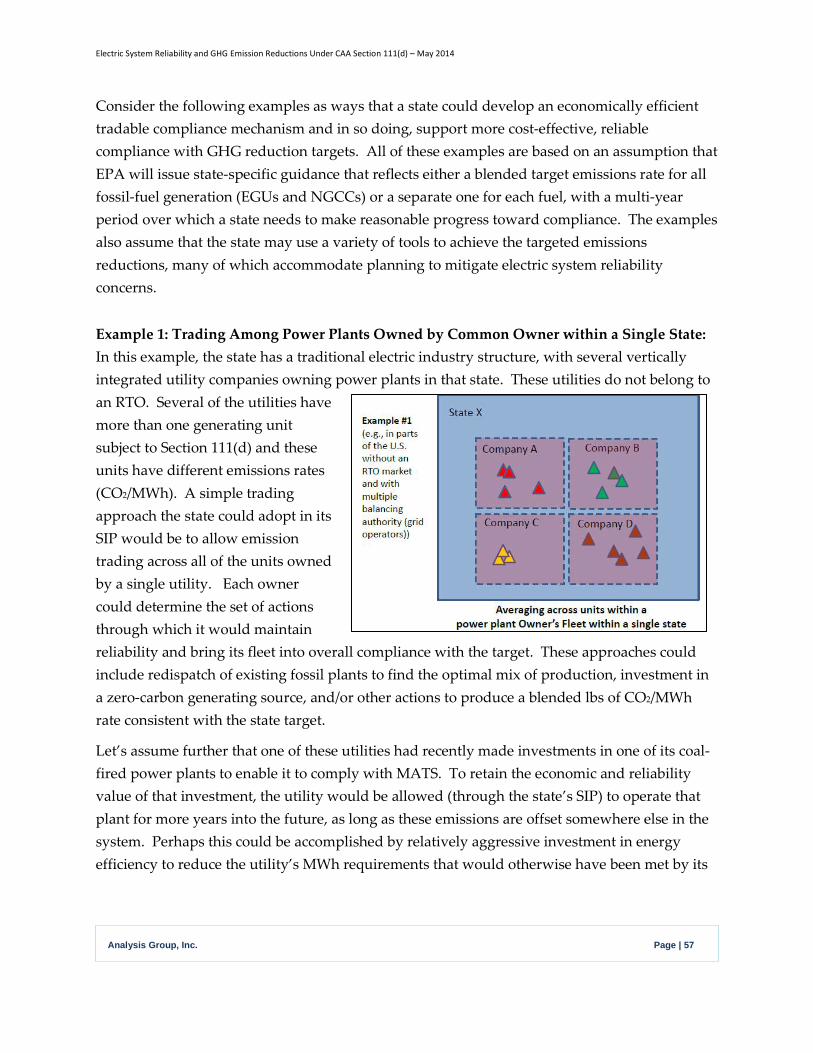
Electric System Reliability and GHG Emission Reductions Under CAA Section 111(d) – May 2014
Analysis Group, Inc. Page | 57
Consider the following examples as ways that a state could develop an economically efficient tradable compliance mechanism and in so doing, support more cost-effective, reliable compliance with GHG reduction targets. All of these examples are based on an assumption that EPA will issue state-specific guidance that reflects either a blended target emissions rate for all fossil-fuel generation (EGUs and NGCCs) or a separate one for each fuel, with a multi-year period over which a state needs to make reasonable progress toward compliance. The examples also assume that the state may use a variety of tools to achieve the targeted emissions reductions, many of which accommodate planning to mitigate electric system reliability concerns.
Example 1: Trading Among Power Plants Owned by Common Owner within a Single State: In this example, the state has a traditional electric industry structure, with several vertically integrated utility companies owning power plants in that state. These utilities do not belong to an RTO. Several of the utilities have more than one generating unit subject to Section 111(d) and these units have different emissions rates (CO2/MWh). A simple trading approach the state could adopt in its SIP would be to allow emission trading across all of the units owned by a single utility. Each owner could determine the set of actions through which it would maintain reliability and bring its fleet into overall compliance with the target. These approaches could include redispatch of existing fossil plants to find the optimal mix of production, investment in a zero-carbon generating source, and/or other actions to produce a blended lbs of CO2/MWh rate consistent with the state target.
Let’s assume further that one of these utilities had recently made investments in one of its coal-fired power plants to enable it to comply with MATS. To retain the economic and reliability value of that investment, the utility would be allowed (through the state’s SIP) to operate that plant for more years into the future, as long as these emissions are offset somewhere else in the system. Perhaps this could be accomplished by relatively aggressive investment in energy efficiency to reduce the utility’s MWh requirements that would otherwise have been met by its

Electric System Reliability and GHG Emission Reductions Under CAA Section 111(d) – May 2014
Analysis Group, Inc. Page | 58
marginal and high-emitting generating unit(s) and in so doing offset the emissions from plants. Perhaps another utility wanted to retain its ability to operate an otherwise relatively inefficient power plant in order to manage an overall resource adequacy issue. This utility could propose a limit on the operating permit of that power plant, in order to maintain it on the system for reliability reasons during seasonal peak energy demand, while also committing to lower output at that plant.
To allow different sets of actions for different utilities that reflected each one’s particular circumstances, the state could structure its SIP to give each utility the ability to manage the cumulative emissions associated with its fleet’s power generation over a multi-year time period in order to satisfy economic and reliability requirements efficiently while also complying with the necessary GHG emission reductions.
Example 2: Trading Among Power Plants Owned by Multiple Owners Within a Single State. In this example, another state with a similar industry structure (no RTO, power plants owned by multiple companies) decides that it will propose a SIP that would permit intra-state trading among all of the power plants subject to Section 111(d) plants within the state. The state could use the EPA’s state-wide target CO2/MWh rate(s) for that state, and allow owners of plants with emissions higher than that rate to trade with plants lower than that rate. The state could either use the tradable-rate-based model or a mass-based approach, with a ceiling on total emissions during a time period and with tradable allowances that companies were either given for free or allowed to purchase through an auction.
Different states in this situation might approach this allowance allocation differently. One might chose to give away for free the allowed statewide average target emissions rate (e.g., CO2/MWh). The plants with higher-than-average emissions would purchase enough CO2 credits to accomplish the target blended rate. The generator with lower-than-average emissions

Electric System Reliability and GHG Emission Reductions Under CAA Section 111(d) – May 2014
Analysis Group, Inc. Page | 59
could sell off the difference between its actual rate and the target rate allocated to it, without taking any further action. Another generator with economically attractive opportunities to make improvements and/or add low-carbon resources to bring its own fleet average even further below the statewide target would have even more CO2 credits to sell.
By contrast, another state could decide to allocate higher-than-average emissions credits to one owner of Section 111(d) units with relatively high emissions, and a different allocation rate to another owner, reflecting equity, stranded costs, electricity price impacts and reliability considerations across the different service territories. Another state might decide that each owner of a Section 111(d) generating unit would need to buy all of its needed CO2 credits (rather than receiving even the average initial allocation for free), and then use the proceeds from the sale of those CO2 credits to offset consumers’ price impacts or to fund energy efficiency program to reduce the overall MWh requirements, achieve CO2 emissions reductions as a result.
Additionally, the state could choose whether to allocate the target CO2/MWh rate to only Section 111(d) generating units, to all fossil units, or to all generating sources (including ones with zero carbon electricity production). The former would tend to lead to trading among fossil units only, and the state could accompany this model with other SIP elements (e.g., increased RPS requirements; new nuclear unit upgrade; a new TES or CES) to increase and/or maintain zero-carbon electricity as a displacement of MWh produced at fossil units. The latter would tend to rely on an economically efficient mechanism for lowering CO2/MWh through creating value for zero-carbon energy options and retaining capacity for reliability and diversity purposes.
A company could manage its own in-state fleet by using its preferred combination of inside-the-fence options, redispatch of its own power plants, procurement of zero-carbon MWh, and purchases/sales of tradable CO2 credits with other power plant owners in the state. The tradable credit or tradable allowance would end up having a price reflecting economic investments in CO2 reductions across the state’s set of power plants.
Such approaches could accommodate many different operational/reliability issues economically. The utility with potential stranded investment in MATs compliance, for example, could purchase output (and credits) from another power plant owner’s lower-emitting but otherwise underutilized generator. The power plant owner that faces a curtailment of natural gas supply during a winter shortage condition could run a unit with higher emissions at that time and offset that unit’s CO2 rate with purchases of a tradable credit from another power plant with lower-than-average emissions. Again, the main point is that states could formulate

Electric System Reliability and GHG Emission Reductions Under CAA Section 111(d) – May 2014
Analysis Group, Inc. Page | 60
their SIPs to allow each power plant owner to manage the cumulative emissions associated with its fleet’s power generation over a multi-year time period so that the average CO2/MWh target is met, along with all operating and resource-adequacy requirements necessary for system reliability.
Example 3a: Trading Among Power Plants in Multiple States That are Owned by a Common Holding Company. In this example, electric generating units located in two states are owned by a common parent company (Holding Company D, in the figure) that operates all of its power plants as a single integrated system for resource adequacy, operational security and economic purposes. From the point of view of system operations, Holding Company D dispatches plants in both states according to security-constrained economic dispatch principles, and shares the economic value of that common system with customers in both states. In this example, there are also other utility companies and IPPs (Companies A, B, C, and D) that own power plants in the relevant state.
Let’s assume that each state has been given a different GHG emissions’ rate target in EPA’s guidance. Each state decides to include in its SIP a mechanism that allows for trading within company-owned fleets or across companies within a state (as in Examples 1 and 2). But for the holding company, the two states decide that they would like to retain the efficiencies associated with that company’s multi-state dispatch. So the two states enter into a formal agreement to allow for interstate trading specifically for Holdco D located in both states, thus enabling it to continue to operate its fleet on a single system basis. (The two states may or may not allow Holdco D to trade with Companies A, B, C, and E.) To the extent that such multi-state dispatch of Holdco’s plants means that State X’s CO2/MWh average rate that is higher over the relevant time period than it otherwise would be under single state operation, then the states’ agreements

Electric System Reliability and GHG Emission Reductions Under CAA Section 111(d) – May 2014
Analysis Group, Inc. Page | 61
would need to establish a mechanism for tracking and offsetting such emissions through deeper reductions in State Y.
This example suggests a way for states to collaborate voluntarily in the design of their SIPs, to tailor elements to fit the structure of their electric industry and to honor long-standing economic and reliability relationships among various utilities and other industry institutions.
Example 3b: Trading Among Power Plants Owned by Multi-State Holding Companies and With the States Having Different Appetites for Other In-State Trading. This example is a slight variation on the same theme as Example 3A. Here, the three states still get different CO2/MWh targets from the EPA, in light of the different conditions in those states. The three states sharing the holding company agree formally to allow that company’s subsidiary companies in the three states to participate in a common interstate CO2 credit-trading program. In exchange for allowing that flexibility, the states agree to require the holding company to achieve more GHG emissions reductions in its fleet than it would otherwise absorb if each state gave the holding company each state’s statewide average CO2/ MWh target. For power plants owned by entities unaffiliated with the holding company, one of those states allows other trading within the states, but the others do not.
The three-state agreement is included in each of the three states’ SIPs, and it details the mechanism through which the states will credit/offset/true-up emissions located in one state against the other states’ compliance requirements. The three states could establish a multi-state cap over that holding company’s generating resources. The holding company has the ability to meet its target through a combination of dispatching its power plants, incremental purchase of

Electric System Reliability and GHG Emission Reductions Under CAA Section 111(d) – May 2014
Analysis Group, Inc. Page | 62
power generated at low-carbon resources, energy efficiency, demand response or other actions to reduce CO2/MWh across the three states. The other company in State Y has the same ability to use its fleet to achieve a blended average emissions rate that complies with EPA guidance for the state.
Again this example suggests tailored strategies to reflect economic, reliability and other conditions unique to a set of states.
Example 4: No Interstate Trading Except for Emissions Associated with a Multi-State Energy Imbalance Market. In this example, the electric companies in a number of states operate as vertically integrated stand-alone utilities, owning generating assets and serving load in a single state. Some of them (e.g., Company A in State X) also own power plants (or contracts for power) in another state (e.g., in State Z) for producing part of the supply for retail customers in the home state (State X). These various approaches have traditionally provided resource adequacy. Each company is interconnected to other utilities in the region through transmission lines, and each company plans for and schedules the dispatch of its own power plants to meet its customers’ requirements (load) with operational reliability. Specifically, each company is the grid operator (balancing authority) in its electric system. Because anticipated demand varies in real time from actual demand, the interconnected utilities have entered into an “energy imbalance market” to allow power companies to voluntarily make their generating assets available to the entire region to allow for efficient dispatch of generating units across multiple systems to make sure that the systems have supply and demand in balance at all times.
The states in this interconnected region enter into an agreement to allow for the CO2 emissions associated with such energy imbalances (which are important for both reliable and efficient

Electric System Reliability and GHG Emission Reductions Under CAA Section 111(d) – May 2014
Analysis Group, Inc. Page | 63
power supply) to be accommodated within each affected states’ SIPs and to credit/offset emissions changes in one state that result from such an interstate energy imbalance market.
Example 5: Multistate RTO. Example 5 depicts a multi-state area, where all of the power plants located in the three states participate in a single RTO. The RTO is responsible for centralized security-constrained economic dispatch of all power plants in the states. The three states seek to retain the economic and reliability benefits of this multi-state RTO, recognizing that CO2/MWh in one state may be affected by the dispatch protocols of the RTO that affect all power plants in the region.
Each of the states includes in its SIP a formal agreement to allow trading across the units in the RTO footprint. The states could work with the RTO to establish the mechanism(s) through which the RTO would introduce CO2 prices and/or other constraints into the dispatch (e.g., through a shadow price116 or through actual tradable credits).
In addition to providing this interstate trading arrangement as part of their SIPs, affected states could also include in their SIPs various other policies – energy efficiency, clean energy standards, more aggressive RPS, contracts with zero-carbon electricity supplies, integrated resource planning with a shadow price on carbon, and so forth – that affect the CO2 emitted from the fossil plants in the RTO. Together, these approaches respect the regional operational reliability practices, market-based dispatch approaches, and state-specific policy preferences and resource-adequacy approaches.
116 As an example, stakeholders in MISO are exploring the implications of a CO2 design that would use a limit on total emissions in the RTO footprint, along with a shadow price to use in security-constrained economic dispatch. Judy Chang, Jurgen Weiss, Yingxia Yang, Jon Brekke, and Will Kaul, “A Market-based Regional Approach to Implementing EPA’s GHG Emissions Regulation,” Brattle Group and Great River Energy, January 2014. Also, MISO, “Refresh of MTEP-10 Carbon Analysis,” presentation to PAC Meeting February 19, 2014.

Electric System Reliability and GHG Emission Reductions Under CAA Section 111(d) – May 2014
Analysis Group, Inc. Page | 64
Example 6: States with Multiple Multi-State RTOs: This example is similar to the prior one, except that one of the states in this region has Section 111(d) power plants located in two different RTOs, each covering a portion of the state. In this example, to the extent that each state seeks to allow its power plants to trade within the RTO market, each state would enter into an agreement to participate in a common trading program, potentially administered by each RTO. The state with electric utilities situated in two RTOs could determine the target CO2/MWh that Section 111(d) units in each part of the state would need to achieve through the inter-state trading program administered by each RTO.
Example 7: States with Multiple Multi-State RTOs and a Multi-State CO2 Trading Programs. A final example involves a multi-state region with multiple RTOs and with a multi-state GHG trading program whose boundaries are not coincident with the boundaries of the RTO. The GHG trading program is a mass-based model, using a cap-and-trade system with CO2 allowances purchased by all fossil generating units (including EGUs and NGCCs). (An example of such an approach is the RGGI program in the Northeast.) In this model, the states have

Electric System Reliability and GHG Emission Reductions Under CAA Section 111(d) – May 2014
Analysis Group, Inc. Page | 65
included in their SIPs their agreements with the other states that participate in the multi-state GHG program. State SIPs would delineate the manner in which the Section 111(d) units within their borders may trade emission allowances (or reductions or averaging) within the program, but not with other units in the portions of the RTO (e.g., RTO 1) where the program is not in effect. Reliability practices, like security-constrained dispatch or capacity markets for resource adequacy, would integrate smoothly with the multi-state nature of the RTO and GHG emission-reduction program.
Outside-the-Fence Models Approaches: Collateral policies
In the examples above, each state may also choose to include in its SIP other elements that contribute to the state’s compliance strategy for reliably reducing GHG emissions at existing EGUs and NGCCs. The state would need to demonstrate and quantify the effect of such other SIP elements on emissions from Section 111(d) units, with a monitoring and verification protocol with back-up actions in the event that such other SIP elements do not bring forth their anticipated emissions reduction outcomes. For example:
A state wanting to encourage the eventual shutdown of a particular utility-owned generating unit (e.g., a coal plant with high emissions CO2 per MWh) learns from the grid operator that the plant is needed for reliability issues pending completion of transmission upgrades (or the completion of a new power plant then under construction). The utility does not want to retire the plant when those other facilities are complete, because the plant would have stranded costs. To encourage the timely retirement of the high-emitting coal plant, the state could include in its SIP a plan to allocate to the utility owner a quantity of CO2/MWh credits for some number of years beyond the unit’s actual retirement, as long as the unit were to retire by a date certain. This could allow that unit’s owner offset its stranded costs by selling those emissions to others after the unit retirement occurs.
One state wanting to gain access to underutilized NGCC capacity in a neighboring state through cost-effective transmission upgrades might enter into an interstate agreement to allocate additional credits to the neighboring state upon completion of the line. The state might propose to shut down a particular Section 111(d) unit upon the completion of the transmission-system upgrade, and free up those credits to cover the emissions in the neighboring state that will go up once the line is energized and the NGCC capacity factors increase.

Electric System Reliability and GHG Emission Reductions Under CAA Section 111(d) – May 2014
Analysis Group, Inc. Page | 66
A state seeking to avoid the premature retirement of a financially challenged but well-performing existing nuclear unit(s) might propose a SIP element to create financial incentives for the unit to remain in operation through its full operating license period. For example, a state already participating in a multi-state RTO and multi-state GHG program might additionally introduce a clean energy (applicable to LSEs) or a tradable emission standard (applicable to all generating units located physically within the state). Through the CES or the TES, the nuclear unit could generate MWh without emitting any CO2, sell those zero-carbon MWh credits to other generators in the state, capture enough monetary value for its supply of zero-carbon MWh to remain in service, and in so doing, help the entire system retain greater fuel diversity and reliability while also cost-effectively reducing system-wide CO2/MWh.
These examples are suggestive of the types of elements that a state may include in its SIP to address local industry conditions, reliability considerations, system diversity, and economic impacts of Section 111(d) compliance. As many states have already begun to do, they can start their SIP planning processes with the expectation that they will be able to tailor their plan to suit their own preferences and policy objectives. This flexibility is inherent within Section 111(d), and affords a strong basis for allowing the states to comply with the CAA’s requirements without jeopardizing electric system reliability.
Conclusions
The bottom line: as long as states and the industry start their planning process soon, there is no reasonable basis for anticipating that EPA’s guidance, the states’ SIPs and the electric industry’s compliance with them will create reliability problems for the power system.
The nature of Section 111(d) affords the states with many options for compliance, both in terms of plan elements and timing. States will have significant flexibility in developing their GHG reduction plans, and EPA will allow them to craft their plans in ways that accommodate reliability considerations. This flexibility is a hallmark of the Section 111(d) regulatory framework, and this ‘cooperative federalism’ framework distinguishes it from some of the other recent air regulations that allow for a more narrow range of compliance strategies (e.g., MATS regulations affecting existing coal-fired power plants).
Moreover, the conditions in the industry are such that compliance paths may be facilitated by low natural gas prices, significant existing under-utilized NGCC capacity, relatively slow

Electric System Reliability and GHG Emission Reductions Under CAA Section 111(d) – May 2014
Analysis Group, Inc. Page | 67
growth in demand for electricity, increased supply expected from low-carbon renewable energy, and retirements of many of the older and least efficient coal-fired power plants before the implementation dates anticipated for Section 111(d).
To a significant degree, if a state has concerns about the reliability implications of compliance with EPA’s action to regulate GHG emission from existing fossil power plants, that state has a range of actions it can take today to address and mitigate these concerns. The states need not wait for EPA to propose and finalize its guidance before asking parties to propose plan elements; many states have already begun such discussions and planning. States can request transmission plans from their utilities and grid operators that examine the implications of particular plan elements on generation dispatch, emissions outlooks, and reliability issues. They can examine conditions that could cause output at Section 111(d) units to increase and to put pressure on meeting GHG emissions targets, and explore potential actions to mitigate those risks. State can step up actions to address reliability concerns now, rather than 18 months from now when the EPA finalizes its guidance.
The states are in the driver seat in navigating compliance paths under Section 111(d) that assure reliable electricity supply as well as cost-effective GHG emissions reductions from existing power plants.

Electric System Reliability and GHG Emission Reductions Under CAA Section 111(d) – May 2014
Analysis Group, Inc. Page | 68
APPENDIX 1:
The Clean Air Act Section 111 – Excerpts
Section 111(a) (a) Definitions. For purposes of this section:
(1) The term “standard of performance” means a standard for emissions of air pollutants which reflects the degree of emission limitation achievable through the application of the best system of emission reduction which (taking into account the cost of achieving such reduction and any nonair quality health and environmental impact and energy requirements) the Administrator determines has been adequately demonstrated. (2) The term “new source” means any stationary source, the construction or modification of which is commenced after the publication of regulations (or, if earlier, proposed regulations) prescribing a standard of performance under this section which will be applicable to such source. (3) The term “stationary source” means any building, structure, facility, or installation which emits or may emit any air pollutant. Nothing in subchapter II of this chapter relating to nonroad engines shall be construed to apply to stationary internal combustion engines. (4) The term “modification” means any physical change in, or change in the method of operation of, a stationary source which increases the amount of any air pollutant emitted by such source or which results in the emission of any air pollutant not previously emitted. (5) The term “owner or operator” means any person who owns, leases, operates, controls, or supervises a stationary source. (6) The term “existing source” means any stationary source other than a new source……
Section 111(d) Standards of performance for existing sources; remaining useful life of source
(1) The Administrator shall prescribe regulations which shall establish a procedure similar to that provided by section 110 under which each State shall submit to the Administrator a plan which (A) establishes standards of performance for any existing source for any air pollutant (i) for which air quality criteria have not been issued or which is not included on a list published under section 108(a) or 112(b)(1)(A) but (ii) to which a standard of performance under this section would apply if such existing source were a new source, and (B) provides for the implementation and enforcement of such standards of performance. Regulations of the Administrator under this paragraph shall permit the State in applying a standard of performance to any particular source under a plan submitted under this paragraph to take into consideration, among other factors, the remaining useful life of the existing source to which such standard applies. (2) The Administrator shall have the same authority— (A) to prescribe a plan for a State in cases where the State fails to submit a satisfactory plan as he would have under section 110(c) in the case of failure to submit an implementation plan, and (B) to enforce the provisions of such plan in cases where the State fails to enforce them as he would have under sections 113 and 114 with respect to an implementation plan. In promulgating a standard of performance under a plan prescribed under this paragraph, the Administrator shall take into consideration, among other factors, remaining useful lives of the sources in the category of sources to which such standard applies.

Electric System Reliability and GHG Emission Reductions Under CAA Section 111(d) – May 2014
Analysis Group, Inc. Page | 69
APPENDIX 2 –
Generating Capacity Subject to 111(d) by State as of the beginning of 2013 (Page 1)
State MW
CapacityNumber of
Units
Capacity Factor (2012)
MW Capacity
Number of Units
Capacity Factor (2012)
MW Capacity
Number of Units
Capacity Factor (2012)
MW Capacity
Number of Units
Capacity Factor (2012)
MW Capacity
Number of Units
Capacity Factor (2012)
ALABAMA 10,790 35 49% 453 15 49% 64 9 77% 6,255 42 63% 0 0 0%ALASKA 118 16 67% - - 0% - - 0% 279 4 70% 47 1 77%ARIZONA 6,230 18 75% - - 0% 974 9 7% 6,452 43 32% 0 0 0%ARKANSAS 5,144 7 63% 300 11 71% 1,203 8 8% 3,060 23 38% 0 0 0%CALIFORNIA 250 8 61% - - 0% 12,848 48 8% 12,830 129 51% 0 0 0%COLORADO 5,377 26 73% - - 0% 120 4 1% 1,663 28 39% 0 0 0%CONNECTICUT 388 1 3% 1,861 7 2% 44 5 23% 2,303 15 23% 0 0 0%DELAWARE 430 3 31% - - 0% 846 6 15% 756 6 53% 0 0 0%FLORIDA 10,493 29 49% 5,499 23 17% 1,038 14 22% 16,785 104 60% 0 0 0%GEORGIA 12,583 43 38% 655 20 52% 129 2 9% 4,877 26 55% 0 0 0%HAWAII 180 1 95% 1,119 21 46% - - 0% - - 0% 375 12 55%IDAHA 17 6 61% 74 4 65% - - 0% 374 4 39% 0 0 0%ILLINOIS 15,943 71 56% - - 0% 40 7 3% 2,005 14 33% 0 0 0%INDIANA 18,283 78 58% 158 4 0% - - 0% 1,549 12 64% 0 0 0%IOWA 6,784 49 60% - - 0% 65 2 14% 813 7 12% 0 0 0%KANSAS 5,096 14 63% - - 0% 1,714 29 11% - - 0% 0 0 0%KENTUCKY 15,329 54 63% - - 0% - - 0% - - 0% 0 0 0%LOUISIANA 4,430 14 64% 266 7 62% 8,049 64 22% 5,916 41 54% 0 0 0%MAINE - - 0% 1,222 19 20% 93 2 65% 880 5 33% 0 0 0%MARYLAND 4,771 16 40% 1,730 4 18% 321 8 6% 157 2 31% 0 0 0%MASSACHUSETTS 1,439 8 18% 2,138 6 1% 645 16 6% 4,315 26 34% 282 4 4%MICHIGAN 11,778 83 53% 51 2 86% 2,182 9 4% 3,378 33 45% 0 0 0%MINNESOTA 4,755 41 55% 15 1 50% 174 17 18% 1,502 11 29% 0 0 0%MISSISSIPPI 2,566 7 33% 235 8 59% 2,773 23 20% 4,685 29 49% 0 0 0%MISSOURI 12,435 51 67% - - 0% 116 6 1% 1,425 11 19% 0 0 0%MONTANA 1,763 8 62% - - 0% - - 0% 41 1 0% 0 0 0%NEBRASKA 4,160 20 69% - - 0% 268 9 2% 296 5 11% 0 0 0%NEVADA 1,303 7 36% - - 0% 470 5 7% 3,377 34 54% 0 0 0%NEW HAMPSHIRE 554 4 26% 407 4 2% - - 0% 882 4 57% 0 0 0%NEW JERSEY 2,001 7 15% 163 3 2% 629 8 3% 4,132 42 49% 0 0 0%NEW MEXICO 3,430 7 72% - - 0% 779 11 32% 925 8 48% 0 0 0%NEW YORK 1,736 15 25% 2,795 9 10% 6,927 22 17% 6,425 63 49% 0 0 0%NORTH CAROLINA 11,084 34 50% 163 7 66% - - 0% 2,809 21 46% 0 0 0%NORTH DAKOTA 4,153 14 78% - - 0% - - 0% - - 0% 0 0 0%OHIO 19,394 84 49% 45 3 82% 35 2 1% 2,292 20 67% 0 0 0%OKLAHOMA 5,323 15 63% 58 1 85% 5,085 32 19% 4,394 31 49% 0 0 0%OREGON 585 1 52% 59 2 41% 32 2 26% 2,100 18 44% 0 0 0%PENNSYLVANIA 14,901 59 58% 842 5 7% 1,635 4 11% 5,614 42 64% 0 0 0%RHODE ISLAND - - 0% 4 2 19% 9 4 22% 1,293 11 47% 0 0 0%SOUTH CAROLINA 6,082 22 50% 244 7 44% 107 3 47% 1,682 10 48% 0 0 0%SOUTH DAKOTA 475 1 68% - - 0% - - 0% 170 1 1% 0 0 0%TENNESSEE 7,734 49 52% 186 6 46% - - 0% 960 5 48% 0 0 0%TEXAS 21,335 40 69% 161 6 77% 18,553 88 13% 27,324 207 50% 0 0 0%UTAH 4,887 15 72% - - 0% 240 4 6% 713 5 55% 0 0 0%VERMONT - - 0% 2 3 26% - - 0% - - 0% 0 0 0%VIRGINIA 5,890 41 26% 1,899 14 11% 334 4 7% 2,779 20 78% 0 0 0%WASHINGTON 1,340 2 32% 150 9 55% 5 1 15% 2,225 21 23% 0 0 0%WEST VIRGINIA 14,378 33 56% - - 0% - - 0% - - 0% 0 0 0%WISCONSIN 8,618 58 44% 135 8 55% 7 1 16% 1,724 12 44% 0 0 0%WYOMING 6,431 24 77% 0 1 51% 3 3 65% - - 0% 0 0 0%50 STATES 292,375 1,204 22,636 227 68,489 482 148,160 1,154 705 17
source: SNL Financial
Steam Turbine - Coal Steam Turbine - Oil Steam Turbine - Natural Gas Combined Cycle - Natural Gas Combined Cycle - Oil

Electric System Reliability and GHG Emission Reductions Under CAA Section 111(d) – May 2014
Analysis Group, Inc. Page | 70
APPENDIX 2 –
Generating Capacity Subject to 111(d) by State as of the beginning of 2013 (Page 2)
State MW CapacityNumber of
UnitsMW
CapacityNumber of
Units
Capacity Factor (2012)
MW Capacity
Number of Units
Capacity Factor (2012)
MW Capacity
Number of Units
MW Capacity
Number of Units
ALABAMA 17,562 101 5,135 5 91% 0 1 0% 10,361 175 33,058 282 ALASKA 444 21 - - 0% 33 25 7% 1,766 473 2,243 519 ARIZONA 13,656 70 3,937 3 93% 829 65 16% 9,634 133 28,056 271 ARKANSAS 9,707 49 1,865 2 95% - - 0% 4,300 112 15,872 163 CALIFORNIA 25,929 185 2,240 2 90% 6,202 498 19% 33,424 1,431 67,795 2,116 COLORADO 7,161 58 - - 0% 2,411 61 29% 5,685 228 15,256 347 CONNECTICUT 4,596 28 2,117 2 92% 1 6 0% 2,687 144 9,401 180 DELAWARE 2,032 15 - - 0% 15 4 20% 1,001 31 3,048 50 FLORIDA 33,815 170 3,140 4 65% 74 11 16% 23,441 401 60,470 586 GEORGIA 18,244 91 4,061 4 95% 3 3 5% 17,498 350 39,806 448 HAWAII 1,674 34 - - 0% 185 27 20% 813 110 2,672 171 IDAHA 465 14 - - 0% 973 32 22% 3,725 203 5,162 249 ILLINOIS 17,988 92 11,673 11 94% 3,579 36 25% 14,462 577 47,703 716 INDIANA 19,991 94 - - 0% 1,543 15 24% 6,300 217 27,834 326 IOWA 7,663 58 622 1 80% 5,050 77 32% 3,134 499 16,469 635 KANSAS 6,810 43 1,205 1 78% 2,516 19 22% 3,504 403 14,034 466 KENTUCKY 15,329 54 - - 0% - - 0% 6,768 111 22,098 165 LOUISIANA 18,660 126 2,157 2 83% - - 0% 5,551 134 26,368 262 MAINE 2,195 26 - - 0% 411 10 23% 2,057 292 4,663 328 MARYLAND 6,979 30 1,734 2 89% 148 14 26% 3,819 156 12,680 202 MASSACHUSETTS 8,820 60 685 1 98% 93 32 11% 5,171 231 14,769 324 MICHIGAN 17,389 127 4,131 4 77% 820 16 15% 9,412 644 31,753 791 MINNESOTA 6,445 70 1,697 3 80% 2,867 145 30% 5,333 433 16,342 651 MISSISSIPPI 10,260 67 1,265 1 66% - - 0% 4,532 71 16,056 139 MISSOURI 13,977 68 1,240 1 99% 459 6 31% 7,185 377 22,860 452 MONTANA 1,803 9 - - 0% 638 10 26% 3,150 95 5,591 114 NEBRASKA 4,725 34 1,271 2 52% 415 11 34% 2,032 253 8,443 300 NEVADA 5,150 46 - - 0% 411 18 12% 5,486 135 11,046 199 NEW HAMPSHIRE 1,843 12 1,247 1 75% 171 3 14% 1,311 142 4,571 158 NEW JERSEY 6,924 60 4,273 4 88% 285 128 11% 8,889 233 20,371 425 NEW MEXICO 5,134 26 - - 0% 921 34 31% 1,833 67 7,887 127 NEW YORK 17,883 109 5,286 6 88% 1,598 27 20% 15,171 843 39,937 985 NORTH CAROLINA 14,056 62 5,206 5 86% 153 64 8% 11,321 344 30,736 475 NORTH DAKOTA 4,153 14 - - 0% 1,805 28 34% 626 40 6,585 82 OHIO 21,765 109 2,176 2 90% 484 13 24% 9,588 332 34,012 456 OKLAHOMA 14,860 79 - - 0% 2,973 27 31% 5,494 129 23,326 235 OREGON 2,776 23 - - 0% 3,154 60 22% 8,144 256 14,074 339 PENNSYLVANIA 22,992 110 9,896 9 87% 1,377 43 18% 9,967 375 44,232 537 RHODE ISLAND 1,306 17 - - 0% 2 1 0% 712 35 2,019 53 SOUTH CAROLINA 8,115 42 6,659 7 88% 0 1 0% 9,158 254 23,931 304 SOUTH DAKOTA 645 2 - - 0% 767 11 42% 2,825 75 4,237 88 TENNESSEE 8,879 60 3,512 3 82% 44 5 12% 8,077 190 20,512 258 TEXAS 67,373 341 5,020 4 87% 11,700 116 31% 22,492 504 106,585 965 UTAH 5,840 24 - - 0% 19 1 24% 1,550 143 7,408 168 VERMONT 2 3 628 1 91% 133 11 9% 545 139 1,308 154 VIRGINIA 10,902 79 3,637 4 90% - - 0% 11,750 626 26,288 709 WASHINGTON 3,719 33 1,158 1 92% 2,802 24 27% 24,743 379 32,422 437 WEST VIRGINIA 14,378 33 - - 0% 583 6 25% 1,542 50 16,503 89 WISCONSIN 10,485 79 1,209 2 92% 614 12 28% 6,252 534 18,559 627 WYOMING 6,434 28 - - 0% 1,383 30 35% 586 58 8,404 116 50 STATES 532,364 3,084 94,944 95 60,642 1,786 354,445 13,992 1,042,395 18,957
source: SNL Financial
Wind and Solar Other Total Grid-Connected NuclearAll Section 111(d) Units

Electric System Reliability and GHG Emission Reductions Under CAA Section 111(d) – May 2014
Analysis Group, Inc. Page | 71
APPENDIX 3 –
MAP of NERC REGIONS AND SUBREGIONS