test report marine radar ra42c - fccid.io · 4 table of contents data for the acceptance of the...
TRANSCRIPT

TEST REPORTMARINE RADAR
RA42C

1
Foreword
The following information is being submitted in compliance with
paragraphs 2.983, 2.985, 2.987, 2.989, 2.991, 2.993 and 2.995 as
provided by part 83 of the FCC Rules and Regulations for Type Acceptance
of the Koden Marine Radar, Type RA42C.
All testing was performed by the Koden Electronics Co., Ltd.
Uenohara Factory, 5278, Uenohara, Uenohara-Machi, Kitatsuru-Gun,
Yamanashi, 409-0112, Japan.
2

3
STANDARD TEST CONDITIONS
and
ENGINEERING PRACTICES
Except as noted herein, the following conditions and procedure were
observed during the testing:
ROOM TEMPERATURE =25±5•
ROOM HUMIDITY =20-50%
Prior to testing, the E.U.T. was tuned up in accordance with the
manufacturer's alignment procedures. All external gain controls were
maintained at the position of maximum and/or optimum gain throughout the
testing.
MEASUREMENT DATA, unless otherwise noted, are WORST CASE
measurements.

4
Table of contents
Data for the acceptance of the Koden Marine Radar Type RA42C
List of Exhibit
Exhibit Number
1 RF Power Output (2.985)
2 Modulation Characteristics (2.987)
3 Occupied Bandwidth (2.989)
4 Spurious Emissions at Antenna Terminal (2.991)
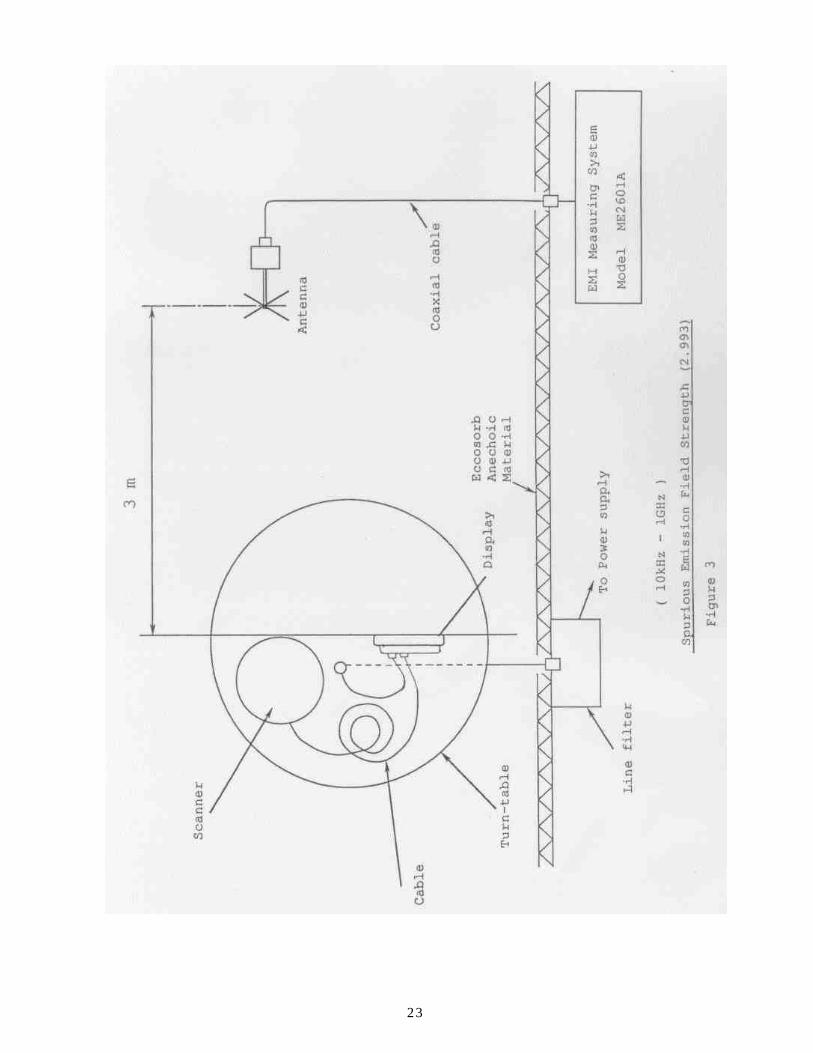
5 Spurious Emissions Field Strength (2.993)
6 Frequency Stability (2.995)

5
Exhibit 1
RF POWER OUTPUT (2.985)
Type of Transmission: P0N
Type of Modulation: Pulse
Frequency Band: 9410 MHz ± 30 MHz
Frequency Source: Fixed Cavity Resonator
Pulse Rate: 600 Hz to 2000 Hz, Selectable as a function
of Range
Pulse Width: 0.11 us to 0.8 us, Selectable as a function
of Range
TEST EQUIPMENT
Equipment Manufacturer Model
1. X-Band Directional Coupler Hewlett-Packard X752D
2. Variable Attenuator Hewlett-Packard X382A
3. Power Meter ANRITSU ML83A
4. Crystal Detector Hewlett-Packard 423B
5. Oscilloscope TEKTRONIX 2445
6. Frequency meter Hewlett-Packard X532B
7. X-Band Dummy Load NIHON KOSHUHA WDL095
TEST PROCEDURE
The Marine Radar is capable of generating the following pulses:
110ns × 2000Hz, 250ns × 1500Hz, 0.8 × 600Hz
The Power output for each of these combinations was measured by
using the following procedure:
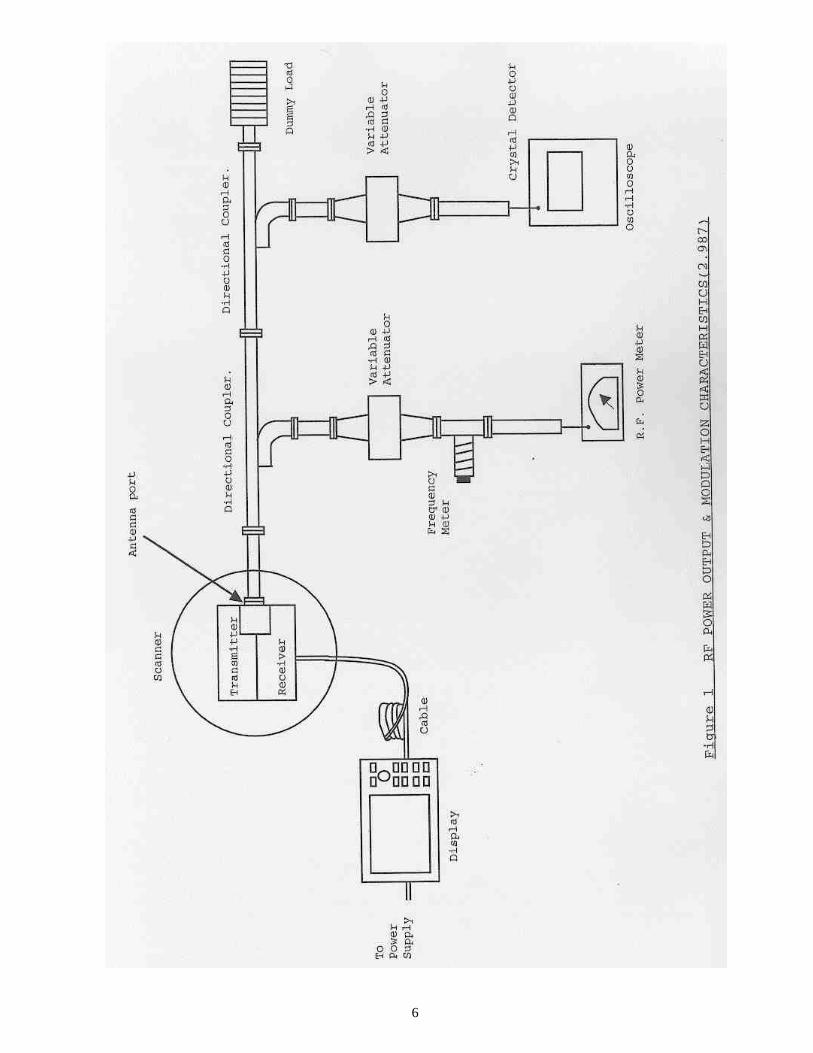
(1) Set up the equipment as shown in Fig.1.
(2) Record reading of Power Meter.
(3) Calculate mean power according to attenuation.
(4) Measure and record pulse width and P.R.F. by using oscilloscope and
frequency counter.
(5) Calculate peak power as follows:
P0 = Pm /(Fr x T)
P0 : Peak Power, Pm : Mean Power, Fr : P.R.F.*
T : Pulse Width, * P.R.F. : Pulse Repetition
Frequency
6

7
Exhibit 1
TEST RESULT
Transmit Pulsewidth andP.R.F.
MeasuredMean Power
MeasuredPulse width
MeasuredP.R.F.
CalculatedPeak powerOutput
110ns×2000Hz 0.91W 120nS 2020Hz 3.75kW
250ns×1500Hz 1.66W 258nS 1488Hz 4.32kW
800ns×600Hz 2.01W 784nS 579Hz 4.43kW
8
Exhibit 2
MODULATION CHARACTERISITICS (2.987)
Type of Transmission: P0N
Type of Modulation: Pulse
Frequency Band: 9410 MHz ±•30MHz
Frequency Source: Fixed Cavity Resonator
Pulse Rate: 600 to 2000 Hz, Selectableas a function of
Range
Pulse Width: 0.11 us to 0.8 us, Selectable as a function
of Range
TEST EQUIPMENT
Equipment Manufacturer Model
1. X-Band Directional CouplerHewlett-Packard X752D
2. Variable Attenuator Hewlett-Packard X382A
3. Power Meter ANRITSU ML83A
4. Crystal Detector Hewlett-Packard 423B
5. Oscilloscope TEKTRONIX 2445
6. Frequency meter Hewlett-Packard X532B
7. X-Band Dummy Load NIHON KOSHUHA WDL095
TEST PROCEDURER
The Marine Radar is capable of generating the following pulses:
0.11 us x 2000 Hz, 0.25 us x 1500 Hz, 0.8 us x 600 Hz
The Modulation characteristics for each of these combinations was
measured by using the following procedure:
(1) Set up the equipment as shown in Fig.1.
(2) Obtain a convenient display on the oscilloscope and adjust peak to
the suitable cursor line.
(3) Decrease variable attenuator 3 dB, and measure the pulse width at
the cursor line.
(4) Photograph the oscilloscope display.
(5) Note and record the Frequency Readout of the counter as "Pulse
Repetition Frequency".

9
Exhibit 2
TEST RESULT
Modulation Characteristics
(Detected Pulse)
(1) Short Pulse
Pulse width (-3 dB) = 120 ns
Pulse repetition Frequency = 2020 Hz
50 ns/div.
10
Exhibit 2
TEST RESULT
Modulation Characteristics
(Detected Pulse)
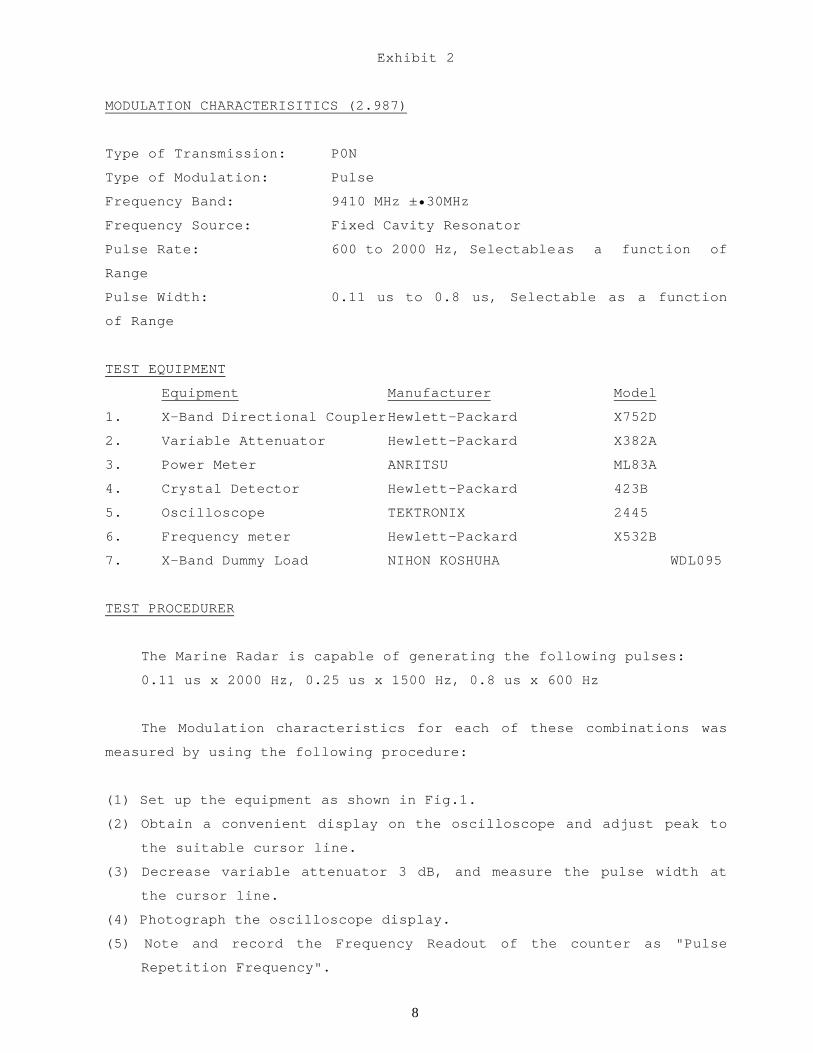
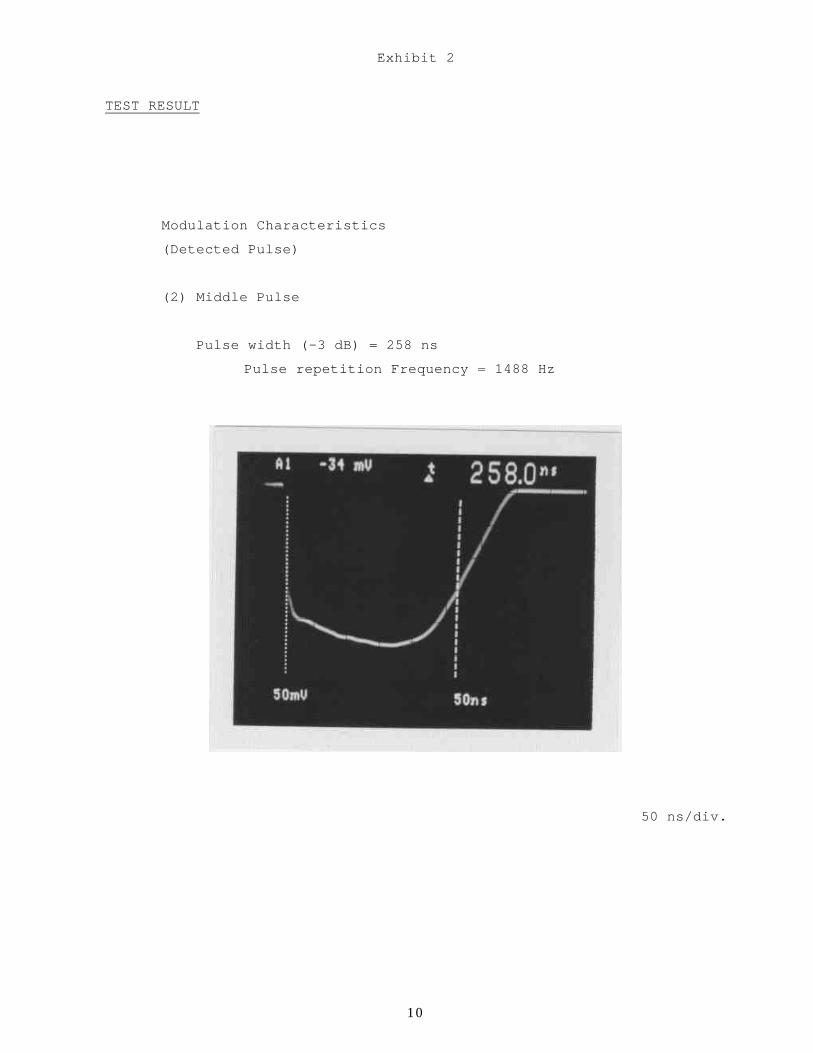
(2) Middle Pulse
Pulse width (-3 dB) = 258 ns
Pulse repetition Frequency = 1488 Hz
50 ns/div.
11
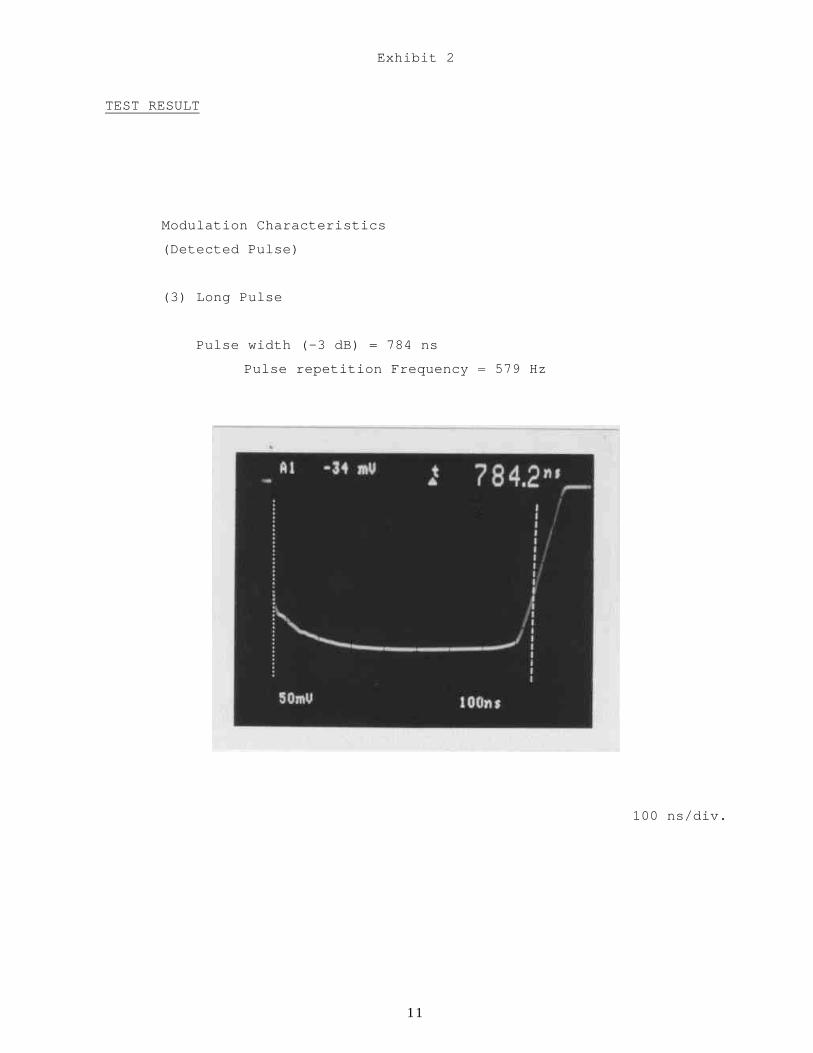
Exhibit 2
TEST RESULT
Modulation Characteristics
(Detected Pulse)
(3) Long Pulse
Pulse width (-3 dB) = 784 ns
Pulse repetition Frequency = 579 Hz
100 ns/div.

12
Exhibit 3
OCCUPIED BANDWIDTH (2.989)
Type of Transmission: P0N
Type of Modulation: Pulse
Frequency Band: 9410 MHz ± 30 MHz
Frequency Source: Fixed Cavity Resonator
Pulse Rate: 600 to 2000 Hz, Selectable as a function of
Range
Pulse Width: 0.11 us to 0.8 us, Selectable as a function
of Range
TEST EQUIPMENT
Equipment Manufacturer Model
1. X-Band Directional CouplerHewlett-Packard X752D
2. Variable Attenuator Hewlett-Packard X382A
3. X-Band Dummy Load NIHON KOSHUHA WDL095
4. Spectrum Analyzer Anritsu MS710C
TEST PROCEDURE
The Marine Radar is capable of generating the following pulses:
110 ns × 2000 Hz, 250 ns × 1500 Hz, 800 ns × 600 Hz
The occupied bandwidth for each of these combinations was measured
by using the following procedure:
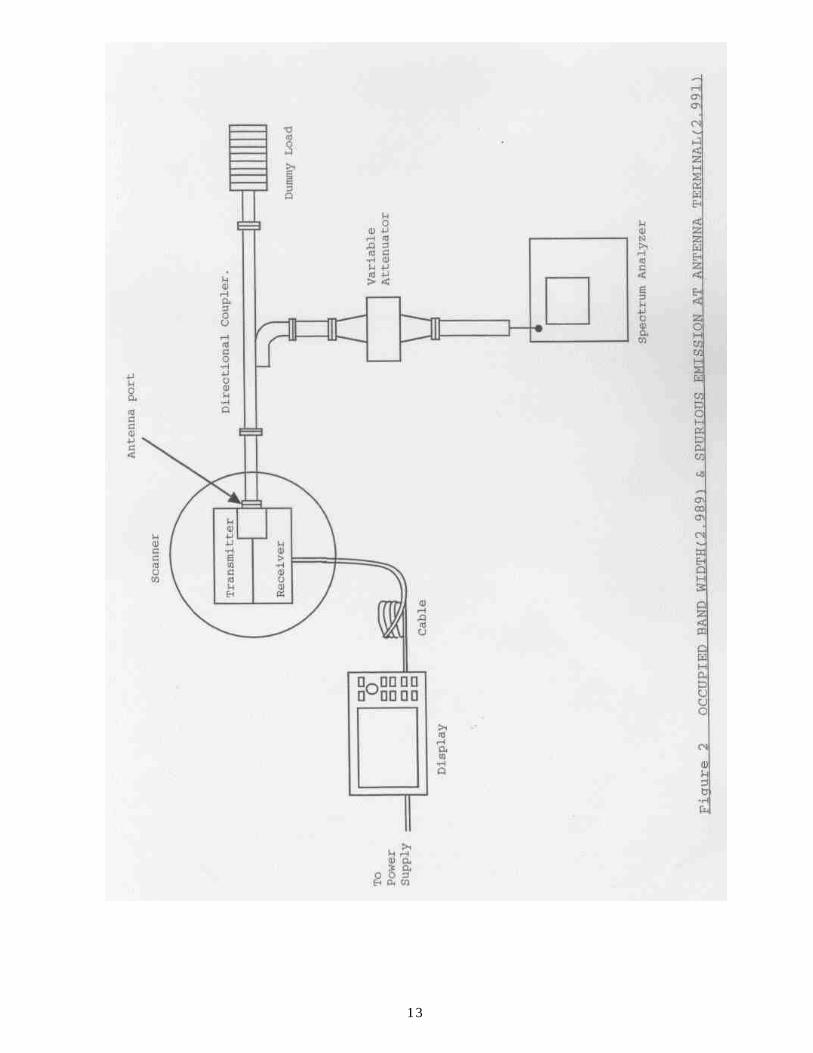
(1) Connect the equipment as shown in Fig.3.
(2) Adjust center frequency, span reference level of spectrum analyzer
and attenuator if necessary, such that the display nearly fills the
screen.
(3) Measure and record spectrum and bandwidth
The bandwidth is calculated so that the total powers lower than the
lowest frequency in the bandwidth and higher than the highest frequency
in the bandwidth occupy 0.5% of the transmitted total power
respectively.
13

14
Exhibit 3
TEST RESULT
Transmission Spectrum of 110 ns × 2000 Hz
Center frequency : 9.4023GHz
Frequency span : 20.0 MHz/div.
Level : 10 dB/div.
Resolution band width : 300 kHz/div.
Video band width : 1 MHz/div.
Sweep time : 200 msec/div.
Occupied band width : 60.0 MHz
15
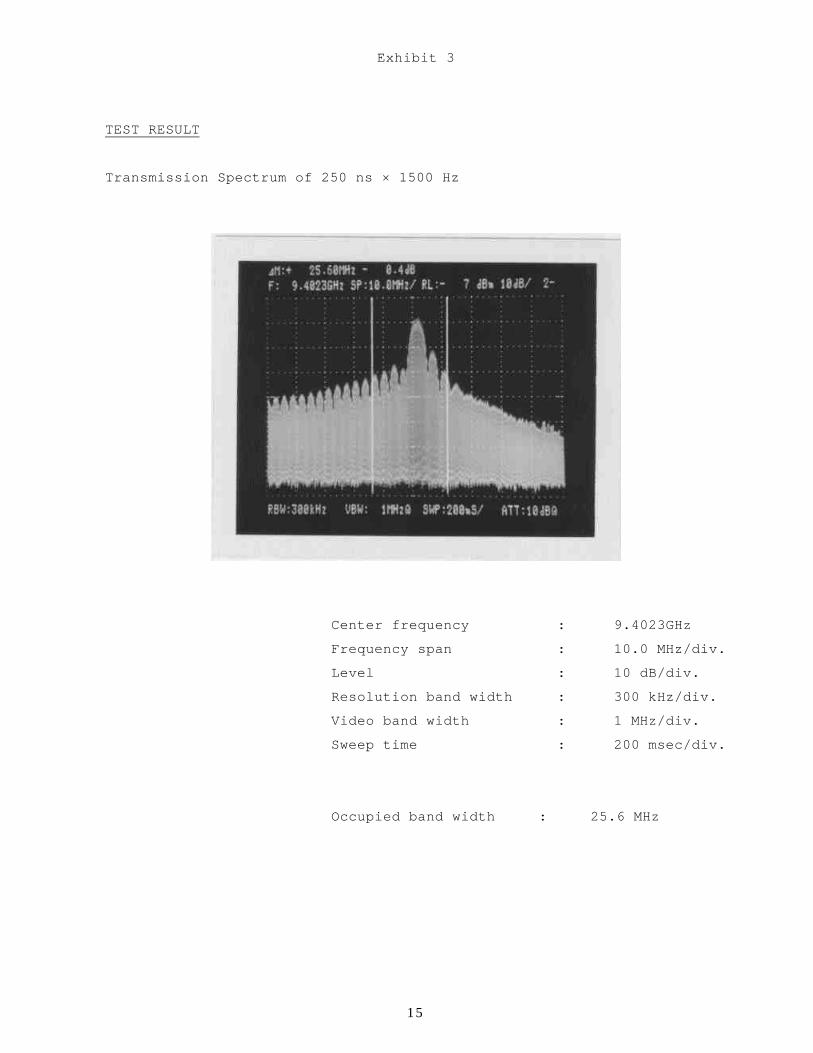
Exhibit 3
TEST RESULT
Transmission Spectrum of 250 ns × 1500 Hz
Center frequency : 9.4023GHz
Frequency span : 10.0 MHz/div.
Level : 10 dB/div.
Resolution band width : 300 kHz/div.
Video band width : 1 MHz/div.
Sweep time : 200 msec/div.
Occupied band width : 25.6 MHz
16
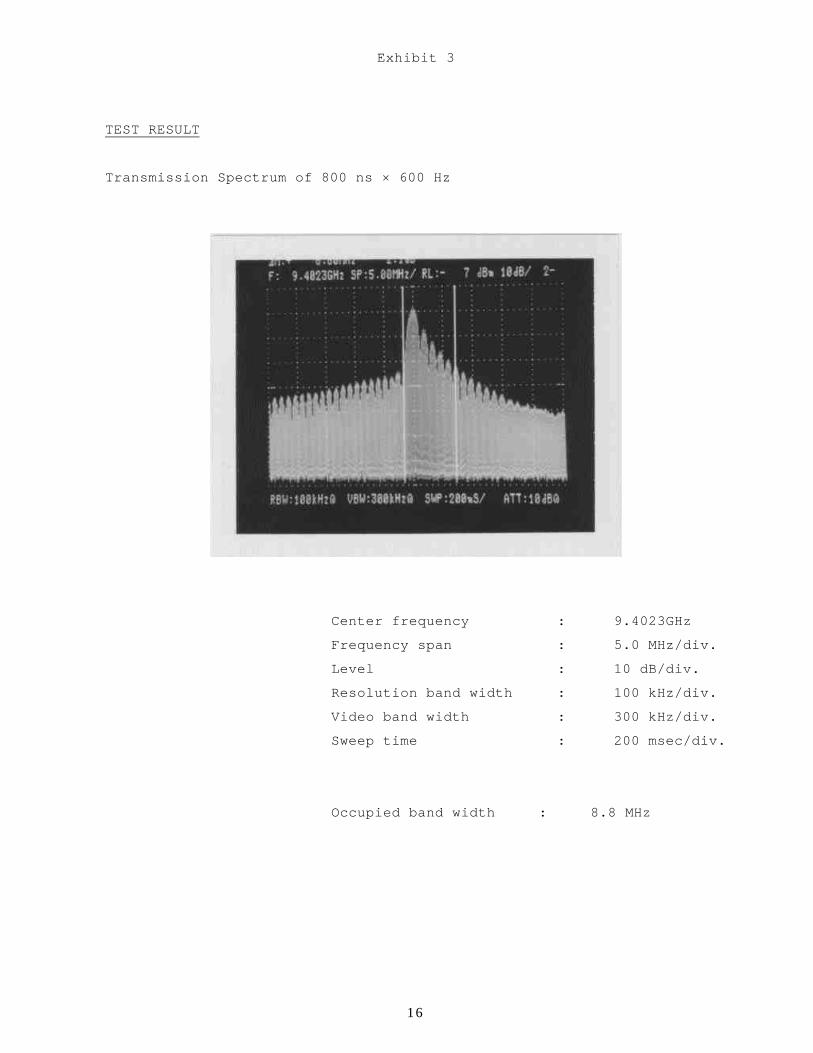
Exhibit 3
TEST RESULT
Transmission Spectrum of 800 ns × 600 Hz
Center frequency : 9.4023GHz
Frequency span : 5.0 MHz/div.
Level : 10 dB/div.
Resolution band width : 100 kHz/div.
Video band width : 300 kHz/div.
Sweep time : 200 msec/div.
Occupied band width : 8.8 MHz
17
Exhibit 3
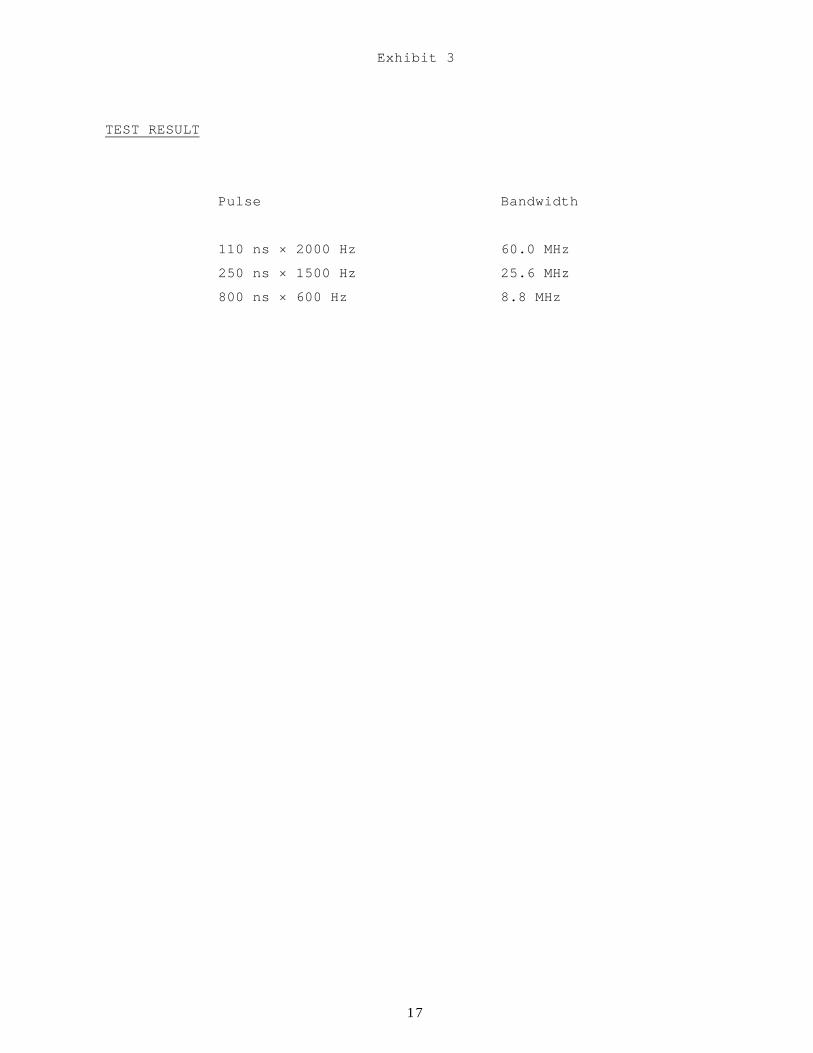
TEST RESULT
Pulse Bandwidth
110 ns × 2000 Hz 60.0 MHz
250 ns × 1500 Hz 25.6 MHz
800 ns × 600 Hz 8.8 MHz
18
Exhibit 4
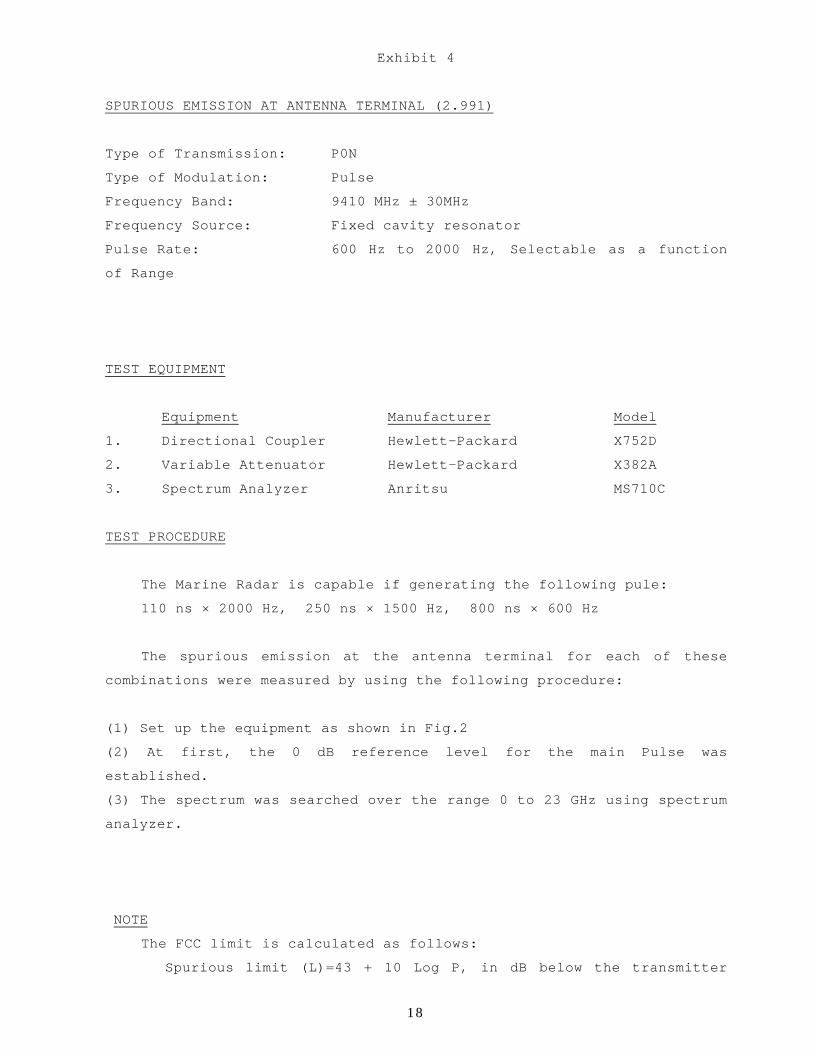
SPURIOUS EMISSION AT ANTENNA TERMINAL (2.991)
Type of Transmission: P0N
Type of Modulation: Pulse
Frequency Band: 9410 MHz ± 30MHz
Frequency Source: Fixed cavity resonator
Pulse Rate: 600 Hz to 2000 Hz, Selectable as a function
of Range
TEST EQUIPMENT
Equipment Manufacturer Model
1. Directional Coupler Hewlett-Packard X752D
2. Variable Attenuator Hewlett-Packard X382A
3. Spectrum Analyzer Anritsu MS710C
TEST PROCEDURE
The Marine Radar is capable if generating the following pule:
110 ns × 2000 Hz, 250 ns × 1500 Hz, 800 ns × 600 Hz
The spurious emission at the antenna terminal for each of these
combinations were measured by using the following procedure:
(1) Set up the equipment as shown in Fig.2
(2) At first, the 0 dB reference level for the main Pulse was
established.
(3) The spectrum was searched over the range 0 to 23 GHz using spectrum
analyzer.
NOTE
The FCC limit is calculated as follows:
Spurious limit (L)=43 + 10 Log P, in dB below the transmitter

19
output power, where P is the mean power output in watts (See
Exhibit 1).

20
Exhibit 4
TEST RESULT
9410 MHz 0 dB
2nd -65 dB
All other spurious and harmonics up to 23 GHz were found to be than
-70dB below maximum mean power, and/or 20 dB below limit.
Limit: -(43 + 10 log 2.01) = -46.0 dB
mean power:2.01 watts at 0.8 us × 600 Hz.
21
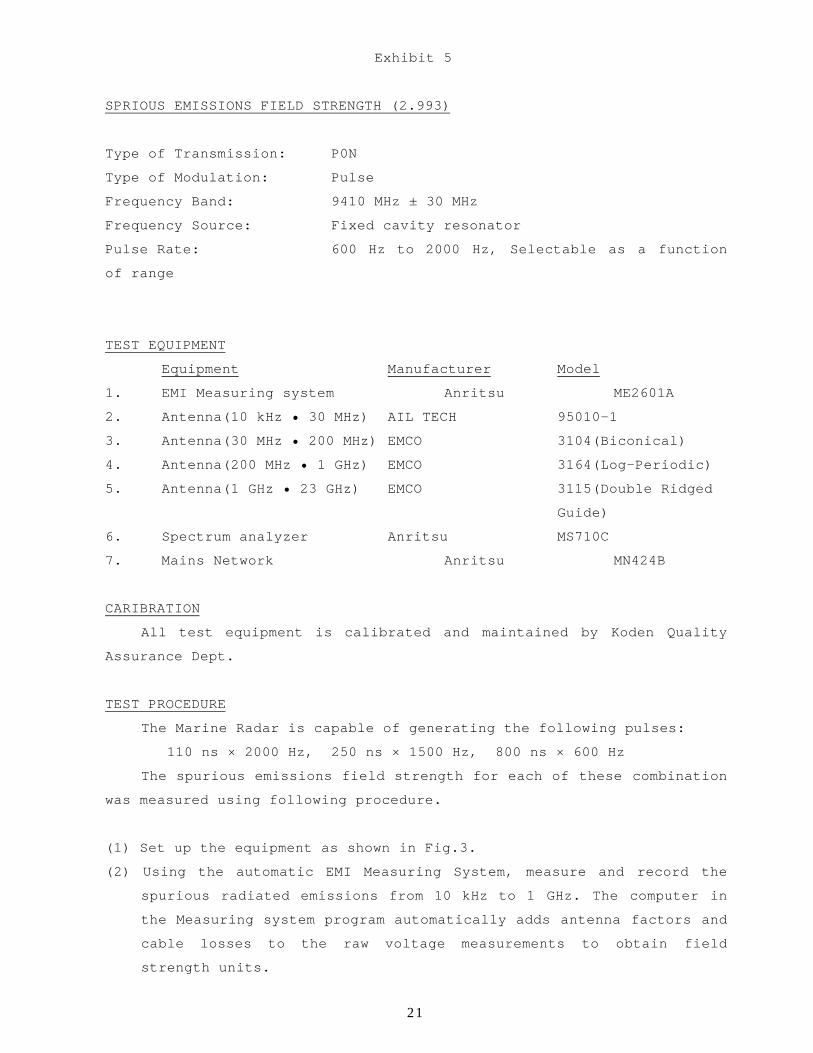
Exhibit 5
SPRIOUS EMISSIONS FIELD STRENGTH (2.993)
Type of Transmission: P0N
Type of Modulation: Pulse
Frequency Band: 9410 MHz ± 30 MHz
Frequency Source: Fixed cavity resonator
Pulse Rate: 600 Hz to 2000 Hz, Selectable as a function
of range
TEST EQUIPMENT
Equipment Manufacturer Model
1. EMI Measuring system Anritsu ME2601A
2. Antenna(10 kHz • 30 MHz) AIL TECH 95010-1
3. Antenna(30 MHz • 200 MHz) EMCO 3104(Biconical)
4. Antenna(200 MHz • 1 GHz) EMCO 3164(Log-Periodic)
5. Antenna(1 GHz • 23 GHz) EMCO 3115(Double Ridged
Guide)
6. Spectrum analyzer Anritsu MS710C
7. Mains Network Anritsu MN424B
CARIBRATION
All test equipment is calibrated and maintained by Koden Quality
Assurance Dept.
TEST PROCEDURE
The Marine Radar is capable of generating the following pulses:
110 ns × 2000 Hz, 250 ns × 1500 Hz, 800 ns × 600 Hz
The spurious emissions field strength for each of these combination
was measured using following procedure.
(1) Set up the equipment as shown in Fig.3.
(2) Using the automatic EMI Measuring System, measure and record the
spurious radiated emissions from 10 kHz to 1 GHz. The computer in
the Measuring system program automatically adds antenna factors and
cable losses to the raw voltage measurements to obtain field
strength units.
22
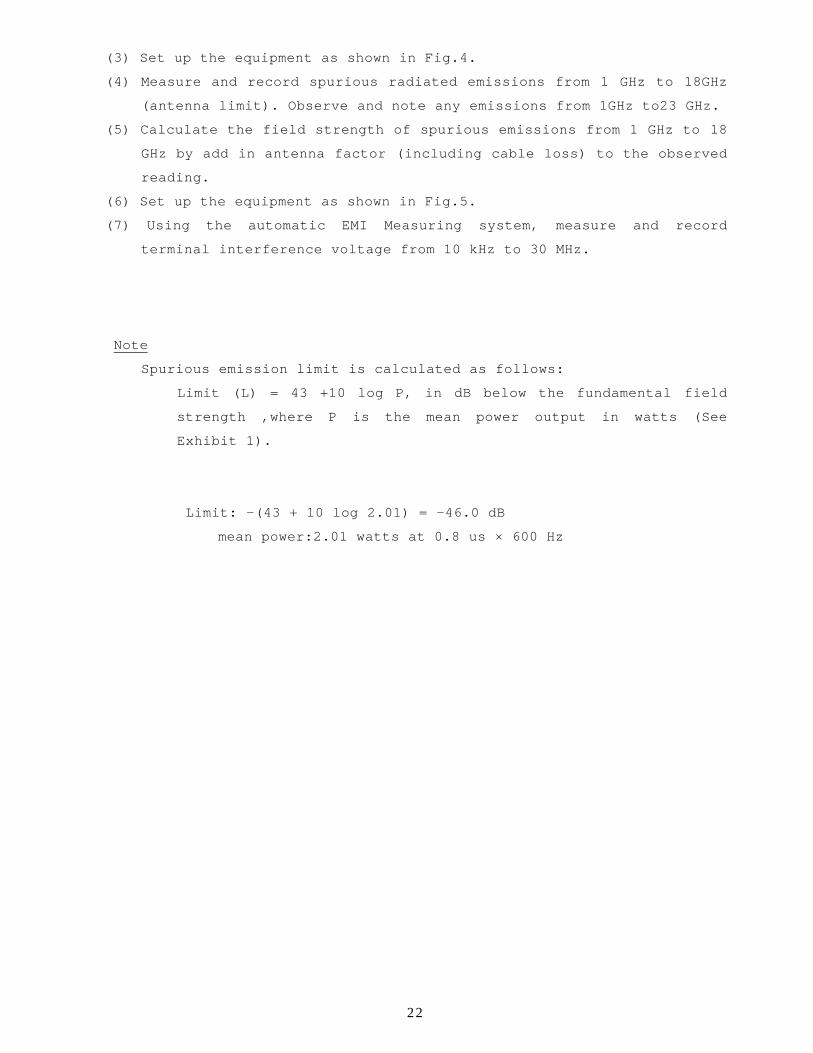
(3) Set up the equipment as shown in Fig.4.
(4) Measure and record spurious radiated emissions from 1 GHz to 18GHz
(antenna limit). Observe and note any emissions from 1GHz to23 GHz.
(5) Calculate the field strength of spurious emissions from 1 GHz to 18
GHz by add in antenna factor (including cable loss) to the observed
reading.
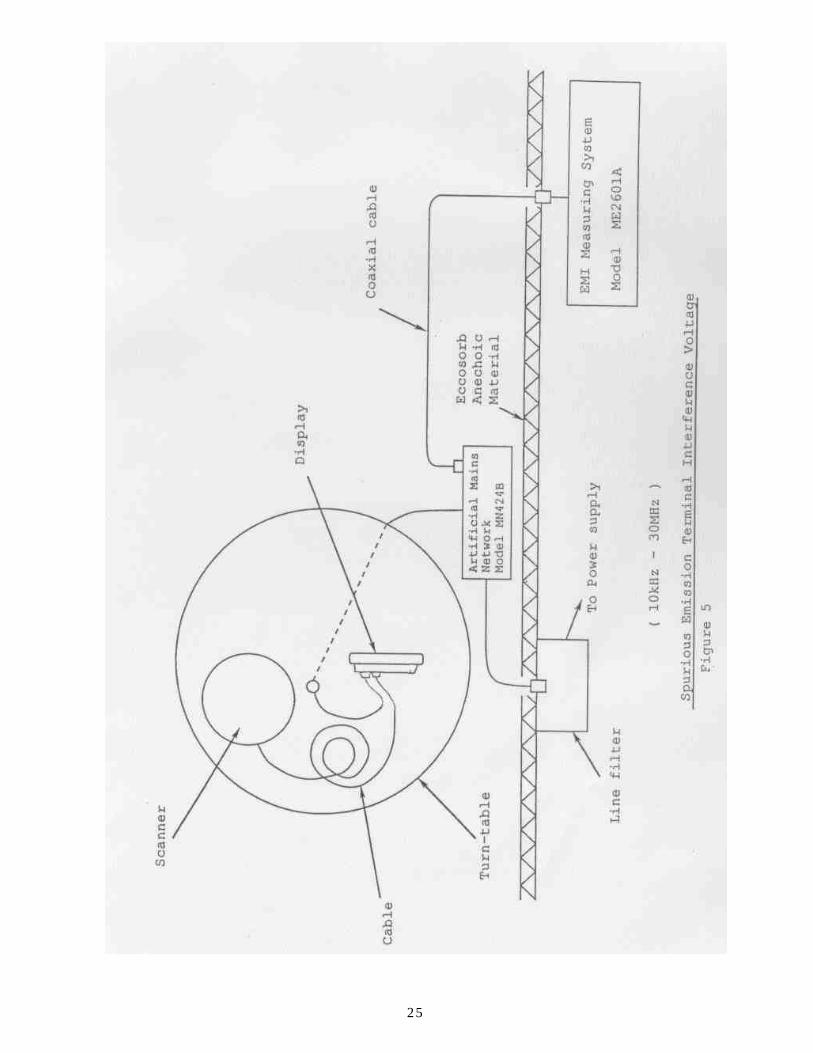
(6) Set up the equipment as shown in Fig.5.
(7) Using the automatic EMI Measuring system, measure and record
terminal interference voltage from 10 kHz to 30 MHz.
Note
Spurious emission limit is calculated as follows:
Limit (L) = 43 +10 log P, in dB below the fundamental field
strength ,where P is the mean power output in watts (See
Exhibit 1).
Limit: -(43 + 10 log 2.01) = -46.0 dB
mean power:2.01 watts at 0.8 us × 600 Hz
23

24
25

26
(Radiated Interference Field Strength 10kHz ~ 30 MHz)
27
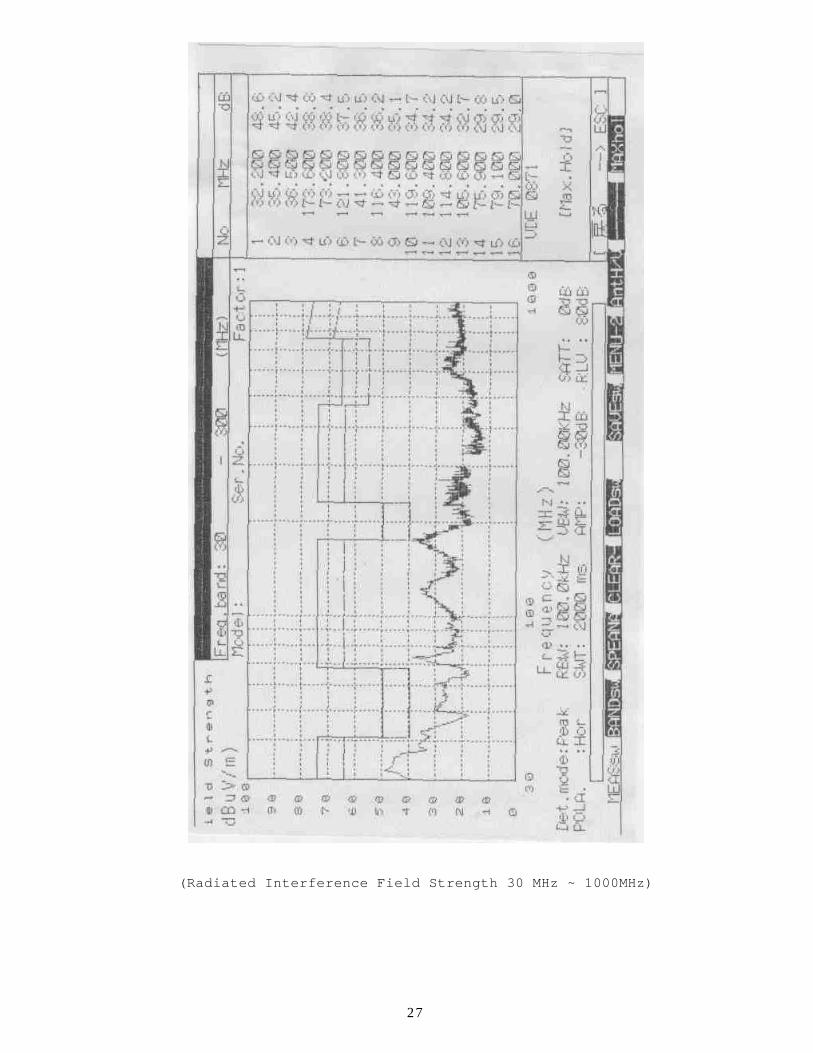
(Radiated Interference Field Strength 30 MHz ~ 1000MHz)

28
(Terminal Interference Voltage 10 kHz ~ 30 MHz)

29
Test result(All data)
Frequency Measurement
Level
Ratio to Main
Transmission
Refer to
Spurious
Emission
Field
Strength
9.410GHz
10kHz to
30MHz
30MHz to 1GHz
1GHz to 18GHz
18GHz to
23GHz
147dBu/m
Max. 60dBu/m
Max. 49dBu/m
Max. 60dBu/m
(Max.
70dBu/m)
0dB
-87dB
-98dB
-87dB
(-77dB)
Figure 4
Figure 3
Figure 3
Figure 4
Figure 4
Terminal
Interference
Voltage
10kHz to
30MHz
73dBu (-74dB) Figure 5
30
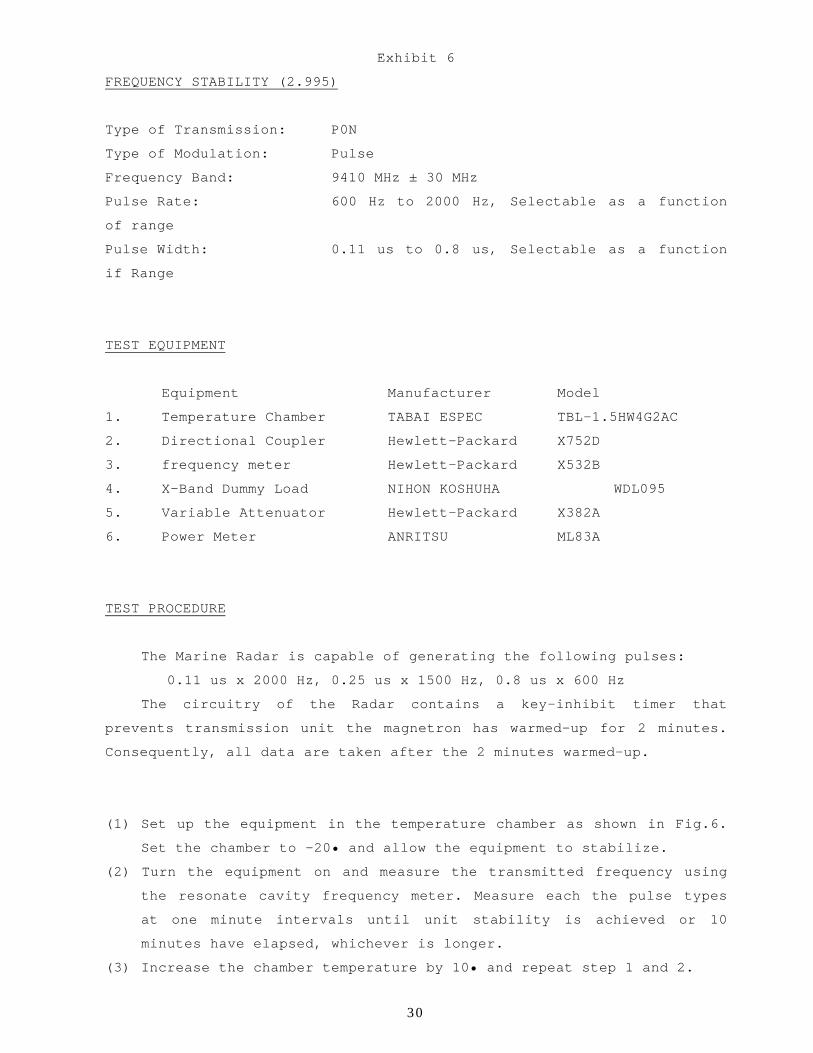
Exhibit 6
FREQUENCY STABILITY (2.995)
Type of Transmission: P0N
Type of Modulation: Pulse
Frequency Band: 9410 MHz ± 30 MHz
Pulse Rate: 600 Hz to 2000 Hz, Selectable as a function
of range
Pulse Width: 0.11 us to 0.8 us, Selectable as a function
if Range
TEST EQUIPMENT
Equipment Manufacturer Model
1. Temperature Chamber TABAI ESPEC TBL-1.5HW4G2AC
2. Directional Coupler Hewlett-Packard X752D
3. frequency meter Hewlett-Packard X532B
4. X-Band Dummy Load NIHON KOSHUHA WDL095
5. Variable Attenuator Hewlett-Packard X382A
6. Power Meter ANRITSU ML83A
TEST PROCEDURE
The Marine Radar is capable of generating the following pulses:
0.11 us x 2000 Hz, 0.25 us x 1500 Hz, 0.8 us x 600 Hz
The circuitry of the Radar contains a key-inhibit timer that
prevents transmission unit the magnetron has warmed-up for 2 minutes.
Consequently, all data are taken after the 2 minutes warmed-up.
(1) Set up the equipment in the temperature chamber as shown in Fig.6.
Set the chamber to -20• and allow the equipment to stabilize.
(2) Turn the equipment on and measure the transmitted frequency using
the resonate cavity frequency meter. Measure each the pulse types
at one minute intervals until unit stability is achieved or 10
minutes have elapsed, whichever is longer.
(3) Increase the chamber temperature by 10• and repeat step 1 and 2.

31
Continue in 10• increments until 50• has been achieved.
(4) Measure the output frequency at room ambient temperature following
voltages applied to the power input.
12V input: Apply 10.2V and 13.8V
24V input: Apply 20.4V and 27.6V
32V input: Apply 27.2V and 36.8V
(5) Calculate test frequency limits from the followings;
The frequency of the principal emission must not be nearer to the
edge of the authorized band than 1.5/t in MHz, (where t is the
shortest pulse used, in micro second).
t = 0.11us(nominal)
1.5/t = 13.64 MHz
Band Limit = 9.300000 to 9.500000 GHz
Emission Limit =9.31364 to 9.48636 GHz

32
33
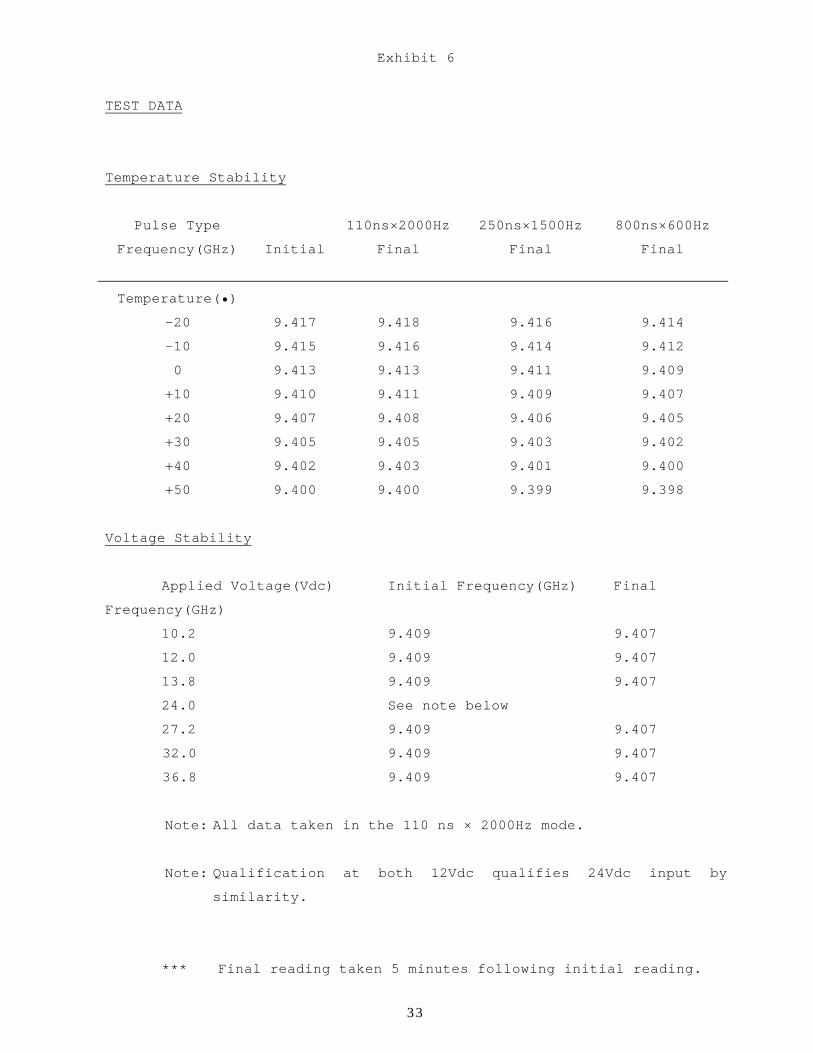
Exhibit 6
TEST DATA
Temperature Stability
Pulse Type 110ns×2000Hz 250ns×1500Hz 800ns×600Hz
Frequency(GHz) Initial Final Final Final
Temperature(•)
-20 9.417 9.418 9.416 9.414
-10 9.415 9.416 9.414 9.412
0 9.413 9.413 9.411 9.409
+10 9.410 9.411 9.409 9.407
+20 9.407 9.408 9.406 9.405
+30 9.405 9.405 9.403 9.402
+40 9.402 9.403 9.401 9.400
+50 9.400 9.400 9.399 9.398
Voltage Stability
Applied Voltage(Vdc) Initial Frequency(GHz) Final
Frequency(GHz)
10.2 9.409 9.407
12.0 9.409 9.407
13.8 9.409 9.407
24.0 See note below
27.2 9.409 9.407
32.0 9.409 9.407
36.8 9.409 9.407
Note: All data taken in the 110 ns × 2000Hz mode.
Note: Qualification at both 12Vdc qualifies 24Vdc input by
similarity.
*** Final reading taken 5 minutes following initial reading.

34