tesseract supersonic business transport - ntrs.nasa.gov · _asa-cr-i9-20?z-tesseract supersonic...
TRANSCRIPT

_ASA-CR-I9-20?Z-
Tesseract
Supersonic Business Transport
Case Western Reserve University
Department of Mechanical and Aerospace EngineeringCleveland, Ohio
Professor Eli Reshotko
Graduate Assistant: Gary GarbinskiTeam Manager: James Fellenstein
Aerodynamics:
Propulsion:
Structure:
Peter Struk
Maggie TaiUonGary WarzynskiJoan HooperMichael RyanBen TaggartMary BottingJames FeUenstein
(_,IAqA-CP-192072) rESSERACT:
SUPERS(.JN[C BUSINESS TRANSPORT
(Case _,,stern Reserve LJniv.) 74 p
N93-17977
Uncl as
G3/05 01_16_2
https://ntrs.nasa.gov/search.jsp?R=19930008788 2018-05-30T11:17:39+00:00Z

Abstract
This year, the senior level Aerospace Design class at Case Western
Reserve University developed a conceptual design of a supersonic business
transport. Due to the growing trade between Asia and the United States, a
transpacific range has been chosen for the aircraft. A Mach number of 2.2
was chosen too because it provides reasonable block times and allows the use of
a large range of materials without a need for active cooling. A payload of 2500
lbs. has been assumed corresponding to a complement of nine (passengers and
crew) plus some light cargo.
With these general requirements set, the class was broken down into
three groups. The aerodynamics of the aircraft were the responsibility of the
first group. The second developed the propulsion system. The efforts of both
the aerodynamics and propulsion groups were monitored and reviewed for
weight considerations and structural feasibility by the third group.
Integration of the design required considerable interaction between the
groups in the final stages. The fuselage length of the final conceptual design
was 107.0 ft while the diameter of the fuselage was 7.6 ft. The delta wing
design consisted of an aspect ratio of 1.9 with a wing span of 47.75 ft and mid-
cord length of 61.0 ft. A SNEMCA MCV 99 variable-cycle engine design was
chosen for this aircraft.
1
Table of Contents:
Abstract
Introduction
Analysis
Section 1: Aerodynamics
Section 2: Propulsion
Section 3: StructureConclusion
AcknowledgementsReferences
Appendix A: Aerodynamic FiguresAppendix B: Aerodynamic Drag AnalysisAppendix C: Aerodynamic Stability AnalysisAppendix D: Propulsion FiguresAppendix E: Structural Initial SizingAppendix F: Structural Final SizingAppendix G: Structural Landing GearAppendix H: Structural Finite Element Analysis
1
2
S
10
1620202122313439S0606870


Introduction
The Aerospace Design class was given the task of developing a
conceptual design of a supersonic business transport. The initial
specifications for the design were developed by the class and are listed below.
Table 1: Design Stseclflcatlons
RangeMach Number
Passenger & Crew CapacityTotal Payload
Transpacific2.2
9
2500 lbs.
With these guidelines, the class was broken down into three groups. Each of
the three groups was placed in charge of one of the following design areas: 1)
Aerodynamics, 2) Propulsion and 3) Structure. The lterative process of
aircraft design began with an initial sizing of the aircraft. For the
specifications listed above, a takeoff gross weight of 107,000 lbs. was estimated.
Also, a fuselage length of 107.O ft and a diameter of 7.6 ft were determined in
the initial study. After the initial sizing was completed each of the three
groups began a detailed analysis of their respective design area. During the
design process, constant communication between the groups was required to
keep the project on line. The final conceptual drawings of Tesseract axe
presented in Figures 1 thru 4 on the following pages.
2

107'
Figure 1: Top View
L
r
t__
80'
_J
30' :-
Figure 2: Side View

16' .I
47.75'
I
Figure 3: Front View
V7"
I
! !i
i i
i -laA
18"
Figure 4: Cabin Layout
4

Analysis
Section 1: Aerodynamics
During the initial conceptual sizing of the proposed supersonic business
jet, similar designs indicated that the jet would have approximately a maximum
lift to drag ratio (L/D max) of 8. Historical trends indicated that the most
efficient cruise for jet aircraft occurs at velocities higher that those that
would generate a maximum lift to drag ratio. This higher velocity is at a L/D of
86.6% of maximum (Raymerl). In our case, cruise L/D would be roughly 7.
A design cruise lift coefficient (CLcruise) was now determined from
initial mission requirements and basic flight mechanics. For an aircraft with
a takeoff gross weight (TOGW) of 107,000 lbs. and a cruising Mach number (M)
of 2.2, a reasonable CLcruise needed to be selected. A target range for the
cruising CL from 0.12 to 0.13 was selected based on similar designs. After some
iteration, a design lift coefficient of 0.128 was determined. This cruising CL
was designed for a wing reference area of roughly 1200 square feet and an
initial cruising altitude of 55,000 feet using equation 1.
CL=
CL=
Lift / q Sref = Weight / ( 0.5 * Ph--55,000 * V 2 * Sref)
q -- Dynamic Pressure Ph = Density of air at 55,000 ft.
V = Velocity Sre f ,_ Reference Area
99,800 lb / (0.5 * 2.87e-4 slug/ft 3 * (2129.5 ft/s) 2 * 1200 ft 2)
(Eq. 1)
Note that a weight of 99,800 lbs. was used in the calculation rather than 107,000
lbs. This smaller value is less the TOGW by a factor of 1296 of total fuel weight
(60,000 lbs.) which is a conservative estimate of the fuel consumed during
takeoff and climb. Any error in this estimation could later be accounted for by
slightly adjusting the initial cruising altitude.
As just alluded to, maintaining a constant lift coefficient during the
cruising portion of the mission while accounting for a constantly changing
weight (fuel consumption) can be accomplished by increasing the altitude of
the aircraft periodically as the fuel supply is diminished. Alternately, velocity
can be altered (reduced) to accomplish the same effect but obviously this
method is not practical. From similar calculations as above, the results in
Table 2 were obtained.
5

Ti_bl¢ 2: Altitude as a Function of Fuel and CLn-uise
CL Cruise
0.128
Fuel Remaining Altitude(% weight) (ft)88 55O0O
0.128 53 600000.128 25 65OOO
From the above analysis, a change in cruising altitude of roughly 10,OOO
feet would be required to maintain a constant lift coefficient. Such a flight
prof'zle (see Figure 1, Appendix A) might have restrictions due to flight
regulations of maintaining constant altitude during all or portions of the
mission. Although, at present, such altitudes are not as populated as some
lower flight levels, such considerations must be mentioned in the early design
stage. Implications of this may result in the aircraft not flying at its design lift
coefficient during the entire cruise.
Before the analysis could proceed any further, a wing planform needed
to be selected. Several wing planform designs with subsonic or supersonic
leading edges were investigated. Forward swept and eccentric wings were
considered (primarily for novel W) but were unfortunately discarded due to a
lack of Literature and data available on these subjects. A delta configuration
with subsonic leading edges was chosen for the main reason that theories for
wing performance of deltas existed and were readily available.
A subsonic leading edge was desired to minimize the supersonic wave
drag. To guarantee this the leading edge sweep back angle must Lie within the
Mach cone. Based upon a free stream cruise Mach number of 2.2 and a normal
to the leading edge Mach number of 0.8, the sweep back angle was calculated to
be 68.7". This Lies within the Mach cone which is 63.0".
Based on the previous discussion, and to minimize induced drag (as shall
be discussed hereafter) an aspect ratio of 1.9 was desired. Based on the
aforementioned pure delta configuration, an aspect ratio of 1.56 was
calculated. This aspect ratio needed to be increased without changing the
reference area of the wing. The main motivation for this was to minimize the
induced drag which is inversely proportional to the aspect ratio. To
accomplish this a triangular section was removed from the trailing edge of the
wing (see Figure 2, Appendix A).
6

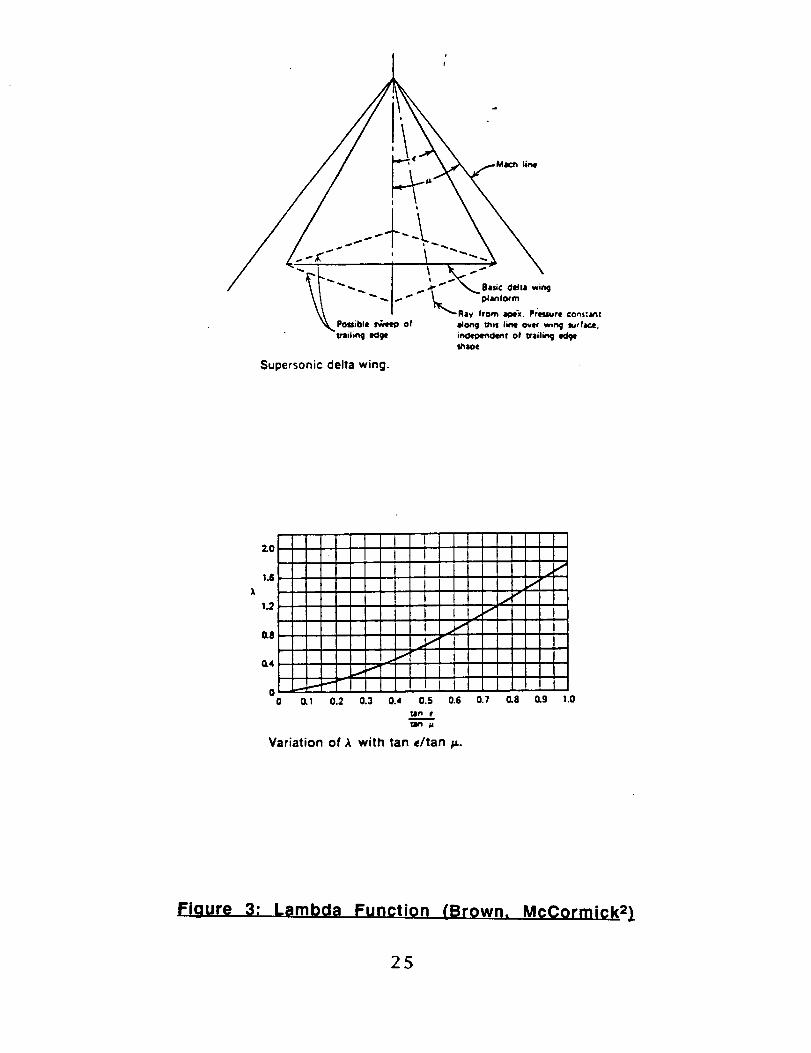
There are theories available to predict the performance of delta wings.
One such theory developed by Brown 3 for the lift curve slope (a) is as follows:
a = 2 rT2 tan e / (IT + lambda) (eq. 2)
Lambda is a function of the ratio of one-half the apex angle tangent (tan e) to
that of the tangent of the Mach angle (see Figure 3, Appendix A). For the
particular configuration shown, lambda is equal to 1.25 which in turn gives a
lift curve slope of 1.76 per radian as shown in Figure 4, Appendix A.
Airfoil selection is difficult due to the unavailability of recent airfoil
developments. An airfoil must be selected to meet the above mentioned
parameters. Based on historical trends for this type of aircraft, a thickness
ratio (t/c) between 0.07 and 0.09 is predicted. This range excludes the use of
present day supercritical airfoils, because they tend towards higher thickness
ratios (roughly O. 15 ).
The next step in aerodynamic considerations was the calculation of the
total drag on the aircraft during cruise. To determine the parasite drag
coefficient, the component buildup method as prescribed in Raymer 1 was
followed. This method considered each portion of the aircraft separately. The
value of the overall coefficientwas then found by summing the drag of the
individual components. Each component's skin friction drag was determined
using fiatplate approximations. These values for Mach 2.2 are summarized in
Table 3 and are presented in Appendix B.
In lieu of the effects of lights,antennae's, and other manufacturing
defects along with other unaccountable factors,an exact coefficientcan not be
determined. A correction factor of 10 percent can be added to the skin friction
drag of the aircraftas prescribed by Raymer I.
The wave drag of the aircraftwas determined using an approximation
method described in Raymer I. This method is valid only for a cross sectional
area distribution of the aircraft similar to a Sears-Haack distribution (see
Figure 5, Appendix A). Aimed at minimizing wave drag, the aircraft was
designed as close as possible to this ideal distribution. For the aircraft, the
wave drag coefficient corrected for Mach number and non-ideal area
distribution is 0.0068. The values for the induced drag at supersonic speeds
were calculated using a theory developed by Brown3 similar to that used for
7

determining the lift curve slope. This method produces an induced drag value
of 0.0058 for the aircraft (see Figure 4, Appendix A).
Drag calculations for the subsonic and transonic regimes were
calculated for varies altitudes using software developed by Kern 4
International entitled B_i_ Aircraft PerformanCe Aniily_is . This program
calculated parasite drag for Mach numbers ranging from 0.0 to 1.0. These
values were predicted by simply smoothing the curve generated from the data
above. While this may seem a crude approximation, such a technique will
suffice for the preliminary design. All the results of the parasite drag are
presented in Figure 6, Appendix A as a function of Mach number.
Table 3: Dra_ Summary Durin_ Cruise
Parasite Drag Coefficient
Skin Friction Drag .0051Wave Drag .0068
Miscellaneous .0005
TOTAL CD,0 .0124
Induced Drag[ Induced Drag CD.i[ .0CP38
Total Dra 8 CoefficientParasite Drag .0124
Induced Drag .0058
TOTAL Co .0182
Longitudinal static stability of most conventional aircraft require the
use of a horizontal stabilizer or simply a horizontal tail. For an aircraft with a
delta wing configuration, an actual horizontal tail separate from the wing is
not always present. Rather, the horizontal taft surface is part of the delta wing
configuration (see Figure 7. Appendix A).
Several difficulties, however, arise from not employing a horizontal tail
separate from the wing. To maintain longitudinal static stability, the tail of
the aircraft may need to produce a force in the direction of gravity to balance
the moments of the aircraft about the center of gravity. This will require a
portion of the wing to generate negative lift. This then requires the portion
8

of the wing generating positive lift to balance the negative lift as well as
support the weight of the aircraft to maintain level flight.
In analyzing the static stability for the aircraft, it was discovered mat a
horizontal stabilizer was essentially unnecessary for the cruising speed of
Mach 2.2 (results in Appendix C show that a slightly positive lifting force is
required). However, for flight at speeds lower than our cruising speed, the
aircraft becomes inherently unstable. This is primarily due to the large shift
in the aerodynamic center of the aircraft. The analysis for low speed static
stability needs to be evaluated and an appropriate control system needs to be
incorporated. For the present, a tail has been added to the design in
anticipation of its use in maintaining low speed static stability.
The criteria for longitudinal static stability at cruise were satisfied for
our design with the horizontal tail. The necessary criteria are:
1. CM,O must be positive (moment at zero lift)
2. 8CM,cg/OAa
For this design, the pertinent stability figures are listed in the following table
at are calculated in Appendix C:
Table 4: Stability Ana!vsis
Location of the center of gravity as afraction of root chord (Empty Weight)
Location of the aerodynamic center as afraction of root chord at M =2.2
Moment coefficient of the wing body about
the aerodynamic center at M=2.2Tail Area
Distance of tail aerodynamic Center to the
center of ,gravityWing Reference Area
Mean aerodynamic chord of the delta wingTail Volume Coefficient
Static Margin at M=2.2
0.70
0.77
0.00
50 ft 2
30 ft
1200 ft 2
33.6 ft
0.037
0.09
The aerodynamic center of the delta wing was determined using a
graphical method prescribed in Raymer 1. This method allows us to determine
the location of the aerodynamic center of the wing as a fraction of the root
chord. The graphical method is shown in Figure 8. For the aircraft, the graph
corresponding to a taper ratio of zero was used in the analysis.
9

To maintain longitudinal static stability the aircraft's center of gravity
throughout the flight must remain in front of the neutral point. This distance
as a fraction of the chord is known as the static margin and should not go less
than 5 percent during any portion of flight. If the static margin falls below 5
percent then the forces required to maintain balance may become too large.
However, if the static margin exceeds 15 percent the aircraft becomes
'sluggish'. This essentially means that the restoring forces resulting from
changes in angle of attack are small, resulting in slow response time.
Section 2: Propulsion
The propulsion system consists of two variable cycle engines mounted
under the wings toward the rear of the aircraft. The system is designed for a
flight cruise speed of Mach 2.2. The fuel to air ratio for this system was
assumed to be 1/35. The thrust required at Mach 2.2 is 7180 lbf. The mass flow
rate of air at cruise is 79.45 lbm/s. The fuel mass flow rate at cruise is 2.27
lbm/s. The propulsion system is designed to handle the one engine out FAA
requirement.
The propulsion system was divided into three sections: the inlet, the
turbomachinery and the exhaust. Both inlet and exhaust air flows were
modeled as adiabatic and compressible. A two-dimensional square inlet
controls the velocity and pressure of the air into the engine core. Engine
mounting is less complex for a rectangular inlet than for a circular one. The
different mass flows associated with the range of flying conditions are
accommodated by the use of a variable area ramp. A circular exhaust nozzle
controls the velocity leaving the engine. The exhaust nozzle, like the inlet
ramp, is variable to allow for the necessary exit velocities required at various
flying conditions. Two convergent nozzles are employed when flying at
subsonic speeds. Supersonic speeds require the use of a convergent-divergent
nozzle. These configurations are shown in the operating mode diagrams
(Figure 1, Appendix D)
A SNEMCA MCV 99 variable-cycle engine design was chosen for this
aircraft. This variable-cycle engine has four operating modes: take-off, climb,
subsonic cruise and supersonic cruise. The climb operating mode is also used
for transonic acceleration. This cycle's use of premixing before combustion,
staged burning, rich burn, quick quench, lean burn combustor and a variable
10

area geometry reduces pollutant emissions into the atmosphere by fifty
percent when compared to present cycles' emissions (Habrard6).
Part 1: Inlet Design
The purpose of the inlet is to bring free stream air to the required
velocity of Mach 0.5 at the entrance to the compressor with a minimum total
pressure loss. Since the aircraft will spend the majority of its flying time at
cruise conditions of Mach 2.2 and an altitude of 55,000 feet, the inlet was
designed for these conditions. A variable ramp will accommodate the
adjustments needed for the other stages of flight (see Figure 2, Appendix D). A
square inlet with a width of 3.66 feet and a capture area of 13.4 square feet was
designed. Two oblique shocks and a normal shock slow the free stream air flow
to Mach 0.5 at the compressor entrance. As suggested by Connors and Meyers 5,
the ramp deflection angle are 9.9 and 10 degrees respectively.
To achieve a minimum total pressure loss at supersonic flight
conditions, internal contraction was used to swallow the normal shock. The
pressure recovery with internal contraction, allowing for some losses, is 0.91.
The concept behind using internal contraction as opposed to other types of
supersonic inlets is the variation in pressure recovery. By increasing the
throat area the normal shock is swallowed further back allowing a higher
percentage of pressure recovery. The design method for internal contraction
began with the evaluation of pressure, area and temperature ratios of the two
oblique shocks and the normal shock. The second step involves the swallowing
of the shock by increasing the area of the throat. This is referred to as
internal contraction. Area ratios with respect to throat area for isentropic
flow were found for the Mach number before the normal shock (Mx) and for
the Mach number after the normal shock (My). These area ratios were then
divided to determine the internal contraction area ratio. The area ratio at
Mach 0.5 at the face of the compressor and the isentropic area ratio for My
were used to calculate the ratio of the compressor face area to the throat area.
The boundary layer is susceptible to separation during supersonic
cruise. Separation occurs from the development of a severe pressure gradient.
In order to prevent separation, a channel-type boundary layer diverter
system on the ramp removes most of the boundary layer before the shocks. In
this removal system the boundary-layer air is caught between a splitter plate
11

and the fuselage. This caught air is then removed from the channel by
diverting ramps angled at approximately thirty degrees.
There are blow in doors near the fan that only feed into the fan.
Therefore, these doors only need to be opened from takeoff to high transonic
flight conditions when the fan is in use.
Following the throat, a diffuser with a length of two feet, diffuses the
flow from approximately Mach 0.72 after the normal shock to Mach 0.5 at the
compressor entrance. A variable inlet ramp adjusts for the varying flight
conditions from takeoff through transonic and to cruise at Mach 2.2. For
takeoff conditions the ramp is retracted to lead the air directly to the
compressor inlet without a contraction. This position allows greater airflow
into the engine to achieve the necessary greater thrust level (see Figure 3 and
the accompanying analysis in Appendix D).
Inlet drag is approximated from the inlet drag trends plot for a two-
dimensional inlet (Figure 4, Appendix D). This plot was compiled from typical
data previously collected (Raymer 1). Inlet drag for different modes of flight
for this design were estimated high due to the generality of the sources (Table
5). The maximum drag occurs at approximately Mach 1.3.
Table 5: Inlet Dra Estimates
D= Drag
Mach D/q/A D (Ibs.)Number
2.20 0.101.30 0.230.95 0.18 7130.10 0.02 3.8
9111733
q - Dynamic Pressure A = Capture Area
Part 2: Exhaust
The exhaust nozzle provides back pressure control for the engine and
an acceleration device converting gas potential energy into kinetic energy.
The throat area is the controlling factor. Since the pressure loss is less for a
circular shape, a circular nozzle was chosen instead of a rectangular shape.
The circular nozzle assembly also weighs less and is less complex compared to a
two dimensional nozzle (Raymerl).
12

A variable-area exhaust nozzle is utilized to accommodate the varying
flight conditions. Two convergent nozzles are utilized during subsonic flight,
one for the fan and one for the core. A convergent-divergent nozzle is used
during supersonic flight. During supersonic cruise at Mach 2.2, the nozzle
increases the velocity of the mass flow from approximately Mach 0.5 to Mach
2.8. Since the ratio of specific heat decreases through the engine cycle, an
average of exit areas calculated with different specific heat ratios (1.3-1.4) was
used. The calculated exit area was 26.9 square feet with a throat area of 6.8
square feet.
Exhaust nozzle analysis involves the use of two dimensionless
coefficients, the discharge coefficient and the velocity coefficient. The
discharge coefficient represents the difference between ideal mass flow and
actual mass flow. The velocity coefficient represents the frictional losses in
the boundary layer of the nozzle. From these coefficients the angle geometry
of the nozzle was determined. See Figure 5 and the accompanying analysis in
Appendix D for the aforementioned information. The primary half angle is
ten degrees and the secondary half angle is fifteen degrees.
Part 3: Turbomachinary
Selection of the engine to power the aircraft was constrained by the
need to have good fuel efficiency at several flight speeds and altitudes while
keeping noise low on takeoff. Single cycle engines (plain turbojets and
turbofans) were considered but found lacking in one or more areas. Turbojets
give good supersonic performance due to their high exhaust velocity, but are
too noisy for civilian use. Turbofans have a lower exhaust velocity and are
therefore quieter, but give poor supersonic performance. As a result, a dual-
cycle engine that combines the advantages of both turbojet and turbofan was
chosen. The design is basically a scaled-down SNECMA MCV99 dual-cycle
engine (see Figure 9, Appendix D). At cruise, this gas turbine acts like a
normal turbojet, but at lower speeds a fan mounted around the narrow core
section is started to give greater efficiency by reducing the exhaust velocity
(and therefore noise as well). This concentrically mounted fan is driven by its
own combustor and turbine fed by bleed air from the core engine. Cruise
efficiency is improved over a turbofan engine because the low-velocity fan,
which does not give much thrust at supersonic speeds, is shut down when it is
13

not needed. This engine is also fuel efficient because it does not require an
afterburner in any part of its operational envelope.
Originally three engines were to be used for safety in case of engine
failure. The decision to use two engines was made for two main reasons. The
first was that two engines would give a lower overall weight. The second was
the problems involved in mounting an engine to the centerline of the
aircraft. These included boundary layer removal, foreign object damage, and
accessibility.
Selection of engine thrust was constrained by the cruise condition. At
55,000 ft. in level flight each engine had to deliver 7,180 lb. of thrust. A sea
level static thrust of 25,000 lb. was then fixed representing an 8.1%
improvement over a sample engine's altitude performance provided by
(Raymer 1 ). Analysis of Federal Airworthiness Regulations found that the
most demanding part of a one engine out takeoff for this aircraft required
only approximately 20,000 lb. of thrust per engine at sea level. This is quite
less than the engine size needed for cruise. The MCV 99 engine has a thrust of
49,455 lb, and was therefore scaled down for use in this design using a modified
"rubber engine" process presented by Raymer 1. The resulting engine
dimensions are in Table 6.
Table 6: Engine Dimensions
Length 12 ft
Compressor Diameter 3.41 ftFan Shroud Diameter 4.13 ft
Fan Hub Diameter 2.21 ft
The hub ratio for the fan was found to be 0.535, greater than the 0.5
minimum given by SNECMA as necessary for the compressor (Habrard6). The
weight of the engine was set at 5,000 lb. based on a historical thrust to weight
ratio of 5 for recent supersonic engines (Aviation Week & Space Technology
7,8&-9). Blow-in doors are needed when the fan is operating to provide correct
airflow, and these have been designed as doors that open out 0.65 ft. on either
side of the engine nacelle to give an additional 6.41 square feet of capture area
for the fan. These doors close and the fan shuts down as high supersonic
speeds are reached.
14

The figures given for this engine by SNECMA are shown in Table 7.
Table 7: SNECMA Engine Characteristics
SFC
(Ibf/Ibm/hr)Pressure
Ratio
Bypass RatioFan Pressure
Ratio
Bleed Ratiofor Fan
Takeoff
(sea level)0.638
192.
1.O
2.5
035
M=2.2 Cruise M=l.3 Climb M=0.95 Cruise
1.138 1.000 0.873
17 18.8 19
0 1.04 0.994
n/a 2.46 2.48
0 0.36 0.34
It is assumed that these figures can be held constant even for a lower thrust
engine.
At cruise condition, a common air/fuel ratio of 35/1 was assumed to give
an air mass flowrate of 79.45 lbm/s. The fuel flowrate at the same condition is
2.27 Ibm/s, and the exit velocity is 4237 ft/s.
Thermodynamic analysis (Cengel, Boles 10) of the engine gives an ideal
Brayton cycle thermal efficiency of 55.49% at cruise. For a maximum constant
turbine inlet temperature of 3060 R (Habrard6), and assuming an 85% efficient
compressor and a 90% efficient turbine, the actual thermal efficiency goes
down to 45.9%.
A rich burn/ quick quench/ lean burn combustor has been chosen as a
promising solution (Habrard 6, Bahr 11) to avoid creating large mounts of the
pollutant nitrogen oxide. NOx is produced in the largest amounts when
combustion is at stoichiometric ratios. To avoid this, the first stage of the
combustor is run at over-stoichiometric levels of fuel. This rich mixture is
then mixed with air quickly, and the combustion continued at less than
stoichiometric levels. The ratios that cause NOx production axe then avoided
completely during the combustion process.
15

Section 3: Structure
The structural design team was responsible for the following tasks: 1)
estimating an initial takeoff gross weight (TOGW) and the initial sizing of the
aircraft; 2) the final weight estimation; 3) landing gear and 4) a finite element
analysis of the aircraft.
Part 1: Initial TOGW and Sizing
The initial TOGW of the aircraft was determined by a statistical
comparison of current aircraft designs based on the following specifications
listed in Table 8.
Table 8: Desiffn Specifications
Range
Passengers & Crew
Passenger & Crew WeightPayload
5r000 nm9
lr800 lbs.700 Ibs.
In the initial study, the effects of varying the range, crew and
passenger size, cruise altitude, specific fuel consumption, lift to drag ratio and
the weight equation constants (either jet transport or jet fighter) were
examined with respect to the TOGW. See Tables 1 through 8 in Appendix E for
the results of this initial trade study. The estimated TOGW varied from 103,000
lbs. to 117,000 lbs. in this study so a target w_ight of 107,000 lbs. was set.
Next, the fuselage length was found from the estimated TOGW and a
statistical relationship based on current aircraft designs (Raymer 1). Using
this method a fuselage length of 107.0 ft was calculated. With the length set,
the diameter of the fuselage was determined to be 7 feet 8 inches based on a
supersonic fineness ratio of fourteen (Raymerl). The fineness ratio is the
ratio between length and diameter of the fuselage which minimizes wave drag.
The inner diameter of the fuselage was set to 7 feet after allowing for a 4 inch
fuselage thickness. These calculations are presented in Appendix E.
With the initial sizing complete, a cabin layout was generated using the
values for economy and high density passenger compartments presented by
Raymer 1 (see Figure 4 on page 4). The total passenger cabin length is 15 foot
4 inches. A recessed floor was used to allow for a 6 foot 2 inch high aisle with
a width of 18 inches. The passenger compartment seated six people plus a jump
16

seat for the flight attendant. Three seats were placed on each side of the aisle
and had a width of 18 inches and a seat pitch of 36 inches. The headroom was 5
feet 10 inches. The cabin also included a 40" X 40" lavatory and a small galley.
Part 2: Final Weight Estimation
After the initial analysis from both the aerodynamics and propulsion
groups was completed, a more accurate weight estimate for the aircraft was
required. Five different weight approximation methods (Raymer 1, Nicolai 12)
were tested on the Concorde to determine their accuracy for supersonic
aircraft. The Concorde was chosen for the comparison because it has a
comparable speed of Mach 2.2 but is almost twice the size of our initial TOGW
estimate. In each case, a discrepancy of 1096 or more was found between the
estimated empty weight and the actual Concorde empty weight. To compensate
for the large errors in using any of the methods Individually, the method used
was a combination of the weight estimation equations that best approximated
the individual components of the aircraft. The difference between the
estimated empty weight and the actual empty weight using the combined
method was 3.7%. Applying this technique to our design and using the 3.796
difference as a correction factor, the estimated empty weight of Tesseract was
found to be 42,878 lbs. Based on a composite utilization by weight of 5596
(Nicolall2), the final empty weight of the design was estimated at 37,778 lbs.
With the weight of each of the individual components of the aircraft known,
the empty weight center of gravity was calculated to be 73.1 feet from the
nose. These calculations are presented in Tables 1, 2 and 3 in Appendix F.
Part 3: Landing Gear
Next, the main landing gear is located 80 feet from the nose of the
aircraft and is 16 feet off the centerline of the fuselage. It will be positioned
on the wing next to the engines. They will fold in towards the fuselage and
most likely will need a pod to house part of the gear which does not fit in the
wing. The total length of the main landing gear is 20 feet preventing the taft
of the airplane from dragging on the ground during takeoff (see Calculations
in Appendix G). The main gear was designed using an estimate of the forward
center of gravity (CG), aft CG and aerodynamic center. The values used were 76
feet, 80 feet, and 86 feet respectively, from the nose of the airplane. The type
of strut used for all the gear is an oleo shock-strut. The main landing gear is
17

comprised of two struts with each strut having two sets of tires for a total of
eight tires. The tire size is 37 inches in diameter and 12 inches wide. The
maximum static load on each main gear strut was calculated to be 48,600 lbs.
The nose gear is located 30 feet from the nose of the airplane. It is
located on the fuselage and wiU fold forward into the fuselage to allow the gear
to free-fall down in case of a failure in the extension system. The nose gear
will be slightly longer than the main gear. It will also have an oleo shock-
strut and have two tires. The size of the tires are 22 inches in diameter and 8
inches wide. The maximum static load calculated for the nose gear was 17,500
lbs. which is 18% of the maximum static load for the main gear. This
percentage is higher then the suggested 14% or less. The minimum static nose
gear load is 9,700 lbs. and the maximum braking load is 12,000 lbs. All the
landing gear calculations are based on information presented by Raymer 1 and
Currey 14 and can be found in Appendix G.
Part 4: Finite Element Analysis
A finite element analysis was completed on the fuselage and wing using
the software "GIFTS 13''. Three sections of the aircraft were modeled during the
analysis. These sections included the cabin section, the fuselage wing root
section and the internal wing structure. Aluminum Alloy 2014-T6 was used for
all of the structural members used in the analysis. Due to the fact that this
analysis coincided with the aerodynamic and propulsion studies, the initial
numbers used in the finite element analysis do not reflect the most recent
changes in the design.
The cabin section was idealized with 96 nodes and 160 elements. The
bulkhead and stringers were idealized as hoUow square cross sections which
were evenly spaced in a circular configuration. The maximum bending
moment the airplane would experience and the shear load were calculated
using a maximum load factor of 2.5. The internal cabin pressure was assumed
to be small compared to the force of the bending moment and therefore was
ignored.
The calculated stress due to pressure exerted on the cabin was found to
be 8,500 psi. A value of 31,000 psi. was obtained for the total stress of the
airplane at lift-off based on the maximum moment and shear stresses.
Therefore, the total stress that the plane would have to withstand would be
40,000 psi.
18

The second test section, where the wing attaches to the fuselage, was
modeled in a more simplistic manner. It had eight booms in a hexagonal shape
with "I" beams as internal support. Furthermore, "I" beams were used to
represent the wing. The maximum bending moment and shear forces were
also applied to this section.
The finite element analysis of the wing was completed by modeling the
spars as 'T' beams. The 'T' beams varied in size from the largest at the root
(2'43") to the smallest at the outermost rib (0'-6") (see Figure 1, Appendix H).
The ribs were idealized as 3/16" flat plates which also ranged in height
through the structure (see Figure 2, Appendix H). Over 150 elements were used
for the interior of the wing to improve the accuracy of the results.
The following design specifications shown in Table 9 were used in the
analysis.
Table 9; Finite Element Design Soeciflcations
Wing Loading
, Aspec.t Ratio
100 psf1.7
Wing Span 47.31 ftCenter Line Chord 57.73 ft
Maximum Load Factor 2_
Using GIFTS, the maximum deflection for the interior of the wing was
six inches. Figures 4 and 5 in Appendix H shows the wing tip deflection and
the wing outer chord warping. At the root, the maximum normal stress for the
spars ranged from 1.24xE6 psf to 1.61xE6 psf. The wing also showed warping at
the outer trailing edge with the distributed 100 lb/ft 2 load.
The skin of the wing was also examined for our wing configuration but
was not included in the report because the software used would not allow the
marriage of the internal structure and the skin to be joined in one complete
structure. This inability of the software resulted in the skin analysis to be
inconclusive in the overall design of the wing.
19

ConclusionThe initial iteration of the Tesseract Supersonic Business Transport was
a success. However, to complete the conceptual design of this aircraft a f'mal
iteration of the data is required to mesh the simultaneous work of the three
design groups. For Example, the initial takeoff gross weight estimates may
have been to high. Initially, the weight of the aircraft structure was estimated
between 4096 to 5096 of the takeoff gross weight. During the final weight
estimation, based on a composite utilization by weight of 55%, the aircraft
structural weight was estimated at 3596 of the takeoff gross weight.
Furthermore, the specific fuel consumption for the SNEMCA MCV 99 variable-
cycle engine was lower than the 1.3/hr expected resulting in further
reduction of the required takeoff gross weight for the aircraft. Also, the
aerodynamic analysis for low speed static stability needs to be evaluated and an
appropriate control system needs to be employed. Even though the conceptual
design of this aircraft was not completed to incorporate the latest changes of
each of the design groups, this project has developed the bases for a future
supersonic business transport design.
2O

Acknowledgements
Professor R. Q_inn and the Spring, 1992 EMAE 376 Class
Mr. Art Glassman of NASA Lewis
NASA/USRA
Summary report prepared by James Fellenstein and Peter Struk
References
1. Raymer, D.P., Aircraft Desitn: A Conceotual Aopr0ach, Washington,
D.C., American Institute of Aeronautics and Astronautics, 1989.
2. McCormick, B.P., Aerodynamics. Aeronautics, & Flight Mechanics.
New York, John Wiley & Sons, 1979
3. Brown, C.E., Theoretical Lift and Drao of Thin Tri_n_ar Wings
at Suoersonic Soegd$, NACA Report 839, 1946.
Kern International, Basic Aircraft Performance An_ly$i_ (Program)
Connors and Meyers (NACA Report of Supersonic How Charts)
Habrard, Alaln."The Variable Cycle Engine-A Solution To the
Economical and Environmental Challenge of the FutureSupersonic Transport."
"International Gas Turbine Engines."Aviation Week and SpaceTechnology, March 18, 1991: 136-138.
"U.S. Gas Turbine Engines." Aviation Week and Space Technology,March 18, 1991: 133-135.
"Multinational Gas Turbine Engines."Aviation Week and SpaceTechnology, March 18, 1991: 139.
Cengel, Yunus, and Michael Boles., Thermodynamics. An EntzineCrinl
Aooroach. New York: McGraw- Hill, 1989.
Bahr, Donald W. "Supersonic/Hypersonic Propulsion Systems Exhaust
Emission Characteristics and Abatement Technology."
Nicolal, Leland M., Fundamentals of Aircraft Desien. San Jose:Mets, Inc., 1984
CASA, Gifts. (Program) University of Arizona, 1979
Currey, Norman S., Landintz Gear Desitm Ha_adbook. Lockheed-GeorgiaCompany, Marietta, Georgia, 1982.
21
Q
5.
6.
1
,
9,
10.
11.
12.

Appendix A (Aerodynamics)
Figures
22

A
I
ole=
m,¢
70000
60000
50000
40000
30000
20000
10000/
00
Figur_
Cruise
r-----1/2
Climb
I I I ! !
5000
Nautical Miles
1- Tesseract's Mission Profile
23

47.75' 43.3'
INITIAL PLAN-FORMAIR = 1.56
FINAL PLANFORMAR = 1.90
Fi_aure 2: Win_a Planforr_
24
f
_ i_-- _.... \
inaeOef_dent ot erailm9 edge1_aoe
Supersonic delta wing•
2.O
1.6
1.2
O.8
O.4
00 0.! 0.2 0.3 0.4 O.S 0.8 0.7 _8 _9 1.0
_nf
Variation of X with tan s/tan _..
Fiaure 3: Lambda Function (Brown. McCormick2).
2S

CL_
C La 2-0
1.2
30
2.0
1.0
//
/
0
c_.. _ /
/
//
/
/
//
/
1
/
/
/
C_C_j ,u
4
0.2 G4 0.6 0.8 _,0
mjl
Fiaure 4: Lift Curve SIooe and Induce f nt
DQIta Wings (Brown, M_Cormick2).
26

80
60
40-
20-
0
-20
\
\\
20 40 60 80
Fuselage Station (ft)
Figure 5: Area Distribution
Tol;;al Area
• Sears - Haack
100
27

O
V
ID
I.
C_
lu
In
C.14--O
r-
|m
uoM
I,I--I,I--
O
0.025
0.020
0.015]
0.010 1
0.005 i ' i !0.0 o.s 1.0 ,.s 2'.0 2'.s 3.0
Mach Number
Figure 6: Drag Estimation for Veriou$ Flight Reuimes
28

4!.75
43
29

s) 3,-0
ZIa.
Cf
,.o+ I I il I i I I '++i _
i ! i I I I t t,-4_c/ I !
I A T_ ^L_
J
--__..., , , I _' ._'_ _ ,, LI i
_ r
+ I I I I I i_'', + I i . ; '+ i 'i ] sul+,,_,¢-----.suPt_tso%,c
0 + "
0 "I'A.'_,%.i I il 41 I | TA'_I '_.i 0
II TAN '_.l TAJ+ 'x+.l il
• "I 1..
I.,I
,,_._:s i L I I I i I + ! i Is.: fll '+1 1 -LIt/ I [ ,IT._.+X,
I I I ' I V I C"I-T', +_
,.o._-i-i_ I.+I_ _ ' _ I ,
+''" "_._t_ " L ......', ."_,,+ I !l, __.,/p_,,I _ ,__ _+'
--o-- ,
" ill + + i + i I I ' ----,+-
"_ I ", _ i i ,I I I I , ' I i, ,, =,
O l
b) 3_- 0._0 TA+'I _.i I _ 0 III I T_ '_.i O
t,% .'+._.=-'--_ TA.'¢ .,_'--"_ II
I. 6 ,
Ill i .0.|
1.4 | I
1411 ' iIJ'
i+ II_
13_ | }
t ! ! I
t , ly;-T_
f!+:+Ti ' ' _ _
'-_,_/+ ! ', i_,l
, i i+ ,"qT+/! I ' , _"I 1_.-,;.-,,."_,t r
c) ;_- 0.5
" ,:', + ' , I I .+/_ t !.. I I !
"_ I ! 0 I i I I I I t , t i I I !I l ! I SUISO_IC ,,,--- _Sb'PEIISOm_¢ _ I I I
0 + '-
o TAN _.. I o t T_,._ ,_._ 0I I
FicJure 8: Aerodynamic Center (Ravmerl_
3O

Appendix B (Aerodynamics)Drag Analysis
31

Drag Calculations
Parasite Drag
Component Buildup Method (Raymerl)
Aerodynamic Data
Wing Reference Area 1200 ft 2
Standard Density (55000 ft) 2.9 e-4 slug / ft3389.9 * RStandard Temperature {55000 ft)
Speed of Sound (55000 ft)
Velocity (Mach 2.2)
Dynamic Viscosity
967.9 ft/s
2129.5 ft/s
3.0 e-7 slug/ft/s
Skin Friction
Component Char.
Length
(ft)33.6
ReynoldsNumber
Coefficientof Friction
Wetted Area
(sq. ft)
# of
Compo-nents
Coefficient
of Drag
Wing 6.9e+7 0.00159 1748.9 1 0.0023
FuselaBe 107.0 2.2e+8 0.00135 1570.0 1 0.0018Nacelle 24.0 4.9e+7 0.00167 240.0 2 0.0007
Vert. Tail 10.0 2.1e+7 0.00190 100.0 1 0.0002
Horz. Tail 10.0 2.1e+7 0.00190 100.0 1TOTALS
0.00020.0051
Wave Drag
Maximum Cross Sectional Area 59.3 ft 2
89.0 ftCharacteristic LengthSEARS-HAACK WAVE DRAG
Correction Factor lEwd)
Leading Edge SweepCORRECTED WAVE DRAG
0.0052
0.0068
Induced Drag(See Figures 4 & 5, Appendix A)
I Induced Drag
[ Coefficient of
Totals Drag for
Drag {Cruise)
Cruise
I
0.0058
0.0182
32

Subsonic & Transonic Drag Data(from Kern 4)
Mach
0.1
0.2
0.3
Altitude (ft)00
0
0.4 00.5 0
00.60.7
CdlO0.0074
0.0070
0.0068
0.0067
0.0067
0.0067
35000 0.00810.8 35000 0.0082
0.85 35000 0.0082
0.9 35000 0.0083
0.95 35000 0.00840.95 55OOO
1.0 55O0O1.1 55000
1.2 55000
55OOO1.3
0.0096
0.0097
0.0102
0.0109
0.0117
33

Appendix C (Aerodynamics)Stability Analysis
34

Nomenclature
CM,CG :
CLW :hRhACR :
CM,ACWB:CMwt_f :OfT
ZrqSW :CR :C
nH :VH :CI_,H :SH :LrITiw :
iH :c3e/Oa :
aOLH "
moment coefficient about center of gravitylift coefficient of winglocation of center of gravity as a fraction of the root chordlocation of aerodynamic center as a fraction of the root chord
moment coefficient about aerodynamic centermoment coefficient per radian of flap deflectionflap deflection in radiansthrust
horizontal distance from engines to the center of gravitydynamic pressurewing reference arearoot chord lengthmean aerodynamic chord
ratio of dynamic pressure at tail to that at wingtail volume coefficientlift cceffieient of tailtail arealift of tail
length of tailwing incidence angletail incidence angle
rate of change of downwash angle with respect to angle ofattack
zero lift angle of attack
35

Tail Determination Required to Maintain Static Stability atCruise
Equation 1
CM,CG =
CM,CG =
CLW (hR - hACR) + CM,ACWB + CMWOf Of + T ZT / q SW CR
-nH VH CLH
CLw (hR - hACR) + CM,ACWB + CMwof Of + T ZT / q Sw CR
- IH SH CLH / SW CR
0 = CLW (.70 - .77) + 0 + 0 + 0.001 - 0.54 SH / SW CLH
Equation 2
CLw + SH / Sw CI_ja = 0.128
Iteration of Equations 1 & 2
Sw
12001200
SH CLW CLH CLTOTAL
100 0.1276 0.004 0.12850 0.1276 0.009 0.128
Thus a tall Is not essentially needed during cruise!
36

Neutral Point Anglysls i_ Cruise
CM,CG = CLW (hR - hACR) + CM,ACWB +CMw0f Of + T ZT / q Sw CR - VH CLH
CLH = CI__ [(a + iw)( 1 - 0e / 0a) +iH - iw - aOHL] VH
Rewritten in terms of angle of attack (a):
CM_G = CLWa (a + iw) (hR - hACP.) + CM.ACWB +CMwof Of + T ZT / q Sw CR - VH CLH
Differentiate with respect to angle of attack
ÜCM,co / aa = CLW a (hR - hACP.) - CLHa (1 - 0e / 0a) VH
Find Neutral Point
0 = hR - hACR - CLHa / CLWa ( 1 - 0e / 0a) V H
hR = hACR + CLHa / CLWa (1 - Oe / 0a) VH
hR=0.77 + (=1) (.037) (1 - .478)
Tall Volume Coefficient
VH = IT SH / C Sw = .037
D0wnwa_h at Supersonic Soeeds(Raymer page 420)
Oe 10a = 0.478
37

Static Stability Analysis at Cruise
CM,CG = CLWa (a + iw) (hR - hACR) + CM,ACWB +CMwaf Of + T ZT / q Sw CR - VH CLH
at zero lift
CM,CG = T ZT / q Sw CR - VH CLm [ill - iw - aOHL]
The tail incidence must be designed so that the above bracketed term is positive.
OCM,co / 0a = CLwa (hR - hACR) - CLHa / CLWa (1 - de / 0a) VH
dCM,co / Oa = 1.76 ( .70 - .77) - (=1) (1 - .478) (.037)
aCM,cG / 0a = -0.104
38

Appendix D (Propulsion)Figures
39

SNECMA MCV 99VARIABLE-CYCLE ENGINE
r
S_411L_IOIm_ _lmQ
Figure 1: MCV 99 Operating Mode
Reference: Habard 6
40

RETRACTING RAMP / _THRrlAr
B[_EED EXIT
SLOTS
BYPASS
Figure 2: Flow Control Devices
41

6.27'
F 11 2 S.S ,_ _
NN
_N N
Boundary Layer Diverter Thickness _ 3" x_(1-3% of the wing length in front of the inlet)
Figure 3: Inlet Geometry
42

D___
.3 (ROUGH APPROXIMATION)
2-D INLET35,0Q0 ft
.2
.1
//
//
//
/
t
0 .5 1.0
2-D INLETlO,O00 ft
INLET, 35,000 ft
AXISYMMETRIC INLETlO.O00 ft
! I I
1.5 2.0 2.$
MACH NUMBER
Figure 4: Inlet Drag Trends
Reference: Raymer 1
43

Inlet (Method; Internal Contraction)
First Oblique Shock
M1 -- 2.2 Delta 1 = 9.9 °M2 -- 1.8266Po2/Pol = 0.98216
Sigma = 35.685 °
Isentropic FlowM3i = 1.4379A/A*= 1.1366
Second Oblique Shock
M2 = 1.8266 Delta 2 = 11.0 °M3 = 1.4379Po3/Po2 = 0.98236
Sigma = 44.576 °
Normal ShockM3 = 1.4379M4 = 0.72428Po4/Po3 -- 0.94823
Isentropic FlowM4i = 0.72428A/A*= 1.0778
P/Po = 0.70526
Internal Contraction
IC = 1.1366/1.0778-- 1.0546M = 1.2711
My = 0.8105
Poy/Pox = 0.9845
Overall
Po4/Pol = 0.9499
Overall With LossesPo4/Pol = 0.9119
Angles Suggested by
Connors and Meyers 5
Inlet (Method: External)
First Oblique Shock
M1 -- 2.2 Delta 1 = 11.8 °M2 = 1.7532Po2/Pol = 0.971
Sigma = 37.655 °
Second Oblique Shock
M2 = 1.7532 Delta 2 = 132 °M3 = 1274Po2/Pol = 0.97092
Sigma = 50.067 °
Normal ShockM3 = 1.274M4 = 0.7995Po4/Po3 = 0.98361
First Oblique ShockM1 = 22 Delta I = 10.0 °M2 = 1.8228Po2/Pol = 0.98165
Sigma = 35.786 °
Second Oblique Shock
M2-- 1.8228 Delta 2 -- 10.0 °M3 = 1,4719Po2/Pol = 0.98663
Sigma = 43.431 °
Normal ShockM3 = 1A719M4 -- 0.71128Po4/Po3 = 0.93845
Po4/Pol = 0.927 Po4/Pol = 0.9089
44

Inlet
Compressor Area -- 9.18 ft 2
M -- 0..5 A/A* = 1.3398P/Po = 0.84302e/eo = 0.88517T/To ---0.95238
Area
Compressor AreaThroat Area
Throat Area
Area of TipArea of Throat
Area of Tip
= 1.3398 =1.0778
= 7.385 ft 2
= 1.0546
ffi 7.788 ft 2
1.24309
45

_0N
A
U_
i
N
X Y
_tm
r
U_
Figure 5; Nozzle Geometry_
Nozzle Geometry
At Turbin_Mt = 03At/A* = 13398
A_Me=Ae/A*=
Exa_2.89534.208
A(turbine exit) = At= 9.18 ft 2
D(turbine exit) = Dt = 3.419 ft
A* = A(throat) = At13398
= 6.85 ft 2 (D*= 2.953 fi)
Ae= 4.208 (A*) = 28.82 _2
Theta = Primary Half Angle
Tan (Theta) = 0.233
X
See Figures 6, 7 & 8
Theta = 5 ° X = 2.66 ft
Theta = 10 ° X = 1.32 ft
Discharge Coefficient (Cd = A8e/A8) = 0.98(A8 = A(throat)) New A(throat) = 6.99 ft 2
A(exit)/A(throat) ,= 4.12 a= 15° Cv-0.998 Y = 5.35 ft
46

I +A_ L, _- •
....s_ro_ .... _......... 8......................... 0-............A 8 Primary nozzle throat areaA 9 Secondary nozzle exit areaa Secondary nozzle half angle0 Primary nozzle half angle
I., Secondary nozzle length
Figure 6: ,Nozzle Geometric
Reference: Mattingly
Parameters
l=
0.9
0.9
CD
0.94
0 10 20 30 40
Primary Nozzle Half Angle, 0
CD,,to= versus 0
Figure 7: Nozzle Discharge
Reference: Mattingly
47
Coefficient

0,988 -
0 20 A 309/A8
Fieure 8: Convereent- Divereent- Nozzle Velocit-_v Coefficient-
Reference: Mattingly
48

i 4.13 ft =I = 12.0 _ •I_ 3.41 _ t
t
1L Fan Bow In Door
Compressor
r_Fin_ Quench/Lean Combustor
Figure 9: Powerplant Configuration
49

Appendix E (Structure)Initial Sizing
50

Table 1:
Design Criteria
Crew Members-,
Payload
Range
Speed of Sound
Cruise Velocity
Specific Fuel Consumption
Endurance
Lift/Drag
Conceptual Sizing for SST (Standard
i
Wc= 1800 Ibs.
Wp= 700 Ibs.R= 5000 nm
R- 30380000 ft
a= 994.8
M= 2.2 M
V= 2188.56 ft/s
C= 1.3 1/hrC= 0.00036111 1/s
E= 0.3333 hr
E= 1199.88 s
L/D= 8
AIt 30000 ft
Turbojet
Conditions)
Mission Segment Weight F.ractions
Total Weight WO= 103548 Ibs.
1) Warmup and Takeoff Wl/WO= 0.97
2) Climb W2/Wl = 0.985
3) Cruise • W3/W2= 0.48503241
4) Loiter W4/W3= 0.94727935
5) Land W5/W4= 0.995
Table 3.2
Table 3.20.866 L/D
L/D Max.
Table 3.2
WS/WO= 0.43679723
Wf/WO-- 0.59699494 6% Fuel allowance
We/WO= 0.37886176 Table 3.1 (Jet Fighter/Trainer)
Verification of Total Weight
Fuel Weight
Empty Weight
WO= 103548
Wf= 61 818
We= 39231
Ibs.
Ibs.
Ibs.
51

Table 2: Conceotual Sizing for SST (Range = 4.500 nm)
Design Criteria
Crew Members= 9 Wc= 1800 Ibs.
Payload Wp= 700 Ibs.
Range R= 4500 nmR= 27342000 ft
Speed of Sound a= 994.8
Cruise Velocity M= 2.2 MV= 2188.56 ft/s
Specific Fuel Consumption C= 1.3 1/hrC= 0.00036111 1/s
Endurance E= 0.3333 hrE= 1199.88 s
Lift/Drag L/D= 8
AIt 30000 ft
Turbojet
Mission Segment Weight Fractions
Total Weight WO= 67367 Ibs.
1) Warmup and Takeoff Wl/WO= 0.97
2) Climb W2/Wl = 0.985
3) Cruise W3/W2= 0.5214272
4) Loiter W4/W3= 0.94727935
5) Land W5/W4= 0.995
Table 3.2
Table 3.2
0.866 L/D
I_/D Max.
Table 3.2
WS/WO= 0.46957265
Wf/WO= 0.56225299 6% Fuel allowance
Verification of Total WeightFuel Weight
Empty Weight
We/WO= 0.40063675
WO= 673671bs.
Wf= 37877 Ibs.
We= 269901bs.
Table 3.1 (Jet Fighter/Trainer)A=1.7 C=-O.13
52

Table 3: Conceotual Sizing for $ST (Range = 4,000 nm)
Design Criteria
Crew Members=
Payload
Range
Speed of Sound
Cruise Velocity
Specific Fuel Consumption
Endurance
Lift/Drag
9 Wc= 1800 Ibs.
Wp= 700 Ibs.R= 400011111
R-- 24304000 ft
a= 994.8
M= 2.2 M
V= 2188.56 ft/s
C= 1.3 1/hr
C= 0.00036111 1/s
E= 0.3333 hr
E= 1199.88 s
L/D= 8
AIt 30000 ft
Turbojet
Mission Segment Weight Fractions
Total Weight WO= 46110 Ibs.
1) Warmup and Takeoff W1/W0= 0.97
2) Climb W2/Wl= 0.985
3) Cruise W3/W2= 0.5605529
4) Loiter W4/W3= 0.947279355) Land W5/W4= 0.995
Table 3.2
Table 3.2
0.866 L/D
L/D Max.Table 3.2
W5/WO= 0.50480741
Wf/WO= 0.52490415 6% Fuel allowance
Verification of Total Weight
Fuel Weight
Empty Weight
We/WO= 0.42087735
WO= 46110Wf= 24203
We= 19407
Ibs.
Ibs.
Ibs.
Table 3.1 (Jet Fighter/Trainer)A=1.7 C=-0.13
53
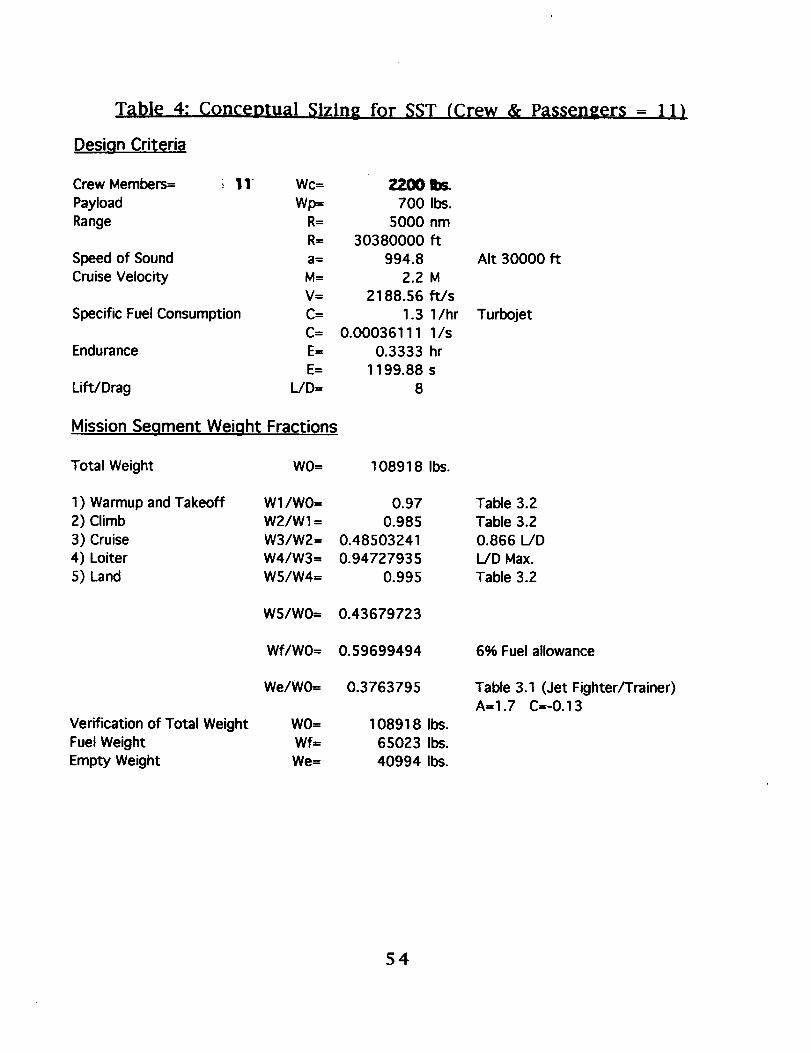
Table 4:
Design Criteria
Conceptual Sizing for $ST (Crew & Passengers = 1 1)
Crew Members= ; I1 Wc= 7.._00 I:_
Payload Wp= 700 Ibs.
Range R= 5000 nmR= 30380000 ft
Speed of Sound a= 994.8
Cruise Velocity M= 2.2 MV= 2188.56 ft/s
Specific Fuel Consumption C= 1.3 1/hrC= 0.00036111 1/s
Endurance E= 0.3333 hr
E= 1199.88 s
Lift/Drag L/D= 8
AIt 30000 ft
Turbojet
Mission Segment Weight Fractions
Total Weight W0= 108918 Ibs.
1) Warmup and Takeoff Wl/WO= 0.97
2) Climb W2/Wl = 0.9853) Cruise W3/W2= 0.48503241
4) Loiter W4/W3= 0.94727935
5) Land WS/W4= 0.995
Table 3.2
Table 3.2
0.866 L/D
I_/D Max.
Table 3.2
WS/WO= 0.43679723
Wf/W0= 0.59699494 6% Fuel allowance
Verification of Total WeightFuel Weight
Empty Weight
We/WO= 0.3763795
W0= 108918
Wf= 65023
We= 40994
Ibs.
Ibs.
Ibs.
Table 3.1 (Jet Fighter/Trainer)A=1.7 C=-0.13
54

Table 5: Conceptual Sizing for SST
(Cruise Altitude = 60.000 fl;)
Design Criteria
Crew Members= 9 Wc= 1800 Ibs.
Payload Wp= 700 Ibs.
Range R= 5000 nmR= 30380000 ft
Speed of Sound a= 968.1 ft/$
Cruise Velocity M= 2.2 MV= 2129.82 ft/s
Specific Fuel Consumption C= 1.3 1/hrC= 0.00036111 1/s
Endurance E= 0.3333 hr
E= 1199.88 s
Lift/Drag L/D= 8
Mission Segment Weight Fractions
Total Weight WO= 117679 Ibs.
1 ) Warmup and Takeoff Wl/WO= 0.97
2) Climb W2/Wl = 0.9853) Cruise W3/W2= 0.47544948
4) Loiter W4/W3= 0.94727935
5) Land W5/W4= 0.995
W5/WO-- 0.4281673
Wf/W0= 0.60614266
We/W0= 0.37261305
Verification of Total Weight
Fuel Weight
Empty Weight
W0= 117679
Wf= 71330
We= 43849
Ait 36000 to 80000 ft
Turbojet
Table 3.2
Table 3.2
0.866 L/DL/D Max.
Table 3.2
Ibs.
Ibs.
Ibs.
6% Fuel allowance
Table 3.1 (Jet Fighter/Trainer)A=1.7 C=-0.13
$5

Table 6:
(Soeciftc
Conceotual Sizing
Fuel ConsumDtlOla
for SST
= 1,2 / hr)
Design Criteria
Crew Members= 9 Wc=
Payload Wp=
Range R=R=
Speed of Sound a=
Cruise Velocity M=V=
Specific Fuel Consumption C=C=
Endurance E=E=
Lift/Drag L/D=
1800 Ibs.
700 Ibs.
5000 nm
30380000 ft
994.8• 2.2 M
2188.56 ft/s
1.2 1/hr
0.00033333 1/s
0.3333 hr
1199.88 s
8
Alt 30000 ft
Turbojet
Mission Segment Weight Fractions
Total Weight WO= 72302 Ibs.
1) Warmup and Takeoff Wl/WO= 0.97
2) Climb W2/Wl = 0.985
3) Cruise W3/W2= 0.51279318
4) Loiter W4/W3= 0.95123418
5) Land W5/W4= 0.995
Table 3.2
Table 3.2
0.866 L/D
I_/D Max.
Table 3.2
W5/WO= 0.46372524
Wf/WO= 0.56845125 6% Fuel allowance
Verification of Total Weight
Fuel Weight
Empty Weight
We/WO= 0.39697155
WO= 72302
Wf= 41100
We= 28702
Ibs.
Ibs.Ibs.
Table 3.1 (Jet Fighter/Trainer)A--1.7 C=-0.13
56

Ti_ble 7: Concet)tual Sizing for SST (Lift/Drag = 9)
Design Criteria
Crew Members=
Payload
Range
Speed of Sound
Cruise Velocity
Specific Fuel Consumption
Endurance
Lift/Drag
Wc= 1800 Ibs.
Wp= 700 Ibs.R= 5000 nm
R= 30380000 ft
a= 994.8
M= 2.2 M
V= 2188.56 ft/s
C= 1.3 1/hrC= 0.00036111 1/s
E= 0.3333 hr
E= 1199.88 s
L/D= ; 9
AIt 30000 ft
Turbojet
Mission Segment Weight Fractions
Total Weight WO= 62344 Ibs.
1) Warmup and Takeoff Wl/WO= 0.972) Climb W2/Wl = 0.985
3) Cruise W3/W2= 0.52563602
4) Loiter W4/W3= 0.95299718
5) Land W5/W4= 0.995
Table 3.2
Table 3.20.866 I_/D
L/D Max.
Table 3.2
W5/WO= 0.47622016
Wf/WO= 0.55520663 6% Fuel allowance
Verification of Total Weight
Fuel Weight
Empty Weight
We/W0= 0.40469335
WO= 623441bs.
Wf= 34614 Ibs.
We- 25230 Ibs.
Table 3.1 (Jet Fighter/Trainer)A=1.7 C=-0.13
57

Table 8: Conceptual Sizing for SST (Eouatlon Constants)
Design Criteria
Crew Members= 9 Wc=
Payload Wp=
Range R=R=
Speed of Sound a=
Cruise Velocity M=V=
Specific Fuel Consumption C=C=
Endurance E=
E=
Lift/Drag L/D=
Mission Segment Weight Fractions
1800 Ibs.
700 Ibs.
5000 nm
30380000 ft
994.8
2.2 M
2188.56 ft/s
1.3 1/hr
0.00036111 1/s
0.3333 hr
1199.88 s
8
Total Weight WO= 76984 Ibs.
1) Warmup and Takeoff W1/WO= 0.97
2) Climb W2/Wl = 0.985
3) Cruise W3/W2= 0.485032414) Loiter W4/W3= 0.94727935
5) Land W5/W4= 0.995
WS/WO=
Wf/WO=
Verification of Total Weight
Fuel WeightEmpty Weight
We/WO=
WO=Wf=
We=
0.43679723
0.59699494
0.37053064
7698445959
28525
Ibs.Ibs.
Ibs.
AIt30000
Turbojet
Table 3.2
Table 3.2
0.866 L/D
L/D Max.Table 3.2
6% Fuel allowance
Table 3.1 (Jet Transport)A-1.02 C,--0.09
58

Calculation of Fuselage Length and Diameter
Length ---A Wo c Wo = Takeoff Gross Weight = 107,000 lbs.A = 0.83 (Raymerl)C = 0.43
Length - 107.0 ft
Fineness Ratio = Fuselage Length = 14Diameter
[Fineness Ratio for Supersonic Aircraft = 14 (Raymerl)]
Diameter = 7.6 ft
59

Appendix F (Structure)Final Sizing
60

Table 1: Concorde Weight
Weight Equations Terminoloqy:
A_
Ah=
Av= IBh=
Bw=
Fw :lHt/Hv=
do':r:lKdw=
Kdwf=
•KIg=
Kmp= I
Kng=
Knp= IKr=
Ktp=
Kuht=
Kws=
Ky=KZ=
LID =
L=
,am0'd::lLambda= I
Lambda ht=
Lambda vt=
Lec=
Lm=
Ln=
Lt=
M=
Nc=
Nen=
Nf=
Ngen=
1.70
0.00
o.8910.00 f t
83.83 ft
0.331ft7.701ft0.00
41620083.4 Ib1.20
0.768
0.774
1.00
1.0011.00
1.0011.00
1.00
1.00
0.45
21.66
72.20 ft
7.00
203.75 ft
190.O01ft
o.15 I1.2810.00
0.79
98.00 ft
123.60 in
154.80 in
72.20 ft
2.20
6.00
4.00
5.00
4.00
1.00 I
41.301ft
ADoroximation
ft^2
Aspect Ratio
Horizontal Tail Aspect Ratio
Vertical Tail Aspect Ratio
Horizontal Tail Span
Wing Span
Fuselage Structural Depth
Fuselage Width at Horizontal Tail IntersectionNot a "T" Tail
Yawing Moment of Inertia (Eq. 16.51)Three Side Doors
Delta Wing
Delta Wing
Location of Landing Gear
Pithching Radius of Gyration
Yawing Radius of Gyration
Fuselage Structural Length
Electronic Routing Distance
Wing Taper Ratio (Tip Chord/Centerline root Chord)
Wing Sweep at 25% MAC
Horizontal Tail Wing Sweep at 25% MAC
Vertical Tail Wing Sweep at 25% MAC
Total Length from engine front to Cockpit
Length of Main landing Gear
Nose Gear Length
Tail LengthMach Number
Number of Crew
Number of Engines
Number of Functions Performed by Controls (4-7)
Number of Generators (=Nen)
Ultimate Landing Load Factor
Nacelle Length
6]

Nm", :lNmw=
Nnw=
Np=Nt=
Nw=
Nz= I
Q=
Rkva= IScs=
Scsw=
Se=-
Sfwet= ISht=
Sn= ISr--
Svt=
Sw=
t/c= IVi=
Vpr= IVstall=
Vt=
W=
Wapu (uninstalled)= IWc=
Wdg=Wec=
Wen=
Wfw=
WI=
Wuav=I
1.00 I2.00 I8.00
2.00
147.00
17.00
3.901ft
3.24 I511.68 Ib/ft^2
160.001kV A821.44 ft^2
344.44 ft^2
0.00 ft
5601.231ft^20.00 ft^2
426.001ft^2112.00 ft^2
365.00 ft^2
3856.00 ft^2
o.o9I31647.50 gal
12025.731ft^3150.00 ft/s
31647.40 gal10.30 ft
lOOO.OOI28000.00 Ibs
408000,00 Ibs
12042.57 Ibs
11000.OOllbs51427.0311bs
245000.00 Ibs
12oo.oollbs
Number
Number
Number
Number
Number
of Mechanical Functions (0-2)of Main Gear Shock Struts
of Main Wheels
of Nose Wheels
of Crew and PassengersNumber of Fuel Tanks
Nacelle Width
Ultimate Load Factor (Table 12.1 Megson)
Dynamic Pressure
System Electrical RatingTotal Area of Control Surfaces
Control Surface Area (Wing Mounted)Elevator Area
Fuselage Wetted AreaHorizontal Tail Area
Nacelle Wetted Area
Rudder Area
Vertical Tail Area
Wing Area
Wing Thickness
Integral Tanks VolumeVolume of Pressurized Section
Total Fuel Volume (6.5 Ibs/gal)
Fuselage Structural Width
Auxiliary Power Unit
Maximum Cargo Weight
Design Gross Weight
Weight of Engine and Contents (per nacelle)Engine Weight (Each)
Weight of Fuel in Wings
Landing Design Gross Weight
Uninstalled Avionics Weight (800-1400)
62

Combined Weight Method:
W wing= 24850 Ibs. 1W horizontal tail= 0 Ibs.
W vertical tail= 2761 Ibs. 1
W fuselage= 43548 Ibs. 1
W main Landing gear= 10108 Ibs. 1
W nose landing gear= 1648 Ibs. 1
W installed engine= 54828 Ibs. 2
W fuel system= 3360 Ibs. 3
W surface control & hyd= 5032 Ibs. 3
W apu installed= 2200 Ibs. 1W instruments= 806 Ibs. 1
W electrical= 2721 Ibs. 3
W avionics= 1840 Ibs. 1
W furnishings= 8071 Ibs. 3W air con & anti-ice= 4103 Ibs. 1
W handling gear= 1224 Ibs. 1
6.44 Ibs/ftA2
7.56 Ibs/ft^2
13.4 Engine % of TDGW
(1.1 Correction for Variable Nose)
Total Weight: 167101 Ibs.
Actual Operational Weiaht Empty: 173500 Ibs
Percent Difference: -3.69%
63

T_,ble 2: T¢sseract Weight Estimation
Weiqhl; Eauations Terminoloqv:
A= 1.90
Ah= 0.00
Av= 0.89Bh= 0.O0 ft
Bw= 47.75 ft
D= 0.33 ft
Fw= 3.83 ft
Ht/Hv= O.00
ly= 3160541.2Kdoor= 1.00
Kdw= 0.768
Kdwf= 0.774
KIg= 1.00
Kmp= 1.00
Kng= 1 .O0
Knp= 1.00Kr= 1.00
Ktp= 1.00Kuht= 1.O0
Kws= 0.37
Ky= I2.00
Kz= 40.00 ft
L/D= 7.00
L= 107.00 ft
La= 85.00 ft
lambda= 0.O0Lambda= 1.12
Lambda ht= 0.OO
Lambda vt= 0.79
Lec= 60.00 ftLm= 123.60 in
Ln= 154.80 in
Lt= 40.00 ft
M= 2.20
Nc= 3.O0
Nen= 2.00
Nf= 5.00
Ngen= 2.00NI= 1 .OO
Nit= 24.00 ft
Nm= 1.00
Ib ft^Z
Aspect Ratio
Horizontal Tail Aspect Ratio
Vertical Tail Aspect RatioHorizontal Tail Span
Wing Span
Fuselage Structural DepthFuselage Width at Horizontal Tail IntersectionNot a _T_ Tail
Yawing Moment of Inertia (Eq. 16.51 )One Side Door
Delta Wing
Delta WingLocation of Landing Gear
Pithching Radius of Gyration
Yawing Radius of Gyration
Fuselage Structural Length
Electronic Routing Distance
Wing Taper Ratio (Tip Chord/Centerline root Chord)
Wing Sweep at 25% MACHorizontal Tail Wing Sweep at 25% MAC
Vertical Tail Wing Sweep at 25% MAC
Total Length from engine front to Cockpit
Length of Main landing Gear
Nose Gear Length
Tail LengthMach Number
Number of Crew
Number of EnginesNumber of Functions Performed by Controls (4-7)
Number of Generators (=Nen)
Ultimate Landing Load Factor
Nacelle LengthNumber of Mechanical Functions (0-2)
64

Nmss= 2.00
Nmw= 4.00
Nnw= 2.00
Np= 9.00Nt= 8.00
Nw= 4.00 ft
Nz= 3.46
(L)=- 649.60 Ib/ft^2Rkva= 160.00 kV A
Scs= 400.00 ft^2
SCSW= 170.00 ft^2
Se= 0.00 ft
Sfwet= 1570.23 ftA2
Sht= 0.00 ft^2Sn= 240.00 ft^2
Sr= 35.00 ft^2
Svt= 100.00 ft^2
Sw= 1200.00 ft^2
t/c= 0.08
Vi= 9230.00 gal
Vpr= 1151.51 ft^3Vstall= 237.18 ft/s
Vt= 9230.00 galW= 7.66 ft
Wapu (uninstalled)= 1000.O0Wc= 500.00 Ibs
Wdg= 107000.00 IbsWec= 5918.29 Ibs
Wen= 5000.O0 Ibs
Wfw= 14998.75 Ibs
Wi= SO000.O0 Ibs
Wuav= 1000.00 Ibs
Number of Main Gear Shock Struts
Number of Main Wheels
Number of Nose Wheels
Number of Crew and PassengersNumber of Fuel Tanks
Nacelle Width
Ultimate Load Factor (Table 12.1 Megson)Dynamic Pressure
System Electrical RatingTotal Area of Control Surfaces
Control Surface Area (Wing Mounted)Elevator Area
Fuselage Wetted AreaHorizontal Tail Area
Nacelle Wetted Area
Rudder Area
Vertical Tail Area
Wing Area
Wing Thickness
Integral Tanks Volume (6.5 Ibs/gal)Volume of Pressurized Section
Total Fuel Volume
Fuselage Structural WidthAuxiliary Power Unit
Maximum Cargo Weight
Design Gross WeightWeight of Engine and Contents (per nacelle)
Engine Weight (Each)
Weight of Fuel in Wings
Landing Design Gross Weight
Uninstalled Avionics Weight (800-1400)
65

Combined Weiaht Method:
W wing= 3488 Ibs.W horizontal tail= 0 Ibs.W vertical tail= 605 Ibs.
W fuselage= 10422 Ibs.
W main Landing gear= 2066 Ibs.
W nose landing gear= 590 Ibs.
W installed engine= 13251 Ibs.
W fuel system= 1359 Ibs.W surface control & hyd= 2428 Ibs.
W apu installed= 2200 Ibs.W instruments= 203 Ibs.
W electrical= 1923 Ibs.W avionics= 1538 Ibs.
W furnishings= 482 Ibs.W air con & anti-ice= 476 Ibs.
W handling gear= 321 Ibs.Total Weight 41352 Ibs.Correction Factor 1.037
2.91 Ibs/ft^2
6.05 ibs/ft^2
12.4 % of TDGW
Composite Corrections:0.75 2616 Ibs.
0.75 0 Ibs.
0.75 454 Ibs.
0.75 7816 Ibs.
0.88 1818 Ibs.
0.88 519 Ibs.
1.00 13251 Ibs.1.00 1359 Ibs.
0.60 1457 Ibs.
1.00 2200 Ibs.
1.00 203 Ibs.
1.00 1923 Ibs.
1.00 1538 Ibs.
1.00 482 Ibs.
1.00 476 Ibs.
1.00 321 Ibs.
364341.037
Corrected Total Weiaht:
42878 Lbs 37778 Lbs
Total Desian Gross Weiaht:
107000 Ibs
Percent of TDGW:
40.07%
107000 Ibs
35.31%
66

Table 3: Emoty Weight Center of Gravity
Component Weight (Ibs) Dis. From Nose (ft) Moment (ft/Ib)WingVertical Tail
rFuselage
Main Landing Gear
Nose Landing Gear
Installed EngineFuel System
Surface Control & Hyd.APU Installed
InstrumentsElectrical
Avionics
FurnishingsAir Con & Anti-Ice
Handling GearTotal:
2616
454
7816
1818
51913251
1359
1457
2200203
1923
1538
482
476
321
83.3100.0
49.6
87.5
10.0
88.5
80.0
90.0
90.0
17.0
45.0
50.0
34.5
72,0
60.0
218008.7
45400.0
387461.8
159075.0
5190.0
1172713.5108720.0
131130.0
198O00.03451.0
86535.0
76900.0
16629.0
34272.0
19260.036433 2662746.0
Empty Weiuht Center of Gravity:
Xcg= 73.1 ft
67

Appendix G (Structure)
Landing Gear
68

Landing Gear
Distance From Nose:Forward CG = 70 ft
Aft CG = 75 ftAC = 86 ftNose Gear = 30 ftMain Gear = 80 ft
F= 55 ft L= 46 ftM=5ft N= 5Oft
J=?Oft
F
N _1_ M
G J]Maximum Static Main Gear Load = W(F-M)/2F = 48,600 Ibs/Strut
Maximum Static Nose Gear Load = W(F-L)/F = 17,500 Ibs
(18% Maximum Main Load)
Minimum Static Nose Gear Load = W(F-N)/F = 9,700 Ibs(10% Maximum Main Load)
Braking Load Nose Gear = 10 J W/(32.2 F) = 12,000 Ibs
Main Gear:.Diameter = A WwB
Diameter = 36.5 in
Tire Sizin_
Ww = Weight on WheelA= 1.60B = 0.31
Ww - Main gear takes 90% of the total load. Therefore, each of the four tireswill carry 24,075 lbs.
Width = A WwB
Width = 11.5 in
Ww = Weight on WheelA = 0.10B = 0.47
NoseNose wheels are 60% of the main wheel tire size.Diameter = 21.9 inWidth = 6.9 in
69

Appendix H (Structure)Finite Element Analysis
70

MODELZ
_-----X
2.ee_E+SB ,lIFTS COMMAND
, MO_EL , , ,
UIEM DIRECTIONe -t88 8
UIEMINO DIST.1.BOSE+t6
PLOT LIHITS
.eOOE÷eeX 2.2eeE_et
.eBeE+eeY S.SSSE4et
.eeeE+OB
.O00E+O0
JOB: Mingi_lt3-MRV-92 2:30
Figure 1; Internal Wing Model
HODEL
2_x4.Se_Evi)8 j
Z
L
i
a
, , HO_)EL ....
UIEM DIRECTION71 B 7t
UIEMING DIST.5.OOBE+56
PLOT LINITS
.888E+88X 2.2BBE+81
y .eeeE+88S.S85E+01
Z .BBBE+_8.088E+88
JOB: Mingi_tt3-HHY-92 2:3t
Figure 2: Internal Wing Model (Soars & Ribs)
71

LORDING CASE
HODELZ
DEFLS.
q"--"---X _-'-X
2.80 E+80 EFLE TIONS 5.00 E÷00
Figure 3: Wing Deflection
LORDING CRSE t
MODEL DEFLS_Jx4.009E-00 , , ,DE tONS , , t .00_E+00
UIEW DIRECTION• -t00 t
UIEMINO DIST.t.000EvlG
PLOT LINITS
.000E+00X 2.200E÷0t
.BOOE÷00V 5.905Ev01
.O00Ev00Z .000E÷O0
JOB: Mingi_t53-HRV-92 t2:2t
Figure 4: Wing Warping
72
UIEM DIRECTION100 0 0
UIEMIHO DIST.t.000E÷t6
PLOT LIHITS
.000E÷00X 2.200E+0t
.000E÷00V 5.98SE+01
Z .000Z+00.000E+00
JOB: Nlngl_t13-NR¥-92 12:26