terrorism and tourism in the asia pacific region: is travel and
TRANSCRIPT


The U.S. Congress established the East-West Centerin 1960 to foster mutual understanding and coopera-tion among the governments and peoples of theAsia Pacific region including the United States.Funding for the Center comes from the U.S. govern-ment with additional support provided by privateagencies, individuals, corporations, and Asian andPacific governments.
East-West Center Working Papers are circulated forcomment and to inform interested colleagues aboutwork in progress at the Center.
For more information about the Center or to orderpublications, contact:
Publication Sales OfficeEast-West Center1601 East-West RoadHonolulu, Hawaii 96848-1601
Telephone: 808-944-7145Facsimile: 808-944-7376Email: [email protected]: www.EastWestCenter.org

E A S T - W E S T C E N T E R W O R K I N G P A P E R SE A S T - W E S T C E N T E R W O R K I N G P A P E R SE A S T - W E S T C E N T E R W O R K I N G P A P E R SE A S T - W E S T C E N T E R W O R K I N G P A P E R SE A S T - W E S T C E N T E R W O R K I N G P A P E R S
Economics Ser iesEconomics Ser iesEconomics Ser iesEconomics Ser iesEconomics Ser ies
No. 86, February 2006
Christopher Edmonds is a Fellow at the East-West Center,and Adjunct Graduate Faculty in the Department ofEconomics at the University of Hawaii at Manoa.
James Mak is a Professor and Chair in the Department ofEconomics at the University of Hawaii at Manoa.
East-West Center Working Papers: Economics Series is anunreviewed and unedited prepublication series reporting onresearch in progress. The views expressed are those of theauthor and not necessarily those of the Center. Please directorders and requests to the East-West Center's PublicationSales Office. The price for Working Papers is $3.00 each plusshipping and handling.
Terrorism and Tourism in the
Asia Pacific Region: Is Travel
and Tourism in a New World
After 9/11?
Christopher Edmonds and James Mak
Terrorism and Tourism in the Asia Pacific Region:
Is Travel and Tourism in a New World After 9/11?
Christopher Edmonds1 and James Mak2
1 Fellow, East-West Center, and Adjunct Graduate Faculty, Department of Economics, University of Hawaii at Manoa.
2 Professor and Chair, Department of Economics, University of Hawaii at Manoa

Terrorism and Tourism in the Asia Pacific Region: Is Travel and Tourism in a New
World After 9/11?
Abstract
The paper reviews trends in travel and tourism in selected Asia Pacific countries before and after the terrorist attacks of September 11, 2001 (9/11) to consider the question of whether or not the global tourism has fundamentally changed since 9/11. Tourism is an important economic sector in several Asia Pacific countries and is a “fragile” industry in that it is highly susceptible to external shocks such as wars, outbreaks of deadly contagious diseases, incidents of terrorism, and so on. The first part of the paper presents a stylized picture of industry response following terrorist incidents and other major negative shocks to tourism, and reviews international tourist arrivals at selected Asia Pacific destinations. A richer body of data available Japan and the U.S. allows examination of the extent of substitution between domestic and international travel, and the impact of changed travel behavior on tourist spending. The paper finds that there has been significant substitution of domestic travel for overseas travel by nationals of both countries after 9/11, and that this has had a dramatic impact on the Hawaii tourism market. The paper explores some of the reasons for the differences observed in post-9/11 travel recoveries across Asia Pacific countries.
Acknowledgments: This paper was presented at the 2005 APEC Economic Outlook Symposium: The Economic Effects of Terrorism and Counter-Terrorism (June 22-23, 2005) at the East-West Center in Honolulu, Hawaii in June 2005. The authors gratefully acknowledge APEC’s support for this research, and for the comments of participants of the Symposium and the Travel Research Group seminar at the University of Hawaii-Manoa. Lastly, we thank Jane Ho and Scott Nojiri for their research support.
I. Introduction
Tourism is an important economic sector in several Asia Pacific countries. It is also often described as a “fragile” industry in that it is highly susceptible to external shocks such as wars, outbreaks of deadly contagious diseases, incidents of terrorism, and so on. In this paper, we review trends in travel and tourism in selected Asia Pacific countries before and after the terrorist attacks of September 11, 2001 (9/11). The question that we wish to answer is whether or not the world has fundamentally changed for travel and tourism since 9/11.
While the focus of this paper is on the relationship between terrorism and tourism, we cannot entirely isolate the effects of terrorist activities from other major events that have occurred since 9/11. A number of these events have had significant negative impacts on travel and tourism in the Asia Pacific region during the past decade, among them, the Asian Financial Crisis (beginning in July, 1997), coalition invasion of Afghanistan (October, 2001), the Bali bombings (October, 2002), in the Spring of 2003 the “Perfect Storm” of the Severe Acute Respiratory Syndrome (SARS) outbreak and the war in Iraq, and most recently (December, 2004) the massive, destructive tsunami in the Indian Ocean. These various shocks exerted different impacts in the countries directly affected, in neighboring countries and regions, and in the global tourism market. For example, the SARS epidemic had a much more damaging impact on international tourist arrivals than 9/11 in a number of Southeast Asian countries, although 9/11 seems to have had a larger negative impact globally. Reviewing past trends suggests some countries appeared to recover more quickly than others from adverse shocks, and an examination of the reasons for this warrants researcher attention, especially if the answers provide useful policy prescriptions.
The paper is divided into three parts. Part I presents a stylized picture of industry response following terrorist incidents and other major negative shocks to tourism. We then review international tourist arrivals at selected Asia Pacific destinations to ascertain how each has been affected by and subsequently responded to these shocks. Part II focuses on Japan and the U.S. because we have data on outbound travel, tourist spending, and resident domestic travel for both countries as well as data on their international arrivals. The richer body of data allows us to examine the extent of substitution between domestic and international travel, and the impact of changed travel behavior on tourist spending. As we shall demonstrate, the substitution of domestic travel for overseas travel by Americans after 9/11 has had a dramatic impact on Hawaii, which has witnessed a sharp upturn in U.S. mainland-origin tourist arrivals in recent years. In Part III, we explore some of the reasons for the differences observed in travel industry responses in the various Asia Pacific countries, and we consider the effects of anti-terrorist and tourism promotion policies on tourism market recovery and growth.
II. International Tourism in Selected Asia Pacific Countries
The terrorist attacks on 9/11 reverberated around the world. Right after it, the World Tourism Organization (WTO) noted with a degree of satisfaction that the number
1

of international tourist arrivals fell by less than 1 percent from 696.7 million arrivals in 2000 to 692.7 million in 2001. This small annual decline, however, marked a sharp reversal of the growth trend in international arrivals registered in the decade preceding 9/11. During the preceding decade (1990 to 2000), international arrivals rose at an average rate of 4.5 percent per annum worldwide (WTO, 2003). The 2001 decline was only the second on record (the last one was recorded in 1982). Not all of the decline can be attributed to 9/11. Part of the decline in international tourist arrivals was a slow-down in global economic growth that coincided with the Asian Financial Crisis and widened with the large falls in equity markets worldwide in 2000. By 2002, international tourist arrivals around the world rebounded to 702.6 million, exceeding the 2000 peak (op. cit.). The WTO confidently predicted that the future growth of international tourism would not be significantly deterred by threat of terrorism. In a report published shortly after 9/11, the WTO boasted, “Liberty and the desire for travel will conquer the fear of terrorism.” (WTO, November 2001, p. 7 cited in Mak, 2005, p. 195) More than a year later, the WTO issued another opinion noting “The economic situation in the world is a more powerful threat to international arrivals than fear of terrorism.” (Mak, op. cit.).
Of course, individual countries can diverge sharply from global trends. As we shall see below, international travel to the U.S. has not recovered since 9/11, and the country’s declining share of international arrivals has been offset by increased domestic travel on the part of its residents. By comparison, Singapore seems to have not only fully recovered from the tourism downturn associated with 9/11, regional wars, SARS, and other international shocks since 2001, but is on the path to even faster rate of tourism growth than before 9/11.
Economic View of Recovery
When travel industry officials speak of recovery from 9/11, the conventional practice is to refer to the year 2000 as the point of reference, and to regard recovery as having been achieved when tourist arrivals (or spending) returns to pre-attack levels. Economists, however, tend to view “recovery” differently. For full recovery to have occurred, it is not enough to get back to where you began, it is necessary that you get to where you otherwise might have been had the terrorist incident not occurred. Hence, recovery is only attained when the level of economic activity (in this instance, tourism arrivals or expenditures) reaches the level, say, by extrapolating the pre-9/11 trend.1
By this definition of “recovery”, the effects of an external shock and subsequent recovery begin with the historical growth trend in tourist arrivals that is suddenly interrupted by an external shock (e.g., a major terrorist attack or natural disaster). The downturn and recovery process can be explained graphically as in Figure 1. The shock produces a sharp downward spike in tourist arrivals. Following the shock, recovery begins almost immediately. To achieve full recovery, tourist arrivals (or expenditures) must grow at a rate that is faster than the historical growth trend—the “catch-up” period. At some point, with the higher growth rate, tourist arrivals reach the level that would have been attained had the terrorist attack not occurred, and recovery is complete.
1 For example, see Engerman (1971) and Blunk et al. (2006).
2

Thereafter, growth is envisioned to proceed according to the historical trend. In this section, we employ this stylized framework to examine 9/11’s impacts and recovery in international tourist arrivals at selected Asia Pacific countries.
Aggregate International Tourist Arrivals to APEC Countries
Figure 2 displays the pre- and post- monthly international tourist arrivals in APEC countries (except Russia) between 1999 and 2002. The years covered are few due to data limitations encountered in some APEC members, so the effects of some of the major international events before 1999 (e.g. Asian Financial Crisis) and after 2002 (e.g., Iraq War and SARS epidemic) cannot be observed. In Figure 2, tourist arrivals are plotted against the number of monthly global terrorist incidents. The terrorist incidents were not necessarily directed at tourists or tourist establishments. Due to the difficulty (and controversy) in defining a “terrorist incident”, we employ two measures of terrorist incidents, one issued by the U.S. State Department (2005) and another from a variety of sources (Wikipedia, 2005). Of course, not every terrorist incident around the world can be expected to have a negative impact on international tourist arrivals in every APEC country. However, as a group, the APEC countries are large enough so that global international terrorism incidents outside the region might be expected to have an observable impact on their aggregate tourist arrivals. 2
As reported in Figure 2, the simple correlation between the number of monthly terrorist incidents and the number of tourist arrivals is negative for both measures of terrorist incidents but rather weak (r = -0.12 to -0.13). But the sharp downturns in tourist arrivals following the 9/11 attacks (2001) and the Afghan war (2002) are quite visible in the Figure. Clearly, by the end of October 2002, tourist arrivals had not yet recovered to the historical trend line. Moreover, the post-9/11 trend is flatter than the historical (pre-9/11), indicating that tourism recovery a year after 9/11 was not in sight. One also readily notes the seasonal fluctuation in arrivals coinciding with peak months of travel over the year, and that major incidents generally interrupt regular trends in the immediate aftermath of the incident, while shifting the month-to-month arrival levels downward. Next, we consider pre- and post-9/11 tourism trends in selected individual countries.
Arrival Trends and Terrible Global Events in Korea, Malaysia, and Singapore
We select these three countries for discussion because of their status as APEC members, and because we have a longer time series of monthly international tourist arrivals statistics for them than for APEC as a whole. They are of particular interest because they display contrasts in the magnitude of their downturns in visitor arrivals following major terrorist and other global events and in the manner of their recovery.
2 Because APEC covers such large share of the global economy, it is reasonable to expect that the number of terrorist events reported worldwide would influence tourism arrivals summed across APEC countries; however the connection between terrorist incidents worldwide and tourism arrivals in any single country should be weaker.
3
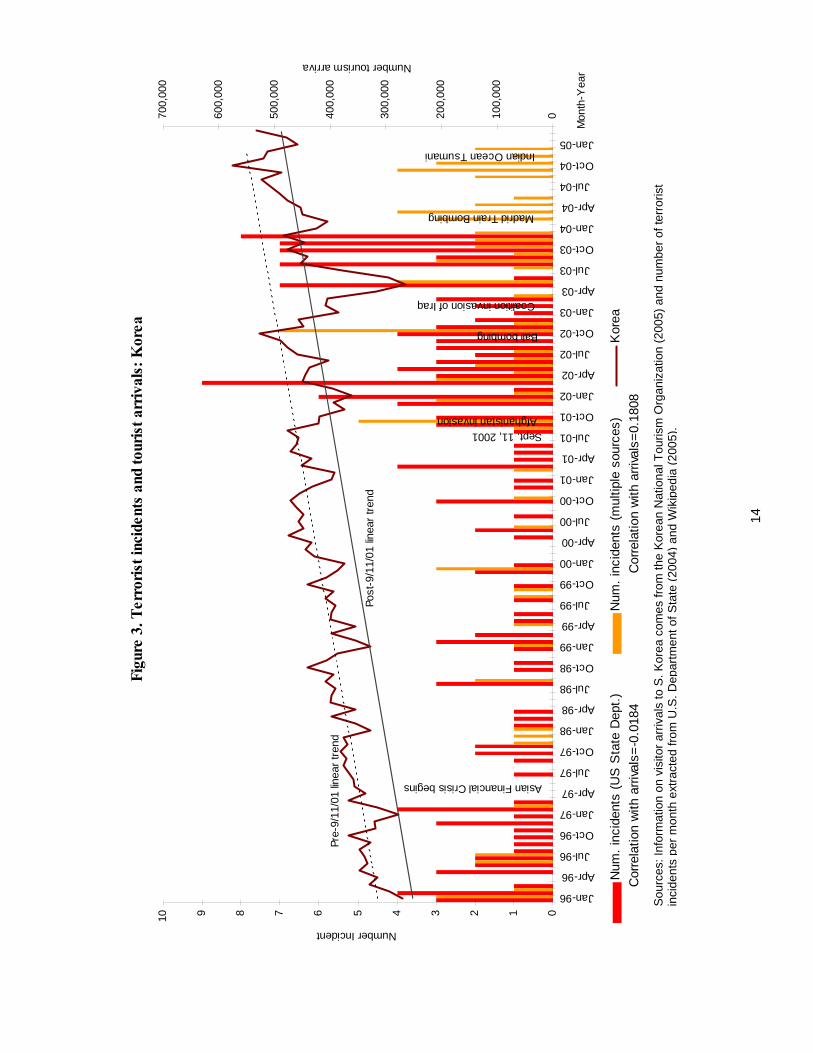
As shown in Figure 3, Korea experienced sharp declines in international tourist arrivals following 9/11, the Afghan war, and the ‘Perfect Storm’ (the Iraq War and SARS, which produced the largest negative impact on tourism inflows). The road to recovery in international visitor arrivals to Korea has been relatively quick after each shock only to be reversed by the arrival of the next major shock. The experience of Korea suggests that waves of external shocks may be more damaging to international travel than a single, catastrophic event. Such an effect would be consistent with recent research (Pizam and Fleischer, 2002) that shows the frequency of events has a greater negative effect on tourism demand than the magnitude of the event. Although the succession of adverse events since 9/11 caused a downward shift in the linear trend in international visitor arrival to the country, they do no appear to have altered the longer-term growth trend as the pre- and post-9/11 trends have nearly identical slopes.
Malaysia presents a more sobering picture of both the short-term and long-term impacts of major terrorist events on that country’s tourism sector. In Figure 4, 9/11 and the war in Afghanistan and the Perfect Storm produced more pronounced, sharper, downward spikes in visitor arrivals. Despite impressive rates of recovery right after these major events (although its rates of recovery following 9/11 and the Iraq War/SARS epidemic appear slower than in Korea), it is noteworthy that the post 9/11 trend in arrivals is much flatter than the pre-9/11 trend. This suggests full recovery of Malaysia’s tourism industry from these major shocks is still not in sight.
One hypothesis for why 9/11 and subsequent events have damaged Malaysia’s international visitor arrivals is that as a Muslim country, Malaysia may be viewed as a riskier destination among some tourists from the West. However, more detailed analysis is required to examine this hypothesis. Malaysia remains a popular destination among Muslim visitors from Arab countries who feel unwelcome in the West, but tourists from North America and Europe represent the largest share of international travels. Overall, the global war on terrorism has been particularly hard on Malaysia’s tourist industry. Reflecting the downturn in the country’s tourism sector and the desire of policymakers to see the sector return to the strong growth it displayed before 9/11, Malaysian tourism officials have been visiting Canada and the U.S. (June, 2005) in an effort to promote international arrivals from North America.
In contrast, Malaysia’s neighbor, Singapore, presents a radically different picture. The impact of the Asian Financial Crisis (1997) on international tourist arrivals in Singapore is clearly visible, as are the closely bunched twin events of 9/11 and the Afghan war (see Figure 5). The War in Iraq and SARS epidemic in Spring 2003 produced much deeper falls in international arrivals to Singapore than 9/11 itself, however, the country’s recovery after 2003 has been much stronger (on a much steeper path) compared to that of Malaysia. In fact, its post-9/11 trend is much steeper than its own pre- 9/11 trend, and by early 2004 visitor arrivals had already exceeded the volumes predicted by the historical trend. This trend may indicate that Singapore is viewed by international travelers as a safer and more appealing destination in the post-9/11 world, and suggests the country is poised to enjoy a faster rate of tourism growth in the future than before 9/11.
4

III. More Detailed Look at Japan and U.S. Trends
There is generally more interest in Japanese outbound international travel than inbound travel because the volume of inbound travel to Japan is much smaller than the volume of outbound travel. In 2004, Japan hosted about 5 million international visits compared to almost 17 million Japanese overseas visits. Moreover, international visitor arrivals in Japan are more apt to be business travelers whose trips are likely to be less discretionary. Given the relatively small size of the inbound international tourism market and the business objective of much of this travel, it is not surprising that international tourist arrivals to Japan recovered relatively quickly following 9/11 (Figure 6).
More noteworthy is the more economically important outbound international tourism from Japan. Figure 7 shows Japanese overseas and domestic travel since 1990. After 9/11, overseas travel by the Japanese fell and the share of outbound travel declined relative to domestic travel. These trends suggest that unrest overseas induced many Japanese to substitute domestic travel for overseas travel. Travel spending fell even more sharply than the number of trips, especially spending on overseas trips (Figure 8). This is likely due to the substitution of cheaper trips closer to home (e.g. Korea, Southeast Asia) for more expensive trips to distant places (e.g. U.S. and Europe).
As in other countries, Figure 9 shows that 9/11 and other major international shocks produced sharp declines in international tourist arrivals in the U.S. The Figure indicates that the U.S. travel and tourism industry is far from recovery as the volume of international visitors to the U.S. continues to languish far below pre-9/11 peak levels; moreover the post-9/11 trend remains flatter than the historical trend. The U.S. share of total international arrivals has fallen to a low 5.9 percent (down significantly from its recent peak level of 9.4 percent recorded in 1992) before showing a modest rise (0.1 percent) in 2004.
One compensation to tourism related businesses in the U.S. has been the uninterrupted rise in the number of domestic person trips since 9/11 (Table 1) compared to the discouraging decline in the number of foreign tourists. On the other hand, total travel spending (after accounting for inflation) fell even among U.S. domestic travelers, and in 2004 remained below the level of domestic travel spending pre- 9/11 (Table 2). The decline in travel spending has fallen particularly hard on tourism employment as direct employment in tourism fell by nearly 5 percent between 2000 and 2004 (Table 3), while total employment in the U.S. declined only marginally (0.23 percent) over the same period.
The decline in U.S. domestic travel spending, despite the rising number of domestic trips, is likely explained by the change in the mix of travelers. Both the terrorist attacks of 9/11 and subsequent events and the U.S. economic recession that began in March 2001, have led to reduced business travel budgets and sharply curtailed high spending business travel (especially travel to conventions and other meetings). In 2003, business travel accounted for 18 percent of total domestic person trips in the U.S., but 31 percent of total travel spending (Travel Industry Association of America, 2005).
5

Advances in telecommunication technology explain part of the decline in business travel; today businesses (40 percent of business air travelers in 2004) are relying more heavily on improved teleconferencing and the Internet as an alternative to personal travel (Ibid.).
In response to 9/11 and subsequent major shocks, U.S. residents have also curtailed their overseas travel, and the number of overseas trips from the U.S. declined continuously from 60.9 million trips in 2000 to 54.2 million trips in 2003. However, this declined in outbound international travel from the U.S. was less than the fall in international visitors to the U.S., which contributed to the country’s growing current account deficit with the rest of the world.
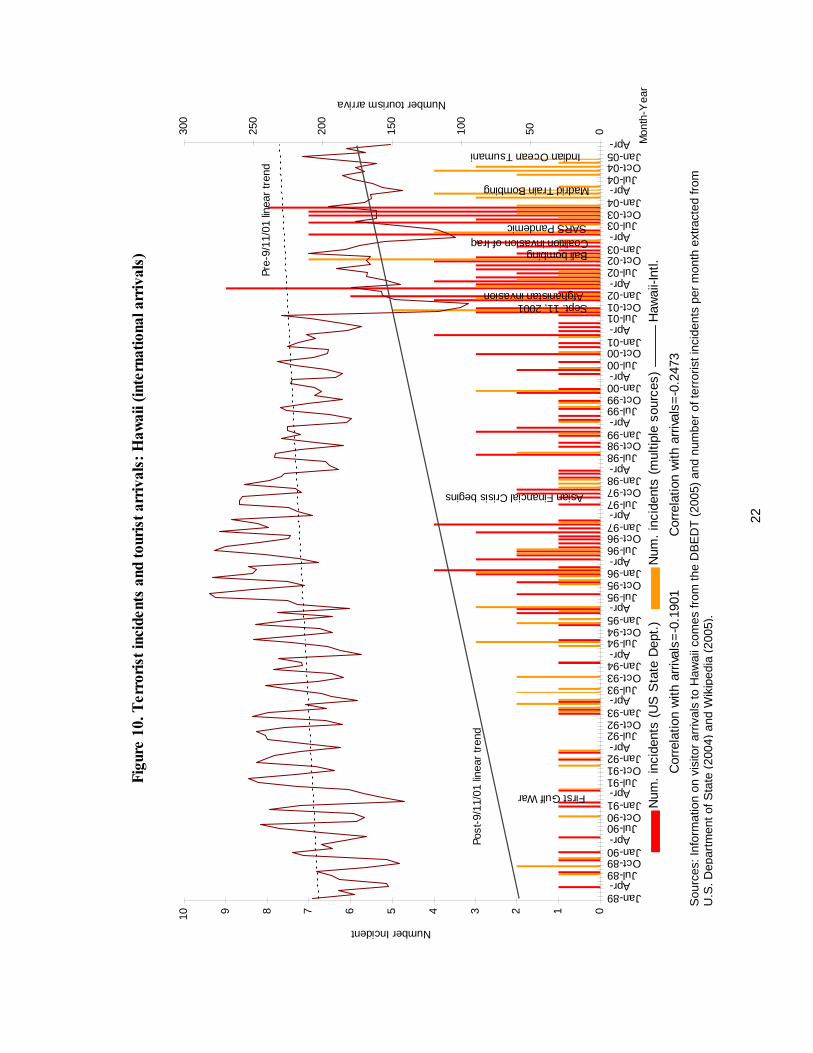
The combination of rising domestic travel and declining foreign travel suggests that Americans have substituted travel to domestic destinations in lieu of foreign travel. This is most clearly illustrated in travel to Hawaii. Figure 10 shows that while international visitor arrivals in Hawaii fell in the wake of 9/11, domestic arrivals from the U.S. mainland have risen more than enough to compensate for the fall in international visitors (Figure 11). The total number of visitor arrivals (domestic and foreign) has surpassed the pre-9/11 peak. Figure 12 shows why U.S. travel to Hawaii is booming: the pre-9/11 trend in the ratio of Hawaii to foreign travel was falling meaning that U.S. travelers were displaying increasing preference for foreign travel as opposed to travel to Hawaii before 9/11. The upward spike in the ratio after 9/11 suggests that 9/11 and subsequent unrest abroad have suddenly increased U.S. preference for travel to Hawaii, and this has had a strong positive effect on the state’s tourism industry. The preference for Hawaii (and other domestic destination) travel may increase further in the near future as new U.S. travel regulations under the Western Hemisphere Travel Initiative (WHTI)-- to require U.S. residents returning from trips to Mexico, Canada, and the Caribbean (except Puerto Rico and the U.S. Virgin Islands) to show U.S. passports-- further discourages American travel abroad. There is a caveat here. When U.S. travelers begin to favor foreign travel again, the current boom in Hawaii tourism could come to an end. For now, tourism in the U.S. and Hawaii have become more dependent on domestic leisure travel.
IV. Conclusion and Policy Considerations
People travel for pleasure in order to escape from the day-to-day routine of their lives. What they do not want is to be exposed to personal hazards, so safety is a paramount concern of most travelers. Not surprisingly, terrorist incidents and other threats to personal safety—whether they are natural disasters or disease epidemics—reduce people’s propensity to travel. Economic downturns associated with business cycles and other economic fluctuations (e.g., large changes in exchange rates) also influence both the level of travel and the choice of destination. While this paper focuses on the relationship between terrorism and tourism in the Asia Pacific region, it is clear that terrorist incidents have not been alone in shaping recent trends and the longer run development of tourism in the region. Indeed, in the short run terrorism and the counter-terrorist measures adopted after 9/11 seem to have been less damaging to travel and tourism growth in the region than some other events—especially the SARS epidemic.
6
Global tourism has withstood the effects of recent years’ terrible events pretty well as travelers adapt to threats by switching their choices of travel destinations. As a result, tourist arrivals in most countries have displayed great resilience in the face of this adverse travel environment. Nonetheless, the succession of negative external shocks in the region following 9/11 has clearly stymied the recovery of tourism in some countries.
The long-term effects of the recent upsurge in global terrorism and of the counter-terrorism policies may not yet have been fully felt in some countries, making it unclear whether the post-9/11 downturn will be lasting. Growing military and security expenditures, higher insurance costs, as well as the rising price of oil, are all associated with higher costs of doing business in the post-9/11 world. The fight against terrorism necessarily diverts economic resources from other productive uses and reduces the overall efficiency and growth of the world’s (and the APEC region’s) economy, which in the long run will retard the growth of income sensitive demand for tourism. Progress in the ‘war on terror’ as well as the policies pursued by affected countries will play large a part in determining how lasting the effect of 9/11 and subsequent tragedies will be on particular countries’ tourism industries.
In the case of the U.S., two trends appear to be working together to contribute to the decline in its global market share of international tourism. One trend relates to the reality and perception regarding ease of travel to the U.S. and the hospitality of the country to foreign visitors. The second trend relates to increasing ease of international travel to many countries and the emergence of new destinations at major for international visitors. We will briefly discuss these two trends in turn.
Opinions about the U.S. have become increasingly negative in recent years (Pew Research Center, 2005) and this may carry over into an apparently increasing perception abroad that the U.S. is unfriendly to foreign tourists, but that has not been demonstrated to be a serious deterrent to foreign travel to the U.S. The perception that U.S. is ‘fortress-like’ when it comes to allowing foreign tourists into the country is longstanding. Until 1986, the U.S. had among the most restrictive visa entry requirements in the world. The U.S. implemented its first visa waiver agreement with U.K. (as an experiment) only in 1988. Today, the list of countries whose nationals are able to enter the U.S. without a prearranged visa is perhaps the shortest of any of the OECD countries.
U.S. insistence that foreign visitors hold passports that include biometric identifiers of the passport holder threatened to stifle the busy summer travel season, and was only dropped last May when it became clear that a majority of European countries would not be able to satisfy the requirement.
It seems obvious that the growing number of regulations and requirements needed to obtain a tourist visa to the U.S. make it more difficult for foreigners who want to visit the U.S. Requirements for personal interviews, and higher visa application fees and longer waits to obtain visas can deter would be international visitors. Added security measures at U.S. Embassies abroad mean that visa applicants must often wait in long-lines in order to apply for a visa.
7

While added scrutiny of would-be visitors and tighter security at U.S. facilities abroad are entirely understandable in today’s dangerous world, greater efforts seem necessary to ensure that the time and inconvenience faced by those interested in visiting the U.S. be reduced as much as possible. An anecdote provided by Marsha Wienert, the State of Hawaii’s Tourism Liaison, illustrates one such opportunity. At the 2005 APEC Economic Outlook Symposium, Ms. Wienert recounted how she had just returned from a trip to Korea along with other members of a Hawaii Trade Mission. She explained how the Trade Mission had observed Koreans waiting to get into the U.S. Embassy to apply for visas to travel to the U.S. The queue of applicants stretched around the Embassy and she speculated that it would have taken several hours just to get into the door of the U.S. Embassy, yet Embassy officials explained that once the applicant got inside the Embassy it took less than an hour to obtain a visa. The explanation for why the line to enter the Embassy was so long was that the facility had only one security set of metal detectors and x-ray machines to screen people going into the Embassy. With added personnel and security screening machines, the Embassy would be able to drastically reduce the time and inconvenience Koreans face in obtaining a visa without sacrificing the nation’s security.
It is widely acknowledged that tourism has always been treated as a “second class citizen” among the world’s major industries. Unless this mindset changes, it is obvious that the final recovery of international travel to the U.S. will not be in sight. The industry, however, is not totally impotent. The recent announcement by the 2,200-member Travel Industry Association of America (TIA) to forge a “strategic partnership” with the Travel Business Roundtable (TBR) could provide more political muscle for a coordinated political lobby campaign to reduce many of the pains associated with international travel. There is an obvious need for the U.S. to figure out ways to reduce the transactions costs foreign tourists face in their efforts to visit the U.S. Otherwise, international travel to the U.S. seems likely to continue to perform below its potential, and the country will be economically worse off as a result. Hopefully, 2004’s stronger growth in the number of international visitors to the U.S. will mark a reversal in the negative trend seen between 2000 and 2003.
Another trend—i.e. measures taken by foreign countries to ease their inbound travel restrictions in order to promote international travel to their countries—also appears likely to contribute to the relative decline in U.S. international tourism. Following 9/11, many countries have lowered their regulatory barriers to international visitors and have become much easier for foreign visitors to visit. Perhaps it is not a coincidence that Singapore which has visa waiver agreements with well over 150 countries in the world saw its international travel recover quickly from waves of external shocks and then surpass its pre- 9/11 peak. The numbers of foreign travelers visiting China have been increasing and the country will likely pass the U.S. as the third most popular international destination worldwide if recent trends continue. In recent years, China has been negotiating “Approved Destination Status” (ADS) agreements that facilitate easier visa processes for Chinese wishing to travel abroad and for foreigners wishing to visit China. The 1990’s saw a number of important multilateral agreements to ease travel between
8

countries. The European Union (EU) implemented the “Schengen Visa” that enables foreign visitors from non-EU countries to obtain a single visa that allows them to travel to all the EU countries. Several countries in the Association of South East Asian Nations (ASEAN) now allow visa free entry for each other’s nationals, and negotiations are underway to allow a “Schengen-type” visa for travel within the ASEAN region. The purpose of mentioning these developments is to note that moves toward easing travel restrictions continue around the world, even in an environment of heightened security concerns, and to note that in the highly competitive global market for tourism, these measures can be expected to influence travelers’ choices of destinations.
Finally, to return to the question initially raised in the paper: “Is Travel and Tourism in a New World After 9/11?” On balance we would say that available data argue against a fundamental shift in international travel patterns globally, however, the heterogeneous policies and experiences of individual countries post-9/11 suggests some countries may be experiencing fundamental changes in their tourism sectors. For the U.S., 9/11 and the continuing war on global terrorism has hurt international travel to the country and perhaps for a long time to come.
9
References
APEC (2003) “WTO Comparative Tourism Statistics for APEC Member Economies 1999 to Dec. 2002,” APEC Tourism Information Network (TIN), available online at: http://www.apec-tourism.org/downloads/.
Blunk, Scott, David Clark and James McGibany (2006) “Evaluating the long-run impacts of the 9/11 terrorist attacks on US domestic airline travel” Applied Economics, Vol. 38, pp. 363–370.
Bureau of Economic Analysis (2005) “Total Tourism-Related Sales Grew 11 percent in First Quarter 2005” BEA News, June 9 (BEA 05-24), Washington, D.C.: International Trade Administration (U.S. Department of Commerce), 6 p.
Bureau of Labor Statistics (2005) "Employment, Hours, and Earnings from the Current Employment Statistics survey (National)," Washington, D.C.: US Department of Labor.
Department of Business, Economic Development, and Tourism (2005) “Data on monthly tourism arrivals to Hawaii” obtained online from the University of Hawai'i Economic Research Organization (UHERO) website at: http://uhero.isdi-hi.com/.
Department of Business, Economic Development, and Tourism (2003) “Annual Visitor Research Report” Honolulu: State of Hawaii, 122 p.
Engerman, Stanley (1971) "The Economic Impact of the Civil War," in Robert W. Fogel and Stanley L. Engerman, eds. The Reinterpretation of American Economic History, New York: Harper and Row, Publishers, pp. 369-379.
JTB Corp. (2005) “Statistics for 1990~2003, Preliminary Figures for 2004, and Projections for 2005”, JTP News, January 13, Tokyo: JTP Corp., 2 p.
Korea National Tourism Organization (2005) Database of tourism statistics for Korea, available online at: http://www.knto.or.kr/eng/07_statistics/ 07_01_2.jsp.
Mak, James (2005) “Tourism Demand and Output in the U.S. Tourism Satellite Accounts: 1998-2003,” Journal of Travel Research, Vol. 44, August, pp. 1-3.
Mak, James (2004) Tourism and the Economy…understanding the economics of tourism,Honolulu: University of Hawaii Press, 268 p.
Malaysia Tourism Promotion Board (2005) "Monthly Tourism Statistics (1996 to 2005)," Kuala Lumpur: Putra World Trade Center (Ministry of Tourism). Available online at: http://www.tourism.gov.my/statistic/default.asp.
10

Office of Travel and Tourism Industries (2005) “Monthly Tourism Statistics (1996 to 2005),” from the report Summary of International Travel to the United States,Washington, D.C.: International Trade Administration (U.S. Department of Commerce). Available online at: http://tinet.ita.doc.gov/research/monthly/arrivals/index.html.
Pew Research Center (2005) “U.S. Image Up Slightly, But Still Negative,” Pew Global Attitudes Project report based on a series of worldwide public opinion surveys, available online at: http://pewglobal.org/reports/display.php?ReportID=247.
Pizam, Abraham, and Aliza Fleischer (2002) “Severity versus Frequency of Acts of Terrorism: Which Has a Larger Impact on Tourism Demand,” Journal of Travel
Research, vol. 40, February, pp. 337-339.
Singapore Tourism Board (2005) Annual Tourism Statistics, Singapore: STB. Latest information on monthly visitor arrivals available at the Research & Statistical Information link: http://app.stb.com.sg/asp/tou/tou02.asp.
Travel Industry Association (2005) “Business and Convention Travelers’ Habits Tracked in New Survey” TIA Press Release, February 8, Washington, D.C.: TIA, 3 p. Available online at: http://www.tia.org /Press/pressrec.asp?Item=359.
Travel Industry Association of America (2005) 2004 Business and Convention Travelers
Report, summary of findings available online at http://www.tia.org/Press/pressrec.asp?Item=359, Washington, D.C.: TIA, 94 p.
U.S. Department of State (2004) Significant Terrorist Incidents, 1961-2003: A Brief
Chronology, Washington, DC: State Department. Available online at: http://www.state.gov/r/pa/ho/pubs/fs/5902.htm.
Wikipedia (2005), “List of terrorist incidents” compiled from multiple sources (MIPT Terrorism Knowledge Base, US State Department's List of Significant Terrorist Incidents (1961 - 2003), Dmoz.org's Society Issues - Terrorism Incidents), available online at: http://en.wikipedia.org/wiki/List_of_terrorist_incidents.
World Bank (2005) World Development Indicators (CD-ROM version), Washington, DC: World Bank.
World Tourism Organization (2003) International Tourist Arrivals, 1950-2002*, Madrid: WTO, available online at: http://www.world-tourism.org/facts/trends/inbound/arrivals/1950-2002.pdf.
World Tourism Organization (2005) WTO World Tourism Barometer (various editions), Madrid: WTO.
11

Figure 1. Schematic representation of tourism downturn and recovery
Number ofTouristArrivals
Historical Trend
Recovery
Losses associatedwith the shock
Catch-up
Contraction
Pre-shock level of tourism
External shock (e.g. 9/11 terrorist attacks)
Return to pre-shock level
Time
12

Fig
ure
2.
Te
rro
rist
in
cid
en
ts a
nd
tou
rist
arr
ivals
: S
ele
cte
d A
PE
C c
ou
ntr
ies
012345678910Jan-99
Apr-99
Jul-99
Oct-99
Jan-00
Apr-00
Jul-00
Oct-00
Jan-01
Apr-01
Jul-01
Oct-01
Jan-02
Apr-02
Jul-02
Oct-02
Mon
th-Y
ear
Number incidents
02000
000
4000
000
6000
000
8000
000
1000
0000
1200
0000
1400
0000
1600
0000
1800
0000
2000
0000
Number tourism arriva
Num
. inc
iden
ts (U
S St
ate
Dep
t.)N
um. i
ncid
ents
(mul
tiple
sou
rces
)AP
EC to
tal
APEC
tota
lLi
near
(APE
C to
tal)
Line
ar (A
PEC
tota
l)Sept. 11, 2001
Bali bombing
Afghanistan invasion
Pre-
9/11
/01
linea
r tre
nd
Post
-9/1
1/01
linea
r tre
nd
Cor
rela
tion
with
arri
vals
=-0.
1213
C
orre
latio
n w
ith a
rriva
ls=-
0.12
77
Sour
ces:
Info
rmat
ion
on A
PEC
-wid
e ar
rival
s co
mes
from
the
Wor
ld T
ouris
m O
rgan
izat
ion’
s In
tern
atio
nal T
ouris
m D
atab
ase
as re
porte
d in
A
PEC
(200
3) a
nd n
umbe
r of t
erro
rist i
ncid
ents
per
mon
th e
xtra
cted
from
U.S
. Dep
artm
ent o
f Sta
te (2
004)
and
Wik
iped
ia (2
005)
.
13
Fig
ure
3.
Te
rro
rist
in
cid
en
ts a
nd
tou
rist
arr
ivals
: K
ore
a
012345678910Jan-96
Apr-96
Jul-96
Oct-96
Jan-97
Apr-97
Jul-97
Oct-97
Jan-98
Apr-98
Jul-98
Oct-98
Jan-99
Apr-99
Jul-99
Oct-99
Jan-00
Apr-00
Jul-00
Oct-00
Jan-01
Apr-01
Jul-01
Oct-01
Jan-02
Apr-02
Jul-02
Oct-02
Jan-03
Apr-03
Jul-03
Oct-03
Jan-04
Apr-04
Jul-04
Oct-04
Jan-05
Mon
th-Y
ear
Number Incident
0100,
000
200,
000
300,
000
400,
000
500,
000
600,
000
700,
000
Number tourism arriva
Num
. inc
iden
ts (U
S St
ate
Dept
.)Nu
m. i
ncid
ents
(mul
tiple
sou
rces
)Ko
rea
Kore
aLi
near
(Kor
ea)
Line
ar (K
orea
)
Sept. 11, 2001
Bali bombing
Indian Ocean Tsumani
Afghanistan invasion
Coalition invasion of Iraq
Asian Financial Crisis begins
Pre-
9/11
/01
linea
r tre
nd
Post
-9/1
1/01
linea
r tre
nd
Corre
latio
n wi
th a
rriva
ls=-
0.01
84
Corre
latio
n wi
th a
rriva
ls=0
.180
8
Madrid Train Bombing
14
Sour
ces:
Info
rmat
ion
on v
isito
r arri
vals
to S
. Kor
ea c
omes
from
the
Kore
an N
atio
nal T
ouris
m O
rgan
izat
ion
(200
5) a
nd n
umbe
r of t
erro
rist
Sour
ces:
Info
rmat
ion
on v
isito
r arri
vals
to S
. Kor
ea c
omes
from
the
Kore
an N
atio
nal T
ouris
m O
rgan
izat
ion
(200
5) a
nd n
umbe
r of t
erro
rist
inci
dent
spe
r mon
th e
xtra
cted
from
U.S
. Dep
artm
ent o
f Sta
te(2
004)
and
Wik
iped
ia (2
005)
.

Fig
ure
4. T
erro
rist
in
cid
ents
an
d t
ou
rist
arr
iva
ls:
Ma
lay
sia
012345678910Jan-99
Apr-99
Jul-99
Oct-99
Jan-00
Apr-00
Jul-00
Oct-00
Jan-01
Apr-01
Jul-01
Oct-01
Jan-02
Apr-02
Jul-02
Oct-02
Jan-03
Apr-03
Jul-03
Oct-03
Jan-04
Apr-04
Jul-04
Oct-04
Jan-05
Mon
th-Y
ear
Number incidents
0500,
000
1,00
0,00
0
1,50
0,00
0
2,00
0,00
0
2,50
0,00
0
Number tourism arrivals
Num
. inc
iden
ts (U
S St
ate
Dep
t.)N
um. i
ncid
ents
(mul
tiple
sou
rces
)M
alay
sia
Mal
aysi
aLi
near
(Mal
aysi
a)Li
near
(Mal
aysi
a)
Sept. 11, 2001
SARS Epidemic
Bali bombing
Indian Ocean Tsumani
Afghanistan invasion
Coalition invasion of Iraq
Pre-
9/11
/01
linea
r tre
nd
Post
-9/1
1/01
line
ar tr
end
Corre
latio
n wi
th a
rriva
ls=-
0.01
29
Corre
latio
n wi
th a
rriva
ls=0
.149
0
Madrid Train Bombing
Sour
ces:
Info
rmat
ion
on v
isito
r arri
vals
to M
alay
sia
com
es fr
om th
e M
alay
sia
Tour
ism
Pro
mot
ion
Boar
d (2
005)
and
num
ber o
f te
rroris
t inc
iden
ts p
er m
onth
ext
ract
ed fr
om U
.S. D
epar
tmen
t of S
tate
(200
4) a
nd W
ikip
edia
(200
5).
15

Fig
ure
5. T
err
ori
st i
nci
de
nts
an
d t
ou
rist
arr
ivals
: S
ing
ap
ore
012345678910Jan-95Apr-95Jul-95
Oct-95Jan-96Apr-96Jul-96
Oct-96Jan-97Apr-97Jul-97
Oct-97Jan-98Apr-98Jul-98
Oct-98Jan-99Apr-99Jul-99
Oct-99Jan-00Apr-00Jul-00
Oct-00Jan-01Apr-01Jul-01
Oct-01Jan-02Apr-02Jul-02
Oct-02Jan-03Apr-03Jul-03
Oct-03Jan-04Apr-04Jul-04
Oct-04Jan-05 M
onth
-Yea
r
Number incidents
0100,
000
200,
000
300,
000
400,
000
500,
000
600,
000
700,
000
800,
000
900,
000
Number tourism arriva
Num
. inc
iden
ts (U
S St
ate
Dept
.)Nu
m. i
ncid
ents
(mul
tiple
sou
rces
)Si
ngap
ore
Sing
apor
eLi
near
(Sin
gapo
re)
Line
ar (S
inga
pore
)
Pre-
9/11
/01
linea
r tre
nd
Post
-9/1
1/01
linea
r tre
nd
Corre
latio
n wi
th a
rriva
ls=-
0088
5
Corre
latio
n wi
th a
rriva
ls=0
.001
1
Sept. 11, 2001
SARS Pandemic
Bali bombing
Indian Ocean Tsumani
Afghanistan invasion
Coalition invasion of Iraq
Asian Financial Crisis begins
Madrid Train Bombing
Sour
ces:
Info
rmat
ion
on v
isito
r arri
vals
to S
inga
pore
com
es fr
om th
e Si
ngap
ore
Tour
ism
Boa
rd (2
005)
and
num
ber o
f ter
roris
t inc
iden
ts p
er
mon
th e
xtra
cted
from
U.S
. Dep
artm
ent o
f Sta
te (2
004)
and
Wik
iped
ia (2
005)
.
16

Fig
ure
6. T
erro
rist
in
cid
ents
an
d t
ou
rist
arr
iva
ls:
Ja
pa
n
012345678910
Jan-99
Apr-99
Jul-99
Oct-99
Jan-00
Apr-00
Jul-00
Oct-00
Jan-01
Apr-01
Jul-01
Oct-01
Jan-02
Apr-02
Jul-02
Oct-02
Mon
th-Y
ear
Number Incidents
0100,
000
200,
000
300,
000
400,
000
500,
000
600,
000
Number tourism arrivals
Num
. inc
iden
ts (U
S St
ate
Dep
t.)N
um. i
ncid
ents
(mul
tiple
sou
rces
)Ja
pan
Japa
nLi
near
(Jap
an)
Line
ar (J
apan
)Sept. 11, 2001
Bali bombing
Afghanistan invasion
Post
-9/1
1/01
line
ar tr
end
Pre-
9/11
/01
linea
r tre
nd
Corre
latio
n wi
th A
rriva
ls=0
.194
3Co
rrela
tion
with
Arri
vals
=0.0
609
Sour
ces:
Info
rmat
ion
on in
tern
atio
nal v
isito
r arri
vals
to J
apan
com
es fr
om th
e W
orld
Tou
rism
Org
aniz
atio
n’s
Inte
rnat
iona
l Tou
rism
Dat
abas
e as
re
porte
d in
APE
C (2
003)
and
num
ber o
f ter
roris
t inc
iden
ts p
er m
onth
ext
ract
ed fr
om U
.S. D
epar
tmen
t of S
tate
(200
4) a
nd W
ikip
edia
(200
5).
17

Fig
ure
7. D
om
esti
c an
d o
ver
seas
travel
by J
ap
an
ese
5.1
5.0
3.9
4.9
4.8
5.2
4.9
4.7
4.9
4.9
4.6
4.1
3.6
3.6
3.2
3.4
150
175
200
225
250
275
300
325
350
1990
1991
1992
1993
1994
1995
1996
1997
1998
1999
2000
2001
2002
2003
2004
2005
year
millions of travelers
Dom
estic
trip
sO
vers
eas
trips
Not
e: N
umbe
rs o
n co
lum
ns d
ispl
ay th
e sh
are
of a
ll tri
ps b
y Ja
pane
se a
ccou
nted
for b
y ov
erse
as tr
ips.
Sou
rce:
JTB
Cor
p. (2
005)
18

Fig
ure
8.
Ex
pe
nd
itu
re o
n d
om
est
ic a
nd
ov
ers
ea
s tr
av
el
by
Ja
pa
ne
se
34.
4 3
0.9
31.
5 29
.8
30.8
33.0
35.
4 3
4.7
33.4
33.
633
.4
30.
431
.027
.631
.4
31.
5
-
2,00
0
4,00
0
6,00
0
8,00
0
10,0
00
12,0
00
14,0
00
16,0
00
18,0
00
20,0
00
1990
1991
1992
1993
1994
1995
1996
1997
1998
1999
2000
2001
2002
2004
2005
year
Billions of Yen
2003
Dom
estic
trip
sO
vers
eas
trips
Note
: Num
bers
on
colu
mns
dis
play
the
shar
es o
f tot
al tr
avel
exp
endi
ture
app
lied
to o
vers
eas
trips
by
Japa
nese
trav
eler
s.
Sou
rce:
JTB
Cor
p. (2
005)
19

20
Fig
ure
9. T
erro
rist
in
cid
ents
an
d t
ou
rist
arr
ivals
: U
SA
012345678910
Jan-99
Apr-99
Jul-99
Oct-99
Jan-00
Apr-00
Jul-00
Oct-00
Jan-01
Apr-01
Jul-01
Oct-01
Jan-02
Apr-02
Jul-02
Oct-02
Jan-03
Apr-03
Jul-03
Oct-03
Jan-04
Apr-04
Jul-04
Oct-04
Mon
th-Y
ear
Number Incidents
01,00
0,00
0
2,00
0,00
0
3,00
0,00
0
4,00
0,00
0
5,00
0,00
0
6,00
0,00
0
Number tourism arrivals
Num
. inc
iden
ts (U
S St
ate
Dep
t.)N
um. i
ncid
ents
(mul
tiple
sou
rces
)U
SA
USA
Li
near
(USA
)Li
near
(USA
)
Sept. 11, 2001
SARS Pandemic
Bali bombing
Indian Ocean Tsumani
Afghanistan invasion
Coalition invasion of Iraq
Pre-
9/11
/01
linea
r tre
nd
Post
-9/1
1/01
line
ar tr
end
MadridTrainBombing
Corre
latio
n wi
th a
rriva
ls=-
0.25
48
Corre
latio
n wi
th a
rriva
ls=-
0.24
73
Sour
ces:
Info
rmat
ion
on v
isito
r arri
vals
to U
.S. c
omes
from
the
Offi
ce o
f Tra
vel a
nd T
ouris
m In
dust
ries
(200
5) a
nd n
umbe
r of t
erro
rist i
ncid
ents
pe
r mon
th e
xtra
cted
from
U.S
. Dep
artm
ent o
f Sta
te (2
004)
and
Wik
iped
ia (2
005)
.

Table 1. Domestic and Foreign Travel in the U.S.: 2000-2004
Domestic Person Trips Foreign Visitors Year (millions) (millions)
2000 1,100.8 51.2
2001 1,123.1 (2.03) 46.9 (-8.40)
2002 1,127.0 (0.35) 43.5 (-7.25)
2003 1,140.0 (1.15) 41.2 (-5.29)
2004 1,163.9 (2.10) 46.1 (11.89)
Note: Numbers in parenthesis gives the year-on-year change (pct.) Source: Travel Industry Association of America (TIA) (2005)
Table 2. Domestic and Foreign Travel Spending in the US: 2000-04
In Current US$ (billions) In Year 2000 $ (billions)Year Domestic Foreign Total Domestic Foreign Total
2000 $498.4 $82.4 $580.8 $498.4 $82.4 $580.8
2001 479.0 71.9 550.9 473.8 71.1 544.9
2002 473.6 66.5 540.1 470.7 66.0 536.7
2003 491.6 65.1 556.7 475.9 63.0 538.9
2004 525.3 74.8 600.1 486.8 69.3 556.1
Percentage Change 2000 to 2004 -2.3% -15.9% -4.3%
Note: Real expenditures were calculated using the travel price index developed by the Travel Industry Association of America (TIA) Source: Spending data from the TIA (2005).
Table 3. Direct Tourism Related Sales and Tourism Employment in the US: 2000-04
Nominal Direct Deflated Direct Tourism Tourism Sales Sales (in billions Yr.2000$) Direct Employment Year (billions current $) TIA Deflator CPI-U ( in 000s)
2000 $516.7 $516.7 $516.7 5,698.3
2001 492.1 486.7 478.2 5,624.3
2002 494.1 490.7 472.8 5,499.5
2003 512.2 495.8 479.1 5,402.1
2004 546.4 506.4 497.6 5,423.6
Pct. Change 2000-Low Year -4.8% -5.8% -8.5% -5.2%
2000-2004 5.7% -2.0% -3.7% -4.8%
Sources: Direct sales and employment data from Bureau of Economic Analysis (2005); travel price index used to deflate direct sales obtained from the Travel Industry Association of America (TIA); CPI-U obtained from the Bureau of Labor Statistics (2005).
21
Fig
ure
10.
Te
rro
rist
inci
de
nts
an
d t
ou
rist
arr
ivals
: H
aw
aii
(in
tern
ati
on
al
arr
ivals
)
012345678910
Jan-89Apr-
Jul-89Oct-89Jan-90
Apr-Jul-90
Oct-90Jan-91
Apr-Jul-91
Oct-91Jan-92
Apr-Jul-92
Oct-92Jan-93
Apr-Jul-93
Oct-93Jan-94
Apr-Jul-94
Oct-94Jan-95
Apr-Jul-95
Oct-95Jan-96
Apr-Jul-96
Oct-96Jan-97
Apr-Jul-97
Oct-97Jan-98
Apr-Jul-98
Oct-98Jan-99
Apr-Jul-99
Oct-99Jan-00
Apr-Jul-00
Oct-00Jan-01
Apr-Jul-01
Oct-01Jan-02
Apr-Jul-02
Oct-02Jan-03
Apr-Jul-03
Oct-03Jan-04
Apr-Jul-04
Oct-04Jan-05
Apr- Mon
th-Y
ear
Number Incident
050100
150
200
250
300
Number tourism arriva
Num
. inc
iden
ts (U
S St
ate
Dept
.)Nu
m. i
ncid
ents
(mul
tiple
sou
rces
)Ha
waii-
Intl.
Hawa
ii-In
tl.Li
near
(Haw
aii-I
ntl.)
Line
ar (H
awai
i-Int
l.)
First Gulf War
Sept. 11, 2001
SARS Pandemic
Bali bombing
Indian Ocean Tsumani
Afghanistan invasion
Coalition invasion of Iraq
Asian Financial Crisis begins
Pre-
9/11
/01
linea
r tre
nd
Corre
latio
n wi
th a
rriva
ls=-
0.19
01
Post
-9/1
1/01
linea
r tre
nd
Corre
latio
n wi
th a
rriva
ls=-
0.24
73
Madrid Train Bombing
Sour
ces:
Info
rmat
ion
on v
isito
r arri
vals
to H
awai
i com
es fr
om th
e D
BED
T (2
005)
and
num
ber o
f ter
roris
t inc
iden
ts p
er m
onth
ext
ract
ed fr
om
U.S
. De p
artm
ent o
f Sta
te (2
004)
and
Wik
iped
ia (2
005)
.
22

Fig
ure
11. T
err
ori
st in
cide
nts
an
d t
ou
rist
arr
ivals
: H
aw
aii
(fr
om
US
A)
012345678910
Jan-89Apr-
Jul-89Oct-89Jan-90
Apr-Jul-90
Oct-90Jan-91
Apr-Jul-91
Oct-91Jan-92
Apr-Jul-92
Oct-92Jan-93
Apr-Jul-93
Oct-93Jan-94
Apr-Jul-94
Oct-94Jan-95
Apr-Jul-95
Oct-95Jan-96
Apr-Jul-96
Oct-96Jan-97
Apr-Jul-97
Oct-97Jan-98
Apr-Jul-98
Oct-98Jan-99
Apr-Jul-99
Oct-99Jan-00
Apr-Jul-00
Oct-00Jan-01
Apr-Jul-01
Oct-01Jan-02
Apr-Jul-02
Oct-02Jan-03
Apr-Jul-03
Oct-03Jan-04
Apr-Jul-04
Oct-04Jan-05
Apr-Mon
th-Y
ear
Number Incident
0100
200
300
400
500
600
Number tourism arriva
Num
. inc
iden
ts (U
S St
ate
Dept
.)Nu
m. i
ncid
ents
(mul
tiple
sou
rces
)Ha
waii-
USHa
waii-
USLi
near
(Haw
aii-U
S)Li
near
(Haw
aii-U
S)
Sept. 11, 2001
First Gulf War
SARS Pandemic
Bali bombing
Indian Ocean Tsumani
Afghanistan invasion
Coalition invasion of Iraq
Asian Financial Crisis begins
Pre-
9/11
/01
linea
r tre
nd
Post
-9/1
1/01
linea
r tre
nd
Corre
latio
n wi
th a
rriva
ls=0
.011
6 Co
rrela
tion
with
arri
vals
=0.0
196
Madrid Train Bombing
Sour
ces:
Info
rmat
ion
on v
isito
r arri
vals
to H
awai
i com
es fr
om th
e D
BED
T (2
005)
and
num
ber o
f ter
roris
t inc
iden
ts p
er m
onth
ext
ract
ed fr
om
U.S
. De p
artm
ent o
f Sta
te (2
004)
and
Wik
iped
ia (2
005)
.
23

Fig
ure
12. R
ati
o o
f U
.S. A
rriv
als
to H
aw
aii a
nd T
ota
l U
.S. O
vers
eas
Depart
ure
s
0.0
5.0
10.0
15.0
20.0
25.0
Jan-96
Apr-96
Jul-96
Oct-96
Jan-97
Apr-97
Jul-97
Oct-97
Jan-98
Apr-98
Jul-98
Oct-98
Jan-99
Apr-99
Jul-99
Oct-99
Jan-00
Apr-00
Jul-00
Oct-00
Jan-01
Apr-01
Jul-01
Oct-01
Jan-02
Apr-02
Jul-02
Oct-02
Jan-03
Apr-03
Jul-03
Oct-03
Jan-04
Apr-04
Jul-04
Oct-04
percent
Ratio
pre
-9/1
1Ra
tio p
ost-9
/11
Post
-9/1
1 lin
ear t
rend
So
urc
es:
Au
tho
rs’
calc
ula
tio
n b
ased
on
dat
a fr
om
DB
ED
T (
20
05
), a
nd
U.S
. D
epar
tmen
t o
f C
om
mer
ce,
Inte
rnat
ion
al T
rad
e A
dm
inis
trat
ion
(1
998
th
rou
gh
20
05
).
Note
: F
igure
s sh
ow
s ra
tio o
f H
awai
i’s
U.S
. vis
itor
arri
val
s by a
ir t
o a
ll U
S o
ver
seas
dep
artu
res
(in
tern
atio
nal
dep
artu
res
excl
ud
ing
Can
ada
and
Mex
ico
).
U
S o
ver
seas
fo
r A
pri
l-to
-Dec
ember
19
99
and
Dec
emb
er 2
00
0 m
issi
ng
fro
m I
TA
sta
tist
ics,
so
est
imat
ed b
ased
on
pri
or
yea
r's
mo
nth
-to
-month
chan
ge
in a
rriv
als
tim
es
pri
or
mo
nth
's l
evel
of
arri
val
s.
24