terner california residential land use survey report
TRANSCRIPT
Local Housing Policies Across California Presenting the Results of a New Statewide Survey December 2018
2
About the Terner Center Authored by:
The Terner Center formulates bold strategies to house families from all walks of life in vibrant, sustainable, and affordable homes and communities. Our focus is on generating constructive, practical strategies for public policy makers and innovative tools for private sector partners to achieve better results for families and communities.
For more information visit: www.ternercenter.berkeley.edu
Sarah Mawhorter Postdoctoral Scholar
Carolina Reid Faculty Research Advisor
Survey Implementation:
Liana Arnold Graduate Researcher
Derek Taylor Julia Morris Ryan Kelley-Cahill Undergraduate Researchers
About the California Department of Housing and Community Development The Department awards loans and grants to public and private housing developers, nonprofit agencies, cities, counties, and state and federal partners. The Department also develops housing policy, building codes, and regulates manufactured homes as well as mobile home parks.
Acknowledgments We would like to acknowledge the work of Liana Arnold, Julia Morris, Derek Taylor, and Ryan Kelley-Cahill. Their talent, enthusiasm, and persistence made the survey possible. We are also grateful to the California Department of Housing and Community Development for the funding that made the survey possible as well as the HCD staff, land use experts, and practitioners who contributed thorough and thoughtful reviews as we developed the survey. Carol Galante, Elizabeth Kneebone, Hayley Raetz, Sara Draper-Zivetz, and Cora Johnson-Grau all contributed valuable feedback and assistance to the survey and report. Finally, we deeply appreciate the planners who took the time to share their data and insights through the survey.
3
Table of Contents About the Terner Center ........................................................................................................... 2
Acknowledgments..................................................................................................................... 2
Table of Contents ...................................................................................................................... 3
Executive Summary .................................................................................................................. 4
Introduction .............................................................................................................................. 5
Background ............................................................................................................................... 6
Survey Design and Implementation ......................................................................................... 6
Survey Responses ...................................................................................................................... 7
Survey Results ......................................................................................................................... 10
Zoning Regulations .................................................................................................................. 10
Approval Process ..................................................................................................................... 15
Development Constraints ........................................................................................................ 19
Affordable Housing Policies ................................................................................................... 20
Rental Regulations ................................................................................................................. 24
Conclusion .............................................................................................................................. 26
Appendix A. Survey Topic Comparison ...................................................................................27
Appendix B. Survey Instrument ............................................................................................. 28
Appendix C. Respondent Jurisdictions .................................................................................. 56
Endnotes ................................................................................................................................. 60
4
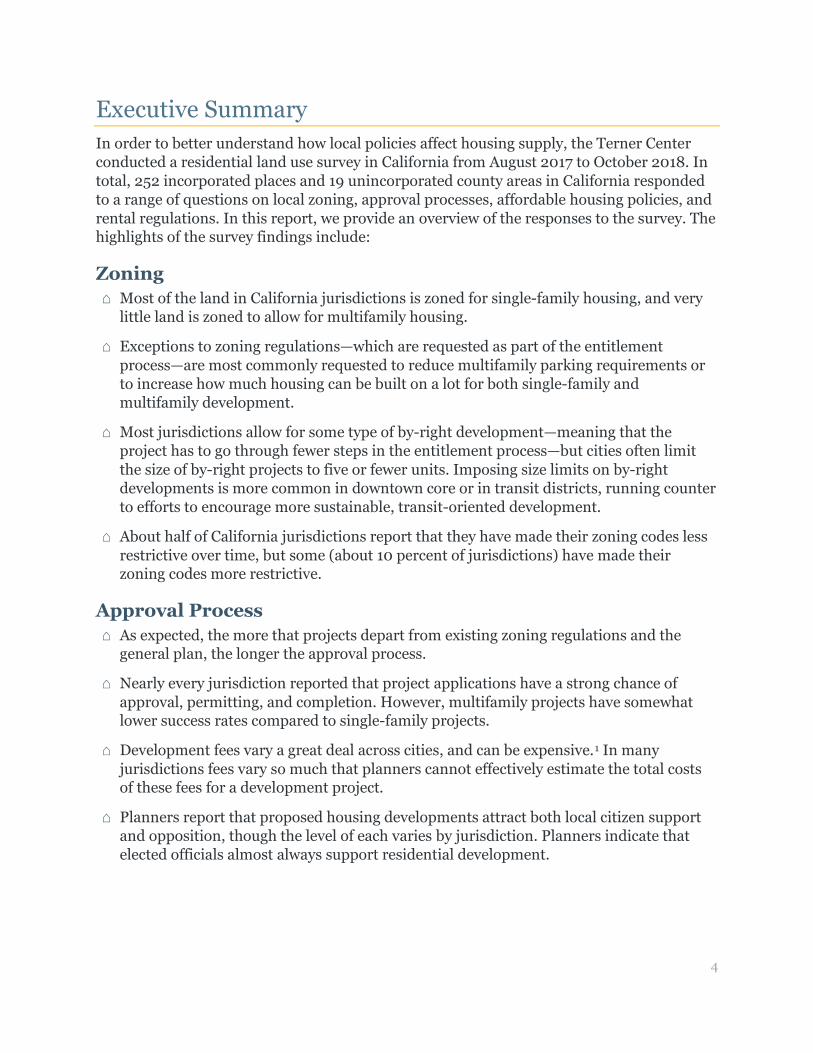
Executive Summary In order to better understand how local policies affect housing supply, the Terner Center conducted a residential land use survey in California from August 2017 to October 2018. In total, 252 incorporated places and 19 unincorporated county areas in California responded to a range of questions on local zoning, approval processes, affordable housing policies, and rental regulations. In this report, we provide an overview of the responses to the survey. The highlights of the survey findings include:
Zoning ⌂ Most of the land in California jurisdictions is zoned for single-family housing, and very
little land is zoned to allow for multifamily housing.
⌂ Exceptions to zoning regulations—which are requested as part of the entitlement process—are most commonly requested to reduce multifamily parking requirements or to increase how much housing can be built on a lot for both single-family and multifamily development.
⌂ Most jurisdictions allow for some type of by-right development—meaning that the project has to go through fewer steps in the entitlement process—but cities often limit the size of by-right projects to five or fewer units. Imposing size limits on by-right developments is more common in downtown core or in transit districts, running counter to efforts to encourage more sustainable, transit-oriented development.
⌂ About half of California jurisdictions report that they have made their zoning codes less restrictive over time, but some (about 10 percent of jurisdictions) have made their zoning codes more restrictive.
Approval Process ⌂ As expected, the more that projects depart from existing zoning regulations and the
general plan, the longer the approval process.
⌂ Nearly every jurisdiction reported that project applications have a strong chance of approval, permitting, and completion. However, multifamily projects have somewhat lower success rates compared to single-family projects.
⌂ Development fees vary a great deal across cities, and can be expensive.1 In many jurisdictions fees vary so much that planners cannot effectively estimate the total costs of these fees for a development project.
⌂ Planners report that proposed housing developments attract both local citizen support and opposition, though the level of each varies by jurisdiction. Planners indicate that elected officials almost always support residential development.
5
Affordable Housing Policies ⌂ While density bonus and inclusionary ordinances are relatively common across
California’s jurisdictions, planners report that they have not resulted in significant new development.
⌂ Far more projects were built under local inclusionary policies than under state density bonus law.
⌂ Density bonus development usually goes hand in hand with inclusionary development, suggesting that inclusionary policies can encourage the use of density bonus provisions and both might be needed to incentivize new affordable housing development.
Rental Regulations ⌂ Slightly over half of jurisdictions restrict conversions from rental housing to
condominiums, but less than 10 percent have ordinances that restrict conversions from rental housing to hotels.
⌂ Only 13 percent of jurisdictions reported rent control ordinances, and only 10 percent of jurisdictions reported just cause eviction protections.
These initial results show the complexity and diversity of land use laws across the state, and suggest some of the policy barriers that hinder the production of new housing in California. By publishing the results of this survey, we hope to generate discussion on how local policies - including zoning more land for multifamily housing, implementing local inclusionary policies where feasible to get the most out of state density bonus law, and wider consideration of just cause eviction and rent conversion ordinances - can help to solve the affordable housing crisis. This descriptive analysis also points to directions for more in-depth research and analysis to understand how local policies and practices can encourage housing development—both affordable and market-rate—to meet California’s dire need for more housing.
The Terner Center is committed to bridging gaps in the data needed to inform conversations and decisions around housing and land use policy and innovation. To that end, the Terner Center is making the data from the survey publicly available, and it is our hope that policymakers, researchers, and advocates will make use of this resource. The data can be accessed at the survey website.
Introduction In August 2018, a two bedroom, 1,100-square-foot townhome in San Jose listed for $1.1 million. A one bedroom, 650-square-foot apartment in Oakland rents for $3,090 per month. Increasing housing prices have touched jurisdictions across California: over the past two years, rents have increased by 26 percent in Sacramento, 23 percent in Long Beach, and 28 percent in Stockton.2
6
The need for more housing is visible in nearly all communities in the state. One obvious solution to this problem is to encourage more housing construction, but this is often harder than it sounds. State housing policies may guide planning regulations and procedures, but local staff, planning commissions, and city councils decide whether each proposed housing development can be built.
To understand how local land use regulations and practices affect housing development, the Terner Center conducted a survey of planners across California cities and counties. The Terner California Residential Land Use Survey includes questions about zoning regulations, the approval process, affordable housing policies, rental regulations, and a range of other local housing policies. This report presents the initial results of the survey. The Terner Center is making the survey data publicly available in the hope that practitioners, researchers, advocates, and policymakers will make use of this evidence to address the problem of housing provision in California cities.
Background The Terner California Residential Land Use Survey builds on prior surveys that have investigated local land use regulations for housing. The earliest of these surveys were conducted in California in the late 1980s and early 1990s.3 A decade later, the Raising the Roof Survey asked planners about the adoption of growth management policies in California jurisdictions.4 In the 2000s, researchers conducted ambitious surveys in cities across the United States: the Brookings National Survey on Local Residential Development Regulation5 and the Wharton Survey on Residential Land Use Regulation.6 Shortly afterwards, the U.S. Department of Housing and Urban Development commissioned a national survey of local land use regulations,7 which was developed through an intensive review process but never administered at the national level. More recently, the 2013 California Land Use Survey follows the approach of the Wharton Survey.8
These surveys form the basis for a body of research on the ways that local land use regulations influence housing development. Many have relied on the Wharton Residential Land Use Regulatory Index9 to measure the restrictiveness of land use regulations in metropolitan areas across the US. For example, Lens and Monkkonen used the Wharton index and found that stringent local land use regulations and local opposition to development play a role in driving income segregation in metropolitan regions, and that density restrictions can increase the concentration of affluent communities.10
Survey Design and Implementation To develop the Terner California Residential Land Use Survey, we began by reviewing previous land use regulation surveys including the Wharton survey,11 Brookings survey,12 Raising the Roof survey,13 and the California Land Use Survey.14 We also benefitted from the careful documentation of the HUD survey design effort,15 which included recommendations from a wide range of experts in the field. In many cases, we carried over questions from previous surveys to enable longitudinal analysis. Appendix A lays out the
7
areas of overlap between this survey and previous surveys, and the survey questionnaire is included in Appendix B.
We also worked closely with staff from the California Department of Housing and Community Development (CA-HCD) to prioritize the most useful topics for understanding local land use regulations in California cities. While many of the questions are broadly applicable to local land use regulations in cities across the US, some are tailored to the California policy context (for example the state density bonus law or policy on accessory dwelling units).
Once we developed a draft questionnaire, we sent the survey to land use experts selected to provide diverse perspectives: housing advocates, land use attorneys, planners, and developers, as well as academics who have either designed previous surveys or analyzed the data. We asked for their input on the content covered by the survey. We were primarily interested in finding gaps in current knowledge that the survey could address.
After incorporating recommendations we received from twenty land use experts, we tested the questionnaire with practicing planners. We interviewed five planners at length, reviewing each question. Based on their feedback we were able to calibrate the question wording and categories to reflect planners’ real-world experience. We also asked planners if any topics were missing from the survey, and they helped us fill in remaining gaps.
We administered the survey online through the Qualtrics survey software, with the option of using a fillable PDF instead. We compiled a list of planners at all 482 incorporated cities and 57 unincorporated county areas in California. We started with the list of respondents from the most recent Annual Planning Survey, conducted by the California Governor’s Office of Planning and Research. We then updated any outdated contact information by searching jurisdiction websites. We emailed the survey to planners in all jurisdictions, and then followed up multiple times by phone and email from August 2017 to October 2018.
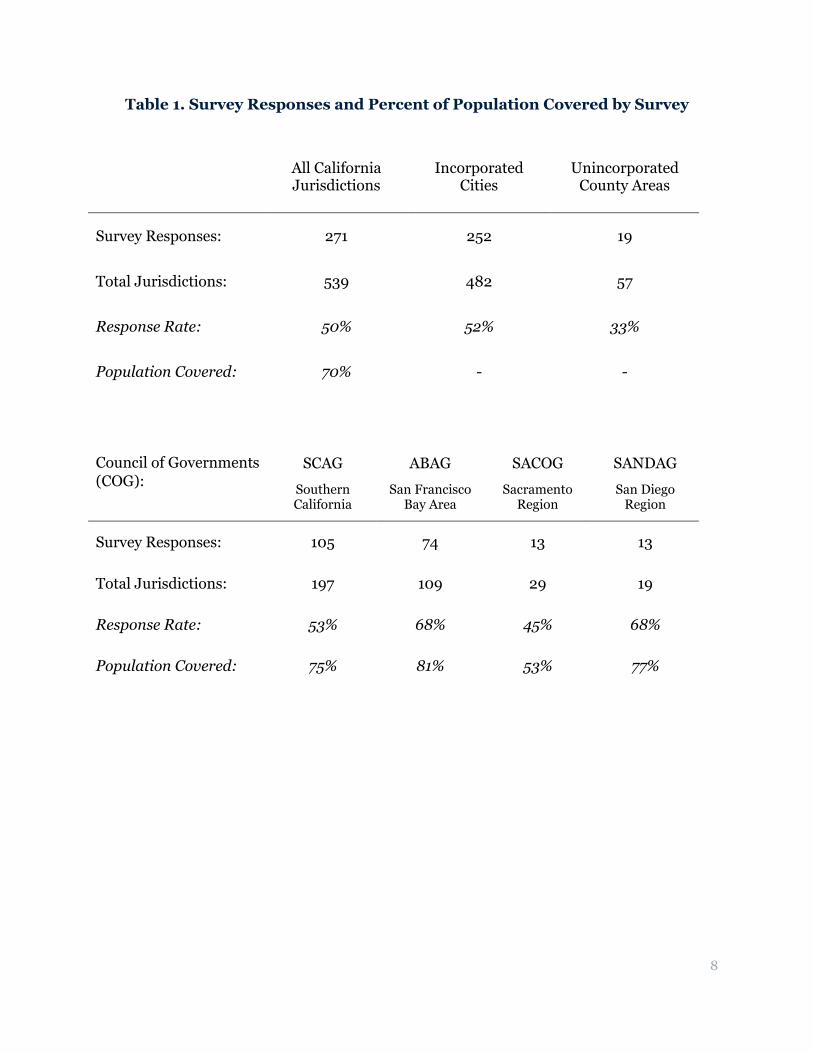
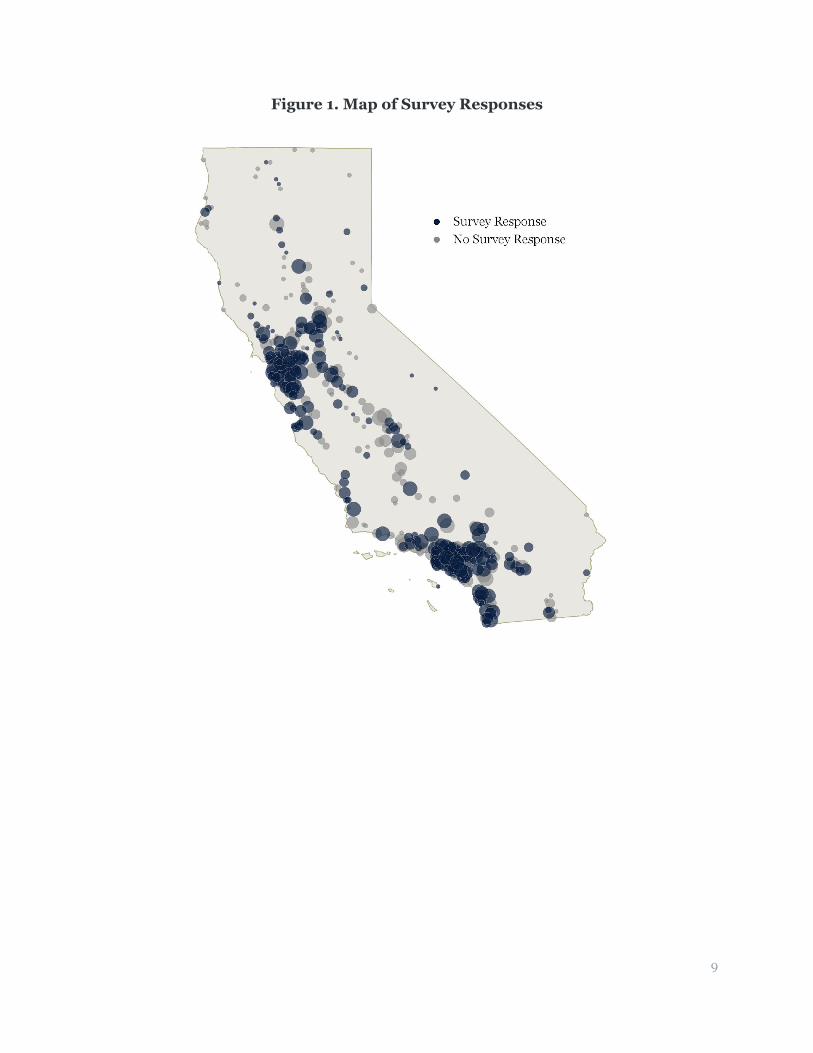
Survey Responses We gathered responses from 252 of the 482 incorporated cities (a 52 percent response rate) and 19 of the 57 county unincorporated areas. These responses represent jurisdictions that encompass 70 percent of the California population. More than two-thirds of jurisdictions responded in the Association of Bay Area Governments (ABAG) and the San Diego Association of Governments (SANDAG), and about half of jurisdictions responded in the Southern California Association of Governments (SCAG) and the Sacramento Area Council of Governments (SACOG) (Table 1). Appendix C contains a list of all the cities and counties that responded to the survey.
8
Table 1. Survey Responses and Percent of Population Covered by Survey
All California Jurisdictions
Incorporated Cities
Unincorporated County Areas
Survey Responses: 271 252 19
Total Jurisdictions: 539 482 57
Response Rate: 50% 52% 33%
Population Covered: 70% - -
Council of Governments (COG):
SCAG ABAG SACOG SANDAG
Southern California
San Francisco Bay Area
Sacramento Region
San Diego Region
Survey Responses: 105 74 13 13
Total Jurisdictions: 197 109 29 19
Response Rate: 53% 68% 45% 68%
Population Covered: 75% 81% 53% 77%
9
Figure 1. Map of Survey Responses
10
Survey Results An overview of the survey responses gives a picture of the way that land use regulations are implemented in cities across California. This report describes the landscape of local zoning regulations, approval processes, affordable housing development policies, and rental regulations in jurisdictions across the state. Future research projects will use these data to conduct analysis of the impacts of local regulation on housing, people, and economies.
The survey responses draw on the knowledge and experiences of planners involved with the housing development process in their jurisdictions. Some of the questions ask about regulations and procedures, other questions ask about the way those regulations and procedures operate in practice, and a few questions ask for planners’ perspectives about the reasons for development constraints or approval delays. Many planners deal with questions of zoning regulations, approval processes, and affordable housing development in their daily work, and are well positioned to provide insights about the policies and practices that affect housing development. However, it is also important to note that the answers reflect the planners’ point of view, which may differ from other stakeholders in the housing development process.
Zoning Regulations Zoning regulations define what is allowed to be built on each plot of land within a jurisdiction. Zoning is the starting place for any new development. We asked planners about the amount of land zoned for housing and the zoning standards that regulate the dimensions of buildings. These questions give us a sense of what is allowed to be built without variances, conditional use permits, or a zoning amendment. We also asked about variances and “by-right” development, which determines the extent to which housing that conforms to zoning regulations can be built without discretionary review.
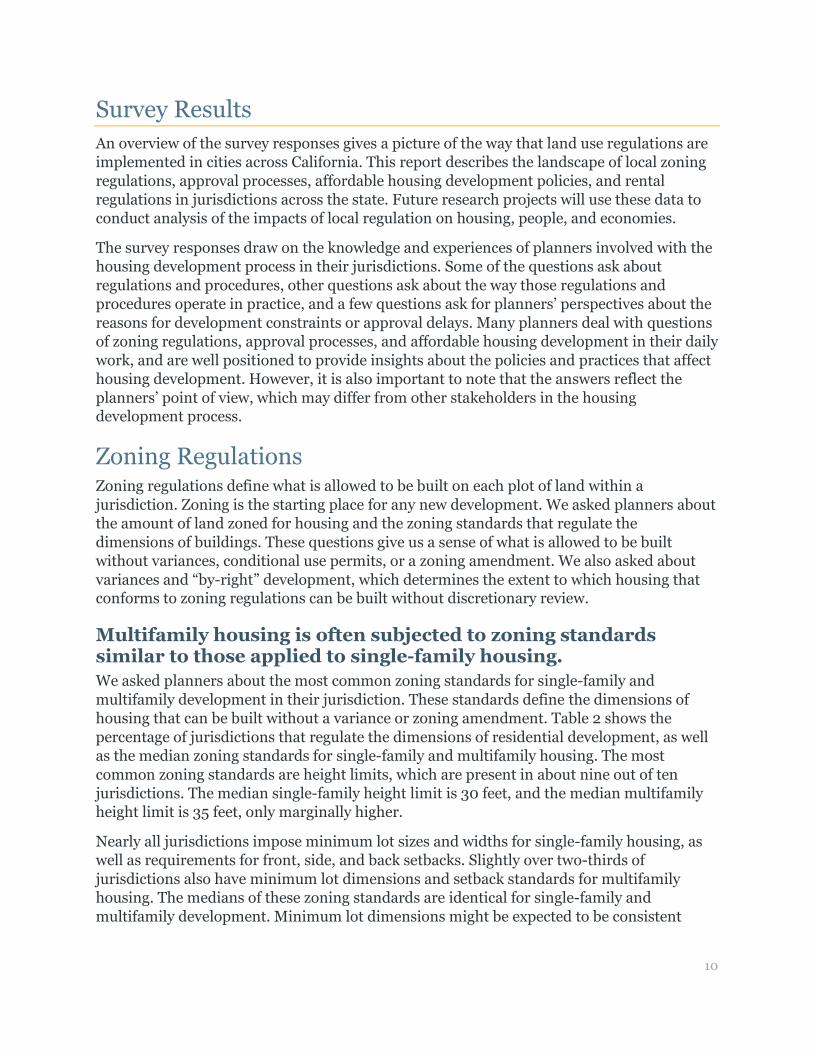
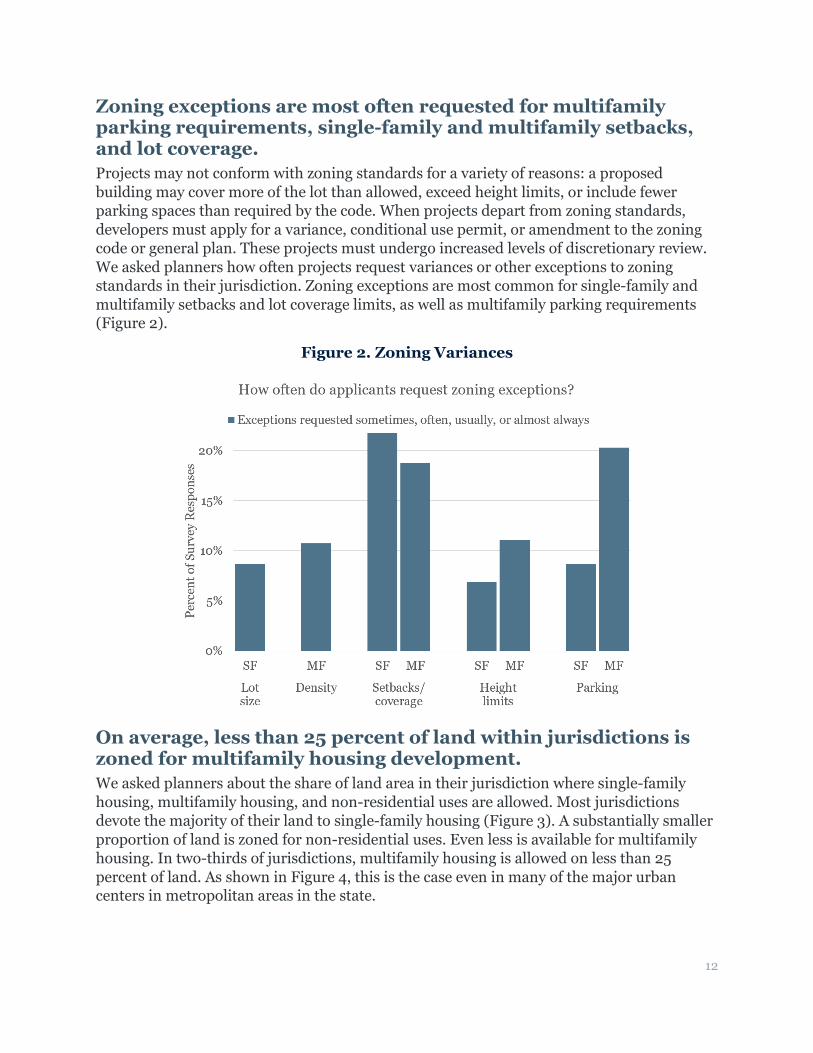
Multifamily housing is often subjected to zoning standards similar to those applied to single-family housing. We asked planners about the most common zoning standards for single-family and multifamily development in their jurisdiction. These standards define the dimensions of housing that can be built without a variance or zoning amendment. Table 2 shows the percentage of jurisdictions that regulate the dimensions of residential development, as well as the median zoning standards for single-family and multifamily housing. The most common zoning standards are height limits, which are present in about nine out of ten jurisdictions. The median single-family height limit is 30 feet, and the median multifamily height limit is 35 feet, only marginally higher.
Nearly all jurisdictions impose minimum lot sizes and widths for single-family housing, as well as requirements for front, side, and back setbacks. Slightly over two-thirds of jurisdictions also have minimum lot dimensions and setback standards for multifamily housing. The medians of these zoning standards are identical for single-family and multifamily development. Minimum lot dimensions might be expected to be consistent
11
regardless of the type of housing, but it is somewhat surprising that multifamily housing is often subject to similar setback requirements as single-family housing.
Table 2. Zoning Standards
Percent with Standards Median Standard
Single- Family
Multi- family Single-Family Multi-
family Min. Lot Size 90% 79% 6000 sq ft 6000 sq ft
Min. Lot Width 85% 73% 60 ft 60 ft
Front Setback 93% 84% 20 ft 20 ft
Side Setback 89% 80% 5 ft 5 ft
Back Setback 90% 84% 15 ft 15 ft
Max. Lot Coverage 69% 64% 40% of lot 55% of lot
Max. Floor Area/Lot 27% 19% 50% of lot 65% of lot
Height Limit 91% 88% 30 ft 35 ft
Max. Density 81% 83% 7 units/acre 24 units/acre
Min. Density 42% 51% 2 units/acre 10 units/acre
Min. Unit Size 29% 29% 875 sq ft 550 sq ft
Beyond setbacks and height limits, jurisdictions have several other ways to define the size of buildings allowed on a lot. Maximum density standards limit the number of units per acre. Lot coverage standards restrict the building footprint to a certain percentage of the lot. Maximum floor area ratios (FARs) limit the total square footage that can be built relative to the size of the lot, including the area of the ground floor and any upper floors. All of these standards regulate how much housing can be built on a lot, influencing both the density of housing and the number of new units.
Over eight in ten jurisdictions use maximum density standards. The median density standard for single-family housing is far lower than for multifamily housing, at seven units per acre for single-family and 24 units per acre for multifamily housing. However, achieving those maximum densities for multifamily depends on the other standards in place in the jurisdiction. About two-thirds of jurisdictions have lot coverage restrictions. The median single-family lot coverage restriction is 40 percent of the lot, and the median multifamily lot coverage restriction is 55 percent of the lot. Fewer jurisdictions use maximum FARs. Only 27 percent have single-family FAR limits, and only 19 percent have multifamily FAR limits. Maximum FARs tend to be slightly higher than lot coverage limits, at 50 percent of the lot for single-family and 65 percent of the lot for multifamily housing.
12
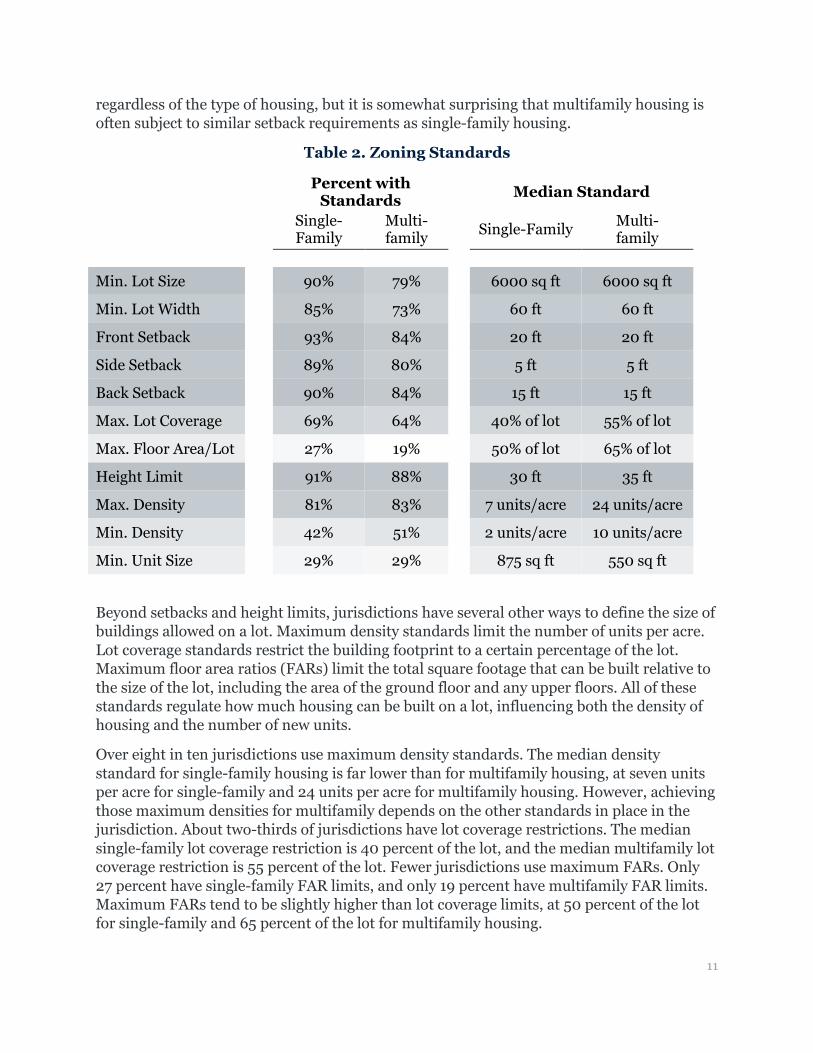
Zoning exceptions are most often requested for multifamily parking requirements, single-family and multifamily setbacks, and lot coverage. Projects may not conform with zoning standards for a variety of reasons: a proposed building may cover more of the lot than allowed, exceed height limits, or include fewer parking spaces than required by the code. When projects depart from zoning standards, developers must apply for a variance, conditional use permit, or amendment to the zoning code or general plan. These projects must undergo increased levels of discretionary review. We asked planners how often projects request variances or other exceptions to zoning standards in their jurisdiction. Zoning exceptions are most common for single-family and multifamily setbacks and lot coverage limits, as well as multifamily parking requirements (Figure 2).
Figure 2. Zoning Variances
On average, less than 25 percent of land within jurisdictions is zoned for multifamily housing development. We asked planners about the share of land area in their jurisdiction where single-family housing, multifamily housing, and non-residential uses are allowed. Most jurisdictions devote the majority of their land to single-family housing (Figure 3). A substantially smaller proportion of land is zoned for non-residential uses. Even less is available for multifamily housing. In two-thirds of jurisdictions, multifamily housing is allowed on less than 25 percent of land. As shown in Figure 4, this is the case even in many of the major urban centers in metropolitan areas in the state.

13
Figure 3. Land Zoned for Residential and Non-Residential Uses
Figure 4. Percentage of Land Where Multifamily Housing is Allowed in the Primary Cities of the Major Metropolitan Areas in California
14
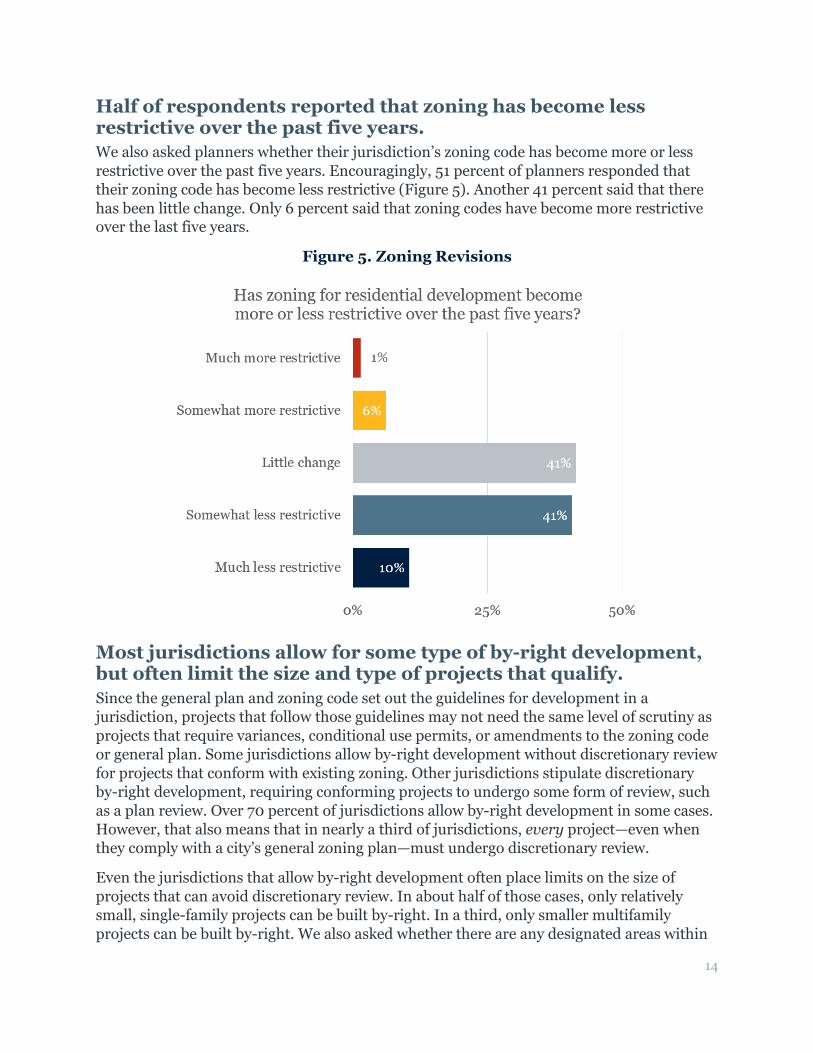
Half of respondents reported that zoning has become less restrictive over the past five years. We also asked planners whether their jurisdiction’s zoning code has become more or less restrictive over the past five years. Encouragingly, 51 percent of planners responded that their zoning code has become less restrictive (Figure 5). Another 41 percent said that there has been little change. Only 6 percent said that zoning codes have become more restrictive over the last five years.
Figure 5. Zoning Revisions
Most jurisdictions allow for some type of by-right development, but often limit the size and type of projects that qualify. Since the general plan and zoning code set out the guidelines for development in a jurisdiction, projects that follow those guidelines may not need the same level of scrutiny as projects that require variances, conditional use permits, or amendments to the zoning code or general plan. Some jurisdictions allow by-right development without discretionary review for projects that conform with existing zoning. Other jurisdictions stipulate discretionary by-right development, requiring conforming projects to undergo some form of review, such as a plan review. Over 70 percent of jurisdictions allow by-right development in some cases. However, that also means that in nearly a third of jurisdictions, every project—even when they comply with a city’s general zoning plan—must undergo discretionary review.
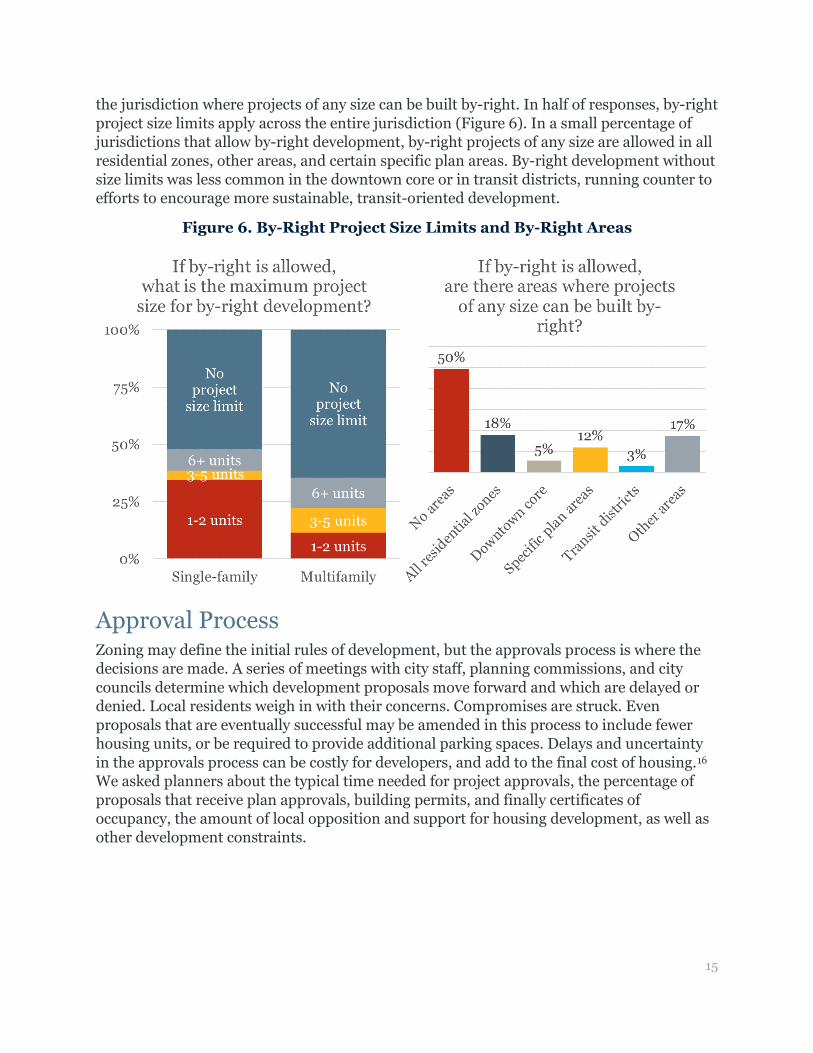
Even the jurisdictions that allow by-right development often place limits on the size of projects that can avoid discretionary review. In about half of those cases, only relatively small, single-family projects can be built by-right. In a third, only smaller multifamily projects can be built by-right. We also asked whether there are any designated areas within
15
the jurisdiction where projects of any size can be built by-right. In half of responses, by-right project size limits apply across the entire jurisdiction (Figure 6). In a small percentage of jurisdictions that allow by-right development, by-right projects of any size are allowed in all residential zones, other areas, and certain specific plan areas. By-right development without size limits was less common in the downtown core or in transit districts, running counter to efforts to encourage more sustainable, transit-oriented development.
Figure 6. By-Right Project Size Limits and By-Right Areas
Approval Process Zoning may define the initial rules of development, but the approvals process is where the decisions are made. A series of meetings with city staff, planning commissions, and city councils determine which development proposals move forward and which are delayed or denied. Local residents weigh in with their concerns. Compromises are struck. Even proposals that are eventually successful may be amended in this process to include fewer housing units, or be required to provide additional parking spaces. Delays and uncertainty in the approvals process can be costly for developers, and add to the final cost of housing.16 We asked planners about the typical time needed for project approvals, the percentage of proposals that receive plan approvals, building permits, and finally certificates of occupancy, the amount of local opposition and support for housing development, as well as other development constraints.
16
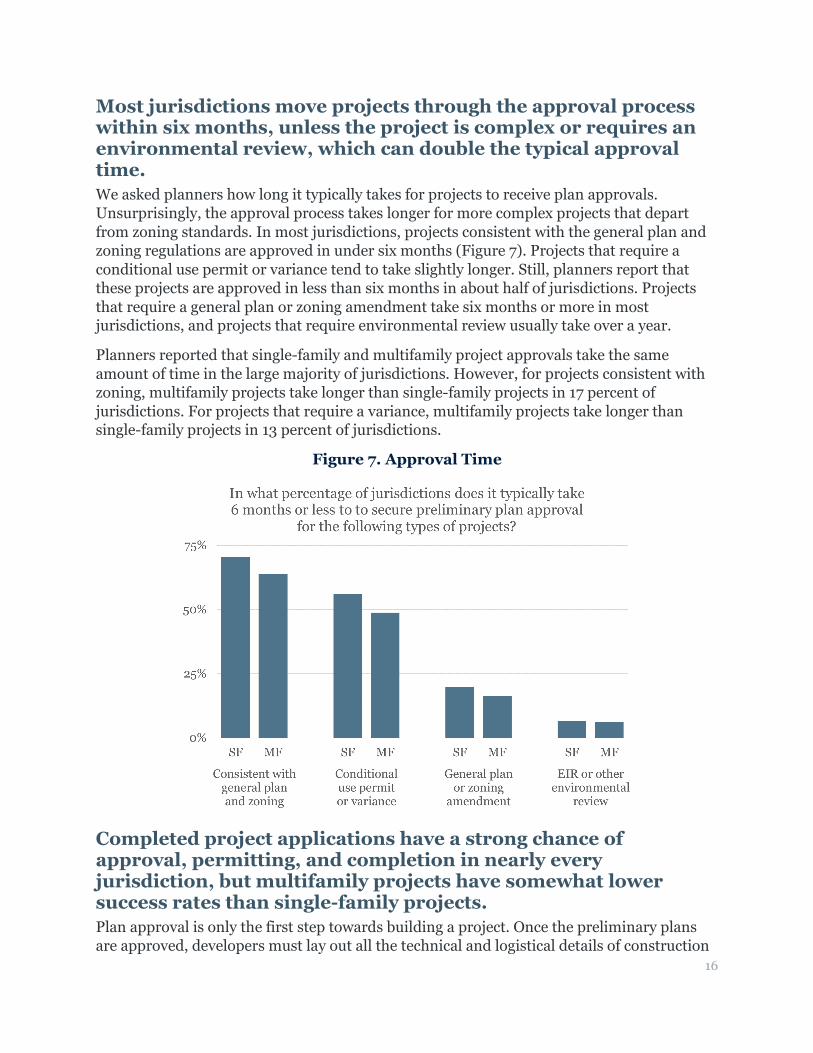
Most jurisdictions move projects through the approval process within six months, unless the project is complex or requires an environmental review, which can double the typical approval time. We asked planners how long it typically takes for projects to receive plan approvals. Unsurprisingly, the approval process takes longer for more complex projects that depart from zoning standards. In most jurisdictions, projects consistent with the general plan and zoning regulations are approved in under six months (Figure 7). Projects that require a conditional use permit or variance tend to take slightly longer. Still, planners report that these projects are approved in less than six months in about half of jurisdictions. Projects that require a general plan or zoning amendment take six months or more in most jurisdictions, and projects that require environmental review usually take over a year.
Planners reported that single-family and multifamily project approvals take the same amount of time in the large majority of jurisdictions. However, for projects consistent with zoning, multifamily projects take longer than single-family projects in 17 percent of jurisdictions. For projects that require a variance, multifamily projects take longer than single-family projects in 13 percent of jurisdictions.
Figure 7. Approval Time
Completed project applications have a strong chance of approval, permitting, and completion in nearly every jurisdiction, but multifamily projects have somewhat lower success rates than single-family projects. Plan approval is only the first step towards building a project. Once the preliminary plans are approved, developers must lay out all the technical and logistical details of construction
17
in order to obtain building permits. From there, construction must be completed in accordance with the approved plans and building codes in order to receive a certificate of occupancy.
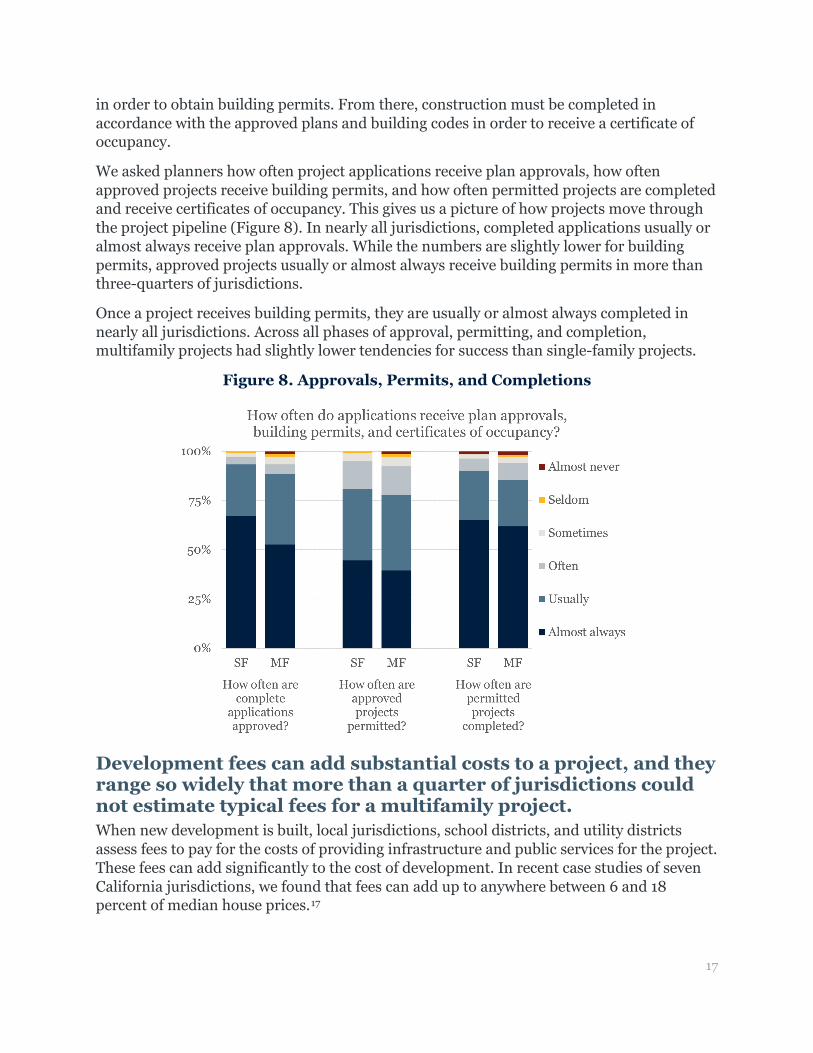
We asked planners how often project applications receive plan approvals, how often approved projects receive building permits, and how often permitted projects are completed and receive certificates of occupancy. This gives us a picture of how projects move through the project pipeline (Figure 8). In nearly all jurisdictions, completed applications usually or almost always receive plan approvals. While the numbers are slightly lower for building permits, approved projects usually or almost always receive building permits in more than three-quarters of jurisdictions.
Once a project receives building permits, they are usually or almost always completed in nearly all jurisdictions. Across all phases of approval, permitting, and completion, multifamily projects had slightly lower tendencies for success than single-family projects.
Figure 8. Approvals, Permits, and Completions
Development fees can add substantial costs to a project, and they range so widely that more than a quarter of jurisdictions could not estimate typical fees for a multifamily project. When new development is built, local jurisdictions, school districts, and utility districts assess fees to pay for the costs of providing infrastructure and public services for the project. These fees can add significantly to the cost of development. In recent case studies of seven California jurisdictions, we found that fees can add up to anywhere between 6 and 18 percent of median house prices.17
18
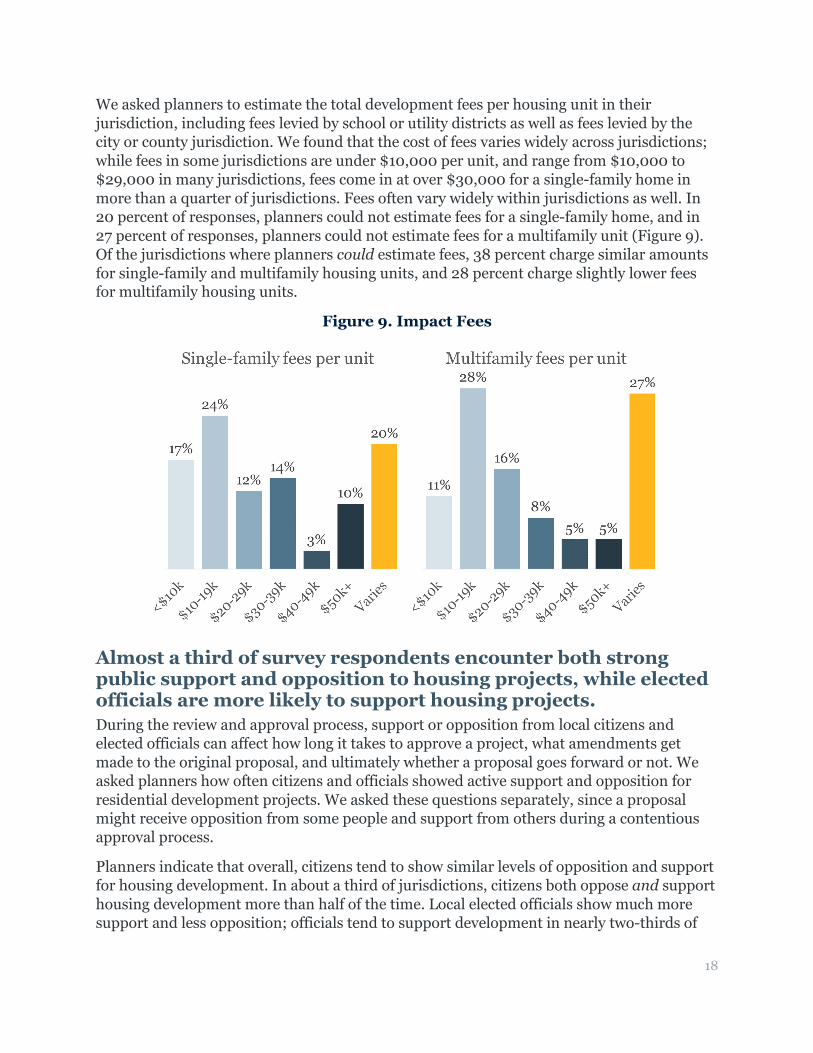
We asked planners to estimate the total development fees per housing unit in their jurisdiction, including fees levied by school or utility districts as well as fees levied by the city or county jurisdiction. We found that the cost of fees varies widely across jurisdictions; while fees in some jurisdictions are under $10,000 per unit, and range from $10,000 to $29,000 in many jurisdictions, fees come in at over $30,000 for a single-family home in more than a quarter of jurisdictions. Fees often vary widely within jurisdictions as well. In 20 percent of responses, planners could not estimate fees for a single-family home, and in 27 percent of responses, planners could not estimate fees for a multifamily unit (Figure 9). Of the jurisdictions where planners could estimate fees, 38 percent charge similar amounts for single-family and multifamily housing units, and 28 percent charge slightly lower fees for multifamily housing units.
Figure 9. Impact Fees
Almost a third of survey respondents encounter both strong public support and opposition to housing projects, while elected officials are more likely to support housing projects. During the review and approval process, support or opposition from local citizens and elected officials can affect how long it takes to approve a project, what amendments get made to the original proposal, and ultimately whether a proposal goes forward or not. We asked planners how often citizens and officials showed active support and opposition for residential development projects. We asked these questions separately, since a proposal might receive opposition from some people and support from others during a contentious approval process.
Planners indicate that overall, citizens tend to show similar levels of opposition and support for housing development. In about a third of jurisdictions, citizens both oppose and support housing development more than half of the time. Local elected officials show much more support and less opposition; officials tend to support development in nearly two-thirds of
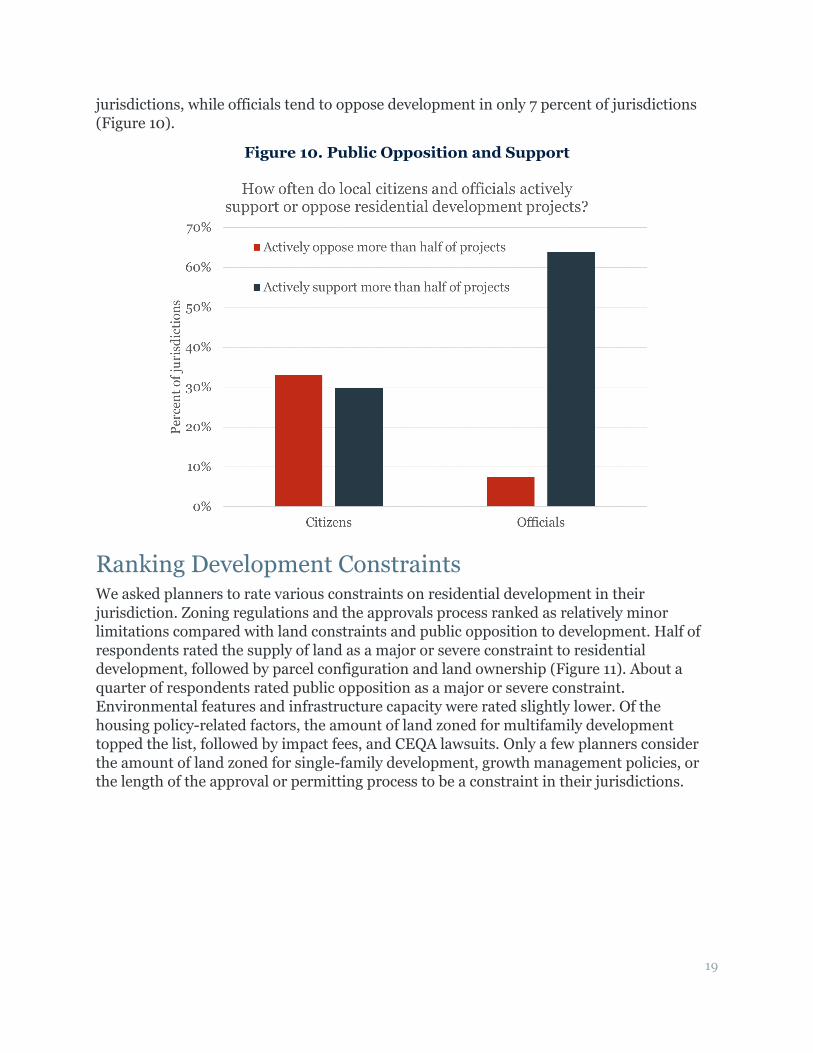
19
jurisdictions, while officials tend to oppose development in only 7 percent of jurisdictions (Figure 10).
Figure 10. Public Opposition and Support
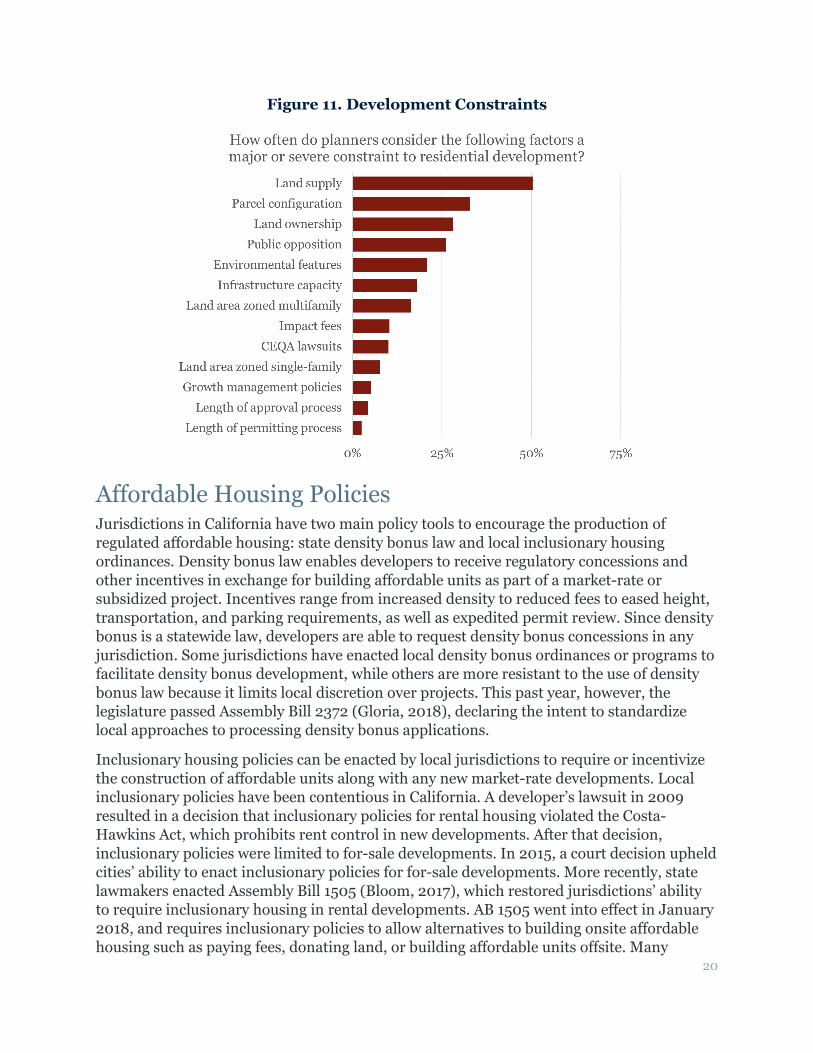
Ranking Development Constraints We asked planners to rate various constraints on residential development in their jurisdiction. Zoning regulations and the approvals process ranked as relatively minor limitations compared with land constraints and public opposition to development. Half of respondents rated the supply of land as a major or severe constraint to residential development, followed by parcel configuration and land ownership (Figure 11). About a quarter of respondents rated public opposition as a major or severe constraint. Environmental features and infrastructure capacity were rated slightly lower. Of the housing policy-related factors, the amount of land zoned for multifamily development topped the list, followed by impact fees, and CEQA lawsuits. Only a few planners consider the amount of land zoned for single-family development, growth management policies, or the length of the approval or permitting process to be a constraint in their jurisdictions.
20
Figure 11. Development Constraints
Affordable Housing Policies Jurisdictions in California have two main policy tools to encourage the production of regulated affordable housing: state density bonus law and local inclusionary housing ordinances. Density bonus law enables developers to receive regulatory concessions and other incentives in exchange for building affordable units as part of a market-rate or subsidized project. Incentives range from increased density to reduced fees to eased height, transportation, and parking requirements, as well as expedited permit review. Since density bonus is a statewide law, developers are able to request density bonus concessions in any jurisdiction. Some jurisdictions have enacted local density bonus ordinances or programs to facilitate density bonus development, while others are more resistant to the use of density bonus law because it limits local discretion over projects. This past year, however, the legislature passed Assembly Bill 2372 (Gloria, 2018), declaring the intent to standardize local approaches to processing density bonus applications.
Inclusionary housing policies can be enacted by local jurisdictions to require or incentivize the construction of affordable units along with any new market-rate developments. Local inclusionary policies have been contentious in California. A developer’s lawsuit in 2009 resulted in a decision that inclusionary policies for rental housing violated the Costa-Hawkins Act, which prohibits rent control in new developments. After that decision, inclusionary policies were limited to for-sale developments. In 2015, a court decision upheld cities’ ability to enact inclusionary policies for for-sale developments. More recently, state lawmakers enacted Assembly Bill 1505 (Bloom, 2017), which restored jurisdictions’ ability to require inclusionary housing in rental developments. AB 1505 went into effect in January 2018, and requires inclusionary policies to allow alternatives to building onsite affordable housing such as paying fees, donating land, or building affordable units offsite. Many
21
inclusionary policies already included these measures, but AB 1505 was designed to both enable inclusionary housing for jurisdictions and make it more flexible for developers.
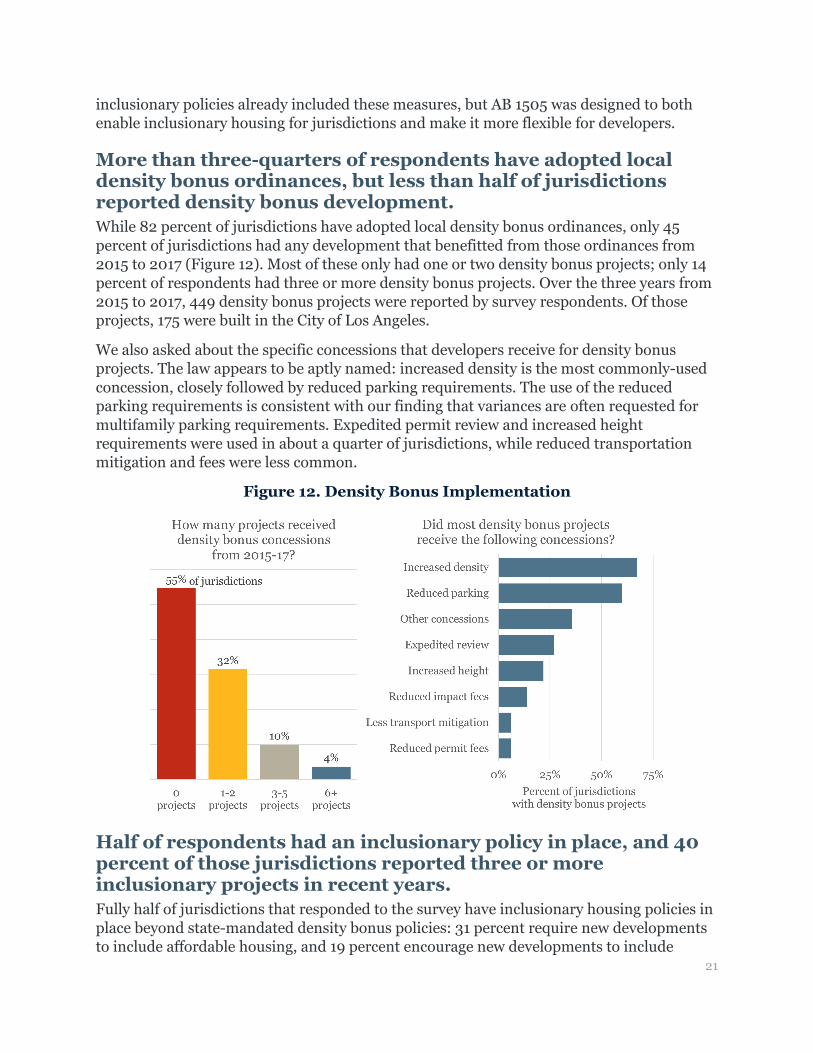
More than three-quarters of respondents have adopted local density bonus ordinances, but less than half of jurisdictions reported density bonus development. While 82 percent of jurisdictions have adopted local density bonus ordinances, only 45 percent of jurisdictions had any development that benefitted from those ordinances from 2015 to 2017 (Figure 12). Most of these only had one or two density bonus projects; only 14 percent of respondents had three or more density bonus projects. Over the three years from 2015 to 2017, 449 density bonus projects were reported by survey respondents. Of those projects, 175 were built in the City of Los Angeles.
We also asked about the specific concessions that developers receive for density bonus projects. The law appears to be aptly named: increased density is the most commonly-used concession, closely followed by reduced parking requirements. The use of the reduced parking requirements is consistent with our finding that variances are often requested for multifamily parking requirements. Expedited permit review and increased height requirements were used in about a quarter of jurisdictions, while reduced transportation mitigation and fees were less common.
Figure 12. Density Bonus Implementation
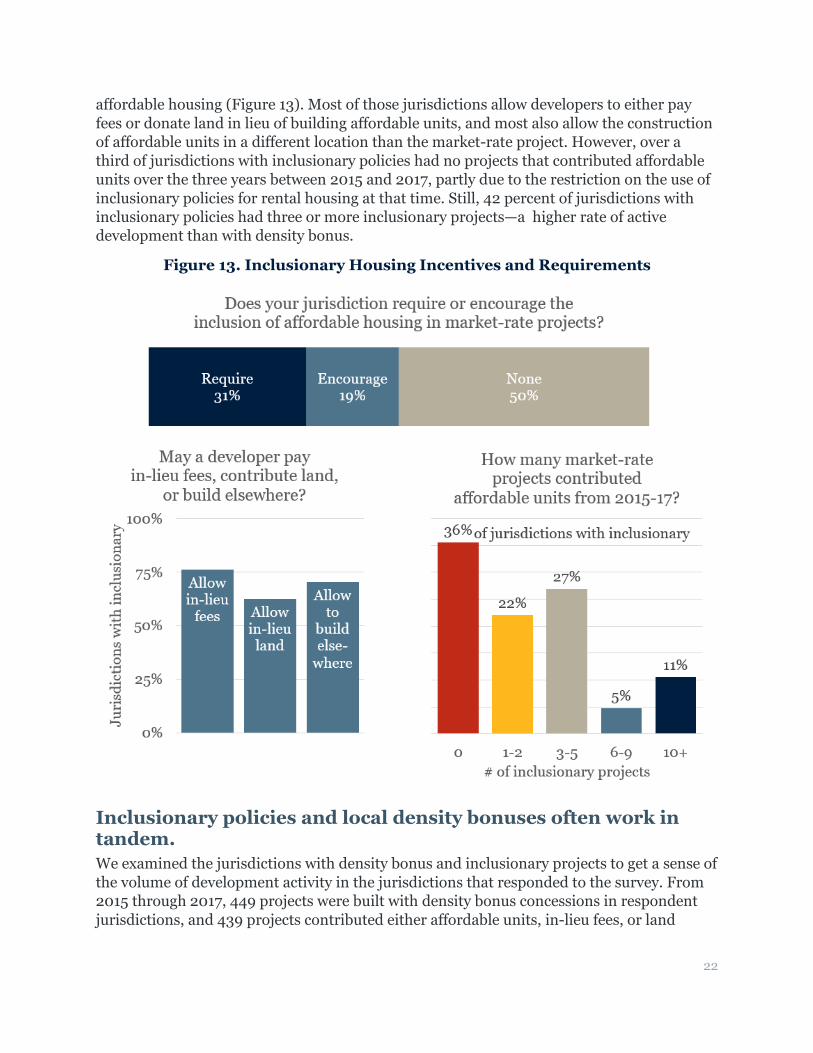
Half of respondents had an inclusionary policy in place, and 40 percent of those jurisdictions reported three or more inclusionary projects in recent years. Fully half of jurisdictions that responded to the survey have inclusionary housing policies in place beyond state-mandated density bonus policies: 31 percent require new developments to include affordable housing, and 19 percent encourage new developments to include
22
affordable housing (Figure 13). Most of those jurisdictions allow developers to either pay fees or donate land in lieu of building affordable units, and most also allow the construction of affordable units in a different location than the market-rate project. However, over a third of jurisdictions with inclusionary policies had no projects that contributed affordable units over the three years between 2015 and 2017, partly due to the restriction on the use of inclusionary policies for rental housing at that time. Still, 42 percent of jurisdictions with inclusionary policies had three or more inclusionary projects—a higher rate of active development than with density bonus.
Figure 13. Inclusionary Housing Incentives and Requirements
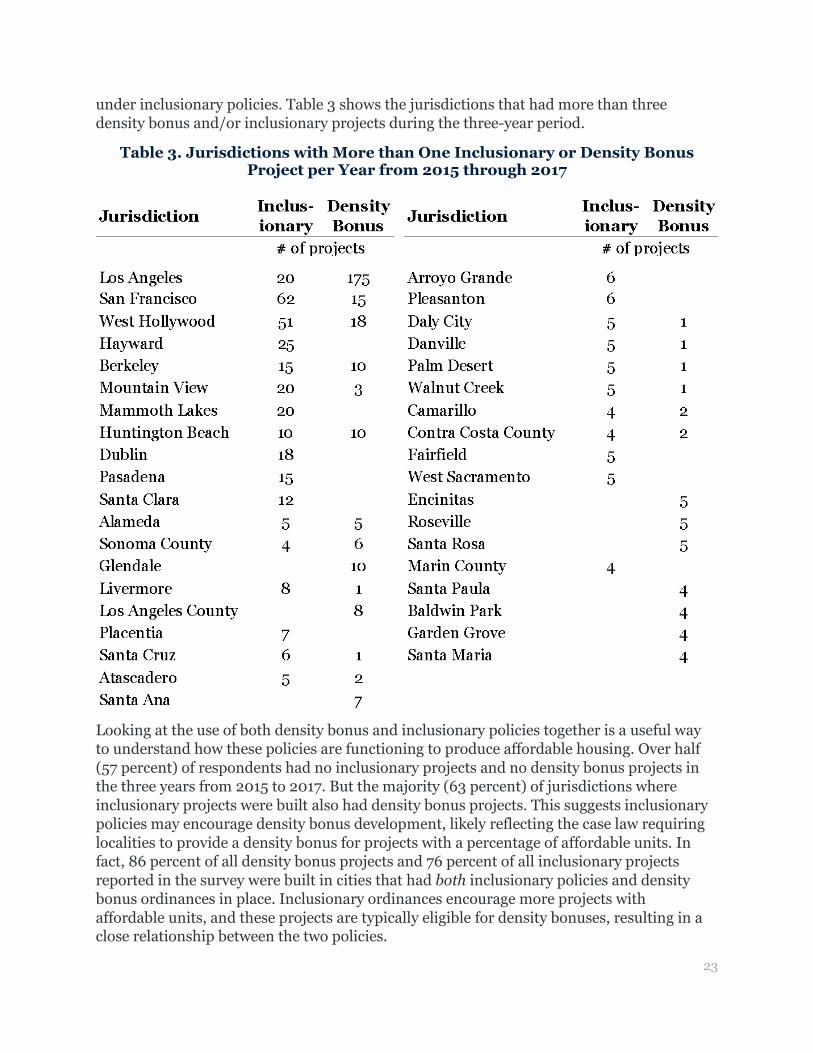
Inclusionary policies and local density bonuses often work in tandem. We examined the jurisdictions with density bonus and inclusionary projects to get a sense of the volume of development activity in the jurisdictions that responded to the survey. From 2015 through 2017, 449 projects were built with density bonus concessions in respondent jurisdictions, and 439 projects contributed either affordable units, in-lieu fees, or land
23
under inclusionary policies. Table 3 shows the jurisdictions that had more than three density bonus and/or inclusionary projects during the three-year period.
Table 3. Jurisdictions with More than One Inclusionary or Density Bonus Project per Year from 2015 through 2017
Looking at the use of both density bonus and inclusionary policies together is a useful way to understand how these policies are functioning to produce affordable housing. Over half (57 percent) of respondents had no inclusionary projects and no density bonus projects in the three years from 2015 to 2017. But the majority (63 percent) of jurisdictions where inclusionary projects were built also had density bonus projects. This suggests inclusionary policies may encourage density bonus development, likely reflecting the case law requiring localities to provide a density bonus for projects with a percentage of affordable units. In fact, 86 percent of all density bonus projects and 76 percent of all inclusionary projects reported in the survey were built in cities that had both inclusionary policies and density bonus ordinances in place. Inclusionary ordinances encourage more projects with affordable units, and these projects are typically eligible for density bonuses, resulting in a close relationship between the two policies.
24
Rental Regulations Beyond the development of new housing, jurisdictions can implement policies to preserve the rental housing stock and protect tenants from rent increases and evictions. We asked planners whether jurisdictions have rental conversion, rent control, and just cause eviction ordinances. About half of jurisdictions have rental conversion ordinances, but very few cities have either rent control or just cause eviction ordinances.
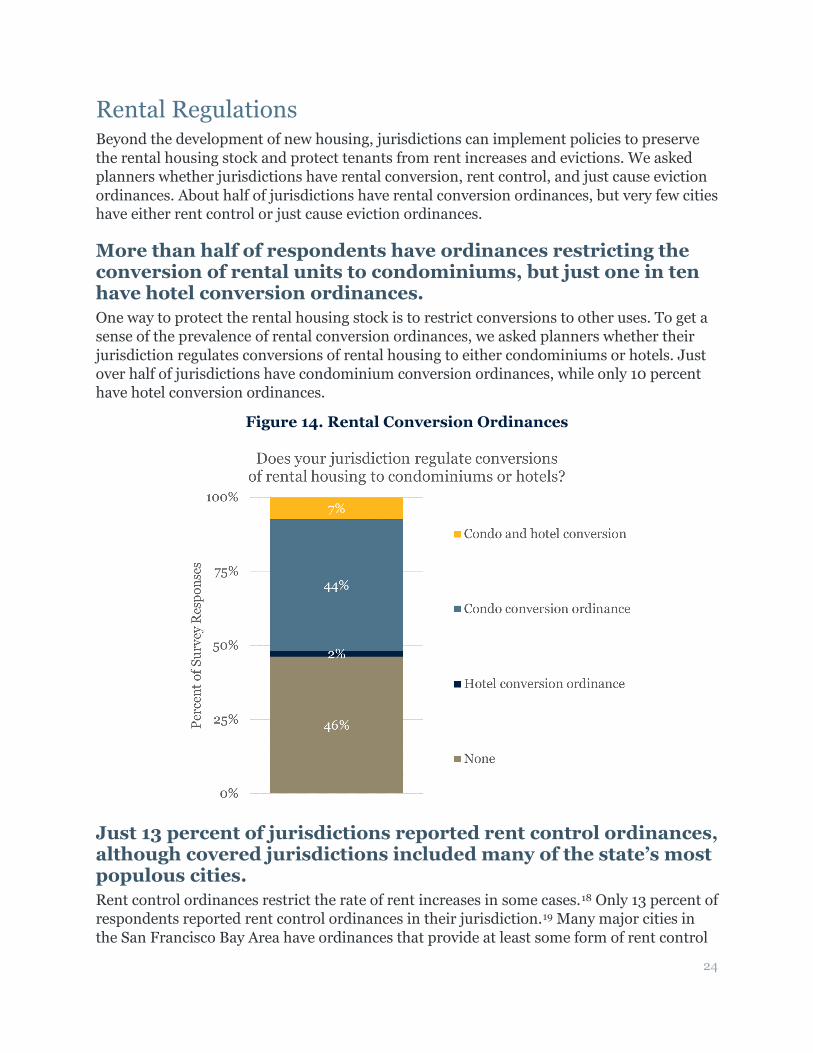
More than half of respondents have ordinances restricting the conversion of rental units to condominiums, but just one in ten have hotel conversion ordinances. One way to protect the rental housing stock is to restrict conversions to other uses. To get a sense of the prevalence of rental conversion ordinances, we asked planners whether their jurisdiction regulates conversions of rental housing to either condominiums or hotels. Just over half of jurisdictions have condominium conversion ordinances, while only 10 percent have hotel conversion ordinances.
Figure 14. Rental Conversion Ordinances
Just 13 percent of jurisdictions reported rent control ordinances, although covered jurisdictions included many of the state’s most populous cities. Rent control ordinances restrict the rate of rent increases in some cases.18 Only 13 percent of respondents reported rent control ordinances in their jurisdiction.19 Many major cities in the San Francisco Bay Area have ordinances that provide at least some form of rent control
25
(San Francisco, San Jose, Oakland, Berkeley, Richmond, and Mountain View, among others), as well as several cities in the Los Angeles and San Diego areas (Los Angeles, Riverside, Palm Springs, Beverly Hills, West Hollywood, Chula Vista, Oceanside, and Escondido, among others). Only five jurisdictions outside these major metropolitan areas reported rent control ordinances (Arcata, Jackson, Marina, Riverbank, and San Luis Obispo county).
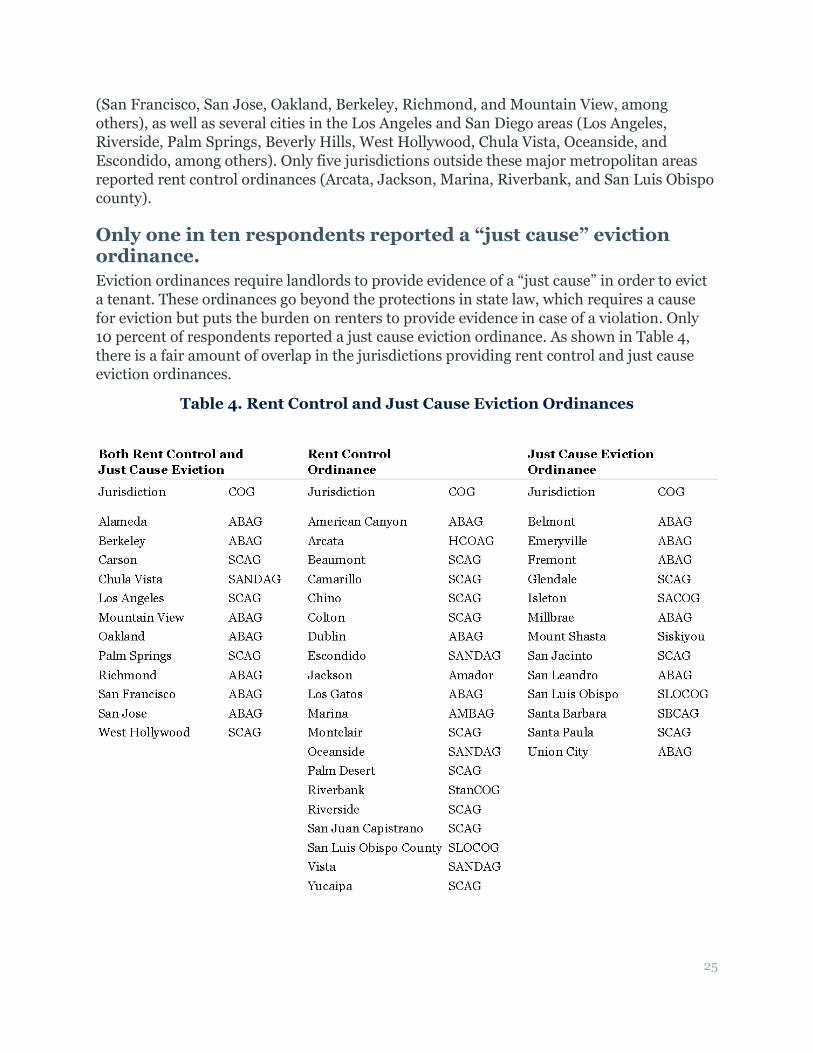
Only one in ten respondents reported a “just cause” eviction ordinance. Eviction ordinances require landlords to provide evidence of a “just cause” in order to evict a tenant. These ordinances go beyond the protections in state law, which requires a cause for eviction but puts the burden on renters to provide evidence in case of a violation. Only 10 percent of respondents reported a just cause eviction ordinance. As shown in Table 4, there is a fair amount of overlap in the jurisdictions providing rent control and just cause eviction ordinances.
Table 4. Rent Control and Just Cause Eviction Ordinances
26
Conclusion The goal of this survey is to better understand how jurisdictions either support or prevent new housing development, and specifically highlight policies that may play a role in the production of affordable housing. Not all factors influencing housing production are controlled by local governments: land supply, federal subsidies, and materials and labor costs all fall mostly outside the realm of local planning and regulations. However, local regulations and processes are also critical in shaping how much housing is built, and at what levels of affordability.
The survey results offer insights about the implementation of specific policies and programs across California’s jurisdictions, and may point towards “easy fixes” that would both reduce the administrative burden of development and development costs. For example, the data on zoning exceptions implies that some jurisdictions could revise their multifamily parking standards, as well as setbacks and lot coverage limits, so that fewer projects need to request variances that add to the entitlement timeline. The survey also can inform current policy discussions. For example, the survey results suggest that inclusionary housing policies may spur the use of density bonus provisions, leading to further questions about the relationship between state and local affordable housing incentives. The evidence of the limited use of rent control and just cause evictions ordinances could also help to inform ongoing discussions over avenues for expanding renter protections. The report also reveals the many ways cities may be limiting new housing production, including zoning little land for multifamily housing or imposing significant restrictions on how much could be built on existing lots.
Just as importantly, however, we conducted this survey to spur further research into the relationship between local land use and housing policies and the core challenges facing California, including affordable housing, climate change, and equity. We hope that by making the data publicly available, researchers, advocates, and planners themselves will use the data to explore and answer pressing questions about the policies and practices that affect the magnitude, type, and distribution of housing development across California.
27
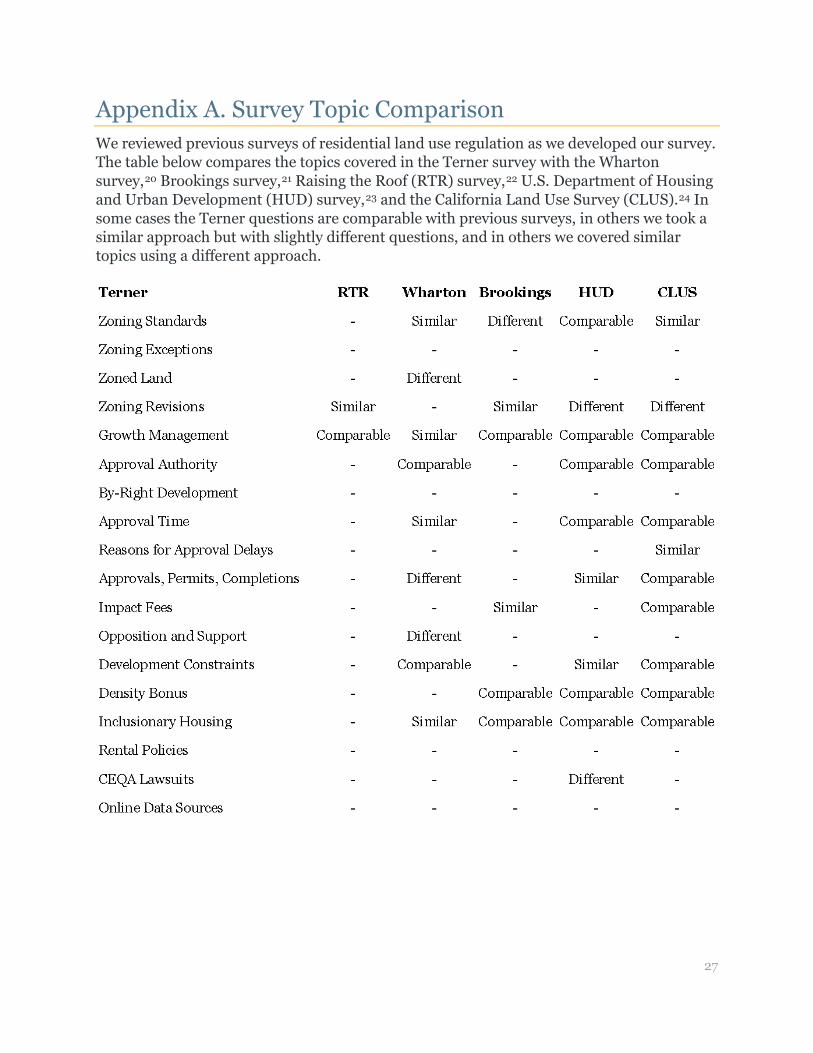
Appendix A. Survey Topic Comparison We reviewed previous surveys of residential land use regulation as we developed our survey. The table below compares the topics covered in the Terner survey with the Wharton survey,20 Brookings survey,21 Raising the Roof (RTR) survey,22 U.S. Department of Housing and Urban Development (HUD) survey,23 and the California Land Use Survey (CLUS).24 In some cases the Terner questions are comparable with previous surveys, in others we took a similar approach but with slightly different questions, and in others we covered similar topics using a different approach.

28
Appendix B. Survey Instrument
Jurisdiction and Respondent Information Jurisdiction Name
________________________________________________ Respondent Information Identifying information is for internal records only and will not be published or released.
Name: ________________________________________________
Phone Number: ________________________________________________
Email Address: ________________________________________________
Job Title: ________________________________________________ How long have you served in your current position? How long with your current department (in any capacity)?
Years in current position: __________
Years with current department: __________ Would you like to receive the results from this survey and a brief report of the findings?
○No ○Yes
29
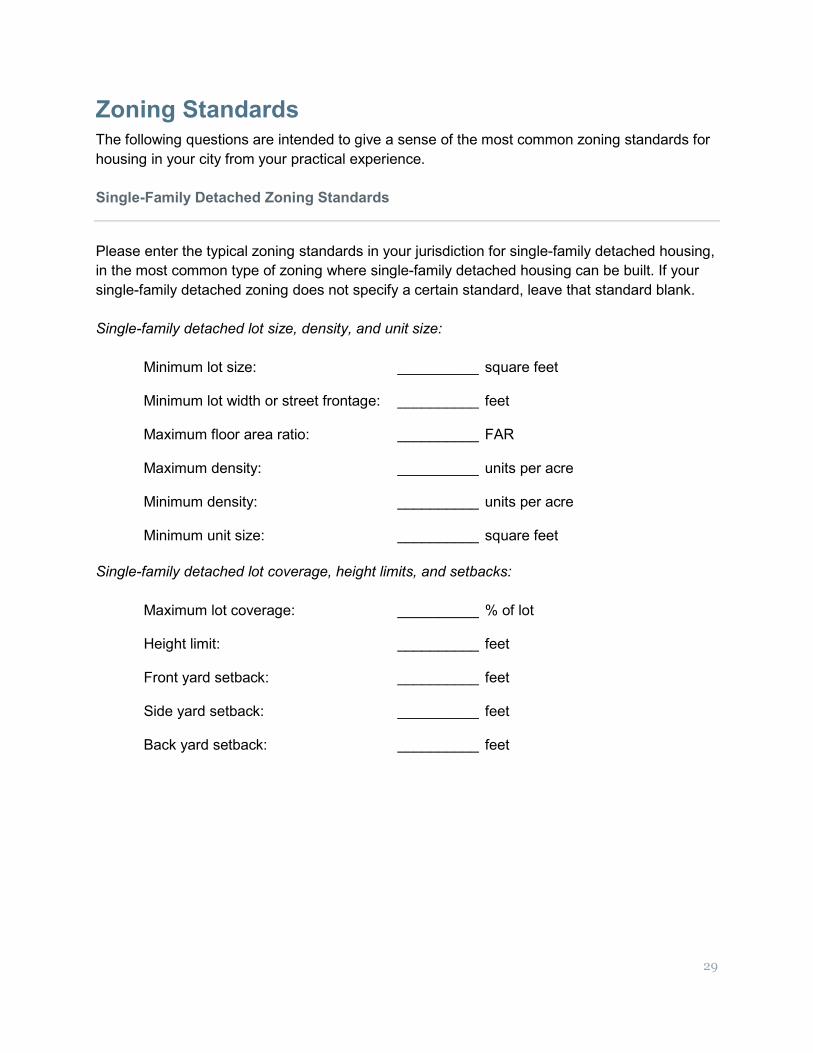
Zoning Standards The following questions are intended to give a sense of the most common zoning standards for housing in your city from your practical experience. Single-Family Detached Zoning Standards
Please enter the typical zoning standards in your jurisdiction for single-family detached housing, in the most common type of zoning where single-family detached housing can be built. If your single-family detached zoning does not specify a certain standard, leave that standard blank. Single-family detached lot size, density, and unit size:
Minimum lot size: __________ square feet Minimum lot width or street frontage: __________ feet Maximum floor area ratio: __________ FAR Maximum density: __________ units per acre Minimum density: __________ units per acre Minimum unit size: __________ square feet
Single-family detached lot coverage, height limits, and setbacks:
Maximum lot coverage: __________ % of lot Height limit: __________ feet Front yard setback: __________ feet Side yard setback: __________ feet Back yard setback: __________ feet
30
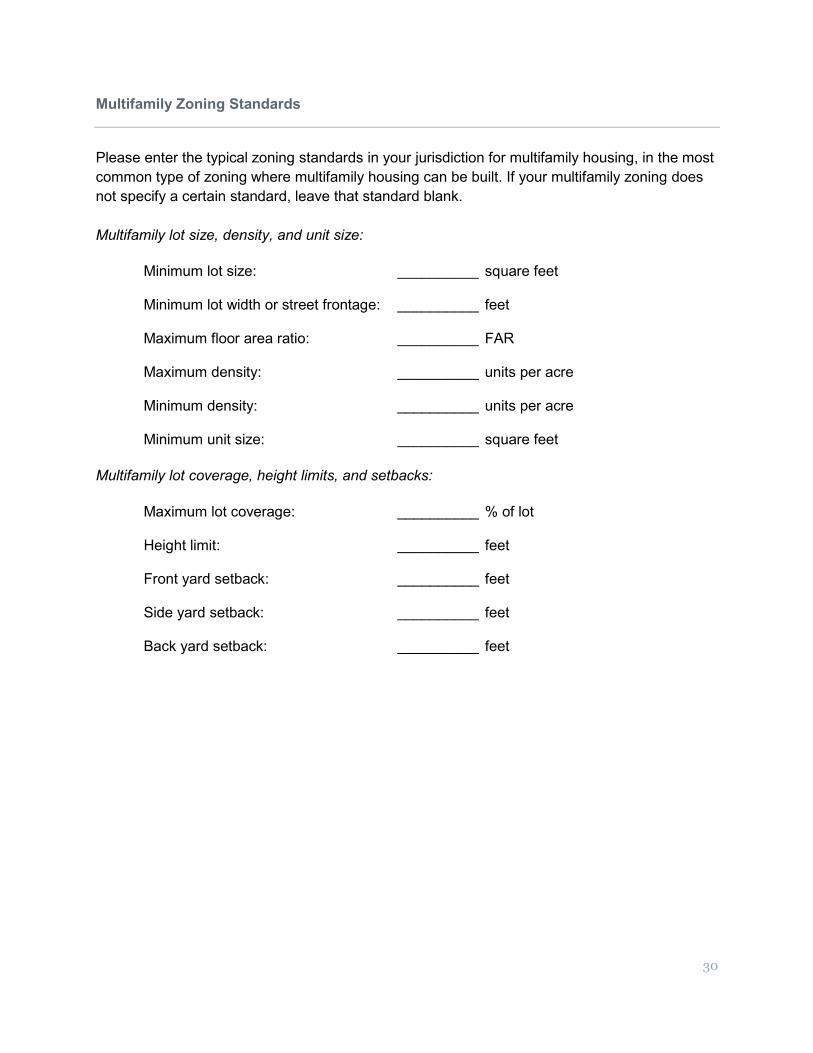
Multifamily Zoning Standards
Please enter the typical zoning standards in your jurisdiction for multifamily housing, in the most common type of zoning where multifamily housing can be built. If your multifamily zoning does not specify a certain standard, leave that standard blank. Multifamily lot size, density, and unit size:
Minimum lot size: __________ square feet Minimum lot width or street frontage: __________ feet Maximum floor area ratio: __________ FAR Maximum density: __________ units per acre Minimum density: __________ units per acre Minimum unit size: __________ square feet
Multifamily lot coverage, height limits, and setbacks:
Maximum lot coverage: __________ % of lot Height limit: __________ feet Front yard setback: __________ feet Side yard setback: __________ feet Back yard setback: __________ feet
31
Single-Family Detached Parking Standards
Please describe the typical parking standards in your jurisdiction for a 3 bedroom single-family detached house.
Total off-street parking: __________ spaces Covered off-street parking: __________ spaces Uncovered off-street parking: __________ spaces
Is tandem parking allowed for single-family detached houses?
○No ○Yes
Multifamily Parking Standards
How many parking spaces are typically required for a 2-bedroom apartment in a multifamily building?
Resident parking: __________ spaces Guest parking: __________ spaces
Does your jurisdiction require covered parking for multifamily buildings?
○No ○Yes
Does your jurisdiction require garages for multifamily buildings?
○No ○Yes
Is tandem parking allowed for multifamily buildings?
○No ○Yes
32
Accessory Dwelling Units (ADUs)
Please enter the typical standards and fees in your jurisdiction for ADUs.
Minimum lot size where ADUs are allowed: __________ square feet Maximum ADU size: __________ square feet Off street parking: __________ spaces Total fees for a typical ADU: __________ $
Has your jurisdiction adopted a local ordinance that allows ADU construction on most single-family lots with timely ministerial review, reduced fees, and reduced parking requirements?
○No local ADU ordinance
○In process of adopting local ADU ordinance
○Yes, local ADU ordinance adopted
33
Zoning Variances and Exceptions
How often do single-family detached project applicants in your jurisdiction request variances or other exceptions to zoning standards?
Almost never (0-5%)
Seldom (6-25%)
Sometimes (26-50%)
Often (51-75%)
Usually (76-95%)
Almost always
(96-100%) Lot size or
width: o o o o o o Height limits: o o o o o o
Setbacks or lot
coverage: o o o o o o
Parking: o o o o o o How often do multifamily project applicants in your jurisdiction request variances or other exceptions to zoning standards?
Almost never (0-5%)
Seldom (6-25%)
Sometimes (26-50%)
Often (51-75%)
Usually (76-95%)
Almost always
(96-100%) FAR or density: o o o o o o Height limits: o o o o o o
Setbacks or lot
coverage: o o o o o o
Parking: o o o o o o

34
Land Use and Growth Land Zoned for Residential and Other Uses
We are interested in learning how much of the developed or developable land in your jurisdiction is zoned for residential development and other uses. Roughly how much land is zoned to allow single-family detached housing? Please include zoning that also allows other uses in addition to single-family detached housing.
Almost none
(0-5%)
Little (6-25%)
Some (26-50%)
A lot (51-75%)
Most (76-95%)
Almost all
(96-100%)
o o o o o o Roughly how much land is zoned to allow multifamily housing? Please include zoning that also allows other uses in addition to multifamily housing.
Almost none
(0-5%)
Little (6-25%)
Some (26-50%)
A lot (51-75%)
Most (76-95%)
Almost all
(96-100%)
o o o o o o Roughly how much land is zoned to allow non-residential uses (commercial, industrial, agricultural, etc.)? Please include zoning that also allows residential uses.
Almost none
(0-5%)
Little (6-25%)
Some (26-50%)
A lot (51-75%)
Most (76-95%)
Almost all
(96-100%)
o o o o o o

35
Specific Plans and Rezoning
Does your jurisdiction use specific plans to designate special zoning for certain areas?
○No ○Yes
In any revisions to your jurisdiction’s zoning regulations over the past 5 years, has zoning for residential development become more or less restrictive in general?
o Much less restrictive
o Somewhat less restrictive
o Little change
o Somewhat more restrictive
o Much more restrictive What year was the most recent comprehensive revision of your jurisdiction's general plan and/or zoning regulations?
__________ year
36
Growth Management
Is your jurisdiction subject to a policy to limit development beyond a boundary within or adjacent to your jurisdiction, such as an urban growth boundary or urban service area?
○No ○Yes
Has your jurisdiction annexed new land areas to allow for additional growth in the past five years?
○No ○Yes
IF NO: Is any land available for annexation?
○No ○Yes
IF YES: Was the annexation made in order to accommodate new residential development?
o No, the annexed land was already developed or intended for another purpose.
o Yes, the annexed land was intended to accommodate new residential development.
Does your jurisdiction place a limit on the number of housing units that can be built in a year?
○No ○Yes
IF YES: What is the limit on the number of housing units that can be built in a year? Building limit: __________ housing units
37
Approval Process Who is typically authorized to grant preliminary plat/plan approval for the following types of development applications? Single-family detached subdivisions with 5 or more homes:
o Jurisdiction staff or zoning administrator
o Planning board or commission
o City council or other elected legislative body Multifamily or townhome projects with 5 or more units:
o Jurisdiction staff or zoning administrator
o Planning board or commission
o City council or other elected legislative body
38
By-Right Development
Does your jurisdiction allow by-right development without discretionary review for some types of projects, or in some areas of your jurisdiction?
○No ○Yes
Is there a project size limit for by-right development without discretionary review in areas zoned for residential development in your jurisdiction?
Is there a project size limit for by-right development?
Maximum project size for by-right
development: No Yes # units
Single-family detached: o o
Multifamily or townhome: o o Are there areas within your jurisdiction where projects of any size can be built by-right without discretionary review (by-right districts or planning areas)? Please check all that apply.
▢ There are no areas where projects of any size can be built by-right
▢ Projects of any size can be built by-right in all residential zones
▢ Projects of any size can be built by-right in the downtown core
▢ Projects of any size can be built by-right in some specific plan areas
▢ Projects of any size can be built by-right in transit districts
▢ Projects of any size can be built by-right in other areas
39
Approval Time
What is the typical time to secure preliminary plat/plan approval for the most common applications for the following types of development, starting from the time the application is deemed complete? Projects with 5 or more units consistent with general plan and zoning:
Less than 2 months
2 to 6 months
6 to 12 months
More than a year
The times vary so
much it is impossible
to say
No recent projects of this type
Single-family detached: o o o o o o
Multifamily or townhome: o o o o o o
Projects with 5 or more units that require a conditional use permit or variance:
Less than 2 months
2 to 6 months
6 to 12 months
More than a year
The times vary so
much it is impossible
to say
No recent projects of this type
Single-family detached: o o o o o o
Multifamily or townhome: o o o o o o
40
Approval Time
What is the typical time to secure preliminary plat/plan approval for the most common applications for the following types of development, starting from the time the application is deemed complete? Projects with 5 or more units that require a general plan or zoning amendment:
Less than 2 months
2 to 6 months
6 to 12 months
More than a year
The times vary so
much it is impossible
to say
No recent projects of this type
Single-family detached: o o o o o o
Multifamily or townhome: o o o o o o
Projects with 5 or more units that require an EIR or similar environmental review process:
Less than 2 months
2 to 6 months
6 to 12 months
More than a year
The times vary so
much it is impossible
to say
No recent projects of this type
Single-family detached: o o o o o o
Multifamily or townhome: o o o o o o
41
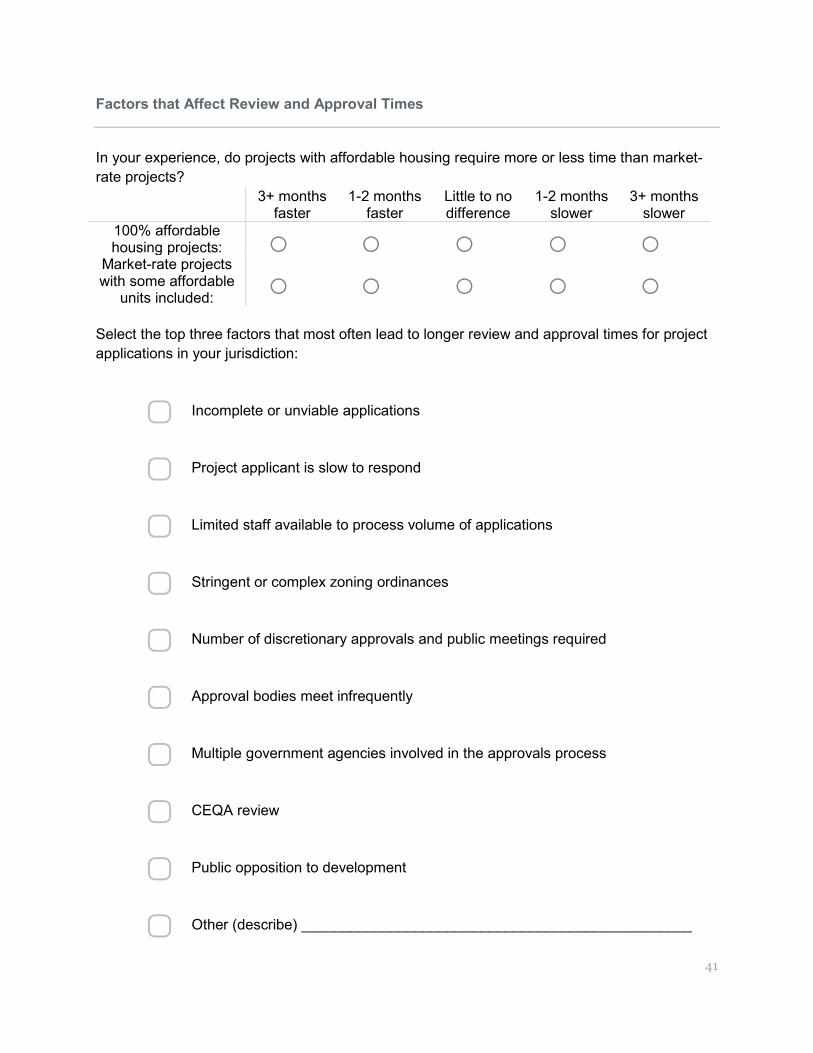
Factors that Affect Review and Approval Times
In your experience, do projects with affordable housing require more or less time than market-rate projects?
3+ months faster
1-2 months faster
Little to no difference
1-2 months slower
3+ months slower
100% affordable housing projects: o o o o o
Market-rate projects with some affordable
units included: o o o o o
Select the top three factors that most often lead to longer review and approval times for project applications in your jurisdiction:
▢ Incomplete or unviable applications
▢ Project applicant is slow to respond
▢ Limited staff available to process volume of applications
▢ Stringent or complex zoning ordinances
▢ Number of discretionary approvals and public meetings required
▢ Approval bodies meet infrequently
▢ Multiple government agencies involved in the approvals process
▢ CEQA review
▢ Public opposition to development
▢ Other (describe) ________________________________________________
42
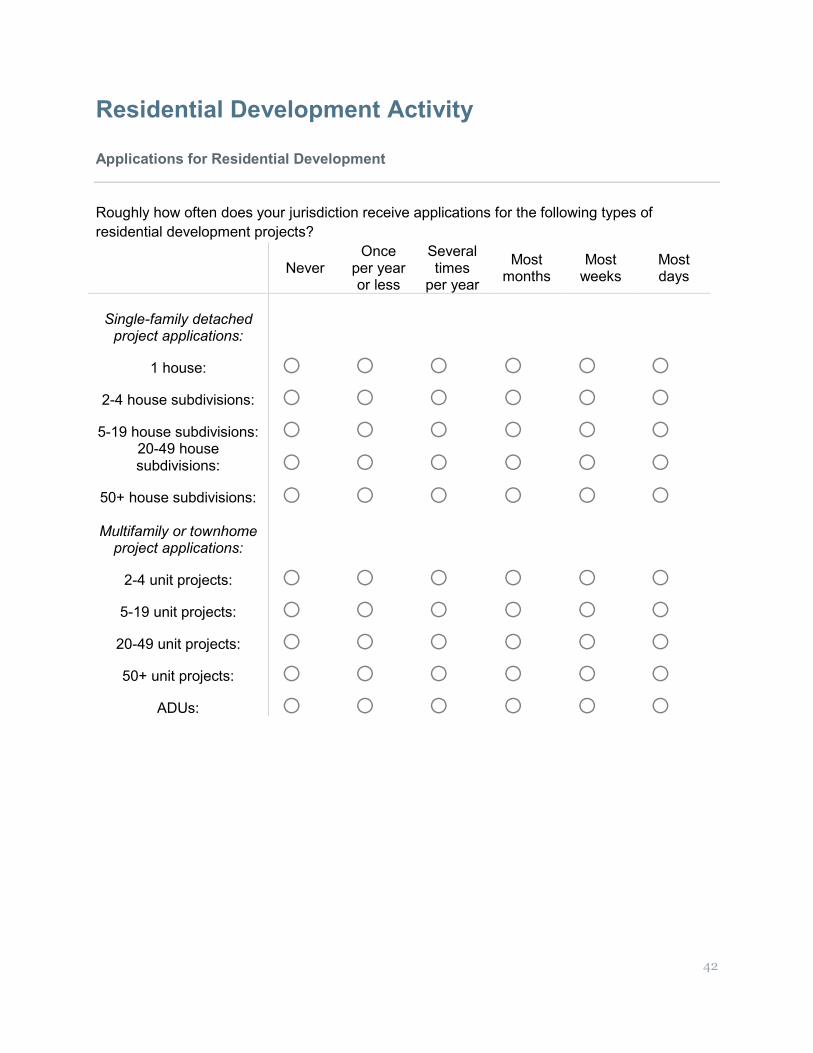
Residential Development Activity Applications for Residential Development
Roughly how often does your jurisdiction receive applications for the following types of residential development projects?
Never Once
per year or less
Several times
per year
Most months
Most weeks
Most days
Single-family detached
project applications:
1 house: o o o o o o
2-4 house subdivisions: o o o o o o
5-19 house subdivisions: o o o o o o 20-49 house subdivisions: o o o o o o
50+ house subdivisions: o o o o o o
Multifamily or townhome project applications:
2-4 unit projects: o o o o o o
5-19 unit projects: o o o o o o
20-49 unit projects: o o o o o o
50+ unit projects: o o o o o o
ADUs: o o o o o o
43
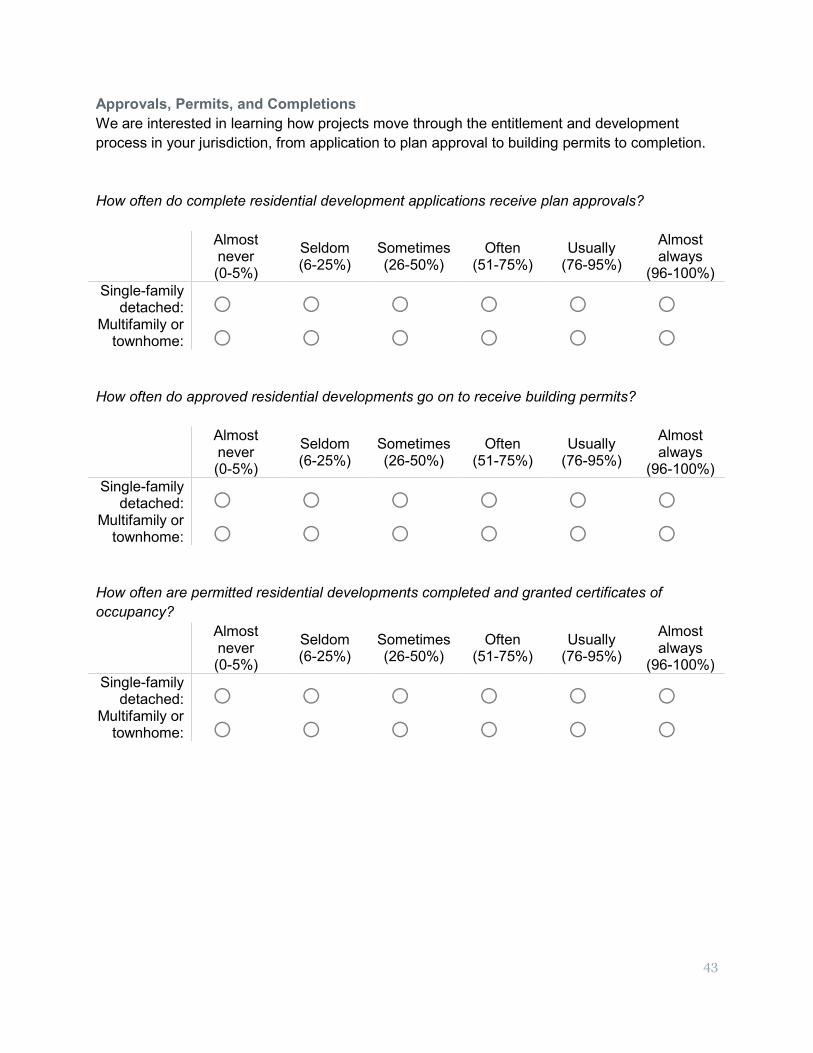
Approvals, Permits, and Completions We are interested in learning how projects move through the entitlement and development process in your jurisdiction, from application to plan approval to building permits to completion. How often do complete residential development applications receive plan approvals?
Almost never (0-5%)
Seldom (6-25%)
Sometimes (26-50%)
Often (51-75%)
Usually (76-95%)
Almost always
(96-100%) Single-family
detached: o o o o o o Multifamily or
townhome: o o o o o o How often do approved residential developments go on to receive building permits?
Almost never (0-5%)
Seldom (6-25%)
Sometimes (26-50%)
Often (51-75%)
Usually (76-95%)
Almost always
(96-100%) Single-family
detached: o o o o o o Multifamily or
townhome: o o o o o o How often are permitted residential developments completed and granted certificates of occupancy?
Almost never (0-5%)
Seldom (6-25%)
Sometimes (26-50%)
Often (51-75%)
Usually (76-95%)
Almost always
(96-100%) Single-family
detached: o o o o o o Multifamily or
townhome: o o o o o o

44
Large Projects Built Roughly how many large new construction projects and new affordable housing developments have been built and completed in your jurisdiction since January 1, 2015?
None 1-2 3-5 6-9 10+
Single-family detached projects:
20-49 house subdivisions: o o o o o
50-149 house subdivisions: o o o o o
150+ house subdivisions: o o o o o
Multifamily or townhome projects:
20-49 unit projects: o o o o o
50-149 unit projects: o o o o o
150+ unit projects: o o o o o
Affordable housing projects:
100% affordable housing projects of any size: o o o o o
Of the multifamily or townhome projects with 5 or more units built since January 1, 2015, estimate how many are intended for sale (seeking an approved condominium map) rather than for rent.
Almost none
(0-5%)
Little (6-25%)
Some (26-50%)
A lot (51-75%)
Most (76-95%)
Almost all
(96-100%)
No relevant projects
o o o o o o o Impact Fees
45
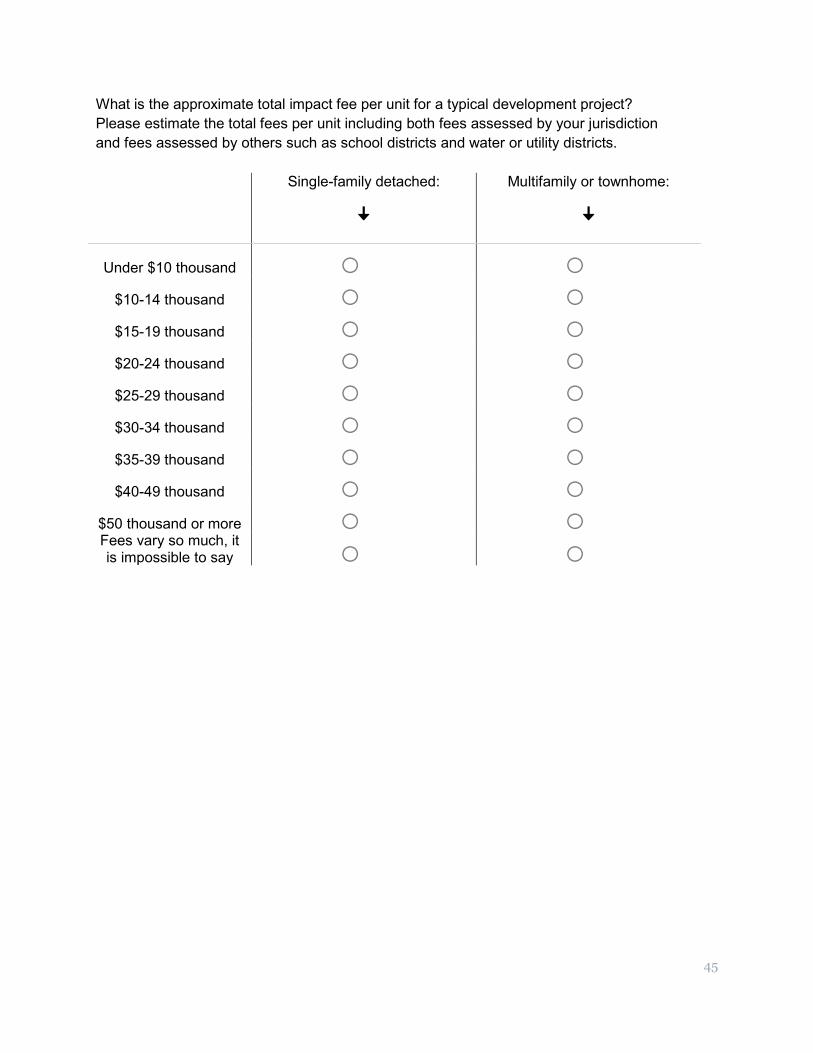
What is the approximate total impact fee per unit for a typical development project? Please estimate the total fees per unit including both fees assessed by your jurisdiction and fees assessed by others such as school districts and water or utility districts.
Single-family detached:
ꜜ Multifamily or townhome:
ꜜ
Under $10 thousand o o
$10-14 thousand o o
$15-19 thousand o o
$20-24 thousand o o
$25-29 thousand o o
$30-34 thousand o o
$35-39 thousand o o
$40-49 thousand o o
$50 thousand or more o o Fees vary so much, it is impossible to say o o
46
Residential Development Constraints We are interested in your perspective about the various factors that affect the rate of housing development in your jurisdiction. In your experience observing the development process, how much do the following factors constrain residential development?
Not a constraint
Minor constraint
Moderate constraint
Major constraint
Severe constraint
Supply of developable land: o o o o o Configuration/size/location of
available parcels: o o o o o Topography, geography, environmental features: o o o o o
Land ownership and assembly: o o o o o
Amount of land zoned for single-family development: o o o o o Amount of land zoned for multifamily development: o o o o o
Infrastructure capacity (transportation, schools,
water, sewer, parks): o o o o o
Public opposition to development: o o o o o
Local growth management policies: o o o o o
Length of planning approval process: o o o o o
Length of building permit process: o o o o o
Zoning standards: o o o o o
Impact fees and exactions: o o o o o
Threat of CEQA lawsuits: o o o o o
Other: o o o o o
47
Affordable Housing Density Bonus
Does your jurisdiction offer the following measures to ease regulatory impacts on applicants proposing projects with an affordable housing aspect? Please select all that apply.
▢ Expedited or concurrent permit review
▢ Eased height requirements
▢ Reduced parking requirements
▢ Reduced transportation mitigation requirements
▢ Reduced impact fees or infrastructure financing requirements
▢ Reduced permit fees
▢ Other mechanisms to reduce regulatory impacts: ________________________________________________
Has your jurisdiction adopted a local ordinance implementing provisions of state density bonus law?
○No ○Yes
What year was your jurisdiction's local density bonus ordinance last updated?
__________ year
48
Density Bonus
How many projects have received a density bonus or related regulatory concessions or incentives (listed above) to build affordable housing in the past three years (2015-2017)?
__________ projects Of these projects, how many received each regulatory concession or incentive?
None A few About half Most All
Increased project density: o o o o o Expedited or concurrent
permit review: o o o o o
Eased height requirements: o o o o o Reduced parking
requirements: o o o o o Reduced transportation mitigation requirements: o o o o o Reduced impact fees or infrastructure financing
requirements: o o o o o
Reduced permit fees: o o o o o Other mechanisms to
reduce regulatory impacts: o o o o o
49
Inclusionary Housing
Aside from density bonuses, does your jurisdiction require or encourage residential developers to include affordable housing in market-rate projects as a condition of approval?
o No
o Yes, inclusion of affordable units is required
o Yes, inclusion of affordable units is encouraged but not required How many units must a project have in order to be subject to inclusionary requirements or incentives?
__________ minimum units for inclusionary What percentage of units must be affordable in projects where inclusionary housing applies? Affordable for any income level (% does not vary by income level): __________ % affordable Affordable for very low income (0-50% of AMI): __________ % affordable Affordable for low income (50-80% of AMI): __________ % affordable Affordable for moderate income (80-120% of AMI): __________ % affordable May a developer pay fees in lieu of providing units?
○No ○Yes
May a developer contribute land for affordable housing production in lieu of providing units?
○No ○Yes
May a developer build the affordable units in a different location than their market-rate project?
○No ○Yes

50
How many market-rate projects contributed affordable units, in-lieu fees, or land as a result of inclusionary requirements or incentives in the past three years (2015-2017)?
__________ projects
51
Rental Policies Does your jurisdiction have an ordinance that regulates the conversion of rental units for other purposes?
o No
o Yes, ordinance regulates conversions from rentals to condominiums
o Yes, ordinance regulates conversions from rentals to hotels
o Yes, ordinances regulate conversions from rentals to both condominiums and hotels Does your jurisdiction have an ordinance that requires landlords to have just cause in order to evict a tenant?
○No ○Yes
Does your jurisdiction have a rent control ordinance that restricts rent increases in certain cases?
○No ○Yes
Are transitional and supportive housing allowed as a residential use in all residential zones?
○No ○Yes
52
Public Opposition and Support In your experience, how often do local citizens and city officials actively oppose residential development projects?
Almost never (0-5%)
Seldom (6-25%)
Sometimes (26-50%)
Often (51-75%)
Usually (76-95%)
Almost always
(96-100%) Local citizen opposition: o o o o o o
Appointed or elected official
opposition: o o o o o o
In your experience, how often do local citizens and city officials actively support residential development projects?
Almost never (0-5%)
Seldom (6-25%)
Sometimes (26-50%)
Often (51-75%)
Usually (76-95%)
Almost always
(96-100%) Local citizen
support: o o o o o o Appointed or
elected official support: o o o o o o
53
CEQA Lawsuits In your experience, how often do project approvals face CEQA lawsuits, or the threat of CEQA lawsuits?
Almost never (0-5%)
Seldom (6-25%)
Sometimes (26-50%)
Often (51-75%)
Usually (76-95%)
Almost always
(96-100%) Single-family detached:
Threat of CEQA lawsuits: o o o o o o
CEQA lawsuits: o o o o o o
Multifamily or townhome: Threat of
CEQA lawsuits: o o o o o o
CEQA lawsuits: o o o o o o How often do CEQA lawsuits or the threat of CEQA lawsuits result in substantial revisions or eventual failure of the project?
Almost never (0-5%)
Seldom (6-25%)
Sometimes (26-50%)
Often (51-75%)
Usually (76-95%)
Almost always
(96-100%) Single-family detached:
Substantial revisions: o o o o o o
Eventual failure: o o o o o o
Multifamily or townhome: Substantial revisions: o o o o o o
Eventual failure: o o o o o o
54
Planning Department Information How many employees at your jurisdiction work on planning for residential development?
Planning for residential development includes tasks such as project review and plan approvals, preparing for planning commission and city council hearings about residential development projects, working with residents and community members on issues related to housing, and dealing with zoning ordinances, the housing element of the general plan, and RHNA. This does not include issuing building permits or code enforcement.
Full time employees: ________________________________________________
Part time employees: ________________________________________________
Interns: ________________________________________________ Does your jurisdiction hire a consultant to assist with your Housing Element updates?
o No, jurisdiction staff update the Housing Element without outside assistance.
o Yes, the jurisdiction hires an outside consultant to assist with Housing Element updates. If there are any other policies, procedures, or external factors that affect residential development in your jurisdiction, please describe here:
55
Online Data
If your jurisdiction posts approvals, permit, or other project pipeline data online, please describe and provide link(s) here:
Link description URL
If your jurisdiction posts GIS shapefiles of zoning ordinances, parcel information, or other mapping resources online, please describe and provide link(s) here:
Link description URL
56
Appendix C. Respondent Jurisdictions
Southern California Association of Governments (SCAG)
1. Los Angeles County 36. Garden Grove 71. Pico Rivera 2. Orange County 37. Glendale 72. Placentia 3. San Bernardino County 38. Hesperia 73. Port Hueneme 4. Ventura County 39. Huntington Beach 74. Rancho Cucamonga 5. Anaheim 40. Imperial 75. Rancho Palos Verdes 6. Apple Valley 41. Indian Wells 76. Rancho Santa Margarita 7. Arcadia 42. Inglewood 77. Redondo Beach 8. Avalon 43. Irvine 78. Riverside 9. Baldwin Park 44. La Canada Flintridge 79. Rolling Hills Estates 10. Beaumont 45. La Habra 80. Rosemead 11. Bell 46. La Palma 81. San Bernardino 12. Bellflower 47. La Quinta 82. San Gabriel 13. Beverly Hills 48. Laguna Beach 83. San Jacinto 14. Blythe 49. Laguna Hills 84. San Juan Capistrano 15. Bradbury 50. Laguna Niguel 85. Santa Ana 16. Buena Park 51. Lake Elsinore 86. Santa Clarita 17. Camarillo 52. Lakewood 87. Santa Fe Springs 18. Carson 53. Lancaster 88. Santa Paula 19. Chino 54. Loma Linda 89. Sierra Madre 20. Coachella 55. Lomita 90. Simi Valley 21. Colton 56. Long Beach 91. South El Monte 22. Corona 57. Los Angeles 92. South Gate 23. Costa Mesa 58. Manhattan Beach 93. Stanton 24. Covina 59. Menifee 94. Temple City 25. Culver City 60. Mission Viejo 95. Torrance 26. Cypress 61. Monrovia 96. Tustin 27. Desert Hot Springs 62. Montclair 97. Twentynine Palms 28. Downey 63. Moorpark 98. Victorville 29. Duarte 64. Moreno Valley 99. West Covina 30. El Centro 65. Norwalk 100. West Hollywood 31. El Monte 66. Ontario 101. Westlake Village 32. Fillmore 67. Palm Desert 102. Westminster 33. Fontana 68. Palm Springs 103. Whittier 34. Fountain Valley 69. Paramount 104. Yorba Linda 35. Fullerton 70. Pasadena 105. Yucaipa
57
Association of Bay Area Governments (ABAG)
1. Contra Costa County 31. Half Moon Bay 61. San Bruno 2. Marin County 32. Hayward 62. San Francisco 3. San Mateo County 33. Healdsburg 63. San Jose 4. Sonoma County 34. Hillsborough 64. San Leandro 5. Alameda 35. Livermore 65. San Pablo 6. Albany 36. Los Altos 66. San Rafael 7. American Canyon 37. Los Altos Hills 67. San Ramon 8. Antioch 38. Los Gatos 68. Santa Clara 9. Atherton 39. Mill Valley 69. Santa Rosa 10. Belmont 40. Millbrae 70. Sebastopol 11. Benicia 41. Milpitas 71. South San Francisco 12. Berkeley 42. Monte Sereno 72. Union City 13. Brentwood 43. Moraga 73. Vallejo 14. Brisbane 44. Mountain View 74. Walnut Creek 15. Burlingame 45. Napa 16. Calistoga 46. Newark 17. Clayton 47. Novato 18. Cloverdale 48. Oakland 19. Colma 49. Oakley 20. Concord 50. Pacifica 21. Cupertino 51. Palo Alto 22. Daly City 52. Pinole 23. Danville 53. Pittsburg 24. Dixon 54. Pleasanton 25. Dublin 55. Redwood City 26. El Cerrito 56. Richmond 27. Emeryville 57. Rohnert Park 28. Fairfax 58. Ross 29. Fairfield 59. Saint Helena 30. Gilroy 60. San Anselmo
58
Sacramento Area Council of Governments (SACOG)
1. Yolo County 8. Rancho Cordova 2. Yuba County 9. Roseville 3. Citrus Heights 10. Sacramento 4. Davis 11. West Sacramento 5. Elk Grove 12. Woodland 6. Galt 13. Yuba City 7. Isleton
San Diego Association of Governments (SANDAG)
1. Carlsbad 8. La Mesa 2. Chula Vista 9. National City 3. Del Mar 10. Oceanside 4. El Cajon 11. San Diego 5. Encinitas 12. Solana Beach 6. Escondido 13. Vista 7. Imperial Beach
59
Other Areas in California
1. Alpine County 26. Grover Beach 51. Sanger 2. Calaveras County 27. Jackson 52. Santa Barbara 3. Glenn County 28. Kerman 53. Santa Cruz 4. San Luis Obispo County 29. Kingsburg 54. Santa Maria 5. Santa Barbara County 30. Lakeport 55. Seaside 6. Santa Cruz County 31. Lathrop 56. Shasta Lake 7. Shasta County 32. Lindsay 57. Soledad 8. Tehama County 33. Livingston 58. Stockton 9. Tulare County 34. Los Banos 59. Susanville 10. Anderson 35. Mammoth Lakes 60. Tehama 11. Arcata 36. Manteca 61. Truckee 12. Arroyo Grande 37. Marina 62. Turlock 13. Atascadero 38. Merced 63. Visalia 14. Avenal 39. Modesto 64. Watsonville 15. Bakersfield 40. Monterey 65. Weed 16. Bishop 41. Mount Shasta 66. Yreka 17. Capitola 42. Pacific Grove 18. Chico 43. Paso Robles 19. Dinuba 44. Plymouth 20. Eureka 45. Red Bluff 21. Farmersville 46. Reedley 22. Firebaugh 47. Ridgecrest 23. Fort Bragg 48. Riverbank 24. Gonzales 49. Salinas 25. Grass Valley 50. San Luis Obispo
60
Endnotes 1 Mawhorter, S., Garcia, D., & Raetz, H. (2018). It All Adds Up: The Cost of Housing Development Fees in
Seven California Cities (The Cost of Building Housing Research Series). Berkeley, CA: Terner Center for Housing Innovation at UC Berkeley.
2 Zillow. (2018). Zillow Rent Index. Retrieved from https://www.zillow.com/research/data/ 3 Glickfeld, M., & Levine, N. (1992). Regional Growth... Local Reaction: The Enactment and Effects of
Local Growth Control and Management Measures in California. Cambridge, MA: Lincoln Institute of Land Policy.
Levine, N. (1999). The Effects of Local Growth Controls on Regional Housing Production and Population Redistribution in California. Urban Studies, 36(12), 2047–2068. https://doi.org/10.1080/0042098992539
4 Landis, J. D. (2000). Raising the Roof: California Housing Development Projections and Constraints,
1997-2020. Institute of Urban & Regional Development. Retrieved from http://escholarship.org/uc/item/1391n947
5 Pendall, R., Puentes, R., & Martin, J. (2006). From Traditional to Reformed: A Review of the Land Use
Regulations in the Nation’s 50 largest Metropolitan Areas (Research Brief). Washington, D.C.: The Brookings Institution.
6 Gyourko, J., Saiz, A., & Summers, A. (2008). A New Measure of the Local Regulatory Environment for
Housing Markets: The Wharton Residential Land Use Regulatory Index. Urban Studies, 45(3), 693–729. https://doi.org/10.1177/0042098007087341
7 Burchell, R. W., & Lahr, M. L. (2008). A National Survey of Local Land-Use Regulations: Steps Toward
a Beginning Robert W. Burchell and Michael L. Lahr. 8 Jackson, K. (Kip). (2018). Regulation, land constraints, and California’s boom and bust. Regional
Science and Urban Economics, 68, 130–147. https://doi.org/10.1016/j.regsciurbeco.2017.10.005 9 Gyourko, J., Saiz, A., & Summers, A. (2008). A New Measure of the Local Regulatory Environment for
Housing Markets: The Wharton Residential Land Use Regulatory Index. Urban Studies, 45(3), 693–729. https://doi.org/10.1177/0042098007087341
10 Lens, M. C., & Monkkonen, P. (2016). Do Strict Land Use Regulations Make Metropolitan Areas More
Segregated by Income? Journal of the American Planning Association, 82(1), 6–21. https://doi.org/10.1080/01944363.2015.1111163
11 Gyourko, J., Saiz, A., & Summers, A. (2008). A New Measure of the Local Regulatory Environment for
Housing Markets: The Wharton Residential Land Use Regulatory Index. Urban Studies, 45(3), 693–729. https://doi.org/10.1177/0042098007087341
12 Pendall, R., Puentes, R., & Martin, J. (2006). From Traditional to Reformed: A Review of the Land Use
Regulations in the Nation’s 50 largest Metropolitan Areas (Research Brief). Washington, D.C.: The Brookings Institution.
13 Landis, J. D. (2000). Raising the Roof: California Housing Development Projections and Constraints,
1997-2020. Institute of Urban & Regional Development. Retrieved from http://escholarship.org/uc/item/1391n947
14 Jackson, K. (Kip). (2018). Regulation, land constraints, and California’s boom and bust. Regional
Science and Urban Economics, 68, 130–147. https://doi.org/10.1016/j.regsciurbeco.2017.10.005
61
15 Burchell, R. W., & Lahr, M. L. (2008). A National Survey of Local Land-Use Regulations: Steps
Toward a Beginning Robert W. Burchell and Michael L. Lahr. 16 Reid, C. & Raetz, H. (2018). Perspectives: Practitioners Weigh in on Drivers of Rising Housing
Construction Costs in San Francisco (The Cost of Building Housing Research Series). Berkeley, CA: Terner Center for Housing Innovation at UC Berkeley.
17 Mawhorter, S., Garcia, D., & Raetz, H. (2018). It All Adds Up: The Cost of Housing Development Fees in Seven California Cities (The Cost of Building Housing Research Series). Berkeley, CA: Terner Center for Housing Innovation at UC Berkeley.
18 According to California law, rent control ordinances can only apply to housing built before the Costa-Hawkins Rental Housing Act was passed in 1995. For cities that already had rent control ordinances in place when Costa-Hawkins was passed, only units built by the time the local ordinance took effect are subject to rent control. In addition, Costa-Hawkins exempts single-family homes and condominiums from rent control. 19 This figure includes jurisdictions with mobile home rent control ordinances. 20 Gyourko, J., Saiz, A., & Summers, A. (2008). A New Measure of the Local Regulatory Environment for
Housing Markets: The Wharton Residential Land Use Regulatory Index. Urban Studies, 45(3), 693–729. https://doi.org/10.1177/0042098007087341
21 Pendall, R., Puentes, R., & Martin, J. (2006). From Traditional to Reformed: A Review of the Land Use
Regulations in the Nation’s 50 largest Metropolitan Areas (Research Brief). Washington, D.C.: The Brookings Institution.
22 Landis, J. D. (2000). Raising the Roof: California Housing Development Projections and Constraints,
1997-2020. Institute of Urban & Regional Development. Retrieved from http://escholarship.org/uc/item/1391n947
23 Burchell, R. W., & Lahr, M. L. (2008). A National Survey of Local Land-Use Regulations: Steps
Toward a Beginning Robert W. Burchell and Michael L. Lahr. 24 Jackson, K. (Kip). (2018). Regulation, land constraints, and California’s boom and bust. Regional
Science and Urban Economics, 68, 130–147. https://doi.org/10.1016/j.regsciurbeco.2017.10.005