tensile behavior of staple spun yarn
TRANSCRIPT

1
TENSILE BEHAVIOR OF STAPLE SPUN YARN
Muhammad Zubair, M.Sc.
SUMMARY OF THE THESIS

Title of the thesis: Tensile behavior of staple spun yarn
Author: Muhammad Zubair, M.Sc. Field of study: Textile Technic and Material Engineering Mode of study: Full time Department: Department of Technologies and Structures Supervisor: prof. Ing. Bohuslav Neckář, DrSc.
Committee for the defense of the dissertation
Chairman: prof. RNDr. David Lukáš, CSc. FT TUL, Department of Nonwovens and
Nanofibrous Materials Vice-chairman: doc. Ing. Maroš Tunák, Ph.D. FT TUL, Department of Textile Evaluation
prof. Ing. Michal Šejnoha, Ph.D., DSc. Czech Technical University in Prague Fac. of Civil Engineering, Dpt. of Mechanicsprof. Ing. Miroslav Václavík, CSc. VÚTS, a. s., Liberec
doc. Ing. Martin Bílek, Ph.D. FS TUL, Department of Textile Machine Design
doc. Ing. Lukáš Čapek, Ph.D. FT TUL, Department of Technologies and Structures
doc. Dr. Ing. Dana Křemenáková FT TUL, Department of Material Engineering
doc. Ing. Jiří Sloupenský, CSc. (opponent) Rieter CZ s.r.o.
Ing. Eva Moučková, Ph.D. FT TUL, Department of Technologies and Structures
The second opponent is S. M. Ishtiaque, Ph.D., B.Tech. from IIT Delhi, Indie (he is not a member of the committee).
2
Abstract
The current study starts with a description of stress-strain curves of fiber and yarn. The effect of yarn structure can be characterized by coefficient of fiber stress utilization in yarn. The four types of models, for coefficient of fiber stress utilization in yarn, are being compared and explained based on idea of helical fibers in the yarn. The Gegauff’s model is the simplest of all models, which can calculate coefficient of fiber stress utilization independent of yarn axial strain, assuming linear stress-strain relationship. The solution of "single integral" equation is possible numerically and can be used to predict coefficient of fiber stress utilization as function of yarn axial strain assuming small deformation, constant packing density and contraction ratio. The "double integral" model explains the generalized helical model and it is used to predict the coefficient of fiber stress utilization in staple spun yarns considering also random character of fiber inclination in the yarn. The real fiber stress-strain function, yarn twist, yarn diameter, and fiber orientation parameter are required for solution of this model which can be determined experimentally. The numerical integration was used to solve this equation.
The different types of fibers (viscose, cotton, polyester, linen, wool and acrylic) and yarns were used for validation of proposed mathematical models for coefficient of fiber stress utilization before the breaking process of yarn. Viscose, cotton and polyester yarns were produced from both ring and rotor technologies while linen, wool and acrylic yarns were made from ring spun technology. Combed cotton ring spun yarns from long staple cotton fiber were also used for verification of the model.
It was observed that the stress-strain curve of yarn always lies under stress-strain curve of fiber. The experimental coefficient of fiber stress utilization was compared with four types of coefficients of fiber stress utilization. The well-known Gegauff’s theory overestimated the coefficient of fiber stress utilization in all studied yarns. The single integral equation predicted the coefficient of fiber stress utilization at each value of strain and it was near the Gegauff’s model but not linear. The empirical constant (k) times coefficient of fiber stress utilization from single integral model was observed near the experimental coefficient of fiber stress utilization but has no logical interpretation. The partial generalization of helical model by taking fiber orientation into account resulted in satisfactory agreement with the experimental results. It was evident that fiber orientation plays an important role in deciding the fiber stress utilization in yarns. The lower is the variability of fiber direction in relation to the corresponding helical direction of fibers, the higher is the fiber stress utilization in yarn.
The experimental coefficient of fiber stress utilization in the ring yarns was observed higher as compared with the rotor yarns due to better fiber orientation in ring yarns. Polyester yarn exhibited significantly low coefficient of fiber stress utilization due to higher slippage and specific fiber structure. The combed cotton yarn revealed higher coefficient of fiber stress utilization as compared with carded cotton yarns due to better fiber orientation from combing process.
Further, the yarn specific stress-strain curves for each type of ring, rotor and combed yarns were predicted and compared with the experimental yarn specific stress-strain curves. It was revealed that, for all types of yarns, the predicted yarn specific stress-strain curves captured well the experimental yarn specific stress-strain curves before the process of yarn break.
Keywords: Average fiber stress-strain curve, average yarn stress-strain curves, coefficient of fiber stress utilization, predicted yarn specific stress-strain curves, fiber orientation.
3

Anotace
V úvodu práce jsou popsány tahové křivky vlákna a příze. Vliv struktury příze na její pevnost může být charakterizován koeficientem využití pevnosti vláken v přízi. V práci jsou představeny a vysvětleny čtyři modely využití pevnosti vláken v přízi odvozené na základě šroubovicového modelu příze. Gegauffův model patří k nejjednodušším modelům a je popsaný rovnicí. Koeficient využití pevnosti vláken v přízi je dle tohoto modelu vypočten nezávisle na tahové deformaci příze. “Jedno-integrálový“ model je možné řešit numericky a může být využita pro predikci koeficientu využití pevnosti vláken v přízi za předpokladu malých deformací, konstantního zaplnění a konstantního poměru příčné kontrakce. “Dvou-integrální“ model popisuje zobecněný šroubovicový model a lze jej využít pro predikci koeficientu využití pevnosti vláken ve staplových přízích s ohledem na náhodný charakter sklonu vláken v přízi. Tento model lze řešit na základě experimentálně stanovených hodnot počtu zákrutů příze, průměru příze, úhlu sklonu vláken a tahové křivky vláken. V této práce byla k řešení rovnice použita numerická integrace.
Různé typy vláken (viskóza, bavlna, polyester, len, vlna a akrylové) a přízí vyrobených z různých technologií byly použity pro ověření navržených matematických modelů pro koeficientem využití napětí vláken. Viskózové, bavlněné a polyesterové příze byly vyrobeny jak prstencovou, tak rotorovou technologií, zatímco lněné, vlněné a polyakrylonitrilové příze byly vypředené pouze na prstencových dopřádacích strojích. Česané prstencové příze z dlouhovlákenné bavlny byly rovněž použity pro ověření modelu.
Bylo zjištěno, že tahové křivky přízí leží vždy pod tahovými křivkami vláken. Experimentální koeficient využití napětí vláken byl ve srovnání se čtyřmi typy teoretických modelů. Dobře známá Gegauffova teorie nadhodnocuje koeficient využití pevnosti vláken v případě všech sledovaných přízí. Model s jednoduchým integrálem predikuje koeficient využití pevnosti vláken v každé hodnotě protažení. Výsledky jsou blízké koeficientům stanoveným na základě Gegauffova modelu, ale není mezi nimi lineární závislost. Částečné zobecnění šroubovicového modelu díky zahrnutí úhlu sklonu vláken přineslo uspokojivý soulad s experimentálními výsledky. Je zřejmé, že orientace vláken hraje důležitou roli při využití pevnosti vláken v přízi. Čím je nižší variabilita sklonu vláken vzhledem k odpovídajícímu sklonu vláken ve šroubovicovému modelu, tím vyšší je využití pevnosti vláken v přízi.
Koeficient využití pevnosti vláken v prstencových přízích byl vyšší v porovnání s koeficientem u rotorových přízí díky lepšímu uspořádání a orientaci vláken v prstencové přízi. Polyesterové příze vykazovaly významně nižší koeficient využití pevnosti vláken díky vyššímu prokluzu a specifické struktuře vláken. Bavlna příze vykazovala vyšší koeficient využití napětí vláken v porovnání s mykanými bavlněnými přízemi z důvodu lepší orientaci vláken z procesu česání.
Dále na základě odvozených vztahů byly predikovány tahové křivky prstencových a rotorových přízí. Křivky byly porovnávány s experimentálně zjištěnými tahovými křivkami. Ukázalo se, že v oblasti před přetrhem příze predikované tahové křivky odpovídají křivkám experimentálním u všech testovaných přízí. Rovněž v případě viskózových prstencových přízí byl navržený matematický model porovnáván s modelem.
Klíčová slova: Průměrná vlákno deformační křivka vlákna, Průměrná příze deformační křivka příze, Koeficient využití napětí vláken. Předpověď specifického napětí příze deformační křivky, orientace vláken.
4

Table of Contents
1. Introduction ............................................................................................................................ 2
2. Purpose and aim of the thesis................................................................................................. 2
3. Overview of the current state of problem .............................................................................. 3
4. Theoretical modelling ..........................................................................................................10
4.1 Stress-strain diagram of fiber and yarn ..........................................................................10
4.2 Coefficient of fiber stress utilization..............................................................................11
4.3 Tensile behavior of twisted yarns according to helical model .......................................11
4.3.1 Coefficient of fiber stress utilization from Gegauff’s model ..................................11
4.3.2 Coefficient of fiber stress utilization considering real stress-strain function .........11
4.4 Coefficient of fiber stress utilization from partial generalization of helical model .......11
5. Methods used and studied materials ....................................................................................12
5.1 Materials ........................................................................................................................12
5.1.1 Fibers.......................................................................................................................12
5.1.2 Yarns .......................................................................................................................13
5.2 Methods..........................................................................................................................13
5.2.1 Fiber tensile test ......................................................................................................13
5.2.2 Yarn tensile test.......................................................................................................13
5.2.3 Yarn linear density ..................................................................................................13
5.2.4 Yarn diameter..........................................................................................................13
5.2.5 Yarn twist ................................................................................................................14
5.3 Evaluation of mean specific stress-strain curves ...........................................................14
5.3.1 Mean specific stress-strain curve for fiber .............................................................. 14
5.3.2 Mean specific stress-strain curve for yarn .............................................................. 14
5.4 Experimental coefficient of fiber stress utilization ........................................................ 15
5.4.1 Experimental coefficient of fiber stress utilization of viscose yarns ...................... 15
5.4.2 Experimental coefficient of fiber stress utilization of cotton yarns ........................ 16
5.4.3 Experimental coefficient of fiber stress utilization of polyester yarns ................... 18
5.4.4 Experimental coefficient of fiber stress utilization of worsted yarn ....................... 18
5.4.5 Experimental coefficient of fiber stress utilization of acrylic yarns ....................... 18
6. Summary of the results achieved ......................................................................................... 19
6.1 Predicted and experimental coefficient of fiber stress utilization .................................. 19
6.1.1 Predicted and experimental coefficient of fiber stress utilization of viscose yarns 19
6.1.2 Predicted and experimental coefficient of fiber stress utilization of cotton yarns .. 20
5

6.1.3 Predicted and experimental coefficient of fiber stress utilization of polyester yarns.......................................................................................................................................... 22
6.1.4 Experimental and predicted coefficient of fiber stress utilization of worsted yarns.......................................................................................................................................... 23
6.1.5 Predicted and experimental coefficient of fiber stress utilization of acrylic yarns . 24
6.2 Experimental and predicted yarn specific stress-strain curves ...................................... 24
6.2.1 Predicted and experimental specific stress-strain curves of viscose yarns ............. 25
6.2.2 Predicted and experimental specific stress-strain curves of polyester yarns .......... 25
6.2.3 Predicted and experimental specific stress-strain curves of carded cotton yarns ... 26
6.2.4 Predicted and experimental specific stress-strain curves of combed cotton yarns . 27
6.2.5 Predicted and experimental specific stress-strain curves of worsted yarns ............ 27
6.2.6 Predicted and experimental specific stress-strain curves of acrylic staple spun yarns ................................................................................................................................. 28
7. Evaluation of the results and new finding............................................................................ 28
7.1 Conclusions .................................................................................................................... 28
7.2 Recommendations .......................................................................................................... 29
8. References ............................................................................................................................30
List of research articles published............................................................................................33
Curriculum vitae ...................................................................................................................... 34
Brief description of the current expertise, research and scientific activities ........................... 35
Record of the state doctoral exam ............................................................................................ 36
Recommendation of the supervisor ......................................................................................... 37
Reviews of the opponents ........................................................................................................ 38
6
1. Introduction
Yarn mechanics is known as an important branch of applied mechanics of textile structures. As yarn strength is the most important quality parameter of yarn so its prediction is very important from technical point of view. The tensile strength and tensile behavior have been widely researched topic in yarn structure therefore it occupies a significant part of the literature on textile yarn mechanics. Most of research work regarding structure, up to now, is related with the continuous filament yarns. Being the extensive applications of staple spun yarns in woven and knitted fabric, it is more important to solve the staple fiber yarn problem.
The discontinuities at the fiber ends and slippage among the fibers are main difficulties in analysis of staple fiber yarn [1]. Particularly, the effect of yarn geometry on the yarn behavior has made the study of staple fiber yarns more complex. The assembly of staple fibers is combined together as a yarn due to twist and migration factors. There is huge variation in yarn linear density, yarn twist, fiber arrangement and fiber migration in staple fiber yarns. The above said variables may have a significant influence on the yam behavior which makes the analysis even more difficult.
Most of research work on staple yarns is focused on the prediction of the yarn modulus and the maximum strength. Some researchers investigated the failure response and whole stress-strain curve for the yarns. Also, little attention has been paid to the yarn behavior under tensile loading. Most of the theoretical work Platt [2] and Hearle [3] including other empirical researches summarized a fact that understanding tensile behavior of twisted yarns needs knowledge of constituent fiber properties, structure of yarns and testing parameters.
The prediction of coefficient of fiber stress utilization, the ratio between the fiber tenacity and mean yarn tenacity for staple yarns is important quality parameter of yarn to know the yarn strength. Yarn structure provides information about the practical understanding of the coefficient of fiber stress utilization of staple spun yarns. The twist level, fiber properties and fiber orientation are the main parameters which may influence the coefficient of fiber stress utilization of staple spun yarns.
The coefficient of fiber stress utilization in yarn depends on yarn axial strain which contradicted the well-known Gegauff’s theory [4]. Our proposed mathematical model, based on the assumptions of small deformation, constant packing density and contraction ratio, can be calculated using numerical integration considering real fiber stress-strain relationship and fiber orientation before the process of yarn break when all fibers are mechanically stressed.
2. Purpose and aim of the thesis
The objective of this research is to apply a mathematical model for prediction of coefficient of fiber stress utilization from fiber and yarn stress-strain curves, considering yarn twist and fiber orientation before break when yarns are subjected to tensile loading. An attempt is made here to compare and validate the theoretical models [5] in light of experimental results.
This work includes:
1 Understanding the mathematical model for prediction of coefficient of fiber stress utilization taking into account the concept of nonlinearity in stress-strain curves of textile fibers and yarns and fiber orientation in the staple spun yarns.
2 Understanding the stress-strain behavior of fiber and staple spun yarn before break using different type of materials, ring and rotor yarns.
7
3 Analyzing behavior of fiber and staple yarn, producing the average stress-strain curves for fiber and yarns before break using Matlab software.
4 Experimental coefficient of fiber stress utilization will be evaluated from experimental fiber mean stress-strain curves and yarn mean stress-strain curves using different materials and technologies.
5 Comparing the predicted and experimental coefficient of fiber stress utilization on the basis of theoretical model and experimental results for staple spun yarns before yarn breaking process.
6 Comparing the predicted and experimental yarn specific stress-strain curves before the process of break for staple spun yarns.
3. Overview of the current state of problem
The research about mechanical behavior of textile yarns has been popular by the textile community. The history of modem textile processing machinery is more than two hundred years old [6]. However, the proper research work was conducted early 1900’s for establishing theoretical relationships among fiber properties, yarn structure and material behavior. The well-known researchers Gegauff [4], Gurney [7] and Peirce [8] introduced foundation for modem textile mechanics.
The basic mathematical model of yarn was introduced by Gegauff [4] in the form of coaxial helices, all having a pitch equal to the reciprocal of yarn twist. He derived an expression for variation of the breaking load of staple fiber yarn with higher twist, assuming that the fiber extensions followed Hook’s law. A similar model was explained by Gurney [7]. He studied the effect of stress distribution, fiber length, fiber friction and twist on strength of cotton yarns.
Sullivan [9], in his study proposed theoretical approach to relate yarn strength with the fiber strength and yarn twist considering parallel fibers with and without twisted fiber structures. Platt [10] derived an expression for strength of continuous filament yarns similar to the Gegauff’s except Hook’s law was not assumed. The total force on yarn was derived in the direction of yarn axis by integrating the components of the forces due to individual fibers. Platt [2] also studied the variation of yarn modulus with twist and derived an expression for it.
Gregory [11] – [13] modified the formula given by Sullivan for calculation of maximum strength of a parallel strand. He studied that strength of staple spun yarn is less than individual fibers due to variation in load of individual fibers in group of fibers, inclination of fiber to the axis of twisted strand and slippage of fiber in outer layers. Hearle [14] proved that the transverse forces between and through the fibers play an important role in determining mechanical properties of yarns. He analyzed the transverse forces through the yarn, their effect on fiber extension and their contribution to yarn tension from the theoretical model for small strain. The model was not good at higher strain because of change in yarn geometry and deviation of Hook’s law.
Afterward, Hearle et al. [15] modified the previous theory, considering yarn extension and breakage at large extension and also taking into account deviation from Hook’s law. Hearle [16] introduced more simpler energy method similar to Treloar and Riding instead of force method to predict the stress-strain behavior of continuous filament yarns.
Hearle [17], [18]studied the effect of migration in staple fiber yarns and he made a consistent analysis of the behavior and cohesion of an idealized short fiber yarns and concluded that fiber arrangement, fiber migration and yarn twist have effect on mechanical properties of yarns.
8

Treloar and Riding [19] developed an equation to evaluate the yarn specific stress from the concept of energy method.The effect of torsional and bending forces was studied by Treloar [20] in a theoretical analysis of rubber models and it was established that they are negligible in the tensioned yarn. Later on Treloar [21] applied rubber model to a filament yarn of idealized migration pattern and it was concluded that migration has slight effect on geometrical and tensile properties of filament yarns.
Holdaway [22] studied the strength of single worsted yarn and a new concept of "ineffective outer layer" of fibers was introduced. He found that the stretched yarn caused limited lateral pressure immediately below an outer layer of fibers. A new approach was introduced by White. et al [23] and Cheng et. al. [24] in mechanics of continuous filament yarns using the method of continuum mechanics and tensor matrix analysis. Carnaby et al. [25] studied the tensile behavior of staple fiber yarns at small strains. A theoretical model was developed by Thwaites [26], analyzing the tensile and torsional behavior of highly twisted yarns.
A serious of papers was published by Pan [27] – [30] in the field of mechanics of staple fiber yarns. He studied the relationship between fiber and yarn strength and developed constitutive theory governing the behavior of short fiber yarns with and without slippage effect.
A statistical theory was developed by Realff et al. [31] to explore the relationship between the statistical strength and the properties of the constituent fibers as well as the structural parameters of twisted fiber. Onder and Baser [32], [33] examined the stress-strain behavior and strength of staple yarns. A yarn model was established in which the fiber migration follows a conical helix path. Their approach is similar to Hearle’s model of staple fiber yarns. A theoretical model was developed by Langenhove [34] – [36] to predict the tensile load and untwisting moment of a yarn at a given strain from fiber properties and yarn structure. Morris et al. [37] developed method for yarn modelling by dividing the series of yarn cross sections at small intervals along its length.
Many other researchers [38] – [48] predicted yarn strength from fiber properties and process parameters from empirical and regression equations. Hafez [49] developed the relationship for predicting the lea strength and single yarn strength from yarn twist, yarn count, mean fiber length and fiber bundle tenacity. Hunter [50] considered the different fiber properties and presented different regression equations to evaluate the strength of ring and rotor yarns. Rajamanickam et al. [51] studied the structural and material parameters of air jet spun yarns and derived the regression equation for yarn tenacity. Chasmawala et al. [52] introduced regression equation which can determine the breaking load from number of core fibers for air-jet yarn.
A mathematical model was developed by Krause et al.[53] for coefficient of fiber strength utilization for the air-jet spun yarn. They derived the expression for coefficient of fiber strength utilization for lower and higher fiber frictions. Frydrych [54] developed a mechanistic model for prediction of yarn strength using the modified Peirce’s equation. Most of the Frydrych’s model are based on previous work by Zurek [55] and Zurek et al. [56].
Das et al. [57] used simulated annealing to solve Frydrych’s equation for yarn strength from fiber properties and twist of ring spun cotton yarns to explore the best combination of parameters that can produce yarn with required strength. Ghosh et al. [58], [59] developed an equation for prediction of yarn strength from the number of fibers at the place of yarn break, average number of fibers in the yarn cross section, fiber bundle tenacity, percentage of broken fiber in the yarn failure zone, and the mean helix angle of fibre at the time of yarn failure. Sami et al. [60] studied the mechanical behavior of yarn using technical parameters by tensile relaxation tests at different strain levels. Dang et al. [61]
9

studied tensile behavior of wool / spandex core spun yarn and introduced theoretical model to determine coefficient of fiber strength utilization taking into account the fiber and yarn properties.
Guha et al. [62] compared the mechanistic model described by Frydrych with statistical and neural network models. The results indicate the success of all three models in predicting yarn strength. Liu et
al. [63] established a theoretical model to predict tensile and torsional behavior of bulky wool single yarns. They used energy method to calculate the applied force on the yarn and considered nonlinear behavior of the fiber at large strain. Sripateep et al. [64], [65] presented a method for modelling the tensile behavior of multifilament twisted yarn using computer aided design approach for tensile analysis.
4. Theoretical modelling
A brief proposed theoretical model is described here which follows the paper series of Neckář el. al.
[5] and Zubair et al. [66].
4.1 Stress-strain diagram of fiber and yarn
Figure 1 illustrates schematically the specific stress-strain curve of twisted staple yarn and similar curve of corresponding fiber. The yarn curve has more or less similar shape to the fiber curve in the twisted staple yarns but the yarn curve lies under fiber curve. It is inconsequence to a very specific fibrous arrangement and fiber to fiber interaction in the yarn. The corresponding stress difference is h1 at the yarn breaking strain = .
However the yarn breaking strain ay is mostly smaller then fiber breaking strain af. So the fiber specific stress increases usually more to h2 to the final value on the distance from ay to af. This mechanism is related to the difference in process, yarn structure and yarn variation. Thus the coefficient of fiber stress utilization in yarn is consequence of process in yarn structure by its tensional deformation (without significant fiber breaks) and process of fiber breakage due to yarn destruction. There are two regions on specific stress-strain curve of yarn in figure 1.
Figure 1 Schematic of specific stress-strain curves [5]
Original structural character of a yarn remains relatively stable and all fibers are mechanically workable in first part (white). However the structure is prominently changed and more and more fibers break in the second part (grey). Of course, the border between these two regions is not too clear, the first portion is continuously changing to the second type as illustrated in the figure1. However, this idea of separation of both processes reveals for building of theoretical models.
10

4.2 Coefficient of fiber stress utilization
The coefficient of fiber stress utilization can be evaluated by studying the area before break of fiber and yarn. By the same strain = , we can find the specific stress in fiber, ( and specific stress in yarn, ( The ratio between yarn specific stress and fiber specific stress is in fact “coefficient of fiber stress utilization” in the yarn expressed as below
( = (1)
The above said expression for coefficient of fiber stress utilization is not constant, it is function of yarn strain .
4.3 Tensile behavior of twisted yarns according to helical model
The helical model of fibers in yarn of fineness T, diameter D and twist Z and number of fibers in cross section n is based on the following assumptions: (1) All fibers have same cross-sectional area s; (2) all fibers are ‘infinitely’ long; (3) the axes of all fiber create helices with same direction of rotation; (4) all helices have one common axis which is yarn axis; (5) the height of each coil of fiber is constant and equal to 1∕Z. Based on the assumption of helical model the equations for coefficient of fiber stress utilization are given in this section.
4.3.1 Coefficient of fiber stress utilization from Gegauff’s model
Gegauff [2] assumed that the specific stress by axial tension of fiber is a linear function of fiber strain = k . (2)
Where k = E / = constant, the constant k is the ratio between fiber Young’s modulus and fiber density.
He derived equation for the coefficient of fiber stress utilization as follows
. (3)
At η = 0, the above equation is reduced to
(4)
4.3.2 Coefficient of fiber stress utilization considering real stress-strain function
Considering real fiber and yarn stress-strain relationship and from idea of yarn helical model the Gegauff’s equation can be modified as single integral equation which is given as follows
( = = (5)
Where = . (6)
is fiber stress-strain function, is general twist angle and D is maximum twist angle in yarn. f and y are fiber and yarn strains. This equation can be solved by numerical integration using stress-strain function of fiber and maximum twist angle D. The contraction ratio = 0.5 can be used for textile materials for constant volume body.
11

4.4 Coefficient of fiber stress utilization from partial generalization of helical model
It is considered in above model that all fibers are inclined at certain angle in accordance with helical model. After partial generalization of helical model let us imagine that all the fibers in the differential layer situated at radius r are lying on the corresponding cylindrical surface, but they do not have the same angle β, rather they form the angle with the yarn axis.
In spite of the fact, we assumed that packing density r and contraction ratio r of differential layer in yarn depends generally on the radius, we assumed for the simplification that these quantities are independent to the radius r similar to yarn strain y. From partial generalization of helical model and considering real fiber stress-strain relationship and fiber orientation distribution in yarn, coefficient of fiber stress utilization in yarn c2 can be expressed as follows
(7)
Where y is yarn axial strain, is general twist angle of fibre, is fiber specific stress f as a function of fibre strain f, u() denotes probability density function of fiber inclination angle , and u indicates upper limit of fibre inclination angle. The unimodal probability density function, u() of non-oriented angles was derived earlier by Neckar et al.[67]. Fibers with angles
approaching are being found in yarn structure only very seldom, however, they were identified by
experimental analysis of internal structure of yarns derived by Neckář et al. [67][68]. (8)
Where C is parameter which depends on directional distribution of fibers in yarn, and it varies according to fiber type and spinning technology. Furthermore, the following expressions are required for calculations.
(9) and can be obtained as follows
. (10)
. (11)
Where is yarn lateral contraction ratio and it can be taken as 0.5 for textile materials. D is yarn diameter, Z is twist per unit length, D is maximum twist angle and u is upper limit of fiber inclination angle .
5. Methods used and studied materials
Experiments were carried out to validate the theoretical model described in section 4. The different types of fibers and staple spun yarns with different linear densities and materials were used for the validation of the mathematical model and brief procedures for the measurement of the necessary parameters are being explained in this section. The mean curves and experimental coefficient of fiber stress utilization are elaborated in this section.
5.1 Materials
The five types of fibers cotton, polyester, viscose, worsted and acrylic were used to produce staple spun yarns. The yarns were produced by ring and rotor technologies with different linear densities.
12

5.1.1 Fibers
The five types of fibers viscose, cotton, polyester, worsted and acrylic were used for validation of model. The measured and / or nominal specification of the fibers are given in the table 1.
13

Table 1 Fiber specifications
Yarn type Parameters
Viscose fiber
Carded cotton fiber
Combed cotton fiber
Polyester fiber
Worsted fiber
Acrylic fiber
Breaking force [cN] 3.66 4.88 6.40 6.11 5.90 4.71 Breaking strain [%] 18.04 6.35 6.93 18.35 31.07 26.21 Tenacity [cN / tex] 29.53 30.5 44.28 42.98 15.43 35.3 Fineness [dtex] 1.29 1.6 1.46 1.43 3.81 1.34 Staple length [mm] 38 28 35 38 40 40
5.1.2 Yarns
The different yarn linear densities of different types of materials viscose, cotton, polyester, worsted and acrylic from ring and rotor technologies were used to validate the modal. The mean values of all parameters obtained from equipment were recorded in the tables 2, 3, 4, 5, 6 and 7.
5.2 Methods
The standard test methods for evaluation of different parameters fiber fineness, fiber force and elongation, yarn fineness, yarn force and elongation, yarn diameter and yarn twist are described here.
5.2.1 Fiber tensile test
Tensile force, elongation, titer and tenacity of all types of fibers were measured on Lenzing Vibrodyn - 400 according to the standard test method CSN-ENISO 1973. A total of fifty measurements were made for all types of fibers. The gauge length was 10 mm and force was applied at a rate of 10 mm / min. The stress-strain curves data for each type of the staple fibers were obtained from the equipment software which was used to produce mean curve for each type of fiber in Matlab software.
5.2.2 Yarn tensile test
All types of yarns were tested on Instron-4411 in accordance with standard test method CSN-ENISO 2060. The yarns were tested for force and elongation at the corresponding speeds depending upon the yarn type and the gauge length being 500 mm for all type of yarns. The tensile force application time was kept from 17 to 22 seconds for all types of yarns. A total of fifty tests were performed on each of the yarns. The individual raw stress-strain curve data of the each yarn was used to obtained average stress-strain curve using linear interpolation and Matlab software.
5.2.3 Yarn linear density
The yarn linear density was measured from a lea of one hundred meters according to standard test procedure CSN 80 0050. Five samples for each type of yarn were prepared on lea making machine and each sample was weighed in grams on weighing balance and yarn tex was determined from mean of five samples.
5.2.4 Yarn diameter
The yarn diameter was determined by image analysis method according to the standard test method (Interni norma) C.22.102-01/01. Image of yarns at different places were saved in the software and then measured for each sample. Mean value of diameter from hundred observations were taken and recoded.
14

5.2.5 Yarn twist
Twist per meter were measured on twist testing machine according to standard procedure CSN 80 0701. Thirty samples from each type of yarn were measured and mean value of twist was recorded. The measured diameter and yarn twist were used to determine the twist angle by using equation tan βD = DZ Where D is yarn diameter, Z is twist per millimeter and βD is maximum twist angle.
5.3 Evaluation of mean specific stress-strain curves
The brief procedures to plot the mean specific stress-strain curves both for fiber and yarn are explained as follows.
5.3.1 Mean specific stress-strain curve for fiber
The preliminary fiber stress-strain curve data for fifty fiber samples obtained from vibrodyn-400 was used to produce average specific stress-strain curve in Matlab for each type of fiber. The mean fiber specific stress-strain curve was evaluated at each strain with a step of 0.001using linear interpolation before the fiber break occurred.
5.3.2 Mean specific stress-strain curve for yarn
The individual raw stress-strain curve data for all type of yarns from fifty specimens from Instron-4411 was used to predict the average specific stress-strain curve for yarn with a step of 0.001 using linear interpolation in Matlab before the process of break.
About 10 % of individual stress-strain curves, having smallest and highest breaking strains were excluded from the experiment data for all fiber and yarn specimens as outlier curves.
The mean experimental specific stress-strain curves for fiber and yarns before the process of break are shown in the figure 2. The mean fiber specific stress-strain curve occupies on higher position and all position of yarn specific stress-strain curves are lower than the fiber curves while rotor yarn curves lie slightly under the ring yarn curves. The shape of specific stress-strain curves both for fiber and yarn are similar for each type of material. All ring yarn curves occupy same position and same is true for all rotor yarns.
Figure 2 Experimental stress-strain curves for fiber and yarns (a) viscose (b) carded cotton
15

Figure 2 Experimental stress-strain curves for fiber and yarns (c) combed cotton (d) polyester (e) wool and (f) acrylic
5.4 Experimental coefficient of fiber stress utilization
The average specific stress-strain curves for fiber and yarns produced in section 5.3 were used to evaluate experimental coefficient of fiber stress utilization using equation (1). The theoretical relations are not fully valid in the area of very small strains probably as consequence of relative imperfections by process of measurement and / or fiber crimp. Liu et al. [63] presented the similar conclusion for fiber and yarns strains. They also studied stress-strain curves beyond the limit of 2 %. Therefore we shall analyze the mutual relations starting from strain value of 0.02 (2 %). The graphs of experimental coefficient of fiber stress utilization curves for all types of yarns are given in figure 3.
5.4.1 Experimental coefficient of fiber stress utilization of viscose yarns
The different specifications of viscose ring and rotor yarns used for investigation of coefficient of fiber stress utilization were measured and recorded in the table 2.
Table 2 Parameters of viscose staple yarns
Yarn type
Yarn linear densities Yarn twist
Yarn dia. Twist angle
Twist coefficient
Test speed
Nominal [tex] Actual [tex] Z [m—1] D [mm] βD [deg] [m-1ktex1/2] [mm/min] Ring 29.5 32.45 650 0.210 20.93 117 220 20 20.07 840 0.169 23.59 119 220 Rotor 29.5 30.71 680 0.222 23.13 119 170 20 20.03 900 0.177 26.97 127 170
16

The experimental coefficient of fiber stress utilization for all types of viscose ring and rotor yarns was evaluated at each strain and was plotted against the different values of strain as shown in the figure 3a. The experimental coefficient of fiber stress utilization for all viscose ring yarns is lying at higher position because of the better orientation of fibers in that yarn due to its structure.
5.4.2 Experimental coefficient of fiber stress utilization of cotton yarns
Carded and combed cotton yarns were used for experimental evaluation of coefficient of fiber stress utilization. The carded and combed cotton yarns were produced from short and long staple cotton fiber respectively.
Experimental coefficient of fiber stress utilization by carded cotton yarns
Two sets of cotton staple yarns ring and rotor were tested for investigation of coefficient of fiber stress utilization. Cotton fiber stress-strain curve data was obtain from the vibrodyn-400.The fineness could not be measured on Vibrodyn - 400 due to smaller staple length of cotton fiber. So the cotton fiber fineness was measured with the help of micron air equipment according to the standard procedure, IS-3674-1966 and value was converted into dtex. The parameter of carded cotton ring and rotor yarn are given in the table 3.
Table 3 Parameters of carded cotton staple yarns
Yarn type
Yarn linear densities Yarn twist Yarn dia.
Twist angle
Twist coefficient
Speed
Nominal [tex] Actual [tex] Z [m—1] D [mm] βD [deg] [m-1ktex1/2] [mm/min] Ring 59.0 58.4 532 0.258 23.3 128 120
73.8 72.2 493 0.301 25.0 133 120 Rotor 59.0 58.5 529 0.337 29.5 128 95
73.8 73.5 454 0.380 28.5 123 95
Figure 3 Experimental coefficient of fiber stress utilization for staple spun yarns, (a) viscose (b) carded cotton
17

Figure 3 Experimental coefficient of fiber stress utilization for staple spun yarns, (c) combed cotton (d) polyester (e) wool and (f) acrylic
The experimental coefficient of fiber stress utilization curves for all types of carded cotton yarns are presented in the figure 3b. All experimental coefficient of fiber stress utilization curves for ring yarns are lying at higher position and for rotor yarns at lower level due to the better orientation of fibers in ring yarns. The shape of all the coefficient of fiber stress utilization curves for ring and rotor are similar. The experimental coefficient of fiber stress utilization curves for cotton yarns also reveal more linear behavior as compared with the viscose and polyester yarns.
Experimental coefficient of fiber stress utilization by combed cotton yarns
The specifications of both combed cotton yarns used for investigation of coefficient of fiber stress utilization are presented in table 4.
Table 4 Parameters of combed cotton staple spun yarns
Yarn type
Yarn linear densities Yarn twist
Yarn dia.
Twist angle
Twist coefficient
Speed
Nominal [tex] Actual [tex] Z [m—1] D [mm] βD [deg] [m-1ktex1/2] [mm/min] Ring 11.5 11.28 955 0.13 21.30 101 65
20.0 19.78 726 0.17 21.20 102 65
The experimental coefficient of fiber stress utilization curves for combed cotton yarns are presented in figure 3c. The experimental coefficient of fiber stress utilization curves for both combed cotton yarns lie on the same position and also exhibit same shape.
18

5.4.3 Experimental coefficient of fiber stress utilization of polyester yarns
Two types of polyester staple spun yarns one ring and other rotor were tested for investigation of coefficient of fiber stress utilization. The polyester ring and rotor yarn parameters are given in the table 5.
Experimental coefficient of fiber stress utilization curves for all ring yarns are at the same position and also all rotor yarn curves exists at the same level as shown in the figure 3d. The trend of all curves has some analogy. The coefficient of fiber stress utilization is higher at the start then decreases at the middle at strain of 0.07~0.08 and again increase before break.
Table 5 Parameters of polyester staple yarns
Yarn type
Yarn linear densities Yarn twist
Yarn dia.
Twist angle
Twist coefficient
Speed
Nominal [tex] Actual [tex] Z [m—1] D [mm] βD [deg] [m-1ktex1/2] [mm/min] Ring 29.5 30.02 661 0.223 24.84 114 230
45 43.84 543 0.274 25.50 115 230 Rotor 33 33.77 720 0.250 29.48 131 230
50 50.54 593 0.313 30.24 133 230
5.4.4 Experimental coefficient of fiber stress utilization of worsted yarn
Two worsted yarns were used to validate the results of the mathematical model. The specifications of both worsted yarns were presented in table 6. The experimental coefficient of fiber stress utilization curves for both the worsted yarns are shown in the figure 3e. Experimental coefficient of fiber stress utilization curves for both the yarns lie at the same position and also have compare able shape.
Table 6 Parameters of worsted staple spun yarns
Yarn type
Yarn linear densities Yarn twist Yarn dia. Twist angle Twist coefficient Speed Nominal [tex] Actual [tex] Z [m—1] D [mm] βD [deg] [m-1ktex1/2] [mm/min]
Ring 20 20.03 790 0.177 23.7 112 230 23 23.25 640 0.190 21.0 98 230
5.4.5 Experimental coefficient of fiber stress utilization of acrylic yarns
Two acrylic ring spun yarns were measured for investigation of coefficient of fiber stress utilization in yarn. The specifications of acrylic yarns were measured and recorded in the table 7.
Table 7 Parameters of acrylic staple spun yarns
Yarn type
Yarn linear densities Yarn twist
Yarn dia.
Twist angle
Twist coefficient
Speed
Nominal [tex] Actual [tex] Z [m—1] D[mm] βD [deg] [m-1ktex1/2] [mm/min] Ring 12 12.70 725 0.141 22 82 280 18 17.95 568 0.167 23 76 280
The experimental coefficient of fiber stress utilization for both acrylic yarns is shown in the figure 3f. The experimental coefficient of fiber stress utilization curves for all acrylic yarns are lying at same position and possess similar shape and trend but exhibit nonlinear behavior.
19

6. Summary of the results achieved
In this section the predicted and experimental coefficient of fiber stress utilization for all types of yarns is explained in brief. Further, we also compared predicted and experimental yarn specific stress-strain curves for all types of yarns studied.
6.1 Predicted and experimental coefficient of fiber stress utilization
We have predicted the coefficient of fiber stress utilization of all the yarn specimens using the theoretical model in section 4. The fully experimental coefficient of fiber stress utilization curve
express ratio between yarn specific stress and fiber specific stress by the same strain value according to equation (1). Both functions in the numerator and denominator are determined experimentally. The predicted coefficient of fiber stress utilization in relation to the yarn strain obtained from five different types of staple spun yarns using equations (3), (5) and (7) are being explained here along with the experimental results. The theoretical results are actually the result of relatively complicated process. The mathematical model developed is implemented using Simulink technique in the Matlab software. The reason that why we choose Simulink for computation is that it can easily provide the information for coefficient of fiber stress utilization by changing the block parameters like fiber specific stress-strain function, twist angle, yarn contraction ratio and angular preference C. Fiber response in the yarn and its contribution to the coefficient of fiber stress utilization in yarn can be investigated both in the form of curve and data. Only at the initial strain up 0.02 (2%), the difference between experimental and predicted coefficient of fiber stress utilization is higher, which might be due to pre-tension yarn, fiber crimp and / or process of measurement. Treloar. [19] proved that theoretical stress-strain curves agreed with the experimental curves except at small values of strain and higher twist. Therefore we shall analyze the mutual relations starting from strain value of 0.02 (2 %). The coefficient of fiber stress utilization behavior for all types of yarns is studied before the process of fiber and yarn breakage.
6.1.1 Predicted and experimental coefficient of fiber stress utilization of viscose yarns
Four graphs of coefficient of fiber stress utilization are shown in the figure 4 related to two ring and two rotor yarns. The parameters from table 2 and η = 0.5 were used for calculations. Moreover empirical common values, C = 4.9 and k = 0.79 for all ring yarns and C = 1.6 and k = 0.55 for all rotor yarns were used to predict theoretical coefficient of fiber stress utilization as shown by curves c2 and k. c1.
A reasonably good inferred regular trends of coefficient of fiber stress utilization was observed by viscose staple yarns. Zubair et al. [66] compared the similar results for viscose ring and rotor yarns and found good agreement for predicted and experimental coefficient of fiber stress utilization. Similar flat experimental curves for coefficient of fiber stress utilization by viscose staple yarns were published in the research report [69]. However, the level of experimental curves was a little higher about 0.75 for ring yarns, 0.55 for rotor yarns from same type of viscose fibers and 0.4 for woolen yarns.
At lower yarn strain coefficient of fiber stress utilization is high which is due to low slippage among the fibers. Dang et al. [70] studied as the yarn extension is increased, force along the fiber axis reduces resulting lower coefficient of fiber stress utilization due to more fiber slippage specially for outer layer fibers.
We can observe from figure 4 that Gegauff’s straight line g are relatively far from experimental curves e on graph in term of their position as well as their shape. The coefficient of fiber stress utilization curve c1 have a similar shape to the experimental curves but they are lying too high in our
20

graph near Gegauff’s line. A suitable k-multiple of c1 curves are very near to the experimental curves e. It is interesting that one common value empirically determined parameter k = 0.79 satisfies to all ring yarns as well as another common value k = 0.55 satisfies to all rotor yarns.
Figure 4 Predicted and experimental coefficient of fiber stress utilization in viscose staple yarn
The analysis offers one idea of distribution of fiber orientation expressed by the coefficient of fiber stress utilization curve c2. These curves lie in close contact with curves k. c1 in all graphs. The suitable value of characteristic C in equation (7) of fiber angular preference is also interesting. The relatively high common value C = 4.9 was necessary to choose for ring yarns in which by consequence to intensive drafting process fiber directions are concentrated mostly round helical model angle β. For rotor yarns we must choose much smaller common value C = 1.6 which corresponds to the level of orientation of short fiber portion in carded web [3]. In other words free flying moving fibers in air channel of spinning unit of rotor technology produce at last the structure like carded web on the internal surface of rotor yarn.
It is evident from figure 4 that all the viscose ring and rotor yarns exhibits similar mean peak coefficient of fiber stress utilization and strain at peak coefficient of fiber stress utilization both experimental and predicted.
6.1.2 Predicted and experimental coefficient of fiber stress utilization of cotton yarns
Two sets of cotton yarns one from carded and other from combed technology were used for validation of mathematical model. The carded cotton yarns were produced from ring and rotor technologies. The same model and procedures were applied as for viscose yarns.
21

Predicted and experimental coefficient of fiber stress utilization of carded cotton yarns
The experimental and theoretical coefficient of fiber stress utilization for various carded cotton ring and rotor yarns were calculated at a range of strain values and the results were presented graphically in figure 5 for ring and rotor yarns. The parameters from table 3 and η = 0.5 were used for calculations. Moreover empirical common values, k = 0.79 for both ring yarns and k = 0.55 for both rotor yarns were used for estimation of curve k. c1. It is interesting that similar values of C for both ring and rotor cotton yarns were used as for viscose yarns C = 4.9 and C = 1.6 respectively.
The shape and position of all the predicted and experimental coefficient of fiber stress utilization curves is similar. The predicted coefficient of fiber stress utilization curves c1 determined from the single integral equation (5) for all ring yarns is function of yarn strain and is not linear as the curve g from the Gegauff’s equation (3). All the coefficient of fiber stress utilization curves c2 predicted from equation (7) are similar in shape to experimental curves e.
Figure 5 Predicted and experimental coefficient of fiber stress utilization in carded cotton staple yarn
The comparison between the experimental and theoretical results in figure 5 for ring and rotor cotton yarns indicates that predicted peak coefficient of fiber stress utilization and strain at peak coefficient of fiber stress utilization are in good agreement with the experimental results.
Predicted and experimental coefficient of fiber stress utilization of combed cotton yarns
Two combed yarns from long staple cotton fiber were used for validation of model. The experimental and theoretical coefficient of fiber stress utilization for both combed cotton yarns was calculated at a range of strain values and the results are presented graphically in figure 6.
The parameters from table 4 and η = 0.5 were used for calculations. Moreover empirical common values, k = 0.73 for both combed yarns was used for prediction of theoretical coefficient of fiber stress utilization k. c1. The relative higher value of C = 5.5 and lower value of empirical constant k was
22

used for evaluation of coefficient of fiber stress utilization because of better orientation of fibers in combed cotton yarns.
The comparison between the experimental and theoretical results in figure 6 for combed cotton yarns show the prediction of coefficient of fiber stress utilization and yarn peak coefficient of fiber stress utilization behavior are reasonable. In general the theoretical prediction agrees well with the experimental results.
Figure 6 Predicted and experimental coefficient of fiber stress utilization in combed cotton staple yarn
The coefficient of fiber stress utilization for combed cotton yarn is higher as compared with carded cotton yarns which might be due to longer staple length of cotton fiber, better orientation and fiber migration in such yarns due to the combing process.
6.1.3 Predicted and experimental coefficient of fiber stress utilization of polyester yarns
The four graph for experimental and theoretical coefficient of fiber stress utilization related to individual polyester yarns are presented in figure 7 for ring and rotor yarns.
On the face of it, these graphs have more or less similar logic then the previous curves of viscose and cotton yarns. Of course, it was necessary to use another parameters specific for these polyester yarns. The values from the table 5 and η = 0.5, parameter C = 2.0 and k = 0.60 for ring yarns and C = 1.17 and k = 0.51 for rotor yarns were used for prediction of theoretical coefficient of fiber stress utilization.
It is also valid that Gegauff’s lines are relatively far from experimental curves. The coefficient of fiber stress utilization curve c1 have roughly similar shapes to the experimental curves but these are lying too high in our graphs near Gegauff’s line. By suitable empirical values of k, the curve k. c1are lying near to the experimental curves e especially by smaller values of strain y. The predicted coefficient of fiber stress utilization curves c2 from double integral equation (7) are lying along with curves k. c1 with respect to position and shape.
The comparison between the experimental and theoretical results in figure 7 for ring and rotor spun polyester yarns show the prediction of coefficient of fiber stress utilization, least coefficient of fiber stress utilization behavior and strain at least coefficient of fiber stress utilization are in good agreement.
23

Figure 7 Predicted and experimental coefficient of fiber stress utilization in polyester staple yarns
The polyester yarns presented low coefficient of fiber stress utilization when compared with viscose and cotton yarns. The shape of the experimental curves is different at higher strain values when compared with the predicted coefficient of fiber stress utilization curves.
6.1.4 Experimental and predicted coefficient of fiber stress utilization of worsted yarns
The predicted and experimental coefficient of fiber stress utilization for two worsted yarns is presented in the figure 8. The position of the experimental coefficient of fiber stress utilization curve e is far from the Gegauff’s straight line g. The coefficient of fiber stress utilization curve c1 is lying near to the Gegauff’s line but it is not linear.
The predicted coefficient of fiber stress utilization curve c2 from double integral equation (7) is similar in position as well as in shape to the experimental curve e. The parameters from table 6 and η = 0.5 were used for calculations. We also used the parameter C = 4.9 and k = 0.79 similar to cotton and viscose ring yarn.
24

Figure 8 Predicted and experimental coefficient of fiber stress utilization in worsted staple yarn
The comparison between the experimental and theoretical results in figure 8 for worsted yarns show the prediction of coefficient of fiber stress utilization, peak coefficient of fiber stress utilization behavior and strain at peak utilization are in reasonable agreement.
6.1.5 Predicted and experimental coefficient of fiber stress utilization of acrylic yarns
The predicted and experimental coefficient of fiber stress utilization for both acrylic yarns is presented in the figure 9. The position of the experimental curve eis far from the Gegauff’s straight line g. The coefficient of fiber stress utilization curve c1 is near to the Gegauff’s line but it is not linear. The predicted coefficient of fiber stress utilization curve c2 from double integral equation (7) is similar in position as well as in shape to the experimental curve e.
Figure 9 Predicted and experimental coefficient of fiber stress utilization in acrylic staple yarn
The comparison between the experimental and theoretical results in figure 9 for acrylic yarns show that the prediction of coefficient of fiber stress utilization, peak coefficient of fiber stress utilization behavior and strain at peak utilization are in good agreement.
6.2 Experimental and predicted yarn specific stress-strain curves
The theoretical coefficient of fiber stress utilization obtained from our model equation (7) was used to evaluate the yarn specific stress from the fiber stress-strain curve data for each type of ring and rotor yarns. The equation (1) was used to predict the yarn specific stress-strain curve for all types of yarns. The predicted and experimental specific stress-strain curve before break for viscose, cotton, polyester, wool and acrylic yarns produced from ring and rotor technologies is being described in this section.
25
6.2.1 Predicted and experimental specific stress-strain curves of viscose yarns
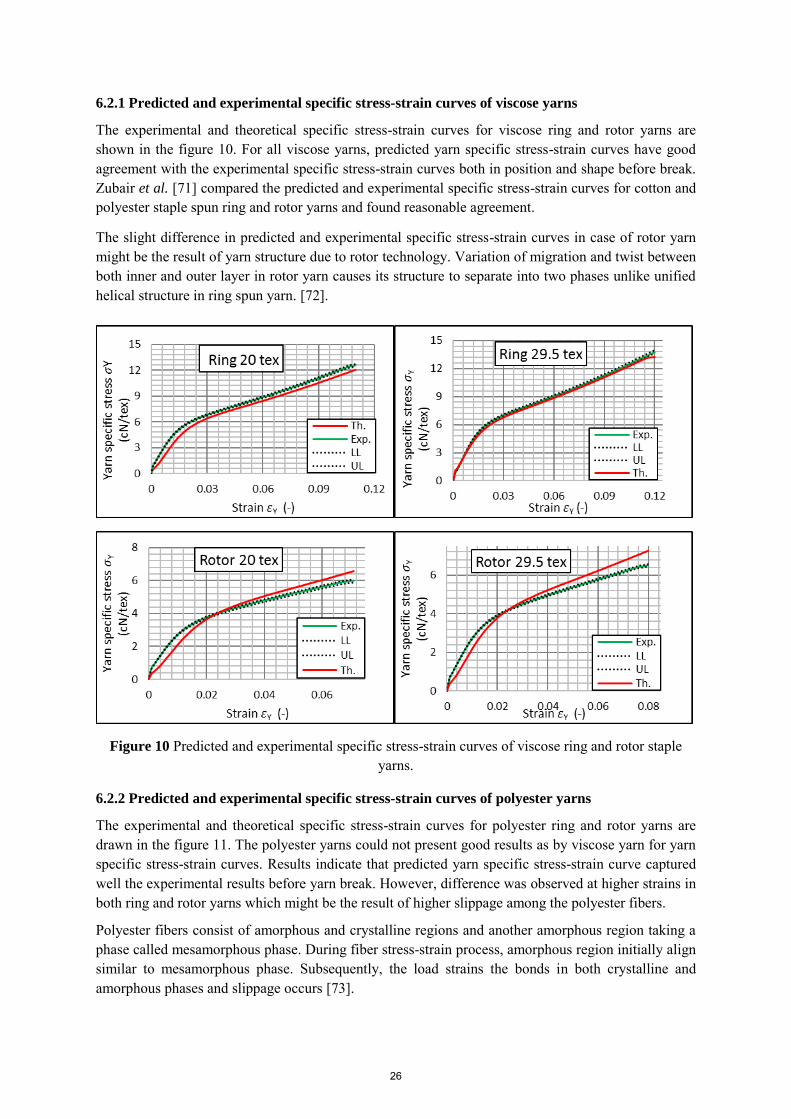
The experimental and theoretical specific stress-strain curves for viscose ring and rotor yarns are shown in the figure 10. For all viscose yarns, predicted yarn specific stress-strain curves have good agreement with the experimental specific stress-strain curves both in position and shape before break. Zubair et al. [71] compared the predicted and experimental specific stress-strain curves for cotton and polyester staple spun ring and rotor yarns and found reasonable agreement.
The slight difference in predicted and experimental specific stress-strain curves in case of rotor yarn might be the result of yarn structure due to rotor technology. Variation of migration and twist between both inner and outer layer in rotor yarn causes its structure to separate into two phases unlike unified helical structure in ring spun yarn. [72].
Figure 10 Predicted and experimental specific stress-strain curves of viscose ring and rotor staple yarns.
6.2.2 Predicted and experimental specific stress-strain curves of polyester yarns
The experimental and theoretical specific stress-strain curves for polyester ring and rotor yarns are drawn in the figure 11. The polyester yarns could not present good results as by viscose yarn for yarn specific stress-strain curves. Results indicate that predicted yarn specific stress-strain curve captured well the experimental results before yarn break. However, difference was observed at higher strains in both ring and rotor yarns which might be the result of higher slippage among the polyester fibers.
Polyester fibers consist of amorphous and crystalline regions and another amorphous region taking a phase called mesamorphous phase. During fiber stress-strain process, amorphous region initially align similar to mesamorphous phase. Subsequently, the load strains the bonds in both crystalline and amorphous phases and slippage occurs [73].
26

Figure 11 Predicted and experimental specific stress curves of polyester ring and rotor staple yarns
6.2.3 Predicted and experimental specific stress-strain curves of carded cotton yarns
The experimental and theoretical specific stress-strain curves for cotton carded ring and rotor yarns are drawn in the figure 12.
The predicted specific stress-strain curves have a reasonable agreement with the experimental specific stress-strain curves before the yarn break. Again, the higher difference near the breaking point of specific stress-strain curves for rotor yarns might be attributed to the structure of rotor yarn and variability in strength and fineness of cotton fibers. The specific stress-strain curves are more linear as compared with viscose and polyester yarn curves due to the chemical nature of cotton fiber.
Figure 12a Predicted and experimental specific stress curves of carded cotton ring and rotor staple yarns
27

Figure 12b Predicted and experimental specific stress curves of carded cotton ring and rotor staple yarns
6.2.4 Predicted and experimental specific stress-strain curves of combed cotton yarns
The experimental and theoretical specific stress-strain curves for combed cotton yarns are shown in the figure 13. The predicted yarn specific stress-strain curves captured well the experimental specific stress-strain curves before break of yarns. Again the specific stress-strain curves are more linear as compared with viscose and polyester yarn curves. The predicted and experimental specific stress-strain curves exhibited less difference because of better orientation in combed cotton yarn and also due to the longer staple fiber used in combed yarns.
Figure 13 Predicted and experimental specific stress-strain curves of combed cotton staple yarns
6.2.5 Predicted and experimental specific stress-strain curves of worsted yarns
The experimental and theoretical stress-strain curves for worsted yarns are presented in the figure 14. The predicted yarn specific stress-strain curves have good agreement with the experimental curves before break of yarns. The difference near the breaking point of yarn for 23 tex yarn is also attributed to variability in the wool fiber fineness, strength and length.
28

Figure 14 Predicted and experimental specific stress-strain curves of worsted staple yarns
6.2.6 Predicted and experimental specific stress-strain curves of acrylic staple spun yarns
The experimental and theoretical specific stress-strain curves for acrylic yarns are produced in the figure 15. The predicted yarn specific stress-strain curves have good agreement with the experimental specific stress-strain curves before break of yarns for both types of studied yarn. The results of yarn specific stress have increasing agreement near to the point of break.
Figure 15 Predicted and experimental specific stress-strain curves of acrylic staple yarns
7. Evaluation of the results and new finding
This thesis presents a mathematical model that predicts fiber stress utilization along with its validation for staple spun yarns. The theoretical model considers fiber stress-strain curve, twist angle, yarn contraction ratio and fiber orientation. The four types of coefficient of fiber stress utilization from Gegauff’s model, single integral model, double integral model and k times single integral model were predicted and compared with the experimental coefficient of fiber stress utilization. Further the specific stress-strain curves for different types of yarns were estimated from the knowledge of predicted coefficient of fiber stress utilization and the experimental fiber specific stress-strain curves.
7.1 Conclusions
It can be concluded that the yarn specific stress strain curves are always lying under the fiber specific stress strain curves for all types of yarns studied. The shape of the fiber and yarn curves are similar for one type of yarn materials. The ring yarn specific stress strain curves are occupying position above the rotor yarns specific stress strain curves. The experimental coefficient of fiber stress utilization is also higher than rotor yarns. We can also summarize for predicted and experimental coefficient of fiber stress utilization of viscose, cotton (carded and combed), polyester, wool and acrylic yarns as shown through figure 4 to 9 in section 6.
29

o Coefficient of fiber stress utilizations from Gegauff’s model are relatively far from experimental coefficient of fiber stress utilization curves on graph in term of their position as well as shapes for all type of yarns.
o The predicted coefficient of fiber stress utilization curves from single integral equation have a similar shape to the experimental coefficient of fiber stress utilization curves but these are lying too high in our graph near Gegauff’s straight lines . Both Gegauff’s model and single integral model overestimate the coefficient of fiber stress utilization.
o When multiplying the coefficient of fiber stress utilization curves c1 by the empirical constant k the results are so close to experimental coefficient of fiber stress utilization curve e but it is without logical interpretation.
o It was interesting phenomena that one common empirical parameter k = 0.79 satisfies to all viscose, wool, acrylic and cotton ring yarns while another common value k = 0.55 fulfils to all rotor yarns.
o One empirical value of k gives us an insight about the prediction of coefficient of fiber stress utilization curves c2 from our double integral model considering fiber orientation in yarn. That is why we are able to explain technically that the position of predicted coefficient of fiber stress utilization curves c2 lie in close contact with curves k. c1 in all the graphs.
o The suitable value of parameter C in double integral model is also interesting which is synchronized with the fiber directional distribution in the yarn. The relatively higher parameter of C = 4.9 was necessary to choose for viscose, cotton (carded), wool and acrylic ring yarns due to controlled drafting process which produced the fiber directions concentrated mostly round helical model angle β.
o We have to choose considerably smaller common value C = 1.6 for rotor viscose and cotton yarns, which might be due to poor fiber orientation and more short fiber portions in these yarns.
o We have to use a little less value of empirical constant k = 0.7 and higher value of parameter C = 5.5 for combed cotton yarns which reveals that fiber orientation in combed cotton yarns is enriched due to the combing process.
o The considerable lower value of parameter C = 2.0 and k = 0.60 for ring yarns and C = 1.17 and k = 0.51 for rotor yarns enable us for evaluation of coefficient of fiber stress utilization in polyester yarns which might be due to higher slippage among the fibers in these yarns.
It can also be concluded from figure 10 through 15 from section 5 that predicted yarn specific stress-strain curve agreed well with the experimental yarn specific stress-strain curves for all type of yarns before the process of yarn break. The higher difference in specific stress for carded cotton and wool yarn near the breaking point might be the result of variation in strength, staple length and fineness of these natural fiber materials. The slight difference between predicted and experimental curves in rotor yarns might be the result of the structure of rotor yarn due to difference in twist and migration between inner and outer yarns layers.
We are unable to predict the coefficient of fiber stress utilization at lower strains 0.02 (2%) and higher values of strains because of catastrophic failure due to pre-tensioned yarn and higher friction near the point of break. All our results are valid for standard yarn twist.
7.2 Recommendations
o There is an important question of research regarding polyester fiber. The lower value for fiber orientation parameter C gives us an insight that there may be some reason behind, which can affect coefficient of fiber stress utilization of polyester fiber. The experimental coefficient of fiber stress utilization of polyester fiber is increased tremendously after 0.07 to 0.08 strain as
30
compared with the predicted coefficient of fiber stress utilization. The reason may be studied up to microscopic level.
o The prediction of coefficient of fiber stress utilization in the yarn and yarn specific stress- strain curves might be evaluated up to the point of yarn break by modification of the mathematical model including the effect of coefficient of variation in fiber breaking strength and strain, variability of fiber crimp and the friction among the fibers (slippage effect).
8. References
[1] B. C. Goswami, J. G. Martindale, and F. L. Scardino, Textile yarns; Technology, stracture,
and applications. John Wiley and sons, 1977. [2] M. M. Platt, “Mechanics of Elastic Performance of Textile Materials Part VI: Influence of
Yarn Twist on Modulus of Elasticity,” Text. Res. J., vol. 20, no. 10, pp. 665–667, 1950. [3] J. W. S. Hearle, “Theoretical Analysis of the Mechanics of Twisted Staple Fiber Yarns,” Text.
Res. J., vol. 35, no. 12, pp. 1060–1071, 1965. [4] C. M. Geaguff, “Strength and elasticity of cotton threads,” Bull. Soc. Ind. Mulhouse, vol. 77,
pp. 153–176, 1907. [5] B. Neckář and D. Das, “Tensile behavior of staple fiber yarns part I: theoretical models,” J.
Text. Inst., pp. 1–9, 2016. [6] W. English, The textile industry. London: Longmans,Green, 1967. [7] H. P. Gurney, “The distribution of stresses in cotton products,” J. Text. Inst., vol. 16, pp.
T269–T289, 1925. [8] F. T. Peirce, “Tensile tests for cotton yarns–‘the weakest link’ theorems on the strength of long
and of composite specimens,” J. Text. Inst, vol. 17, pp. T355–368, 1926. [9] R. R. Sullivan, “A theoretical approach to the problem of yarn strength,” J. Appl. Phys., vol.
13, no. 3, pp. 157–167, 1942. [10] M. M. Platt, “Mechanics of elastic performance of textile materials III. Some aspects of stress
analysis of textile structures—continuous-filament yarns,” Text. Res. J., vol. 20, no. 1, pp. 1–15, 1950.
[11] J. Gregory, “The strength of twisted yarn elements in relation to the properties of the constituent fibers,” J. Text. Inst., vol. 41, pp. T499–T512, 1953.
[12] J. Gregory, “The strength of artificial yarn elements in relation to bulk and twist,” J. Text.
Inst., vol. 41, pp. T30–T52, 1953. [13] J. Gregory, “The relation between strength measurements made on fiber, fiber bundles, yarns
and cloths,” J. Text. Inst, vol. 41, pp. T515–T515, 1953. [14] J. W. S. Hearle, “29—The mechanics of twisted yarns: The influence of transverse forces on
tensile behaviour,” J. Text. Inst. Trans., vol. 49, no. 8, pp. T389–T408, 1958. [15] J. W. S. Hearle, H. El-Behery, and V. M. Thakur, “The mechanics of twisted yarns: theoretical
developments,” J. Text. Inst. Proc., vol. 52, no. 5, pp. P203–P203, 1961. [16] J. W. S. Hearle, “8—On the theory of the mechanics of Twisted Yarns,” J. Text. Inst., vol. 60,
no. 3, pp. 95–101, 1969. [17] J. W. S. Hearle, P. Grosberg, and S. Backer, Structural mechanics of fibers, yarns, and fabrics.
Wiley-Interscience, 1969. [18] J. W. S. Hearle, “Theoretical analysis of the mechanics of twisted staple fiber yarns,” Text.
Res. J., vol. 35, no. 12, pp. 1060–1071, 1965. [19] L. R. G. Treloar and G. Riding, “16—A theory of the Stress–Strain properties of continuous-
filament yarns,” J. Text. Inst. Trans., vol. 54, no. 4, pp. T156–T170, 1963. [20] L. R. G. Treloar, “Rubber model of yarns and cords,” J. Appl. Phys., vol. 13, p. 314, 1962. [21] L. R. G. Treloar, “A migrating-filament theory of yarn properties,” J. Text. Inst., vol. 56, pp.
T359–T377, 1965. [22] H. W. Holdaway, “Theoretical model for predicting the strength of single worsted yarns,” J.
Text. Inst., vol. 56, no. 11, pp. T121–T144, 1965. [23] J. L. White, C. C. Cheng, and K. E. Duckett, “An Approach to Friction Effects in Twisted
Yarns,” Text. Res. J., vol. 46, no. 7, pp. 496–501, 1976. [24] C. C. Cheng, J. L. White, and K. E. Duckett, “A Continuum Mechanics Approach to Twisted
31

Yarns,” Text. Res. J., vol. 44, no. 10, pp. 798–803, 1974. [25] G. A. Carnaby and P. Grosberg, “Tensile behaviour of staple fibre yarns at small extensions,”
J. Text. Inst., vol. 67, pp. 299–308, 1967. [26] J. J. Thwaites, “A continuum model for yarn mechanics,” NATO Adv. study Inst., vol. 87,
1979. [27] N. Pan, T. Hua, and Y. Qiu, “Relationship between fiber and yarn strength,” Text. Res. J., vol.
71, no. 11, pp. 960–964, 2001. [28] N. Pan, “Development of a constitutive theory for short fiber yarns: Mechanics of staple yarn
without slippage effect,” Text. Res. J., vol. 62, no. 12, pp. 749–765, 1992. [29] N. Pan, “Development of a Constitutive Theory for Short Fiber Yarns Part II: Mechanics of
Staple Yarn With Slippage Effect,” Text. Res. J., vol. 63, no. 9, pp. 504–514, 1993. [30] N. Pan, “Prediction of statistical strengths of twisted fibre structures,” J. Mater. Sci., vol. 28,
no. 22, pp. 6107–6114, 1993. [31] M. L. Realff, N. Pan, M. Seo, M. C. Boyce, and S. Backer, “A stochastic simulation of the
failure process and ultimate strength of blended continuous yarns,” Text. Res. J., vol. 70, no. 5, pp. 415–430, 2000.
[32] E. Önder and G. Baser, “A comprehensive stress and breakage analysis of staple fiber yarns Part I: Stress analysis of a staple yarn based on a yarn geometry of conical helix fiber paths,” Text. Res. J., vol. 66, no. 9, pp. 562–575, 1996.
[33] E. Önder and G. Baser, “A Comprehensive Stress and Breakage Analysis of Staple Fiber Yams Part II: Breakage Analysis of Single Staple Fiber Yams,” Text. Res. J., vol. 66, no. 10, pp. 634–640, 1996.
[34] L. V. Langenhove, “Simulating the mechanical properties of yarn based on the properties and arrangement of its fibers,Part I:the finite element model,” Text. Res. J., vol. 67, pp. 263–268, 1997.
[35] L. V. Langenhove, “Simulating the mechanical properties of a yarn based on the properties and arrangement of its fibers, Part II: results of simulation,” Text. Res. J., vol. 67, pp. 342–347, 1997.
[36] L. V. Langenhove, “Simulating the mechanical properties of a yarn based on the properties and arrangement of its fibers,” Text. Res. J., vol. 67, pp. 406–412, 1997.
[37] P. J. Morris, J. H. Merkin, and R. W. Rennell, “Modelling of yarn properties from fibre properties,” J. Text. Institute. Part 1, Fibre Sci. Text. Technol., vol. 90, no. 3, pp. 322–335, 1999.
[38] A. N. Solovev, The Prediction of Yarn Properties in Cotton Processing. Moskva, 1958. [39] Usenko, The Use of Staple Fiber in Spinning. Moskva, 1958. [40] J. F. Bogdan, “The characterization of spinning quality,” Text. Res. J., vol. 26, no. 9, pp. 720–
730, 1956. [41] J. F. Bogdan, “The prediction of cotton yarn strengths1,” Text. Res. J., vol. 37, no. 6, pp. 536–
537, 1967. [42] T. A. Subramanian, K. Ganesh, and S. Bandyopadhyay, “34—A generallized Equation for
Predicting the Lea Strength of Ring-Spun Cotton Yarns,” J. Text. Inst., vol. 65, no. 6, pp. 307–313, 1974.
[43] R. L. N. Iyengar and A. K. Gupta, “Proportion of Fiber Strength Utilized in the Single Yarn,” Text. Res. J., vol. 44, no. 7, pp. 489–492, 1974.
[44] R. L. N. Iyengar and A. K. Gupta, “Some Functions Involving Fiber Properties for Estimating Yarn Tenacity,” Text. Res. J., vol. 44, no. 7, pp. 492–594, 1974.
[45] Y. E. El Mogahzy, “Selecting cotton fiber properties for fitting reliable equations to HVI data,” Text. Res. J., vol. 58, no. 7, pp. 392–397, 1988.
[46] P. Neelakantan and T. A. Subramanian, “An Attempt to Quantify the Translation of Fiber Bundle Tenacity into Yarn Tenacity,” Text. Res. J., vol. 46, no. 11, pp. 822–827, 1976.
[47] M. D. Ethridge, J. D. Towery, and J. F. Hembree, “Estimating Functional Relationships Between Fiber Properties and the Strength of Open-End Spun Yarns’,” Text. Res. J., vol. 52, no. 1, pp. 35–45, 1982.
[48] T. Swiech, “Influnence of fiber properties on the strength of rotor spun yarns,” melliandTextilber, vol. 68, pp. 874–877, 1987.
32

[49] O. M. A. Hafez, “Yarn-strength prediction of American cottons,” Text. Res. J., vol. 48, no. 12, pp. 701–705, 1978.
[50] L. Hunter and E. Gee, “Correlation between cotton fber properties and ring-yarn and rotor-yarn,” Melliand Textilber Textilberichte Int. Text. Reports, vol. 63, no. 6, pp. 407–411, 1982.
[51] R. Rajamanickam, S. M. Hansen, and S. Jayaraman, “Analysis of the modeling methodologies for predicting the strength of air-jet spun yarns,” Text. Res. J., vol. 67, no. 1, pp. 39–44, 1997.
[52] R. J. Chasmawala, S. M. Hansen, and S. Jayaraman, “Structure and properties of air-jet spun yarns,” Text. Res. J., vol. 60, no. 2, pp. 61–69, 1990.
[53] H. W. Krause and H. A. Soliman, “Theoretical study of the strength of single jet false twist spun yarns,” Text. Res. J., vol. 60, no. 6, pp. 309–318, 1990.
[54] I. Frydrych, “A new approach for predicting strength properties of yarn,” Text. Res. J., vol. 62, no. 6, pp. 340–348, 1992.
[55] W. Zurek, The Structure of Yarn. Poland: Warsaw, 1975. [56] W. Zurek, I. Frydrych, and S. Zakrzewski, “A method of predicting the strength and breaking
strain of cotton yarn,” Text. Res. J., vol. 57, no. 8, pp. 439–444, 1987. [57] S. Das and A. Ghosh., “cotton fiber -to -yarn engineering; A simulated annealing approach,”
FIBERS Text. East. Eur., vol. 23, no. 3, pp. 51–53, 2015. [58] A. Ghosh, S. Ishtiaque, S. Rengasamy, P. Mal, and A. Patnaik, “Predictive models for strength
of spun yarns: An overview,” AUTEX Res. J., vol. 5, no. 1, pp. 20–29, 2005. [59] A. Ghosh, “A theoretical investigation on the generation of strength in staple yarns,” Fibers
Polym., vol. 7, no. 3, pp. 310–316, 2006. [60] B.A.Sami and H. Naima, “Prediction of the Mechanical behavior of Open-End and Ring
SPUN Yarns,” J. Appl. Sci., vol. 9, no. 8, pp. 1466–2009, 2009. [61] M. Dang, S. Wang, and G. Liu, “Theoretical prediction on tensile model of wool/spandex
core-spun yarn,” J. Ind. Text., vol. 37, no. 4, pp. 301–313, 2008. [62] A. Guha, R. Chattopadhyay, and Jayadeva, “Predicting yarn tenacity: a comparison of
mechanistic, statistical, and neural network models,” J. Text. Inst., vol. 92, no. 2, pp. 139–145, 2001.
[63] T. Liu, K. F. Choi, and Y. Li, “Mechanical Modeling of Singles Yarn,” Text. Res. J., vol. 77, no. 3, pp. 123–130, 2007.
[64] K. Sriprateep and A. Pattiya, “Computer aided geometric modeling of twist fiber,” J. Comput.
Sci., vol. 5, no. 3, p. 221, 2009. [65] K. Sriprateep and E. L. J. Bohez, “CAD/CAE for stress–strain properties of multifilament
twisted yarns,” Text. Res. J., p. 0040517516636000, 2016. [66] M. Zubair, B. Neckář, and D. Das, “Tensile behavior of staple fiber yarns part II: model
validation,” J. Text. Inst., pp. 1–4, 2016. [67] B. Neckář and D. Das, Theory of structure and mechanics of fibrous assemblies. Woodhead
Publishing India, 2012. [68] B. Neckář, M. K. Soni, and D. Das, “Modelling of radial fiber migration in yarns,” Text. Res.
J., vol. 76, no. 6, pp. 486–491, 2006. [69] B. Neckar, “Cross-dimensions and stress-strain curve of yarns,” Liberec, 1981. [70] M. Dang, S. Wang, and G. Liu, “Theoretical prediction on tensile model of wool/spandex
core-spun yarn,” J. Ind. Text., vol. 37, no. 4, pp. 301–313, 2008. [71] M. Zubair, B. Neckar, M. Eldeeb, and G. A. Baig, “Tensile behavior of staple fiber yarns, part
IV: experimental verification of predicted stress–strain curves,” J. Text. Inst., pp. 1–6, 2016. [72] P. R. Lord, “The structure of open-end spun yarn,” Text. Res. J., vol. 41, no. 9, pp. 778–784,
1971. [73] S. Basu, “Tensile deformation of fibers used in textile industry,” Agil. Technol. Appl. Note, pp.
1–7, 2012.
33
List of research articles published
1 Publications in Journal
1. M. Zubair, B. Neckář, and D. Das, “Tensile behavior of staple fiber yarns part II: model validation,” J. Text. Inst., pp. 1–4, 2016.
(Published on line)
2. M. Zubair, M. Eldeeb, and B. Neckar, “Tensile behavior of staple fiber yarns part III: comparison of mathematical models,” J. Text. Inst., pp. 1–4, 2016.
(Published on line)
3. M. Zubair, B. Neckar, M. Eldeeb, and G. A. Baig, “Tensile behavior of staple fiber yarns, partIV: experimental verification of predicted stress–strain curves,” J. Text. Inst., pp. 1–6, 2016. (Published on line)
4. M. Zubair, B. Neckář, and Z. A. Malik, “Predicting Specific Stress of Cotton Staple Ring Spun Yarns: Experimental and Theoretical results,” FIBERS Text. East. Eur., vol. 2, 2017. (Accepted)
5. M. Zubair, H. S. Maqsood, and B. Neckář, “Impact of Filling Yarns on Woven Fabric Performance,” Fibres Text. East. Eur., 2016.
(Published) 6. M. Zubair, T. Hussain, S. Hussain, and A. Mazari, “Development of polyester/cellulosic blend woven fabric for better comfort/Dezvoltarea tesaturilor din amestec poliester/celuloza pentru un confort mai bun,” Ind. Textila, vol. 67, no. 6, p. 359, 2016.
(Published)
7. H. S. Maqsood, U. Bashir, M. Zubair, J. Wiener, and J. Militky, “Cationization of cellulose fibers for composites,” J. Text. Inst., pp. 1–6, 2016. (Published on line)
2 Contribution in conference proceeding
1. M. Zubair and B. Neckář, “Stress strain curves for PES fiber and yarns,” in Strutex 2014, 2014, pp. 49–52.
2. M. Zubair, B. Neckar, and H. S. Maqsood, “Experimental and predicted specific stresss strain curves of worsted yarns,” in Strutex, 2016, pp. 125–130.
3. M. Zubair and B. Neckar, “Linen fiber and yarn stress strain curves,” in Workshop for PhD
students of faculty of textile engineering and faculty of mechanical engineering TUL, 2015, pp. 193–197.
4. M. Zubair and B. Neckář, “Specific stress strain curves of viscose yarn:experimental verification,” in Workshop for PhD students of faculty of textile engineering and mechanical engineering
TUL, 2016, pp. 149–152. 5. H. S. Maqsood, M. Zubair, J. Wiener, and J. Militky, “Reinforcement of cationized cellulose in anionic matrix,” in Workshop for PhD students of faculty of textile engineering and faculty of
mechanical engineerin TUL, 2016, pp. 91–97
34

Curriculum vitae
Personal
Information
First name / Surname Muhammad Zubair Address House C-1, National Textile University, Faisalabad Pakistan Mobile +92-333-6598053, +420-774-690845 E-mail(s) [email protected] [email protected] Nationality Pakistani Place and date of birth District Mandi Bahauddin Punjab (Pakistan) on 10th of April, 1968. Status and Gender Married; Male Work experience Dates 05/2013 to-date Occupation or position
Asstt. Professor, Department of Fabric Manufacturing, National Textile University, Faisalabad, Pakistan.
Dates 09/2003 to 04/2013 Occupation or position
Lecturer, Department of Fabric Manufacturing, National Textile University, Faisalabad, Pakistan.
Dates 2008 to 2009 Occupation or position
Ag. Head, Department of Fabric Manufacturing, National Textile University, Faisalabad, Pakistan.
Dates 1999 to 2002 Occupation or position
Mills Manager, Weaving, Crescent Mills Ltd. Faisalabad, Pakistan.
Dates 1997 to 1999 Occupation or position
Weaving Manager, Weaving, Crescent Mills Ltd. Faisalabad, Pakistan
Dates 1995 to 1996 Occupation or position
Deputy Manager, Weaving, Crescent Textile Mills Ltd. Faisalabad, Pakistan.
Dates 1993 to 1994, Asst. Manager, Weaving, Crescent Textile Mills Ltd. Faisalabad, Pakistan.
Education Dates November 2013 to present Title / Qualification PhD student (Textile Techniques and Material Engineering) Name and type of organisation
Department of Textile Technology, Faculty of Textile Engineering, Technical University of Liberec.
Research field/ Tensile Behaviour of Staple Spun Yarns
35

Thesis topic
Dates 2008 to 2010 Title of qualification
awarded
MS Textile Management
Name and type of organisation
Department of Textile Engineering, Textile University of Faisalabad, Faisalabad, Pakistan.
Dates 2010 to 2012 Title of qualification
awarded
MSc. Textile Engineering
Name and type of organisation
National Textile University, Faisalabad, Pakistan.
Dates 1989 to 1993 Title of qualification
awarded BSc. Textile Engineering
Name and type of organisation
National College of Textile Engineering University of Engineering and Technology, Lahore, Pakistan.
Dates 1987 to 1989 Title of qualification
awarded BSc. Physics & Mathematics.
Name and type of organisation
University of Punjab, Lahore, Pakistan.
Brief description of the current expertise, research and scientific activities
Studies Textile Engineering Field Textile Techniques and Material Engineering Specialization Textile Technology List of exams passed 1. Mathematical statistics and data analysis KHT / D 02. (11.03.2014) 2. Structural theory of fibrous assemblies KTT/ D11. (14.04.2014) 3. Mechanics of fibrous assemblies DFT / D 43 (14.10.2014) 4. Structural mechanics of fibrous assemblies KTT / D 51. (3.03.2015) 5. Experimental technique of the textile DFT / D 33. (27.09.2016) SDE 6. State doctorial examination completed on 07.12.2016.
36

Record of the state doctoral exam
37
Recommendation of the supervisor
38

Reviews of the opponents
39

40

41

42