tennessee technological university · results on nsse's ten engagement indicators (eis)...
TRANSCRIPT

IPEDS: 221847
Note:
The Major Field Report was formatted for printing. When viewing on screen in Excel,
some content may appear truncated or oddly formatted. This is normal. Increasing the
zoom level or viewing the report in Print Preview will improve on-screen display.
Tennessee Technological University
NSSE 2016 Major Field Report, Part I
Within-Institution Comparisons
Comparing your students' responses across groups of related majors within your institution

About Your Major Field Report, Part I
Related-Major Groups
Sample
Class
Technical Requirements
Report Sections
Composition of Related-Major Groups (p. 3) How your NSSE 2016 Major Field Report categories were selected and which majors were included in each group.
Response frequencies for all demographic questions for your institution by related-major group.
Number of respondents, mean and standard deviation by related-major group for all survey items except demographics.
Response frequencies by related-major group for all survey items except demographics.
Results on student participation in six High-Impact Practices (HIPs). See your High-Impact Practices report for more details.
Results on NSSE's ten Engagement Indicators (EIs) organized into four themes. See your Engagement Indicators report for
more details.
Respondent Profile (pp. 49-62)
Engagement Indicators (pp. 4-7)
High-Impact Practices (p. 8)
Item Summary Statistics (pp. 43-48)
Frequency Distributions (pp. 9-42)
NSSE 2016 Major Field Report, Part IAbout This Report
Related-major groups with fewer than 20 respondents in a given class are not reported (columns are blank). Although 20 is a minimum requirement, keep in mind that any statistical
result requires a sufficient number of respondents per group to produce a reliable estimate. Due to the disaggregation of results by student-reported major, the Major Field Report results
are unweighted.
Self-reported majors (first major given if two were reported) were identified from the survey. Your institution had the option to customize how these were grouped, using up to ten
related-major groups. Institutions choosing not to customize their major categories receive NSSE's ten default groups. The groups used in this report are shown on page 3.
This report is based on information from all randomly selected or census-administered students for your institution. Targeted and locally administered oversamples and other non-
randomly selected students are not included.
Results are presented separately by institution-reported class level. Keep in mind that majors are student-reported. First-year students may report intended majors that have not yet been
declared. Also, much of the first-year experience may take place outside of the major field. For these reasons, first-year results should be interpreted with caution.
NSSE data serve to identify institutional strengths and weaknesses in reference to selected comparison institutions, yet
institution-level comparisons may not capture important variation in student engagement that can be found within key sub-
populations such as major. NSSE urges institutions to "look within," calling attention to the need to examine variation in
the student experience at your institution. This report provides an overview of your students' responses by groups of
related majors.
NSSE results included in MFR, Part I ● Engagement Indicators
● High-Impact Practices
● Frequency Distributions
● Item Summary Statistics
● Respondent Profile
NSSE 2016 MAJOR FIELD REPORT, PART I • 2

Date Confirmed: 7/26/2016 Selection Method:
Arts and Humanities (First-year N=18, Senior N=19)
Natural-Math Science (First-year N=30, Senior N=55)
Social Sciences (First-year N=18, Senior N=22)
Education (First-year N=30, Senior N=80)
Engineering (First-year N=77, Senior N=95)
Interdisc. Studies (First-year N=5, Senior N=38)
Nursing (First-year N=24, Senior N=18)
Ag and Human Ecology (First-year N=18, Senior N=19)
Business (First-year N=32, Senior N=48)
Health Professions (First-year N=13, Senior N=7)
Unassigned Majors (First-year N=0, Senior N=3)
NSSE 2016 Major Field Report, Part IComposition of Related-Major Groups
Tennessee Technological University
Allied health; Anthropology; Architecture; Art history; Astronomy; Atmospheric science (including meteorology); Bioengineering; Biomedical engineering; Business education; Computer information systems; Criminology; Engineering (general); Entrepreneurial studies; Ethnic studies; Forensics; Gender
studies; Geography; Hospitality and tourism; Humanities (general); Information systems; International relations; Justice administration; Law; Liberal arts and sciences; Mass communications and media studies; Military science; Network security and systems; Neuroscience; Occupational safety and health; Other
fine and performing arts; Other humanities; Other language and literature; Other physical sciences; Petroleum engineering; Philosophy; Physiology and developmental biology; Public administration, policy; Public safety and emergency management; Rehabilitation sciences; Religion; Social sciences (general);
Social studies education; Speech; Speech therapy; Statistics; Supply chain and operations management; Technical, vocational studies; Telecommunications; Theater or drama; Theological studies, ministry; Urban planning
Criminal justice; Other social sciences; Political science; Psychology; Social work; Sociology
Arts, fine and applied; Early childhood education; Education (general); Elementary, middle school education; Kinesiology; Mathematics education; Music; Music or art education; Other education; Parks, recreation, leisure studies, sports mgmt.; Physical education; Secondary education; Special education
Aero-, astronautical engineering; Chemical engineering; Civil engineering; Computer engineering and technology; Computer science; Electrical or electronic engineering; Industrial engineering; Information technology; Materials engineering; Mechanical engineering; Other computer science and technology;
Other engineering; Software engineering
Environmental science/studies; Multi, Interdisciplinary studies; Natural resources and conservation; Professional studies (general)
Nursing
Agriculture; Family and consumer studies; Nutrition and dietetics; Other agriculture and natural resources; Veterinary science
This page documents how your NSSE 2016 Major Field Report groups were selected and which majors were included in each related-major group. Students’ self-reported majors (first major if two were
reported) were assigned to a standard list of 139 majors. Institutions had the option to customize how these were grouped, using up to ten related-major groups. Institutions choosing not to customize receive
NSSE’s ten default groups (or, if available, the customized groups from your last participation in the updated survey (since 2013)).
CUSTOM GROUPS–Your institution did not customize this year so we applied your prior-year selections.
Broadcast communications; Communications (general); English (language and literature); French (language and literature); General studies; History; Journalism; Other communications; Other, not listed; Public relations and advertising; Spanish (language and literature); Undecided, undeclared
Biochemistry or biophysics; Biology (general); Biomedical science; Botany; Cell and molecular biology; Chemistry; Earth science (including geology); Marine science; Mathematics; Microbiology or bacteriology; Natural science; Other biological sciences; Physical sciences (general); Physics; Zoology
Accounting; Business administration; Economics; Finance; International business; Management; Management information systems; Marketing; Organizational leadership or behavior; Other business
Dentistry; Health science; Health technology (medical, dental, laboratory); Healthcare administration and policy; Medicine; Occupational therapy; Other health professions; Pharmacy; Physical therapy
NSSE 2016 MAJOR FIELD REPORT, PART I • 3
Theme
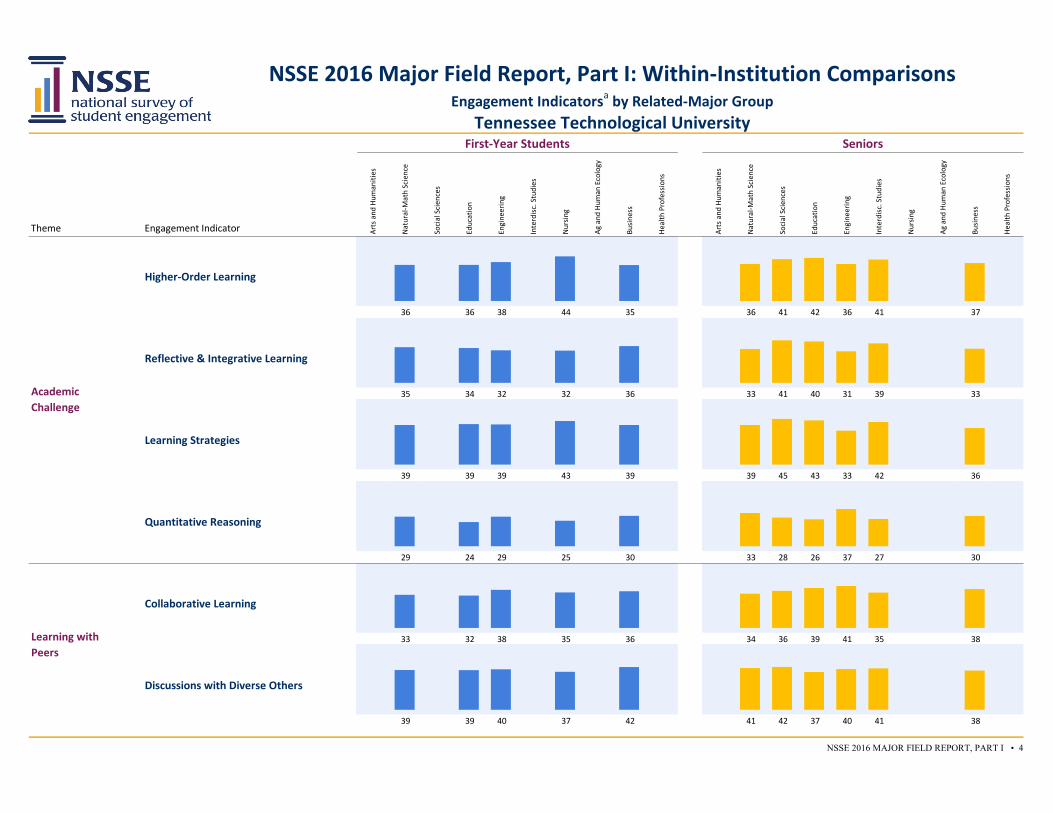
36 36 38 44 35 36 41 42 36 41 37
35 34 32 32 36 33 41 40 31 39 33
39 39 39 43 39 39 45 43 33 42 36
29 24 29 25 30 33 28 26 37 27 30
33 32 38 35 36 34 36 39 41 35 38
39 39 40 37 42 41 42 37 40 41 38
Academic
Challenge
Higher-Order Learning
Reflective & Integrative Learning
Learning Strategies
Quantitative Reasoning
Learning with
Peers
Collaborative Learning
Discussions with Diverse Others
NSSE 2016 Major Field Report, Part I: Within-Institution ComparisonsEngagement Indicatorsa by Related-Major Group
Tennessee Technological UniversityFirst-Year Students Seniors
Hea
lth
Pro
fess
ion
s
Engagement Indicator Inte
rdis
c. S
tud
ies
Engi
nee
rin
g
Inte
rdis
c. S
tud
ies
Nu
rsin
g
Ag
and
Hu
man
Eco
logy
Bu
sin
ess
Hea
lth
Pro
fess
ion
s
Engi
nee
rin
g
Nat
ura
l-M
ath
Sci
ence
Soci
al S
cien
ces
Edu
cati
on
Art
s an
d H
um
anit
ies
Nat
ura
l-M
ath
Sci
ence
Nu
rsin
g
Ag
and
Hu
man
Eco
logy
Bu
sin
ess
Soci
al S
cien
ces
Edu
cati
on
Art
s an
d H
um
anit
ies
NSSE 2016 MAJOR FIELD REPORT, PART I • 4

Theme
NSSE 2016 Major Field Report, Part I: Within-Institution ComparisonsEngagement Indicatorsa by Related-Major Group
Tennessee Technological UniversityFirst-Year Students Seniors
Hea
lth
Pro
fess
ion
s
Engagement Indicator Inte
rdis
c. S
tud
ies
Engi
nee
rin
g
Inte
rdis
c. S
tud
ies
Nu
rsin
g
Ag
and
Hu
man
Eco
logy
Bu
sin
ess
Hea
lth
Pro
fess
ion
s
Engi
nee
rin
g
Nat
ura
l-M
ath
Sci
ence
Soci
al S
cien
ces
Edu
cati
on
Art
s an
d H
um
anit
ies
Nat
ura
l-M
ath
Sci
ence
Nu
rsin
g
Ag
and
Hu
man
Eco
logy
Bu
sin
ess
Soci
al S
cien
ces
Edu
cati
on
Art
s an
d H
um
anit
ies
24 26 17 21 23 27 28 29 24 23 21
41 37 36 41 41 37 45 41 37 44 37
41 44 42 44 47 42 42 43 41 43 42
34 34 32 39 35 30 32 31 29 35 31
Campus
Environment
Quality of Interactions
Supportive Environment
Experiences with
Faculty
Student-Faculty Interaction
Effective Teaching Practices
NSSE 2016 MAJOR FIELD REPORT, PART I • 5

First-Year Students
Academic Challenge
35.5 35.5 38.0 43.8 35.2 14.2 11.1 13.5 10.5 13.8 30 30 74 24 32
34.7 34.1 31.7 31.5 35.9 13.4 10.2 10.6 11.2 11.0 30 29 76 24 32
38.9 39.3 39.2 42.7 39.0 12.8 12.8 13.8 13.4 14.6 30 29 73 22 32
29.1 23.8 29.0 25.0 29.8 15.5 16.2 15.8 15.1 15.7 30 30 76 24 32
Learning with Peers
32.5 31.7 37.5 34.8 36.0 14.1 10.6 12.0 12.2 13.1 30 29 77 24 31
39.0 38.8 39.5 37.2 41.8 15.7 16.4 13.6 17.4 15.4 29 29 75 23 31
Experiences with Faculty
24.2 25.7 17.2 20.8 22.8 15.9 17.0 13.8 12.7 15.2 30 28 76 24 32
41.3 36.7 35.6 41.0 41.4 10.9 11.7 13.1 11.1 11.3 30 30 76 24 32
Campus Environment
40.5 43.8 41.8 43.6 47.4 10.6 12.4 11.5 8.8 9.1 29 29 73 23 32
34.0 33.9 32.1 38.7 35.0 11.8 10.1 13.0 12.4 11.7 30 30 76 24 32
Theme/
Engagement Indicator
Discussions with
Diverse Others
Student-Faculty
Interaction
Effective Teaching
Practices
Quality of
Interactions
Supportive
Environment
Higher-Order
Learning
Reflective &
Integrative Learning
Learning Strategies
Quantitative
Reasoning
Collaborative
Learning
NSSE 2016 Major Field Report, Part I: Within-Institution ComparisonsEngagement Indicatorsa by Related-Major Group
Tennessee Technological University
Nu
rsin
g
Ag
and
Hu
man
Eco
logy
Bu
sin
ess
Hea
lth
Pro
fess
ion
s
Inte
rdis
c. S
tud
ies
Ag
and
Hu
man
Eco
logy
Ag
and
Hu
man
Eco
logy
Mean Standard deviationb N
Art
s an
d
Hu
man
itie
s
Nat
ura
l-M
ath
Scie
nce
Soci
al S
cien
ces
Edu
cati
on
Engi
nee
rin
g
Bu
sin
ess
Nu
rsin
g
Hea
lth
Pro
fess
ion
s
Art
s an
d
Hu
man
itie
s
Nat
ura
l-M
ath
Scie
nce
Inte
rdis
c. S
tud
ies
Engi
nee
rin
g
Bu
sin
ess
Hea
lth
Pro
fess
ion
s
Art
s an
d
Hu
man
itie
s
Nat
ura
l-M
ath
Scie
nce
Soci
al S
cien
ces
Edu
cati
on
Soci
al S
cien
ces
Edu
cati
on
Engi
nee
rin
g
Inte
rdis
c. S
tud
ies
Nu
rsin
g
NSSE 2016 MAJOR FIELD REPORT, PART I • 6

Seniors
Academic Challenge
36.5 40.9 42.3 36.3 40.7 37.0 15.4 13.9 14.9 14.6 14.2 12.4 55 22 79 91 38 47
32.8 41.5 40.4 30.8 38.7 33.4 11.9 14.6 12.5 11.9 14.6 10.0 55 21 79 94 38 48
38.8 44.8 43.1 33.0 41.8 35.7 14.9 14.5 13.9 15.2 16.2 13.6 54 21 78 94 38 48
32.8 28.2 26.3 36.5 26.7 29.7 16.9 13.6 17.3 16.8 17.8 13.8 55 22 79 94 37 48
Learning with Peers
33.6 36.4 39.3 41.3 34.7 37.9 13.2 16.2 14.5 12.8 15.1 11.6 52 22 78 95 38 48
40.7 41.9 37.1 39.8 40.5 38.3 15.8 14.4 15.3 15.6 16.8 15.2 55 21 79 95 38 47
Experiences with Faculty
27.0 27.7 29.0 24.5 23.2 21.5 16.1 14.5 16.1 13.9 16.0 13.3 54 22 77 91 38 47
36.7 44.6 40.9 36.7 44.3 37.2 13.5 12.8 17.5 14.0 16.4 14.2 55 22 79 94 38 48
Campus Environment
41.7 41.8 42.7 41.4 43.4 42.5 11.8 9.4 12.4 12.9 15.4 11.8 55 22 80 93 36 48
30.1 31.6 31.4 28.9 34.9 30.8 13.1 12.6 15.1 13.6 13.8 13.3 55 22 79 93 38 46
Theme/
Engagement Indicator
Discussions with
Diverse Others
Student-Faculty
Interaction
Effective Teaching
Practices
Quality of
Interactions
Supportive
Environment
Higher-Order
Learning
Reflective &
Integrative Learning
Learning Strategies
Quantitative
Reasoning
Collaborative
Learning
NSSE 2016 Major Field Report, Part I: Within-Institution ComparisonsEngagement Indicatorsa by Related-Major Group
Tennessee Technological University
Nu
rsin
g
Ag
and
Hu
man
Eco
logy
Bu
sin
ess
Hea
lth
Pro
fess
ion
s
Inte
rdis
c. S
tud
ies
Ag
and
Hu
man
Eco
logy
Ag
and
Hu
man
Eco
logy
Mean Standard deviationb N
Art
s an
d
Hu
man
itie
s
Nat
ura
l-M
ath
Scie
nce
Soci
al S
cien
ces
Edu
cati
on
Engi
nee
rin
g
Bu
sin
ess
Nu
rsin
g
Hea
lth
Pro
fess
ion
s
Art
s an
d
Hu
man
itie
s
Nat
ura
l-M
ath
Scie
nce
Inte
rdis
c. S
tud
ies
Engi
nee
rin
g
Bu
sin
ess
Hea
lth
Pro
fess
ion
s
Art
s an
d
Hu
man
itie
s
Nat
ura
l-M
ath
Scie
nce
Soci
al S
cien
ces
Edu
cati
on
Soci
al S
cien
ces
Edu
cati
on
Engi
nee
rin
g
Inte
rdis
c. S
tud
ies
Nu
rsin
g
NSSE 2016 MAJOR FIELD REPORT, PART I • 7
Art
s an
d H
um
anit
ies
Nat
ura
l-M
ath
Sci
ence
Soci
al S
cien
ces
Edu
cati
on
Engi
nee
rin
g
Inte
rdis
c. S
tud
ies
Nu
rsin
g
Ag
and
Hu
man
Eco
logy
Bu
sin
ess
Hea
lth
Pro
fess
ion
s
Art
s an
d H
um
anit
ies
Nat
ura
l-M
ath
Sci
ence
Soci
al S
cien
ces
Edu
cati
on
Engi
nee
rin
g
Inte
rdis
c. S
tud
ies
Nu
rsin
g
Ag
and
Hu
man
Eco
logy
Bu
sin
ess
Hea
lth
Pro
fess
ion
s
Item # % % % % % % % % % % % % % % % % % % % %
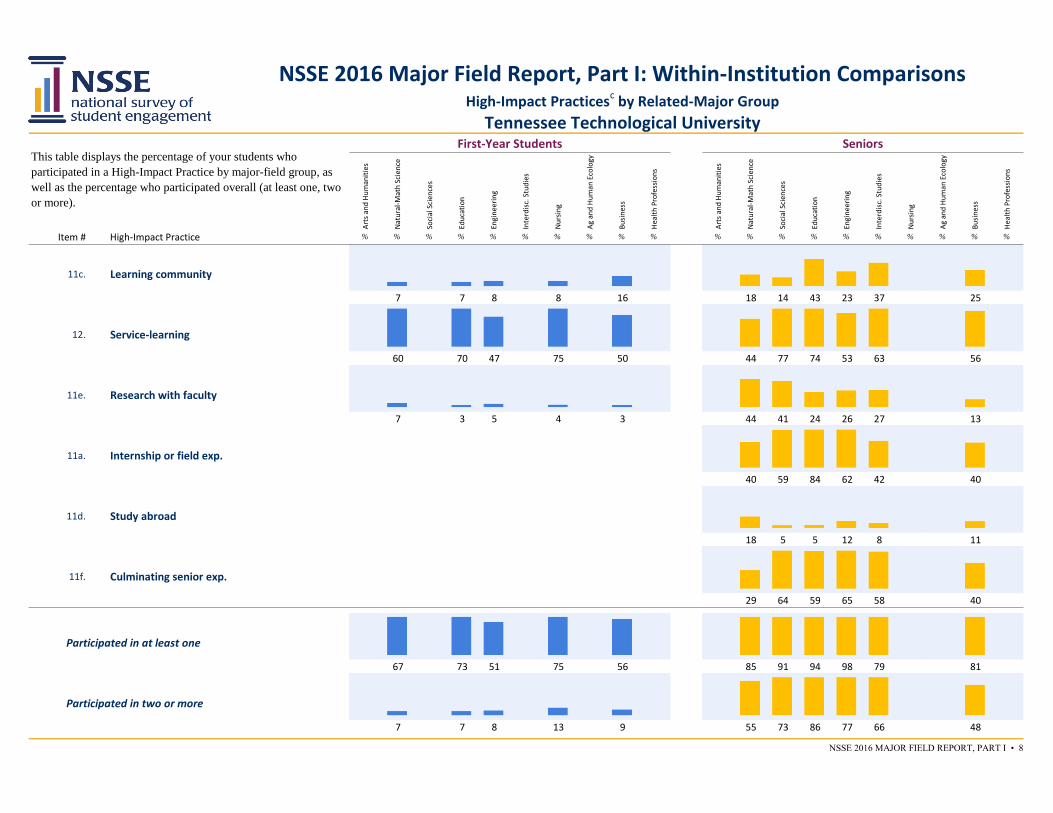
7 7 8 8 16 18 14 43 23 37 25
60 70 47 75 50 44 77 74 53 63 56
7 3 5 4 3 44 41 24 26 27 13
40 59 84 62 42 40
18 5 5 12 8 11
29 64 59 65 58 40
67 73 51 75 56 85 91 94 98 79 81
7 7 8 13 9 55 73 86 77 66 48
Participated in at least one
Participated in two or more
Learning community
Service-learning
Research with faculty
Internship or field exp.
Study abroad
Culminating senior exp.
11c.
12.
11e.
11a.
11d.
11f.
High-Impact Practice
First-Year Students Seniors
NSSE 2016 Major Field Report, Part I: Within-Institution ComparisonsHigh-Impact Practicesc by Related-Major Group
Tennessee Technological University
This table displays the percentage of your students who
participated in a High-Impact Practice by major-field group, as
well as the percentage who participated overall (at least one, two
or more).
NSSE 2016 MAJOR FIELD REPORT, PART I • 8

First-Year Students
Item wording
or description
Variable
name e Values f Response options Count % Count % Count % Count % Count % Count % Count % Count % Count % Count %
1. During the current school year, about how often have you done the following?
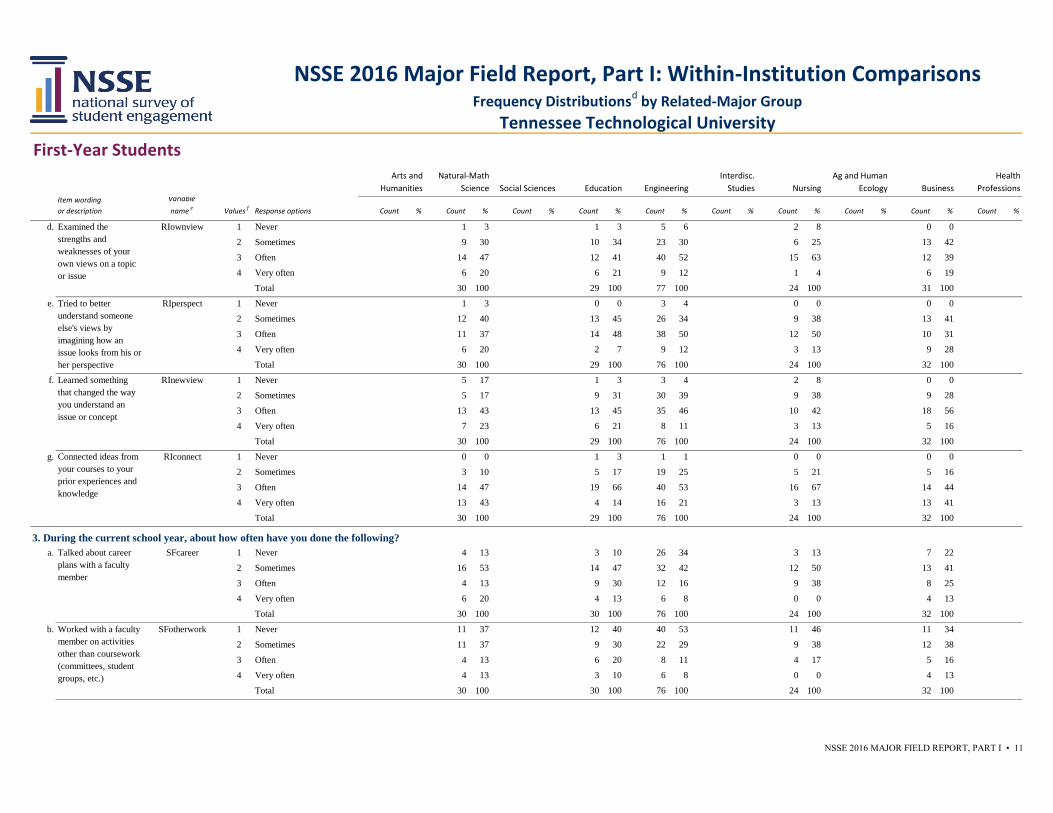
a. 1 Never 3 10 0 0 3 4 0 0 1 3
2 Sometimes 13 43 7 23 29 38 11 46 12 38
3 Often 6 20 16 53 30 39 9 38 10 31
4 Very often 8 27 7 23 15 19 4 17 9 28
Total 30 100 30 100 77 100 24 100 32 100
b. 1 Never 15 50 4 13 19 25 2 8 5 16
2 Sometimes 9 30 9 30 22 29 8 33 12 38
3 Often 1 3 8 27 22 29 10 42 6 19
4 Very often 5 17 9 30 13 17 4 17 9 28
Total 30 100 30 100 76 100 24 100 32 100
c. 1 Very often 3 10 2 7 4 5 1 4 2 6
2 Often 1 3 3 10 10 13 2 8 2 6
3 Sometimes 17 57 16 53 40 53 13 54 16 50
4 Never 9 30 9 30 22 29 8 33 12 38
Total 30 100 30 100 76 100 24 100 32 100
d. 1 Never 4 13 7 23 22 29 4 17 2 6
2 Sometimes 14 47 14 47 30 39 16 67 15 47
3 Often 7 23 4 13 21 27 4 17 12 38
4 Very often 5 17 5 17 4 5 0 0 3 9
Total 30 100 30 100 77 100 24 100 32 100
e. 1 Never 2 7 1 3 2 3 0 0 1 3
2 Sometimes 13 43 10 33 16 21 11 46 13 41
3 Often 8 27 15 50 37 48 9 38 10 31
4 Very often 7 23 4 13 22 29 4 17 8 25
Total 30 100 30 100 77 100 24 100 32 100
f. 1 Never 2 7 1 3 5 6 0 0 1 3
2 Sometimes 11 37 10 33 14 18 9 38 9 28
3 Often 11 37 16 53 38 49 10 42 16 50
4 Very often 6 20 3 10 20 26 5 21 6 19
Total 30 100 30 100 77 100 24 100 32 100
Arts and
Humanities
Natural-Math
Science Education Engineering
Interdisc.
Studies Nursing
Ag and Human
Ecology BusinessSocial Sciences
Health
Professions
Attended an art
exhibit, play or other
arts performance
(dance, music, etc.)
attendart
Asked questions or
contributed to course
discussions in other
ways
askquest
Prepared two or more
drafts of a paper or
assignment before
turning it in
drafts
Come to class without
completing readings or
assignments
unpreparedr
(Reverse-coded
version of
unprepared created
by NSSE.)
Asked another student
to help you understand
course material
CLaskhelp
Explained course
material to one or
more students
CLexplain
NSSE 2016 Major Field Report, Part I: Within-Institution ComparisonsFrequency Distributionsd by Related-Major Group
Tennessee Technological University
NSSE 2016 MAJOR FIELD REPORT, PART I • 9

First-Year Students
Item wording
or description
Variable
name e Values f Response options Count % Count % Count % Count % Count % Count % Count % Count % Count % Count %
Arts and
Humanities
Natural-Math
Science Education Engineering
Interdisc.
Studies Nursing
Ag and Human
Ecology BusinessSocial Sciences
Health
Professions
NSSE 2016 Major Field Report, Part I: Within-Institution ComparisonsFrequency Distributionsd by Related-Major Group
Tennessee Technological University
g. 1 Never 5 17 7 23 10 13 0 0 1 3
2 Sometimes 10 33 11 37 17 22 12 50 13 41
3 Often 7 23 8 27 31 40 7 29 11 34
4 Very often 8 27 4 13 19 25 5 21 7 22
Total 30 100 30 100 77 100 24 100 32 100
h. 1 Never 2 7 2 7 6 8 0 0 1 3
2 Sometimes 16 53 11 38 19 25 11 46 11 35
3 Often 6 20 12 41 39 51 9 38 13 42
4 Very often 6 20 4 14 13 17 4 17 6 19
Total 30 100 29 100 77 100 24 100 31 100
i. 1 Never 9 30 5 17 16 21 3 13 3 9
2 Sometimes 10 33 13 43 33 43 13 54 12 38
3 Often 7 23 9 30 23 30 5 21 12 38
4 Very often 4 13 3 10 5 6 3 13 5 16
Total 30 100 30 100 77 100 24 100 32 100
2. During the current school year, about how often have you done the following?
a. 1 Never 5 17 0 0 9 12 1 4 2 6
2 Sometimes 12 40 11 38 30 39 10 42 17 53
3 Often 6 20 13 45 29 38 11 46 9 28
4 Very often 7 23 5 17 9 12 2 8 4 13
Total 30 100 29 100 77 100 24 100 32 100
b. 1 Never 4 13 3 10 11 14 3 13 2 6
2 Sometimes 12 40 12 41 39 51 12 50 13 41
3 Often 9 30 11 38 20 26 8 33 11 34
4 Very often 5 17 3 10 7 9 1 4 6 19
Total 30 100 29 100 77 100 24 100 32 100
c. 1 Never 4 13 2 7 11 14 3 13 1 3
2 Sometimes 12 40 11 38 38 50 12 50 15 47
3 Often 9 30 15 52 23 30 8 33 10 31
4 Very often 5 17 1 3 4 5 1 4 6 19
Total 30 100 29 100 76 100 24 100 32 100
Combined ideas from
different courses when
completing
assignments
RIintegrate
Connected your
learning to societal
problems or issues
RIsocietal
Included diverse
perspectives (political,
religious, racial/ethnic,
gender, etc.) in course
discussions or
assignments
RIdiverse
Worked with other
students on course
projects or
assignments
CLproject
Prepared for exams by
discussing or working
through course
material with other
students
CLstudy
Given a course
presentation
present
NSSE 2016 MAJOR FIELD REPORT, PART I • 10
First-Year Students
Item wording
or description
Variable
name e Values f Response options Count % Count % Count % Count % Count % Count % Count % Count % Count % Count %
Arts and
Humanities
Natural-Math
Science Education Engineering
Interdisc.
Studies Nursing
Ag and Human
Ecology BusinessSocial Sciences
Health
Professions
NSSE 2016 Major Field Report, Part I: Within-Institution ComparisonsFrequency Distributionsd by Related-Major Group
Tennessee Technological University
d. 1 Never 1 3 1 3 5 6 2 8 0 0
2 Sometimes 9 30 10 34 23 30 6 25 13 42
3 Often 14 47 12 41 40 52 15 63 12 39
4 Very often 6 20 6 21 9 12 1 4 6 19
Total 30 100 29 100 77 100 24 100 31 100
e. 1 Never 1 3 0 0 3 4 0 0 0 0
2 Sometimes 12 40 13 45 26 34 9 38 13 41
3 Often 11 37 14 48 38 50 12 50 10 31
4 Very often 6 20 2 7 9 12 3 13 9 28
Total 30 100 29 100 76 100 24 100 32 100
f. 1 Never 5 17 1 3 3 4 2 8 0 0
2 Sometimes 5 17 9 31 30 39 9 38 9 28
3 Often 13 43 13 45 35 46 10 42 18 56
4 Very often 7 23 6 21 8 11 3 13 5 16
Total 30 100 29 100 76 100 24 100 32 100
g. 1 Never 0 0 1 3 1 1 0 0 0 0
2 Sometimes 3 10 5 17 19 25 5 21 5 16
3 Often 14 47 19 66 40 53 16 67 14 44
4 Very often 13 43 4 14 16 21 3 13 13 41
Total 30 100 29 100 76 100 24 100 32 100
3. During the current school year, about how often have you done the following?
a. 1 Never 4 13 3 10 26 34 3 13 7 22
2 Sometimes 16 53 14 47 32 42 12 50 13 41
3 Often 4 13 9 30 12 16 9 38 8 25
4 Very often 6 20 4 13 6 8 0 0 4 13
Total 30 100 30 100 76 100 24 100 32 100
b. 1 Never 11 37 12 40 40 53 11 46 11 34
2 Sometimes 11 37 9 30 22 29 9 38 12 38
3 Often 4 13 6 20 8 11 4 17 5 16
4 Very often 4 13 3 10 6 8 0 0 4 13
Total 30 100 30 100 76 100 24 100 32 100
Connected ideas from
your courses to your
prior experiences and
knowledge
RIconnect
Talked about career
plans with a faculty
member
SFcareer
Examined the
strengths and
weaknesses of your
own views on a topic
or issue
RIownview
Tried to better
understand someone
else's views by
imagining how an
issue looks from his or
her perspective
RIperspect
Learned something
that changed the way
you understand an
issue or concept
RInewview
Worked with a faculty
member on activities
other than coursework
(committees, student
groups, etc.)
SFotherwork
NSSE 2016 MAJOR FIELD REPORT, PART I • 11

First-Year Students
Item wording
or description
Variable
name e Values f Response options Count % Count % Count % Count % Count % Count % Count % Count % Count % Count %
Arts and
Humanities
Natural-Math
Science Education Engineering
Interdisc.
Studies Nursing
Ag and Human
Ecology BusinessSocial Sciences
Health
Professions
NSSE 2016 Major Field Report, Part I: Within-Institution ComparisonsFrequency Distributionsd by Related-Major Group
Tennessee Technological University
c. 1 Never 9 30 9 32 28 37 6 25 13 41
2 Sometimes 10 33 8 29 34 45 12 50 11 34
3 Often 8 27 6 21 12 16 4 17 4 13
4 Very often 3 10 5 18 2 3 2 8 4 13
Total 30 100 28 100 76 100 24 100 32 100
d. 1 Never 6 20 5 17 26 34 5 21 3 9
2 Sometimes 15 50 11 37 35 46 12 50 21 66
3 Often 5 17 9 30 12 16 6 25 5 16
4 Very often 4 13 5 17 3 4 1 4 3 9
Total 30 100 30 100 76 100 24 100 32 100
4. During the current school year, how much has your coursework emphasized the following?
a. 1 Very little 0 0 0 0 0 0 0 0 0 0
2 Some 2 7 5 17 17 23 2 8 5 16
3 Quite a bit 13 43 17 57 39 52 12 50 13 41
4 Very much 15 50 8 27 19 25 10 42 14 44
Total 30 100 30 100 75 100 24 100 32 100
b. 1 Very little 0 0 0 0 0 0 0 0 2 6
2 Some 5 17 12 40 14 19 2 8 6 19
3 Quite a bit 14 47 13 43 31 41 13 54 16 50
4 Very much 11 37 5 17 30 40 9 38 8 25
Total 30 100 30 100 75 100 24 100 32 100
c. 1 Very little 3 10 1 3 1 1 0 0 2 6
2 Some 11 37 12 40 21 28 1 4 9 28
3 Quite a bit 9 30 11 37 29 39 15 63 16 50
4 Very much 7 23 6 20 24 32 8 33 5 16
Total 30 100 30 100 75 100 24 100 32 100
d. 1 Very little 4 13 0 0 8 11 0 0 1 3
2 Some 8 27 7 23 23 31 4 17 9 28
3 Quite a bit 13 43 18 60 27 36 14 58 16 50
4 Very much 5 17 5 17 16 22 6 25 6 19
Total 30 100 30 100 74 100 24 100 32 100
Applying facts,
theories, or methods to
practical problems or
new situations
HOapply
Analyzing an idea,
experience, or line of
reasoning in depth by
examining its parts
HOanalyze
Memorizing course
material
memorize
Evaluating a point of
view, decision, or
information source
HOevaluate
Discussed course
topics, ideas, or
concepts with a
faculty member
outside of class
SFdiscuss
Discussed your
academic performance
with a faculty member
SFperform
NSSE 2016 MAJOR FIELD REPORT, PART I • 12

First-Year Students
Item wording
or description
Variable
name e Values f Response options Count % Count % Count % Count % Count % Count % Count % Count % Count % Count %
Arts and
Humanities
Natural-Math
Science Education Engineering
Interdisc.
Studies Nursing
Ag and Human
Ecology BusinessSocial Sciences
Health
Professions
NSSE 2016 Major Field Report, Part I: Within-Institution ComparisonsFrequency Distributionsd by Related-Major Group
Tennessee Technological University
e. 1 Very little 5 17 1 3 7 9 0 0 4 13
2 Some 10 33 13 43 22 29 4 17 13 41
3 Quite a bit 7 23 11 37 31 41 14 58 10 31
4 Very much 8 27 5 17 15 20 6 25 5 16
Total 30 100 30 100 75 100 24 100 32 100
5. During the current school year, to what extent have your instructors done the following?
a. 1 Very little 0 0 0 0 5 7 0 0 0 0
2 Some 6 20 4 13 14 18 4 17 5 16
3 Quite a bit 12 40 17 57 37 49 11 48 15 47
4 Very much 12 40 9 30 20 26 8 35 12 38
Total 30 100 30 100 76 100 23 100 32 100
b. 1 Very little 0 0 3 10 2 3 0 0 0 0
2 Some 1 3 3 10 14 18 4 17 3 10
3 Quite a bit 17 57 15 50 39 51 13 54 17 55
4 Very much 12 40 9 30 21 28 7 29 11 35
Total 30 100 30 100 76 100 24 100 31 100
c. 1 Very little 0 0 2 7 4 5 0 0 0 0
2 Some 7 23 8 27 20 27 2 8 4 13
3 Quite a bit 12 40 15 50 25 33 14 58 15 47
4 Very much 11 37 5 17 26 35 8 33 13 41
Total 30 100 30 100 75 100 24 100 32 100
d. 1 Very little 2 7 4 13 15 20 1 4 2 6
2 Some 13 43 10 33 26 34 7 29 12 38
3 Quite a bit 9 30 12 40 27 36 9 38 10 31
4 Very much 6 20 4 13 8 11 7 29 8 25
Total 30 100 30 100 76 100 24 100 32 100
e. 1 Very little 1 3 4 14 9 12 2 8 2 6
2 Some 8 27 6 21 27 36 6 25 10 31
3 Quite a bit 11 37 14 48 27 36 12 50 10 31
4 Very much 10 33 5 17 13 17 4 17 10 31
Total 30 100 29 100 76 100 24 100 32 100
Used examples or
illustrations to explain
difficult points
ETexample
Provided feedback on
a draft or work in
progress
ETdraftfb
Provided prompt and
detailed feedback on
tests or completed
assignments
ETfeedback
Forming a new idea or
understanding from
various pieces of
information
HOform
Clearly explained
course goals and
requirements
ETgoals
Taught course
sessions in an
organized way
ETorganize
NSSE 2016 MAJOR FIELD REPORT, PART I • 13

First-Year Students
Item wording
or description
Variable
name e Values f Response options Count % Count % Count % Count % Count % Count % Count % Count % Count % Count %
Arts and
Humanities
Natural-Math
Science Education Engineering
Interdisc.
Studies Nursing
Ag and Human
Ecology BusinessSocial Sciences
Health
Professions
NSSE 2016 Major Field Report, Part I: Within-Institution ComparisonsFrequency Distributionsd by Related-Major Group
Tennessee Technological University
6. During the current school year, about how often have you done the following?
a. 1 Never 2 7 5 17 8 11 3 13 3 9
2 Sometimes 13 43 11 37 22 29 10 42 10 31
3 Often 6 20 11 37 31 41 10 42 14 44
4 Very often 9 30 3 10 15 20 1 4 5 16
Total 30 100 30 100 76 100 24 100 32 100
b. 1 Never 6 20 8 27 19 25 5 21 5 16
2 Sometimes 13 43 12 40 23 30 11 46 12 38
3 Often 7 23 7 23 25 33 7 29 11 34
4 Very often 4 13 3 10 9 12 1 4 4 13
Total 30 100 30 100 76 100 24 100 32 100
c. 1 Never 4 13 10 33 14 18 5 21 4 13
2 Sometimes 16 53 11 37 29 38 10 42 16 50
3 Often 6 20 8 27 26 34 8 33 8 25
4 Very often 4 13 1 3 7 9 1 4 4 13
Total 30 100 30 100 76 100 24 100 32 100
7. During the current school year, about how many papers, reports, or other writing tasks of the following length have you been assigned? (Include those not yet completed.)
a. 0 None 7 23 2 7 13 17 1 4 9 28
1.5 1-2 10 33 11 38 20 27 6 26 7 22
4 3-5 8 27 7 24 20 27 9 39 6 19
8 6-10 4 13 6 21 15 20 6 26 5 16
13 11-15 1 3 2 7 5 7 1 4 3 9
18 16-20 0 0 1 3 0 0 0 0 1 3
23 More than 20 0 0 0 0 2 3 0 0 1 3
Total 30 100 29 100 75 100 23 100 32 100
b. 0 None 22 76 19 68 45 62 12 57 21 66
1.5 1-2 3 10 5 18 14 19 5 24 10 31
4 3-5 3 10 2 7 8 11 3 14 1 3
8 6-10 1 3 2 7 4 5 1 5 0 0
13 11-15 0 0 0 0 1 1 0 0 0 0
18 16-20 0 0 0 0 1 1 0 0 0 0
23 More than 20 0 0 0 0 0 0 0 0 0 0
Total 29 100 28 100 73 100 21 100 32 100
Evaluated what others
have concluded from
numerical information
QRevaluate
Between 6 and 10
pages
wrmednum
(Recoded version
of wrmed created
by NSSE. Values
are estimated
number of papers,
reports, etc.)
Reached conclusions
based on your own
analysis of numerical
information (numbers,
graphs, statistics, etc.)
QRconclude
Used numerical
information to
examine a real-world
problem or issue
(unemployment,
climate change, public
health, etc.)
QRproblem
Up to 5 pages wrshortnum
(Recoded version
of wrshort created
by NSSE. Values
are estimated
number of papers,
reports, etc.)
NSSE 2016 MAJOR FIELD REPORT, PART I • 14

First-Year Students
Item wording
or description
Variable
name e Values f Response options Count % Count % Count % Count % Count % Count % Count % Count % Count % Count %
Arts and
Humanities
Natural-Math
Science Education Engineering
Interdisc.
Studies Nursing
Ag and Human
Ecology BusinessSocial Sciences
Health
Professions
NSSE 2016 Major Field Report, Part I: Within-Institution ComparisonsFrequency Distributionsd by Related-Major Group
Tennessee Technological University
c. 0 None 26 90 26 87 65 88 18 90 29 91
1.5 1-2 2 7 2 7 3 4 1 5 3 9
4 3-5 0 0 1 3 2 3 0 0 0 0
8 6-10 1 3 1 3 0 0 1 5 0 0
13 11-15 0 0 0 0 3 4 0 0 0 0
18 16-20 0 0 0 0 0 0 0 0 0 0
23 More than 20 0 0 0 0 1 1 0 0 0 0
Total 29 100 30 100 74 100 20 100 32 100
8. During the current school year, about how often have you had discussions with people from the following groups?
a. 1 Never 1 3 1 3 2 3 1 4 0 0
2 Sometimes 9 31 8 27 23 31 9 39 9 28
3 Often 8 28 11 37 24 32 7 30 9 28
4 Very often 11 38 10 33 26 35 6 26 14 44
Total 29 100 30 100 75 100 23 100 32 100
b. 1 Never 1 3 2 7 3 4 2 8 1 3
2 Sometimes 7 24 6 20 17 23 7 29 9 28
3 Often 12 41 14 47 34 45 7 29 11 34
4 Very often 9 31 8 27 21 28 8 33 11 34
Total 29 100 30 100 75 100 24 100 32 100
c. 1 Never 3 10 3 10 3 4 1 4 1 3
2 Sometimes 9 31 8 27 21 28 9 38 8 25
3 Often 12 41 10 33 28 37 8 33 12 38
4 Very often 5 17 9 30 23 31 6 25 11 34
Total 29 100 30 100 75 100 24 100 32 100
d. 1 Never 0 0 1 3 3 4 2 8 0 0
2 Sometimes 9 31 8 28 17 23 7 29 7 23
3 Often 7 24 10 34 32 43 7 29 12 39
4 Very often 13 45 10 34 23 31 8 33 12 39
Total 29 100 29 100 75 100 24 100 31 100
People with religious
beliefs other than your
own
DDreligion
People with political
views other than your
own
DDpolitical
People of a race or
ethnicity other than
your own
DDrace
People from an
economic background
other than your own
DDeconomic
11 pages or more wrlongnum
(Recoded version
of wrlong created
by NSSE. Values
are estimated
number of papers,
reports, etc.)
NSSE 2016 MAJOR FIELD REPORT, PART I • 15

First-Year Students
Item wording
or description
Variable
name e Values f Response options Count % Count % Count % Count % Count % Count % Count % Count % Count % Count %
Arts and
Humanities
Natural-Math
Science Education Engineering
Interdisc.
Studies Nursing
Ag and Human
Ecology BusinessSocial Sciences
Health
Professions
NSSE 2016 Major Field Report, Part I: Within-Institution ComparisonsFrequency Distributionsd by Related-Major Group
Tennessee Technological University
9. During the current school year, about how often have you done the following?
a. 1 Never 2 7 0 0 6 8 0 0 1 3
2 Sometimes 9 30 6 20 19 26 6 25 10 31
3 Often 9 30 19 63 32 43 10 42 13 41
4 Very often 10 33 5 17 17 23 8 33 8 25
Total 30 100 30 100 74 100 24 100 32 100
b. 1 Never 0 0 2 7 2 3 1 4 1 3
2 Sometimes 8 27 6 20 17 23 2 9 8 25
3 Often 9 30 12 40 25 34 10 43 12 38
4 Very often 13 43 10 33 30 41 10 43 11 34
Total 30 100 30 100 74 100 23 100 32 100
c. 1 Never 2 7 2 7 3 4 1 4 1 3
2 Sometimes 10 33 5 17 24 32 3 13 12 38
3 Often 11 37 14 48 22 30 11 48 7 22
4 Very often 7 23 8 28 25 34 8 35 12 38
Total 30 100 29 100 74 100 23 100 32 100
10. During the current school year, to what extent have your courses challenged you to do your best work?
1 Not at all 0 0 0 0 0 0 0 0 0 0
2 1 3 0 0 1 1 1 4 0 0
3 1 3 1 3 0 0 0 0 2 6
4 3 10 6 20 4 5 2 8 3 9
5 11 37 5 17 20 26 7 29 10 31
6 8 27 7 23 31 41 5 21 10 31
7 Very much 6 20 11 37 20 26 9 38 7 22
Total 30 100 30 100 76 100 24 100 32 100
challenge
LSreading
Reviewed your notes
after class
LSnotes
Summarized what you
learned in class or
from course materials
LSsummary
Identified key
information from
reading assignments
NSSE 2016 MAJOR FIELD REPORT, PART I • 16

First-Year Students
Item wording
or description
Variable
name e Values f Response options Count % Count % Count % Count % Count % Count % Count % Count % Count % Count %
Arts and
Humanities
Natural-Math
Science Education Engineering
Interdisc.
Studies Nursing
Ag and Human
Ecology BusinessSocial Sciences
Health
Professions
NSSE 2016 Major Field Report, Part I: Within-Institution ComparisonsFrequency Distributionsd by Related-Major Group
Tennessee Technological University
11. Which of the following have you done or do you plan to do before you graduate?
a. Have not decided 3 10 3 10 6 8 3 13 4 13
Do not plan to do 0 0 1 3 3 4 0 0 1 3
Plan to do 26 87 25 83 63 83 18 75 21 68
Done or in progress 1 3 1 3 4 5 3 13 5 16
Total 30 100 30 100 76 100 24 100 31 100
b. Have not decided 6 20 9 30 20 27 8 33 7 23
Do not plan to do 10 33 8 27 21 28 5 21 3 10
Plan to do 10 33 10 33 27 36 9 38 17 55
Done or in progress 4 13 3 10 7 9 2 8 4 13
Total 30 100 30 100 75 100 24 100 31 100
c. Have not decided 10 33 10 33 31 42 10 42 10 32
Do not plan to do 11 37 8 27 26 35 6 25 8 26
Plan to do 7 23 10 33 11 15 6 25 8 26
Done or in progress 2 7 2 7 6 8 2 8 5 16
Total 30 100 30 100 74 100 24 100 31 100
d. Have not decided 13 43 11 37 28 38 7 30 9 29
Do not plan to do 4 13 11 37 32 43 10 43 10 32
Plan to do 12 40 8 27 13 18 6 26 9 29
Done or in progress 1 3 0 0 1 1 0 0 3 10
Total 30 100 30 100 74 100 23 100 31 100
e. Have not decided 10 33 10 33 34 46 11 46 13 43
Do not plan to do 3 10 8 27 10 14 9 38 10 33
Plan to do 15 50 11 37 26 35 3 13 6 20
Done or in progress 2 7 1 3 4 5 1 4 1 3
Total 30 100 30 100 74 100 24 100 30 100
f. Have not decided 9 30 14 47 16 22 8 33 9 29
Do not plan to do 3 10 2 7 7 9 4 17 5 16
Plan to do 18 60 14 47 51 69 12 50 14 45
Done or in progress 0 0 0 0 0 0 0 0 3 10
Total 30 100 30 100 74 100 24 100 31 100
Participate in a study
abroad program
abroad
(Means indicate
the percentage
who responded
"Done or in
progress.")
Work with a faculty
member on a research
project
research
(Means indicate
the percentage
who responded
"Done or in
progress.")
Complete a
culminating senior
experience (capstone
course, senior project
or thesis,
comprehensive exam,
portfolio, etc.)
capstone
(Means indicate
the percentage
who responded
"Done or in
progress.")
Hold a formal
leadership role in a
student organization or
group
leader
(Means indicate
the percentage
who responded
"Done or in
progress.")
Participate in a
learning community or
some other formal
program where groups
of students take two or
more classes together
learncom
(Means indicate
the percentage
who responded
"Done or in
progress.")
Participate in an
internship, co-op, field
experience, student
teaching, or clinical
placement
intern
(Means indicate
the percentage
who responded
"Done or in
progress.")
NSSE 2016 MAJOR FIELD REPORT, PART I • 17

First-Year Students
Item wording
or description
Variable
name e Values f Response options Count % Count % Count % Count % Count % Count % Count % Count % Count % Count %
Arts and
Humanities
Natural-Math
Science Education Engineering
Interdisc.
Studies Nursing
Ag and Human
Ecology BusinessSocial Sciences
Health
Professions
NSSE 2016 Major Field Report, Part I: Within-Institution ComparisonsFrequency Distributionsd by Related-Major Group
Tennessee Technological University
12. About how many of your courses at this institution have included a community-based project (service-learning)?
1 None 12 40 9 30 40 53 6 25 16 50
2 Some 16 53 18 60 29 38 16 67 14 44
3 Most 2 7 2 7 6 8 2 8 2 6
4 All 0 0 1 3 1 1 0 0 0 0
Total 30 100 30 100 76 100 24 100 32 100
13. Indicate the quality of your interactions with the following people at your institution.
a. 1 Poor 0 0 0 0 2 3 0 0 0 0
2 2 7 1 3 2 3 0 0 1 3
3 3 10 1 3 4 5 0 0 1 3
4 8 28 5 17 8 11 2 8 2 6
5 7 24 7 23 27 36 13 54 9 28
6 5 17 6 20 17 23 5 21 7 22
7 Excellent 4 14 10 33 15 20 4 17 12 38
— Not applicable 0 0 0 0 0 0 0 0 0 0
Total 29 100 30 100 75 100 24 100 32 100
b. 1 Poor 1 3 1 3 4 5 1 4 0 0
2 0 0 2 7 1 1 0 0 0 0
3 2 7 0 0 3 4 2 8 3 9
4 6 20 1 3 14 19 1 4 2 6
5 5 17 11 37 15 20 4 17 5 16
6 6 20 4 13 22 29 7 29 6 19
7 Excellent 10 33 11 37 16 21 9 38 16 50
— Not applicable 0 0 0 0 0 0 0 0 0 0
Total 30 100 30 100 75 100 24 100 32 100
c. 1 Poor 0 0 0 0 2 3 1 5 0 0
2 0 0 1 3 0 0 0 0 0 0
3 2 7 2 7 4 5 1 5 2 6
4 5 17 2 7 8 11 2 9 2 6
5 5 17 6 20 23 31 9 41 9 28
6 13 43 10 33 27 36 6 27 8 25
7 Excellent 5 17 9 30 11 15 3 14 11 34
— Not applicable 0 0 0 0 0 0 0 0 0 0
Total 30 100 30 100 75 100 22 100 32 100
Academic advisors
Students QIstudent
servcourse
QIadvisor
Faculty QIfaculty
NSSE 2016 MAJOR FIELD REPORT, PART I • 18

First-Year Students
Item wording
or description
Variable
name e Values f Response options Count % Count % Count % Count % Count % Count % Count % Count % Count % Count %
Arts and
Humanities
Natural-Math
Science Education Engineering
Interdisc.
Studies Nursing
Ag and Human
Ecology BusinessSocial Sciences
Health
Professions
NSSE 2016 Major Field Report, Part I: Within-Institution ComparisonsFrequency Distributionsd by Related-Major Group
Tennessee Technological University
d. 1 Poor 1 3 2 7 4 5 0 0 0 0
2 1 3 1 3 3 4 0 0 0 0
3 4 14 0 0 1 1 2 8 1 3
4 2 7 6 20 16 21 2 8 6 19
5 10 34 5 17 17 23 8 33 5 16
6 4 14 7 23 12 16 6 25 6 19
7 Excellent 4 14 4 13 18 24 3 13 12 38
— Not applicable 3 10 5 17 4 5 3 13 2 6
Total 29 100 30 100 75 100 24 100 32 100
e. 1 Poor 1 3 2 7 5 7 1 4 0 0
2 3 10 0 0 0 0 0 0 0 0
3 2 7 1 3 4 5 1 4 2 6
4 5 17 6 20 12 16 3 13 3 10
5 8 27 7 23 21 28 7 30 9 29
6 5 17 5 17 18 24 8 35 8 26
7 Excellent 4 13 8 27 13 17 1 4 7 23
— Not applicable 2 7 1 3 2 3 2 9 2 6
Total 30 100 30 100 75 100 23 100 31 100
14. How much does your institution emphasize the following?
a. 1 Very little 0 0 0 0 3 4 0 0 0 0
2 Some 2 7 8 27 16 21 5 21 10 31
3 Quite a bit 17 57 17 57 29 38 7 29 13 41
4 Very much 11 37 5 17 28 37 12 50 9 28
Total 30 100 30 100 76 100 24 100 32 100
b. 1 Very little 0 0 1 3 2 3 0 0 0 0
2 Some 9 30 8 27 18 24 3 13 9 28
3 Quite a bit 12 40 17 57 37 49 13 54 11 34
4 Very much 9 30 4 13 19 25 8 33 12 38
Total 30 100 30 100 76 100 24 100 32 100
c. 1 Very little 1 3 2 7 5 7 0 0 1 3
2 Some 6 20 4 13 17 23 5 22 6 19
3 Quite a bit 11 37 17 57 27 36 10 43 16 50
4 Very much 12 40 7 23 26 35 8 35 9 28
Total 30 100 30 100 75 100 23 100 32 100
Student services staff
(career services,
student activities,
housing, etc.)
QIstaff
Other administrative
staff and offices
(registrar, financial
aid, etc.)
QIadmin
Spending significant
amounts of time
studying and on
academic works
empstudy
Providing support to
help students succeed
academically
SEacademic
Using learning support
services (tutoring
services, writing
center, etc.)
SElearnsup
NSSE 2016 MAJOR FIELD REPORT, PART I • 19

First-Year Students
Item wording
or description
Variable
name e Values f Response options Count % Count % Count % Count % Count % Count % Count % Count % Count % Count %
Arts and
Humanities
Natural-Math
Science Education Engineering
Interdisc.
Studies Nursing
Ag and Human
Ecology BusinessSocial Sciences
Health
Professions
NSSE 2016 Major Field Report, Part I: Within-Institution ComparisonsFrequency Distributionsd by Related-Major Group
Tennessee Technological University
d. 1 Very little 1 3 2 7 14 18 2 8 0 0
2 Some 16 53 12 40 24 32 7 29 18 56
3 Quite a bit 8 27 14 47 29 38 9 38 8 25
4 Very much 5 17 2 7 9 12 6 25 6 19
Total 30 100 30 100 76 100 24 100 32 100
e. 1 Very little 1 3 0 0 7 9 0 0 2 6
2 Some 9 30 10 33 23 30 5 22 6 19
3 Quite a bit 16 53 15 50 31 41 9 39 15 47
4 Very much 4 13 5 17 15 20 9 39 9 28
Total 30 100 30 100 76 100 23 100 32 100
f. 1 Very little 3 10 1 3 5 7 1 4 2 6
2 Some 6 21 9 30 22 29 2 9 11 34
3 Quite a bit 10 34 14 47 32 42 14 61 11 34
4 Very much 10 34 6 20 17 22 6 26 8 25
Total 29 100 30 100 76 100 23 100 32 100
g. 1 Very little 12 40 6 20 23 30 3 13 7 22
2 Some 12 40 13 43 27 36 8 35 17 53
3 Quite a bit 5 17 8 27 23 30 10 43 6 19
4 Very much 1 3 3 10 3 4 2 9 2 6
Total 30 100 30 100 76 100 23 100 32 100
h. 1 Very little 2 7 0 0 5 7 2 8 0 0
2 Some 6 20 9 30 30 39 1 4 9 28
3 Quite a bit 15 50 15 50 31 41 18 75 14 44
4 Very much 7 23 6 20 10 13 3 13 9 28
Total 30 100 30 100 76 100 24 100 32 100
i. 1 Very little 4 13 2 7 19 25 3 13 3 9
2 Some 12 40 15 50 27 36 6 25 17 53
3 Quite a bit 10 33 11 37 21 28 11 46 8 25
4 Very much 4 13 2 7 9 12 4 17 4 13
Total 30 100 30 100 76 100 24 100 32 100
Encouraging contact
among students from
different backgrounds
(social, racial/ethnic,
religious, etc.)
SEdiverse
Providing
opportunities to be
involved socially
SEsocial
Providing support for
your overall well-
being (recreation,
health care,
counseling, etc.)
SEwellness
Helping you manage
your non-academic
responsibilities (work,
family, etc.)
SEnonacad
Attending campus
activities and events
(performing arts,
athletic events, etc.)
SEactivities
Attending events that
address important
social, economic, or
political issues
SEevents
NSSE 2016 MAJOR FIELD REPORT, PART I • 20

First-Year Students
Item wording
or description
Variable
name e Values f Response options Count % Count % Count % Count % Count % Count % Count % Count % Count % Count %
Arts and
Humanities
Natural-Math
Science Education Engineering
Interdisc.
Studies Nursing
Ag and Human
Ecology BusinessSocial Sciences
Health
Professions
NSSE 2016 Major Field Report, Part I: Within-Institution ComparisonsFrequency Distributionsd by Related-Major Group
Tennessee Technological University
15. About how many hours do you spend in a typical 7-day week doing the following?
a. 0 0 hrs 0 0 1 3 0 0 0 0 1 3
3 1-5 hrs 5 17 5 17 7 9 3 13 4 13
8 6-10 hrs 10 33 9 30 13 17 5 21 6 19
13 11-15 hrs 5 17 7 23 20 27 9 38 5 16
18 16-20 hrs 4 13 3 10 19 25 3 13 7 22
23 21-25 hrs 3 10 1 3 6 8 2 8 1 3
28 26-30 hrs 1 3 3 10 1 1 1 4 6 19
33 More than 30 hrs 2 7 1 3 9 12 1 4 2 6
Total 30 100 30 100 75 100 24 100 32 100
b. 0 0 hrs 6 20 10 34 17 22 9 38 11 34
3 1-5 hrs 17 57 10 34 30 39 10 42 7 22
8 6-10 hrs 4 13 3 10 11 14 1 4 8 25
13 11-15 hrs 0 0 4 14 7 9 2 8 3 9
18 16-20 hrs 1 3 1 3 4 5 0 0 1 3
23 21-25 hrs 1 3 0 0 2 3 1 4 2 6
28 26-30 hrs 0 0 1 3 2 3 0 0 0 0
33 More than 30 hrs 1 3 0 0 3 4 1 4 0 0
Total 30 100 29 100 76 100 24 100 32 100
c. 0 0 hrs 21 70 25 83 51 68 16 70 24 75
3 1-5 hrs 2 7 0 0 1 1 0 0 2 6
8 6-10 hrs 5 17 5 17 15 20 5 22 4 13
13 11-15 hrs 1 3 0 0 3 4 1 4 1 3
18 16-20 hrs 1 3 0 0 3 4 0 0 0 0
23 21-25 hrs 0 0 0 0 2 3 0 0 0 0
28 26-30 hrs 0 0 0 0 0 0 0 0 1 3
33 More than 30 hrs 0 0 0 0 0 0 1 4 0 0
Total 30 100 30 100 75 100 23 100 32 100
tmworkonhrs
(Recoded version
of tmworkon
created by NSSE.
Values are
estimated number
of hours per week.)
Preparing for class
(studying, reading,
writing, doing
homework or lab
work, analyzing data,
rehearsing, and other
academic activities)
tmprephrs
(Recoded version
of tmprep created
by NSSE. Values
are estimated
number of hours
per week.)
Participating in co-
curricular activities
(organizations,
campus publications,
student government,
fraternity or sorority,
intercollegiate or
intramural sports, etc.)
tmcocurrhrs
(Recoded version
of tmcocurr
created by NSSE.
Values are
estimated number
of hours per week.)
Working for pay on
campus
NSSE 2016 MAJOR FIELD REPORT, PART I • 21

First-Year Students
Item wording
or description
Variable
name e Values f Response options Count % Count % Count % Count % Count % Count % Count % Count % Count % Count %
Arts and
Humanities
Natural-Math
Science Education Engineering
Interdisc.
Studies Nursing
Ag and Human
Ecology BusinessSocial Sciences
Health
Professions
NSSE 2016 Major Field Report, Part I: Within-Institution ComparisonsFrequency Distributionsd by Related-Major Group
Tennessee Technological University
d. 0 0 hrs 14 47 12 40 60 80 9 39 19 61
3 1-5 hrs 3 10 3 10 5 7 1 4 2 6
8 6-10 hrs 2 7 2 7 2 3 0 0 2 6
13 11-15 hrs 3 10 5 17 3 4 6 26 0 0
18 16-20 hrs 3 10 4 13 2 3 1 4 5 16
23 21-25 hrs 4 13 3 10 1 1 5 22 0 0
28 26-30 hrs 1 3 1 3 1 1 1 4 2 6
33 More than 30 hrs 0 0 0 0 1 1 0 0 1 3
Total 30 100 30 100 75 100 23 100 31 100
e. 0 0 hrs 15 52 17 57 43 57 11 46 21 66
3 1-5 hrs 10 34 6 20 21 28 8 33 8 25
8 6-10 hrs 2 7 2 7 7 9 3 13 2 6
13 11-15 hrs 0 0 1 3 2 3 0 0 0 0
18 16-20 hrs 1 3 1 3 2 3 0 0 0 0
23 21-25 hrs 0 0 2 7 1 1 2 8 0 0
28 26-30 hrs 0 0 0 0 0 0 0 0 1 3
33 More than 30 hrs 1 3 1 3 0 0 0 0 0 0
Total 29 100 30 100 76 100 24 100 32 100
f. 0 0 hrs 0 0 1 3 2 3 1 4 2 6
3 1-5 hrs 5 17 12 40 12 16 6 25 5 16
8 6-10 hrs 8 27 5 17 20 27 8 33 10 31
13 11-15 hrs 11 37 4 13 15 20 5 21 3 9
18 16-20 hrs 3 10 4 13 10 13 1 4 6 19
23 21-25 hrs 1 3 3 10 9 12 1 4 2 6
28 26-30 hrs 0 0 1 3 2 3 1 4 2 6
33 More than 30 hrs 2 7 0 0 5 7 1 4 2 6
Total 30 100 30 100 75 100 24 100 32 100
Working for pay off
campus
tmworkoffhrs
(Recoded version
of tmworkoff
created by NSSE.
Values are
estimated number
of hours per week.)
Doing community
service or volunteer
work
tmservicehrs
(Recoded version
of tmservice
created by NSSE.
Values are
estimated number
of hours per week.)
Relaxing and
socializing (time with
friends, video games,
TV or videos, keeping
up with friends online,
etc.)
tmrelaxhrs
(Recoded version
of tmrelax created
by NSSE. Values
are estimated
number of hours
per week.)
NSSE 2016 MAJOR FIELD REPORT, PART I • 22

First-Year Students
Item wording
or description
Variable
name e Values f Response options Count % Count % Count % Count % Count % Count % Count % Count % Count % Count %
Arts and
Humanities
Natural-Math
Science Education Engineering
Interdisc.
Studies Nursing
Ag and Human
Ecology BusinessSocial Sciences
Health
Professions
NSSE 2016 Major Field Report, Part I: Within-Institution ComparisonsFrequency Distributionsd by Related-Major Group
Tennessee Technological University
g. 0 0 hrs 22 73 17 59 63 83 17 71 27 84
3 1-5 hrs 2 7 3 10 7 9 4 17 0 0
8 6-10 hrs 1 3 2 7 2 3 1 4 1 3
13 11-15 hrs 3 10 2 7 0 0 2 8 1 3
18 16-20 hrs 1 3 2 7 2 3 0 0 0 0
23 21-25 hrs 0 0 1 3 2 3 0 0 0 0
28 26-30 hrs 0 0 1 3 0 0 0 0 1 3
33 More than 30 hrs 1 3 1 3 0 0 0 0 2 6
Total 30 100 29 100 76 100 24 100 32 100
h. 0 0 hrs 10 33 5 17 32 42 5 21 7 22
3 1-5 hrs 13 43 10 33 33 43 13 54 16 50
8 6-10 hrs 3 10 13 43 7 9 4 17 6 19
13 11-15 hrs 2 7 0 0 2 3 1 4 1 3
18 16-20 hrs 1 3 0 0 0 0 1 4 1 3
23 21-25 hrs 0 0 0 0 1 1 0 0 0 0
28 26-30 hrs 0 0 1 3 0 0 0 0 1 3
33 More than 30 hrs 1 3 1 3 1 1 0 0 0 0
Total 30 100 30 100 76 100 24 100 32 100
16. Of the time you spend preparing for class in a typical 7-day week, about how much is on assigned reading?
1 Very little 10 34 6 21 15 20 0 0 8 25
2 Some 8 28 12 41 35 46 6 25 6 19
3 About half 8 28 8 28 19 25 9 38 10 31
4 Most 2 7 2 7 4 5 8 33 7 22
5 Almost all 1 3 1 3 3 4 1 4 1 3
Total 29 100 29 100 76 100 24 100 32 100
0 0 hrs 0 0 1 3 0 0 0 0 1 3
3 More than 0, up to 5 hrs 20 69 19 66 47 63 8 33 14 44
8 More than 5, up to 10 hrs 5 17 7 24 23 31 12 50 8 25
13 More than 10, up to 15 hrs 2 7 0 0 3 4 3 13 4 13
18 More than 15, up to 20 hrs 1 3 1 3 1 1 0 0 2 6
23 More than 20, up to 25 hrs 0 0 1 3 0 0 1 4 2 6
28 More than 25 hrs 1 3 0 0 1 1 0 0 1 3
Total 29 100 29 100 75 100 24 100 32 100
tmreadinghrscol
(Recoded version
of tmcommute
created by NSSE.
Values are
estimated number
of hours per week.)
Providing care for
dependents (children,
parents, etc.)
tmcarehrs
(Recoded version
of tmcare created
by NSSE. Values
are estimated
number of hours
per week.)
Commuting to campus
(driving, walking, etc.)
tmcommutehrs
(Recoded version
of tmcommute
created by NSSE.
Values are
estimated number
of hours per week.)
reading
NSSE 2016 MAJOR FIELD REPORT, PART I • 23

First-Year Students
Item wording
or description
Variable
name e Values f Response options Count % Count % Count % Count % Count % Count % Count % Count % Count % Count %
Arts and
Humanities
Natural-Math
Science Education Engineering
Interdisc.
Studies Nursing
Ag and Human
Ecology BusinessSocial Sciences
Health
Professions
NSSE 2016 Major Field Report, Part I: Within-Institution ComparisonsFrequency Distributionsd by Related-Major Group
Tennessee Technological University
17. How much has your experience at this institution contributed to your knowledge, skills, and personal development in the following areas?
a. 1 Very little 9 31 4 13 18 24 1 4 2 6
2 Some 8 28 6 20 20 26 9 38 12 38
3 Quite a bit 9 31 17 57 25 33 13 54 13 41
4 Very much 3 10 3 10 13 17 1 4 5 16
Total 29 100 30 100 76 100 24 100 32 100
b. 1 Very little 6 20 3 10 12 16 0 0 3 9
2 Some 15 50 13 43 26 34 12 50 9 28
3 Quite a bit 5 17 11 37 27 36 11 46 15 47
4 Very much 4 13 3 10 11 14 1 4 5 16
Total 30 100 30 100 76 100 24 100 32 100
c. 1 Very little 1 3 0 0 4 5 0 0 0 0
2 Some 5 17 9 30 15 20 3 13 10 31
3 Quite a bit 13 43 15 50 33 43 16 67 14 44
4 Very much 11 37 6 20 24 32 5 21 8 25
Total 30 100 30 100 76 100 24 100 32 100
d. 1 Very little 3 10 2 7 6 8 5 21 3 9
2 Some 8 27 13 43 18 24 7 29 8 25
3 Quite a bit 10 33 11 37 30 39 9 38 15 47
4 Very much 9 30 4 13 22 29 3 13 6 19
Total 30 100 30 100 76 100 24 100 32 100
e. 1 Very little 4 13 2 7 8 11 1 4 3 9
2 Some 13 43 9 30 22 29 11 46 15 47
3 Quite a bit 8 27 12 40 28 37 7 29 8 25
4 Very much 5 17 7 23 18 24 5 21 6 19
Total 30 100 30 100 76 100 24 100 32 100
f. 1 Very little 3 10 1 3 2 3 1 4 3 9
2 Some 13 43 9 30 23 31 4 17 10 31
3 Quite a bit 11 37 14 47 38 51 14 58 11 34
4 Very much 3 10 6 20 12 16 5 21 8 25
Total 30 100 30 100 75 100 24 100 32 100
Acquiring job- or
work-related
knowledge and skills
pgwork
Working effectively
with others
pgothers
Speaking clearly and
effectively
pgspeak
Thinking critically and
analytically
pgthink
Analyzing numerical
and statistical
information
pganalyze
Writing clearly and
effectively
pgwrite
NSSE 2016 MAJOR FIELD REPORT, PART I • 24

First-Year Students
Item wording
or description
Variable
name e Values f Response options Count % Count % Count % Count % Count % Count % Count % Count % Count % Count %
Arts and
Humanities
Natural-Math
Science Education Engineering
Interdisc.
Studies Nursing
Ag and Human
Ecology BusinessSocial Sciences
Health
Professions
NSSE 2016 Major Field Report, Part I: Within-Institution ComparisonsFrequency Distributionsd by Related-Major Group
Tennessee Technological University
g. 1 Very little 5 17 5 17 13 17 1 4 6 19
2 Some 14 47 10 33 26 34 7 30 13 41
3 Quite a bit 9 30 14 47 25 33 10 43 8 25
4 Very much 2 7 1 3 12 16 5 22 5 16
Total 30 100 30 100 76 100 23 100 32 100
h. 1 Very little 5 17 2 7 21 28 1 4 5 16
2 Some 14 48 16 53 17 22 7 29 13 41
3 Quite a bit 7 24 7 23 26 34 11 46 9 28
4 Very much 3 10 5 17 12 16 5 21 5 16
Total 29 100 30 100 76 100 24 100 32 100
i. 1 Very little 6 20 3 10 11 14 1 4 8 25
2 Some 12 40 13 43 21 28 8 33 12 38
3 Quite a bit 8 27 10 33 32 42 11 46 7 22
4 Very much 4 13 4 13 12 16 4 17 5 16
Total 30 100 30 100 76 100 24 100 32 100
j. 1 Very little 4 13 4 13 20 26 2 8 7 22
2 Some 15 50 10 33 19 25 8 33 11 34
3 Quite a bit 8 27 11 37 28 37 9 38 9 28
4 Very much 3 10 5 17 9 12 5 21 5 16
Total 30 100 30 100 76 100 24 100 32 100
18. How would you evaluate your entire educational experience at this institution?
1 Poor 0 0 0 0 1 1 0 0 0 0
2 Fair 1 3 4 13 14 18 1 4 1 3
3 Good 17 57 17 57 39 51 13 54 15 47
4 Excellent 12 40 9 30 23 30 10 42 16 50
Total 30 100 30 100 77 100 24 100 32 100
19. If you could start over again, would you go to the same institution you are now attending?
1 Definitely no 0 0 1 3 2 3 0 0 1 3
2 Probably no 3 10 2 7 6 8 2 8 1 3
3 Probably yes 15 50 13 43 36 47 7 29 12 38
4 Definitely yes 12 40 14 47 33 43 15 63 18 56
Total 30 100 30 100 77 100 24 100 32 100
sameinst
evalexp
Being an informed and
active citizen
pgcitizen
Developing or
clarifying a personal
code of values and
ethics
pgvalues
Understanding people
of other backgrounds
(economic,
racial/ethnic, political,
religious, nationality,
etc.)
pgdiverse
Solving complex real-
world problems
pgprobsolve
NSSE 2016 MAJOR FIELD REPORT, PART I • 25

Seniors
Item wording
or description
Variable
name e Values f Response options Count % Count % Count % Count % Count % Count % Count % Count % Count % Count %
1. During the current school year, about how often have you done the following?
a. 1 Never 3 5 0 0 1 1 2 2 1 3 1 2
2 Sometimes 20 36 5 23 9 11 32 34 7 18 21 45
3 Often 17 31 5 23 22 28 34 36 10 26 12 26
4 Very often 15 27 12 55 48 60 26 28 20 53 13 28
Total 55 100 22 100 80 100 94 100 38 100 47 100
b. 1 Never 16 30 3 14 10 13 28 29 6 16 12 25
2 Sometimes 20 37 6 27 24 30 34 36 14 38 20 42
3 Often 12 22 4 18 18 23 22 23 6 16 10 21
4 Very often 6 11 9 41 27 34 11 12 11 30 6 13
Total 54 100 22 100 79 100 95 100 37 100 48 100
c. 1 Very often 2 4 0 0 4 5 4 4 4 11 2 4
2 Often 5 9 5 23 6 8 9 9 2 5 8 17
3 Sometimes 29 53 12 55 35 44 58 61 14 37 30 63
4 Never 19 35 5 23 34 43 24 25 18 47 8 17
Total 55 100 22 100 79 100 95 100 38 100 48 100
d. 1 Never 18 33 6 27 29 37 39 41 15 41 19 40
2 Sometimes 27 49 9 41 29 37 43 46 17 46 21 44
3 Often 8 15 5 23 6 8 8 9 3 8 7 15
4 Very often 2 4 2 9 15 19 4 4 2 5 1 2
Total 55 100 22 100 79 100 94 100 37 100 48 100
e. 1 Never 6 11 2 9 3 4 5 5 5 13 4 8
2 Sometimes 29 53 10 45 32 40 26 27 16 42 17 35
3 Often 14 25 5 23 23 29 39 41 11 29 22 46
4 Very often 6 11 5 23 22 28 25 26 6 16 5 10
Total 55 100 22 100 80 100 95 100 38 100 48 100
f. 1 Never 2 4 0 0 0 0 1 1 2 5 1 2
2 Sometimes 18 33 11 50 18 23 17 18 16 42 13 27
3 Often 21 38 4 18 34 43 46 48 14 37 28 58
4 Very often 14 25 7 32 27 34 31 33 6 16 6 13
Total 55 100 22 100 79 100 95 100 38 100 48 100
Health
Professions
Asked questions or
contributed to course
discussions in other
ways
askquest
Arts and
Humanities
Natural-Math
Science Social Sciences Education Engineering
Interdisc.
Studies
Prepared two or more
drafts of a paper or
assignment before
turning it in
drafts
Come to class without
completing readings or
assignments
unpreparedr
(Reverse-coded
version of
unprepared created
by NSSE.)
Attended an art
exhibit, play or other
arts performance
(dance, music, etc.)
attendart
Nursing
Ag and Human
Ecology Business
Asked another student
to help you understand
course material
CLaskhelp
Explained course
material to one or
more students
CLexplain
NSSE 2016 Major Field Report, Part I: Within-Institution ComparisonsFrequency Distributionsd by Related-Major Group
Tennessee Technological University
NSSE 2016 MAJOR FIELD REPORT, PART I • 26

Seniors
Item wording
or description
Variable
name e Values f Response options Count % Count % Count % Count % Count % Count % Count % Count % Count % Count %
Health
Professions
Arts and
Humanities
Natural-Math
Science Social Sciences Education Engineering
Interdisc.
Studies Nursing
Ag and Human
Ecology Business
NSSE 2016 Major Field Report, Part I: Within-Institution ComparisonsFrequency Distributionsd by Related-Major Group
Tennessee Technological University
g. 1 Never 4 8 3 14 8 10 8 8 5 13 4 8
2 Sometimes 22 42 6 27 16 20 23 24 13 34 11 23
3 Often 19 37 5 23 31 39 35 37 10 26 19 40
4 Very often 7 13 8 36 25 31 29 31 10 26 14 29
Total 52 100 22 100 80 100 95 100 38 100 48 100
h. 1 Never 1 2 0 0 4 5 1 1 4 11 0 0
2 Sometimes 20 36 8 36 19 24 11 12 5 13 6 13
3 Often 22 40 5 23 25 32 37 39 9 24 22 46
4 Very often 12 22 9 41 31 39 46 48 20 53 20 42
Total 55 100 22 100 79 100 95 100 38 100 48 100
i. 1 Never 7 13 0 0 7 9 9 10 4 11 4 8
2 Sometimes 22 40 9 41 16 21 46 49 8 21 12 25
3 Often 18 33 5 23 25 32 23 25 9 24 20 42
4 Very often 8 15 8 36 30 38 15 16 17 45 12 25
Total 55 100 22 100 78 100 93 100 38 100 48 100
2. During the current school year, about how often have you done the following?
a. 1 Never 4 7 1 5 2 3 3 3 4 11 2 4
2 Sometimes 12 22 7 33 20 25 20 21 12 32 14 29
3 Often 24 44 5 24 25 32 36 38 10 26 25 52
4 Very often 15 27 8 38 32 41 35 37 12 32 7 15
Total 55 100 21 100 79 100 94 100 38 100 48 100
b. 1 Never 9 16 2 10 3 4 18 19 4 11 3 6
2 Sometimes 24 44 6 29 23 29 42 45 11 29 19 40
3 Often 15 27 6 29 31 39 22 24 13 34 18 38
4 Very often 7 13 7 33 22 28 11 12 10 26 7 15
Total 55 100 21 100 79 100 93 100 38 100 47 100
c. 1 Never 11 20 0 0 10 13 40 43 3 8 5 10
2 Sometimes 31 56 4 19 26 33 39 41 10 26 25 52
3 Often 9 16 11 52 27 34 8 9 15 39 12 25
4 Very often 4 7 6 29 16 20 7 7 10 26 6 13
Total 55 100 21 100 79 100 94 100 38 100 48 100
Worked with other
students on course
projects or
assignments
CLproject
Given a course
presentation
present
Combined ideas from
different courses when
completing
assignments
RIintegrate
Prepared for exams by
discussing or working
through course
material with other
students
CLstudy
Connected your
learning to societal
problems or issues
RIsocietal
Included diverse
perspectives (political,
religious, racial/ethnic,
gender, etc.) in course
discussions or
assignments
RIdiverse
NSSE 2016 MAJOR FIELD REPORT, PART I • 27

Seniors
Item wording
or description
Variable
name e Values f Response options Count % Count % Count % Count % Count % Count % Count % Count % Count % Count %
Health
Professions
Arts and
Humanities
Natural-Math
Science Social Sciences Education Engineering
Interdisc.
Studies Nursing
Ag and Human
Ecology Business
NSSE 2016 Major Field Report, Part I: Within-Institution ComparisonsFrequency Distributionsd by Related-Major Group
Tennessee Technological University
d. 1 Never 2 4 0 0 1 1 13 14 3 8 5 10
2 Sometimes 19 35 6 29 20 25 36 39 12 32 19 40
3 Often 30 55 7 33 33 41 31 33 11 29 16 33
4 Very often 4 7 8 38 26 33 13 14 12 32 8 17
Total 55 100 21 100 80 100 93 100 38 100 48 100
e. 1 Never 3 5 1 5 1 1 12 13 1 3 1 2
2 Sometimes 20 36 5 24 16 20 39 41 6 16 14 29
3 Often 20 36 7 33 39 49 32 34 17 46 27 56
4 Very often 12 22 8 38 24 30 12 13 13 35 6 13
Total 55 100 21 100 80 100 95 100 37 100 48 100
f. 1 Never 4 7 0 0 0 0 7 7 1 3 1 2
2 Sometimes 24 44 6 29 23 29 30 32 13 35 21 46
3 Often 17 31 5 24 33 41 42 45 13 35 21 46
4 Very often 10 18 10 48 24 30 15 16 10 27 3 7
Total 55 100 21 100 80 100 94 100 37 100 46 100
g. 1 Never 2 4 0 0 1 1 2 2 1 3 0 0
2 Sometimes 10 18 3 14 9 11 26 27 5 14 10 21
3 Often 24 44 9 43 30 38 40 42 12 32 29 60
4 Very often 19 35 9 43 40 50 27 28 19 51 9 19
Total 55 100 21 100 80 100 95 100 37 100 48 100
3. During the current school year, about how often have you done the following?
a. 1 Never 8 15 2 9 6 8 20 22 5 13 10 21
2 Sometimes 14 25 12 55 23 29 41 44 18 47 16 34
3 Often 20 36 4 18 25 32 20 22 10 26 15 32
4 Very often 13 24 4 18 24 31 12 13 5 13 6 13
Total 55 100 22 100 78 100 93 100 38 100 47 100
b. 1 Never 19 35 7 32 27 34 33 35 19 50 20 42
2 Sometimes 13 24 9 41 33 42 34 37 9 24 18 38
3 Often 12 22 5 23 6 8 10 11 5 13 9 19
4 Very often 11 20 1 5 13 16 16 17 5 13 1 2
Total 55 100 22 100 79 100 93 100 38 100 48 100
Tried to better
understand someone
else's views by
imagining how an
issue looks from his or
her perspective
RIperspect
Learned something
that changed the way
you understand an
issue or concept
RInewview
Connected ideas from
your courses to your
prior experiences and
knowledge
RIconnect
Examined the
strengths and
weaknesses of your
own views on a topic
or issue
RIownview
Talked about career
plans with a faculty
member
SFcareer
Worked with a faculty
member on activities
other than coursework
(committees, student
groups, etc.)
SFotherwork
NSSE 2016 MAJOR FIELD REPORT, PART I • 28

Seniors
Item wording
or description
Variable
name e Values f Response options Count % Count % Count % Count % Count % Count % Count % Count % Count % Count %
Health
Professions
Arts and
Humanities
Natural-Math
Science Social Sciences Education Engineering
Interdisc.
Studies Nursing
Ag and Human
Ecology Business
NSSE 2016 Major Field Report, Part I: Within-Institution ComparisonsFrequency Distributionsd by Related-Major Group
Tennessee Technological University
c. 1 Never 15 28 3 14 14 18 13 14 13 34 17 35
2 Sometimes 16 30 9 41 33 42 42 46 15 39 17 35
3 Often 17 31 4 18 12 15 27 29 6 16 13 27
4 Very often 6 11 6 27 19 24 10 11 4 11 1 2
Total 54 100 22 100 78 100 92 100 38 100 48 100
d. 1 Never 13 24 1 5 11 14 25 27 7 18 9 19
2 Sometimes 23 42 12 55 34 43 38 41 16 42 23 48
3 Often 14 25 6 27 18 23 22 24 11 29 13 27
4 Very often 5 9 3 14 16 20 7 8 4 11 3 6
Total 55 100 22 100 79 100 92 100 38 100 48 100
4. During the current school year, how much has your coursework emphasized the following?
a. 1 Very little 2 4 0 0 19 24 15 16 5 13 1 2
2 Some 9 16 6 27 30 38 35 37 10 26 18 38
3 Quite a bit 19 35 13 59 20 25 29 31 12 32 16 33
4 Very much 25 45 3 14 11 14 15 16 11 29 13 27
Total 55 100 22 100 80 100 94 100 38 100 48 100
b. 1 Very little 2 4 1 5 1 1 6 6 1 3 1 2
2 Some 11 20 4 18 13 16 9 9 7 18 11 23
3 Quite a bit 23 42 11 50 21 27 37 39 15 39 25 53
4 Very much 19 35 6 27 44 56 43 45 15 39 10 21
Total 55 100 22 100 79 100 95 100 38 100 47 100
c. 1 Very little 4 7 1 5 4 5 7 7 1 3 1 2
2 Some 15 27 4 18 13 16 17 18 10 26 14 29
3 Quite a bit 17 31 11 50 31 39 32 34 14 37 25 52
4 Very much 19 35 6 27 32 40 38 40 13 34 8 17
Total 55 100 22 100 80 100 94 100 38 100 48 100
d. 1 Very little 7 13 1 5 6 8 23 25 3 8 2 4
2 Some 19 35 1 5 17 21 32 34 4 11 17 35
3 Quite a bit 17 31 13 59 29 36 24 26 18 47 19 40
4 Very much 12 22 7 32 28 35 14 15 13 34 10 21
Total 55 100 22 100 80 100 93 100 38 100 48 100
Discussed your
academic performance
with a faculty member
SFperform
Memorizing course
material
memorize
Applying facts,
theories, or methods to
practical problems or
new situations
HOapply
Discussed course
topics, ideas, or
concepts with a
faculty member
outside of class
SFdiscuss
Analyzing an idea,
experience, or line of
reasoning in depth by
examining its parts
HOanalyze
Evaluating a point of
view, decision, or
information source
HOevaluate
NSSE 2016 MAJOR FIELD REPORT, PART I • 29

Seniors
Item wording
or description
Variable
name e Values f Response options Count % Count % Count % Count % Count % Count % Count % Count % Count % Count %
Health
Professions
Arts and
Humanities
Natural-Math
Science Social Sciences Education Engineering
Interdisc.
Studies Nursing
Ag and Human
Ecology Business
NSSE 2016 Major Field Report, Part I: Within-Institution ComparisonsFrequency Distributionsd by Related-Major Group
Tennessee Technological University
e. 1 Very little 6 11 1 5 6 8 11 12 1 3 1 2
2 Some 14 25 3 14 16 20 30 32 13 34 14 29
3 Quite a bit 27 49 13 59 32 40 34 36 14 37 25 52
4 Very much 8 15 5 23 26 33 19 20 10 26 8 17
Total 55 100 22 100 80 100 94 100 38 100 48 100
5. During the current school year, to what extent have your instructors done the following?
a. 1 Very little 1 2 0 0 7 9 4 4 1 3 1 2
2 Some 11 20 5 23 9 11 18 19 6 16 9 19
3 Quite a bit 27 49 8 36 29 36 44 47 13 34 21 44
4 Very much 16 29 9 41 35 44 28 30 18 47 17 35
Total 55 100 22 100 80 100 94 100 38 100 48 100
b. 1 Very little 3 5 0 0 6 8 6 6 1 3 3 6
2 Some 13 24 5 23 16 21 22 23 5 13 10 21
3 Quite a bit 25 45 6 27 26 33 39 41 13 34 18 38
4 Very much 14 25 11 50 30 38 28 29 19 50 17 35
Total 55 100 22 100 78 100 95 100 38 100 48 100
c. 1 Very little 2 4 0 0 5 6 6 6 0 0 2 4
2 Some 11 20 3 14 18 23 13 14 6 16 11 23
3 Quite a bit 26 47 9 41 22 28 41 43 11 29 19 40
4 Very much 16 29 10 45 34 43 35 37 21 55 16 33
Total 55 100 22 100 79 100 95 100 38 100 48 100
d. 1 Very little 10 18 0 0 9 11 17 18 3 8 8 17
2 Some 20 36 3 14 16 20 34 36 9 24 19 41
3 Quite a bit 16 29 13 59 18 23 28 30 11 29 13 28
4 Very much 9 16 6 27 36 46 15 16 15 39 6 13
Total 55 100 22 100 79 100 94 100 38 100 46 100
e. 1 Very little 6 11 0 0 13 16 8 9 5 13 4 8
2 Some 11 20 3 14 9 11 30 32 5 13 14 29
3 Quite a bit 28 51 9 43 26 33 38 41 9 24 22 46
4 Very much 10 18 9 43 31 39 17 18 19 50 8 17
Total 55 100 21 100 79 100 93 100 38 100 48 100
Clearly explained
course goals and
requirements
ETgoals
Taught course
sessions in an
organized way
ETorganize
Used examples or
illustrations to explain
difficult points
ETexample
Forming a new idea or
understanding from
various pieces of
information
HOform
Provided feedback on
a draft or work in
progress
ETdraftfb
Provided prompt and
detailed feedback on
tests or completed
assignments
ETfeedback
NSSE 2016 MAJOR FIELD REPORT, PART I • 30

Seniors
Item wording
or description
Variable
name e Values f Response options Count % Count % Count % Count % Count % Count % Count % Count % Count % Count %
Health
Professions
Arts and
Humanities
Natural-Math
Science Social Sciences Education Engineering
Interdisc.
Studies Nursing
Ag and Human
Ecology Business
NSSE 2016 Major Field Report, Part I: Within-Institution ComparisonsFrequency Distributionsd by Related-Major Group
Tennessee Technological University
6. During the current school year, about how often have you done the following?
a. 1 Never 5 9 2 9 12 15 7 7 6 16 1 2
2 Sometimes 11 20 9 41 31 39 14 15 12 32 23 48
3 Often 21 38 10 45 24 30 28 30 11 29 14 29
4 Very often 18 33 1 5 13 16 45 48 9 24 10 21
Total 55 100 22 100 80 100 94 100 38 100 48 100
b. 1 Never 8 15 3 14 23 29 17 18 10 27 5 10
2 Sometimes 17 31 11 50 26 33 24 26 15 41 24 50
3 Often 21 38 7 32 16 20 26 28 7 19 14 29
4 Very often 9 16 1 5 14 18 27 29 5 14 5 10
Total 55 100 22 100 79 100 94 100 37 100 48 100
c. 1 Never 11 20 3 14 19 24 16 17 8 22 6 13
2 Sometimes 21 38 8 36 36 45 27 29 17 46 24 50
3 Often 12 22 8 36 15 19 27 29 7 19 12 25
4 Very often 11 20 3 14 10 13 24 26 5 14 6 13
Total 55 100 22 100 80 100 94 100 37 100 48 100
7. During the current school year, about how many papers, reports, or other writing tasks of the following length have you been assigned? (Include those not yet completed.)
a. 0 None 5 9 0 0 7 9 18 19 4 11 8 17
1.5 1-2 14 26 4 19 14 18 26 27 12 33 12 25
4 3-5 14 26 11 52 24 32 23 24 8 22 13 27
8 6-10 10 19 3 14 14 18 16 17 3 8 8 17
13 11-15 5 9 2 10 8 11 8 8 3 8 5 10
18 16-20 4 7 0 0 5 7 1 1 2 6 1 2
23 More than 20 2 4 1 5 4 5 3 3 4 11 1 2
Total 54 100 21 100 76 100 95 100 36 100 48 100
b. 0 None 27 50 2 10 20 27 37 40 9 25 20 43
1.5 1-2 17 31 13 62 22 29 29 31 16 44 16 34
4 3-5 8 15 3 14 26 35 11 12 6 17 5 11
8 6-10 1 2 2 10 2 3 10 11 2 6 4 9
13 11-15 1 2 1 5 2 3 4 4 1 3 1 2
18 16-20 0 0 0 0 3 4 1 1 1 3 1 2
23 More than 20 0 0 0 0 0 0 1 1 1 3 0 0
Total 54 100 21 100 75 100 93 100 36 100 47 100
Used numerical
information to
examine a real-world
problem or issue
(unemployment,
climate change, public
health, etc.)
QRproblem
Evaluated what others
have concluded from
numerical information
QRevaluate
Up to 5 pages wrshortnum
(Recoded version
of wrshort created
by NSSE. Values
are estimated
number of papers,
reports, etc.)
Reached conclusions
based on your own
analysis of numerical
information (numbers,
graphs, statistics, etc.)
QRconclude
Between 6 and 10
pages
wrmednum
(Recoded version
of wrmed created
by NSSE. Values
are estimated
number of papers,
reports, etc.)
NSSE 2016 MAJOR FIELD REPORT, PART I • 31

Seniors
Item wording
or description
Variable
name e Values f Response options Count % Count % Count % Count % Count % Count % Count % Count % Count % Count %
Health
Professions
Arts and
Humanities
Natural-Math
Science Social Sciences Education Engineering
Interdisc.
Studies Nursing
Ag and Human
Ecology Business
NSSE 2016 Major Field Report, Part I: Within-Institution ComparisonsFrequency Distributionsd by Related-Major Group
Tennessee Technological University
c. 0 None 38 73 6 27 32 42 35 38 17 49 31 66
1.5 1-2 10 19 14 64 34 45 34 37 12 34 12 26
4 3-5 2 4 0 0 4 5 14 15 4 11 1 2
8 6-10 2 4 1 5 2 3 7 8 2 6 2 4
13 11-15 0 0 0 0 2 3 1 1 0 0 1 2
18 16-20 0 0 0 0 1 1 0 0 0 0 0 0
23 More than 20 0 0 1 5 1 1 1 1 0 0 0 0
Total 52 100 22 100 76 100 92 100 35 100 47 100
8. During the current school year, about how often have you had discussions with people from the following groups?
a. 1 Never 4 7 1 5 8 10 4 4 3 8 3 6
2 Sometimes 16 29 6 27 26 33 28 29 12 32 14 29
3 Often 18 33 9 41 21 27 28 29 8 21 17 35
4 Very often 17 31 6 27 24 30 35 37 15 39 14 29
Total 55 100 22 100 79 100 95 100 38 100 48 100
b. 1 Never 3 5 1 5 5 6 3 3 1 3 3 6
2 Sometimes 12 22 5 23 20 25 23 24 11 29 9 19
3 Often 19 35 10 45 29 36 39 41 12 32 21 45
4 Very often 21 38 6 27 26 33 30 32 14 37 14 30
Total 55 100 22 100 80 100 95 100 38 100 47 100
c. 1 Never 3 5 1 5 5 6 7 7 2 5 2 4
2 Sometimes 11 20 7 33 32 40 23 24 10 26 15 31
3 Often 17 31 3 14 20 25 31 33 11 29 17 35
4 Very often 24 44 10 48 23 29 34 36 15 39 14 29
Total 55 100 21 100 80 100 95 100 38 100 48 100
d. 1 Never 3 5 0 0 2 3 4 4 1 3 2 4
2 Sometimes 13 24 3 14 29 36 26 27 10 26 12 25
3 Often 15 27 7 32 25 31 32 34 10 26 22 46
4 Very often 24 44 12 55 24 30 33 35 17 45 12 25
Total 55 100 22 100 80 100 95 100 38 100 48 100
People of a race or
ethnicity other than
your own
DDrace
People from an
economic background
other than your own
DDeconomic
People with religious
beliefs other than your
own
DDreligion
11 pages or more wrlongnum
(Recoded version
of wrlong created
by NSSE. Values
are estimated
number of papers,
reports, etc.)
People with political
views other than your
own
DDpolitical
NSSE 2016 MAJOR FIELD REPORT, PART I • 32

Seniors
Item wording
or description
Variable
name e Values f Response options Count % Count % Count % Count % Count % Count % Count % Count % Count % Count %
Health
Professions
Arts and
Humanities
Natural-Math
Science Social Sciences Education Engineering
Interdisc.
Studies Nursing
Ag and Human
Ecology Business
NSSE 2016 Major Field Report, Part I: Within-Institution ComparisonsFrequency Distributionsd by Related-Major Group
Tennessee Technological University
9. During the current school year, about how often have you done the following?
a. 1 Never 3 5 0 0 0 0 11 12 1 3 2 4
2 Sometimes 11 20 4 19 15 19 25 26 6 16 16 33
3 Often 26 47 8 38 29 37 38 40 12 32 22 46
4 Very often 15 27 9 43 35 44 21 22 19 50 8 17
Total 55 100 21 100 79 100 95 100 38 100 48 100
b. 1 Never 3 6 1 5 4 5 13 14 3 8 1 2
2 Sometimes 14 26 3 14 17 22 29 31 10 26 14 29
3 Often 14 26 7 32 24 31 28 30 9 24 18 38
4 Very often 23 43 11 50 33 42 24 26 16 42 15 31
Total 54 100 22 100 78 100 94 100 38 100 48 100
c. 1 Never 5 9 0 0 2 3 14 15 3 8 4 8
2 Sometimes 18 33 5 24 18 23 29 31 9 24 19 40
3 Often 13 24 8 38 31 39 36 38 12 32 16 33
4 Very often 19 35 8 38 28 35 16 17 14 37 9 19
Total 55 100 21 100 79 100 95 100 38 100 48 100
10. During the current school year, to what extent have your courses challenged you to do your best work?
1 Not at all 0 0 0 0 2 3 3 3 1 3 1 2
2 1 2 1 5 1 1 0 0 1 3 1 2
3 1 2 1 5 1 1 3 3 1 3 1 2
4 5 9 0 0 5 6 8 8 3 8 7 15
5 20 37 9 41 16 20 26 27 6 16 14 30
6 16 30 6 27 20 25 29 31 10 26 14 30
7 Very much 11 20 5 23 34 43 26 27 16 42 9 19
Total 54 100 22 100 79 100 95 100 38 100 47 100
Summarized what you
learned in class or
from course materials
LSsummary
challenge
Identified key
information from
reading assignments
LSreading
Reviewed your notes
after class
LSnotes
NSSE 2016 MAJOR FIELD REPORT, PART I • 33

Seniors
Item wording
or description
Variable
name e Values f Response options Count % Count % Count % Count % Count % Count % Count % Count % Count % Count %
Health
Professions
Arts and
Humanities
Natural-Math
Science Social Sciences Education Engineering
Interdisc.
Studies Nursing
Ag and Human
Ecology Business
NSSE 2016 Major Field Report, Part I: Within-Institution ComparisonsFrequency Distributionsd by Related-Major Group
Tennessee Technological University
11. Which of the following have you done or do you plan to do before you graduate?
a. Have not decided 5 9 1 5 2 3 7 7 4 11 4 8
Do not plan to do 19 35 6 27 4 5 20 21 13 34 16 33
Plan to do 9 16 2 9 7 9 9 9 5 13 9 19
Done or in progress 22 40 13 59 67 84 59 62 16 42 19 40
Total 55 100 22 100 80 100 95 100 38 100 48 100
b. Have not decided 4 7 3 14 11 14 13 14 3 8 2 4
Do not plan to do 23 42 10 45 40 50 32 34 21 55 26 54
Plan to do 1 2 4 18 2 3 7 7 4 11 4 8
Done or in progress 27 49 5 23 27 34 42 45 10 26 16 33
Total 55 100 22 100 80 100 94 100 38 100 48 100
c. Have not decided 8 15 4 18 5 6 11 12 1 3 7 15
Do not plan to do 36 65 13 59 36 45 55 58 21 55 25 52
Plan to do 1 2 2 9 5 6 7 7 2 5 4 8
Done or in progress 10 18 3 14 34 43 22 23 14 37 12 25
Total 55 100 22 100 80 100 95 100 38 100 48 100
d. Have not decided 5 9 2 9 6 8 10 11 6 16 2 4
Do not plan to do 35 64 18 82 68 85 68 72 26 68 35 74
Plan to do 5 9 1 5 2 3 6 6 3 8 5 11
Done or in progress 10 18 1 5 4 5 11 12 3 8 5 11
Total 55 100 22 100 80 100 95 100 38 100 47 100
e. Have not decided 5 9 4 18 8 10 9 9 3 8 5 10
Do not plan to do 21 38 7 32 46 58 46 48 19 51 34 71
Plan to do 5 9 2 9 7 9 15 16 5 14 3 6
Done or in progress 24 44 9 41 19 24 25 26 10 27 6 13
Total 55 100 22 100 80 100 95 100 37 100 48 100
f. Have not decided 3 5 0 0 1 1 3 3 0 0 4 9
Do not plan to do 24 44 5 23 18 23 4 4 4 11 14 30
Plan to do 12 22 3 14 14 18 26 27 12 32 10 21
Done or in progress 16 29 14 64 47 59 62 65 22 58 19 40
Total 55 100 22 100 80 100 95 100 38 100 47 100
Participate in an
internship, co-op, field
experience, student
teaching, or clinical
placement
intern
(Means indicate
the percentage
who responded
"Done or in
progress.")
Work with a faculty
member on a research
project
research
(Means indicate
the percentage
who responded
"Done or in
progress.")
Complete a
culminating senior
experience (capstone
course, senior project
or thesis,
comprehensive exam,
portfolio, etc.)
capstone
(Means indicate
the percentage
who responded
"Done or in
progress.")
Hold a formal
leadership role in a
student organization or
group
leader
(Means indicate
the percentage
who responded
"Done or in
progress.")
Participate in a
learning community or
some other formal
program where groups
of students take two or
more classes together
learncom
(Means indicate
the percentage
who responded
"Done or in
progress.")
Participate in a study
abroad program
abroad
(Means indicate
the percentage
who responded
"Done or in
progress.")
NSSE 2016 MAJOR FIELD REPORT, PART I • 34

Seniors
Item wording
or description
Variable
name e Values f Response options Count % Count % Count % Count % Count % Count % Count % Count % Count % Count %
Health
Professions
Arts and
Humanities
Natural-Math
Science Social Sciences Education Engineering
Interdisc.
Studies Nursing
Ag and Human
Ecology Business
NSSE 2016 Major Field Report, Part I: Within-Institution ComparisonsFrequency Distributionsd by Related-Major Group
Tennessee Technological University
12. About how many of your courses at this institution have included a community-based project (service-learning)?
1 None 31 56 5 23 21 26 45 47 14 37 21 44
2 Some 22 40 12 55 42 53 43 45 21 55 25 52
3 Most 2 4 5 23 16 20 6 6 3 8 2 4
4 All 0 0 0 0 1 1 1 1 0 0 0 0
Total 55 100 22 100 80 100 95 100 38 100 48 100
13. Indicate the quality of your interactions with the following people at your institution.
a. 1 Poor 1 2 0 0 1 1 1 1 1 3 0 0
2 3 5 0 0 0 0 4 4 1 3 1 2
3 2 4 0 0 2 3 2 2 3 8 1 2
4 5 9 0 0 4 5 4 4 0 0 8 17
5 12 22 11 50 17 21 23 24 7 18 5 10
6 16 29 6 27 22 28 34 36 5 13 13 27
7 Excellent 16 29 5 23 34 43 27 28 19 50 20 42
— Not applicable 0 0 0 0 0 0 0 0 2 5 0 0
Total 55 100 22 100 80 100 95 100 38 100 48 100
b. 1 Poor 2 4 0 0 6 8 8 8 2 5 3 6
2 3 5 2 9 7 9 6 6 2 5 2 4
3 5 9 3 14 7 9 4 4 2 5 7 15
4 3 5 1 5 10 13 11 12 6 16 5 10
5 10 18 4 18 13 16 16 17 2 5 10 21
6 17 31 0 0 10 13 26 27 3 8 4 8
7 Excellent 15 27 12 55 27 34 23 24 21 55 17 35
— Not applicable 0 0 0 0 0 0 1 1 0 0 0 0
Total 55 100 22 100 80 100 95 100 38 100 48 100
c. 1 Poor 0 0 0 0 2 3 5 5 1 3 2 4
2 2 4 0 0 3 4 2 2 2 5 1 2
3 2 4 1 5 5 6 4 4 2 5 4 8
4 7 13 2 9 5 6 14 15 2 5 6 13
5 13 24 6 27 16 20 12 13 6 16 8 17
6 16 29 7 32 20 25 34 37 10 26 12 25
7 Excellent 15 27 6 27 29 36 22 24 15 39 15 31
— Not applicable 0 0 0 0 0 0 0 0 0 0 0 0
Total 55 100 22 100 80 100 93 100 38 100 48 100
servcourse
Students QIstudent
Academic advisors QIadvisor
Faculty QIfaculty
NSSE 2016 MAJOR FIELD REPORT, PART I • 35

Seniors
Item wording
or description
Variable
name e Values f Response options Count % Count % Count % Count % Count % Count % Count % Count % Count % Count %
Health
Professions
Arts and
Humanities
Natural-Math
Science Social Sciences Education Engineering
Interdisc.
Studies Nursing
Ag and Human
Ecology Business
NSSE 2016 Major Field Report, Part I: Within-Institution ComparisonsFrequency Distributionsd by Related-Major Group
Tennessee Technological University
d. 1 Poor 3 5 2 9 5 6 6 6 2 5 1 2
2 4 7 0 0 2 3 10 11 2 5 2 4
3 1 2 2 9 10 13 6 6 2 5 3 6
4 9 16 4 18 12 15 9 9 8 21 9 19
5 13 24 6 27 12 15 19 20 5 13 7 15
6 12 22 3 14 9 11 23 24 3 8 13 27
7 Excellent 8 15 2 9 16 20 16 17 7 18 5 10
— Not applicable 5 9 3 14 14 18 6 6 9 24 8 17
Total 55 100 22 100 80 100 95 100 38 100 48 100
e. 1 Poor 3 6 0 0 4 5 8 8 2 5 1 2
2 4 8 2 10 1 1 7 7 3 8 1 2
3 6 11 3 14 11 14 3 3 3 8 5 10
4 9 17 6 29 11 14 10 11 9 24 9 19
5 13 25 6 29 22 28 25 26 3 8 13 27
6 8 15 4 19 17 21 26 27 7 18 11 23
7 Excellent 9 17 0 0 13 16 15 16 9 24 8 17
— Not applicable 1 2 0 0 1 1 1 1 2 5 0 0
Total 53 100 21 100 80 100 95 100 38 100 48 100
14. How much does your institution emphasize the following?
a. 1 Very little 1 2 0 0 2 3 4 4 0 0 1 2
2 Some 9 16 5 23 24 30 12 13 5 13 12 25
3 Quite a bit 27 49 11 50 28 35 34 37 15 39 23 48
4 Very much 18 33 6 27 25 32 43 46 18 47 12 25
Total 55 100 22 100 79 100 93 100 38 100 48 100
b. 1 Very little 4 7 0 0 5 6 6 6 3 8 3 6
2 Some 13 24 2 10 20 25 22 23 5 13 13 28
3 Quite a bit 25 45 15 71 30 38 46 49 16 42 22 47
4 Very much 13 24 4 19 24 30 20 21 14 37 9 19
Total 55 100 21 100 79 100 94 100 38 100 47 100
c. 1 Very little 3 5 4 18 12 15 11 12 5 13 5 10
2 Some 15 27 5 23 19 24 37 40 7 18 13 27
3 Quite a bit 20 36 10 45 29 37 29 31 11 29 20 42
4 Very much 17 31 3 14 19 24 16 17 15 39 10 21
Total 55 100 22 100 79 100 93 100 38 100 48 100
Student services staff
(career services,
student activities,
housing, etc.)
QIstaff
Other administrative
staff and offices
(registrar, financial
aid, etc.)
QIadmin
Spending significant
amounts of time
studying and on
academic works
empstudy
Providing support to
help students succeed
academically
SEacademic
Using learning support
services (tutoring
services, writing
center, etc.)
SElearnsup
NSSE 2016 MAJOR FIELD REPORT, PART I • 36

Seniors
Item wording
or description
Variable
name e Values f Response options Count % Count % Count % Count % Count % Count % Count % Count % Count % Count %
Health
Professions
Arts and
Humanities
Natural-Math
Science Social Sciences Education Engineering
Interdisc.
Studies Nursing
Ag and Human
Ecology Business
NSSE 2016 Major Field Report, Part I: Within-Institution ComparisonsFrequency Distributionsd by Related-Major Group
Tennessee Technological University
d. 1 Very little 13 24 3 14 15 19 22 24 4 11 11 24
2 Some 22 40 5 23 28 35 33 36 8 21 17 37
3 Quite a bit 11 20 10 45 17 22 24 26 13 34 12 26
4 Very much 9 16 4 18 19 24 13 14 13 34 6 13
Total 55 100 22 100 79 100 92 100 38 100 46 100
e. 1 Very little 8 15 1 5 8 10 11 12 4 11 4 8
2 Some 12 22 7 32 20 25 26 28 6 16 9 19
3 Quite a bit 24 44 10 45 28 35 38 41 12 32 23 48
4 Very much 11 20 4 18 23 29 18 19 16 42 12 25
Total 55 100 22 100 79 100 93 100 38 100 48 100
f. 1 Very little 5 9 3 14 12 15 19 20 3 8 7 15
2 Some 15 27 5 23 20 25 26 28 8 21 17 36
3 Quite a bit 23 42 10 45 25 32 31 33 16 42 16 34
4 Very much 12 22 4 18 22 28 17 18 11 29 7 15
Total 55 100 22 100 79 100 93 100 38 100 47 100
g. 1 Very little 24 44 6 29 31 39 36 39 13 35 12 26
2 Some 19 35 8 38 27 34 30 32 10 27 20 43
3 Quite a bit 6 11 6 29 11 14 21 23 10 27 12 26
4 Very much 6 11 1 5 10 13 6 6 4 11 2 4
Total 55 100 21 100 79 100 93 100 37 100 46 100
h. 1 Very little 8 15 1 5 15 19 11 12 4 11 5 11
2 Some 21 39 12 55 20 25 33 36 13 34 16 34
3 Quite a bit 17 31 7 32 27 34 34 37 17 45 19 40
4 Very much 8 15 2 9 17 22 14 15 4 11 7 15
Total 54 100 22 100 79 100 92 100 38 100 47 100
i. 1 Very little 12 22 4 18 21 27 25 27 10 26 6 13
2 Some 27 49 9 41 30 38 36 39 10 26 18 38
3 Quite a bit 12 22 7 32 12 15 24 26 14 37 17 35
4 Very much 4 7 2 9 16 20 7 8 4 11 7 15
Total 55 100 22 100 79 100 92 100 38 100 48 100
Providing
opportunities to be
involved socially
SEsocial
Providing support for
your overall well-
being (recreation,
health care,
counseling, etc.)
SEwellness
Helping you manage
your non-academic
responsibilities (work,
family, etc.)
SEnonacad
Encouraging contact
among students from
different backgrounds
(social, racial/ethnic,
religious, etc.)
SEdiverse
Attending campus
activities and events
(performing arts,
athletic events, etc.)
SEactivities
Attending events that
address important
social, economic, or
political issues
SEevents
NSSE 2016 MAJOR FIELD REPORT, PART I • 37
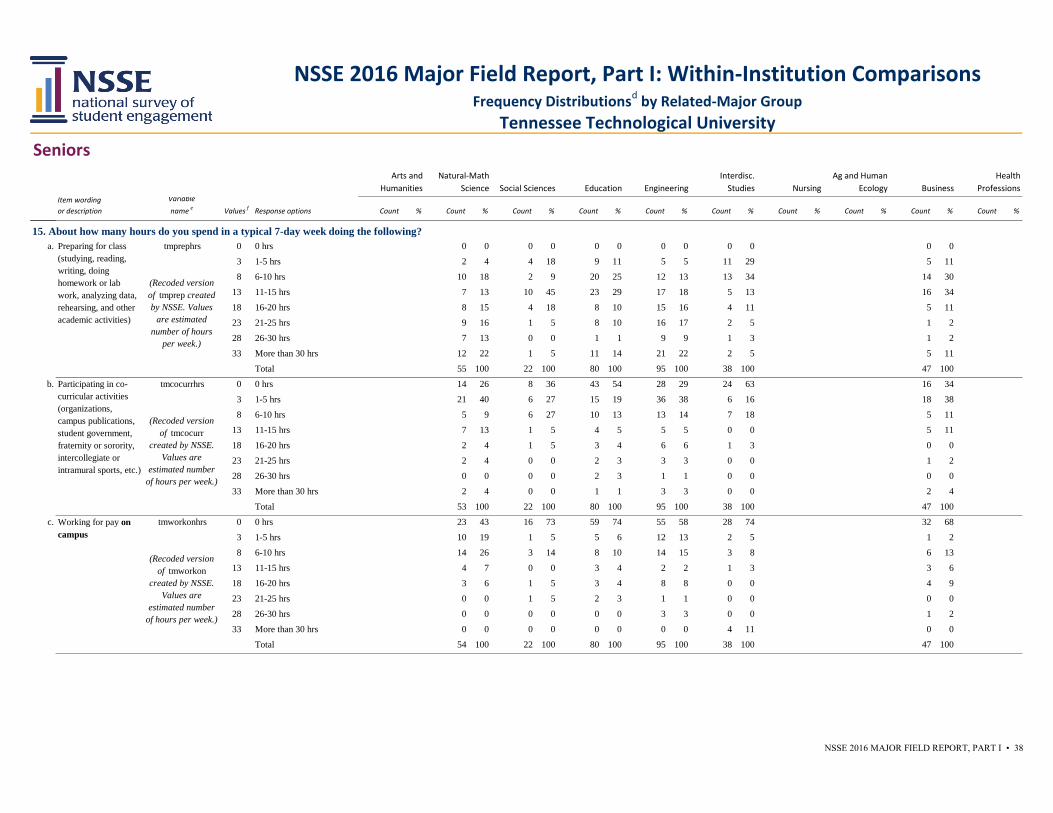
Seniors
Item wording
or description
Variable
name e Values f Response options Count % Count % Count % Count % Count % Count % Count % Count % Count % Count %
Health
Professions
Arts and
Humanities
Natural-Math
Science Social Sciences Education Engineering
Interdisc.
Studies Nursing
Ag and Human
Ecology Business
NSSE 2016 Major Field Report, Part I: Within-Institution ComparisonsFrequency Distributionsd by Related-Major Group
Tennessee Technological University
15. About how many hours do you spend in a typical 7-day week doing the following?
a. 0 0 hrs 0 0 0 0 0 0 0 0 0 0 0 0
3 1-5 hrs 2 4 4 18 9 11 5 5 11 29 5 11
8 6-10 hrs 10 18 2 9 20 25 12 13 13 34 14 30
13 11-15 hrs 7 13 10 45 23 29 17 18 5 13 16 34
18 16-20 hrs 8 15 4 18 8 10 15 16 4 11 5 11
23 21-25 hrs 9 16 1 5 8 10 16 17 2 5 1 2
28 26-30 hrs 7 13 0 0 1 1 9 9 1 3 1 2
33 More than 30 hrs 12 22 1 5 11 14 21 22 2 5 5 11
Total 55 100 22 100 80 100 95 100 38 100 47 100
b. 0 0 hrs 14 26 8 36 43 54 28 29 24 63 16 34
3 1-5 hrs 21 40 6 27 15 19 36 38 6 16 18 38
8 6-10 hrs 5 9 6 27 10 13 13 14 7 18 5 11
13 11-15 hrs 7 13 1 5 4 5 5 5 0 0 5 11
18 16-20 hrs 2 4 1 5 3 4 6 6 1 3 0 0
23 21-25 hrs 2 4 0 0 2 3 3 3 0 0 1 2
28 26-30 hrs 0 0 0 0 2 3 1 1 0 0 0 0
33 More than 30 hrs 2 4 0 0 1 1 3 3 0 0 2 4
Total 53 100 22 100 80 100 95 100 38 100 47 100
c. 0 0 hrs 23 43 16 73 59 74 55 58 28 74 32 68
3 1-5 hrs 10 19 1 5 5 6 12 13 2 5 1 2
8 6-10 hrs 14 26 3 14 8 10 14 15 3 8 6 13
13 11-15 hrs 4 7 0 0 3 4 2 2 1 3 3 6
18 16-20 hrs 3 6 1 5 3 4 8 8 0 0 4 9
23 21-25 hrs 0 0 1 5 2 3 1 1 0 0 0 0
28 26-30 hrs 0 0 0 0 0 0 3 3 0 0 1 2
33 More than 30 hrs 0 0 0 0 0 0 0 0 4 11 0 0
Total 54 100 22 100 80 100 95 100 38 100 47 100
Participating in co-
curricular activities
(organizations,
campus publications,
student government,
fraternity or sorority,
intercollegiate or
intramural sports, etc.)
tmcocurrhrs
(Recoded version
of tmcocurr
created by NSSE.
Values are
estimated number
of hours per week.)
Working for pay on
campus
tmworkonhrs
(Recoded version
of tmworkon
created by NSSE.
Values are
estimated number
of hours per week.)
Preparing for class
(studying, reading,
writing, doing
homework or lab
work, analyzing data,
rehearsing, and other
academic activities)
tmprephrs
(Recoded version
of tmprep created
by NSSE. Values
are estimated
number of hours
per week.)
NSSE 2016 MAJOR FIELD REPORT, PART I • 38

Seniors
Item wording
or description
Variable
name e Values f Response options Count % Count % Count % Count % Count % Count % Count % Count % Count % Count %
Health
Professions
Arts and
Humanities
Natural-Math
Science Social Sciences Education Engineering
Interdisc.
Studies Nursing
Ag and Human
Ecology Business
NSSE 2016 Major Field Report, Part I: Within-Institution ComparisonsFrequency Distributionsd by Related-Major Group
Tennessee Technological University
d. 0 0 hrs 30 56 7 32 41 51 66 70 11 30 17 36
3 1-5 hrs 2 4 0 0 3 4 3 3 2 5 1 2
8 6-10 hrs 3 6 3 14 8 10 4 4 1 3 0 0
13 11-15 hrs 5 9 1 5 4 5 2 2 2 5 8 17
18 16-20 hrs 1 2 3 14 9 11 6 6 1 3 5 11
23 21-25 hrs 6 11 3 14 3 4 3 3 1 3 7 15
28 26-30 hrs 2 4 1 5 7 9 7 7 2 5 1 2
33 More than 30 hrs 5 9 4 18 5 6 3 3 17 46 8 17
Total 54 100 22 100 80 100 94 100 37 100 47 100
e. 0 0 hrs 20 37 6 27 35 44 59 62 12 32 27 57
3 1-5 hrs 22 41 10 45 28 35 27 28 20 53 14 30
8 6-10 hrs 6 11 4 18 7 9 6 6 4 11 2 4
13 11-15 hrs 4 7 0 0 3 4 2 2 0 0 3 6
18 16-20 hrs 1 2 1 5 4 5 1 1 1 3 1 2
23 21-25 hrs 1 2 0 0 1 1 0 0 0 0 0 0
28 26-30 hrs 0 0 1 5 0 0 0 0 0 0 0 0
33 More than 30 hrs 0 0 0 0 1 1 0 0 1 3 0 0
Total 54 100 22 100 79 100 95 100 38 100 47 100
f. 0 0 hrs 1 2 1 5 0 0 2 2 2 5 3 6
3 1-5 hrs 14 25 4 18 36 45 22 24 16 43 20 43
8 6-10 hrs 14 25 8 36 20 25 29 32 14 38 7 15
13 11-15 hrs 12 22 3 14 12 15 14 15 4 11 6 13
18 16-20 hrs 7 13 1 5 1 1 15 16 0 0 4 9
23 21-25 hrs 4 7 3 14 5 6 4 4 0 0 4 9
28 26-30 hrs 1 2 2 9 0 0 2 2 0 0 1 2
33 More than 30 hrs 2 4 0 0 6 8 4 4 1 3 2 4
Total 55 100 22 100 80 100 92 100 37 100 47 100
Working for pay off
campus
tmworkoffhrs
(Recoded version
of tmworkoff
created by NSSE.
Values are
estimated number
of hours per week.)
Doing community
service or volunteer
work
tmservicehrs
(Recoded version
of tmservice
created by NSSE.
Values are
estimated number
of hours per week.)
Relaxing and
socializing (time with
friends, video games,
TV or videos, keeping
up with friends online,
etc.)
tmrelaxhrs
(Recoded version
of tmrelax created
by NSSE. Values
are estimated
number of hours
per week.)
NSSE 2016 MAJOR FIELD REPORT, PART I • 39

Seniors
Item wording
or description
Variable
name e Values f Response options Count % Count % Count % Count % Count % Count % Count % Count % Count % Count %
Health
Professions
Arts and
Humanities
Natural-Math
Science Social Sciences Education Engineering
Interdisc.
Studies Nursing
Ag and Human
Ecology Business
NSSE 2016 Major Field Report, Part I: Within-Institution ComparisonsFrequency Distributionsd by Related-Major Group
Tennessee Technological University
g. 0 0 hrs 43 78 16 73 48 61 72 79 15 41 31 66
3 1-5 hrs 8 15 3 14 13 16 6 7 4 11 5 11
8 6-10 hrs 0 0 1 5 1 1 6 7 6 16 1 2
13 11-15 hrs 1 2 0 0 5 6 0 0 4 11 2 4
18 16-20 hrs 1 2 0 0 2 3 2 2 1 3 4 9
23 21-25 hrs 0 0 0 0 0 0 2 2 2 5 0 0
28 26-30 hrs 0 0 0 0 2 3 1 1 0 0 0 0
33 More than 30 hrs 2 4 2 9 8 10 2 2 5 14 4 9
Total 55 100 22 100 79 100 91 100 37 100 47 100
h. 0 0 hrs 8 15 2 9 7 9 12 13 6 16 2 4
3 1-5 hrs 40 73 13 59 51 64 68 73 24 63 30 65
8 6-10 hrs 2 4 4 18 15 19 8 9 6 16 7 15
13 11-15 hrs 5 9 0 0 3 4 2 2 1 3 2 4
18 16-20 hrs 0 0 1 5 2 3 3 3 1 3 3 7
23 21-25 hrs 0 0 1 5 1 1 0 0 0 0 1 2
28 26-30 hrs 0 0 1 5 0 0 0 0 0 0 0 0
33 More than 30 hrs 0 0 0 0 1 1 0 0 0 0 1 2
Total 55 100 22 100 80 100 93 100 38 100 46 100
16. Of the time you spend preparing for class in a typical 7-day week, about how much is on assigned reading?
1 Very little 15 27 0 0 19 24 44 47 9 24 8 17
2 Some 21 38 8 36 21 26 31 33 7 18 15 32
3 About half 10 18 5 23 23 29 11 12 10 26 13 28
4 Most 7 13 6 27 15 19 5 5 11 29 7 15
5 Almost all 2 4 3 14 2 3 3 3 1 3 4 9
Total 55 100 22 100 80 100 94 100 38 100 47 100
0 0 hrs 0 0 0 0 0 0 0 0 0 0 0 0
3 More than 0, up to 5 hrs 28 51 10 45 46 58 62 66 24 63 27 57
8 More than 5, up to 10 hrs 15 27 7 32 20 25 22 23 10 26 10 21
13 More than 10, up to 15 hrs 3 5 4 18 6 8 4 4 3 8 4 9
18 More than 15, up to 20 hrs 3 5 0 0 4 5 2 2 0 0 3 6
23 More than 20, up to 25 hrs 4 7 0 0 4 5 3 3 1 3 2 4
28 More than 25 hrs 2 4 1 5 0 0 1 1 0 0 1 2
Total 55 100 22 100 80 100 94 100 38 100 47 100
Commuting to campus
(driving, walking, etc.)
tmcommutehrs
(Recoded version
of tmcommute
created by NSSE.
Values are
estimated number
of hours per week.)
Providing care for
dependents (children,
parents, etc.)
tmcarehrs
(Recoded version
of tmcare created
by NSSE. Values
are estimated
number of hours
per week.)
reading
tmreadinghrscol
(Recoded version
of tmcommute
created by NSSE.
Values are
estimated number
of hours per week.)
NSSE 2016 MAJOR FIELD REPORT, PART I • 40

Seniors
Item wording
or description
Variable
name e Values f Response options Count % Count % Count % Count % Count % Count % Count % Count % Count % Count %
Health
Professions
Arts and
Humanities
Natural-Math
Science Social Sciences Education Engineering
Interdisc.
Studies Nursing
Ag and Human
Ecology Business
NSSE 2016 Major Field Report, Part I: Within-Institution ComparisonsFrequency Distributionsd by Related-Major Group
Tennessee Technological University
17. How much has your experience at this institution contributed to your knowledge, skills, and personal development in the following areas?
a. 1 Very little 2 4 0 0 8 10 12 13 1 3 4 8
2 Some 22 40 3 14 20 25 36 38 8 21 17 35
3 Quite a bit 19 35 11 50 30 38 26 28 13 34 16 33
4 Very much 12 22 8 36 21 27 20 21 16 42 11 23
Total 55 100 22 100 79 100 94 100 38 100 48 100
b. 1 Very little 2 4 0 0 9 11 14 15 2 5 2 4
2 Some 21 38 5 23 14 18 24 26 8 21 13 28
3 Quite a bit 19 35 11 50 30 38 33 35 13 34 17 36
4 Very much 13 24 6 27 27 34 23 24 15 39 15 32
Total 55 100 22 100 80 100 94 100 38 100 47 100
c. 1 Very little 2 4 0 0 6 8 4 4 2 5 1 2
2 Some 5 9 5 23 16 20 9 10 5 13 9 19
3 Quite a bit 24 44 8 36 29 36 32 34 15 39 20 42
4 Very much 24 44 9 41 29 36 49 52 16 42 18 38
Total 55 100 22 100 80 100 94 100 38 100 48 100
d. 1 Very little 1 2 1 5 20 25 5 5 4 11 2 4
2 Some 10 18 8 36 29 37 11 12 11 29 7 15
3 Quite a bit 25 45 5 23 20 25 29 31 12 32 24 51
4 Very much 19 35 8 36 10 13 49 52 11 29 14 30
Total 55 100 22 100 79 100 94 100 38 100 47 100
e. 1 Very little 10 18 1 5 2 3 8 9 4 11 2 4
2 Some 13 24 5 23 16 20 22 23 6 16 8 17
3 Quite a bit 15 27 11 50 25 32 29 31 10 26 21 44
4 Very much 17 31 5 23 36 46 35 37 18 47 17 35
Total 55 100 22 100 79 100 94 100 38 100 48 100
f. 1 Very little 2 4 0 0 4 5 6 7 2 5 2 4
2 Some 17 31 4 18 13 16 17 18 7 18 11 24
3 Quite a bit 22 40 9 41 30 38 30 33 8 21 17 37
4 Very much 14 25 9 41 33 41 39 42 21 55 16 35
Total 55 100 22 100 80 100 92 100 38 100 46 100
pgspeak
Thinking critically and
analytically
pgthink
Analyzing numerical
and statistical
information
pganalyze
Acquiring job- or
work-related
knowledge and skills
pgwork
Working effectively
with others
pgothers
Writing clearly and
effectively
pgwrite
Speaking clearly and
effectively
NSSE 2016 MAJOR FIELD REPORT, PART I • 41

Seniors
Item wording
or description
Variable
name e Values f Response options Count % Count % Count % Count % Count % Count % Count % Count % Count % Count %
Health
Professions
Arts and
Humanities
Natural-Math
Science Social Sciences Education Engineering
Interdisc.
Studies Nursing
Ag and Human
Ecology Business
NSSE 2016 Major Field Report, Part I: Within-Institution ComparisonsFrequency Distributionsd by Related-Major Group
Tennessee Technological University
g. 1 Very little 7 13 1 5 11 14 21 22 3 8 6 13
2 Some 19 35 7 32 20 25 20 21 10 26 9 19
3 Quite a bit 19 35 8 36 22 28 30 32 12 32 20 43
4 Very much 10 18 6 27 26 33 23 24 13 34 12 26
Total 55 100 22 100 79 100 94 100 38 100 47 100
h. 1 Very little 5 9 2 9 13 16 18 19 4 11 9 19
2 Some 20 36 7 32 26 33 33 35 11 29 6 13
3 Quite a bit 17 31 5 23 23 29 28 30 10 26 22 47
4 Very much 13 24 8 36 18 23 15 16 13 34 10 21
Total 55 100 22 100 80 100 94 100 38 100 47 100
i. 1 Very little 4 7 1 5 9 11 8 9 5 13 4 9
2 Some 14 26 7 32 25 32 17 18 8 21 15 32
3 Quite a bit 23 43 8 36 26 33 35 38 14 37 18 38
4 Very much 13 24 6 27 19 24 33 35 11 29 10 21
Total 54 100 22 100 79 100 93 100 38 100 47 100
j. 1 Very little 8 15 1 5 12 15 26 28 7 19 8 17
2 Some 17 31 7 32 29 37 29 31 10 27 14 30
3 Quite a bit 21 39 7 32 23 29 28 30 9 24 14 30
4 Very much 8 15 7 32 15 19 11 12 11 30 11 23
Total 54 100 22 100 79 100 94 100 37 100 47 100
18. How would you evaluate your entire educational experience at this institution?
1 Poor 1 2 0 0 2 3 7 7 1 3 3 6
2 Fair 6 11 3 14 9 11 9 9 5 13 5 11
3 Good 22 40 9 41 28 35 40 42 12 32 17 36
4 Excellent 26 47 10 45 41 51 39 41 20 53 22 47
Total 55 100 22 100 80 100 95 100 38 100 47 100
19. If you could start over again, would you go to the same institution you are now attending?
1 Definitely no 4 7 0 0 7 9 7 7 3 8 4 8
2 Probably no 9 16 3 14 8 10 8 8 4 11 7 15
3 Probably yes 13 24 8 36 23 29 41 43 9 24 13 27
4 Definitely yes 29 53 11 50 42 53 39 41 22 58 24 50
Total 55 100 22 100 80 100 95 100 38 100 48 100
Being an informed and
active citizen
pgcitizen
evalexp
sameinst
Developing or
clarifying a personal
code of values and
ethics
pgvalues
Understanding people
of other backgrounds
(economic,
racial/ethnic, political,
religious, nationality,
etc.)
pgdiverse
Solving complex real-
world problems
pgprobsolve
NSSE 2016 MAJOR FIELD REPORT, PART I • 42

First-Year Students
Variable Namee
1 a. askquest 2.6 3.0 2.7 2.7 2.8 1.0 0.7 0.8 0.8 0.9 30 30 77 24 32
b. drafts 1.9 2.7 2.4 2.7 2.6 1.1 1.0 1.0 0.9 1.1 30 30 76 24 32
c. unpreparedr 3.1 3.1 3.1 3.2 3.2 0.9 0.8 0.8 0.8 0.8 30 30 76 24 32
d. attendart 2.4 2.2 2.1 2.0 2.5 0.9 1.0 0.9 0.6 0.8 30 30 77 24 32
e. CLaskhelp 2.7 2.7 3.0 2.7 2.8 0.9 0.7 0.8 0.8 0.9 30 30 77 24 32
f. CLexplain 2.7 2.7 2.9 2.8 2.8 0.9 0.7 0.8 0.8 0.8 30 30 77 24 32
g. CLstudy 2.6 2.3 2.8 2.7 2.8 1.1 1.0 1.0 0.8 0.8 30 30 77 24 32
h. CLproject 2.5 2.6 2.8 2.7 2.8 0.9 0.8 0.8 0.8 0.8 30 29 77 24 31
i. present 2.2 2.3 2.2 2.3 2.6 1.0 0.9 0.9 0.9 0.9 30 30 77 24 32
2 a. RIintegrate 2.5 2.8 2.5 2.6 2.5 1.0 0.7 0.9 0.7 0.8 30 29 77 24 32
b. RIsocietal 2.5 2.5 2.3 2.3 2.7 0.9 0.8 0.8 0.8 0.9 30 29 77 24 32
c. RIdiverse 2.5 2.5 2.3 2.3 2.7 0.9 0.7 0.8 0.8 0.8 30 29 76 24 32
d. RIownview 2.8 2.8 2.7 2.6 2.8 0.8 0.8 0.8 0.7 0.8 30 29 77 24 31
e. RIperspect 2.7 2.6 2.7 2.8 2.9 0.8 0.6 0.7 0.7 0.8 30 29 76 24 32
f. RInewview 2.7 2.8 2.6 2.6 2.9 1.0 0.8 0.7 0.8 0.7 30 29 76 24 32
g. RIconnect 3.3 2.9 2.9 2.9 3.3 0.7 0.7 0.7 0.6 0.7 30 29 76 24 32
3 a. SFcareer 2.4 2.5 2.0 2.3 2.3 1.0 0.9 0.9 0.7 1.0 30 30 76 24 32
b. SFotherwork 2.0 2.0 1.7 1.7 2.1 1.0 1.0 0.9 0.8 1.0 30 30 76 24 32
c. SFdiscuss 2.2 2.3 1.8 2.1 2.0 1.0 1.1 0.8 0.9 1.0 30 28 76 24 32
d. SFperform 2.2 2.5 1.9 2.1 2.3 0.9 1.0 0.8 0.8 0.8 30 30 76 24 32
4 a. memorize 3.4 3.1 3.0 3.3 3.3 0.6 0.7 0.7 0.6 0.7 30 30 75 24 32
b. HOapply 3.2 2.8 3.2 3.3 2.9 0.7 0.7 0.7 0.6 0.8 30 30 75 24 32
c. HOanalyze 2.7 2.7 3.0 3.3 2.8 1.0 0.8 0.8 0.6 0.8 30 30 75 24 32
d. HOevaluate 2.6 2.9 2.7 3.1 2.8 0.9 0.6 0.9 0.7 0.8 30 30 74 24 32
e. HOform 2.6 2.7 2.7 3.1 2.5 1.1 0.8 0.9 0.7 0.9 30 30 75 24 32
5 a. ETgoals 3.2 3.2 2.9 3.2 3.2 0.8 0.6 0.8 0.7 0.7 30 30 76 23 32
b. ETorganize 3.4 3.0 3.0 3.1 3.3 0.6 0.9 0.8 0.7 0.6 30 30 76 24 31
c. ETexample 3.1 2.8 3.0 3.3 3.3 0.8 0.8 0.9 0.6 0.7 30 30 75 24 32
d. ETdraftfb 2.6 2.5 2.4 2.9 2.8 0.9 0.9 0.9 0.9 0.9 30 30 76 24 32
e. ETfeedback 3.0 2.7 2.6 2.8 2.9 0.9 0.9 0.9 0.8 0.9 30 29 76 24 32
Hea
lth
Pro
fess
ion
s
Engi
nee
rin
g
Inte
rdis
c. S
tud
ies
Nu
rsin
g
Ag
and
Hu
man
Eco
logy
Bu
sin
ess
Soci
al S
cien
ces
Ag
and
Hu
man
Eco
logy
Nu
rsin
g
Edu
cati
on
Inte
rdis
c. S
tud
ies
Engi
nee
rin
g
Edu
cati
on
Art
s an
d H
um
anit
ies
Nat
ura
l-M
ath
Scie
nce
Soci
al S
cien
ces
Art
s an
d H
um
anit
ies
Art
s an
d H
um
anit
ies
Nat
ura
l-M
ath
Scie
nce
Bu
sin
ess
Hea
lth
Pro
fess
ion
s
NSSE 2016 Major Field Report, Part I: Within-Institution ComparisonsItem Summary Statisticsd by Related-Major Group
Tennessee Technological University
Mean
Hea
lth
Pro
fess
ion
s
Nat
ura
l-M
ath
Scie
nce
Soci
al S
cien
ces
Bu
sin
ess
Edu
cati
on
Engi
nee
rin
g
Inte
rdis
c. S
tud
ies
Ag
and
Hu
man
Eco
logy
Nu
rsin
g
Standard deviationb
N
NSSE 2016 MAJOR FIELD REPORT, PART I • 43

First-Year Students
Variable Namee
Hea
lth
Pro
fess
ion
s
Engi
nee
rin
g
Inte
rdis
c. S
tud
ies
Nu
rsin
g
Ag
and
Hu
man
Eco
logy
Bu
sin
ess
Soci
al S
cien
ces
Ag
and
Hu
man
Eco
logy
Nu
rsin
g
Edu
cati
on
Inte
rdis
c. S
tud
ies
Engi
nee
rin
g
Edu
cati
on
Art
s an
d H
um
anit
ies
Nat
ura
l-M
ath
Scie
nce
Soci
al S
cien
ces
Art
s an
d H
um
anit
ies
Art
s an
d H
um
anit
ies
Nat
ura
l-M
ath
Scie
nce
Bu
sin
ess
Hea
lth
Pro
fess
ion
s
NSSE 2016 Major Field Report, Part I: Within-Institution ComparisonsItem Summary Statisticsd by Related-Major Group
Tennessee Technological University
Mean
Hea
lth
Pro
fess
ion
s
Nat
ura
l-M
ath
Scie
nce
Soci
al S
cien
ces
Bu
sin
ess
Edu
cati
on
Engi
nee
rin
g
Inte
rdis
c. S
tud
ies
Ag
and
Hu
man
Eco
logy
Nu
rsin
g
Standard deviationb
N
6 a. QRconclude 2.7 2.4 2.7 2.4 2.7 1.0 0.9 0.9 0.8 0.9 30 30 76 24 32
b. QRproblem 2.3 2.2 2.3 2.2 2.4 1.0 0.9 1.0 0.8 0.9 30 30 76 24 32
c. QRevaluate 2.3 2.0 2.3 2.2 2.4 0.9 0.9 0.9 0.8 0.9 30 30 76 24 32
7 a. wrshortnum 3.1 4.7 4.5 4.6 4.8 3.2 4.4 4.8 3.2 5.8 30 29 75 23 32
b. wrmednum 0.8 1.1 1.6 1.3 0.6 1.9 2.2 3.2 2.1 0.9 29 28 73 21 32
c. wrlongnum 0.4 0.5 1.0 0.5 0.1 1.5 1.6 3.7 1.8 0.4 29 30 74 20 32
— wrpages 21.1 29.4 39.1 31.4 21.3 39.3 43.3 84.2 44.1 21.9 29 28 73 20 32
8 a. DDrace 3.0 3.0 3.0 2.8 3.2 0.9 0.9 0.9 0.9 0.8 29 30 75 23 32
b. DDeconomic 3.0 2.9 3.0 2.9 3.0 0.8 0.9 0.8 1.0 0.9 29 30 75 24 32
c. DDreligion 2.7 2.8 2.9 2.8 3.0 0.9 1.0 0.9 0.9 0.9 29 30 75 24 32
d. DDpolitical 3.1 3.0 3.0 2.9 3.2 0.9 0.9 0.8 1.0 0.8 29 29 75 24 31
9 a. LSreading 2.9 3.0 2.8 3.1 2.9 1.0 0.6 0.9 0.8 0.8 30 30 74 24 32
b. LSnotes 3.2 3.0 3.1 3.3 3.0 0.8 0.9 0.9 0.8 0.9 30 30 74 23 32
c. LSsummary 2.8 3.0 2.9 3.1 2.9 0.9 0.9 0.9 0.8 0.9 30 29 74 23 32
challenge 5.4 5.7 5.8 5.8 5.5 1.2 1.3 1.0 1.3 1.1 30 30 76 24 32
11 a. intern 0.03 0.03 0.05 0.13 0.16 30 30 76 24 31
b. leader 0.13 0.10 0.09 0.08 0.13 30 30 75 24 31
c. learncom 0.07 0.07 0.08 0.08 0.16 30 30 74 24 31
d. abroad 0.03 0.00 0.01 0.00 0.10 30 30 74 23 31
e. research 0.07 0.03 0.05 0.04 0.03 30 30 74 24 30
f. capstone 0.00 0.00 0.00 0.00 0.10 30 30 74 24 31
servcourse 1.7 1.8 1.6 1.8 1.6 0.6 0.7 0.7 0.6 0.6 30 30 76 24 32
13 a. QIstudent 4.8 5.5 5.2 5.5 5.8 1.4 1.4 1.4 0.9 1.3 29 30 75 24 32
b. QIadvisor 5.4 5.5 5.2 5.7 5.9 1.6 1.6 1.6 1.6 1.3 30 30 75 24 32
c. QIfaculty 5.5 5.6 5.3 5.2 5.8 1.2 1.4 1.3 1.4 1.2 30 30 75 22 32
d. QIstaff 4.8 4.9 5.1 5.3 5.7 1.6 1.7 1.7 1.1 1.3 26 25 71 21 30
e. QIadmin 4.7 5.2 5.1 5.0 5.5 1.7 1.7 1.6 1.3 1.2 28 29 73 21 29
14 a. empstudy 3.3 2.9 3.1 3.3 3.0 0.6 0.7 0.9 0.8 0.8 30 30 76 24 32
b. SEacademic 3.0 2.8 3.0 3.2 3.1 0.8 0.7 0.8 0.7 0.8 30 30 76 24 32
c. SElearnsup 3.1 3.0 3.0 3.1 3.0 0.9 0.8 0.9 0.8 0.8 30 30 75 23 32
10.
12.
NSSE 2016 MAJOR FIELD REPORT, PART I • 44

First-Year Students
Variable Namee
Hea
lth
Pro
fess
ion
s
Engi
nee
rin
g
Inte
rdis
c. S
tud
ies
Nu
rsin
g
Ag
and
Hu
man
Eco
logy
Bu
sin
ess
Soci
al S
cien
ces
Ag
and
Hu
man
Eco
logy
Nu
rsin
g
Edu
cati
on
Inte
rdis
c. S
tud
ies
Engi
nee
rin
g
Edu
cati
on
Art
s an
d H
um
anit
ies
Nat
ura
l-M
ath
Scie
nce
Soci
al S
cien
ces
Art
s an
d H
um
anit
ies
Art
s an
d H
um
anit
ies
Nat
ura
l-M
ath
Scie
nce
Bu
sin
ess
Hea
lth
Pro
fess
ion
s
NSSE 2016 Major Field Report, Part I: Within-Institution ComparisonsItem Summary Statisticsd by Related-Major Group
Tennessee Technological University
Mean
Hea
lth
Pro
fess
ion
s
Nat
ura
l-M
ath
Scie
nce
Soci
al S
cien
ces
Bu
sin
ess
Edu
cati
on
Engi
nee
rin
g
Inte
rdis
c. S
tud
ies
Ag
and
Hu
man
Eco
logy
Nu
rsin
g
Standard deviationb
N
d. SEdiverse 2.6 2.5 2.4 2.8 2.6 0.8 0.7 0.9 0.9 0.8 30 30 76 24 32
e. SEsocial 2.8 2.8 2.7 3.2 3.0 0.7 0.7 0.9 0.8 0.9 30 30 76 23 32
f. SEwellness 2.9 2.8 2.8 3.1 2.8 1.0 0.8 0.9 0.7 0.9 29 30 76 23 32
g. SEnonacad 1.8 2.3 2.1 2.5 2.1 0.8 0.9 0.9 0.8 0.8 30 30 76 23 32
h. SEactivities 2.9 2.9 2.6 2.9 3.0 0.8 0.7 0.8 0.7 0.8 30 30 76 24 32
i. SEevents 2.5 2.4 2.3 2.7 2.4 0.9 0.7 1.0 0.9 0.8 30 30 76 24 32
15 a. tmprephrs 13.2 12.4 15.9 13.6 15.9 8.7 8.6 8.5 7.6 9.6 30 30 75 24 32
b. tmcocurrhrs 5.2 5.2 7.1 5.0 5.9 7.3 6.7 8.5 8.1 6.6 30 29 76 24 32
c. tmworkonhrs 2.6 1.3 3.5 3.7 2.5 4.7 3.0 5.9 7.6 5.8 30 30 75 23 32
d. tmworkoffhrs 7.9 8.6 2.5 10.5 6.5 9.6 9.2 6.6 10.1 10.2 30 30 75 23 31
— tmworkhrs 10.5 10.0 5.9 13.7 8.8 11.3 9.2 9.5 10.8 13.2 30 30 74 22 31
e. tmservicehrs 3.3 4.8 2.7 3.9 2.1 6.8 8.6 4.6 6.4 5.2 29 30 76 24 32
f. tmrelaxhrs 12.2 9.9 13.3 10.4 12.8 7.6 7.9 8.7 8.2 9.3 30 30 75 24 32
g. tmcarehrs 3.5 5.9 1.6 1.9 3.6 7.5 9.5 4.8 3.9 9.5 30 29 76 24 32
h. tmcommutehrs 4.7 6.5 3.1 4.3 4.8 7.0 7.3 5.1 4.3 5.8 30 30 76 24 32
reading 2.2 2.3 2.3 3.2 2.6 1.1 1.0 1.0 0.9 1.2 29 29 76 24 32
— tmreadinghrs 5.0 4.4 5.1 7.3 7.8 6.4 4.7 4.4 5.1 7.3 29 29 75 24 32
17 a. pgwrite 2.2 2.6 2.4 2.6 2.7 1.0 0.9 1.0 0.7 0.8 29 30 76 24 32
b. pgspeak 2.2 2.5 2.5 2.5 2.7 0.9 0.8 0.9 0.6 0.9 30 30 76 24 32
c. pgthink 3.1 2.9 3.0 3.1 2.9 0.8 0.7 0.9 0.6 0.8 30 30 76 24 32
d. pganalyze 2.8 2.6 2.9 2.4 2.8 1.0 0.8 0.9 1.0 0.9 30 30 76 24 32
e. pgwork 2.5 2.8 2.7 2.7 2.5 0.9 0.9 0.9 0.9 0.9 30 30 76 24 32
f. pgothers 2.5 2.8 2.8 3.0 2.8 0.8 0.8 0.7 0.8 1.0 30 30 75 24 32
g. pgvalues 2.3 2.4 2.5 2.8 2.4 0.8 0.8 1.0 0.8 1.0 30 30 76 23 32
h. pgdiverse 2.3 2.5 2.4 2.8 2.4 0.9 0.9 1.1 0.8 0.9 29 30 76 24 32
i. pgprobsolve 2.3 2.5 2.6 2.8 2.3 1.0 0.9 0.9 0.8 1.0 30 30 76 24 32
j. pgcitizen 2.3 2.6 2.3 2.7 2.4 0.8 0.9 1.0 0.9 1.0 30 30 76 24 32
evalexp 3.4 3.2 3.1 3.4 3.5 0.6 0.6 0.7 0.6 0.6 30 30 77 24 32
sameinst 3.3 3.3 3.3 3.5 3.5 0.7 0.8 0.7 0.7 0.7 30 30 77 24 32
16.
18.
19.
NSSE 2016 MAJOR FIELD REPORT, PART I • 45

Seniors
Variable Namee
1 a. askquest 2.8 3.3 3.5 2.9 3.3 2.8 0.9 0.8 0.7 0.8 0.9 0.9 55 22 80 94 38 47
b. drafts 2.1 2.9 2.8 2.2 2.6 2.2 1.0 1.1 1.1 1.0 1.1 1.0 54 22 79 95 37 48
c. unpreparedr 3.2 3.0 3.3 3.1 3.2 2.9 0.7 0.7 0.8 0.7 1.0 0.7 55 22 79 95 38 48
d. attendart 1.9 2.1 2.1 1.8 1.8 1.8 0.8 0.9 1.1 0.8 0.8 0.8 55 22 79 94 37 48
e. CLaskhelp 2.4 2.6 2.8 2.9 2.5 2.6 0.8 1.0 0.9 0.9 0.9 0.8 55 22 80 95 38 48
f. CLexplain 2.9 2.8 3.1 3.1 2.6 2.8 0.8 0.9 0.8 0.7 0.8 0.7 55 22 79 95 38 48
g. CLstudy 2.6 2.8 2.9 2.9 2.7 2.9 0.8 1.1 1.0 0.9 1.0 0.9 52 22 80 95 38 48
h. CLproject 2.8 3.0 3.1 3.3 3.2 3.3 0.8 0.9 0.9 0.7 1.0 0.7 55 22 79 95 38 48
i. present 2.5 3.0 3.0 2.5 3.0 2.8 0.9 0.9 1.0 0.9 1.1 0.9 55 22 78 93 38 48
2 a. RIintegrate 2.9 3.0 3.1 3.1 2.8 2.8 0.9 1.0 0.9 0.8 1.0 0.8 55 21 79 94 38 48
b. RIsocietal 2.4 2.9 2.9 2.3 2.8 2.6 0.9 1.0 0.9 0.9 1.0 0.8 55 21 79 93 38 47
c. RIdiverse 2.1 3.1 2.6 1.8 2.8 2.4 0.8 0.7 1.0 0.9 0.9 0.8 55 21 79 94 38 48
d. RIownview 2.7 3.1 3.1 2.5 2.8 2.6 0.7 0.8 0.8 0.9 1.0 0.9 55 21 80 93 38 48
e. RIperspect 2.7 3.0 3.1 2.5 3.1 2.8 0.9 0.9 0.7 0.9 0.8 0.7 55 21 80 95 37 48
f. RInewview 2.6 3.2 3.0 2.7 2.9 2.6 0.9 0.9 0.8 0.8 0.9 0.7 55 21 80 94 37 46
g. RIconnect 3.1 3.3 3.4 3.0 3.3 3.0 0.8 0.7 0.7 0.8 0.8 0.6 55 21 80 95 37 48
3 a. SFcareer 2.7 2.5 2.9 2.3 2.4 2.4 1.0 0.9 0.9 0.9 0.9 1.0 55 22 78 93 38 47
b. SFotherwork 2.3 2.0 2.1 2.1 1.9 1.8 1.1 0.9 1.0 1.1 1.1 0.8 55 22 79 93 38 48
c. SFdiscuss 2.3 2.6 2.5 2.4 2.0 2.0 1.0 1.1 1.1 0.9 1.0 0.8 54 22 78 92 38 48
d. SFperform 2.2 2.5 2.5 2.1 2.3 2.2 0.9 0.8 1.0 0.9 0.9 0.8 55 22 79 92 38 48
4 a. memorize 3.2 2.9 2.3 2.5 2.8 2.9 0.9 0.6 1.0 0.9 1.0 0.9 55 22 80 94 38 48
b. HOapply 3.1 3.0 3.4 3.2 3.2 2.9 0.8 0.8 0.8 0.9 0.8 0.7 55 22 79 95 38 47
c. HOanalyze 2.9 3.0 3.1 3.1 3.0 2.8 1.0 0.8 0.9 0.9 0.9 0.7 55 22 80 94 38 48
d. HOevaluate 2.6 3.2 3.0 2.3 3.1 2.8 1.0 0.7 0.9 1.0 0.9 0.8 55 22 80 93 38 48
e. HOform 2.7 3.0 3.0 2.6 2.9 2.8 0.9 0.8 0.9 0.9 0.8 0.7 55 22 80 94 38 48
5 a. ETgoals 3.1 3.2 3.2 3.0 3.3 3.1 0.8 0.8 0.9 0.8 0.8 0.8 55 22 80 94 38 48
b. ETorganize 2.9 3.3 3.0 2.9 3.3 3.0 0.8 0.8 1.0 0.9 0.8 0.9 55 22 78 95 38 48
c. ETexample 3.0 3.3 3.1 3.1 3.4 3.0 0.8 0.7 1.0 0.9 0.8 0.9 55 22 79 95 38 48
d. ETdraftfb 2.4 3.1 3.0 2.4 3.0 2.4 1.0 0.6 1.1 1.0 1.0 0.9 55 22 79 94 38 46
e. ETfeedback 2.8 3.3 2.9 2.7 3.1 2.7 0.9 0.7 1.1 0.9 1.1 0.8 55 21 79 93 38 48
Mean Standard deviationb
NA
rts
and
Hu
man
itie
s
Nat
ura
l-M
ath
Scie
nce
Soci
al S
cien
ces
Edu
cati
on
Engi
nee
rin
g
Ag
and
Hu
man
Eco
logy
Nu
rsin
g
Ag
and
Hu
man
Eco
logy
Nu
rsin
g
Ag
and
Hu
man
Eco
logy
Bu
sin
ess
Bu
sin
ess
Edu
cati
on
Engi
nee
rin
g
Inte
rdis
c. S
tud
ies
Hea
lth
Pro
fess
ion
s
Art
s an
d H
um
anit
ies
Nat
ura
l-M
ath
Scie
nce
Soci
al S
cien
ces
NSSE 2016 Major Field Report, Part I: Within-Institution ComparisonsItem Summary Statisticsd by Related-Major Group
Tennessee Technological University
Inte
rdis
c. S
tud
ies
Nu
rsin
g
Hea
lth
Pro
fess
ion
s
Bu
sin
ess
Hea
lth
Pro
fess
ion
s
Art
s an
d H
um
anit
ies
Nat
ura
l-M
ath
Scie
nce
Soci
al S
cien
ces
Edu
cati
on
Engi
nee
rin
g
Inte
rdis
c. S
tud
ies
NSSE 2016 MAJOR FIELD REPORT, PART I • 46

Seniors
Variable Namee
Mean Standard deviationb
NA
rts
and
Hu
man
itie
s
Nat
ura
l-M
ath
Scie
nce
Soci
al S
cien
ces
Edu
cati
on
Engi
nee
rin
g
Ag
and
Hu
man
Eco
logy
Nu
rsin
g
Ag
and
Hu
man
Eco
logy
Nu
rsin
g
Ag
and
Hu
man
Eco
logy
Bu
sin
ess
Bu
sin
ess
Edu
cati
on
Engi
nee
rin
g
Inte
rdis
c. S
tud
ies
Hea
lth
Pro
fess
ion
s
Art
s an
d H
um
anit
ies
Nat
ura
l-M
ath
Scie
nce
Soci
al S
cien
ces
NSSE 2016 Major Field Report, Part I: Within-Institution ComparisonsItem Summary Statisticsd by Related-Major Group
Tennessee Technological University
Inte
rdis
c. S
tud
ies
Nu
rsin
g
Hea
lth
Pro
fess
ion
s
Bu
sin
ess
Hea
lth
Pro
fess
ion
s
Art
s an
d H
um
anit
ies
Nat
ura
l-M
ath
Scie
nce
Soci
al S
cien
ces
Edu
cati
on
Engi
nee
rin
g
Inte
rdis
c. S
tud
ies
6 a. QRconclude 2.9 2.5 2.5 3.2 2.6 2.7 1.0 0.7 0.9 0.9 1.0 0.8 55 22 80 94 38 48
b. QRproblem 2.6 2.3 2.3 2.7 2.2 2.4 0.9 0.8 1.1 1.1 1.0 0.8 55 22 79 94 37 48
c. QRevaluate 2.4 2.5 2.2 2.6 2.2 2.4 1.0 0.9 0.9 1.0 1.0 0.9 55 22 80 94 37 48
7 a. wrshortnum 6.3 5.9 6.8 4.7 6.7 5.0 6.1 5.1 6.2 5.2 7.6 5.1 54 21 76 95 36 48
b. wrmednum 1.5 2.9 3.1 2.8 3.3 2.3 2.3 3.2 4.0 4.3 5.1 3.7 54 21 75 93 36 47
c. wrlongnum 0.8 2.4 2.0 2.2 1.4 1.1 1.7 4.9 3.9 3.3 2.1 2.5 52 22 76 92 35 47
— wrpages 41.9 61.3 70.1 68.1 66.7 49.3 47.9 47.5 94.4 88.6 77.5 64.9 52 21 73 92 33 47
8 a. DDrace 2.9 2.9 2.8 3.0 2.9 2.9 0.9 0.9 1.0 0.9 1.0 0.9 55 22 79 95 38 48
b. DDeconomic 3.1 3.0 3.0 3.0 3.0 3.0 0.9 0.8 0.9 0.8 0.9 0.9 55 22 80 95 38 47
c. DDreligion 3.1 3.0 2.8 3.0 3.0 2.9 0.9 1.0 0.9 1.0 0.9 0.9 55 21 80 95 38 48
d. DDpolitical 3.1 3.4 2.9 3.0 3.1 2.9 0.9 0.7 0.9 0.9 0.9 0.8 55 22 80 95 38 48
9 a. LSreading 3.0 3.2 3.3 2.7 3.3 2.8 0.8 0.8 0.8 0.9 0.8 0.8 55 21 79 95 38 48
b. LSnotes 3.1 3.3 3.1 2.7 3.0 3.0 1.0 0.9 0.9 1.0 1.0 0.8 54 22 78 94 38 48
c. LSsummary 2.8 3.1 3.1 2.6 3.0 2.6 1.0 0.8 0.8 0.9 1.0 0.9 55 21 79 95 38 48
challenge 5.5 5.5 5.9 5.6 5.8 5.3 1.1 1.3 1.4 1.3 1.5 1.3 54 22 79 95 38 47
11 a. intern 0.40 0.59 0.84 0.62 0.42 0.40 55 22 80 95 38 48
b. leader 0.49 0.23 0.34 0.45 0.26 0.33 55 22 80 94 38 48
c. learncom 0.18 0.14 0.43 0.23 0.37 0.25 55 22 80 95 38 48
d. abroad 0.18 0.05 0.05 0.12 0.08 0.11 55 22 80 95 38 47
e. research 0.44 0.41 0.24 0.26 0.27 0.13 55 22 80 95 37 48
f. capstone 0.29 0.64 0.59 0.65 0.58 0.40 55 22 80 95 38 47
servcourse 1.5 2.0 2.0 1.6 1.7 1.6 0.6 0.7 0.7 0.7 0.6 0.6 55 22 80 95 38 48
13 a. QIstudent 5.5 5.7 6.0 5.7 5.8 5.8 1.5 0.8 1.2 1.3 1.6 1.3 55 22 80 95 36 48
b. QIadvisor 5.3 5.5 4.9 5.0 5.6 5.0 1.7 1.9 2.0 1.9 1.9 1.9 55 22 80 94 38 48
c. QIfaculty 5.5 5.7 5.6 5.3 5.6 5.4 1.3 1.1 1.6 1.6 1.6 1.7 55 22 80 93 38 48
d. QIstaff 4.9 4.5 4.7 4.8 4.7 5.0 1.7 1.7 1.8 1.9 1.8 1.5 50 19 66 89 29 40
e. QIadmin 4.6 4.3 4.9 4.9 4.8 5.0 1.7 1.2 1.6 1.8 1.9 1.4 52 21 79 94 36 48
14 a. empstudy 3.1 3.0 3.0 3.2 3.3 3.0 0.7 0.7 0.9 0.8 0.7 0.8 55 22 79 93 38 48
b. SEacademic 2.9 3.1 2.9 2.9 3.1 2.8 0.9 0.5 0.9 0.8 0.9 0.8 55 21 79 94 38 47
c. SElearnsup 2.9 2.5 2.7 2.5 2.9 2.7 0.9 1.0 1.0 0.9 1.1 0.9 55 22 79 93 38 48
10.
12.
NSSE 2016 MAJOR FIELD REPORT, PART I • 47

Seniors
Variable Namee
Mean Standard deviationb
NA
rts
and
Hu
man
itie
s
Nat
ura
l-M
ath
Scie
nce
Soci
al S
cien
ces
Edu
cati
on
Engi
nee
rin
g
Ag
and
Hu
man
Eco
logy
Nu
rsin
g
Ag
and
Hu
man
Eco
logy
Nu
rsin
g
Ag
and
Hu
man
Eco
logy
Bu
sin
ess
Bu
sin
ess
Edu
cati
on
Engi
nee
rin
g
Inte
rdis
c. S
tud
ies
Hea
lth
Pro
fess
ion
s
Art
s an
d H
um
anit
ies
Nat
ura
l-M
ath
Scie
nce
Soci
al S
cien
ces
NSSE 2016 Major Field Report, Part I: Within-Institution ComparisonsItem Summary Statisticsd by Related-Major Group
Tennessee Technological University
Inte
rdis
c. S
tud
ies
Nu
rsin
g
Hea
lth
Pro
fess
ion
s
Bu
sin
ess
Hea
lth
Pro
fess
ion
s
Art
s an
d H
um
anit
ies
Nat
ura
l-M
ath
Scie
nce
Soci
al S
cien
ces
Edu
cati
on
Engi
nee
rin
g
Inte
rdis
c. S
tud
ies
d. SEdiverse 2.3 2.7 2.5 2.3 2.9 2.3 1.0 0.9 1.1 1.0 1.0 1.0 55 22 79 92 38 46
e. SEsocial 2.7 2.8 2.8 2.7 3.1 2.9 1.0 0.8 1.0 0.9 1.0 0.9 55 22 79 93 38 48
f. SEwellness 2.8 2.7 2.7 2.5 2.9 2.5 0.9 0.9 1.0 1.0 0.9 0.9 55 22 79 93 38 47
g. SEnonacad 1.9 2.1 2.0 2.0 2.1 2.1 1.0 0.9 1.0 0.9 1.0 0.8 55 21 79 93 37 46
h. SEactivities 2.5 2.5 2.6 2.6 2.6 2.6 0.9 0.7 1.0 0.9 0.8 0.9 54 22 79 92 38 47
i. SEevents 2.1 2.3 2.3 2.1 2.3 2.5 0.8 0.9 1.1 0.9 1.0 0.9 55 22 79 92 38 48
15 a. tmprephrs 20.4 13.0 15.1 20.2 10.9 13.6 9.6 7.1 9.2 9.4 8.4 8.4 55 22 80 95 38 47
b. tmcocurrhrs 6.5 4.4 4.6 6.1 2.4 5.3 8.0 4.9 7.5 8.0 4.0 7.7 53 22 80 95 38 47
c. tmworkonhrs 4.6 3.1 2.7 4.5 4.6 4.0 5.3 6.3 5.6 7.2 10.3 6.9 54 22 80 95 38 47
d. tmworkoffhrs 8.7 14.5 9.0 5.7 18.9 13.8 11.8 12.7 11.4 10.3 15.1 12.5 54 22 80 94 37 47
— tmworkhrs 13.2 17.6 11.7 10.3 23.6 17.9 11.7 15.6 11.1 12.0 13.9 12.0 53 22 80 94 37 47
e. tmservicehrs 3.8 4.9 3.9 1.8 3.8 2.4 5.0 6.6 6.1 3.2 6.0 4.2 54 22 79 95 38 47
f. tmrelaxhrs 11.3 11.7 9.4 11.2 6.6 9.6 7.9 8.5 8.7 8.0 5.7 8.9 55 22 80 92 37 47
g. tmcarehrs 2.2 3.8 5.9 2.7 9.2 5.4 6.8 9.7 10.8 7.0 11.5 10.1 55 22 79 91 37 47
h. tmcommutehrs 3.7 6.4 5.1 3.7 4.0 6.1 3.3 7.3 5.2 3.5 3.7 6.5 55 22 80 93 38 46
reading 2.3 3.2 2.5 1.9 2.7 2.7 1.1 1.1 1.1 1.0 1.2 1.2 55 22 80 94 38 47
— tmreadinghrs 7.6 7.3 6.2 5.2 4.8 6.6 7.1 6.4 6.0 5.4 4.9 7.0 55 22 80 94 38 47
17 a. pgwrite 2.7 3.2 2.8 2.6 3.2 2.7 0.8 0.7 0.9 1.0 0.9 0.9 55 22 79 94 38 48
b. pgspeak 2.8 3.0 2.9 2.7 3.1 3.0 0.9 0.7 1.0 1.0 0.9 0.9 55 22 80 94 38 47
c. pgthink 3.3 3.2 3.0 3.3 3.2 3.1 0.8 0.8 0.9 0.8 0.9 0.8 55 22 80 94 38 48
d. pganalyze 3.1 2.9 2.3 3.3 2.8 3.1 0.8 1.0 1.0 0.9 1.0 0.8 55 22 79 94 38 47
e. pgwork 2.7 2.9 3.2 3.0 3.1 3.1 1.1 0.8 0.9 1.0 1.0 0.8 55 22 79 94 38 48
f. pgothers 2.9 3.2 3.2 3.1 3.3 3.0 0.8 0.8 0.9 0.9 0.9 0.9 55 22 80 92 38 46
g. pgvalues 2.6 2.9 2.8 2.6 2.9 2.8 0.9 0.9 1.1 1.1 1.0 1.0 55 22 79 94 38 47
h. pgdiverse 2.7 2.9 2.6 2.4 2.8 2.7 0.9 1.0 1.0 1.0 1.0 1.0 55 22 80 94 38 47
i. pgprobsolve 2.8 2.9 2.7 3.0 2.8 2.7 0.9 0.9 1.0 0.9 1.0 0.9 54 22 79 93 38 47
j. pgcitizen 2.5 2.9 2.5 2.3 2.6 2.6 0.9 0.9 1.0 1.0 1.1 1.0 54 22 79 94 37 47
evalexp 3.3 3.3 3.4 3.2 3.3 3.2 0.7 0.7 0.8 0.9 0.8 0.9 55 22 80 95 38 47
sameinst 3.2 3.4 3.3 3.2 3.3 3.2 1.0 0.7 1.0 0.9 1.0 1.0 55 22 80 95 38 48
18.
19.
16.
NSSE 2016 MAJOR FIELD REPORT, PART I • 48

First-Year Students
Item wording
or description
Variable
name Response options Count % Count % Count % Count % Count % Count % Count % Count % Count % Count %
20a. One 26 87 29 97 75 97 23 96 24 75
More than one 4 13 1 3 2 3 1 4 8 25
Total 30 100 30 100 77 100 24 100 32 100
Arts & Humanities 0 0 6 20 0 0 0 0 0 0
Biological Sci., Agriculture,
& Natural Resources21 70 0 0 0 0 0 0 0 0
Physical Sci., Mathematics,
& Computer Science9 30 0 0 12 16 0 0 0 0
Social Sciences 0 0 0 0 0 0 0 0 1 3
Business 0 0 0 0 0 0 0 0 31 97
Communications, Media,
& Public Relations0 0 0 0 0 0 0 0 0 0
Education 0 0 17 57 0 0 0 0 0 0
Engineering 0 0 0 0 65 84 0 0 0 0
Health Professions 0 0 7 23 0 0 24 100 0 0
Social Service Professions 0 0 0 0 0 0 0 0 0 0
All Other 0 0 0 0 0 0 0 0 0 0
Undecided, Undeclared 0 0 0 0 0 0 0 0 0 0
Total 30 100 30 100 77 100 24 100 32 100
Arts & Humanities 1 25 1 100 0 0 0 0 0 0
Biological Sci., Agriculture,
& Natural Resources2 50 0 0 0 0 0 0 0 0
Physical Sci., Mathematics,
& Computer Science0 0 0 0 0 0 0 0 0 0
Social Sciences 0 0 0 0 0 0 0 0 1 13
Business 0 0 0 0 1 50 0 0 7 88
Communications, Media,
& Public Relations0 0 0 0 0 0 0 0 0 0
Education 1 25 0 0 0 0 0 0 0 0
Engineering 0 0 0 0 1 50 0 0 0 0
Health Professions 0 0 0 0 0 0 1 100 0 0
Social Service Professions 0 0 0 0 0 0 0 0 0 0
All Other 0 0 0 0 0 0 0 0 0 0
Undecided, Undeclared 0 0 0 0 0 0 0 0 0 0
Total 4 100 1 100 2 100 1 100 8 100
Health
Professions
Arts and
Humanities
Natural-Math
Science Social Sciences Education Engineering
Interdisc.
Studies Nursing
Ag and Human
Ecology Business
How many majors do
you plan to complete?
(Do not count minors.)
MAJnum
First major or expected
first major, in NSSE's
default related-major
categories.
(Does not reflect any
customization made
for the Major Field
Report)
MAJfirstcol
(Recoded from
MAJfirst.)
Second major or
expected second major,
in NSSE's default
related-major
categories.
(Does not reflect any
customization made
for the Major Field
Report)
MAJsecondcol
(Recoded from
MAJsecond.)
NSSE 2016 Major Field Report, Part I: Within-Institution ComparisonsRespondent Profiled by Related-Major Group
Tennessee Technological University
NSSE 2016 MAJOR FIELD REPORT, PART I • 49

First-Year Students
Item wording
or description
Variable
name Response options Count % Count % Count % Count % Count % Count % Count % Count % Count % Count %
Health
Professions
Arts and
Humanities
Natural-Math
Science Social Sciences Education Engineering
Interdisc.
Studies Nursing
Ag and Human
Ecology Business
NSSE 2016 Major Field Report, Part I: Within-Institution ComparisonsRespondent Profiled by Related-Major Group
Tennessee Technological University
21. Freshman/First-year 24 80 21 70 66 86 23 96 22 69
Sophomore 6 20 9 30 10 13 1 4 9 28
Junior 0 0 0 0 1 1 0 0 0 0
Senior 0 0 0 0 0 0 0 0 1 3
Unclassified 0 0 0 0 0 0 0 0 0 0
Total 30 100 30 100 77 100 24 100 32 100
22. No 0 0 1 3 1 1 0 0 1 3
Yes 30 100 29 97 75 99 24 100 31 97
Total 30 100 30 100 76 100 24 100 32 100
23a. 0 0 0 0 0 0 0 0 0 0 0
1 0 0 0 0 0 0 0 0 0 0
2 0 0 0 0 0 0 0 0 1 3
3 0 0 2 7 1 1 0 0 2 6
4 13 43 3 10 17 22 5 21 4 13
5 12 40 14 47 42 55 17 71 18 56
6 4 13 6 20 12 16 2 8 6 19
7 or more 1 3 5 17 5 6 0 0 1 3
Total 30 100 30 100 77 100 24 100 32 100
b. 0 25 86 23 77 70 91 14 58 27 84
1 3 10 6 20 4 5 8 33 5 16
2 0 0 1 3 2 3 2 8 0 0
3 1 3 0 0 1 1 0 0 0 0
4 0 0 0 0 0 0 0 0 0 0
5 0 0 0 0 0 0 0 0 0 0
6 0 0 0 0 0 0 0 0 0 0
7 or more 0 0 0 0 0 0 0 0 0 0
Total 29 100 30 100 77 100 24 100 32 100
No courses taken online 25 86 23 77 70 91 14 58 27 84
Some courses taken online 4 14 7 23 7 9 10 42 5 16
All courses taken online 0 0 0 0 0 0 0 0 0 0
Total 29 100 30 100 77 100 24 100 32 100
onlinecrscol
What is your class
level?
class
Thinking about this
current academic term,
are you a full-time
student?
fulltime
How many courses are
you taking for credit
this current academic
term?
coursenum
Of these, how many are
entirely online ?
onlinenum
Collapsed recode of
courses taken online
(Based on responses to
coursenum and
onlinenum)
NSSE 2016 MAJOR FIELD REPORT, PART I • 50

First-Year Students
Item wording
or description
Variable
name Response options Count % Count % Count % Count % Count % Count % Count % Count % Count % Count %
Health
Professions
Arts and
Humanities
Natural-Math
Science Social Sciences Education Engineering
Interdisc.
Studies Nursing
Ag and Human
Ecology Business
NSSE 2016 Major Field Report, Part I: Within-Institution ComparisonsRespondent Profiled by Related-Major Group
Tennessee Technological University
24. C- or lower 0 0 1 3 1 1 0 0 0 0
C 1 3 1 3 2 3 0 0 0 0
C+ 3 10 1 3 4 5 0 0 1 3
B- 3 10 4 13 5 6 0 0 2 6
B 1 3 5 17 15 19 2 8 4 13
B+ 5 17 4 13 12 16 3 13 5 16
A- 5 17 6 20 12 16 5 21 9 28
A 12 40 8 27 26 34 14 58 11 34
Total 30 100 30 100 77 100 24 100 32 100
25. Started here 21 70 25 83 67 87 22 92 28 88
Started elsewhere 9 30 5 17 10 13 2 8 4 13
Total 30 100 30 100 77 100 24 100 32 100
26. attend_voc Vocational or technical school 0 0 0 0 1 1 0 0 0 0
attend_com Community or junior college 4 13 2 7 13 17 3 13 4 13
attend_col 4-year college or university
other than this one4 13 5 17 1 1 3 13 3 9
attend_none None 20 67 23 77 61 79 20 83 22 69
attend_other Other 3 10 0 0 2 3 0 0 4 13
27. Some college but less than a
bachelor's0 0 2 7 3 4 1 4 4 13
Bachelor's degree 7 23 8 27 36 47 6 25 8 25
Master's degree 4 13 15 50 31 40 14 58 18 56
Doctoral or professional degree 19 63 5 17 7 9 3 13 2 6
Total 30 100 30 100 77 100 24 100 32 100
What have most of your
grades been up to now
at this institution?
grades
Did you begin college
at this institution or
elsewhere?
begincol
Since graduating from
high school, which of
the following types of
schools have you
attended other than the
one you are now
attending? (Select all
that apply.)
What is the highest
level of education you
ever expect to
complete?
edaspire
NSSE 2016 MAJOR FIELD REPORT, PART I • 51

First-Year Students
Item wording
or description
Variable
name Response options Count % Count % Count % Count % Count % Count % Count % Count % Count % Count %
Health
Professions
Arts and
Humanities
Natural-Math
Science Social Sciences Education Engineering
Interdisc.
Studies Nursing
Ag and Human
Ecology Business
NSSE 2016 Major Field Report, Part I: Within-Institution ComparisonsRespondent Profiled by Related-Major Group
Tennessee Technological University
28. Did not finish high school 0 0 2 7 2 3 2 8 1 3
High school diploma or G.E.D. 4 13 4 13 13 17 6 25 8 25
Attended college, but did not
complete degree4 13 4 13 8 10 3 13 5 16
Associate's degree (A.A., A.S., etc.) 5 17 6 20 6 8 2 8 1 3
Bachelor’s degree (B.A., B.S., etc.) 9 30 9 30 29 38 6 25 11 34
Master’s degree (M.A., M.S., etc.) 4 13 5 17 16 21 4 17 1 3
Doctoral or professional degree
(Ph.D., J.D., M.D., etc.)4 13 0 0 3 4 1 4 5 16
Total 30 100 30 100 77 100 24 100 32 100
No 17 57 14 47 48 62 11 46 17 53
Yes 13 43 16 53 29 38 13 54 15 47
Total 30 100 30 100 77 100 24 100 32 100
29. Man 8 27 5 17 52 68 3 13 12 38
Woman 22 73 24 80 22 29 21 88 19 59
Another gender identity 0 0 1 3 2 3 0 0 0 0
I prefer not to respond 0 0 0 0 0 0 0 0 1 3
Total 30 100 30 100 76 100 24 100 32 100
30. 19 or younger 28 97 25 83 70 92 22 92 24 77
20-23 1 3 4 13 5 7 1 4 3 10
24-29 0 0 0 0 0 0 1 4 1 3
30-39 0 0 0 0 1 1 0 0 1 3
40-55 0 0 1 3 0 0 0 0 2 6
Over 55 0 0 0 0 0 0 0 0 0 0
Total 29 100 30 100 76 100 24 100 31 100
What is the highest
level of education
completed by either of
your parents (or those
who raised you)?
parented
First-generation status
(No parent holds a
bachelor's degree)
firstgen
(Recoded from
parented)
What is your gender
identity?
genderid
Enter your year of birth
(e.g., 1994):
agecat
(Recoded
from the
information
entered in
birthyear)
NSSE 2016 MAJOR FIELD REPORT, PART I • 52

First-Year Students
Item wording
or description
Variable
name Response options Count % Count % Count % Count % Count % Count % Count % Count % Count % Count %
Health
Professions
Arts and
Humanities
Natural-Math
Science Social Sciences Education Engineering
Interdisc.
Studies Nursing
Ag and Human
Ecology Business
NSSE 2016 Major Field Report, Part I: Within-Institution ComparisonsRespondent Profiled by Related-Major Group
Tennessee Technological University
31a. No 29 97 30 100 73 97 23 100 28 88
Yes 1 3 0 0 2 3 0 0 4 13
Total 30 100 30 100 75 100 23 100 32 100
Africa Sub-Saharan 0 0 0 0 0 0 0 0 0 0
Asia 1 100 0 0 0 0 0 0 0 0
Canada 0 0 0 0 0 0 0 0 0 0
Europe 0 0 0 0 0 0 0 0 1 25
Latin America and Caribbean 0 0 0 0 0 0 0 0 2 50
Middle East and North Africa 0 0 0 0 1 50 0 0 1 25
Oceania 0 0 0 0 1 50 0 0 0 0
Unknown region/uncoded 0 0 0 0 0 0 0 0 0 0
Total 1 100 0 0 2 100 0 0 4 100
32. re_amind American Indian or Alaska Native 2 7 0 0 1 1 1 4 1 3
re_asian Asian 1 3 0 0 2 3 0 0 1 3
re_black Black or African American 0 0 3 10 3 4 0 0 4 13
re_latino Hispanic or Latino 1 3 0 0 4 5 1 4 2 6
re_pacific Native Hawaiian/Other Pac. Islander 0 0 0 0 1 1 0 0 0 0
re_white White 25 83 27 90 69 91 23 96 23 72
re_other Other 1 3 0 0 0 0 0 0 1 3
re_pnr I prefer not to respond 1 3 1 3 2 3 0 0 2 6
American Indian or Alaska Native 1 3 0 0 0 0 0 0 0 0
Asian 1 3 0 0 1 1 0 0 0 0
Black or African American 0 0 2 7 1 1 0 0 4 13
Hispanic or Latino 1 3 0 0 2 3 1 4 2 6
Native Hawaiian/Other Pac. Islander 0 0 0 0 1 1 0 0 0 0
White 24 80 26 87 63 83 22 92 21 66
Other 1 3 0 0 0 0 0 0 1 3
Multiracial 1 3 1 3 6 8 1 4 2 6
I prefer not to respond 1 3 1 3 2 3 0 0 2 6
Total 30 100 30 100 76 100 24 100 32 100
33. No 29 97 27 90 70 92 23 96 27 84
Yes 1 3 3 10 6 8 1 4 5 16
Total 30 100 30 100 76 100 24 100 32 100
International student
country of citizenship,
collapsed into regions
by NSSE. Responses to
country are in the data
file. U.S. (domestic)
students did not receive
this question.
countrycol
(Recoded from
country.)
Are you a member of a
social fraternity or
sorority?
greek
Are you an
international student?
internat
What is your racial or
ethnic identification?
(Select all that apply.)
Racial or ethnic
identification
re_all
(Recoded from
re_amind
through
re_pnr
where each
student is
represented
only once)
NSSE 2016 MAJOR FIELD REPORT, PART I • 53

First-Year Students
Item wording
or description
Variable
name Response options Count % Count % Count % Count % Count % Count % Count % Count % Count % Count %
Health
Professions
Arts and
Humanities
Natural-Math
Science Social Sciences Education Engineering
Interdisc.
Studies Nursing
Ag and Human
Ecology Business
NSSE 2016 Major Field Report, Part I: Within-Institution ComparisonsRespondent Profiled by Related-Major Group
Tennessee Technological University
34. Dormitory or other campus housing
(not fraternity or sorority house)16 53 8 27 57 75 11 46 15 47
Fraternity or sorority house 0 0 0 0 0 0 0 0 1 3
Residence, within walking dist. 3 10 1 3 7 9 2 8 6 19
Residence, farther than
walking dist.11 37 20 67 9 12 10 42 10 31
None of the above 0 0 1 3 3 4 1 4 0 0
Total 30 100 30 100 76 100 24 100 32 100
35. No 27 90 28 93 75 99 24 100 31 97
Yes 3 10 2 7 1 1 0 0 1 3
Total 30 100 30 100 76 100 24 100 32 100
36. No 29 100 30 100 75 100 23 100 28 88
Yes 0 0 0 0 0 0 0 0 4 13
Total 29 100 30 100 75 100 23 100 32 100
37a. No 23 77 24 80 67 88 22 92 28 88
Yes 6 20 4 13 5 7 2 8 2 6
I prefer not to respond 1 3 2 7 4 5 0 0 2 6
Total 30 100 30 100 76 100 24 100 32 100
b. dis_sense A sensory impairment 0 0 1 25 0 0 0 0 1 50
dis_mobility A mobility impairment 0 0 1 25 1 20 0 0 0 0
dis_learning A learning disability 4 67 1 25 3 60 0 0 0 0
dis_mental A mental health disorder 2 33 0 0 1 20 2 100 0 0
dis_other A disability not listed 1 17 2 50 0 0 0 0 1 50
A sensory impairment 0 0 1 3 0 0 0 0 1 3
A mobility impairment 0 0 1 3 1 1 0 0 0 0
A learning disability 3 10 0 0 3 4 0 0 0 0
A mental health disorder 2 7 0 0 1 1 2 8 0 0
A disability not listed 0 0 1 3 0 0 0 0 1 3
More than one disability 1 3 1 3 0 0 0 0 0 0
No disability or impairment 23 77 24 80 67 88 22 92 28 88
Prefer not to respond 1 3 2 7 4 5 0 0 2 6
Total 30 100 30 100 76 100 24 100 32 100
Disability or
impairment
disability_all
(Recoded from
disability and
dis_sense
through
dis_other where
each student is
represented
only once)
[If answered "yes"]
Which of the following
has been diagnosed?
(Select all that apply.)
Which of the following
best describes where
you are living while
attending college?
living
Are you a student-
athlete on a team
sponsored by your
institution’s athletics
department?
athlete
Are you a current or
former member of the
U.S. Armed Forces,
Reserves, or National
Guard?
veteran
Have you been
diagnosed with any
disability or
impairment?
disability
NSSE 2016 MAJOR FIELD REPORT, PART I • 54

First-Year Students
Item wording
or description
Variable
name Response options Count % Count % Count % Count % Count % Count % Count % Count % Count % Count %
Health
Professions
Arts and
Humanities
Natural-Math
Science Social Sciences Education Engineering
Interdisc.
Studies Nursing
Ag and Human
Ecology Business
NSSE 2016 Major Field Report, Part I: Within-Institution ComparisonsRespondent Profiled by Related-Major Group
Tennessee Technological University
38. Heterosexual -- -- -- -- -- -- -- -- -- --
Gay -- -- -- -- -- -- -- -- -- --
Lesbian -- -- -- -- -- -- -- -- -- --
Bisexual -- -- -- -- -- -- -- -- -- --
Another sexual orientation -- -- -- -- -- -- -- -- -- --
Questioning or unsure -- -- -- -- -- -- -- -- -- --
I prefer not to respond -- -- -- -- -- -- -- -- -- --
Total -- -- -- -- -- -- -- -- -- --
Female 22 73 24 80 23 30 21 88 19 59
Male 8 27 6 20 54 70 3 13 13 41
Total 30 100 30 100 77 100 24 100 32 100
American Indian or Alaska Native 0 0 0 0 0 0 0 0 0 0
Asian 1 3 0 0 1 1 0 0 2 6
Black or African American 0 0 2 7 1 1 0 0 3 9
Hispanic or Latino 0 0 0 0 0 0 0 0 0 0
Native Hawaiian/Other Pac. Islander 0 0 0 0 0 0 0 0 0 0
White 28 93 27 90 67 87 21 88 25 78
Other 0 0 0 0 0 0 0 0 0 0
Foreign or nonresident alien 0 0 0 0 0 0 0 0 0 0
Two or more races/ethnicities 1 3 1 3 7 9 2 8 2 6
Unknown 0 0 0 0 1 1 1 4 0 0
Total 30 100 30 100 77 100 24 100 32 100
Freshman/First-Year 30 100 30 100 77 100 24 100 32 100
Sophomore 0 0 0 0 0 0 0 0 0 0
Junior 0 0 0 0 0 0 0 0 0 0
Senior 0 0 0 0 0 0 0 0 0 0
Other 0 0 0 0 0 0 0 0 0 0
Total 30 100 30 100 77 100 24 100 32 100
No 3 10 5 17 6 8 1 4 8 25
Yes 27 90 25 83 71 92 23 96 24 75
Total 30 100 30 100 77 100 24 100 32 100
Not full-time 0 0 1 3 1 1 0 0 0 0
Full-time 30 100 29 97 76 99 24 100 32 100
Total 30 100 30 100 77 100 24 100 32 100
Institution-reported
enrollment status
IRenrollment
Institution-reported sex IRsex
Institution-reported
race or ethnicity
IRrace
Institution-reported
class level
IRclass
Institution-reported information (Variables provided by your institution in your NSSE population file.)
Institution-reported
first-time first-year
(FTFY) status
IRftfy
Which of the following
best describes your
sexual orientation?
(Question
administered per
institution request)
sexorient14
NSSE 2016 MAJOR FIELD REPORT, PART I • 55

Seniors
Item wording
or description
Variable
name Response options Count % Count % Count % Count % Count % Count % Count % Count % Count % Count %
20a. One 46 84 20 91 74 93 86 91 35 92 40 83
More than one 9 16 2 9 6 8 9 9 3 8 8 17
Total 55 100 22 100 80 100 95 100 38 100 48 100
Arts & Humanities 0 0 0 0 4 5 0 0 0 0 0 0
Biological Sci., Agriculture,
& Natural Resources38 69 0 0 0 0 0 0 6 16 0 0
Physical Sci., Mathematics,
& Computer Science17 31 0 0 0 0 9 9 0 0 0 0
Social Sciences 0 0 22 100 0 0 0 0 0 0 3 6
Business 0 0 0 0 0 0 0 0 0 0 45 94
Communications, Media,
& Public Relations0 0 0 0 0 0 0 0 0 0 0 0
Education 0 0 0 0 67 84 0 0 0 0 0 0
Engineering 0 0 0 0 0 0 81 85 0 0 0 0
Health Professions 0 0 0 0 8 10 0 0 0 0 0 0
Social Service Professions 0 0 0 0 0 0 0 0 0 0 0 0
All Other 0 0 0 0 1 1 5 5 32 84 0 0
Undecided, Undeclared 0 0 0 0 0 0 0 0 0 0 0 0
Total 55 100 22 100 80 100 95 100 38 100 48 100
Arts & Humanities 0 0 0 0 0 0 3 38 0 0 0 0
Biological Sci., Agriculture,
& Natural Resources5 56 0 0 0 0 0 0 0 0 0 0
Physical Sci., Mathematics,
& Computer Science2 22 0 0 1 17 0 0 0 0 0 0
Social Sciences 0 0 0 0 0 0 0 0 1 33 1 13
Business 0 0 1 50 0 0 2 25 1 33 5 63
Communications, Media,
& Public Relations0 0 0 0 0 0 0 0 0 0 0 0
Education 1 11 0 0 3 50 0 0 0 0 0 0
Engineering 1 11 0 0 0 0 3 38 0 0 0 0
Health Professions 0 0 0 0 2 33 0 0 1 33 1 13
Social Service Professions 0 0 1 50 0 0 0 0 0 0 0 0
All Other 0 0 0 0 0 0 0 0 0 0 0 0
Undecided, Undeclared 0 0 0 0 0 0 0 0 0 0 1 13
Total 9 100 2 100 6 100 8 100 3 100 8 100
NSSE 2016 Major Field Report, Part I: Within-Institution ComparisonsRespondent Profiled by Related-Major Group
Arts and
Humanities
Natural-Math
Science Social Sciences Education Engineering
Interdisc.
Studies Nursing
Ag and Human
Ecology Business
Health
Professions
Tennessee Technological University
How many majors do
you plan to complete?
(Do not count minors.)
MAJnum
First major or expected
first major, in NSSE's
default related-major
categories.
(Does not reflect any
customization made
for the Major Field
Report)
MAJfirstcol
(Recoded from
MAJfirst.)
Second major or
expected second major,
in NSSE's default
related-major
categories.
(Does not reflect any
customization made
for the Major Field
Report)
MAJsecondcol
(Recoded from
MAJsecond.)
NSSE 2016 MAJOR FIELD REPORT, PART I • 56

Seniors
Item wording
or description
Variable
name Response options Count % Count % Count % Count % Count % Count % Count % Count % Count % Count %
NSSE 2016 Major Field Report, Part I: Within-Institution ComparisonsRespondent Profiled by Related-Major Group
Arts and
Humanities
Natural-Math
Science Social Sciences Education Engineering
Interdisc.
Studies Nursing
Ag and Human
Ecology Business
Health
Professions
Tennessee Technological University
21. Freshman/First-year 0 0 0 0 0 0 0 0 0 0 0 0
Sophomore 0 0 0 0 1 1 0 0 0 0 1 2
Junior 1 2 0 0 7 9 4 4 1 3 2 4
Senior 49 89 22 100 69 87 87 92 35 92 38 83
Unclassified 5 9 0 0 2 3 4 4 2 5 5 11
Total 55 100 22 100 79 100 95 100 38 100 46 100
22. No 7 13 4 18 2 3 13 14 10 27 11 24
Yes 48 87 18 82 77 97 79 86 27 73 34 76
Total 55 100 22 100 79 100 92 100 37 100 45 100
23a. 0 1 2 0 0 1 1 3 3 7 18 3 7
1 1 2 1 5 1 1 4 4 2 5 1 2
2 1 2 1 5 25 31 3 3 7 18 5 11
3 4 7 2 9 14 18 9 10 0 0 5 11
4 17 31 3 14 16 20 23 25 13 34 15 33
5 18 33 7 32 8 10 23 25 4 11 10 22
6 10 18 2 9 3 4 16 17 3 8 5 11
7 or more 3 5 6 27 12 15 12 13 2 5 2 4
Total 55 100 22 100 80 100 93 100 38 100 46 100
b. 0 41 75 17 77 64 80 82 88 24 63 26 57
1 11 20 4 18 11 14 9 10 10 26 11 24
2 2 4 0 0 2 3 1 1 1 3 8 17
3 1 2 1 5 0 0 0 0 0 0 1 2
4 0 0 0 0 3 4 0 0 1 3 0 0
5 0 0 0 0 0 0 0 0 1 3 0 0
6 0 0 0 0 0 0 0 0 1 3 0 0
7 or more 0 0 0 0 0 0 1 1 0 0 0 0
Total 55 100 22 100 80 100 93 100 38 100 46 100
No courses taken online 41 75 17 77 64 80 82 88 24 63 26 57
Some courses taken online 14 25 5 23 13 16 9 10 9 24 15 33
All courses taken online 0 0 0 0 3 4 2 2 5 13 5 11
Total 55 100 22 100 80 100 93 100 38 100 46 100
Collapsed recode of
courses taken online
(Based on responses to
coursenum and
onlinenum)
onlinecrscol
What is your class
level?
class
Thinking about this
current academic term,
are you a full-time
student?
fulltime
How many courses are
you taking for credit
this current academic
term?
coursenum
Of these, how many are
entirely online ?
onlinenum
NSSE 2016 MAJOR FIELD REPORT, PART I • 57

Seniors
Item wording
or description
Variable
name Response options Count % Count % Count % Count % Count % Count % Count % Count % Count % Count %
NSSE 2016 Major Field Report, Part I: Within-Institution ComparisonsRespondent Profiled by Related-Major Group
Arts and
Humanities
Natural-Math
Science Social Sciences Education Engineering
Interdisc.
Studies Nursing
Ag and Human
Ecology Business
Health
Professions
Tennessee Technological University
24. C- or lower 1 2 0 0 1 1 2 2 0 0 0 0
C 2 4 0 0 0 0 6 6 1 3 1 2
C+ 2 4 1 5 0 0 4 4 2 5 4 9
B- 2 4 3 14 0 0 7 8 2 5 6 13
B 13 24 2 9 6 8 25 27 3 8 11 24
B+ 6 11 3 14 7 9 7 8 5 13 8 17
A- 8 15 4 18 17 21 17 18 7 18 5 11
A 21 38 9 41 49 61 25 27 18 47 11 24
Total 55 100 22 100 80 100 93 100 38 100 46 100
25. Started here 39 71 14 64 45 56 61 66 18 47 25 54
Started elsewhere 16 29 8 36 35 44 32 34 20 53 21 46
Total 55 100 22 100 80 100 93 100 38 100 46 100
26. attend_voc Vocational or technical school 0 0 0 0 3 4 4 4 4 11 3 7
attend_com Community or junior college 17 31 9 41 42 53 32 34 21 55 16 35
attend_col 4-year college or university
other than this one13 24 5 23 18 23 17 18 9 24 13 28
attend_none None 28 52 11 50 33 41 47 51 12 32 18 39
attend_other Other 1 2 0 0 1 1 3 3 1 3 1 2
27. Some college but less than a
bachelor's0 0 0 0 3 4 3 3 2 5 4 9
Bachelor's degree 10 18 3 14 17 22 34 37 10 26 22 48
Master's degree 20 36 14 64 41 52 42 46 20 53 18 39
Doctoral or professional degree 25 45 5 23 18 23 13 14 6 16 2 4
Total 55 100 22 100 79 100 92 100 38 100 46 100
What have most of your
grades been up to now
at this institution?
grades
Did you begin college
at this institution or
elsewhere?
begincol
Since graduating from
high school, which of
the following types of
schools have you
attended other than the
one you are now
attending? (Select all
that apply.)
What is the highest
level of education you
ever expect to
complete?
edaspire
NSSE 2016 MAJOR FIELD REPORT, PART I • 58

Seniors
Item wording
or description
Variable
name Response options Count % Count % Count % Count % Count % Count % Count % Count % Count % Count %
NSSE 2016 Major Field Report, Part I: Within-Institution ComparisonsRespondent Profiled by Related-Major Group
Arts and
Humanities
Natural-Math
Science Social Sciences Education Engineering
Interdisc.
Studies Nursing
Ag and Human
Ecology Business
Health
Professions
Tennessee Technological University
28. Did not finish high school 0 0 2 9 3 4 4 4 4 11 3 7
High school diploma or G.E.D. 8 15 5 23 21 26 20 22 13 34 9 20
Attended college, but did not
complete degree10 18 4 18 11 14 5 5 3 8 4 9
Associate's degree (A.A., A.S., etc.) 8 15 5 23 6 8 4 4 1 3 4 9
Bachelor’s degree (B.A., B.S., etc.) 13 24 2 9 19 24 28 30 7 18 21 46
Master’s degree (M.A., M.S., etc.) 11 20 3 14 17 21 24 26 7 18 4 9
Doctoral or professional degree
(Ph.D., J.D., M.D., etc.)5 9 1 5 3 4 8 9 3 8 1 2
Total 55 100 22 100 80 100 93 100 38 100 46 100
No 29 53 6 27 39 49 60 65 17 45 26 57
Yes 26 47 16 73 41 51 33 35 21 55 20 43
Total 55 100 22 100 80 100 93 100 38 100 46 100
29. Man 17 31 5 23 17 22 70 75 11 29 21 47
Woman 38 69 17 77 60 76 21 23 27 71 24 53
Another gender identity 0 0 0 0 0 0 2 2 0 0 0 0
I prefer not to respond 0 0 0 0 2 3 0 0 0 0 0 0
Total 55 100 22 100 79 100 93 100 38 100 45 100
30. 19 or younger 0 0 1 5 0 0 0 0 0 0 0 0
20-23 47 85 17 77 56 70 68 73 15 39 30 67
24-29 7 13 3 14 10 13 15 16 7 18 6 13
30-39 1 2 0 0 11 14 7 8 8 21 4 9
40-55 0 0 1 5 2 3 1 1 5 13 4 9
Over 55 0 0 0 0 1 1 2 2 3 8 1 2
Total 55 100 22 100 80 100 93 100 38 100 45 100
What is your gender
identity?
genderid
First-generation status
(No parent holds a
bachelor's degree)
firstgen
(Recoded from
parented)
What is the highest
level of education
completed by either of
your parents (or those
who raised you)?
parented
Enter your year of birth
(e.g., 1994):
agecat
(Recoded
from the
information
entered in
birthyear)
NSSE 2016 MAJOR FIELD REPORT, PART I • 59

Seniors
Item wording
or description
Variable
name Response options Count % Count % Count % Count % Count % Count % Count % Count % Count % Count %
NSSE 2016 Major Field Report, Part I: Within-Institution ComparisonsRespondent Profiled by Related-Major Group
Arts and
Humanities
Natural-Math
Science Social Sciences Education Engineering
Interdisc.
Studies Nursing
Ag and Human
Ecology Business
Health
Professions
Tennessee Technological University
31a. No 52 98 21 100 80 100 86 92 37 100 41 95
Yes 1 2 0 0 0 0 7 8 0 0 2 5
Total 53 100 21 100 80 100 93 100 37 100 43 100
Africa Sub-Saharan 0 0 0 0 0 0 0 0 0 0 0 0
Asia 0 0 0 0 0 0 0 0 0 0 1 50
Canada 0 0 0 0 0 0 0 0 0 0 0 0
Europe 0 0 0 0 0 0 0 0 0 0 0 0
Latin America and Caribbean 1 100 0 0 0 0 1 14 0 0 1 50
Middle East and North Africa 0 0 0 0 0 0 6 86 0 0 0 0
Oceania 0 0 0 0 0 0 0 0 0 0 0 0
Unknown region/uncoded 0 0 0 0 0 0 0 0 0 0 0 0
Total 1 100 0 0 0 0 7 100 0 0 2 100
32. re_amind American Indian or Alaska Native 1 2 0 0 0 0 1 1 1 3 1 2
re_asian Asian 4 7 0 0 2 3 5 5 0 0 2 4
re_black Black or African American 1 2 0 0 0 0 3 3 1 3 0 0
re_latino Hispanic or Latino 0 0 0 0 0 0 1 1 2 5 2 4
re_pacific Native Hawaiian/Other Pac. Islander 0 0 0 0 1 1 0 0 0 0 0 0
re_white White 50 93 22 100 78 98 81 87 35 92 39 87
re_other Other 0 0 0 0 0 0 3 3 0 0 1 2
re_pnr I prefer not to respond 0 0 0 0 1 1 2 2 1 3 1 2
American Indian or Alaska Native 0 0 0 0 0 0 0 0 0 0 0 0
Asian 2 4 0 0 1 1 5 5 0 0 2 4
Black or African American 1 2 0 0 0 0 2 2 1 3 0 0
Hispanic or Latino 0 0 0 0 0 0 1 1 1 3 2 4
Native Hawaiian/Other Pac. Islander 0 0 0 0 0 0 0 0 0 0 0 0
White 49 91 22 100 76 95 79 85 33 87 38 84
Other 0 0 0 0 0 0 2 2 0 0 1 2
Multiracial 2 4 0 0 2 3 2 2 2 5 1 2
I prefer not to respond 0 0 0 0 1 1 2 2 1 3 1 2
Total 54 100 22 100 80 100 93 100 38 100 45 100
33. No 48 87 19 86 72 90 85 92 31 84 38 84
Yes 7 13 3 14 8 10 7 8 6 16 7 16
Total 55 100 22 100 80 100 92 100 37 100 45 100
Are you an
international student?
internat
What is your racial or
ethnic identification?
(Select all that apply.)
Racial or ethnic
identification
re_all
(Recoded from
re_amind
through
re_pnr
where each
student is
represented
only once)
Are you a member of a
social fraternity or
sorority?
greek
International student
country of citizenship,
collapsed into regions
by NSSE. Responses to
country are in the data
file. U.S. (domestic)
students did not receive
this question.
countrycol
(Recoded from
country.)
NSSE 2016 MAJOR FIELD REPORT, PART I • 60

Seniors
Item wording
or description
Variable
name Response options Count % Count % Count % Count % Count % Count % Count % Count % Count % Count %
NSSE 2016 Major Field Report, Part I: Within-Institution ComparisonsRespondent Profiled by Related-Major Group
Arts and
Humanities
Natural-Math
Science Social Sciences Education Engineering
Interdisc.
Studies Nursing
Ag and Human
Ecology Business
Health
Professions
Tennessee Technological University
34. Dormitory or other campus housing
(not fraternity or sorority house)7 13 2 9 4 5 13 14 3 8 1 2
Fraternity or sorority house 0 0 0 0 0 0 1 1 0 0 3 7
Residence, within walking dist. 20 36 7 32 14 18 31 33 5 13 10 23
Residence, farther than
walking dist.27 49 12 55 57 71 47 51 28 74 29 66
None of the above 1 2 1 5 5 6 1 1 2 5 1 2
Total 55 100 22 100 80 100 93 100 38 100 44 100
35. No 52 96 19 100 77 97 90 97 35 92 42 95
Yes 2 4 0 0 2 3 3 3 3 8 2 5
Total 54 100 19 100 79 100 93 100 38 100 44 100
36. No 55 100 21 95 76 96 85 93 36 95 41 93
Yes 0 0 1 5 3 4 6 7 2 5 3 7
Total 55 100 22 100 79 100 91 100 38 100 44 100
37a. No 48 89 19 86 73 91 82 88 32 84 37 84
Yes 4 7 2 9 6 8 8 9 4 11 6 14
I prefer not to respond 2 4 1 5 1 1 3 3 2 5 1 2
Total 54 100 22 100 80 100 93 100 38 100 44 100
b. dis_sense A sensory impairment 1 25 0 0 1 17 0 0 0 0 0 0
dis_mobility A mobility impairment 1 25 0 0 1 17 0 0 0 0 0 0
dis_learning A learning disability 0 0 1 50 1 17 3 38 1 25 3 50
dis_mental A mental health disorder 1 25 0 0 1 17 5 63 1 25 2 33
dis_other A disability not listed 1 25 1 50 2 33 2 25 2 50 1 17
A sensory impairment 1 2 0 0 1 1 0 0 0 0 0 0
A mobility impairment 1 2 0 0 1 1 0 0 0 0 0 0
A learning disability 0 0 1 5 1 1 2 2 1 3 3 7
A mental health disorder 1 2 0 0 1 1 3 3 1 3 2 5
A disability not listed 1 2 1 5 2 3 1 1 2 5 1 2
More than one disability 0 0 0 0 0 0 2 2 0 0 0 0
No disability or impairment 48 89 19 86 73 91 82 88 32 84 37 84
Prefer not to respond 2 4 1 5 1 1 3 3 2 5 1 2
Total 54 100 22 100 80 100 93 100 38 100 44 100
Which of the following
best describes where
you are living while
attending college?
living
Are you a student-
athlete on a team
sponsored by your
institution’s athletics
department?
athlete
Are you a current or
former member of the
U.S. Armed Forces,
Reserves, or National
Guard?
veteran
disability
[If answered "yes"]
Which of the following
has been diagnosed?
(Select all that apply.)
Disability or
impairment
disability_all
(Recoded from
disability and
dis_sense
through
dis_other where
each student is
represented
only once)
Have you been
diagnosed with any
disability or
impairment?
NSSE 2016 MAJOR FIELD REPORT, PART I • 61

Seniors
Item wording
or description
Variable
name Response options Count % Count % Count % Count % Count % Count % Count % Count % Count % Count %
NSSE 2016 Major Field Report, Part I: Within-Institution ComparisonsRespondent Profiled by Related-Major Group
Arts and
Humanities
Natural-Math
Science Social Sciences Education Engineering
Interdisc.
Studies Nursing
Ag and Human
Ecology Business
Health
Professions
Tennessee Technological University
38. Heterosexual -- -- -- -- -- -- -- -- -- -- -- --
Gay -- -- -- -- -- -- -- -- -- -- -- --
Lesbian -- -- -- -- -- -- -- -- -- -- -- --
Bisexual -- -- -- -- -- -- -- -- -- -- -- --
Another sexual orientation -- -- -- -- -- -- -- -- -- -- -- --
Questioning or unsure -- -- -- -- -- -- -- -- -- -- -- --
I prefer not to respond -- -- -- -- -- -- -- -- -- -- -- --
Total -- -- -- -- -- -- -- -- -- -- -- --
Female 38 69 17 77 62 78 22 23 27 71 26 54
Male 17 31 5 23 18 23 73 77 11 29 22 46
Total 55 100 22 100 80 100 95 100 38 100 48 100
American Indian or Alaska Native 0 0 0 0 0 0 0 0 0 0 0 0
Asian 2 4 0 0 1 1 4 4 0 0 2 4
Black or African American 1 2 0 0 0 0 2 2 1 3 0 0
Hispanic or Latino 0 0 0 0 0 0 0 0 0 0 0 0
Native Hawaiian/Other Pac. Islander 0 0 0 0 0 0 0 0 0 0 0 0
White 50 91 22 100 78 98 89 94 34 89 44 92
Other 0 0 0 0 0 0 0 0 0 0 0 0
Foreign or nonresident alien 0 0 0 0 0 0 0 0 0 0 0 0
Two or more races/ethnicities 2 4 0 0 1 1 0 0 1 3 0 0
Unknown 0 0 0 0 0 0 0 0 2 5 2 4
Total 55 100 22 100 80 100 95 100 38 100 48 100
Freshman/First-Year 0 0 0 0 0 0 0 0 0 0 0 0
Sophomore 0 0 0 0 0 0 0 0 0 0 0 0
Junior 0 0 0 0 0 0 0 0 0 0 0 0
Senior 55 100 22 100 80 100 95 100 38 100 48 100
Other 0 0 0 0 0 0 0 0 0 0 0 0
Total 55 100 22 100 80 100 95 100 38 100 48 100
No 55 100 22 100 80 100 95 100 38 100 48 100
Yes 0 0 0 0 0 0 0 0 0 0 0 0
Total 55 100 22 100 80 100 95 100 38 100 48 100
Not full-time 9 16 1 5 4 5 14 15 8 21 5 10
Full-time 46 84 21 95 76 95 81 85 30 79 43 90
Total 55 100 22 100 80 100 95 100 38 100 48 100
Institution-reported
first-time first-year
(FTFY) status
IRftfy
Institution-reported
enrollment status
IRenrollment
Institution-reported sex IRsex
Institution-reported
race or ethnicity
IRrace
Institution-reported
class level
IRclass
Institution-reported information (Variables provided by your institution in your NSSE population file.)
Which of the following
best describes your
sexual orientation?
(Question
administered per
institution request)
sexorient14
NSSE 2016 MAJOR FIELD REPORT, PART I • 62

Endnotes
a.
b.
c.
d.
e.
f.
NSSE 2016 Major Field Report, Part I: Within-Institution ComparisonsEndnotes
Tennessee Technological University
Items that make up the Engagement Indicators include the following two-letter prefixes: CL = Collaborative Learning, DD = Discussions with Diverse Others, ET = Effective
Teaching Practices, HO = Higher-Order Learning, LS = Learning Strategies, QI = Quality of Interactions, QR = Quantitative Reasoning, RI = Reflective & Integrative
Learning, SE = Supportive Environment, and SF = Student-Faculty Interaction.
These are the values used to calculate means. For the majority of items, these values match the codes in the data file and codebook. For items estimating number of papers and
hours per week, the values represent actual units using the midpoints of response option ranges and an estimate for unbounded options.
All results are unweighted. Major categories with fewer than 20 respondents in a given class are not reported (i.e., the column is blank). Engagement Indicators range from 0 to
60. For details on EI development and scores, visit nsse.indiana.edu/html/engagement_indicators.cfm
All results are unweighted. Major categories with fewer than 20 respondents in a given class are not reported (i.e., the column is blank). For High-Impact Practices, we report
the percentage of students who responded "Done or in progress," except for service-learning which is the percentage who responded that at least "Some" courses included a
community-based project. For details on HIP development and scores, visit nsse.indiana.edu/html/high_impact_practices.cfm
A measure of the amount individual scores deviate from the mean of all the scores in the distribution.
All results are unweighted. Major categories with fewer than 20 respondents in a given class are not reported (i.e., the column is blank).
NSSE 2016 MAJOR FIELD REPORT, PART I • 63