tennessee department of transportation help program and transportation … · ·...
TRANSCRIPT

TENNESSEE DEPARTMENT OF TRANSPORTATION HELP PROGRAM
AND TRANSPORTATION MANAGEMENT CENTERS
ANNUAL OPERATIONS REPORT
July 1, 2013 – June 30, 2014
Prepared by the
Tennessee Department of Transportation
Traffic Operations Division
Transportation Management Office
December, 2014

i
TDOT HELP MISSION STATEMENT
The mission of HELP is to minimize traffic congestion, promote the safe movement of people
and products, and improve the travel environment. We work in partnership with emergency
response agencies and other TDOT units as part of a highway incident management team. We
are committed to performing our duties in a professional manner.

ii
Transportation Management Centers (TMCs’)
Mission Statement
It is the mission of Smartway to proactively monitor the highways to maximize traffic flow and inform
area travelers of abnormal conditions. This mission is accomplished using the field devices, software,
and Smartway partners to gather and disseminate real-time traveler information.
iii
Table of Contents
Section Page
1 Introduction 1
2 Roles and Responsibilities of Tennessee’s Transportation Management
Centers
5
3 Roles and Responsibilities of the HELP Patrol 9
4 Statewide Resources and Output 19
5 HELP Comments Cards Data/Stakeholder Comments 29
6 Costs, Benefits, and Funding Sources 37
Appendix A Tennessee “Move It” Brochure 40
Appendix B HELP Program Comment Card 41
Appendix C Tennessee Incident Management Coordinators Contact
Information
42
Appendix D Office of Transportation Management Contact Information 43

iv
List of Exhibits
Exhibit Page
1 TDOT Regional and District Boundaries 1
2 Statewide Quarterly Report (October-December, 2012) 3
3 Tennessee HELP Routes (Statewide) 9
4 HELP Operator, Truck, and Equipment, Nashville, TN 17
5 HELP Supervisor Truck, Regions II and IV 18
6 Unattended Vehicle Notice 20
7 Statewide Resources and Output 20
8 HELP Stops by Region 22
9 Services Provided (in Order of Statewide Frequency 23
10 Types of Incidents 24
11 Average Incident Clearance Times 25
12 Roadway Clearance Time 25
13 Types of Vehicles Assisted 26
14 Origin of Registration (Based on License Plate) 27
15 How Incident Discovered by HELP 28
16 Comment Cards Received from Each Region as Percent of Total 29
17 Response to “For What Reason Did You Need Assistance?” 30
18 Response to “Where Was Your Vehicle When the HELP Unit Arrived?” 31
19 Response to “Did the HELP Operator Assist You in a Courteous Manner?” 32
20 Response to “How Would You Rate the HELP Service?” 33
21 Excerpts from the HELP Comment Cards 35
22 HELP Truck Data and Personnel 37
23 Benefits of the HELP Program for Tennessee Taxpayers 39

1
SECTION 1
INTRODUCTION
The HELP program, which operates in Chattanooga, Knoxville, Memphis and Nashville, is a core component of
Tennessee Department of Transportation‘s (TDOT) SmartWay Program. The purpose of SmartWay is to reduce
traffic congestion, problems caused by congestion, and to improve operational efficiency, effectiveness, and safety
on Tennessee’s transportation system.
The SmartWay Program traffic cameras are operated from TDOT’s regional Transportation Management Centers
(TMC) located as follows:
Region I Region II Region III Region IV
Steve Borden, Director Ray Rucker, Director David Layhew, Director Chuck Rychen, Director
7345 Region Lane 7500 Volkswagen Drive 6601 Centennial Blvd. 5336 Boswell Ave.
Knoxville, TN 37914 Chattanooga, TN 37416 Nashville, TN 37243 Memphis, TN 38120
865-594-2403 423-892-3430 615-350-4300 901-935-0312
Just over eight years after the first Transportation Management Center opened in Nashville, TDOT’s fourth TMC
opened in Chattanooga on December 14, 2012. With continued expansion of the SmartWay Program, the system
now covers 342 centerline miles. There are statewide 418 urban and 57 rural cameras used to visually monitor
Tennessee’s roadways. In addition, they have access to 163 Dynamic Message Signs, 1205 radar detection systems
to spot traffic flow interruptions, 49 video cameras, and a city-wide highway advisory radio station broadcasting on
AM 1620. Each TMC has a Transportation Operations Manager position, along with a staff of TMC Operators,
TMC Supervisors and HELP Program Dispatchers. Currently, the TMC in Knoxville and Nashville operate on a
24/7 schedule. The Knoxville TMC monitors the Chattanooga service areas overnight starting after the second shift
ends, and Nashville monitors the Memphis service area during the same time frame.
TDOT’s first Transportation Management Center opened in Nashville June 12, 2003. TDOT’s fourth TMC opened in
Chattanooga on December 14, 2012. With continued expansion of the SmartWay Program the system now covers
393 centerline miles statewide . There are 418 urban and 59 rural cameras used to visually monitor Tennessee’s
roadways. In addition, there are 164 Dynamic Message Signs, 1,254 congestion monitoring devices, and 58 highway
advisory radio transmitters. Each TMC has a Transportation Operations Manager, along with a staff of TMC
Operators, TMC Supervisors and HELP Program Dispatchers. Currently, the TMC in Knoxville and Nashville
operate on a 24/7 schedule.
Exhibit 1: TDOT Regional and District Boundaries

2
The HELP Program is a component of highway incident management in Tennessee and started its fifteenth year of
operation as of July, 2014. Recent improvements in highway incident management in our state are due in large part
to the work of local and state law enforcement agencies, fire services, rescue squads, emergency medical services,
emergency communication centers, emergency management agencies, towing and recovery companies, news media,
transportation planning organizations, and other agencies and organizations with responsibilities for highway
response, planning, and operations.
This annual report describes the operations of TDOT’s HELP Program summarizing the work accompanied by the
HELP personnel during the past fiscal year beginning July 1, 2013 and ending June 30, 2014. TDOT is very proud
of these accomplishments; however, as noted in the mission statement, HELP is part of an “incident management
team.” Other divisions within TDOT, along with other state and local agencies, also played critical roles in keeping
Tennessee’s roadways operating efficiently and safely.
We recognize and thank the individual police officers, troopers, fire fighters, Emergency Medical Technicians
(EMTs), rescue squad members, 911 operators, police and fire dispatchers, tow truck operators, traffic reporters,
transportation planners, and others who support the HELP program and assist the HELP personnel. As a result of the
combined efforts of these entities and to maintain compliance with the National Traffic Incident Management
Coalition (NTIMC) National Unified Goal (NUG) process, the Office of Transportation Management along with the
assistance of other divisions in TDOT embraces the development of an “Open Road Policy” rule that will emphasize
standard, consistent operations and cooperative efforts for the safe, quick removal of highway crashes and spilled
cargo from Tennessee’s interstates within ninety (90) minutes.
The HELP Annual Report for FY 2013-14 depicts resources committed to the program, numbers and types of
services provided to motorists, customer evaluations, and the program costs, benefits, and funding sources.
TDOT’s statewide TMCs’ are in their fourth year utilizing a web based traffic incident locator, along with activity
and reporting capabilities. The system provides real-time location information and reporting of traffic incidents and
HELP Truck activity. The program system, Locate/IM, was integrated with the statewide TMCs for traffic incident
management control and roadway monitoring. Through Locate/IM database each regional system has the capability
to produce a quarterly report indicating total incidents, events affecting traffic, clearance time, type of service
provided by the HELP Operators in each region. The system allows for a statewide quarterly report to be generated
combining each region information. Presently, another ad hoc report is being generated to accumulate the data on an
annual basis.
These reports are downloaded to the TDOT, Office of Transportation Management web site at
http://www.tdot.state.tn.us/incident/default.htm. Locate/IM, created by Gannett Fleming, is an ongoing project
creating ad hoc reports and improving the system as recommended by TMC management and operators across the
state.
Exhibit 2 is the Statewide Quarterly Report for October – December 2013 (4th Quarter) which can be found on the
mentioned website along with the regional quarterly reports.

3
Exhibit 2: Statewide 2013 Quarter 4 Report

4
The database Locate/IM provides a collaborative environment by combining the existing TMC Operators and the
HELP Truck’s GPS/AVL application into a new integrated solution, allowing both entities to team together to
manage and record a highway incident. When an incident occurs in the regional service area, the web based
system locates the nearest HELP truck by the use of a GPS/AVL device installed in each HELP vehicle. The
TMC personnel communicate with the HELP Truck Operator and login pertinent information concerning the
incident into the Locate/IM database. The TMC personnel can monitor such incidents as well as incidents the
driver happens upon. The map will merge two types of data used in the TMC onto one seamless map display.
Locate/IM has eliminated all hand written documentations by the HELP Truck Operators; data entry functions
are done by the TMC staff only. Regional incident information is communicated to the TMC personnel via radio
communications with the HELP Truck Operators.
Exterior of the Transportation Management Centers

5
SECTION 2
ROLES AND RESPONSIBILITIES OF TENNESSEE’S
TRANSPORTATION MANAGEMENT CENTERS
Region I
On May 5, 2005, Region I open the second TMC and was the first center to go to a twenty-four daily operation
center. This schedule was due to the closure of I-40 during the Smartfix 40 Project. The success and importance
of having a transportation management center open twenty-four hours proved to be effective at monitoring traffic
and incidents on I-40 that it remained on the twenty-four schedule.
Currently, Region I is providing overnight monitoring for the service area in Region II. This process is done by
equipping a Region I TMC operator work station with a flat screen monitor and video tours of all cameras
changing approximately every five seconds. If an incident occurs a notification process has been put in place to
contact the necessary responders.
Region 1 Transportation Management Center (TMC), Knoxville, TN

6
Region II
On December 14, 2011, the Region II TMC opened. The TMC utilizes cutting edge technology to monitor traffic
trouble spots and keep drivers up to date on the latest roadway conditions.
From the TMC in Enterprise South Industrial Park, TDOT personnel can monitor 71 SmartWay traffic cameras
located along the area’s most heavily-traveled corridors. In addition, they have access to 16 Dynamic Message
Signs, 175 speed/congestion monitoring stations to spot traffic flow interruptions and a city-wide highway
advisory radio station broadcasting on AM 1620.
The system is specifically designed to keep Chattanooga motorists informed about road conditions by providing
up-to-the-minute traffic information to help drivers avoid problems on the road.
Region II Transportation Management Center (TMC), Chattanooga, TN

7
Region III
The Region III TMC was the first in the state, beginning operations in June 2003. What began as a few cameras
located at interstate interchanges around town has blossomed into a system of over 150 cameras, 59 DMS, and
over 350 speed detection devices. Plans are to further expand in the very near future so that we can help assist the
motoring public to safely reach their destinations.
The Region III TMC operates 24 hours a day, 7 days a week. To do this, we had to organize a solid staff of
Operators, Dispatchers, and Supervisors working together to sustain the standard of excellence on a 24/7 scale.
Currently, Region III is providing overnight monitoring for the service area in Region IV. This process is done by
equipping a Region IV TMC operator work station with a flat screen monitor and video tours of all cameras
changing approximately every five seconds. If an incident occurs a notification process has been put in place to
contact the necessary responders.
The HELP program is stretching its limits outside of the Metropolitan area to a large degree. Closures of
interstates well outside of the Nashville area have prompted THP and other agencies to request TDOT assistance.
Our HELP Operators respond all hours of the night when called upon to assist in the safe transportation of
motorists almost anywhere in the Region.
The Region III TMC works closely with the other Regions of Tennessee, plus with Kentucky transportation
officials on a regular basis in order to keep all informed of potential problem areas. The cooperation of these
various agencies makes for better service to the motorists we serve.
Region III Transportation Management Center (TMC), Nashville, TN
8
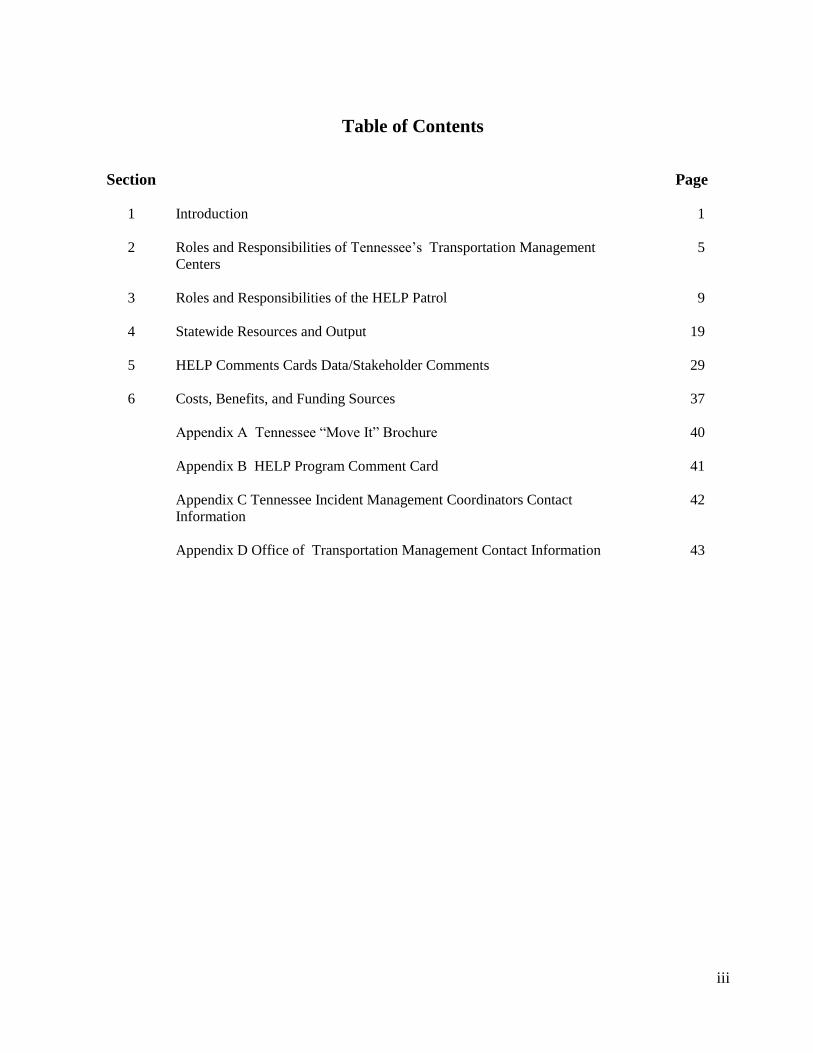
Region IV
The Region IV TMC sets in the Southwest corner of the state in the City of Memphis. Region IV TMC started
operations in October, 2008 and was the first TMC in the state to cross train its entire staff. All are trained and
certified dispatchers and can operate all the equipment in the TMC, giving flexibility for staffing during long term
incidents. The Region IV TMC and HELP staffs have been integrated and work as a team under the
Transportation Management Coordinator.
The location of the Region IV TMC makes it unique for several reasons. Region IV HELP Program operates
within a few miles of the Arkansas and Mississippi borders.
Arkansas has several miles of ITS infrastructure that is monitored by the Region IV TMC on a daily basis. The
TMC monitors these areas and relays incident information to the Arkansas State Police and State Highway Police
along with other local agencies. The TMC staff also dispatches HELP trucks to the area to offer assistance at
large events.
Region IV TMC may not have any ITS infrastructures setup in Mississippi but they have a great relationship with
Mississippi Department of Transportation and their TMC in Jackson, MS. The centers are in regular contact with
each other about incidents at the state line. Often each TMC posts messages on DMS boards to assist each other.
Region IV Transportation Management Center (TMC), Memphis, TN

9
SECTION 3
ROLES AND RESPONSIBILITIES OF THE HELP PATROL The HELP patrols operate on the most heavily traveled routes (peak hour service area) in the core of the state’s four
largest metropolitan areas (Chattanooga, Knoxville, Memphis, and Nashville) from early morning to late evening,
seven (7) days a week. The HELP service is provided with three shifts of operators, working supervisors, and
dispatchers. The operating hours are from 6:00 AM to 8:30 PM on Monday, 5:00 AM to 10:30 PM, Tuesday
through Friday, 8:30 AM to 8:30 PM on Saturday and 9:30 AM to 8:30 PM on Sunday. Regions I and III TMCs’
are providing 24/7 monitoring to their service areas along with after hour monitoring for Region II and Region IV.
In 2008, in preparation for the SmartFIX 40 project which closed I-40 through downtown Knoxville for 14
months and re-routed traffic onto I-640, the Knoxville TMC began operating 24 hours a day, seven (7) days a
week to ensure quick response to any incidents which might occur. By operating on this schedule, it allowed the
TMC to become a primary hub to receive and distribute incident information at all times. After the project was
completed, the benefits were realized and the TMC remained on this schedule to efficiently coordinate incident
information throughout the entire region.” Beginning in the spring of 2014 Region I began overnight monitoring
to Region II service area. The Nashville TMC began 24/7 operation in 2011: the TMC staff monitors the
interstate twenty four hours, seven days a week, along with monitoring the overnight shift for Region IV service
area. After the HELP trucks shifts end in Region III, the supervisor and HELP truck operators are “on call”
status until the shift starts back the following morning.
Exhibit 3: Tennessee HELP Routes (Statewide)
KNOXVILLE INTERSTATE CHATTANOOGA INTERSTATE
I-40 I-24
I-75 I-75
I-140 I-124
I-275
I-640 Total miles served during
HELP Route *peak hours 77.00 Total miles served during
HELP Route *peak hours 73.00
NASHVILLE INTERSTATE MEMPHIS INTERSTATE
I-24 I-40
Briley Pkwy SR-155
I-40 I-55
I-65 I-240
I-440 Total miles served during
HELP Route *peak hours 138.00 Total miles served during
HELP Route *peak hours 105.00 Peak hours are morning and afternoon hours where commuter traffic volumes are at their highest.

10
These close-in patrol routes (designated service areas), which are adjusted by the working supervisors in response
to prevailing conditions, allow prompt response to incidents that would otherwise cause widespread and
prolonged congestion, secondary crashes, and related problems. Although rural roads and secondary routes are
not part of the close-in patrol routes for the HELP program, the HELP units also respond to requests from local
law enforcement agencies and/or the Tennessee Highway Patrol (THP) to assist with crashes and other
emergencies outside of the normal patrol areas. The total number of miles serviced by the statewide HELP
Program during peak hours is 312.50 miles.
The Metropolitan Nashville Public Works Incident Response Program is another emergency assistance service for
the Nashville Metropolitan area that plays a role in the incident management arena of providing assistance to the
HELP Truck Operators and responding to incidents on non-freeway routes.
The clearance and response times for HELP assisted lane blockage incidents is approximately 95% statewide for
all incidents (major and minor) incidents cleared within ninety (90) minutes during July 1, 2013 to June 30, 2014
(Exhibit 12). HELP Operators are usually the first responders at the scene of a major or minor incident. Without
the assistance of the HELP Operator, such incidents could often impose potential danger to the public, as well as
other emergency operators. In Tennessee, the HELP Supervisors and Operators also work closely with local
towing and recovery companies to ensure the safety of the public, which is their first priority, and to implement
quick clearance of the roadways.
According to the Tennessee Highway Patrol (THP) on October 23, 2013 at approximately 2:00 pm, a passenger
bus was traveling eastbound on I-40 near mile marker 423 when its left front tire blew out. The driver lost control
and the bus crossed the median and crashed into a tractor trailer and clipped a Tahoe SUV that was heading
westbound. Reports indicate the tractor trailer immediately caught fire and the bus overturned. Within five
minutes, the first emergency crews from Jefferson County arrived, and began helping the victims while sending
out the call for more help.
An EMS official stated that 20 ambulances and five helicopters responded from multiple counties, including
Knox, Sevier, Jefferson, Hamblen, and Grainger Counties. The THP was the lead investigating agency on the
scene. Their Critical Incident Response Team (CIRT) has special training and equipment to respond to and
reconstruct fatal accidents.
I-40 Jefferson County Bus Crosses the Median and Crashes with Transport Truck

11
Implementation of New Programs in TDOT’s Traffic Operations Division
Yellow DOT Program
TDOT has been authorized by the state’s General Assembly through bill number 2296 to implement a statewide
program designed to provide crucial medical information to emergency responders in the event of a vehicle
incident. The national program is known as the “Yellow DOT “Program. Immediately following a car crash, first
responders have what is known as “the golden hour”, which is the time when medical care can mean the
difference between “life” and “death”.
All too often, victims cannot communicate important information. If they see a yellow decal on the left rear
window on the driver’s side that will be an indication that a photo and medical information is in the glove
compartment, hopefully of the driver and possible passenger. The intent of this program is to allow first
responders the accessibility to important personal information when they arrive on the scene of an incident,
regardless of the individual’s condition. They can use the “Golden Hour” to begin assisting the injured condition,
instead of trying to acquire medical information from the injured or someone else. The Tennessee Yellow DOT
Program has distributed over 50,000 packets statewide to AARP chapters, AAA offices, Senior Centers, Church
Groups, Local Law Enforcement Agencies, EMS/EMA Offices, Health Care Centers and other groups.
Tennessee has over 100 enrollment sites in over fifty (50) counties.
Protect The Queue
In June of 2013, the Protect the Queue Program was created. The start of this program was due to a multiple
vehicle crash on I-24 Eastbound just south of the Exit 80 (SR 99) Interchange. Traffic had been heavy along the I-
24 corridor south of Nashville for the last several hours due to the upcoming start of the annual Bonnaroo Music
Festival in Manchester. Prior to this accident, a non-injury incident had caused a line of slow moving traffic to
develop on this section of the Interstate. A tractor trailer collided with the back of this line of traffic. Two vehicles
became trapped underneath the trailer and caught on fire. Responders were able to save two people in one car, but
two other persons perished in their vehicle.
This program stresses to all TDOT employees and partnering agencies the importance of protecting drivers caught
in a traffic queue. A training program on the most effective queue management techniques was launched. Since
the start of TDOT's Protect the Queue campaign, data gathered from July 2013 through December 2013 shows a
19% reduction in secondary incidents over the same period in 2012. This equates to 20 fewer secondary
incidents, and could represent four lives saved. This information was retrieved from the Tennessee’s Integrated
Traffic Analysis Network, (TITAN), created by the Tennessee Highway Patrol. This tragedy was a turning point
for the Tennessee Department of Transportation. Crashes like this, known as secondary crashes, account for 18%
of all fatalities on freeways nationally. As much as 25% of all traffic incidents are secondary crashes, and up to
20% of those involve serious injuries or fatalities.
This movement stresses to all TDOT employees and partnering agencies the importance of protecting drivers
caught in a traffic queue (defined as a line of slow moving traffic). Since the start of the Protect the Queue
campaign, TDOT’s Incident Management Team and Regional Operations staff have risen to the challenge.
Specially outfitted trucks are being deployed at the notice of the formation of non-reoccurring traffic queues.
These “queue trucks” are positioned to provide and maintain advance warning for approaching traffic. A Standard
Operating Guideline has been developed to establish standard practices for queue protection. Queues resulting
from construction related lane closures are being addressed with the Protect the Queue Construction Special
Provision, which establishes specific contractor requirements for providing protection at the end of a queue.
Additionally, special Protect the Queue reference cards have been distributed to all TDOT staff. Employees are
directed to alert TMCs of nonrecurring traffic queues witnessed during their daily commute or personal travels.
Year to date data recorded in the Tennessee Department of Safety’s crash database indicates a 24% reduction of
all secondary incidents when compared to earlier figures 2013. This paper details all the efforts associated with
the Protect the Queue Campaign and the standard practices that have grown as a positive byproduct. It is our hope
that the success in Tennessee can be duplicated on a national level as a best practice. This information was

12
retrieved from the Tennessee’s Integrated Traffic Analysis Network, (TITAN), created by the Tennessee Highway
Patrol.
Traffic Incident Management Training Track
TDOT has secured funds for the building of a Traffic Incident Management training site. This training site will
be built at 283 Stewarts Ferry Pike, Nashville, TN 37214, which is located adjacent to the Tennessee Department
of Safety and Homeland Security Training Center (TDOSHS). The property is located is leased through an
interagency agreement from the Department of Intellectual and Developmental Disabilities (DIDD). The scope of
the subject document is to form a three party interagency agreement between TDOT, TDOSHS, and DIDD. The
following is an explanation of the responsibilities of each agency:
TDOT: The Tennessee Department of Transportation will design, let to contract, and fund construction of
the Traffic Incident Management Training Site at 283 Stewarts Ferry Pike.
TDOSHS: The Tennessee Department of Safety and Homeland Security will be responsible for the
management and maintenance of the Traffic Incident Management Training Site.
DIDD: The Department of Intellectual and Developmental Disabilities, being the owner of the property,
shall grant access for TDOT, or representing agents, for the purpose of constructing the Traffic
Incident Management training site.
The Traffic Incident Management training site will feature sections of simulated roadway that will provide a real-
world training environment for all emergency response professionals from law enforcement, Fire Service, EMS,
Emergency Management Agencies, TDOT and towing/recovery and HAZ-MAT companies. The site will include
the following design features:
• Approximately 1500 ft of simulated roadway with multiple lane transitions, cross-section changes, and
points of curvature.
• Connector access to facilitate the circulation of traffic flow during training.
• A full four leg intersection.
Proposed Location for the Traffic Incident Management Training Track, Nashville, TN

13
Region III HELP; Providing Traffic Assistance on I-40 in Nashville, TN
In February 2012, TDOT, Tennessee Department of Safety, and Homeland Security (TDOSHS), and the
Tennessee Highway Patrol (THP) jointly prepared and signed an interagency memorandum of understanding to
provide guidance to personnel of each department relative to incidents on Tennessee highways, including crashes
and spilled cargo to ensure public safety, promote safe and orderly flow of traffic, protect the safety of emergency
responders, and restore the roadway to full capacity as soon as possible following an incident. Since the signing
of the inter-agency memorandum of understanding TDOT has prepared an agreement for local law enforcement
offices to recognize and cooperate by the quick clearance rule established by Federal Highway Administration
(FHWA). A new initiative in the program is to enter into memorandums of understanding with local agencies to
ensure efficiency in accordance with the national 3Cs’cooperation, coordination and communication.
During FY 2013-14, TDOT entered into memorandums of understanding with the following local cities/counties:
Region 1 Region 2 Region 3 Region 4
City of Knoxville Cheatham County Carroll County
Union County Dickson County Crockett County
Washington County Giles County Madison County
Johnson City Police Dept Humphreys County Hardin County
Johnson County Marshall County
Metro-Nashville-
Davidson County
Montgomery County
Smith County
Robertson County
Trousdale County
Wilson County
City of Murfreesboro

14
The HELP operators and supervisors are specially trained and equipped for the many kinds of emergencies
encountered on Tennessee’s most heavily traveled roadways, from disabled vehicles to major crashes. All of the
operators and supervisors are certified emergency medical “First Responders” and have recertification training
throughout the year. The HELP services are provided without charge to the motorist and the HELP operators do
not accept tips. The operators give a postage-paid "comment card" to each motorist receiving assistance to fill out
and mail the card as soon as possible after the incident. The FY 2013 – 2014 statewide rating for HELP
Operators being courteous and helpful to motorists on our roadways is 96.1%.
During FY 2013-2014, HELP Operators were called on to assist with special events across the State which
created exceptional demands on the transportation system. Region I provided HELP Truck Patrols on I-40 in
Jefferson County during Thanksgiving holiday weekend, 2013 and Memorial Holiday weekend, 2014, due to I-40
bridge repair project having I-40 reduced to one lane.
Other events provided by Region I HELP Patrol
During Bristol Sprint Cup Races, several HELP Trucks operated in Bristol during race weekend.
During the University of Tennessee Football season, August-November, 2013, the HELP Operators
provide assistance to motorists and traffic control for seven home games. Extended patrol hours to
accommodate event’s traffic.
Region I HELP Operators have worked with different elementary and high schools during school
functions by demonstrating the HELP Truck equipment and explaining Operators duties.
June, 2014, Region I worked in conjunction with THP during a weekend traffic safety enforcement
campaign to enforce the State Move Over Law

15
TIMS Training Class: On May 31, 2014, the Region I HELP Supervisors demonstrated to the
students how to hook to an overturned vehicle and turn it over and push it out of the roadway to
provide a quick clearance of lanes.
The Chattanooga HELP Unit annually works in conjunction with the THP, local law enforcement, and numerous
other agencies to manage traffic flow on I-24 to insure the safety of the motoring public during the mid-June
Bonnaroo Music Festival near Manchester, TN, and during this time the Chattanooga TMC annually provides
motorist information. Last fiscal year the Chattanooga HELP Unit assisted the Governor’s Highway Safety
Office (GHSO) with motorist driver safety check points.
Other events provided by Region II HELP Patrol
Region II annually help provide traffic control and the TMC helps provide motorists information for
the River Bend Festival in downtown Chattanooga.
Region II provided traffic control for the USA Cycling National Championship and the Chattanooga
TMC served as the command center for the road race point of the event.
Region II HELP Patrol assisted the Georgia State Patrol (GSP) with traffic control for the 150th
Anniversary Battle of Chickamauga re-enactment celebration.
Region II HELP Operators have worked with different elementary and high schools during school
functions by demonstrating the HELP Truck equipment and explaining Operator duties.

16
The Nashville HELP Program, which serves the largest geographical area during peak hours, participated in many
events throughout the fiscal year. June 2014, The Nashville HELP Patrol assisted the THP in escorting the “Wall
that Heals” (Tennessee Vietnam Vets Memorial Wall) from the TN/KY state line to the TN Bicenntennial Mall
State Park. The Middle Tennessee HELP Program annually works with Metro-Nashville Police Department with
traffic control for the Nashville Christmas Parade, CMA Festivals, and the Music City Marathon. This year the
Nashville Patrol assisted Region II with traffic control during annual BONNAROO festivities.
Other events provided by Region III HELP Patrol
Assisted THP and Smyrna Police Department with traffic controls for the Smyrna Air Show
Assisted THP with traffic control during DUI checkpoints in September and December, 2013
Participated in the training exercises with the THP statewide certification teams and other law
enforcement agencies at the Smyrna Airport
Nashville HELP Operators have worked with different elementary and high schools during school
functions by demonstrating the HELP Truck equipment and explaining Operators duties.
The Memphis HELP Unit peak hour service area is the smallest in miles as compared to the other regions, yet
their total fiscal year mileage always comes in second to the largest. Memphis HELP Program participates in
many special events; assists Region 2 by providing traffic control each year at the Bonaroo Festival in Region II.
The unit also visited several elementary and middle schools on career day informing the children on their job’s
responsibilities.

17
Exhibit 4 shows a HELP operator with his truck and a display of standard equipment available to assist the
operator and other incident responders. (When “in service,” the operators always wear their reflective vests.)
Exhibit 4: HELP Operator, Truck, and Equipment
Installed Equipment
Two-way radio w/repeater
CB radio
Emergency vehicle package
(lights, siren, etc.)
20-foot self-retracting air hose
Halogen work lights; spot light
Police radio (supervisors)
Public address system
Air compressor
3500 watt generator
Front-facing video camera (some
vehicles)
Portable Equipment and Tools
Tow straps and chains
Reflector zed traffic cones
Ball peen hammer, sledge
hammer, pry bar, hack saw
Battery booster pack
Push brooms, shovels
Portable traffic control signs
Roadway flares
Air impact wrench, portable air
hose, lug-lock removal tool
300-foot measuring tape
Camera
Fluorescent traffic control flags Portable air tank
Jacks, wheel chocks
25-foot jumper cables
Portable flood light
Traffic control paddles Leaf blower (some vehicles)
Sockets, wrenches, screw drivers Radiological monitoring device
Supplies
Gasoline and diesel fuel
Water
Assorted fuses, hose clamps, nuts,
bolts, clips
Marking paint
Area maps and phone directories
Motorist comment cards Fire extinguishers
Absorbent material
Electrical tape, duct tape,
mechanical wire
Medical
First aid/trauma kit Oxygen kit Eye wash kit
Blankets, flat cloth sheets Automated external defibrillator
Personal Protective Equipment (PPE)
Reflective vest Cell phone Flashlight
Hard hat

18
Exhibit 5 shows a HELP supervisor heavy-duty pickup trucks with much of the same equipment and the capacity
to transport passengers when necessary.
Exhibit 5: HELP Supervisor Trucks, Regions II and IV
The HELP Operators utilize a language interpreting service contracted by the State of Tennessee to more readily
assist motorists with limited English proficiency. The HELP operator uses a “Point to your Language” card to
ascertain the native language spoken by the motorist. The HELP Operator contacts the language interpreters
services via cellular telephone utilizing an “800” number and pin number. The HELP Operator speaks with a
company operator and states the type of language interpretation needed. The company operator serves as a
facilitator between the HELP Operator and the motorist. The language interpreting company (AVAZA) can also
provide onsite service, if needed. Although there has not been a large demand for this service, it is reassuring to
know when needed the Department has services in place to assist any stranded motorist on our urban roadways.
The Traffic Operations Division, Transportation Management Office produced and continues to distribute
throughout the state a brochure directed to motorists explaining Tennessee’s “Move It” law (TCA 55-10-117) as
shown in Appendix A. Moving a vehicle off the roadway in Tennessee is not only a law, but it helps clear crashes
quickly, reduces congestion, and improves safety conditions for all motorists and emergency responders.
Each TDOT Region is equipped with incident response trailers to be used as an onsite command post for long
term major highway incidents.

19
SECTION 4
STATEWIDE RESOURCES AND OUTPUT
The following pages provide a statistical review of HELP performances during FY 2013-14, recognizing the
numbers do not capture the full extent of the work performed by the HELP personnel. A “stop” can be as simple
as tagging an abandoned vehicle or changing a flat tire on the shoulder of the roadway without any complications.
However, the next stop may involve multiple vehicles, an overturned truck, spilled fuel or cargo, serious injuries,
or the need to make immediate decisions to close ramps, lanes, or even an entire freeway. Even during routine
stops the HELP operators must contend with traffic operating at high speeds, high levels of noise, exhaust fumes,
wind, and sometimes adverse weather, all of which make the job especially challenging and potentially
hazardous.
The Tennessee Department of Transportation contracted services with Gannett Fleming, who implemented an
internet database that is being used to update the data collection process for the HELP Program. The objective of
this project is to improve the effectiveness of the HELP Program by allowing the HELP Operator to concentrate
on assisting stranded motorists, and not be concerned with keeping up with hand written data sheets. The created
system (Locate/IM) also has the ability to create and retrieve real time data in a timely manner for reporting
purposes.
Another statewide resource is the Protect the Queue initiative to all TDOT employees and partnering agencies
the importance of protecting drivers caught in a traffic queue. Since the start of TDOT's Protect the Queue
campaign, data gathered from July 2013 through December 2013 shows a 19% reduction in secondary incidents
over the same period in 2012. This equates to 20 fewer secondary incidents, and could represent four lives saved.
Another service provided by HELP operators is inspecting and tagging abandoned vehicles on Tennessee’s
roadways. The tagging of vehicles is in accordance with the T.C.A. 56-16-103, which states a vehicle is
considered abandoned if it remains illegally on public property, and T.C.A. 55-16-111, which states the law
authorizes removal of illegally stopped or parked vehicles at the owner’s expense. (Exhibit 6)
Exhibit 7 describes the resources committed to the HELP program and the program output for FY July, 2013 –
June, 2014, along with definitions for key terms that are used throughout the report.
Underlying all of the numbers and the details about the HELP program are two priorities – safety and quick
clearance of incidents.

20
Exhibit 6: Unattended Vehicle Notice
Exhibit 7: Statewide Resources and Output
___________________________________________
1 Operating positions: Number of authorized positions for HELP operators and supervisors. 2 Trucks: Number of specially equipped HELP operator and supervisor vehicles available for patrols. 3 Route miles: Centerline mileage for routes that are patrolled by HELP trucks on a routine basis and during peak hours. Where routes
overlap for more frequent service (shorter headways) on a particular roadway segment, the mileage is counted only once. The actual route
miles patrolled vary from day-to-day and during each day in response to changing traffic conditions, weather, and the number of incidents
that require HELP trucks on-scene for extended periods.
4Vehicle miles driven: Difference between mileage at the beginning and end of the year for all of the specially equipped HELP trucks,
which includes miles driven for training purposes, moving vehicles to the site of special events, and other miles off the regular routes.
5 Stops recorded: Total number of patrol stops.
6 Miles driven per position: Regional Coordinators and Dispatchers are not included
Resources Output
Hwy Response Operators position 1
71
HELP trucks 2 72
Statewide urban area route miles 3 341.5
Statewide vehicle miles driven 4 2,936,408
Statewide stops recorded 5 90,180
Miles driven per position 6 41,358
Miles driven per operator shift 172
Miles driven per truck per year 40,783
Stops per authorized position per year 1,270
Stops per route mile 307
Number of Special Events 48
21
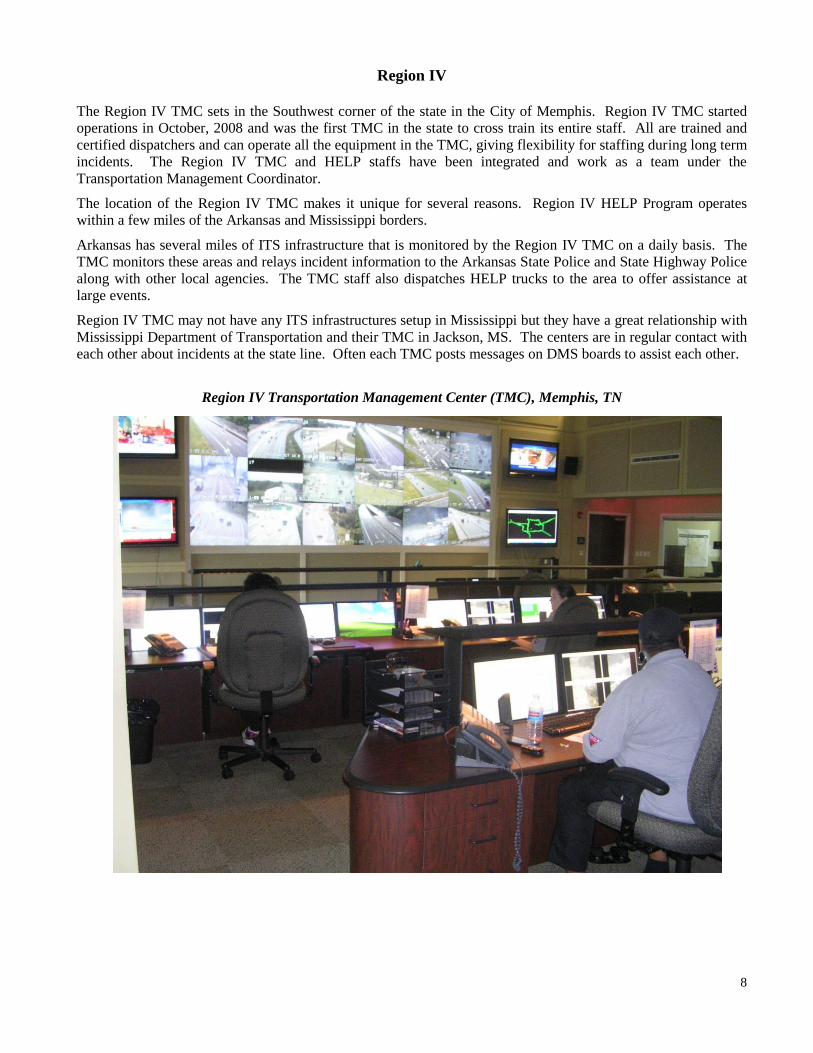
On June 16, 2014, at I-24 East at I-40 East Junction in Nashville a large metal spool hit the bridge and caused
debris at Exit 50E. Eastbound traffic was affected with the left lane being blocked. The traffic was diverted to an
alternate route. The westbound traffic was affected with no delays. The roadway time was within ninety (90)
minutes and all lanes were open.

22
The following charts and tables on pages 22 through 29 describe the reasons that HELP trucks stopped to provide
assistance, the type of assistance provided, characteristics of the vehicles assisted, circumstances at the scene, and
other aspects of HELP service during FY 2013-2014.
Exhibit 8
HELP Stops by Region
For
Fiscal Year 2013-2014
Region Calls % Of Total
Region 1 18549 20.6
Region 2 12672 14.1
Region 3 29889 33.1
Region 4 29070 32.2
Total: 90180 100

23
Exhibit 9
Services Provided
(In Order of Statewide Frequency)
For Fiscal Year 2013-2014
Statewide Region 1 Region 2 Region 3 Region 4
Number Percent Number Percent Number Percent Number Percent Number Percent
Blocked Ln/Traf Crtl 25126 19.7 2257 10 8405 33.8 12036 0.1 2428 6.9
No Service-occupied 12660 9.9 4608 20.5 956 3.8 4256 0.1 2840 8.1
Fuel 12185 9.6 2310 10.3 1710 6.9 3168 7.1 4997 14.2
Tag Abandoned 11387 8.9 2316 10.3 1578 6.3 5065 0.1 5012 14.3
Tire 10917 8.6 2114 9.4 1205 4.8 3177 7.1 4421 12.6
Comment Card 10389 8.2 0 0 586 2.4 6332 14.1 3471 9.9
Mechanical 8820 6.9 1935 8.6 945 3.8 1998 4.5 3942 11.2
Directions 6753 5.3 587 2.6 5648 22.7 345 0.1 173 0.5
Remove Debris 6617 5.2 1880 8.4 1190 4.8 2122 4.7 1425 4.1
Relocate Vehicle 6446 5.1 879 3.9 1015 4.1 3007 6.7 1545 4.4
Jump Start / Pack 3194 2.5 602 2.7 376 1.5 891 0.1 1325 3.8
Fluids 2165 1.7 576 2.6 296 1.2 378 0.8 915 2.6
Other 1642 1.3 672 3 319 1.3 262 0.6 389 1.1
Notified Law Enforce 1226 1 214 1 131 0.5 608 0.1 273 0.8
Called Wrecker 1322 1 126 0.6 20 0.1 289 0.1 887 2.5
No Service-abandoned 970 0.8 578 2.6 88 0.4 270 0.1 34 0.1
Unable to Locate 802 0.6 312 1.4 87 0.3 112 0.1 291 0.8
Phone Call 548 0.4 186 0.8 91 0.4 117 0.1 154 0.4
Transported 427 0.3 73 0.3 67 0.3 77 0.1 210 0.6
Absorbent 387 0.3 96 0.4 59 0.2 212 0.5 20 0.1
Wrecker Towed 321 0.3 2 0 2 0 16 0.1 301 0.9
Secure Load 295 0.2 94 0.4 53 0.2 73 0.1 75 0.2
First Aid 120 0.1 53 0.2 22 0.1 32 0.1 13 0
Notified TDOT 69 0.1 30 0.1 5 0 34 0.1 0 0
Extinguish Fire 35 0 4 0 10 0 9 0 12 0
Totals 124823 100% 22504 100% 24864 100% 44886 100% 35153 100%

24
Exhibit 10
Types of Incidents
For Fiscal Year 2013-2014 Statewide Region 1 Region 2 Region 3 Region 4
Number Percent Number Percent Number Percent Number Percent Number Percent
Disabled Vehicle 71670 67.3 17039 66.3 13066 74.2 19834 57.7 21731 75.5
Aban Vehicle 10841 10.2 3013 11.7 741 4.2 4659 13.6 2428 8.4
Multivehicle Crash 7105 6.7 1157 4.5 1031 5.9 3663 10.7 1254 4.4
Debris 6112 5.7 1749 6.8 1164 6.6 1714 5 1485 5.2
Sched Roadwork 1998 1.9 641 2.5 96 0.5 1122 3.3 139 0.5
Special Evt/PSA 1794 1.7 590 2.3 390 2.2 487 1.4 327 1.1
Travel Time 1786 1.7 560 2.2 289 1.6 599 1.7 338 1.2
Single Vehicle Crash 1830 1.7 414 1.6 269 1.5 826 2.4 321 1.1
PD/MED Activity 1259 1.2 152 0.6 273 1.6 652 1.9 182 0.6
Unsched Roadwork 510 0.5 113 0.4 79 0.4 132 0.4 186 0.6
Unknown 580 0.5 60 0.2 0 0 266 0.8 254 0.9
Weather 296 0.3 125 0.5 68 0.4 80 0.2 23 0.1
Overturned Vehicle 322 0.3 26 0.1 56 0.3 184 0.5 56 0.2
Vehicle Fire 281 0.3 63 0.2 52 0.3 117 0.3 49 0.2
Amber Alert 5 0 2 0 2 0 1 0 0 0
JK TR TR 42 0 1 0 23 0.1 14 0 4 0
Test Incident 31 0 5 0 6 0 8 0 12 0
Totals 106462 100% 25710 100% 17605 100% 34358 100% 28789 100%

25
Exhibit 11
Average Incident Clearance Times
For Fiscal Year 2013-2014
Statewide Region 1 Region 2 Region 3 Region 4
Minutes Minutes Minutes Minutes Minutes
58.75 61 52 62 60
FHWA defines Incident Clearance Time as the “time between the first recordable awareness of the
incident and the time at which the last responder has left the scene.”
Exhibits 12
Roadway Clearance Time (Incidents Cleared within 90 Minutes)
For Fiscal Year 2013-2014
FHWA defines Roadway Clearance Time as the “time between first recordable awareness of an incident by a
responsible agency and first confirmation that all lanes are available for traffic flow.”

26
Exhibit 13
Types of Vehicles Assisted
For Fiscal Year 2013-2014
Statewide Region 1 Region 2 Region 3 Region 4
Number Percent Number Percent Number Percent Number Percent Number Percent
Passenger 51334 59.9 8279 49.3 7712 48.9 15264 57.1 20079 75.8
Pick-up/Van 16627 19.4 4523 26.9 3927 24.9 5127 19.2 3050 11.5
SUV 11806 13.8 2758 16.4 2251 14.3 4357 16.3 2440 9.2
TT 2872 3.4 571 3.4 896 5.7 1026 3.8 379 1.4
Truck 1646 1.9 306 1.8 527 3.3 435 1.6 378 1.4
RV/Bus 520 0.6 163 1 150 1 144 0.5 63 0.2
MC 392 0.5 106 0.6 126 0.8 106 0.4 54 0.2
Trailer 327 0.4 44 0.3 112 0.7 149 0.6 22 0.1
Other 166 0.2 35 0.2 6 0 111 0.4 14 0.1
Totals 85690 100% 16785 100% 15707 100% 26719 100% 26479 100%

27
Exhibit 14
Origin of Registration (Based on License Plate)
For Fiscal Year 2013-2014
Statewide Region 1 Region 2 Region 3 Region 4
Number Percent Number Percent Number Percent Number Percent Number Percent
TN 76587 88.3 14831 88.4 13285 84.2 25333 91.2 23138 87.4
MS 2305 2.7 34 0.2 35 0.2 97 0.3 2139 8.1
GA 1949 2.2 179 1.1 1485 9.4 226 0.8 59 0.2
KY 623 0.7 195 1.2 50 0.3 346 1.2 32 0.1
AL 595 0.7 95 0.6 253 1.6 195 0.7 52 0.2
AR 480 0.6 19 0.1 8 0.1 36 0.1 417 1.6
FL 426 0.5 134 0.8 126 0.8 132 0.5 34 0.1
TX 391 0.5 90 0.5 59 0.4 147 0.5 95 0.4
IN 358 0.4 89 0.5 40 0.3 166 0.6 63 0.2
IL 346 0.4 67 0.4 47 0.3 172 0.6 60 0.2
Other 2667 3 1052 6.2 383 2.4 922 3.5 390 1.5
Totals 86727 100% 16785 100% 15771 100% 27772 100% 26479 100%

28
Exhibit 15
How Incident Discovered by HELP
For Fiscal Year 2013-2014
Statewide Region 1 Region 2 Region 3 Region 4
Number Percent Number Percent Number Percent Number Percent Number Percent
Drive-up on route 40342 43 9207 41 6126 38 14846 49 10163 41
HELP Dispatch 2360 3 435 2 87 1 480 2 1358 6
Other 1218 1 672 3 270 2 196 1 80 0
Other HELP Op/Supv 717 1 109 1 84 1 313 1 211 1
Police Disp/Off 7467 8 1746 8 1362 9 4190 14 169 1
Saw & Changed route 984 1 203 1 385 2 286 1 110 0
TMC Operator 40446 43 10388 46 7631 48 9788 33 12639 51
Totals 93534 100 22760 100 15945 100 30099 100 24730 100

29
SECTION 5
HELP COMMENT CARD DATA
The information in this section is from 864 comment cards received by TDOT from motorists that received assistance
from HELP operators. Each card is entered into TDOT’s Business Object Enterprise (BOE) database weekly to allow
staff the ability to review the number of comments cards received from each region.
The HELP operators and shift supervisors make a strong effort to distribute postage-paid comment cards to customers,
recognizing that handing out comment cards may be precluded by more important considerations – safety, prompt
restoration of traffic flow, or respect for individuals in stressful situations. Further, no “customer” may be available to
receive a comment card for activities such as directing traffic, removing debris, tagging an abandoned vehicle, or
notifying other agencies that assistance is needed.
Exhibit 16
Comment Cards Received From Each Region As Percent of Total
For Fiscal Year 2013-2014
Statewide Region 1 Region 2 Region 3 Region 4
Total 864 84 122 381 277
100% 10% 14% 44% 32%

30
Exhibit 17
Response to: "For What Reason Did You Need Assistance?" For Fiscal Year 2013-2014
Statewide Region 1 Region 2 Region 3 Region 4
Number Percent Number Percent Number Percent Number Percent Number Percent
Accident 22 2.9% 1 1.4% 10 9.3% 10 3.0% 1 0.4%
Flat Tire 411 53.3% 49 67.1% 40 37.4% 198 58.4% 124 49.3%
Mechanical
Problem 110 14.3% 11 15.1% 25 23.4% 38 11.2% 36 14.3%
Other 77 10.0% 9 12.3% 10 9.3% 36 10.6% 22 8.8%
Out of gas 150 19.5% 3 4.1% 22 20.6% 57 16.8% 68 27.2%
Totals 770 100% 73 100.0% 107 100.0% 339 100.0% 251 100.0%

31
Exhibit 18
“Where was your Vehicle when the HELP unit arrived?”
For Fiscal Year 2013-2014
Statewide Region 1 Region 2 Region 3 Region 4
Number Percent Number Percent Number Percent Number Percent Number Percent
Completely off the
road 64 8.4% 3 4.4% 7 7.1% 29 8.5% 25 9.9%
On the left shoulder 73 9.6% 9 13.1% 3 3.0% 31 9.1% 30 11.9%
On the ramp 37 4.8% 2 2.9% 8 8.1% 17 5.0% 10 3.9%
On the right shoulder 540 70.8% 54 78.2% 71 71.7% 241 70.5% 174 68.8%
On the road, blocking
a traffic lane 35 4.6% 1 1.5% 8 8.1% 17 5.0% 9 3.5%
On the road, partially
blocking a traffic lane 14 1.8% 0 0.0% 2 2.0% 7 2.0% 5 2.0%
Totals 763 100.0% 69 100.0% 99 100.0% 342 100.0% 253 100.0%

32
Exhibit 19
Response to: "Did the HELP Operator Assist You in a Courteous Manner?”
For Fiscal Year 2013-2014
Statewide Region 1 Region 2 Region 3 Region 4
Knoxville Chattanooga Nashville Memphis
Number Percent Number Percent Number Percent Number Percent Number Percent
Yes 720 99.3% 68 100.0% 94 98.9% 322 100.0% 236 98.3%
No 5 0.7% 0 0.0% 1 1.1% 0 0.0% 4 1.7%
Totals 725 100.0% 68 100.0% 95 100.0% 322 100.0% 240 100.0%

33
Exhibit 20 Response to: "How would you rate the HELP Service?"
For Fiscal Year 2013-2014
Statewide Region 1 Region 2 Region 3 Region 4
Number Percent Number Percent Number Percent Number Percent Number Percent
Excellent 697 96.1% 67 98.5% 95 100.0% 308 95.7% 227 94.6%
Good 20 2.8% 1 1.5% 0 0.0% 12 3.7% 7 2.9%
Fair 1 0.1% 0 0.0% 0 0.0% 0 0.0% 1 0.4%
Others 7 1.0% 0 0.0% 0 0.0% 2 0.6% 5 2.1%
Totals 725 100.0% 68 100.0% 95 100.0% 322 100.0% 240 100.0%

34
Statewide Dynamic Highway Signs (DHS) in Tennessee

35
Customer Comments
The HELP Comment Card includes a space for the motorist to add written comments if they choose. The
excerpts in Exhibit 21 include representative comments from each of the four cities and from each month of the
year. Comment cards are available for review upon request.
TDOT also receives incident management feedback through e-mails, letters, phone calls, and personal
conversations with citizens, law enforcement officers, fire and emergency medical services personnel, tow truck
operators, and local transportation officials. A few comments with fair ratings were received during the year,
mostly from motorists who had to wait longer than they expected, or thought the HELP operator was not
sufficiently helpful. A few motorists reported actions that were perceived as unsafe or unnecessarily disruptive to
traffic flow, and HELP supervisors and managers addressed all such complaints promptly and thoroughly.
However, the comments from all sources during FY 2013-2014 were overwhelmingly positive.
Exhibit 21
Excerpts from the HELP Comment Cards
Date
Helped Comment Route City
7/12/2013 He was an angel sent in time of need! If only the world made more! I-75 Knoxville
8/11/2013 Very helpful and polite. Thanks so much. Jacksonville, Florida US-27 Chattanooga
10/20/2013 He was patience and courteous in a situation when I was nervous. I was
grateful he was there.
I-24 Nashville
10/27/2013 The cavalry came. The Operator represents TDOT’s pride and
professionalism
I-55 Memphis
11/17/2013 Great service! Great use of tax dollars! I-40 Knoxville
11/26/2013 Mr. Saint pulled up behind us. He is a lifesaver. SR-153 Chattanooga
12/26/2013 Best service on the planet!! I-24 Chattanooga
12/30/2013 The Operator was amazing---so friendly and helpful an exceptional
employee.
I-40 Knoxville
1/12/2014 Thank God for TDOT. I-440 Nashville
1/19/2014 Followed me to my exit to make sure I would not run hot. Now that’s
love!!
I-40 Memphis

36
Traffic Control Setup on Briley Parkway, Nashville, TN (Region 3)

37
SECTION 6
COSTS, BENEFITS, AND FUNDING SOURCES
The total operating expenditures for the HELP Program during FY 2013-2014 were approximately $8.8
million, including salaries and related costs, vehicle operation and maintenance, fuel, supplies, and other
operating costs.
These resources generate benefits for all highway users and others who would otherwise suffer because of
the crashes, disabled vehicles, debris in the roadway congestion, or other conditions rectified by the
HELP operators.
The TDOT HELP Program profile is as follows:
Exhibit 22
HELP Truck Authorized Data and Personnel
Region 1 Region 2 Region 3 Region 4 Total
Operators 10 10 22 15 57
Supervisors 4 4 4 4 16
Dispatchers 4 5 6 5 20
Reg. Coord. 1 1 1 1 4
Total Personnel
19 20 33 25 97
Oper. Trucks 11 10 24 17 62
Sprv. Trucks 4 4 4 4 16
Support Trucks 1 1 1 1 4
Total Trucks
16 15 29 22 82

38
Benefits
The benefits of the HELP program are categorized in Exhibit 23. For some of those benefit categories, a
direct economic value could be estimated with a high degree of confidence. For other categories the
economic benefits would be more difficult to determine and would require many assumptions. The
University of Tennessee, Transportation Research Office, has prepared a technical report on cost-benefit
estimation for TDOT’s Traffic Operations Division, Transportation Management Office. The finding
from this report indicates the quantifiable benefits of the HELP Program far exceed the funding costs of
operation. The benefit to cost ratio for the statewide HELP Program is estimated at 8.48:1. As calculated
by other states program studies, this ratio falls in the lower middle of the range of values. This estimation
is probably lower because it only accounts for delay savings and does not account for safety benefits or
environment impacts or goodwill.1
The 2012 Urban Mobility Report prepared by the Texas Transportation Institute (TTI) examined the
causes and costs of traffic congestion in many U.S. urban areas, including Memphis and Nashville.2 This
report includes an estimate of the cost savings attributable to “operational treatments” to reduce
congestion, including the HELP patrols in Memphis and Nashville. Based just on the reduced travel
delays and fuel savings from avoided congestion the TTI study concluded that the benefits generated by
the HELP patrols in Memphis totaled to approximately $24.5 million for calendar year 2011. For
Nashville, the estimated benefits were approximately $31.5 million. The TTI estimates of the HELP
Program benefits for reduced travel delays and fuel savings in just the two cities is $56.0 million versus
the actual statewide operational costs of $9.5 million. The 2012 Urban Mobility Report also included
Knoxville, TN.
As noted above, the TTI study did not attempt to assign any value to the reduced risks of secondary
crashes, improved safety for other incident responders or motorists in distress, avoided air or water
pollution, improved transportation system security, or the goodwill created when an out-of-state motorist
is assisted, not to mention the benefits for the Tennessee citizens and visitors who received direct
assistance from a HELP operator.
Funding Sources
Most of the startup costs for the HELP program, including the initial purchase of trucks and equipment,
were paid with federal funds, primarily under a program known as Congestion Mitigation and Air Quality
(CMAQ). The CMAQ funds, administered by the Federal Highway Administration, were allocated for
use in Knoxville, Memphis, and Nashville because those cities were not in compliance with certain
federal air quality standards. Chattanooga was in compliance and did not receive CMAQ allocations, and
TDOT used Federal Surface Transportation Program (STP) funds for the startup in Chattanooga.
The operating costs for HELP Program during FY 2013-2014 were covered with state and federal
National Highway Performance Program, (NHPP) funds.
__________________________________________________
1 The University of Tennessee, A Technical Report on Cost-Benefit Estimation for TDOT’s Traffic Incident Management (draft) Sam Moss, Lee
D. Han PhD, January 2012
2 Texas Transportation Institute, 2012 Annual Urban Mobility Study, 201. (http://mobility.tamu.edu/) 3 TDOT also considered, but decided against, charging motorists for services such as changing tires or providing fuel. Several equally important
factors influenced that decision. First, the HELP operators would have to handle cash or prepare an invoice for the motorist, extending the time
of exposure to hazardous circumstances for both the HELP operator and the motorist. Likewise, other motorists would be distracted for a longer period, with the associated disruption of traffic and risks of secondary crashes. Further, some motorists might want to refuse the service if a fee
were charged, causing continued delays and hazards for others. Finally, the administrative costs of collecting, securing, depositing, and
accounting for payments and bills could easily exceed the amounts received. TDOT believes that the public interest is best served by clearing the roadway and getting stranded motorists back on their way as quickly as possible

39
Exhibit 23
Benefits of the HELP Program for Tennessee Taxpayers
Benefits
N
um
ber
of
serv
ices
del
iver
ed d
uri
ng C
Y 2
011
Red
uce
d t
ravel
del
ays
an
d lost
pro
du
ctiv
ity
Red
uce
d t
he
nu
mb
er o
f se
cond
ary
crash
es
Impro
ved
safe
ty f
or
moto
rist
s in
dis
tres
s
Impro
ved
safe
ty f
or
oth
er
inci
den
t re
spon
der
s
Red
uce
d w
ast
ed f
uel
an
d
envir
on
men
tal p
oll
uti
on
Impro
ved
tra
nsp
ort
ati
on
syst
em
secu
rity
Cre
ate
d g
ood
wil
l fo
r T
ennes
see
Provide traffic control 26,212
Tagged Abandoned Vehicle 11,117
Mechanical assistance 11,916 = Direct
Change tire 11,449
Provide fuel 12,742 = Indirect
No service – check well being 13,164
Remove debris from roadway 5,936 = Incidental
Provide directions 11,835
Relocate vehicle from traffic lane 5,795
Provide use of cell phone 781
Notify law enforcement 2,086
Provide fluids 2,199
Transport motorist 374
Secure load 382
Perform first aid 97
Apply absorbent 251
Extinguish fire 46
Note: In addition to the above benefits for all Tennessee taxpayers, more than 88,550 Tennessee motorists and more than 10,422
motorists from other states received direct assistance from HELP (changed tire, fuel, first aid, etc.) during CY 2011.
HELP Service

40
Appendix A: “Move It” Brochure
Region 2 TMC Operators Region 2 TMC Incident Coordinator/ TN State Trooper

41
Appendix B: HELP Comment Card

42
APPENDIX C
TENNESSEE REGIONAL INCIDENT MANAGEMENT COORDINATORS
Region I
Mark Dykes, Incident Management Coordinator
David Wortham, Assistant Incident Management Coordinator
7238 Region Lane
Knoxville, TN 37914
Telephone Number: 865-594-2714
Region II
Lacy Word, Incident Management Coordinator
7500 Volkswagen Drive
Chattanooga, TN 37416
Telephone Number: 423-510-1168
Region III
Robert Allen, Incident Management Coordinator
Emerson Boguskie, Assistant Incident Management Coordinator
6603 Centennial Blvd. TMC Bldg. R
Nashville, TN 37243
Telephone Number: 615-350-4437
Region IV
John Thomas, Incident Management Coordinator
Carlton Towles, Assistant Incident Management Coordinator
5336 Boswell Ave.
Memphis, TN 38120
Telephone Number: 901-935-0312

43
APPENDIX D
For Additional Information Contact:
Mr. Frank Horne, Program Manager
Tennessee Department of Transportation
Office of Transportation Management
James K. Polk Bldg. 505 Deaderick St., Suite 300
Nashville, TN 37243
Telephone Number: 615-253-0042
Fax Number: 615-253-5462
Or
Ms. Ollie Jackson, Program Coordinator
Tennessee Department of Transportation
Office of Transportation Management
James K. Polk Bldg. 505 Deaderick St., Suite 300
Nashville, TN 37243
Telephone Number: 615-253-1024
Fax Number: 615-253-5462